Thunderbolt, GA
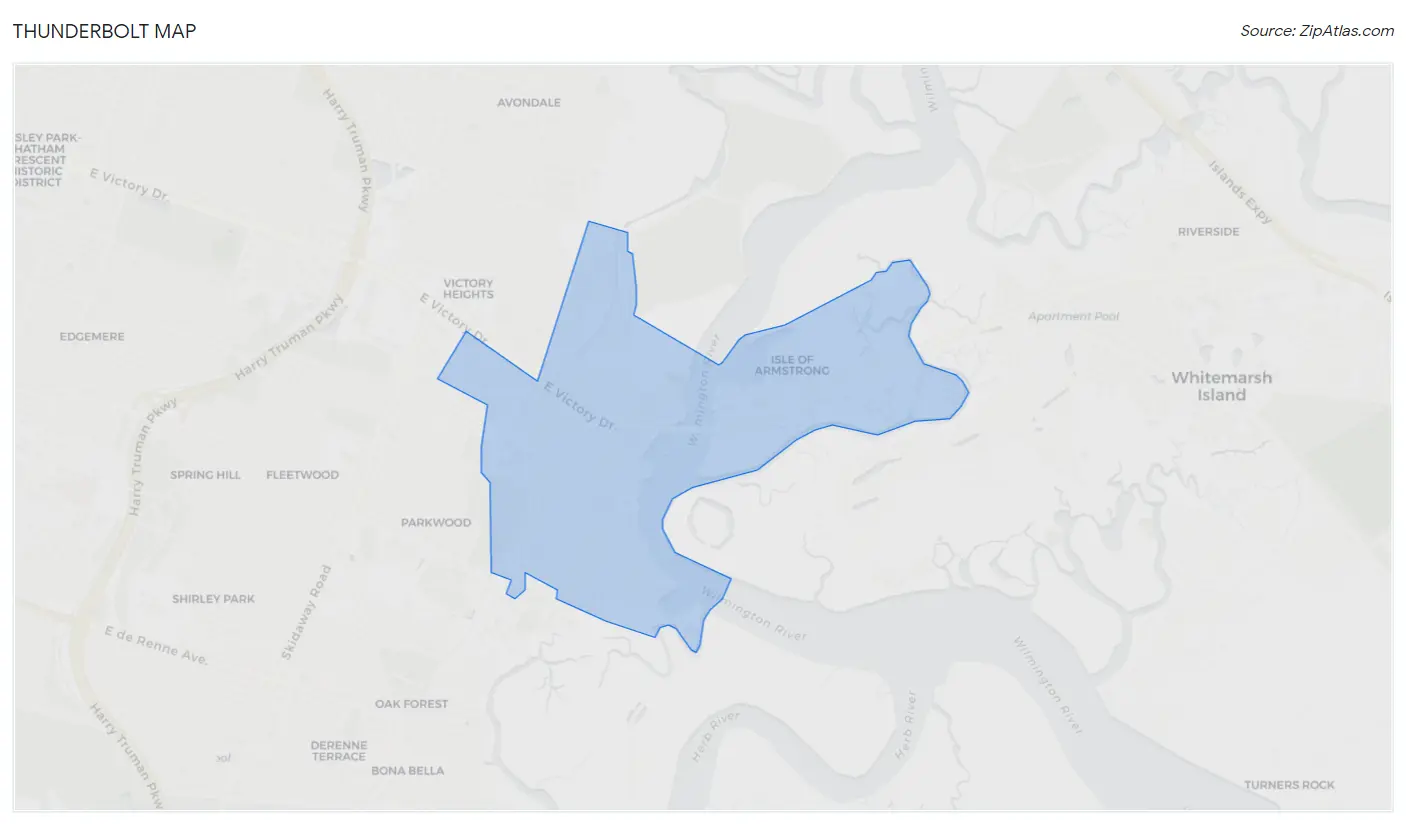
Thunderbolt Map
Thunderbolt Overview
2,552
TOTAL POPULATION
1,068
MALE POPULATION
1,484
FEMALE POPULATION
71.97
MALES / 100 FEMALES
138.95
FEMALES / 100 MALES
50.1
MEDIAN AGE
2.9
AVG FAMILY SIZE
2.0
AVG HOUSEHOLD SIZE
$38,190
PER CAPITA INCOME
$72,130
AVG FAMILY INCOME
$63,148
AVG HOUSEHOLD INCOME
0.6%
WAGE / INCOME GAP [ % ]
99.4¢/ $1
WAGE / INCOME GAP [ $ ]
$4,914
FAMILY INCOME DEFICIT
0.40
INEQUALITY / GINI INDEX
1,353
LABOR FORCE [ PEOPLE ]
63.6%
PERCENT IN LABOR FORCE
3.6%
UNEMPLOYMENT RATE
Thunderbolt Area Codes
Race in Thunderbolt
The most populous races in Thunderbolt are White / Caucasian (1,475 | 57.8%), Black / African American (970 | 38.0%), and Two or more Races (57 | 2.2%).

| Race | # Population | % Population |
| Asian | 21 | 0.8% |
| Black / African American | 970 | 38.0% |
| Hawaiian / Pacific | 0 | 0.0% |
| Hispanic or Latino | 35 | 1.4% |
| Native / Alaskan | 0 | 0.0% |
| White / Caucasian | 1,475 | 57.8% |
| Two or more Races | 57 | 2.2% |
| Some other Race | 29 | 1.1% |
| Total | 2,552 | 100.0% |
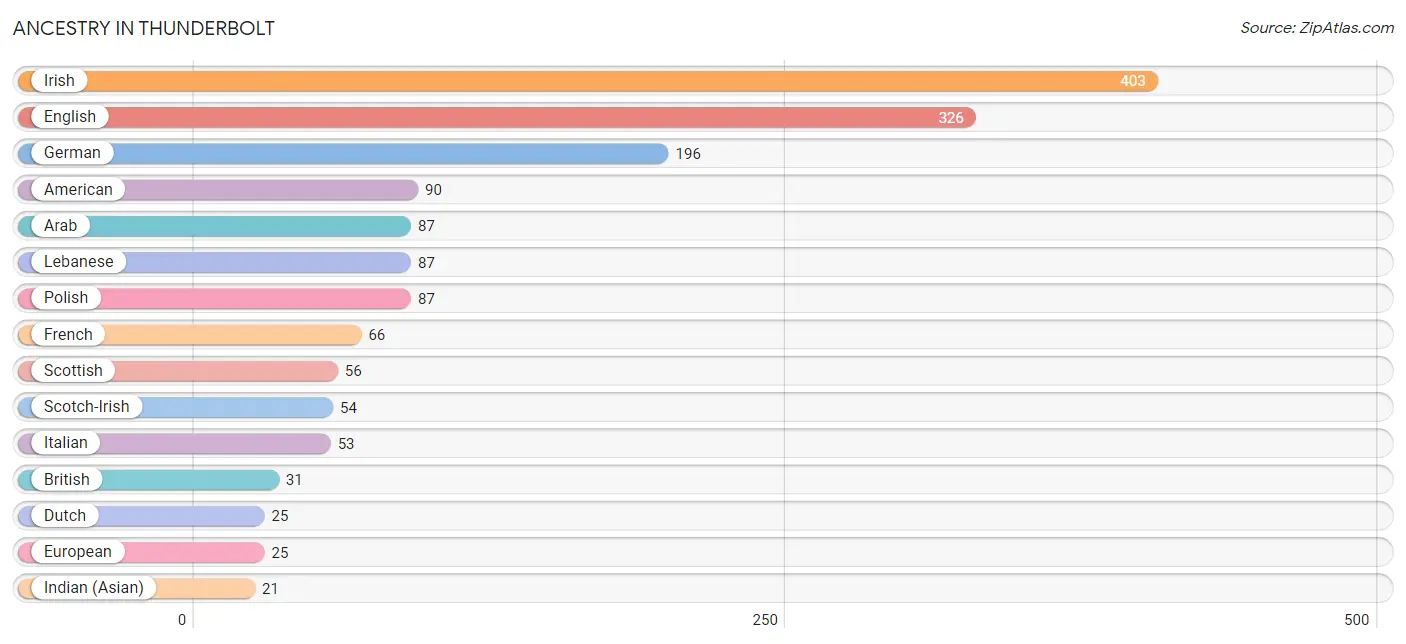
Ancestry in Thunderbolt
The most populous ancestries reported in Thunderbolt are Irish (403 | 15.8%), English (326 | 12.8%), German (196 | 7.7%), American (90 | 3.5%), and Arab (87 | 3.4%), together accounting for 43.2% of all Thunderbolt residents.
| Ancestry | # Population | % Population |
| African | 7 | 0.3% |
| American | 90 | 3.5% |
| Arab | 87 | 3.4% |
| Armenian | 7 | 0.3% |
| Austrian | 11 | 0.4% |
| Barbadian | 6 | 0.2% |
| British | 31 | 1.2% |
| Colombian | 12 | 0.5% |
| Cuban | 7 | 0.3% |
| Danish | 20 | 0.8% |
| Dutch | 25 | 1.0% |
| English | 326 | 12.8% |
| European | 25 | 1.0% |
| French | 66 | 2.6% |
| German | 196 | 7.7% |
| Greek | 10 | 0.4% |
| Hungarian | 14 | 0.5% |
| Indian (Asian) | 21 | 0.8% |
| Irish | 403 | 15.8% |
| Italian | 53 | 2.1% |
| Korean | 15 | 0.6% |
| Lebanese | 87 | 3.4% |
| Mexican | 16 | 0.6% |
| Nigerian | 5 | 0.2% |
| Norwegian | 7 | 0.3% |
| Polish | 87 | 3.4% |
| Scotch-Irish | 54 | 2.1% |
| Scottish | 56 | 2.2% |
| South American | 12 | 0.5% |
| Subsaharan African | 12 | 0.5% |
| Swedish | 14 | 0.5% |
| Welsh | 19 | 0.7% | View All 32 Rows |
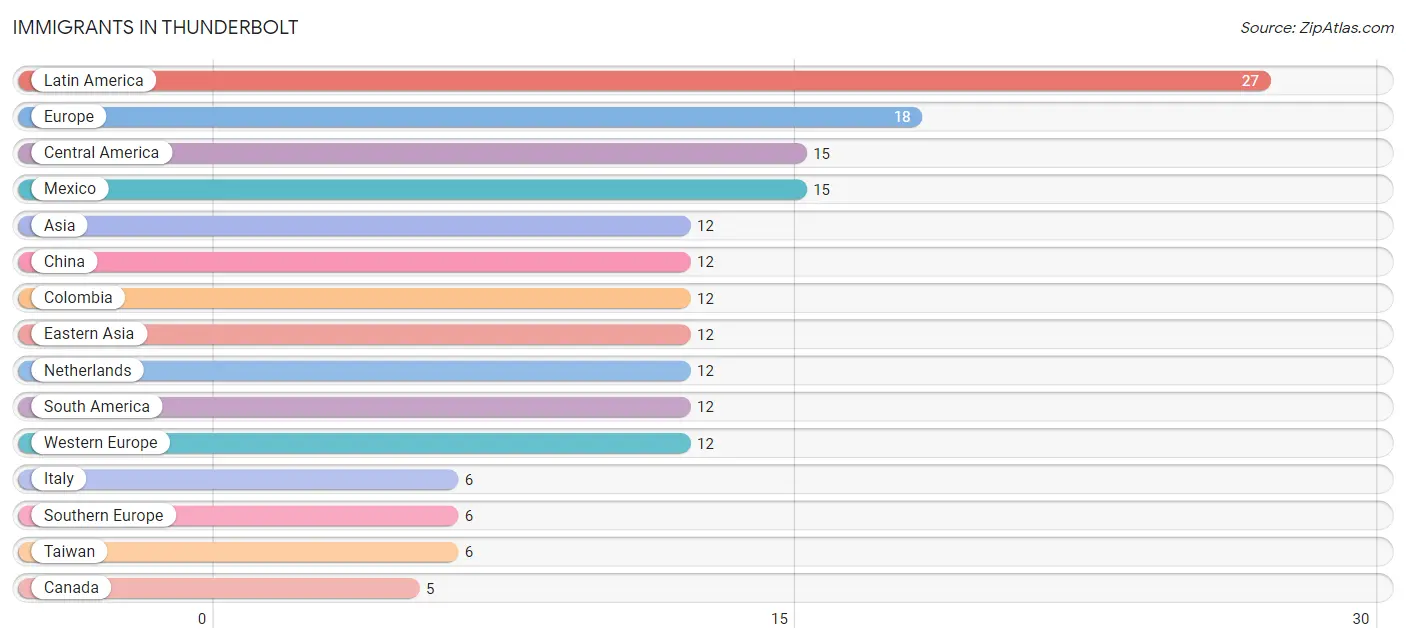
Immigrants in Thunderbolt
The most numerous immigrant groups reported in Thunderbolt came from Latin America (27 | 1.1%), Europe (18 | 0.7%), Central America (15 | 0.6%), Mexico (15 | 0.6%), and Asia (12 | 0.5%), together accounting for 3.4% of all Thunderbolt residents.
| Immigration Origin | # Population | % Population |
| Asia | 12 | 0.5% |
| Canada | 5 | 0.2% |
| Central America | 15 | 0.6% |
| China | 12 | 0.5% |
| Colombia | 12 | 0.5% |
| Eastern Asia | 12 | 0.5% |
| Europe | 18 | 0.7% |
| Italy | 6 | 0.2% |
| Latin America | 27 | 1.1% |
| Mexico | 15 | 0.6% |
| Netherlands | 12 | 0.5% |
| South America | 12 | 0.5% |
| Southern Europe | 6 | 0.2% |
| Taiwan | 6 | 0.2% |
| Western Europe | 12 | 0.5% | View All 15 Rows |
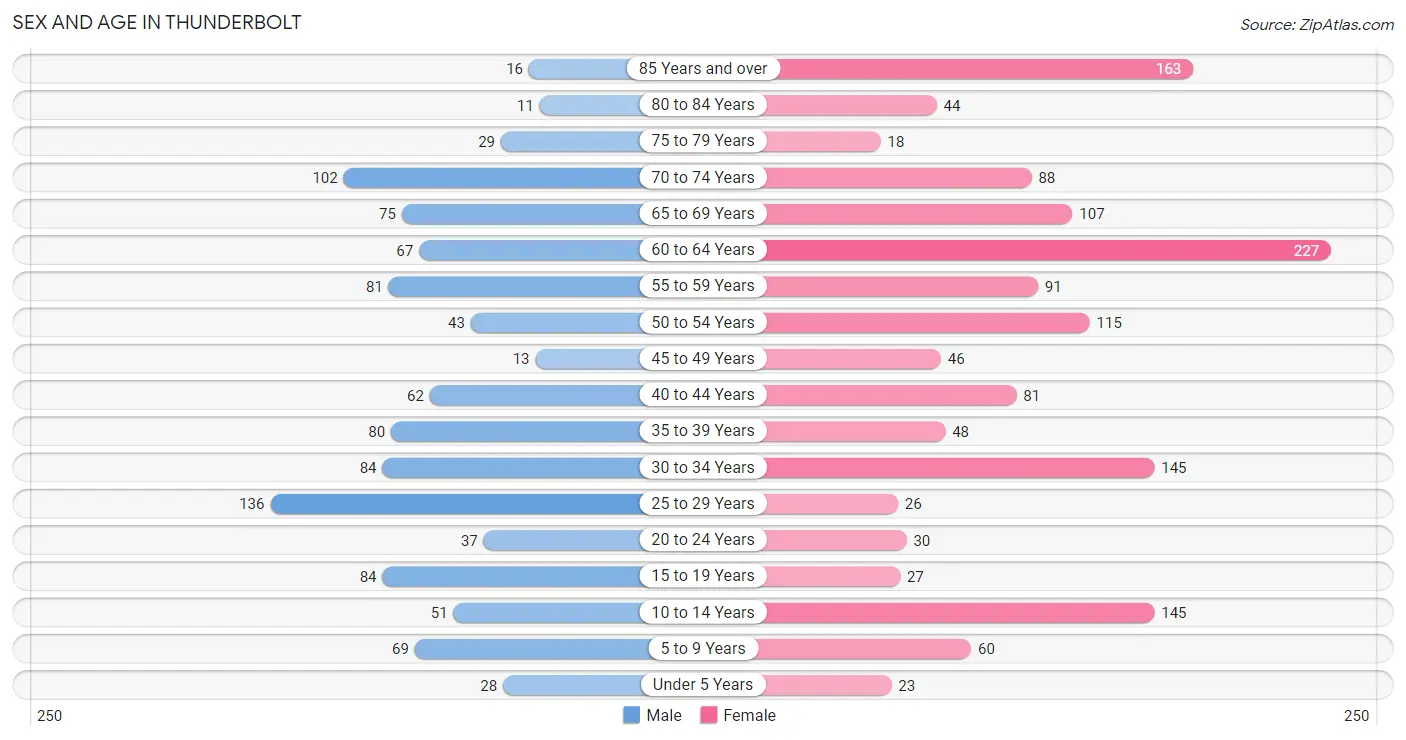
Sex and Age in Thunderbolt
Sex and Age in Thunderbolt
The most populous age groups in Thunderbolt are 25 to 29 Years (136 | 12.7%) for men and 60 to 64 Years (227 | 15.3%) for women.
| Age Bracket | Male | Female |
| Under 5 Years | 28 (2.6%) | 23 (1.5%) |
| 5 to 9 Years | 69 (6.5%) | 60 (4.0%) |
| 10 to 14 Years | 51 (4.8%) | 145 (9.8%) |
| 15 to 19 Years | 84 (7.9%) | 27 (1.8%) |
| 20 to 24 Years | 37 (3.5%) | 30 (2.0%) |
| 25 to 29 Years | 136 (12.7%) | 26 (1.8%) |
| 30 to 34 Years | 84 (7.9%) | 145 (9.8%) |
| 35 to 39 Years | 80 (7.5%) | 48 (3.2%) |
| 40 to 44 Years | 62 (5.8%) | 81 (5.5%) |
| 45 to 49 Years | 13 (1.2%) | 46 (3.1%) |
| 50 to 54 Years | 43 (4.0%) | 115 (7.7%) |
| 55 to 59 Years | 81 (7.6%) | 91 (6.1%) |
| 60 to 64 Years | 67 (6.3%) | 227 (15.3%) |
| 65 to 69 Years | 75 (7.0%) | 107 (7.2%) |
| 70 to 74 Years | 102 (9.6%) | 88 (5.9%) |
| 75 to 79 Years | 29 (2.7%) | 18 (1.2%) |
| 80 to 84 Years | 11 (1.0%) | 44 (3.0%) |
| 85 Years and over | 16 (1.5%) | 163 (11.0%) |
| Total | 1,068 (100.0%) | 1,484 (100.0%) |
Families and Households in Thunderbolt
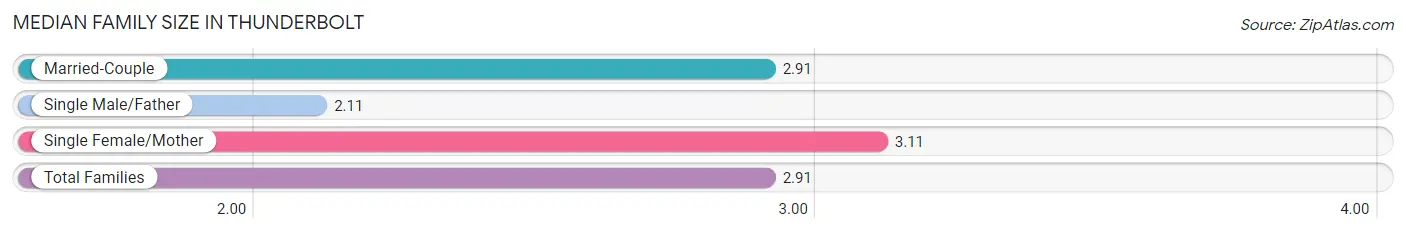
Median Family Size in Thunderbolt
The median family size in Thunderbolt is 2.91 persons per family, with single female/mother families (137 | 29.4%) accounting for the largest median family size of 3.11 persons per family. On the other hand, single male/father families (35 | 7.5%) represent the smallest median family size with 2.11 persons per family.
| Family Type | # Families | Family Size |
| Married-Couple | 294 (63.1%) | 2.91 |
| Single Male/Father | 35 (7.5%) | 2.11 |
| Single Female/Mother | 137 (29.4%) | 3.11 |
| Total Families | 466 (100.0%) | 2.91 |
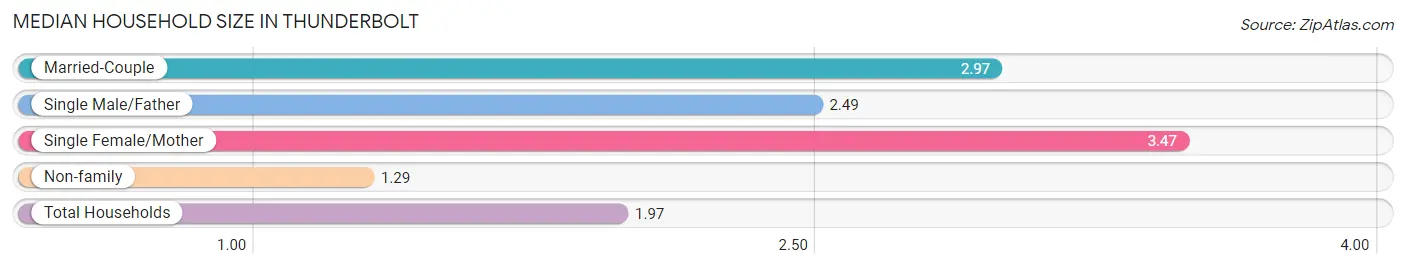
Median Household Size in Thunderbolt
The median household size in Thunderbolt is 1.97 persons per household, with single female/mother households (137 | 11.2%) accounting for the largest median household size of 3.47 persons per household. non-family households (760 | 62.0%) represent the smallest median household size with 1.29 persons per household.
| Household Type | # Households | Household Size |
| Married-Couple | 294 (24.0%) | 2.97 |
| Single Male/Father | 35 (2.9%) | 2.49 |
| Single Female/Mother | 137 (11.2%) | 3.47 |
| Non-family | 760 (62.0%) | 1.29 |
| Total Households | 1,226 (100.0%) | 1.97 |
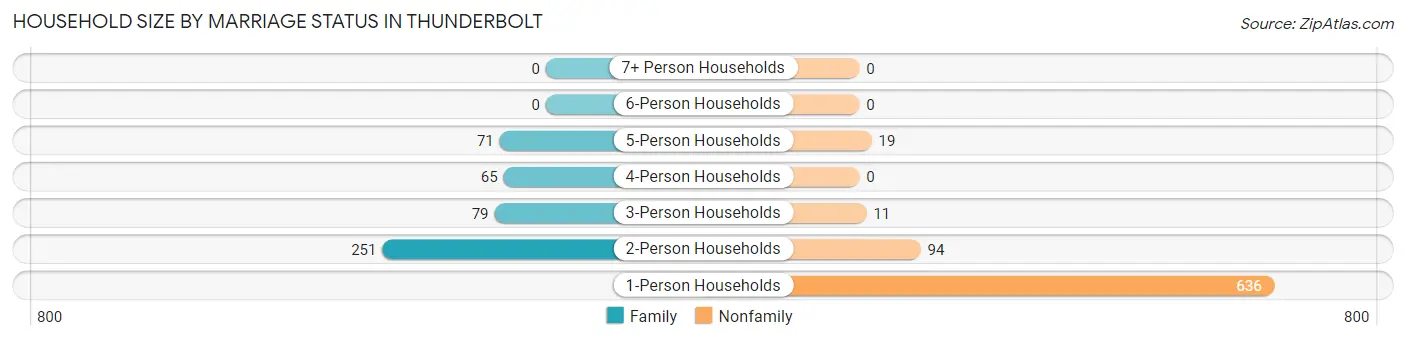
Household Size by Marriage Status in Thunderbolt
Out of a total of 1,226 households in Thunderbolt, 466 (38.0%) are family households, while 760 (62.0%) are nonfamily households. The most numerous type of family households are 2-person households, comprising 251, and the most common type of nonfamily households are 1-person households, comprising 636.
| Household Size | Family Households | Nonfamily Households |
| 1-Person Households | - | 636 (51.9%) |
| 2-Person Households | 251 (20.5%) | 94 (7.7%) |
| 3-Person Households | 79 (6.4%) | 11 (0.9%) |
| 4-Person Households | 65 (5.3%) | 0 (0.0%) |
| 5-Person Households | 71 (5.8%) | 19 (1.5%) |
| 6-Person Households | 0 (0.0%) | 0 (0.0%) |
| 7+ Person Households | 0 (0.0%) | 0 (0.0%) |
| Total | 466 (38.0%) | 760 (62.0%) |
Female Fertility in Thunderbolt
Fertility by Age in Thunderbolt
| Age Bracket | Women with Births | Births / 1,000 Women |
| 15 to 19 years | 0 (0.0%) | 0.0 |
| 20 to 34 years | 0 (0.0%) | 0.0 |
| 35 to 50 years | 0 (0.0%) | 0.0 |
| Total | 0 (0.0%) | 0.0 |
Fertility by Age by Marriage Status in Thunderbolt
| Age Bracket | Married | Unmarried |
| 15 to 19 years | 0 (0.0%) | 0 (0.0%) |
| 20 to 34 years | 0 (0.0%) | 0 (0.0%) |
| 35 to 50 years | 0 (0.0%) | 0 (0.0%) |
| Total | 0 (0.0%) | 0 (0.0%) |
Fertility by Education in Thunderbolt
| Educational Attainment | Women with Births | Births / 1,000 Women |
| Less than High School | 0 (0.0%) | 0.0 |
| High School Diploma | 0 (0.0%) | 0.0 |
| College or Associate's Degree | 0 (0.0%) | 0.0 |
| Bachelor's Degree | 0 (0.0%) | 0.0 |
| Graduate Degree | 0 (0.0%) | 0.0 |
| Total | 0 (0.0%) | 0.0 |
Fertility by Education by Marriage Status in Thunderbolt
| Educational Attainment | Married | Unmarried |
| Less than High School | 0 (0.0%) | 0 (0.0%) |
| High School Diploma | 0 (0.0%) | 0 (0.0%) |
| College or Associate's Degree | 0 (0.0%) | 0 (0.0%) |
| Bachelor's Degree | 0 (0.0%) | 0 (0.0%) |
| Graduate Degree | 0 (0.0%) | 0 (0.0%) |
| Total | 0 (0.0%) | 0 (0.0%) |
Income in Thunderbolt
Income Overview in Thunderbolt
Per Capita Income in Thunderbolt is $38,190, while median incomes of families and households are $72,130 and $63,148 respectively.
| Characteristic | Number | Measure |
| Per Capita Income | 2,552 | $38,190 |
| Median Family Income | 466 | $72,130 |
| Mean Family Income | 466 | $91,067 |
| Median Household Income | 1,226 | $63,148 |
| Mean Household Income | 1,226 | $76,499 |
| Income Deficit | 466 | $4,914 |
| Wage / Income Gap (%) | 2,552 | 0.58% |
| Wage / Income Gap ($) | 2,552 | 99.42¢ per $1 |
| Gini / Inequality Index | 2,552 | 0.40 |
Earnings by Sex in Thunderbolt
Average Earnings in Thunderbolt are $38,807, $38,977 for men and $38,750 for women, a difference of 0.6%.
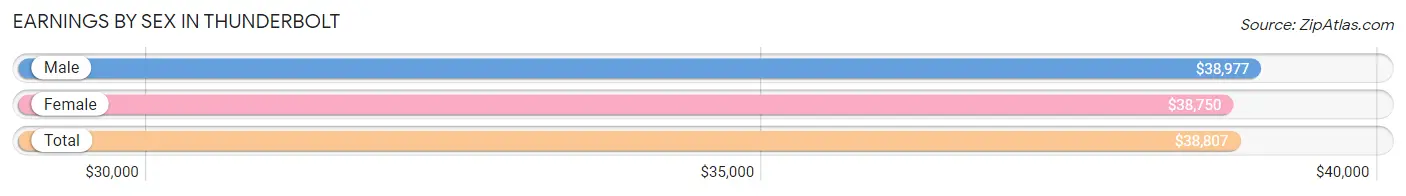
| Sex | Number | Average Earnings |
| Male | 705 (50.2%) | $38,977 |
| Female | 699 (49.8%) | $38,750 |
| Total | 1,404 (100.0%) | $38,807 |
Earnings by Sex by Income Bracket in Thunderbolt
The most common earnings brackets in Thunderbolt are $100,000+ for men (113 | 16.0%) and $75,000 to $99,999 for women (120 | 17.2%).
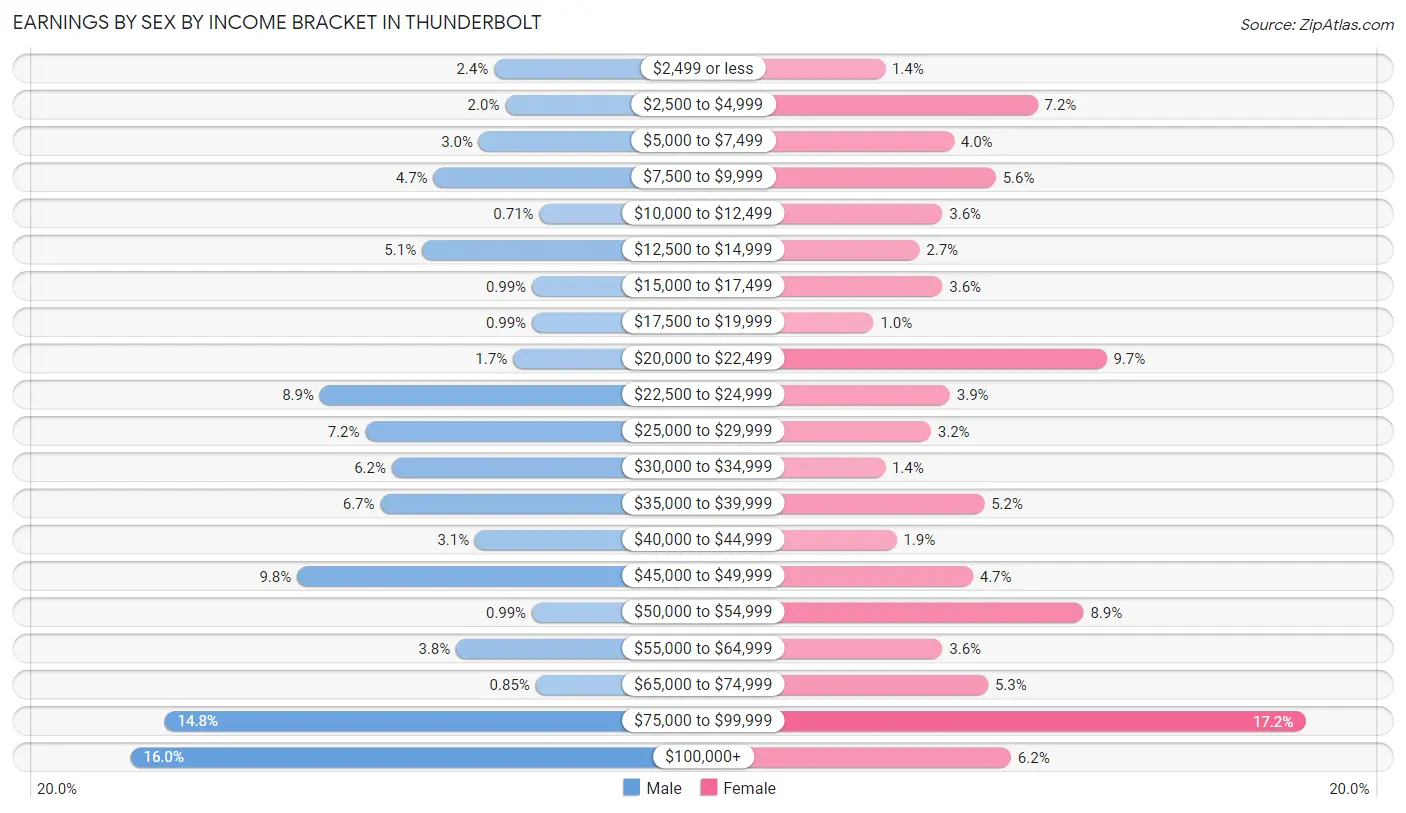
| Income | Male | Female |
| $2,499 or less | 17 (2.4%) | 10 (1.4%) |
| $2,500 to $4,999 | 14 (2.0%) | 50 (7.1%) |
| $5,000 to $7,499 | 21 (3.0%) | 28 (4.0%) |
| $7,500 to $9,999 | 33 (4.7%) | 39 (5.6%) |
| $10,000 to $12,499 | 5 (0.7%) | 25 (3.6%) |
| $12,500 to $14,999 | 36 (5.1%) | 19 (2.7%) |
| $15,000 to $17,499 | 7 (1.0%) | 25 (3.6%) |
| $17,500 to $19,999 | 7 (1.0%) | 7 (1.0%) |
| $20,000 to $22,499 | 12 (1.7%) | 68 (9.7%) |
| $22,500 to $24,999 | 63 (8.9%) | 27 (3.9%) |
| $25,000 to $29,999 | 51 (7.2%) | 22 (3.2%) |
| $30,000 to $34,999 | 44 (6.2%) | 10 (1.4%) |
| $35,000 to $39,999 | 47 (6.7%) | 36 (5.1%) |
| $40,000 to $44,999 | 22 (3.1%) | 13 (1.9%) |
| $45,000 to $49,999 | 69 (9.8%) | 33 (4.7%) |
| $50,000 to $54,999 | 7 (1.0%) | 62 (8.9%) |
| $55,000 to $64,999 | 27 (3.8%) | 25 (3.6%) |
| $65,000 to $74,999 | 6 (0.9%) | 37 (5.3%) |
| $75,000 to $99,999 | 104 (14.7%) | 120 (17.2%) |
| $100,000+ | 113 (16.0%) | 43 (6.1%) |
| Total | 705 (100.0%) | 699 (100.0%) |
Earnings by Sex by Educational Attainment in Thunderbolt
Average earnings in Thunderbolt are $45,313 for men and $39,280 for women, a difference of 13.3%. Men with an educational attainment of graduate degree enjoy the highest average annual earnings of $93,929, while those with less than high school education earn the least with $28,083. Women with an educational attainment of college or associate's degree earn the most with the average annual earnings of $29,886, while those with high school diploma education have the smallest earnings of $22,596.
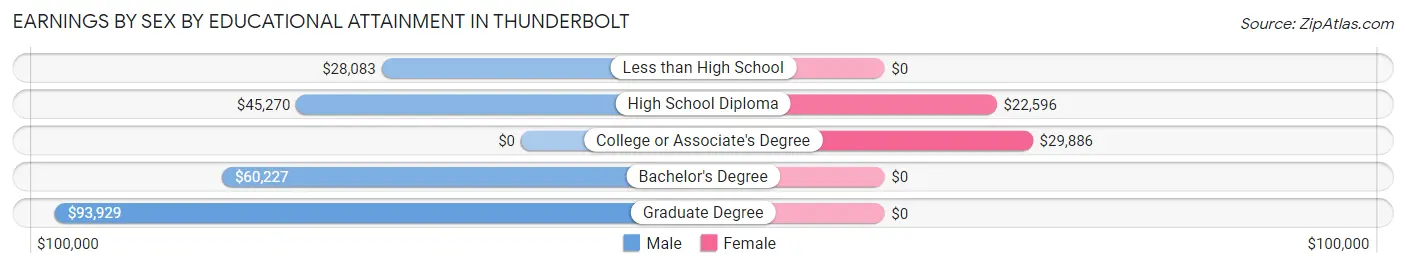
| Educational Attainment | Male Income | Female Income |
| Less than High School | $28,083 | $0 |
| High School Diploma | $45,270 | $22,596 |
| College or Associate's Degree | - | - |
| Bachelor's Degree | $60,227 | $0 |
| Graduate Degree | $93,929 | $0 |
| Total | $45,313 | $39,280 |
Family Income in Thunderbolt
Family Income Brackets in Thunderbolt
According to the Thunderbolt family income data, there are 117 families falling into the $50,000 to $74,999 income range, which is the most common income bracket and makes up 25.1% of all families.
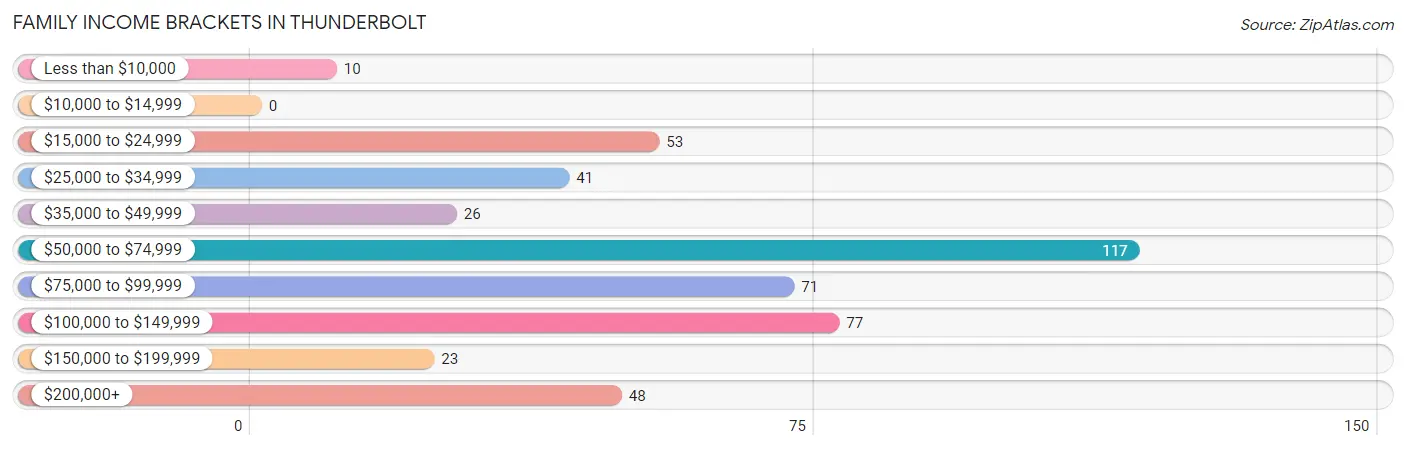
| Income Bracket | # Families | % Families |
| Less than $10,000 | 10 | 2.1% |
| $10,000 to $14,999 | 0 | 0.0% |
| $15,000 to $24,999 | 53 | 11.4% |
| $25,000 to $34,999 | 41 | 8.8% |
| $35,000 to $49,999 | 26 | 5.6% |
| $50,000 to $74,999 | 117 | 25.1% |
| $75,000 to $99,999 | 71 | 15.2% |
| $100,000 to $149,999 | 77 | 16.5% |
| $150,000 to $199,999 | 23 | 4.9% |
| $200,000+ | 48 | 10.3% |
Family Income by Famaliy Size in Thunderbolt
5-person families (44 | 9.4%) account for the highest median family income in Thunderbolt with $103,026 per family, while 2-person families (283 | 60.7%) have the highest median income of $36,134 per family member.
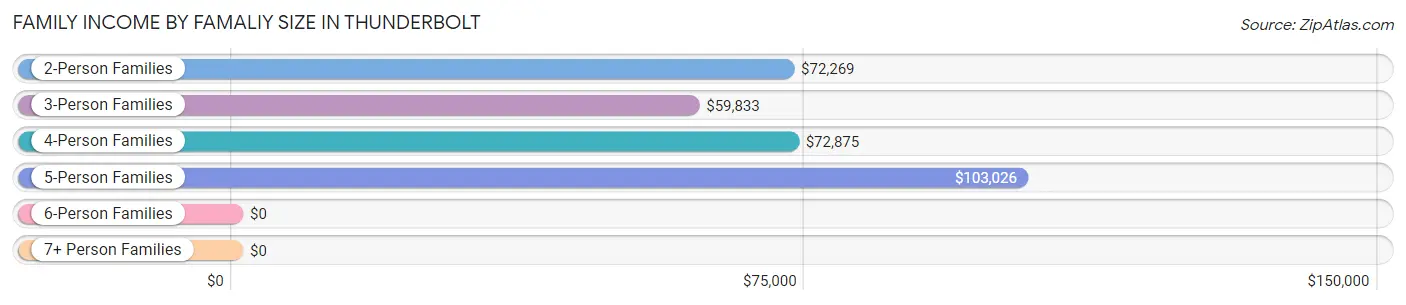
| Income Bracket | # Families | Median Income |
| 2-Person Families | 283 (60.7%) | $72,269 |
| 3-Person Families | 62 (13.3%) | $59,833 |
| 4-Person Families | 77 (16.5%) | $72,875 |
| 5-Person Families | 44 (9.4%) | $103,026 |
| 6-Person Families | 0 (0.0%) | $0 |
| 7+ Person Families | 0 (0.0%) | $0 |
| Total | 466 (100.0%) | $72,130 |
Family Income by Number of Earners in Thunderbolt
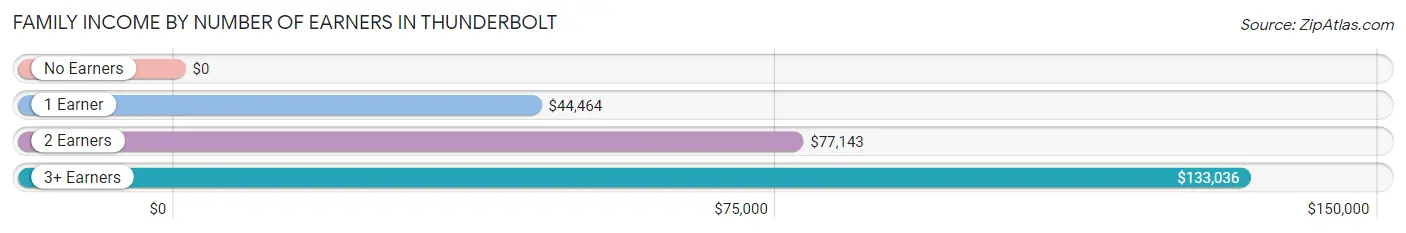
| Number of Earners | # Families | Median Income |
| No Earners | 74 (15.9%) | $0 |
| 1 Earner | 133 (28.5%) | $44,464 |
| 2 Earners | 236 (50.6%) | $77,143 |
| 3+ Earners | 23 (4.9%) | $133,036 |
| Total | 466 (100.0%) | $72,130 |
Household Income in Thunderbolt
Household Income Brackets in Thunderbolt
With 254 households falling in the category, the $50,000 to $74,999 income range is the most frequent in Thunderbolt, accounting for 20.7% of all households. In contrast, only 23 households (1.9%) fall into the $10,000 to $14,999 income bracket, making it the least populous group.
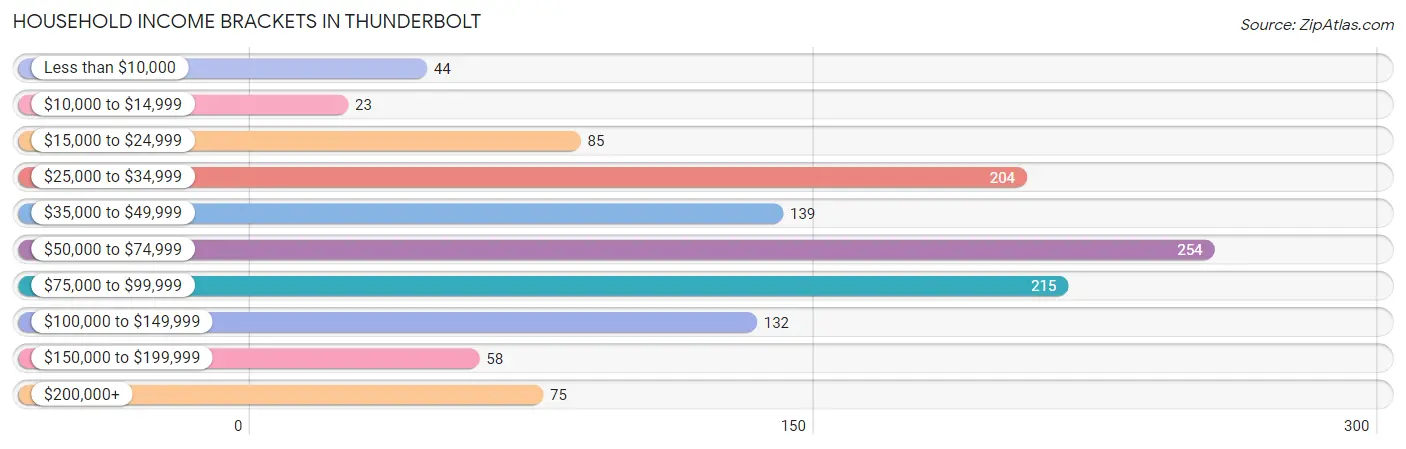
| Income Bracket | # Households | % Households |
| Less than $10,000 | 44 | 3.6% |
| $10,000 to $14,999 | 23 | 1.9% |
| $15,000 to $24,999 | 85 | 6.9% |
| $25,000 to $34,999 | 204 | 16.6% |
| $35,000 to $49,999 | 139 | 11.3% |
| $50,000 to $74,999 | 254 | 20.7% |
| $75,000 to $99,999 | 215 | 17.5% |
| $100,000 to $149,999 | 132 | 10.8% |
| $150,000 to $199,999 | 58 | 4.7% |
| $200,000+ | 75 | 6.1% |
Household Income by Householder Age in Thunderbolt
The median household income in Thunderbolt is $63,148, with the highest median household income of $85,144 found in the 45 to 64 years age bracket for the primary householder. A total of 484 households (39.5%) fall into this category. Meanwhile, the 15 to 24 years age bracket for the primary householder has the lowest median household income of $0, with 71 households (5.8%) in this group.
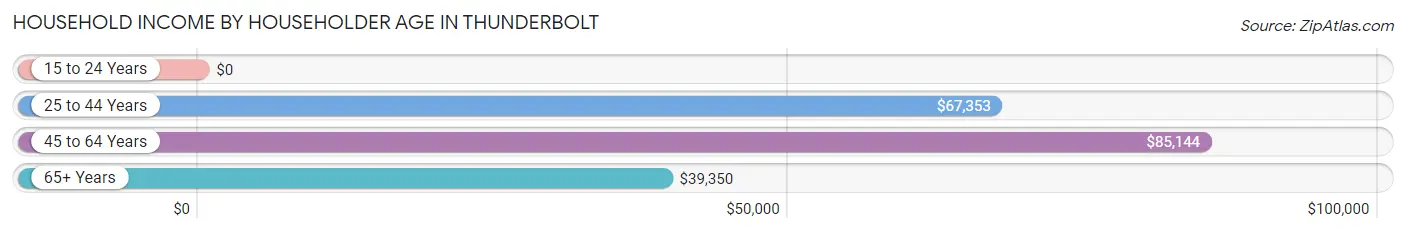
| Income Bracket | # Households | Median Income |
| 15 to 24 Years | 71 (5.8%) | $0 |
| 25 to 44 Years | 256 (20.9%) | $67,353 |
| 45 to 64 Years | 484 (39.5%) | $85,144 |
| 65+ Years | 415 (33.9%) | $39,350 |
| Total | 1,226 (100.0%) | $63,148 |
Poverty in Thunderbolt
Income Below Poverty by Sex and Age in Thunderbolt
With 15.0% poverty level for males and 23.1% for females among the residents of Thunderbolt, 15 year old males and 12 to 14 year old females are the most vulnerable to poverty, with 20 males (40.8%) and 53 females (67.9%) in their respective age groups living below the poverty level.
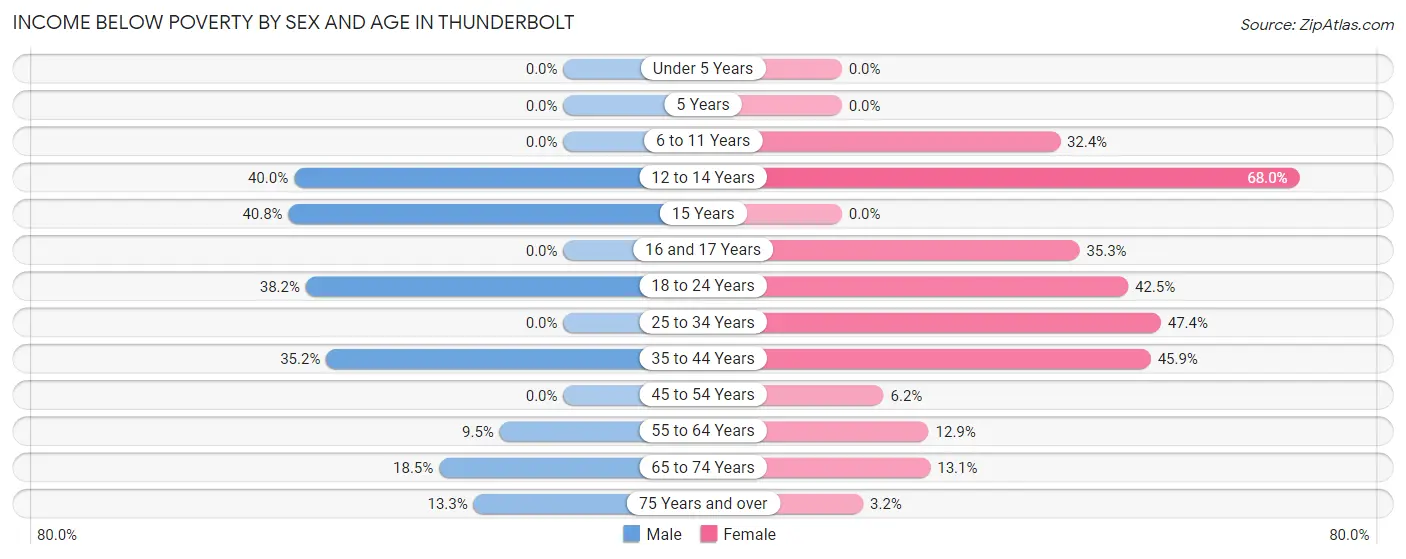
| Age Bracket | Male | Female |
| Under 5 Years | 0 (0.0%) | 0 (0.0%) |
| 5 Years | 0 (0.0%) | 0 (0.0%) |
| 6 to 11 Years | 0 (0.0%) | 23 (32.4%) |
| 12 to 14 Years | 10 (40.0%) | 53 (67.9%) |
| 15 Years | 20 (40.8%) | 0 (0.0%) |
| 16 and 17 Years | 0 (0.0%) | 6 (35.3%) |
| 18 to 24 Years | 26 (38.2%) | 17 (42.5%) |
| 25 to 34 Years | 0 (0.0%) | 81 (47.4%) |
| 35 to 44 Years | 50 (35.2%) | 50 (45.9%) |
| 45 to 54 Years | 0 (0.0%) | 10 (6.2%) |
| 55 to 64 Years | 14 (9.5%) | 41 (12.9%) |
| 65 to 74 Years | 31 (18.4%) | 23 (13.1%) |
| 75 Years and over | 6 (13.3%) | 5 (3.2%) |
| Total | 157 (15.0%) | 309 (23.1%) |
Income Above Poverty by Sex and Age in Thunderbolt
According to the poverty statistics in Thunderbolt, males aged under 5 years and females aged under 5 years are the age groups that are most secure financially, with 100.0% of males and 100.0% of females in these age groups living above the poverty line.
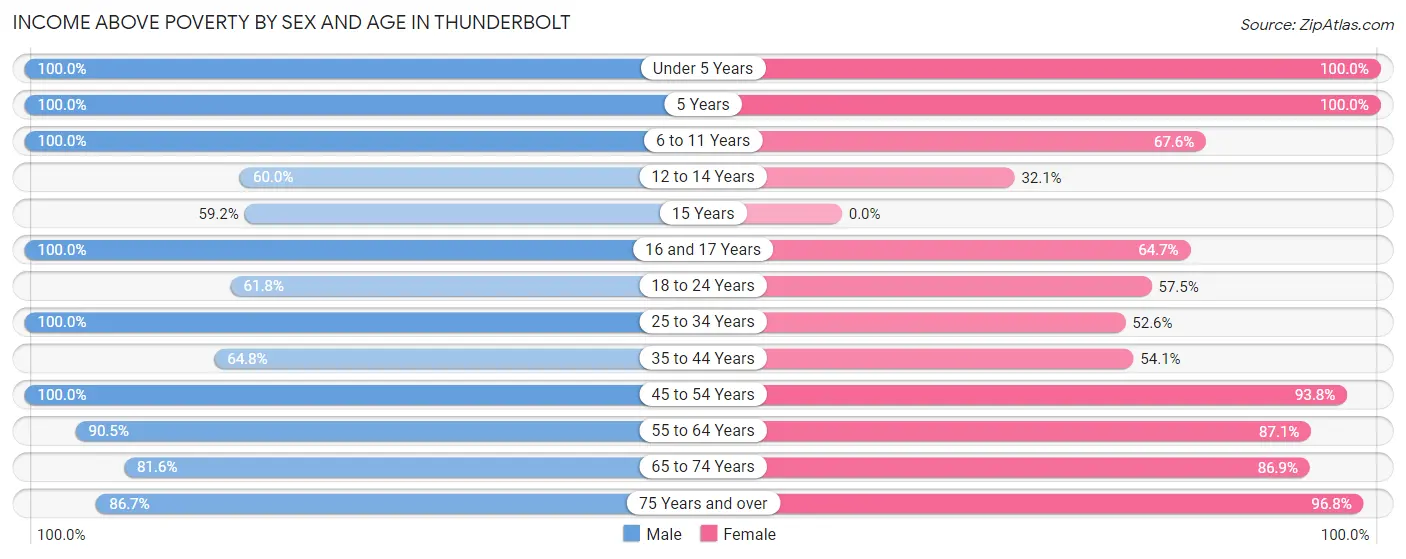
| Age Bracket | Male | Female |
| Under 5 Years | 28 (100.0%) | 23 (100.0%) |
| 5 Years | 11 (100.0%) | 18 (100.0%) |
| 6 to 11 Years | 84 (100.0%) | 48 (67.6%) |
| 12 to 14 Years | 15 (60.0%) | 25 (32.1%) |
| 15 Years | 29 (59.2%) | 0 (0.0%) |
| 16 and 17 Years | 4 (100.0%) | 11 (64.7%) |
| 18 to 24 Years | 42 (61.8%) | 23 (57.5%) |
| 25 to 34 Years | 220 (100.0%) | 90 (52.6%) |
| 35 to 44 Years | 92 (64.8%) | 59 (54.1%) |
| 45 to 54 Years | 56 (100.0%) | 151 (93.8%) |
| 55 to 64 Years | 134 (90.5%) | 277 (87.1%) |
| 65 to 74 Years | 137 (81.6%) | 152 (86.9%) |
| 75 Years and over | 39 (86.7%) | 153 (96.8%) |
| Total | 891 (85.0%) | 1,030 (76.9%) |
Income Below Poverty Among Married-Couple Families in Thunderbolt
The poverty statistics for married-couple families in Thunderbolt show that 11.2% or 33 of the total 294 families live below the poverty line. Families with 3 or 4 children have the highest poverty rate of 100.0%, comprising of 13 families. On the other hand, families with no children have the lowest poverty rate of 6.5%, which includes 12 families.
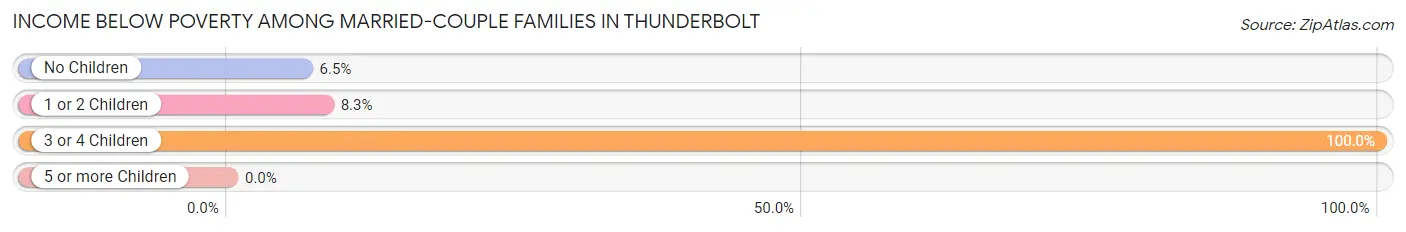
| Children | Above Poverty | Below Poverty |
| No Children | 173 (93.5%) | 12 (6.5%) |
| 1 or 2 Children | 88 (91.7%) | 8 (8.3%) |
| 3 or 4 Children | 0 (0.0%) | 13 (100.0%) |
| 5 or more Children | 0 (0.0%) | 0 (0.0%) |
| Total | 261 (88.8%) | 33 (11.2%) |
Income Below Poverty Among Single-Parent Households in Thunderbolt
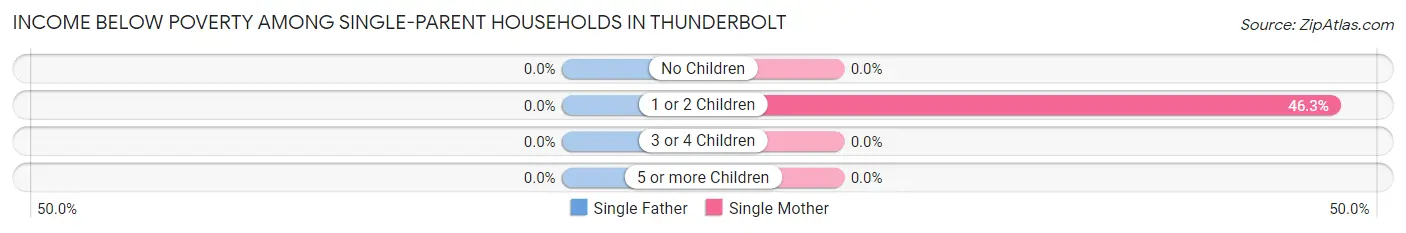
| Children | Single Father | Single Mother |
| No Children | 0 (0.0%) | 0 (0.0%) |
| 1 or 2 Children | 0 (0.0%) | 31 (46.3%) |
| 3 or 4 Children | 0 (0.0%) | 0 (0.0%) |
| 5 or more Children | 0 (0.0%) | 0 (0.0%) |
| Total | 0 (0.0%) | 31 (22.6%) |
Income Below Poverty Among Married-Couple vs Single-Parent Households in Thunderbolt
The poverty data for Thunderbolt shows that 33 of the married-couple family households (11.2%) and 31 of the single-parent households (18.0%) are living below the poverty level. Within the married-couple family households, those with 3 or 4 children have the highest poverty rate, with 13 households (100.0%) falling below the poverty line. Among the single-parent households, those with 1 or 2 children have the highest poverty rate, with 31 household (46.3%) living below poverty.
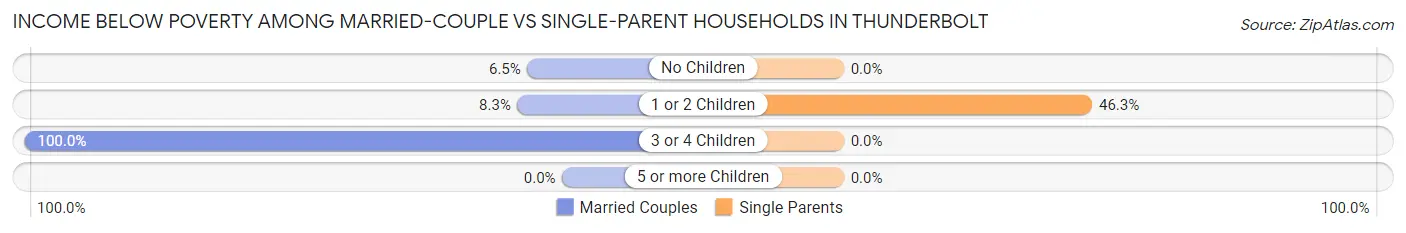
| Children | Married-Couple Families | Single-Parent Households |
| No Children | 12 (6.5%) | 0 (0.0%) |
| 1 or 2 Children | 8 (8.3%) | 31 (46.3%) |
| 3 or 4 Children | 13 (100.0%) | 0 (0.0%) |
| 5 or more Children | 0 (0.0%) | 0 (0.0%) |
| Total | 33 (11.2%) | 31 (18.0%) |
Employment Characteristics in Thunderbolt
Employment by Class of Employer in Thunderbolt
Among the 1,271 employed individuals in Thunderbolt, private company employees (734 | 57.8%), local government employees (164 | 12.9%), and not-for-profit organizations (125 | 9.8%) make up the most common classes of employment.
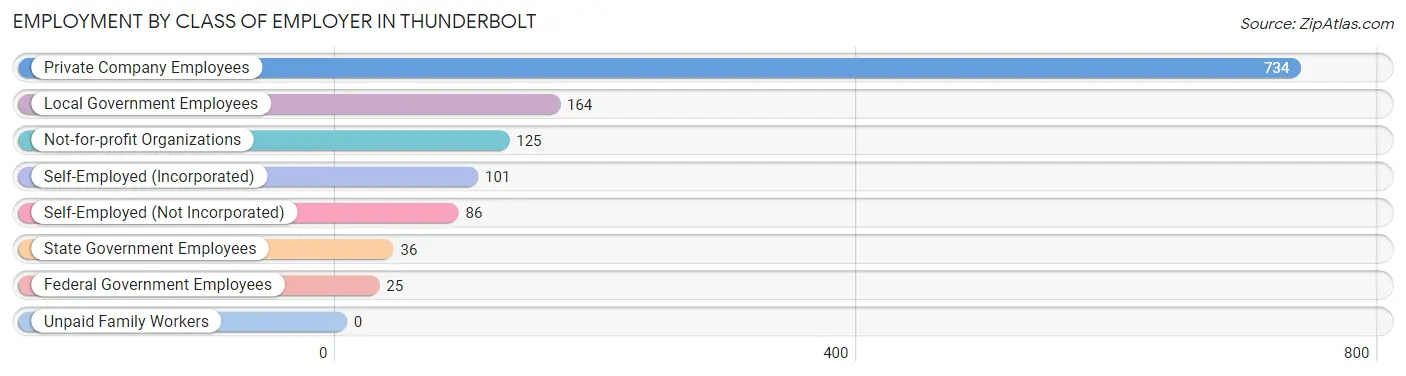
| Employer Class | # Employees | % Employees |
| Private Company Employees | 734 | 57.8% |
| Self-Employed (Incorporated) | 101 | 8.0% |
| Self-Employed (Not Incorporated) | 86 | 6.8% |
| Not-for-profit Organizations | 125 | 9.8% |
| Local Government Employees | 164 | 12.9% |
| State Government Employees | 36 | 2.8% |
| Federal Government Employees | 25 | 2.0% |
| Unpaid Family Workers | 0 | 0.0% |
| Total | 1,271 | 100.0% |
Employment Status by Age in Thunderbolt
According to the labor force statistics for Thunderbolt, out of the total population over 16 years of age (2,127), 63.6% or 1,353 individuals are in the labor force, with 3.6% or 49 of them unemployed. The age group with the highest labor force participation rate is 25 to 29 years, with 100.0% or 162 individuals in the labor force. Within the labor force, the 60 to 64 years age range has the highest percentage of unemployed individuals, with 12.1% or 25 of them being unemployed.
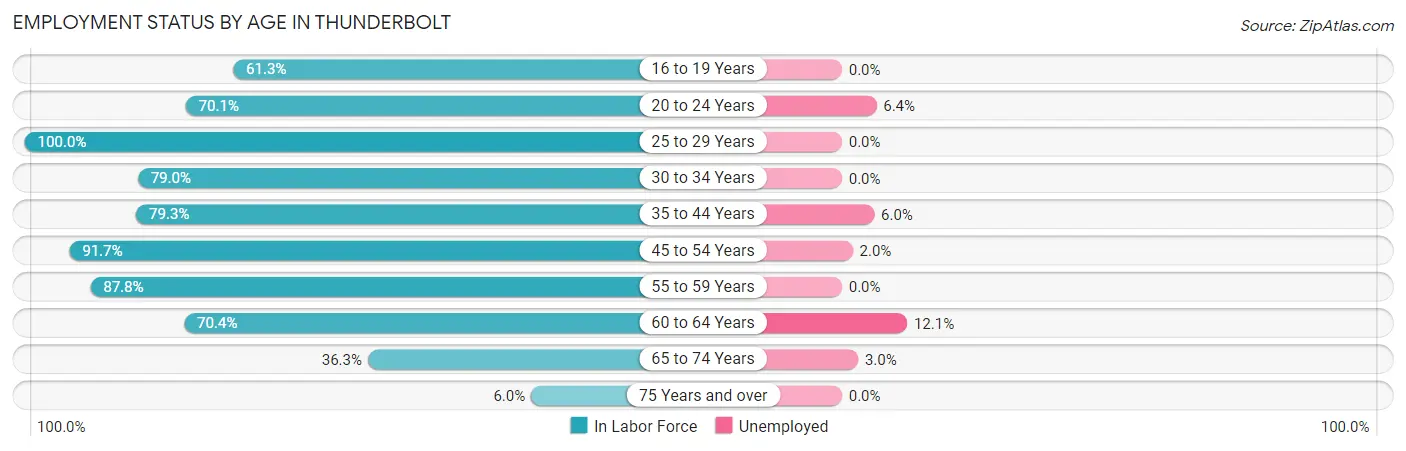
| Age Bracket | In Labor Force | Unemployed |
| 16 to 19 Years | 38 (61.3%) | 0 (0.0%) |
| 20 to 24 Years | 47 (70.1%) | 3 (6.4%) |
| 25 to 29 Years | 162 (100.0%) | 0 (0.0%) |
| 30 to 34 Years | 181 (79.0%) | 0 (0.0%) |
| 35 to 44 Years | 215 (79.3%) | 13 (6.0%) |
| 45 to 54 Years | 199 (91.7%) | 4 (2.0%) |
| 55 to 59 Years | 151 (87.8%) | 0 (0.0%) |
| 60 to 64 Years | 207 (70.4%) | 25 (12.1%) |
| 65 to 74 Years | 135 (36.3%) | 4 (3.0%) |
| 75 Years and over | 17 (6.0%) | 0 (0.0%) |
| Total | 1,353 (63.6%) | 49 (3.6%) |
Employment Status by Educational Attainment in Thunderbolt
According to labor force statistics for Thunderbolt, 82.9% of individuals (1,115) out of the total population between 25 and 64 years of age (1,345) are in the labor force, with 3.8% or 42 of them being unemployed. The group with the highest labor force participation rate are those with the educational attainment of bachelor's degree or higher, with 93.8% or 556 individuals in the labor force. Within the labor force, individuals with college / associate degree education have the highest percentage of unemployment, with 5.0% or 12 of them being unemployed.
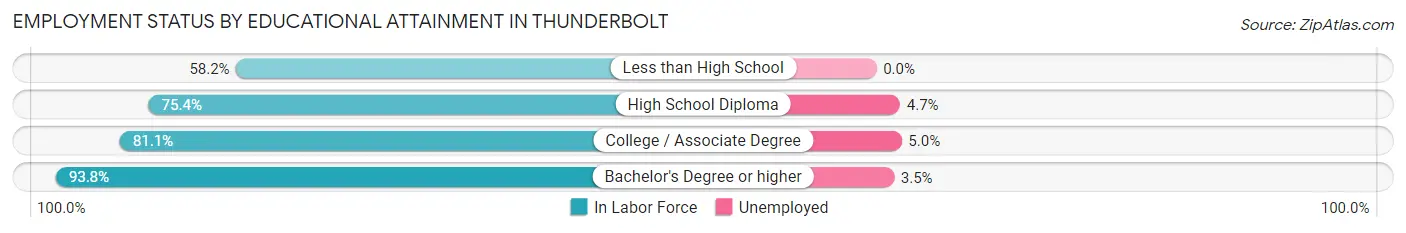
| Educational Attainment | In Labor Force | Unemployed |
| Less than High School | 85 (58.2%) | 0 (0.0%) |
| High School Diploma | 233 (75.4%) | 15 (4.7%) |
| College / Associate Degree | 241 (81.1%) | 15 (5.0%) |
| Bachelor's Degree or higher | 556 (93.8%) | 21 (3.5%) |
| Total | 1,115 (82.9%) | 51 (3.8%) |
Employment Occupations by Sex in Thunderbolt
Management, Business, Science and Arts Occupations
The most common Management, Business, Science and Arts occupations in Thunderbolt are Community & Social Service (311 | 24.0%), Education Instruction & Library (156 | 12.0%), Arts, Media & Entertainment (120 | 9.3%), Computers, Engineering & Science (95 | 7.3%), and Management (56 | 4.3%).
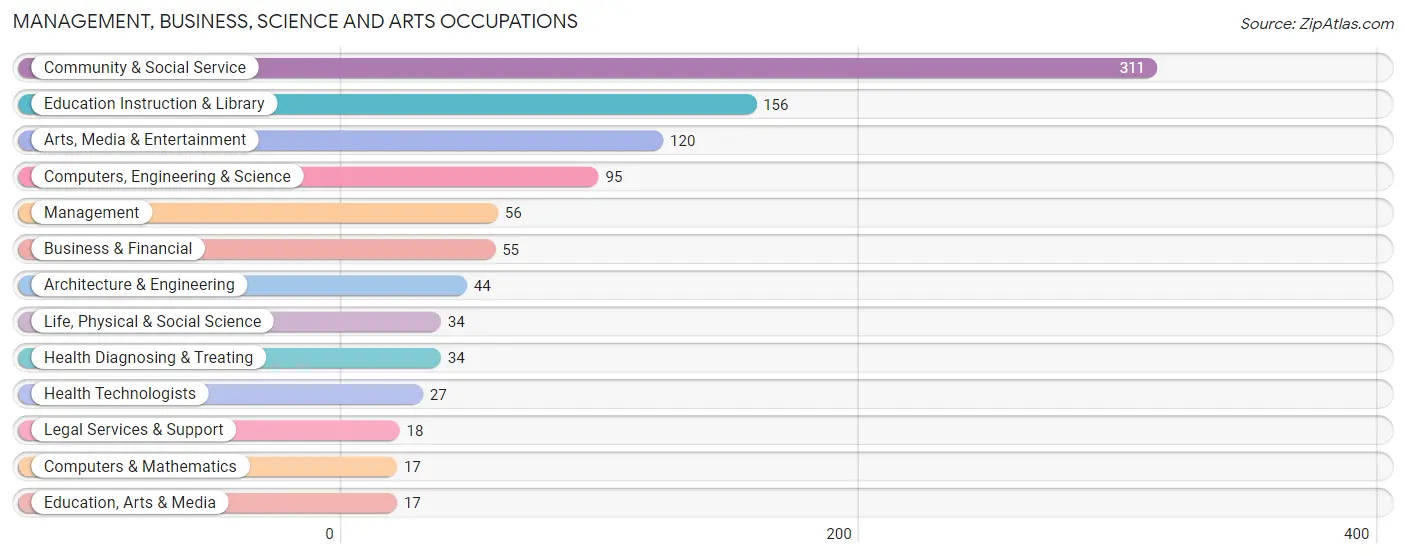
Management, Business, Science and Arts Occupations by Sex
Within the Management, Business, Science and Arts occupations in Thunderbolt, the most male-oriented occupations are Architecture & Engineering (86.4%), Computers & Mathematics (70.6%), and Education, Arts & Media (70.6%), while the most female-oriented occupations are Education Instruction & Library (88.5%), Health Diagnosing & Treating (85.3%), and Health Technologists (81.5%).
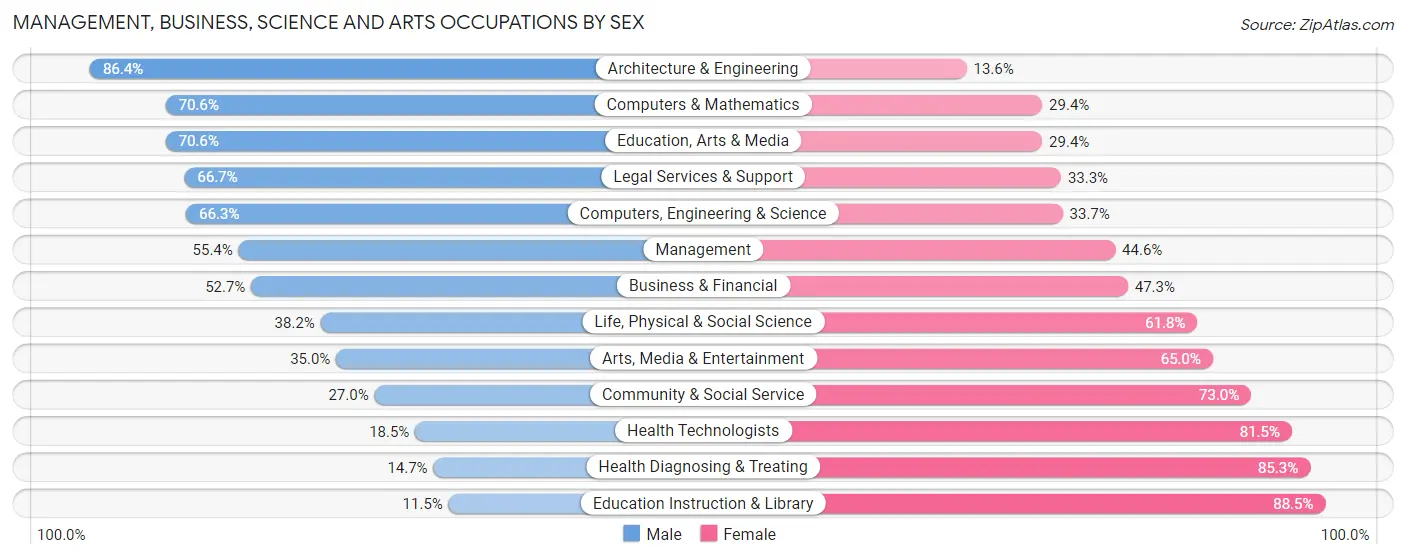
| Occupation | Male | Female |
| Management | 31 (55.4%) | 25 (44.6%) |
| Business & Financial | 29 (52.7%) | 26 (47.3%) |
| Computers, Engineering & Science | 63 (66.3%) | 32 (33.7%) |
| Computers & Mathematics | 12 (70.6%) | 5 (29.4%) |
| Architecture & Engineering | 38 (86.4%) | 6 (13.6%) |
| Life, Physical & Social Science | 13 (38.2%) | 21 (61.8%) |
| Community & Social Service | 84 (27.0%) | 227 (73.0%) |
| Education, Arts & Media | 12 (70.6%) | 5 (29.4%) |
| Legal Services & Support | 12 (66.7%) | 6 (33.3%) |
| Education Instruction & Library | 18 (11.5%) | 138 (88.5%) |
| Arts, Media & Entertainment | 42 (35.0%) | 78 (65.0%) |
| Health Diagnosing & Treating | 5 (14.7%) | 29 (85.3%) |
| Health Technologists | 5 (18.5%) | 22 (81.5%) |
| Total (Category) | 212 (38.5%) | 339 (61.5%) |
| Total (Overall) | 665 (51.3%) | 631 (48.7%) |
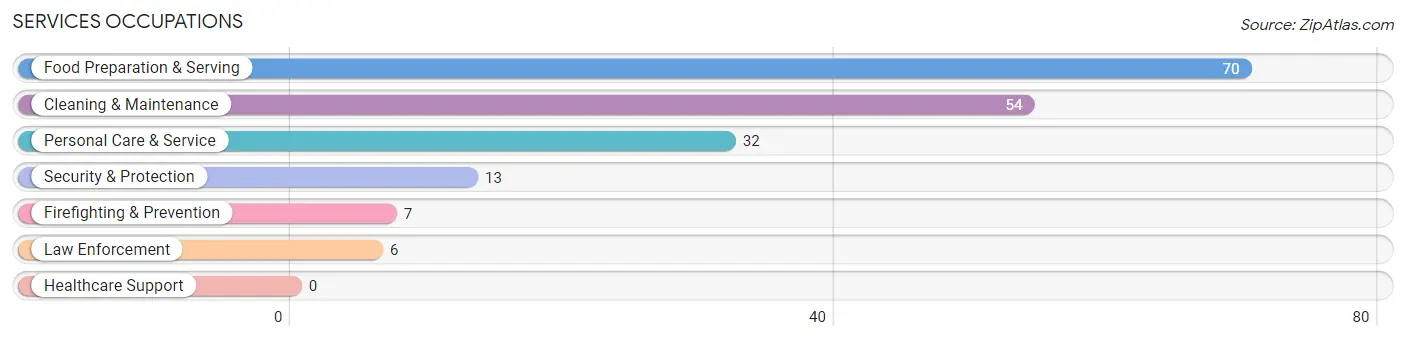
Services Occupations
The most common Services occupations in Thunderbolt are Food Preparation & Serving (70 | 5.4%), Cleaning & Maintenance (54 | 4.2%), Personal Care & Service (32 | 2.5%), Security & Protection (13 | 1.0%), and Firefighting & Prevention (7 | 0.5%).
Services Occupations by Sex
Within the Services occupations in Thunderbolt, the most male-oriented occupations are Security & Protection (100.0%), Firefighting & Prevention (100.0%), and Law Enforcement (100.0%), while the most female-oriented occupations are Cleaning & Maintenance (35.2%), and Food Preparation & Serving (11.4%).
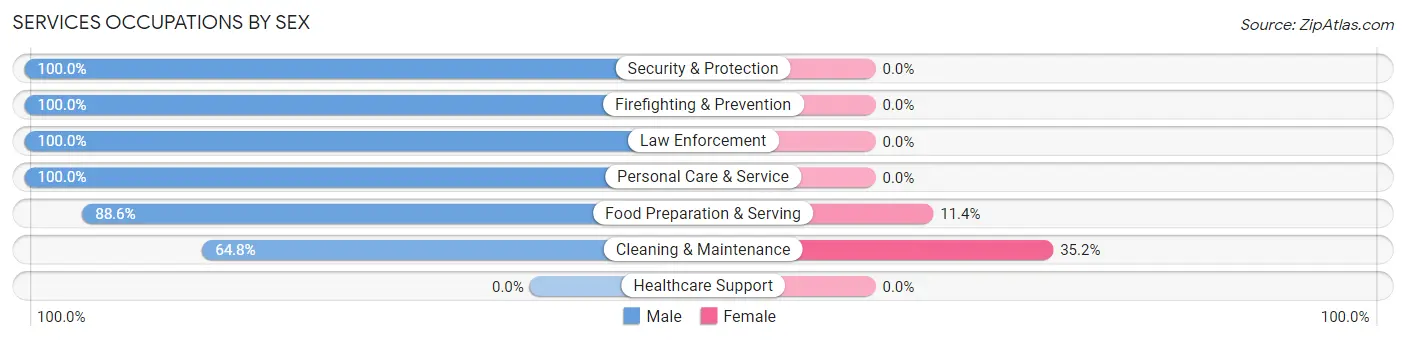
| Occupation | Male | Female |
| Healthcare Support | 0 (0.0%) | 0 (0.0%) |
| Security & Protection | 13 (100.0%) | 0 (0.0%) |
| Firefighting & Prevention | 7 (100.0%) | 0 (0.0%) |
| Law Enforcement | 6 (100.0%) | 0 (0.0%) |
| Food Preparation & Serving | 62 (88.6%) | 8 (11.4%) |
| Cleaning & Maintenance | 35 (64.8%) | 19 (35.2%) |
| Personal Care & Service | 32 (100.0%) | 0 (0.0%) |
| Total (Category) | 142 (84.0%) | 27 (16.0%) |
| Total (Overall) | 665 (51.3%) | 631 (48.7%) |
Sales and Office Occupations
The most common Sales and Office occupations in Thunderbolt are Sales & Related (204 | 15.7%), and Office & Administration (95 | 7.3%).
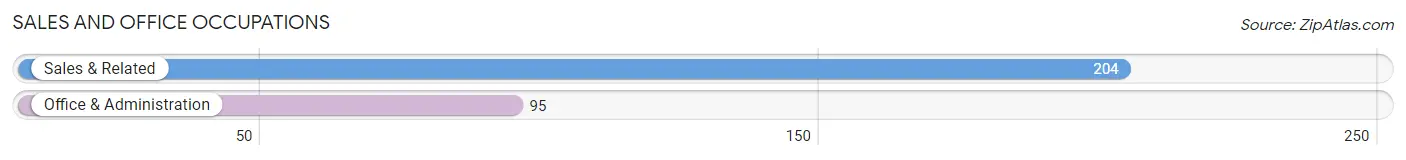
Sales and Office Occupations by Sex
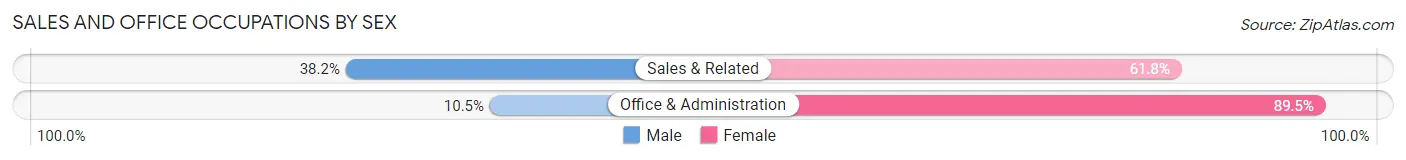
| Occupation | Male | Female |
| Sales & Related | 78 (38.2%) | 126 (61.8%) |
| Office & Administration | 10 (10.5%) | 85 (89.5%) |
| Total (Category) | 88 (29.4%) | 211 (70.6%) |
| Total (Overall) | 665 (51.3%) | 631 (48.7%) |
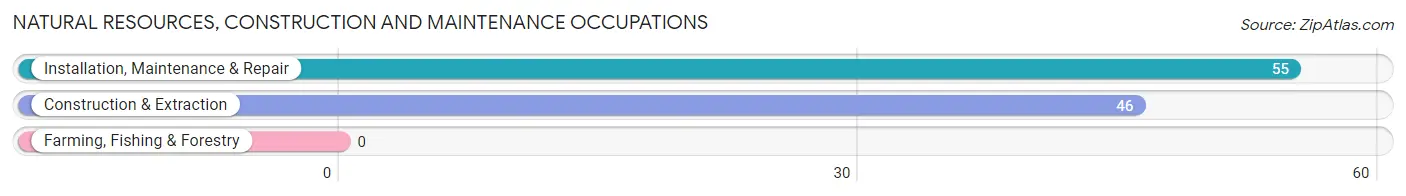
Natural Resources, Construction and Maintenance Occupations
The most common Natural Resources, Construction and Maintenance occupations in Thunderbolt are Installation, Maintenance & Repair (55 | 4.2%), and Construction & Extraction (46 | 3.5%).
Natural Resources, Construction and Maintenance Occupations by Sex
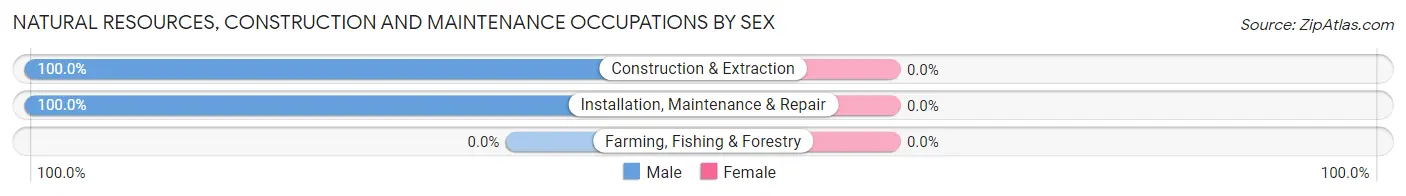
| Occupation | Male | Female |
| Farming, Fishing & Forestry | 0 (0.0%) | 0 (0.0%) |
| Construction & Extraction | 46 (100.0%) | 0 (0.0%) |
| Installation, Maintenance & Repair | 55 (100.0%) | 0 (0.0%) |
| Total (Category) | 101 (100.0%) | 0 (0.0%) |
| Total (Overall) | 665 (51.3%) | 631 (48.7%) |
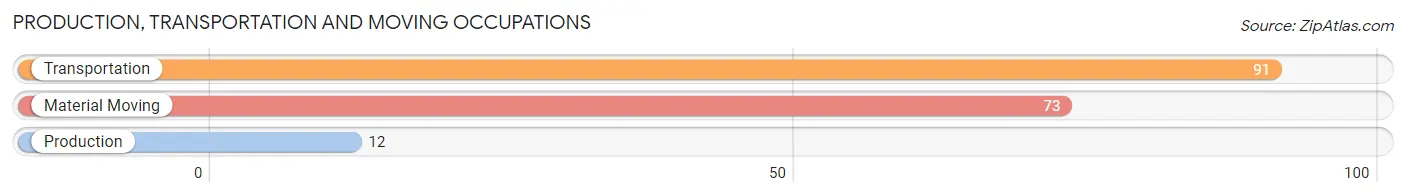
Production, Transportation and Moving Occupations
The most common Production, Transportation and Moving occupations in Thunderbolt are Transportation (91 | 7.0%), Material Moving (73 | 5.6%), and Production (12 | 0.9%).
Production, Transportation and Moving Occupations by Sex
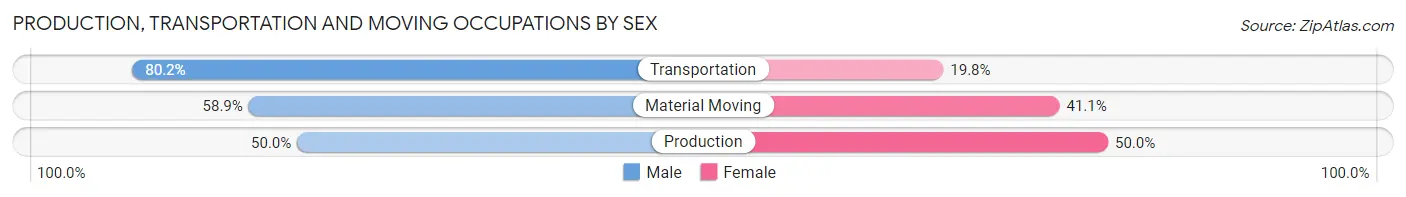
| Occupation | Male | Female |
| Production | 6 (50.0%) | 6 (50.0%) |
| Transportation | 73 (80.2%) | 18 (19.8%) |
| Material Moving | 43 (58.9%) | 30 (41.1%) |
| Total (Category) | 122 (69.3%) | 54 (30.7%) |
| Total (Overall) | 665 (51.3%) | 631 (48.7%) |
Employment Industries by Sex in Thunderbolt
Employment Industries in Thunderbolt
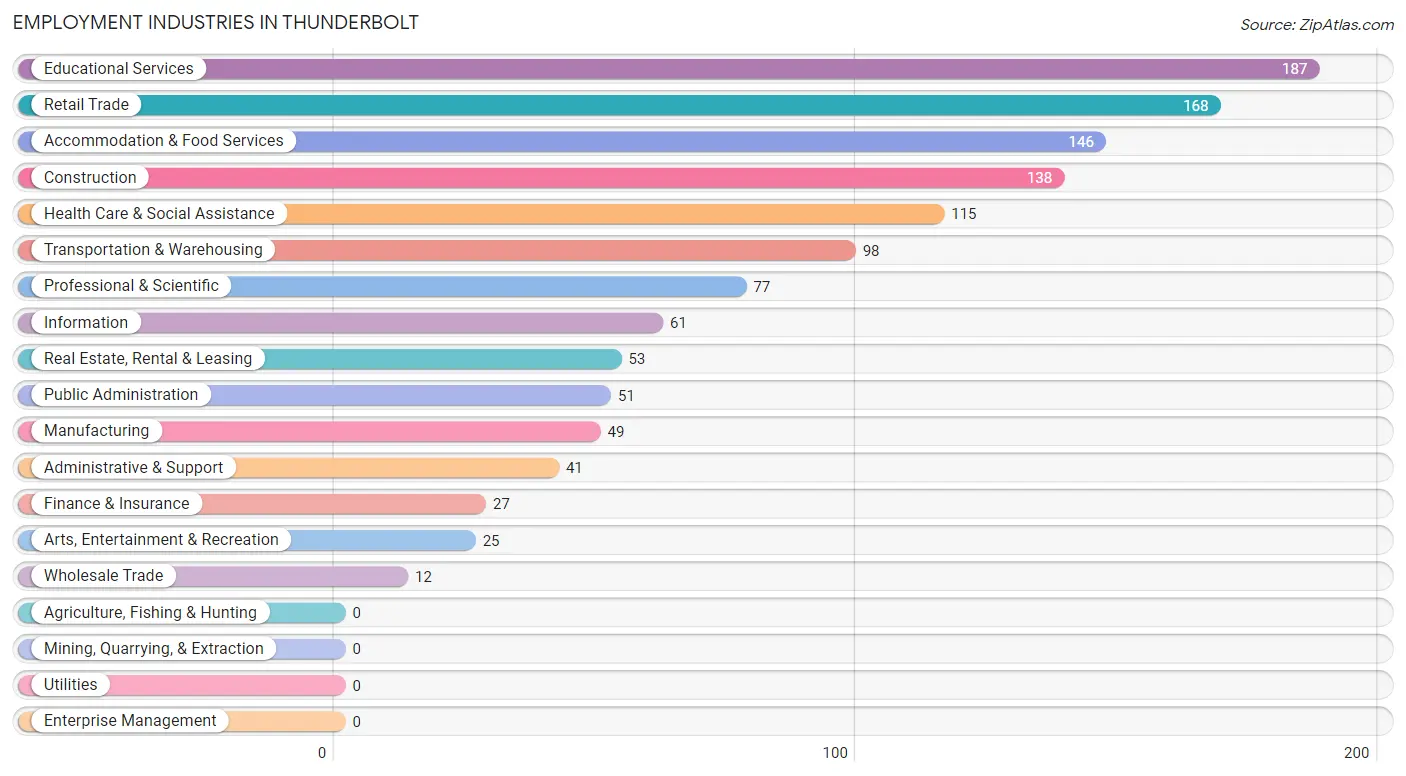
The major employment industries in Thunderbolt include Educational Services (187 | 14.4%), Retail Trade (168 | 13.0%), Accommodation & Food Services (146 | 11.3%), Construction (138 | 10.6%), and Health Care & Social Assistance (115 | 8.9%).
Employment Industries by Sex in Thunderbolt
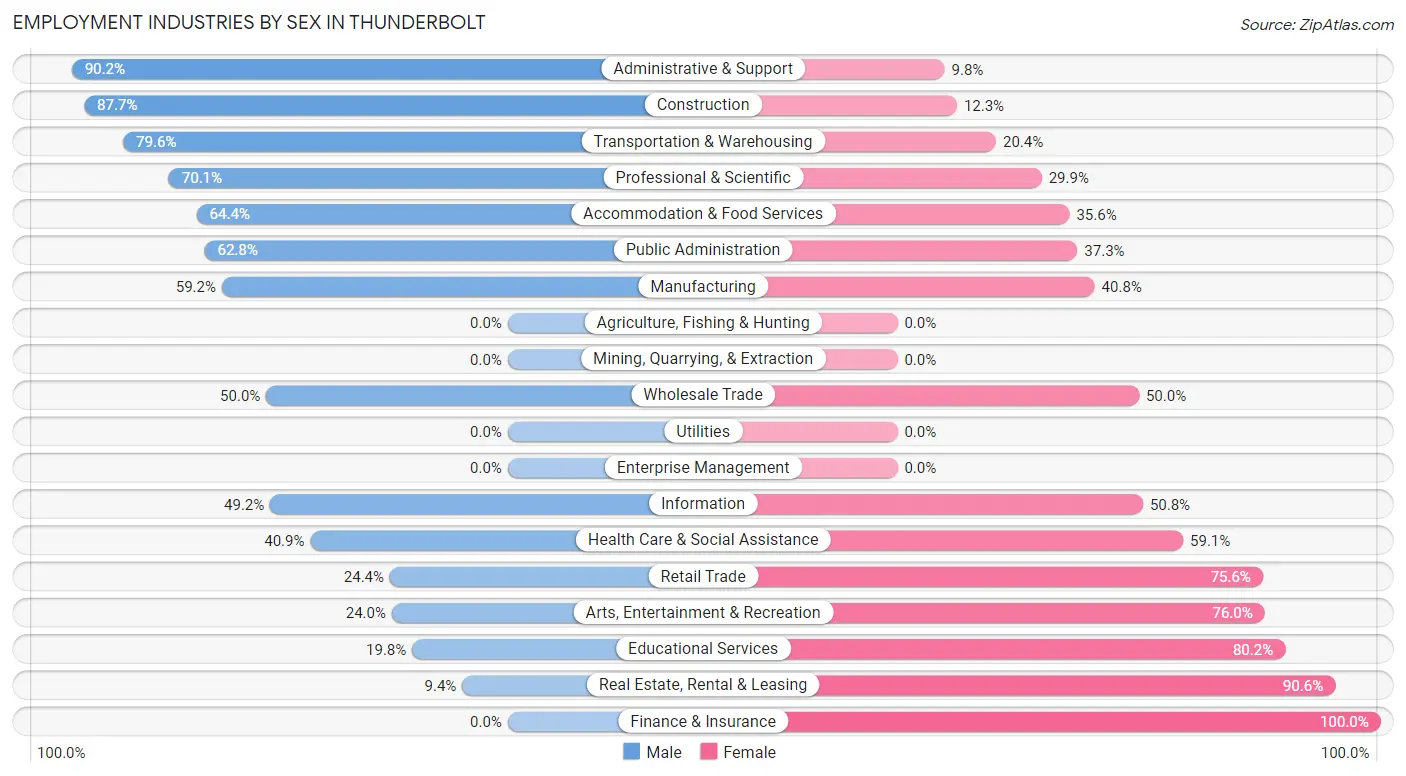
The Thunderbolt industries that see more men than women are Administrative & Support (90.2%), Construction (87.7%), and Transportation & Warehousing (79.6%), whereas the industries that tend to have a higher number of women are Finance & Insurance (100.0%), Real Estate, Rental & Leasing (90.6%), and Educational Services (80.2%).
| Industry | Male | Female |
| Agriculture, Fishing & Hunting | 0 (0.0%) | 0 (0.0%) |
| Mining, Quarrying, & Extraction | 0 (0.0%) | 0 (0.0%) |
| Construction | 121 (87.7%) | 17 (12.3%) |
| Manufacturing | 29 (59.2%) | 20 (40.8%) |
| Wholesale Trade | 6 (50.0%) | 6 (50.0%) |
| Retail Trade | 41 (24.4%) | 127 (75.6%) |
| Transportation & Warehousing | 78 (79.6%) | 20 (20.4%) |
| Utilities | 0 (0.0%) | 0 (0.0%) |
| Information | 30 (49.2%) | 31 (50.8%) |
| Finance & Insurance | 0 (0.0%) | 27 (100.0%) |
| Real Estate, Rental & Leasing | 5 (9.4%) | 48 (90.6%) |
| Professional & Scientific | 54 (70.1%) | 23 (29.9%) |
| Enterprise Management | 0 (0.0%) | 0 (0.0%) |
| Administrative & Support | 37 (90.2%) | 4 (9.8%) |
| Educational Services | 37 (19.8%) | 150 (80.2%) |
| Health Care & Social Assistance | 47 (40.9%) | 68 (59.1%) |
| Arts, Entertainment & Recreation | 6 (24.0%) | 19 (76.0%) |
| Accommodation & Food Services | 94 (64.4%) | 52 (35.6%) |
| Public Administration | 32 (62.7%) | 19 (37.2%) |
| Total | 665 (51.3%) | 631 (48.7%) |
Education in Thunderbolt
School Enrollment in Thunderbolt
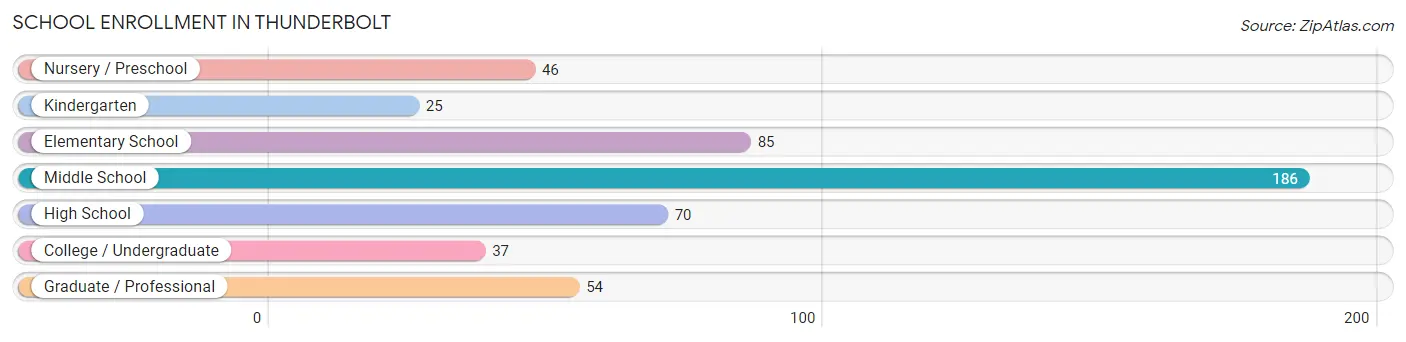
The most common levels of schooling among the 503 students in Thunderbolt are middle school (186 | 37.0%), elementary school (85 | 16.9%), and high school (70 | 13.9%).
| School Level | # Students | % Students |
| Nursery / Preschool | 46 | 9.1% |
| Kindergarten | 25 | 5.0% |
| Elementary School | 85 | 16.9% |
| Middle School | 186 | 37.0% |
| High School | 70 | 13.9% |
| College / Undergraduate | 37 | 7.4% |
| Graduate / Professional | 54 | 10.7% |
| Total | 503 | 100.0% |
School Enrollment by Age by Funding Source in Thunderbolt
Out of a total of 503 students who are enrolled in schools in Thunderbolt, 59 (11.7%) attend a private institution, while the remaining 444 (88.3%) are enrolled in public schools. The age group of 20 to 24 year olds has the highest likelihood of being enrolled in private schools, with 23 (88.5% in the age bracket) enrolled. Conversely, the age group of 3 to 4 year olds has the lowest likelihood of being enrolled in a private school, with 23 (100.0% in the age bracket) attending a public institution.
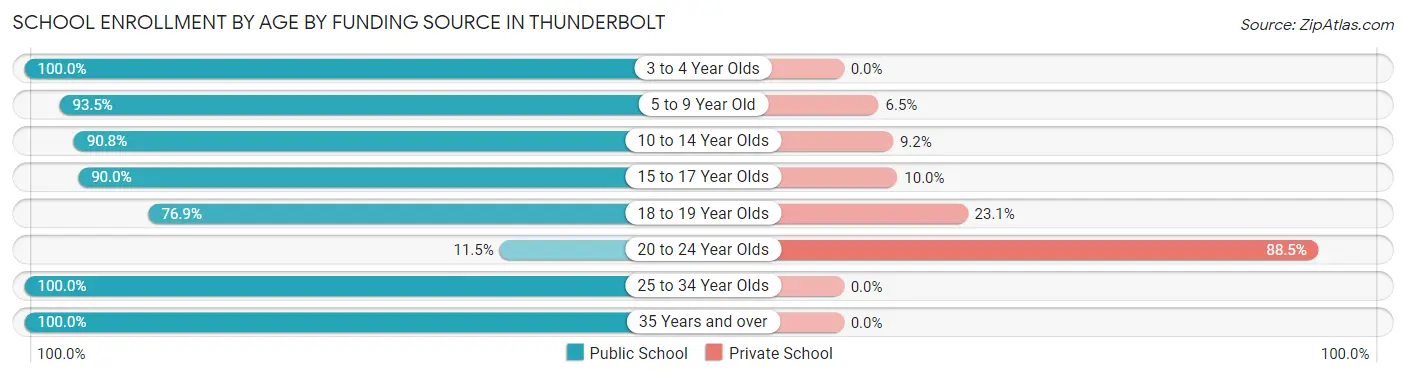
| Age Bracket | Public School | Private School |
| 3 to 4 Year Olds | 23 (100.0%) | 0 (0.0%) |
| 5 to 9 Year Old | 115 (93.5%) | 8 (6.5%) |
| 10 to 14 Year Olds | 178 (90.8%) | 18 (9.2%) |
| 15 to 17 Year Olds | 63 (90.0%) | 7 (10.0%) |
| 18 to 19 Year Olds | 10 (76.9%) | 3 (23.1%) |
| 20 to 24 Year Olds | 3 (11.5%) | 23 (88.5%) |
| 25 to 34 Year Olds | 13 (100.0%) | 0 (0.0%) |
| 35 Years and over | 39 (100.0%) | 0 (0.0%) |
| Total | 444 (88.3%) | 59 (11.7%) |
Educational Attainment by Field of Study in Thunderbolt
Education (158 | 20.1%), business (118 | 15.0%), social sciences (111 | 14.1%), visual & performing arts (83 | 10.6%), and arts & humanities (54 | 6.9%) are the most common fields of study among 785 individuals in Thunderbolt who have obtained a bachelor's degree or higher.
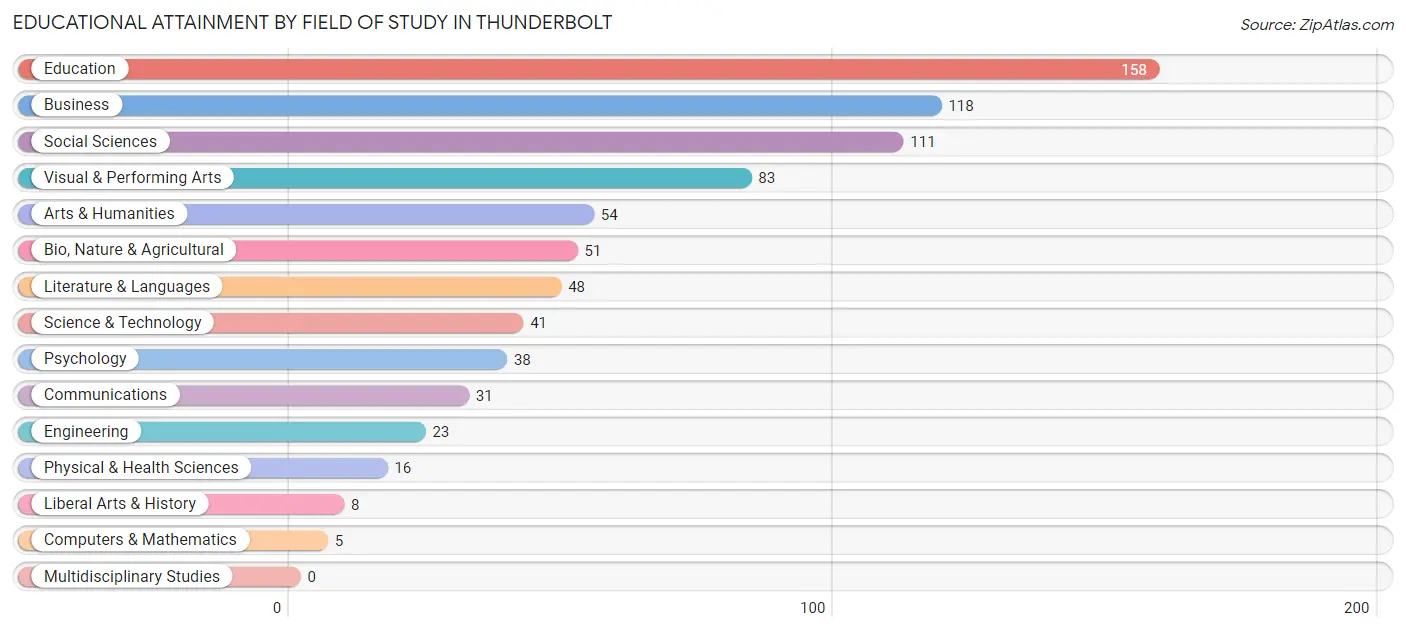
| Field of Study | # Graduates | % Graduates |
| Computers & Mathematics | 5 | 0.6% |
| Bio, Nature & Agricultural | 51 | 6.5% |
| Physical & Health Sciences | 16 | 2.0% |
| Psychology | 38 | 4.8% |
| Social Sciences | 111 | 14.1% |
| Engineering | 23 | 2.9% |
| Multidisciplinary Studies | 0 | 0.0% |
| Science & Technology | 41 | 5.2% |
| Business | 118 | 15.0% |
| Education | 158 | 20.1% |
| Literature & Languages | 48 | 6.1% |
| Liberal Arts & History | 8 | 1.0% |
| Visual & Performing Arts | 83 | 10.6% |
| Communications | 31 | 4.0% |
| Arts & Humanities | 54 | 6.9% |
| Total | 785 | 100.0% |
Transportation & Commute in Thunderbolt
Vehicle Availability by Sex in Thunderbolt
The most prevalent vehicle ownership categories in Thunderbolt are males with 1 vehicle (310, accounting for 48.5%) and females with 1 vehicle (265, making up 49.0%).
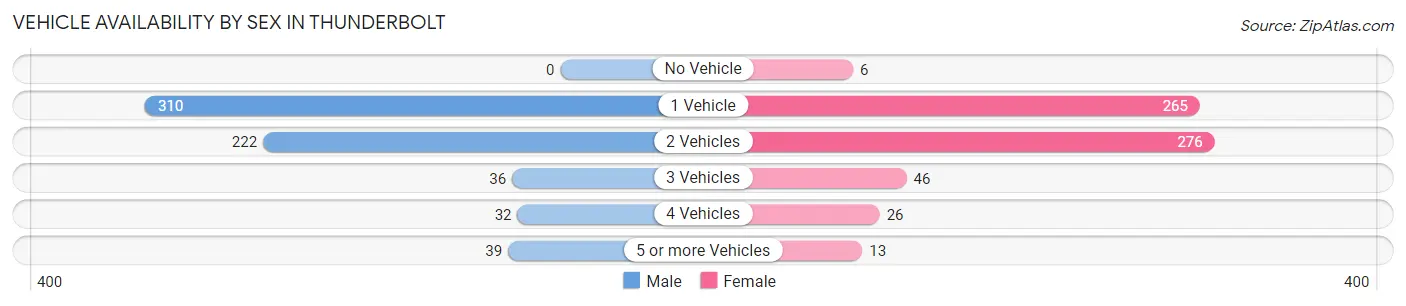
| Vehicles Available | Male | Female |
| No Vehicle | 0 (0.0%) | 6 (0.9%) |
| 1 Vehicle | 310 (48.5%) | 265 (41.9%) |
| 2 Vehicles | 222 (34.7%) | 276 (43.7%) |
| 3 Vehicles | 36 (5.6%) | 46 (7.3%) |
| 4 Vehicles | 32 (5.0%) | 26 (4.1%) |
| 5 or more Vehicles | 39 (6.1%) | 13 (2.1%) |
| Total | 639 (100.0%) | 632 (100.0%) |
Commute Time in Thunderbolt
The most frequently occuring commute durations in Thunderbolt are 15 to 19 minutes (289 commuters, 27.5%), 20 to 24 minutes (193 commuters, 18.3%), and 10 to 14 minutes (140 commuters, 13.3%).
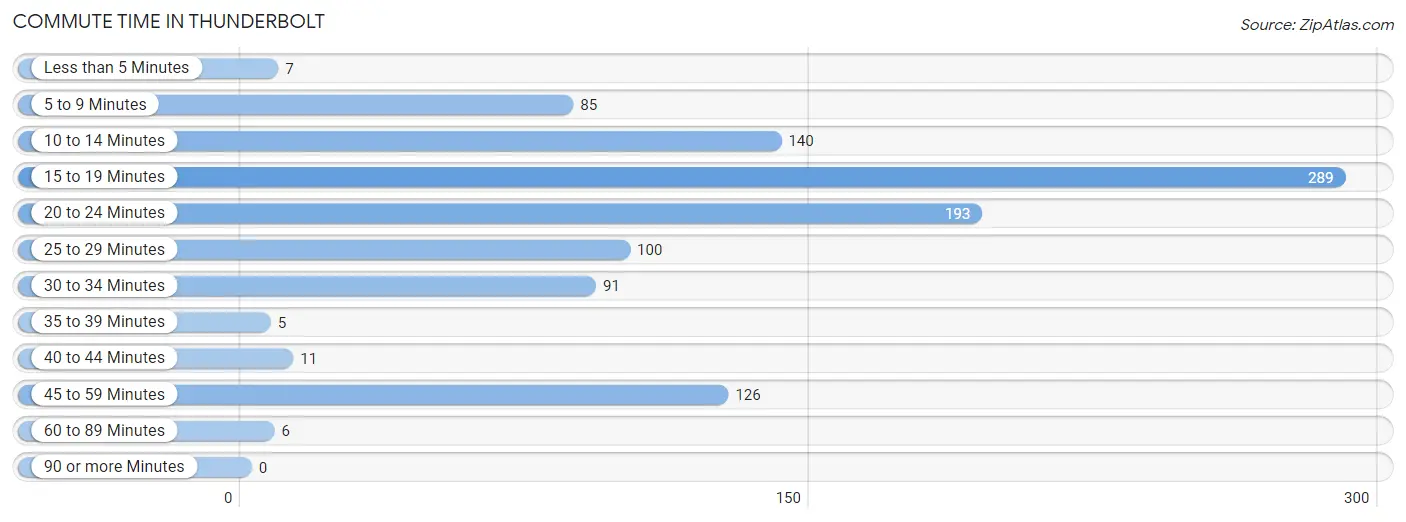
| Commute Time | # Commuters | % Commuters |
| Less than 5 Minutes | 7 | 0.7% |
| 5 to 9 Minutes | 85 | 8.1% |
| 10 to 14 Minutes | 140 | 13.3% |
| 15 to 19 Minutes | 289 | 27.5% |
| 20 to 24 Minutes | 193 | 18.3% |
| 25 to 29 Minutes | 100 | 9.5% |
| 30 to 34 Minutes | 91 | 8.6% |
| 35 to 39 Minutes | 5 | 0.5% |
| 40 to 44 Minutes | 11 | 1.0% |
| 45 to 59 Minutes | 126 | 12.0% |
| 60 to 89 Minutes | 6 | 0.6% |
| 90 or more Minutes | 0 | 0.0% |
Commute Time by Sex in Thunderbolt
The most common commute times in Thunderbolt are 20 to 24 minutes (115 commuters, 23.3%) for males and 15 to 19 minutes (188 commuters, 33.6%) for females.
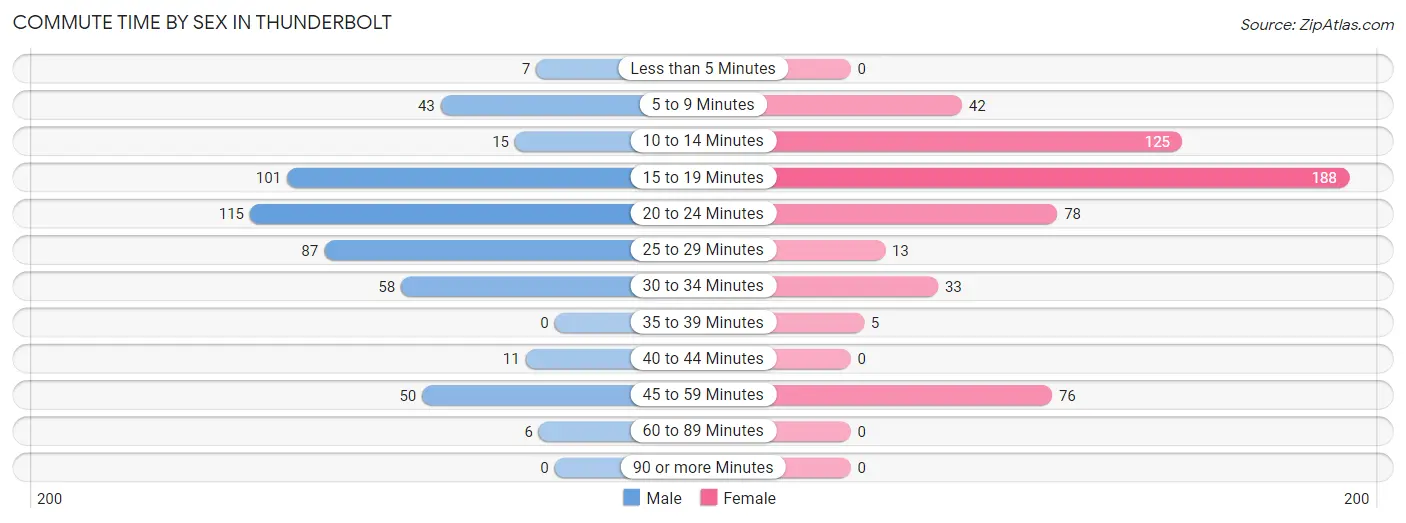
| Commute Time | Male | Female |
| Less than 5 Minutes | 7 (1.4%) | 0 (0.0%) |
| 5 to 9 Minutes | 43 (8.7%) | 42 (7.5%) |
| 10 to 14 Minutes | 15 (3.0%) | 125 (22.3%) |
| 15 to 19 Minutes | 101 (20.5%) | 188 (33.6%) |
| 20 to 24 Minutes | 115 (23.3%) | 78 (13.9%) |
| 25 to 29 Minutes | 87 (17.6%) | 13 (2.3%) |
| 30 to 34 Minutes | 58 (11.8%) | 33 (5.9%) |
| 35 to 39 Minutes | 0 (0.0%) | 5 (0.9%) |
| 40 to 44 Minutes | 11 (2.2%) | 0 (0.0%) |
| 45 to 59 Minutes | 50 (10.1%) | 76 (13.6%) |
| 60 to 89 Minutes | 6 (1.2%) | 0 (0.0%) |
| 90 or more Minutes | 0 (0.0%) | 0 (0.0%) |
Time of Departure to Work by Sex in Thunderbolt
The most frequent times of departure to work in Thunderbolt are 8:00 AM to 8:29 AM (113, 22.9%) for males and 6:00 AM to 6:29 AM (106, 18.9%) for females.
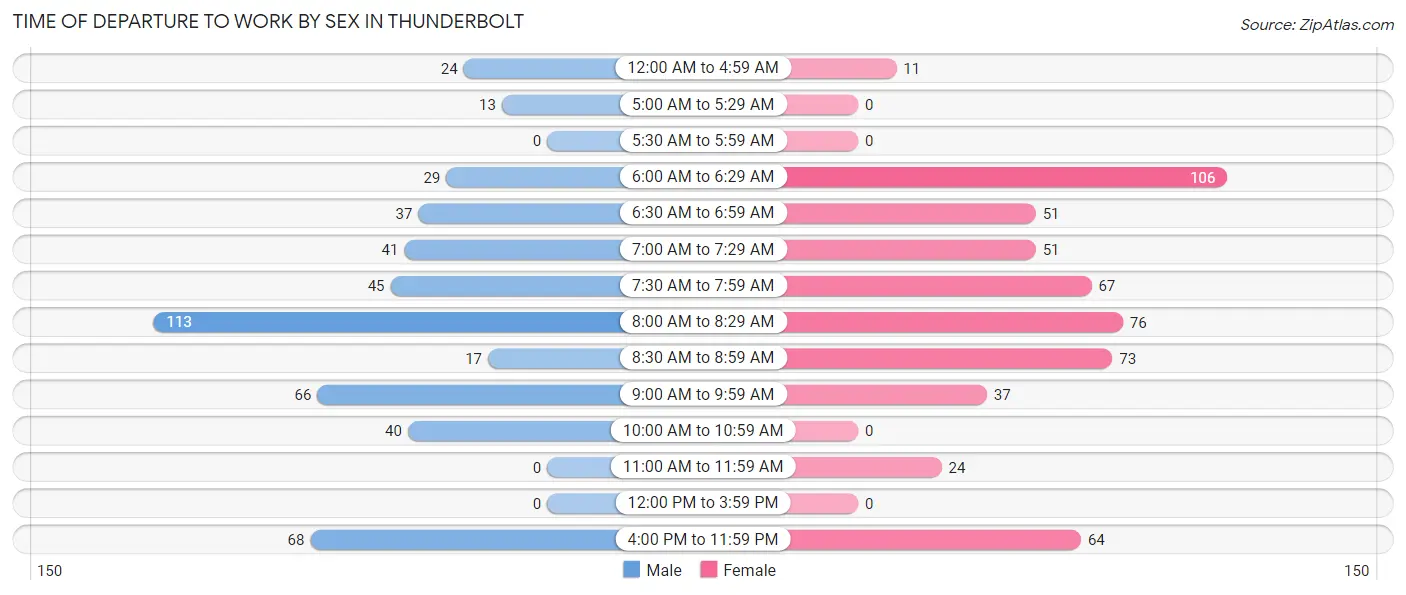
| Time of Departure | Male | Female |
| 12:00 AM to 4:59 AM | 24 (4.9%) | 11 (2.0%) |
| 5:00 AM to 5:29 AM | 13 (2.6%) | 0 (0.0%) |
| 5:30 AM to 5:59 AM | 0 (0.0%) | 0 (0.0%) |
| 6:00 AM to 6:29 AM | 29 (5.9%) | 106 (18.9%) |
| 6:30 AM to 6:59 AM | 37 (7.5%) | 51 (9.1%) |
| 7:00 AM to 7:29 AM | 41 (8.3%) | 51 (9.1%) |
| 7:30 AM to 7:59 AM | 45 (9.1%) | 67 (12.0%) |
| 8:00 AM to 8:29 AM | 113 (22.9%) | 76 (13.6%) |
| 8:30 AM to 8:59 AM | 17 (3.5%) | 73 (13.0%) |
| 9:00 AM to 9:59 AM | 66 (13.4%) | 37 (6.6%) |
| 10:00 AM to 10:59 AM | 40 (8.1%) | 0 (0.0%) |
| 11:00 AM to 11:59 AM | 0 (0.0%) | 24 (4.3%) |
| 12:00 PM to 3:59 PM | 0 (0.0%) | 0 (0.0%) |
| 4:00 PM to 11:59 PM | 68 (13.8%) | 64 (11.4%) |
| Total | 493 (100.0%) | 560 (100.0%) |
Housing Occupancy in Thunderbolt
Occupancy by Ownership in Thunderbolt
Of the total 1,226 dwellings in Thunderbolt, owner-occupied units account for 783 (63.9%), while renter-occupied units make up 443 (36.1%).
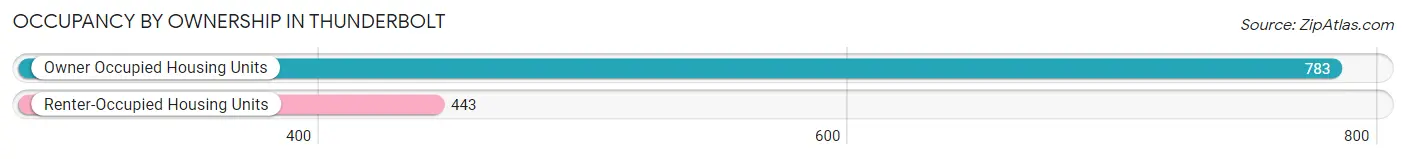
| Occupancy | # Housing Units | % Housing Units |
| Owner Occupied Housing Units | 783 | 63.9% |
| Renter-Occupied Housing Units | 443 | 36.1% |
| Total Occupied Housing Units | 1,226 | 100.0% |
Occupancy by Household Size in Thunderbolt
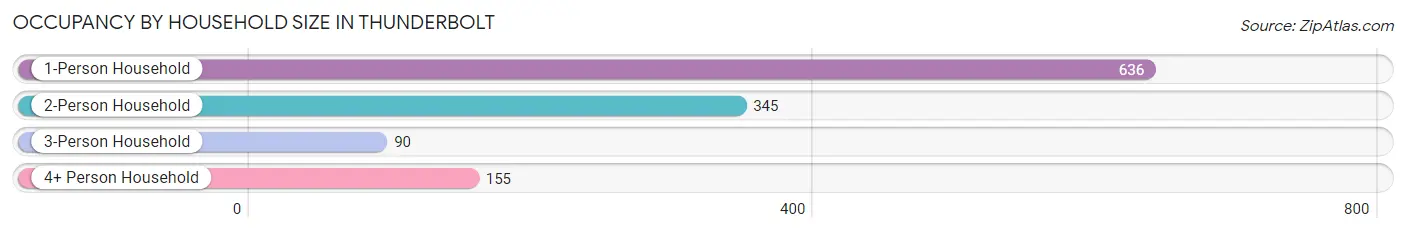
| Household Size | # Housing Units | % Housing Units |
| 1-Person Household | 636 | 51.9% |
| 2-Person Household | 345 | 28.1% |
| 3-Person Household | 90 | 7.3% |
| 4+ Person Household | 155 | 12.6% |
| Total Housing Units | 1,226 | 100.0% |
Occupancy by Ownership by Household Size in Thunderbolt
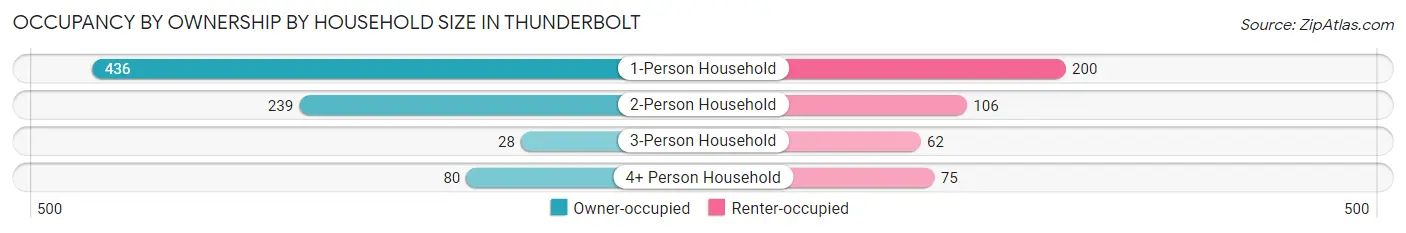
| Household Size | Owner-occupied | Renter-occupied |
| 1-Person Household | 436 (68.5%) | 200 (31.5%) |
| 2-Person Household | 239 (69.3%) | 106 (30.7%) |
| 3-Person Household | 28 (31.1%) | 62 (68.9%) |
| 4+ Person Household | 80 (51.6%) | 75 (48.4%) |
| Total Housing Units | 783 (63.9%) | 443 (36.1%) |
Occupancy by Educational Attainment in Thunderbolt
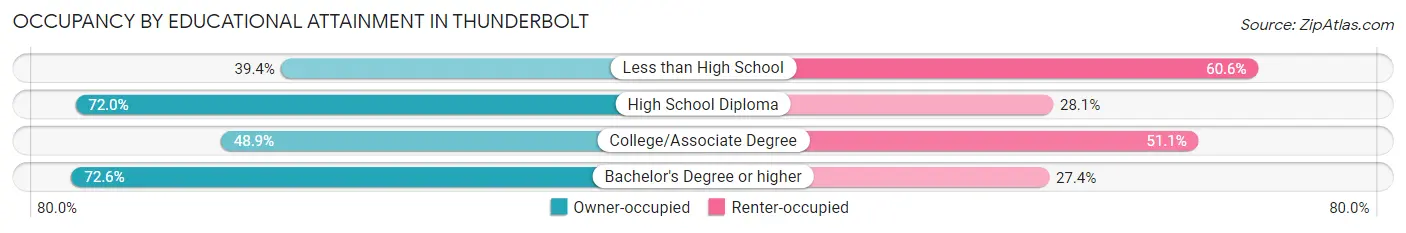
| Household Size | Owner-occupied | Renter-occupied |
| Less than High School | 26 (39.4%) | 40 (60.6%) |
| High School Diploma | 218 (72.0%) | 85 (28.1%) |
| College/Associate Degree | 171 (48.9%) | 179 (51.1%) |
| Bachelor's Degree or higher | 368 (72.6%) | 139 (27.4%) |
Occupancy by Age of Householder in Thunderbolt
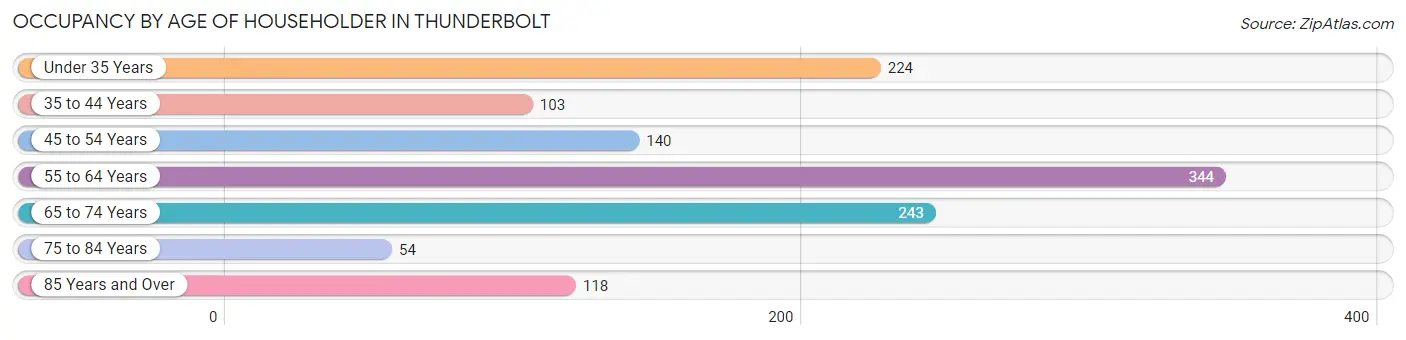
| Age Bracket | # Households | % Households |
| Under 35 Years | 224 | 18.3% |
| 35 to 44 Years | 103 | 8.4% |
| 45 to 54 Years | 140 | 11.4% |
| 55 to 64 Years | 344 | 28.1% |
| 65 to 74 Years | 243 | 19.8% |
| 75 to 84 Years | 54 | 4.4% |
| 85 Years and Over | 118 | 9.6% |
| Total | 1,226 | 100.0% |
Housing Finances in Thunderbolt
Median Income by Occupancy in Thunderbolt
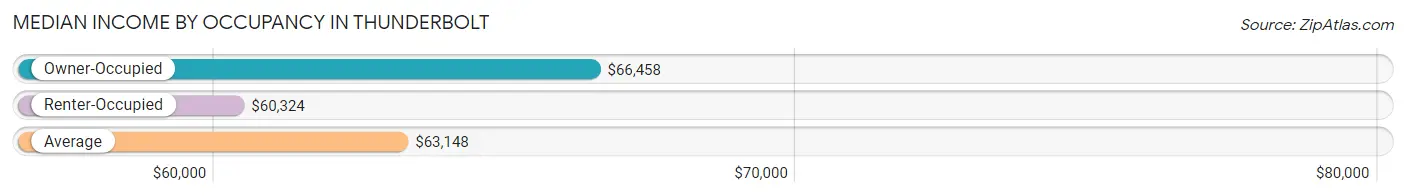
| Occupancy Type | # Households | Median Income |
| Owner-Occupied | 783 (63.9%) | $66,458 |
| Renter-Occupied | 443 (36.1%) | $60,324 |
| Average | 1,226 (100.0%) | $63,148 |
Occupancy by Householder Income Bracket in Thunderbolt
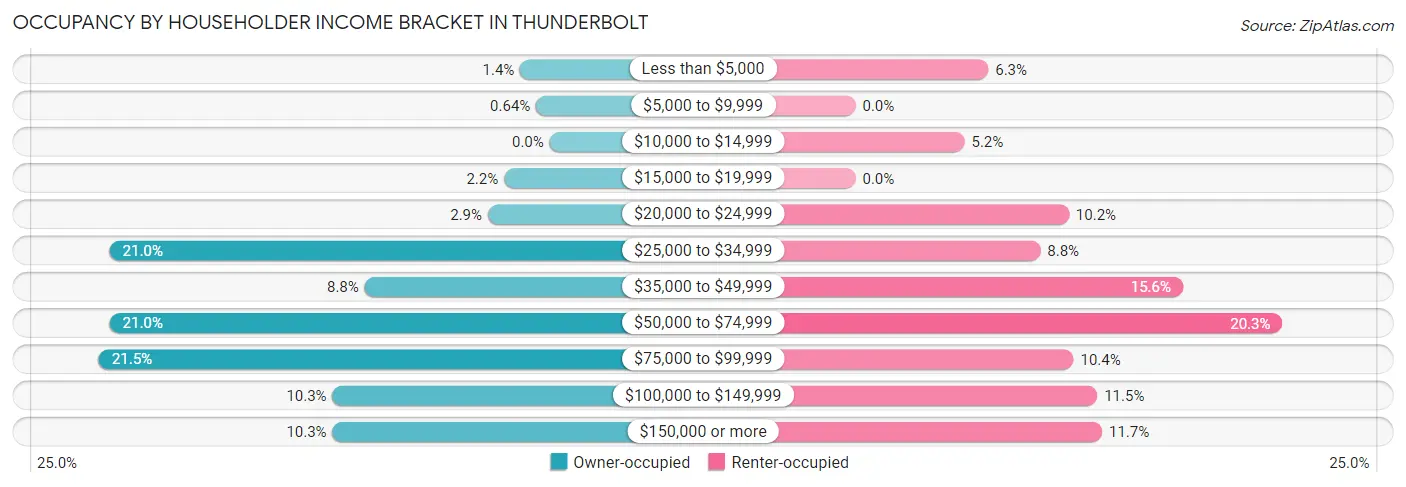
| Income Bracket | Owner-occupied | Renter-occupied |
| Less than $5,000 | 11 (1.4%) | 28 (6.3%) |
| $5,000 to $9,999 | 5 (0.6%) | 0 (0.0%) |
| $10,000 to $14,999 | 0 (0.0%) | 23 (5.2%) |
| $15,000 to $19,999 | 17 (2.2%) | 0 (0.0%) |
| $20,000 to $24,999 | 23 (2.9%) | 45 (10.2%) |
| $25,000 to $34,999 | 164 (20.9%) | 39 (8.8%) |
| $35,000 to $49,999 | 69 (8.8%) | 69 (15.6%) |
| $50,000 to $74,999 | 164 (20.9%) | 90 (20.3%) |
| $75,000 to $99,999 | 168 (21.5%) | 46 (10.4%) |
| $100,000 to $149,999 | 81 (10.3%) | 51 (11.5%) |
| $150,000 or more | 81 (10.3%) | 52 (11.7%) |
| Total | 783 (100.0%) | 443 (100.0%) |
Monthly Housing Cost Tiers in Thunderbolt
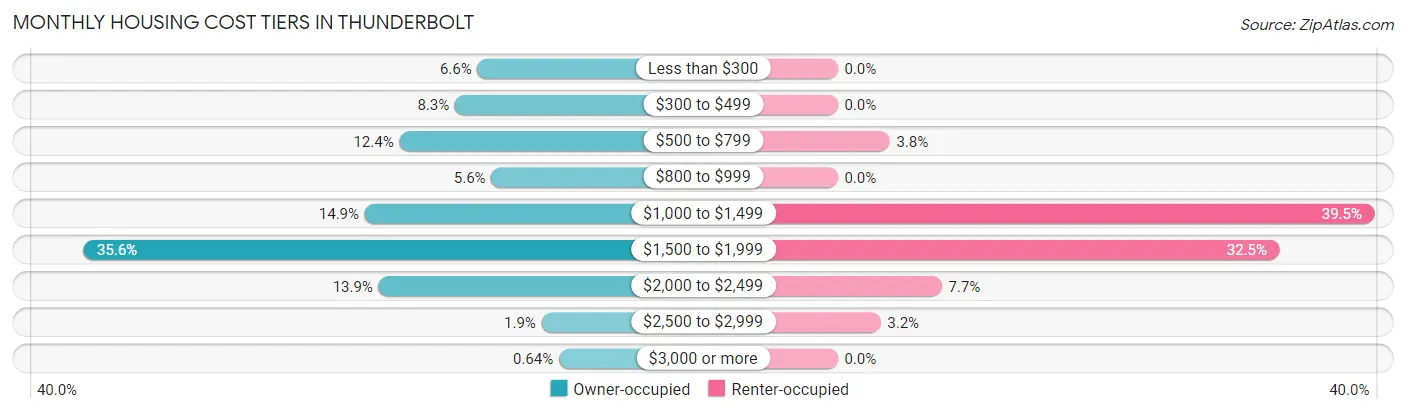
| Monthly Cost | Owner-occupied | Renter-occupied |
| Less than $300 | 52 (6.6%) | 0 (0.0%) |
| $300 to $499 | 65 (8.3%) | 0 (0.0%) |
| $500 to $799 | 97 (12.4%) | 17 (3.8%) |
| $800 to $999 | 44 (5.6%) | 0 (0.0%) |
| $1,000 to $1,499 | 117 (14.9%) | 175 (39.5%) |
| $1,500 to $1,999 | 279 (35.6%) | 144 (32.5%) |
| $2,000 to $2,499 | 109 (13.9%) | 34 (7.7%) |
| $2,500 to $2,999 | 15 (1.9%) | 14 (3.2%) |
| $3,000 or more | 5 (0.6%) | 0 (0.0%) |
| Total | 783 (100.0%) | 443 (100.0%) |
Physical Housing Characteristics in Thunderbolt
Housing Structures in Thunderbolt
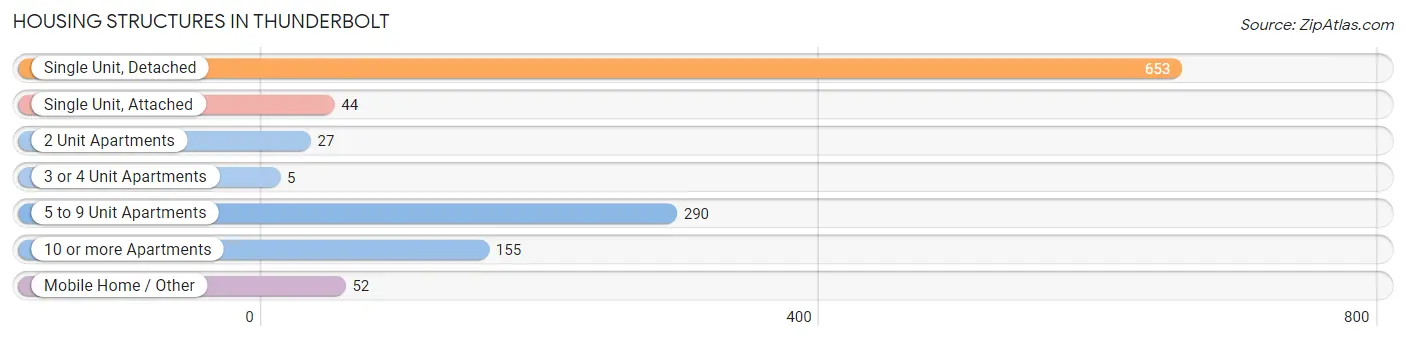
| Structure Type | # Housing Units | % Housing Units |
| Single Unit, Detached | 653 | 53.3% |
| Single Unit, Attached | 44 | 3.6% |
| 2 Unit Apartments | 27 | 2.2% |
| 3 or 4 Unit Apartments | 5 | 0.4% |
| 5 to 9 Unit Apartments | 290 | 23.6% |
| 10 or more Apartments | 155 | 12.6% |
| Mobile Home / Other | 52 | 4.2% |
| Total | 1,226 | 100.0% |
Housing Structures by Occupancy in Thunderbolt
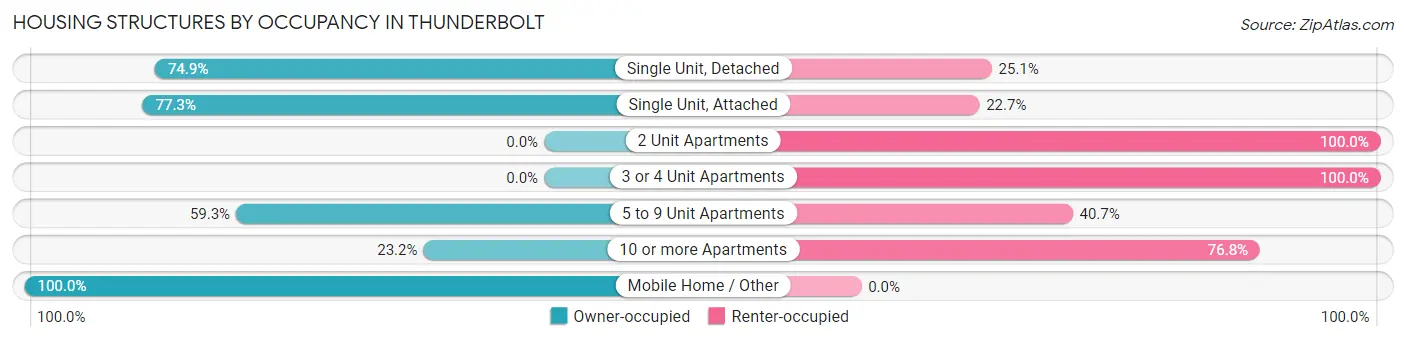
| Structure Type | Owner-occupied | Renter-occupied |
| Single Unit, Detached | 489 (74.9%) | 164 (25.1%) |
| Single Unit, Attached | 34 (77.3%) | 10 (22.7%) |
| 2 Unit Apartments | 0 (0.0%) | 27 (100.0%) |
| 3 or 4 Unit Apartments | 0 (0.0%) | 5 (100.0%) |
| 5 to 9 Unit Apartments | 172 (59.3%) | 118 (40.7%) |
| 10 or more Apartments | 36 (23.2%) | 119 (76.8%) |
| Mobile Home / Other | 52 (100.0%) | 0 (0.0%) |
| Total | 783 (63.9%) | 443 (36.1%) |
Housing Structures by Number of Rooms in Thunderbolt
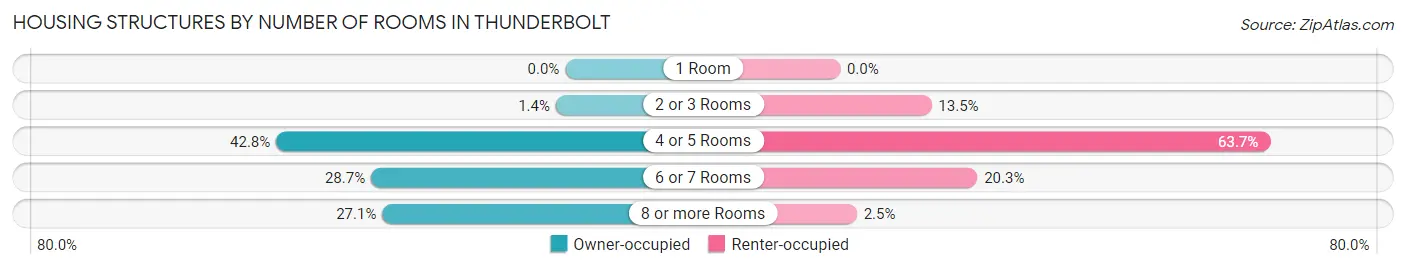
| Number of Rooms | Owner-occupied | Renter-occupied |
| 1 Room | 0 (0.0%) | 0 (0.0%) |
| 2 or 3 Rooms | 11 (1.4%) | 60 (13.5%) |
| 4 or 5 Rooms | 335 (42.8%) | 282 (63.7%) |
| 6 or 7 Rooms | 225 (28.7%) | 90 (20.3%) |
| 8 or more Rooms | 212 (27.1%) | 11 (2.5%) |
| Total | 783 (100.0%) | 443 (100.0%) |
Housing Structure by Heating Type in Thunderbolt
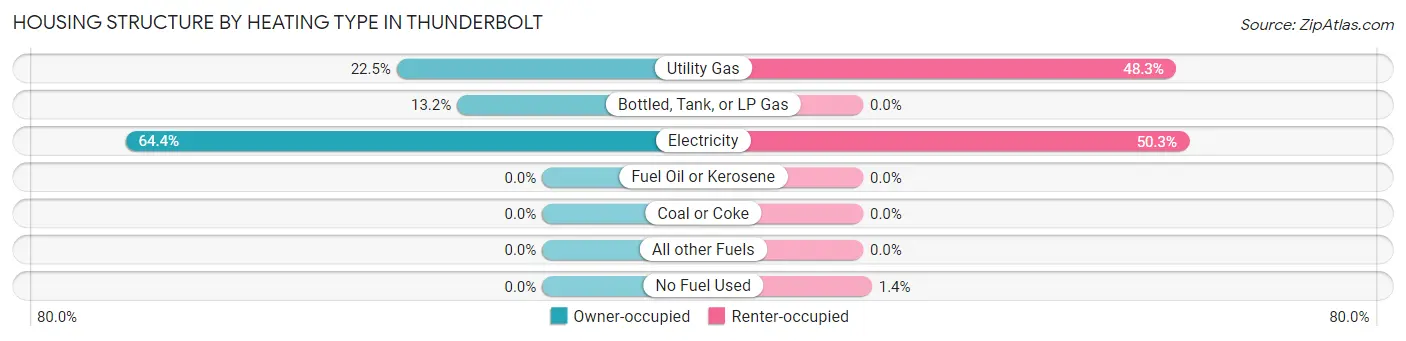
| Heating Type | Owner-occupied | Renter-occupied |
| Utility Gas | 176 (22.5%) | 214 (48.3%) |
| Bottled, Tank, or LP Gas | 103 (13.2%) | 0 (0.0%) |
| Electricity | 504 (64.4%) | 223 (50.3%) |
| Fuel Oil or Kerosene | 0 (0.0%) | 0 (0.0%) |
| Coal or Coke | 0 (0.0%) | 0 (0.0%) |
| All other Fuels | 0 (0.0%) | 0 (0.0%) |
| No Fuel Used | 0 (0.0%) | 6 (1.3%) |
| Total | 783 (100.0%) | 443 (100.0%) |
Household Vehicle Usage in Thunderbolt
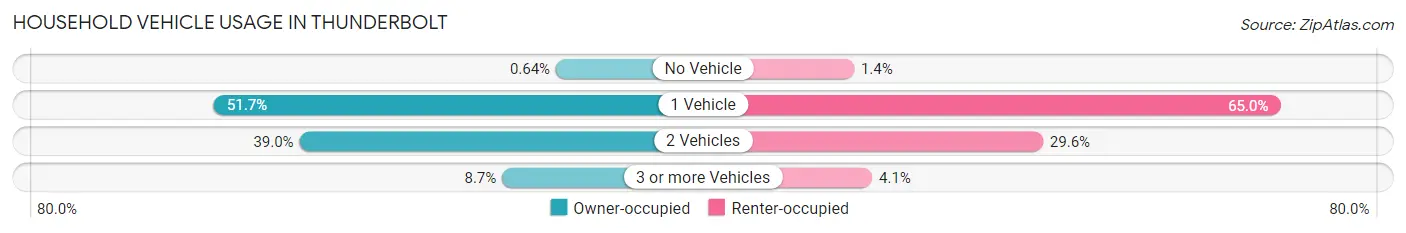
| Vehicles per Household | Owner-occupied | Renter-occupied |
| No Vehicle | 5 (0.6%) | 6 (1.3%) |
| 1 Vehicle | 405 (51.7%) | 288 (65.0%) |
| 2 Vehicles | 305 (39.0%) | 131 (29.6%) |
| 3 or more Vehicles | 68 (8.7%) | 18 (4.1%) |
| Total | 783 (100.0%) | 443 (100.0%) |
Real Estate & Mortgages in Thunderbolt
Real Estate and Mortgage Overview in Thunderbolt
| Characteristic | Without Mortgage | With Mortgage |
| Housing Units | 251 | 532 |
| Median Property Value | $192,800 | $298,000 |
| Median Household Income | $59,050 | $70 |
| Monthly Housing Costs | $534 | $5 |
| Real Estate Taxes | $1,463 | $0 |
Property Value by Mortgage Status in Thunderbolt
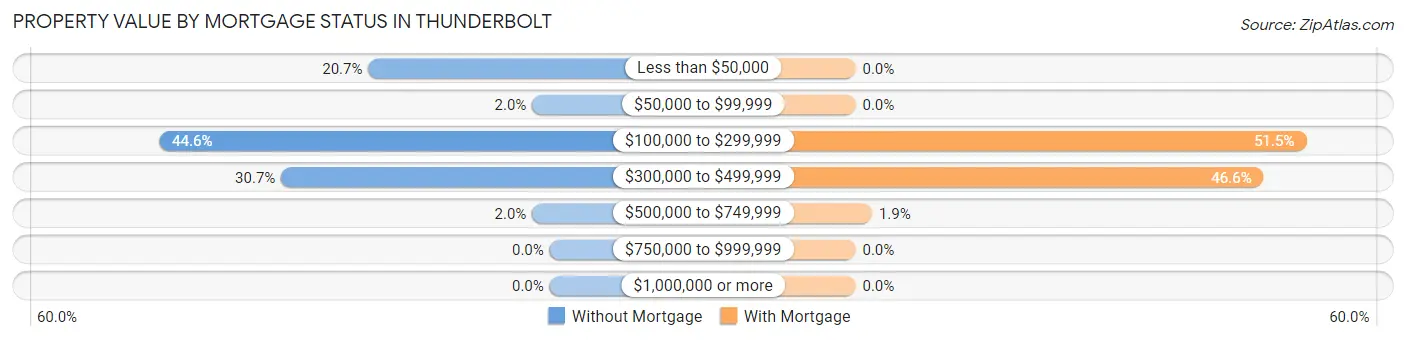
| Property Value | Without Mortgage | With Mortgage |
| Less than $50,000 | 52 (20.7%) | 0 (0.0%) |
| $50,000 to $99,999 | 5 (2.0%) | 0 (0.0%) |
| $100,000 to $299,999 | 112 (44.6%) | 274 (51.5%) |
| $300,000 to $499,999 | 77 (30.7%) | 248 (46.6%) |
| $500,000 to $749,999 | 5 (2.0%) | 10 (1.9%) |
| $750,000 to $999,999 | 0 (0.0%) | 0 (0.0%) |
| $1,000,000 or more | 0 (0.0%) | 0 (0.0%) |
| Total | 251 (100.0%) | 532 (100.0%) |
Household Income by Mortgage Status in Thunderbolt
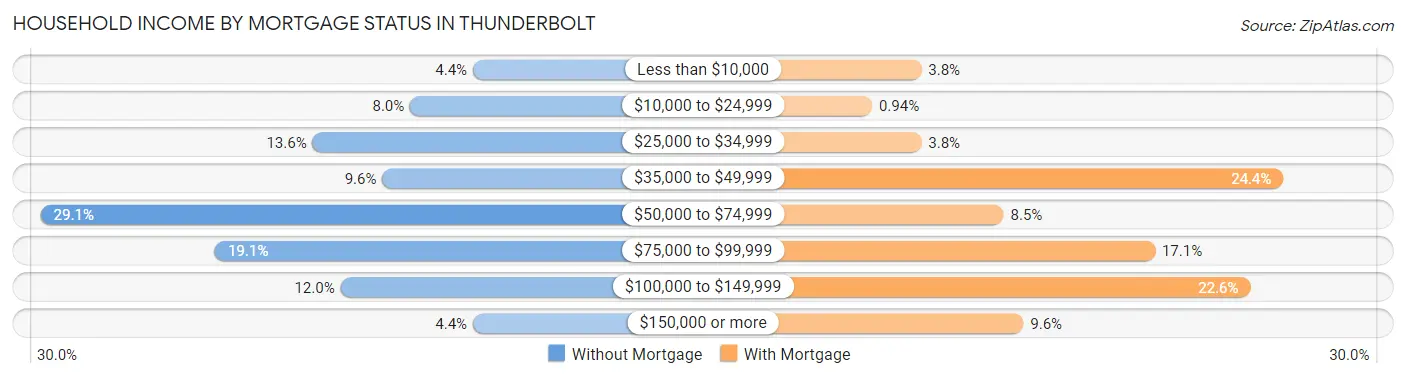
| Household Income | Without Mortgage | With Mortgage |
| Less than $10,000 | 11 (4.4%) | 20 (3.8%) |
| $10,000 to $24,999 | 20 (8.0%) | 5 (0.9%) |
| $25,000 to $34,999 | 34 (13.6%) | 20 (3.8%) |
| $35,000 to $49,999 | 24 (9.6%) | 130 (24.4%) |
| $50,000 to $74,999 | 73 (29.1%) | 45 (8.5%) |
| $75,000 to $99,999 | 48 (19.1%) | 91 (17.1%) |
| $100,000 to $149,999 | 30 (11.9%) | 120 (22.6%) |
| $150,000 or more | 11 (4.4%) | 51 (9.6%) |
| Total | 251 (100.0%) | 532 (100.0%) |
Property Value to Household Income Ratio in Thunderbolt
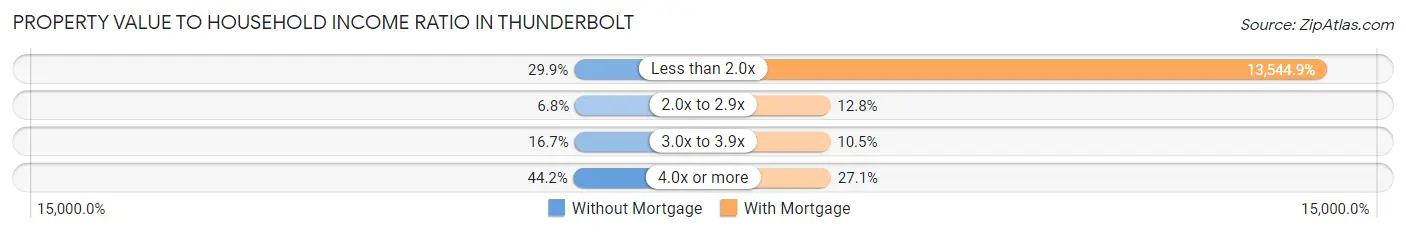
| Value-to-Income Ratio | Without Mortgage | With Mortgage |
| Less than 2.0x | 75 (29.9%) | 72,059 (13,544.9%) |
| 2.0x to 2.9x | 17 (6.8%) | 68 (12.8%) |
| 3.0x to 3.9x | 42 (16.7%) | 56 (10.5%) |
| 4.0x or more | 111 (44.2%) | 144 (27.1%) |
| Total | 251 (100.0%) | 532 (100.0%) |
Real Estate Taxes by Mortgage Status in Thunderbolt
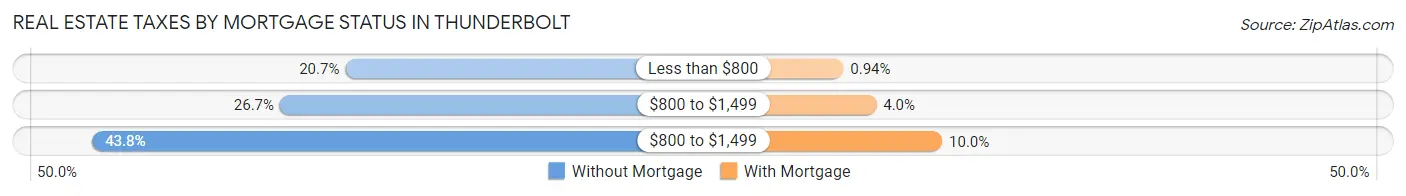
| Property Taxes | Without Mortgage | With Mortgage |
| Less than $800 | 52 (20.7%) | 5 (0.9%) |
| $800 to $1,499 | 67 (26.7%) | 21 (4.0%) |
| $800 to $1,499 | 110 (43.8%) | 53 (10.0%) |
| Total | 251 (100.0%) | 532 (100.0%) |
Health & Disability in Thunderbolt
Health Insurance Coverage by Age in Thunderbolt
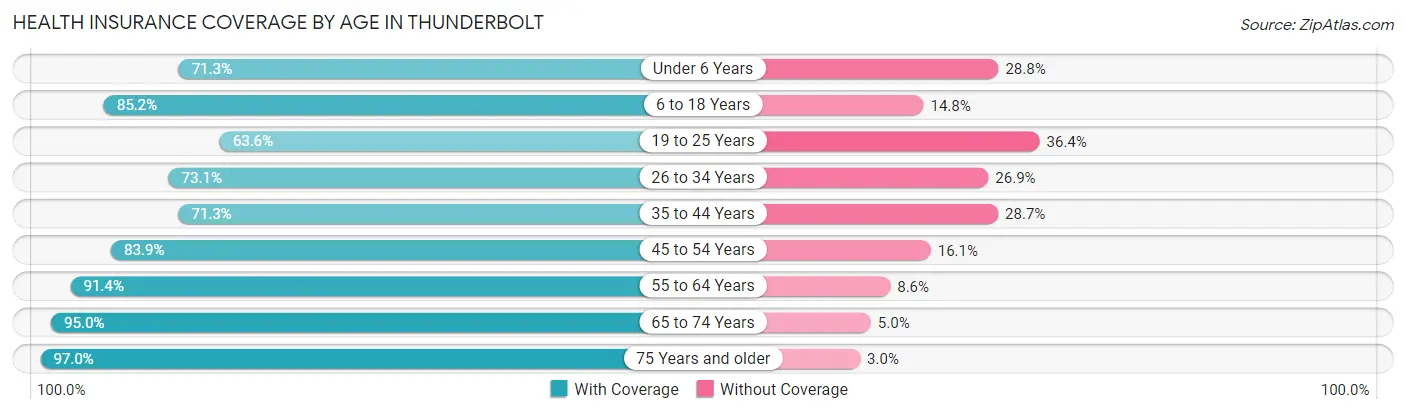
| Age Bracket | With Coverage | Without Coverage |
| Under 6 Years | 57 (71.3%) | 23 (28.7%) |
| 6 to 18 Years | 317 (85.2%) | 55 (14.8%) |
| 19 to 25 Years | 96 (63.6%) | 55 (36.4%) |
| 26 to 34 Years | 245 (73.1%) | 90 (26.9%) |
| 35 to 44 Years | 179 (71.3%) | 72 (28.7%) |
| 45 to 54 Years | 182 (83.9%) | 35 (16.1%) |
| 55 to 64 Years | 426 (91.4%) | 40 (8.6%) |
| 65 to 74 Years | 326 (95.0%) | 17 (5.0%) |
| 75 Years and older | 197 (97.0%) | 6 (3.0%) |
| Total | 2,025 (83.8%) | 393 (16.3%) |
Health Insurance Coverage by Citizenship Status in Thunderbolt
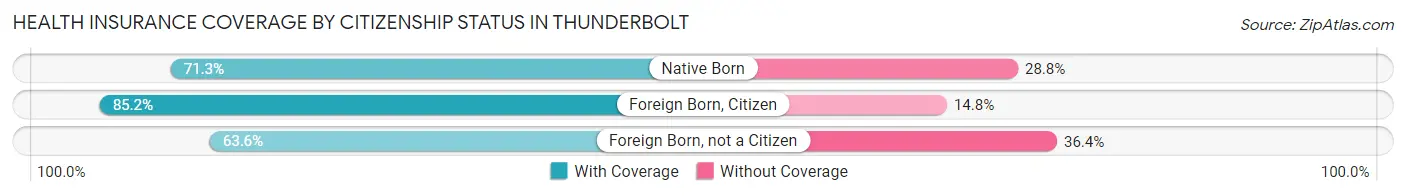
| Citizenship Status | With Coverage | Without Coverage |
| Native Born | 57 (71.3%) | 23 (28.7%) |
| Foreign Born, Citizen | 317 (85.2%) | 55 (14.8%) |
| Foreign Born, not a Citizen | 96 (63.6%) | 55 (36.4%) |
Health Insurance Coverage by Household Income in Thunderbolt
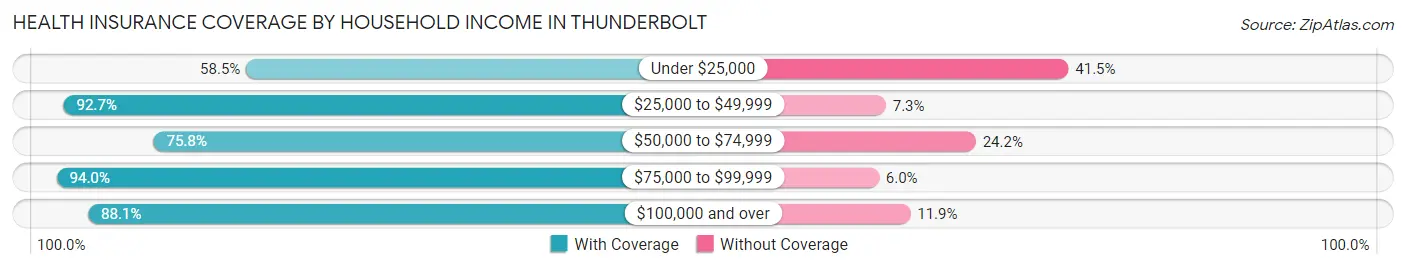
| Household Income | With Coverage | Without Coverage |
| Under $25,000 | 155 (58.5%) | 110 (41.5%) |
| $25,000 to $49,999 | 507 (92.7%) | 40 (7.3%) |
| $50,000 to $74,999 | 427 (75.8%) | 136 (24.2%) |
| $75,000 to $99,999 | 282 (94.0%) | 18 (6.0%) |
| $100,000 and over | 644 (88.1%) | 87 (11.9%) |
Public vs Private Health Insurance Coverage by Age in Thunderbolt
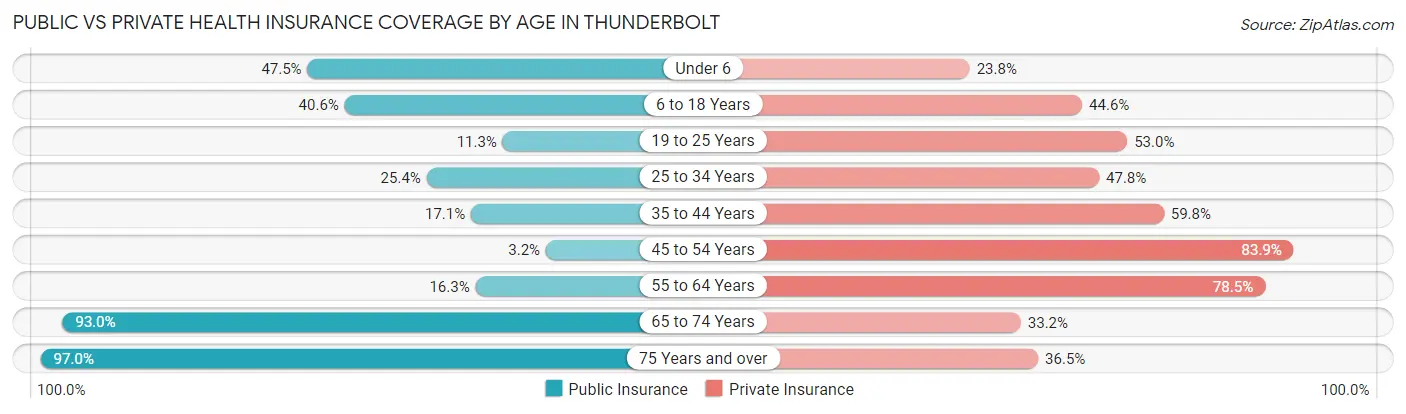
| Age Bracket | Public Insurance | Private Insurance |
| Under 6 | 38 (47.5%) | 19 (23.7%) |
| 6 to 18 Years | 151 (40.6%) | 166 (44.6%) |
| 19 to 25 Years | 17 (11.3%) | 80 (53.0%) |
| 25 to 34 Years | 85 (25.4%) | 160 (47.8%) |
| 35 to 44 Years | 43 (17.1%) | 150 (59.8%) |
| 45 to 54 Years | 7 (3.2%) | 182 (83.9%) |
| 55 to 64 Years | 76 (16.3%) | 366 (78.5%) |
| 65 to 74 Years | 319 (93.0%) | 114 (33.2%) |
| 75 Years and over | 197 (97.0%) | 74 (36.4%) |
| Total | 933 (38.6%) | 1,311 (54.2%) |
Disability Status by Sex by Age in Thunderbolt
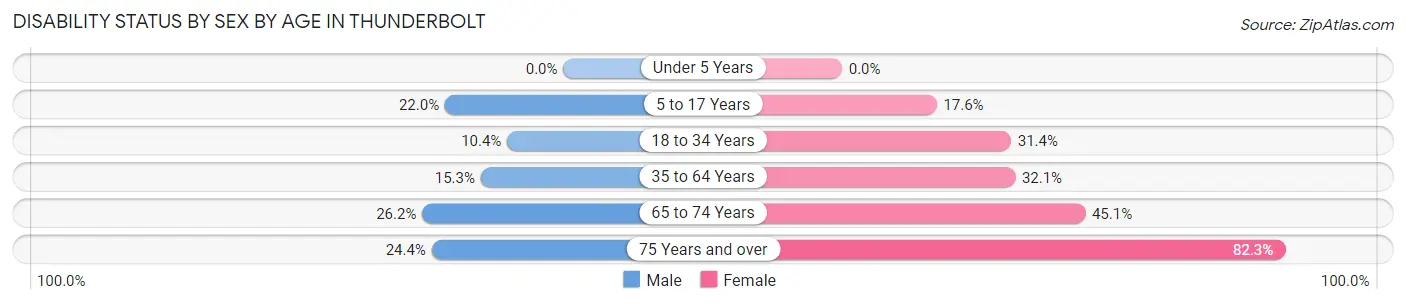
| Age Bracket | Male | Female |
| Under 5 Years | 0 (0.0%) | 0 (0.0%) |
| 5 to 17 Years | 38 (22.0%) | 39 (17.6%) |
| 18 to 34 Years | 30 (10.4%) | 64 (31.4%) |
| 35 to 64 Years | 53 (15.3%) | 189 (32.1%) |
| 65 to 74 Years | 44 (26.2%) | 79 (45.1%) |
| 75 Years and over | 11 (24.4%) | 130 (82.3%) |
Disability Class by Sex by Age in Thunderbolt
Disability Class: Hearing Difficulty
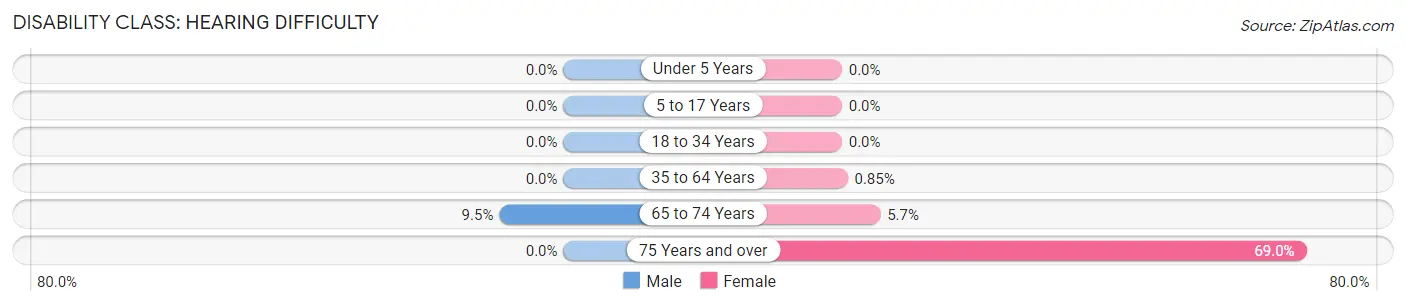
| Age Bracket | Male | Female |
| Under 5 Years | 0 (0.0%) | 0 (0.0%) |
| 5 to 17 Years | 0 (0.0%) | 0 (0.0%) |
| 18 to 34 Years | 0 (0.0%) | 0 (0.0%) |
| 35 to 64 Years | 0 (0.0%) | 5 (0.9%) |
| 65 to 74 Years | 16 (9.5%) | 10 (5.7%) |
| 75 Years and over | 0 (0.0%) | 109 (69.0%) |
Disability Class: Vision Difficulty
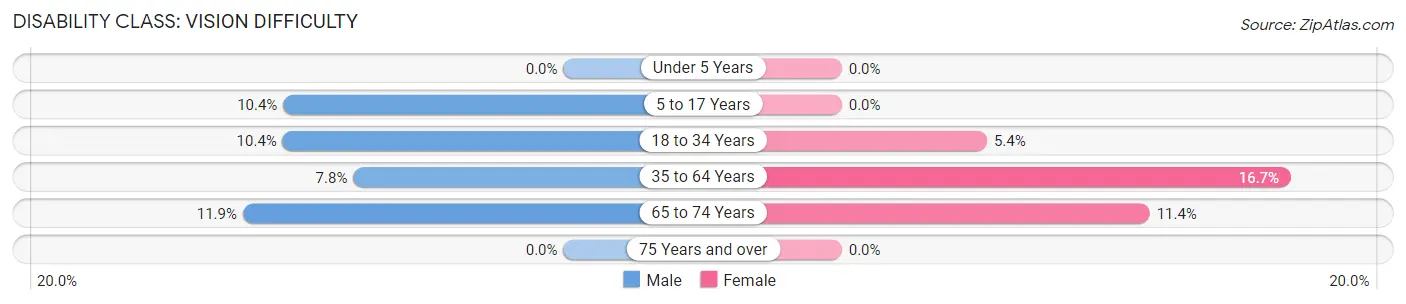
| Age Bracket | Male | Female |
| Under 5 Years | 0 (0.0%) | 0 (0.0%) |
| 5 to 17 Years | 18 (10.4%) | 0 (0.0%) |
| 18 to 34 Years | 30 (10.4%) | 11 (5.4%) |
| 35 to 64 Years | 27 (7.8%) | 98 (16.7%) |
| 65 to 74 Years | 20 (11.9%) | 20 (11.4%) |
| 75 Years and over | 0 (0.0%) | 0 (0.0%) |
Disability Class: Cognitive Difficulty
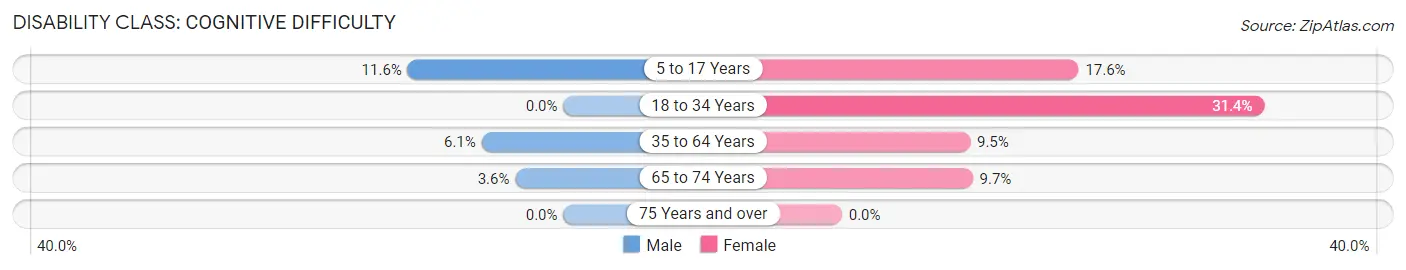
| Age Bracket | Male | Female |
| 5 to 17 Years | 20 (11.6%) | 39 (17.6%) |
| 18 to 34 Years | 0 (0.0%) | 64 (31.4%) |
| 35 to 64 Years | 21 (6.1%) | 56 (9.5%) |
| 65 to 74 Years | 6 (3.6%) | 17 (9.7%) |
| 75 Years and over | 0 (0.0%) | 0 (0.0%) |
Disability Class: Ambulatory Difficulty
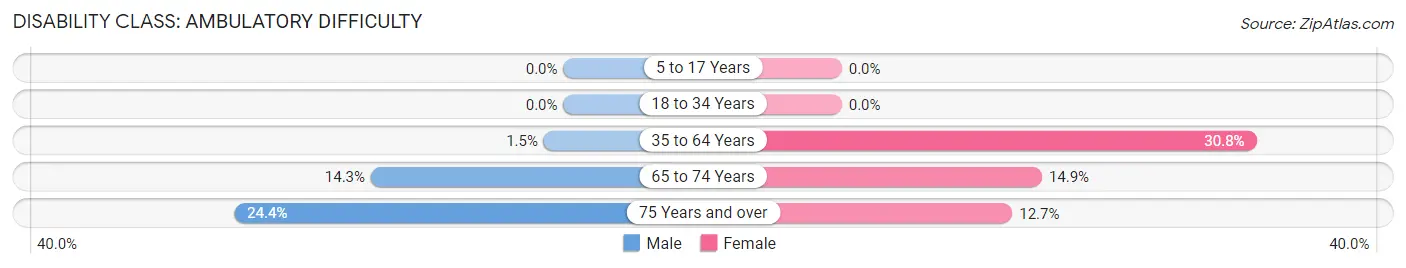
| Age Bracket | Male | Female |
| 5 to 17 Years | 0 (0.0%) | 0 (0.0%) |
| 18 to 34 Years | 0 (0.0%) | 0 (0.0%) |
| 35 to 64 Years | 5 (1.5%) | 181 (30.8%) |
| 65 to 74 Years | 24 (14.3%) | 26 (14.9%) |
| 75 Years and over | 11 (24.4%) | 20 (12.7%) |
Disability Class: Self-Care Difficulty
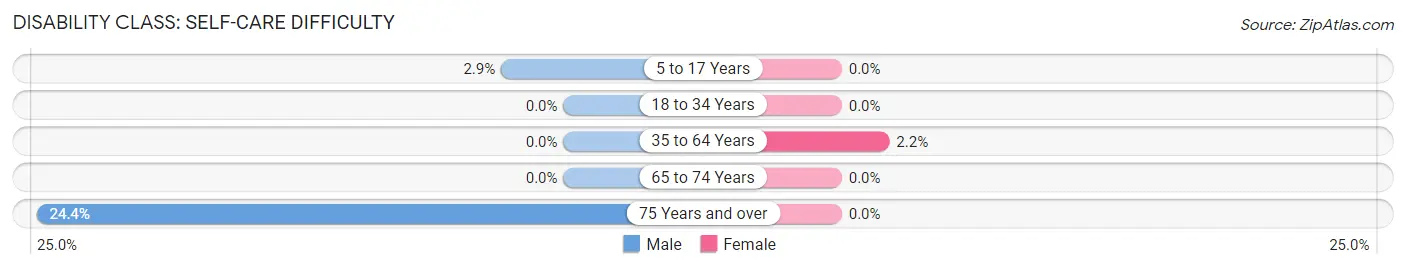
| Age Bracket | Male | Female |
| 5 to 17 Years | 5 (2.9%) | 0 (0.0%) |
| 18 to 34 Years | 0 (0.0%) | 0 (0.0%) |
| 35 to 64 Years | 0 (0.0%) | 13 (2.2%) |
| 65 to 74 Years | 0 (0.0%) | 0 (0.0%) |
| 75 Years and over | 11 (24.4%) | 0 (0.0%) |
Technology Access in Thunderbolt
Computing Device Access in Thunderbolt
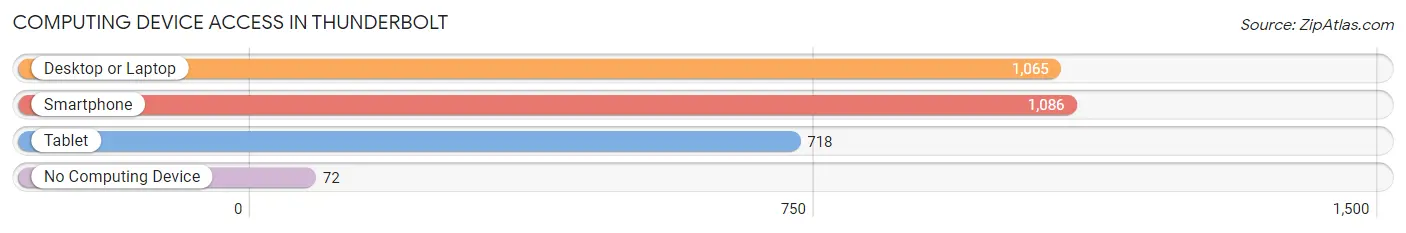
| Device Type | # Households | % Households |
| Desktop or Laptop | 1,065 | 86.9% |
| Smartphone | 1,086 | 88.6% |
| Tablet | 718 | 58.6% |
| No Computing Device | 72 | 5.9% |
| Total | 1,226 | 100.0% |
Internet Access in Thunderbolt
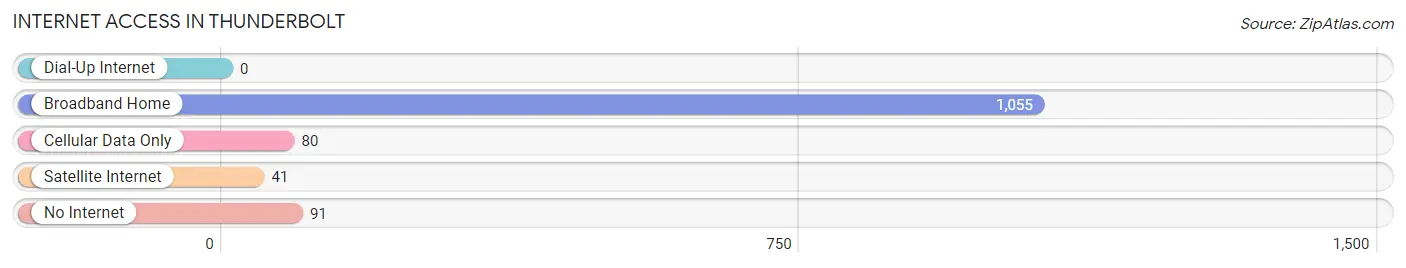
| Internet Type | # Households | % Households |
| Dial-Up Internet | 0 | 0.0% |
| Broadband Home | 1,055 | 86.1% |
| Cellular Data Only | 80 | 6.5% |
| Satellite Internet | 41 | 3.3% |
| No Internet | 91 | 7.4% |
| Total | 1,226 | 100.0% |
Thunderbolt Summary
Thunderbolt, Georgia is a small city located in Chatham County, Georgia, United States. It is situated on the banks of the Wilmington River, just south of Savannah. The city has a population of 2,611 as of the 2010 census.
History
The area that is now Thunderbolt was originally inhabited by the Yamacraw Indians. The Yamacraws were a branch of the Creek Indians, and were led by Chief Tomochichi. In 1733, General James Oglethorpe and his party of settlers arrived in the area and established the city of Savannah. The Yamacraws were friendly to the settlers and allowed them to settle in the area.
In 1736, the Yamacraws granted the settlers a tract of land that included the area that is now Thunderbolt. The settlers named the area Thunderbolt, after the thunderstorms that frequently occurred in the area.
In 1864, during the Civil War, the Union Army occupied Thunderbolt. The Union Army built a fort on the banks of the Wilmington River, which was used to protect the city of Savannah from Confederate attacks.
Geography
Thunderbolt is located in Chatham County, Georgia, United States. It is situated on the banks of the Wilmington River, just south of Savannah. The city has a total area of 1.3 square miles, all of which is land.
The city is located in a humid subtropical climate zone, with hot, humid summers and mild winters. The average temperature in the summer is around 80°F, and the average temperature in the winter is around 50°F.
Economy
The economy of Thunderbolt is largely based on tourism and services. The city is home to several restaurants, bars, and shops, as well as a marina and boat launch. The city also has a number of art galleries and museums, which attract visitors from all over the world.
The city is also home to several manufacturing companies, including a paper mill, a printing company, and a plastics factory. The city also has a number of small businesses, including a grocery store, a hardware store, and a pharmacy.
Demographics
As of the 2010 census, the population of Thunderbolt was 2,611. The racial makeup of the city was 79.3% White, 15.2% African American, 0.3% Native American, 0.7% Asian, 0.1% Pacific Islander, and 4.4% from other races. Hispanic or Latino of any race were 4.4% of the population.
The median household income in Thunderbolt was $41,944, and the median family income was $50,917. The per capita income for the city was $22,845. About 11.2% of families and 14.2% of the population were below the poverty line, including 19.2% of those under age 18 and 8.2% of those age 65 or over.
Common Questions
What is the Total Population of Thunderbolt?
Total Population of Thunderbolt is 2,552.
What is the Total Male Population of Thunderbolt?
Total Male Population of Thunderbolt is 1,068.
What is the Total Female Population of Thunderbolt?
Total Female Population of Thunderbolt is 1,484.
What is the Ratio of Males per 100 Females in Thunderbolt?
There are 71.97 Males per 100 Females in Thunderbolt.
What is the Ratio of Females per 100 Males in Thunderbolt?
There are 138.95 Females per 100 Males in Thunderbolt.
What is the Median Population Age in Thunderbolt?
Median Population Age in Thunderbolt is 50.1 Years.
What is the Average Family Size in Thunderbolt
Average Family Size in Thunderbolt is 2.9 People.
What is the Average Household Size in Thunderbolt
Average Household Size in Thunderbolt is 2.0 People.
What is Per Capita Income in Thunderbolt?
Per Capita income in Thunderbolt is $38,190.
What is the Median Family Income in Thunderbolt?
Median Family Income in Thunderbolt is $72,130.
What is the Median Household income in Thunderbolt?
Median Household Income in Thunderbolt is $63,148.
What is Income or Wage Gap in Thunderbolt?
Income or Wage Gap in Thunderbolt is 0.6%.
Women in Thunderbolt earn 99.4 cents for every dollar earned by a man.
What is Family Income Deficit in Thunderbolt?
Family Income Deficit in Thunderbolt is $4,914.
Families that are below poverty line in Thunderbolt earn $4,914 less on average than the poverty threshold level.
What is Inequality or Gini Index in Thunderbolt?
Inequality or Gini Index in Thunderbolt is 0.40.
How Large is the Labor Force in Thunderbolt?
There are 1,353 People in the Labor Forcein in Thunderbolt.
What is the Percentage of People in the Labor Force in Thunderbolt?
63.6% of People are in the Labor Force in Thunderbolt.
What is the Unemployment Rate in Thunderbolt?
Unemployment Rate in Thunderbolt is 3.6%.