Sunny Side, GA
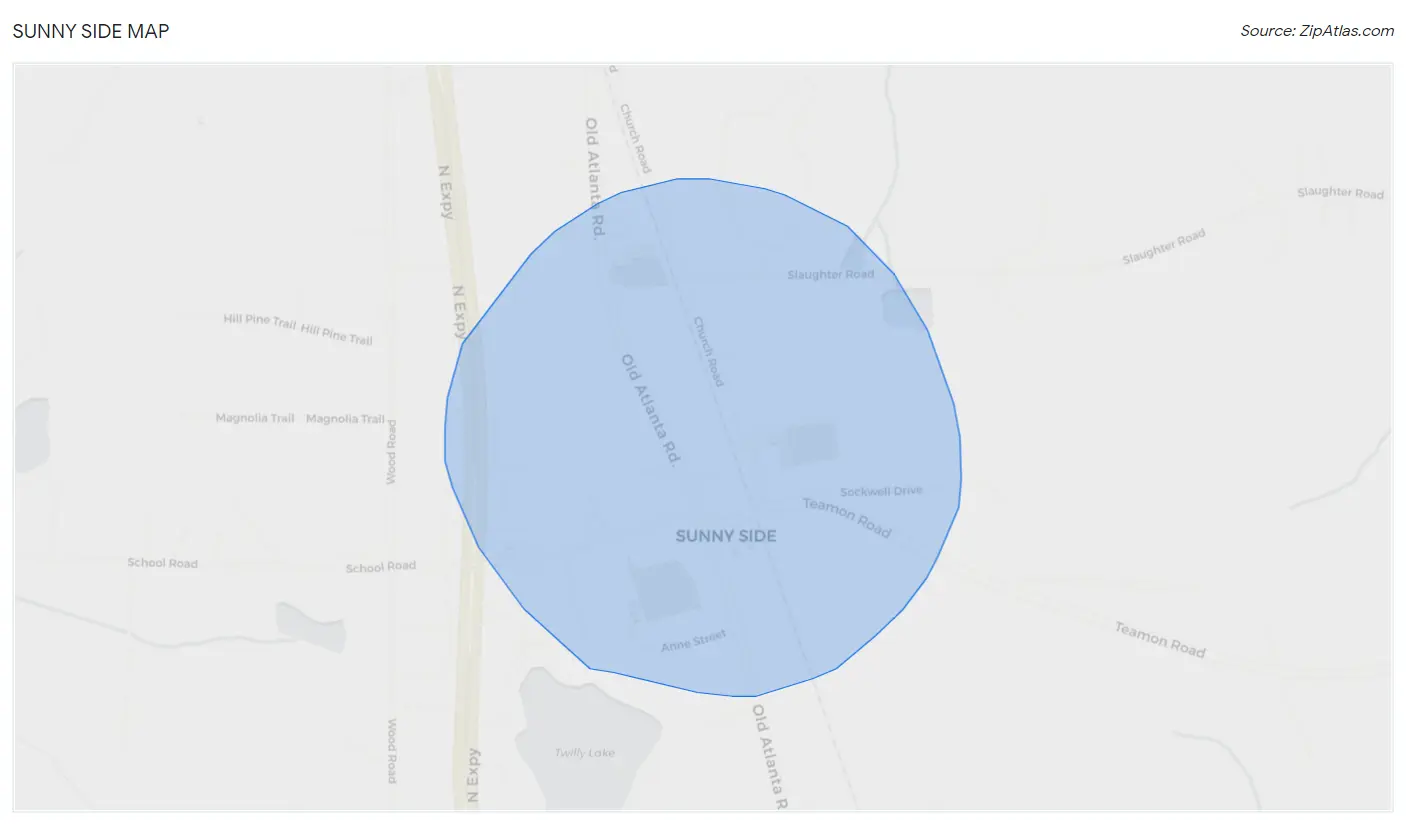
Sunny Side Map
Sunny Side Overview
174
TOTAL POPULATION
83
MALE POPULATION
91
FEMALE POPULATION
91.21
MALES / 100 FEMALES
109.64
FEMALES / 100 MALES
29.5
MEDIAN AGE
3.0
AVG FAMILY SIZE
2.5
AVG HOUSEHOLD SIZE
$23,151
PER CAPITA INCOME
$30,833
AVG HOUSEHOLD INCOME
0.51
INEQUALITY / GINI INDEX
65
LABOR FORCE [ PEOPLE ]
59.6%
PERCENT IN LABOR FORCE
1.5%
UNEMPLOYMENT RATE
Sunny Side Zip Codes
Sunny Side Area Codes
Race in Sunny Side
The most populous races in Sunny Side are White / Caucasian (121 | 69.5%), Black / African American (48 | 27.6%), and Some other Race (5 | 2.9%).
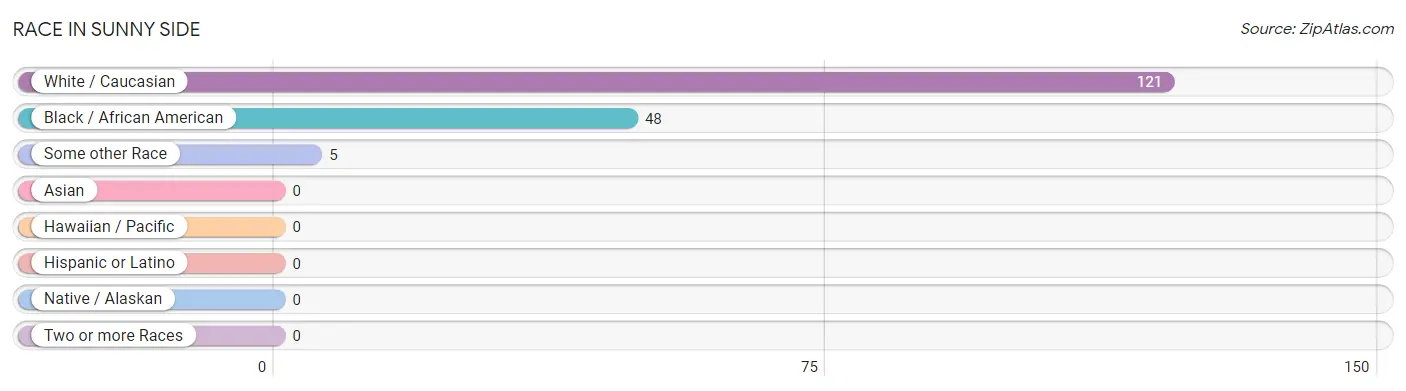
| Race | # Population | % Population |
| Asian | 0 | 0.0% |
| Black / African American | 48 | 27.6% |
| Hawaiian / Pacific | 0 | 0.0% |
| Hispanic or Latino | 0 | 0.0% |
| Native / Alaskan | 0 | 0.0% |
| White / Caucasian | 121 | 69.5% |
| Two or more Races | 0 | 0.0% |
| Some other Race | 5 | 2.9% |
| Total | 174 | 100.0% |
Ancestry in Sunny Side
The most populous ancestries reported in Sunny Side are American (114 | 65.5%), English (24 | 13.8%), Irish (9 | 5.2%), German (4 | 2.3%), and Polish (1 | 0.6%), together accounting for 87.4% of all Sunny Side residents.
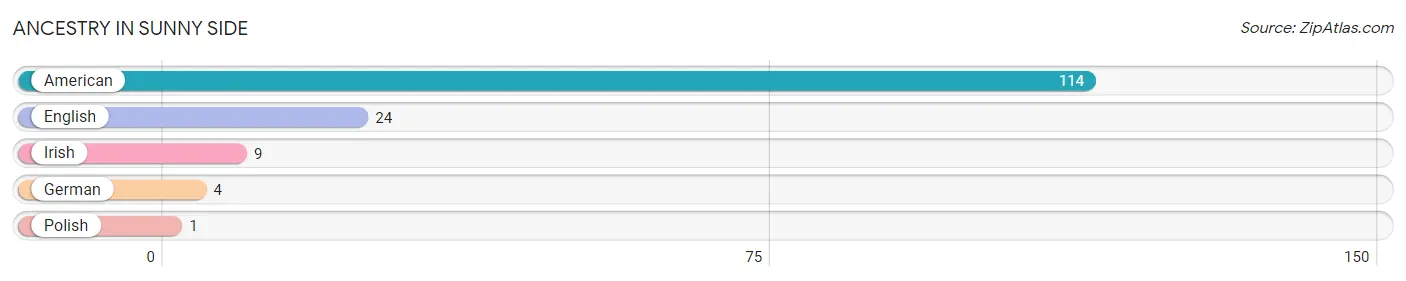
| Ancestry | # Population | % Population |
| American | 114 | 65.5% |
| English | 24 | 13.8% |
| German | 4 | 2.3% |
| Irish | 9 | 5.2% |
| Polish | 1 | 0.6% | View All 5 Rows |
Immigrants in Sunny Side

| Immigration Origin | # Population | % Population | View All 0 Rows |
Sex and Age in Sunny Side
Sex and Age in Sunny Side
The most populous age groups in Sunny Side are Under 5 Years (22 | 26.5%) for men and 10 to 14 Years (26 | 28.6%) for women.
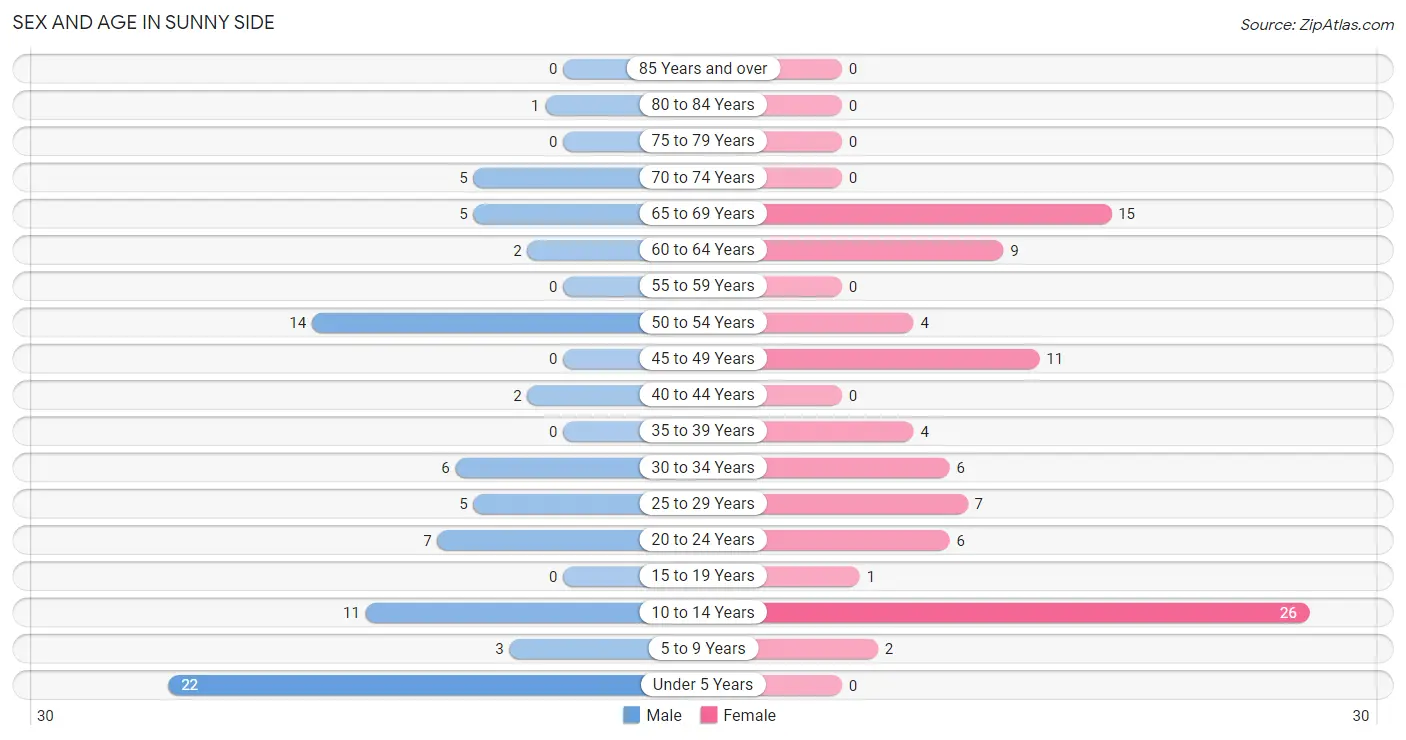
| Age Bracket | Male | Female |
| Under 5 Years | 22 (26.5%) | 0 (0.0%) |
| 5 to 9 Years | 3 (3.6%) | 2 (2.2%) |
| 10 to 14 Years | 11 (13.3%) | 26 (28.6%) |
| 15 to 19 Years | 0 (0.0%) | 1 (1.1%) |
| 20 to 24 Years | 7 (8.4%) | 6 (6.6%) |
| 25 to 29 Years | 5 (6.0%) | 7 (7.7%) |
| 30 to 34 Years | 6 (7.2%) | 6 (6.6%) |
| 35 to 39 Years | 0 (0.0%) | 4 (4.4%) |
| 40 to 44 Years | 2 (2.4%) | 0 (0.0%) |
| 45 to 49 Years | 0 (0.0%) | 11 (12.1%) |
| 50 to 54 Years | 14 (16.9%) | 4 (4.4%) |
| 55 to 59 Years | 0 (0.0%) | 0 (0.0%) |
| 60 to 64 Years | 2 (2.4%) | 9 (9.9%) |
| 65 to 69 Years | 5 (6.0%) | 15 (16.5%) |
| 70 to 74 Years | 5 (6.0%) | 0 (0.0%) |
| 75 to 79 Years | 0 (0.0%) | 0 (0.0%) |
| 80 to 84 Years | 1 (1.2%) | 0 (0.0%) |
| 85 Years and over | 0 (0.0%) | 0 (0.0%) |
| Total | 83 (100.0%) | 91 (100.0%) |
Families and Households in Sunny Side
Median Family Size in Sunny Side
The median family size in Sunny Side is 3.04 persons per family, with married-couple families (26 | 51.0%) accounting for the largest median family size of 3.5 persons per family. On the other hand, single male/father families (6 | 11.8%) represent the smallest median family size with 1.67 persons per family.
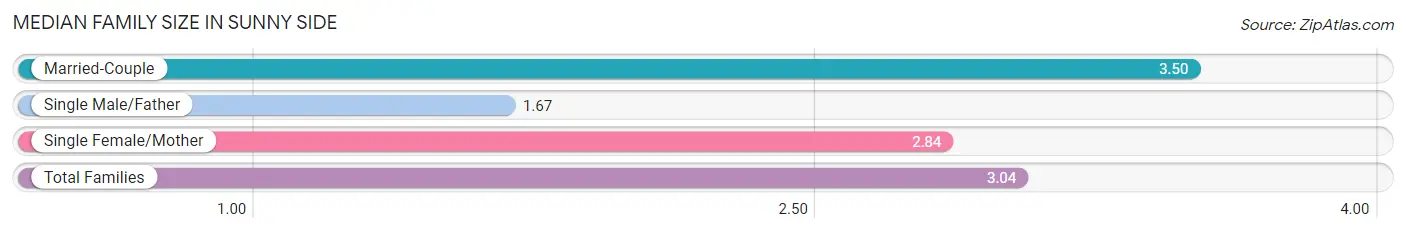
| Family Type | # Families | Family Size |
| Married-Couple | 26 (51.0%) | 3.50 |
| Single Male/Father | 6 (11.8%) | 1.67 |
| Single Female/Mother | 19 (37.2%) | 2.84 |
| Total Families | 51 (100.0%) | 3.04 |
Median Household Size in Sunny Side
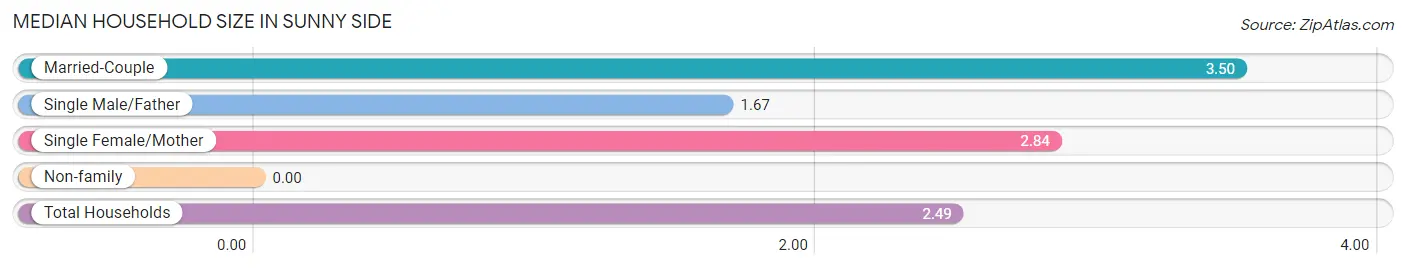
| Household Type | # Households | Household Size |
| Married-Couple | 26 (37.1%) | 3.50 |
| Single Male/Father | 6 (8.6%) | 1.67 |
| Single Female/Mother | 19 (27.1%) | 2.84 |
| Non-family | 19 (27.1%) | - |
| Total Households | 70 (100.0%) | 2.49 |
Household Size by Marriage Status in Sunny Side
Out of a total of 70 households in Sunny Side, 51 (72.9%) are family households, while 19 (27.1%) are nonfamily households. The most numerous type of family households are 4-person households, comprising 21, and the most common type of nonfamily households are 1-person households, comprising 19.
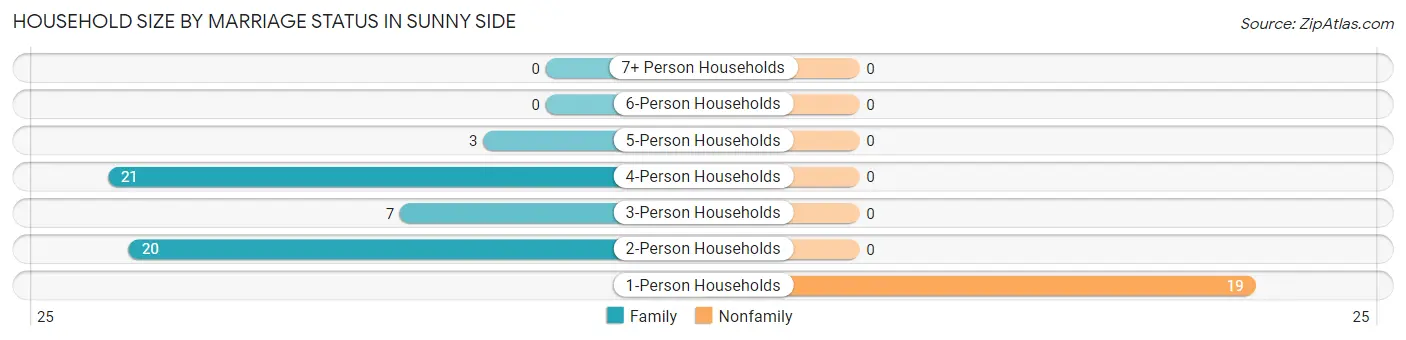
| Household Size | Family Households | Nonfamily Households |
| 1-Person Households | - | 19 (27.1%) |
| 2-Person Households | 20 (28.6%) | 0 (0.0%) |
| 3-Person Households | 7 (10.0%) | 0 (0.0%) |
| 4-Person Households | 21 (30.0%) | 0 (0.0%) |
| 5-Person Households | 3 (4.3%) | 0 (0.0%) |
| 6-Person Households | 0 (0.0%) | 0 (0.0%) |
| 7+ Person Households | 0 (0.0%) | 0 (0.0%) |
| Total | 51 (72.9%) | 19 (27.1%) |
Female Fertility in Sunny Side
Fertility by Age in Sunny Side
| Age Bracket | Women with Births | Births / 1,000 Women |
| 15 to 19 years | 0 (0.0%) | 0.0 |
| 20 to 34 years | 0 (0.0%) | 0.0 |
| 35 to 50 years | 0 (0.0%) | 0.0 |
| Total | 0 (0.0%) | 0.0 |
Fertility by Age by Marriage Status in Sunny Side
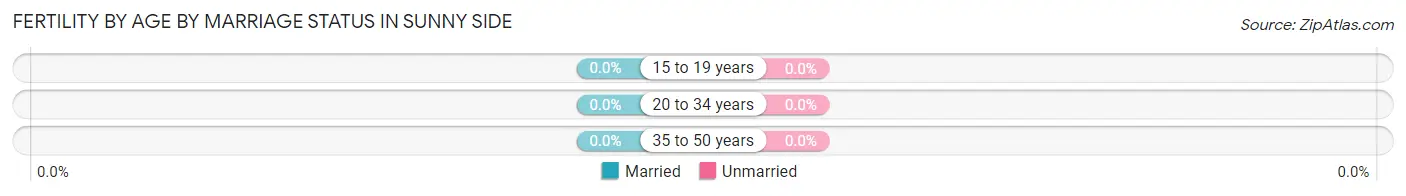
| Age Bracket | Married | Unmarried |
| 15 to 19 years | 0 (0.0%) | 0 (0.0%) |
| 20 to 34 years | 0 (0.0%) | 0 (0.0%) |
| 35 to 50 years | 0 (0.0%) | 0 (0.0%) |
| Total | 0 (0.0%) | 0 (0.0%) |
Fertility by Education in Sunny Side
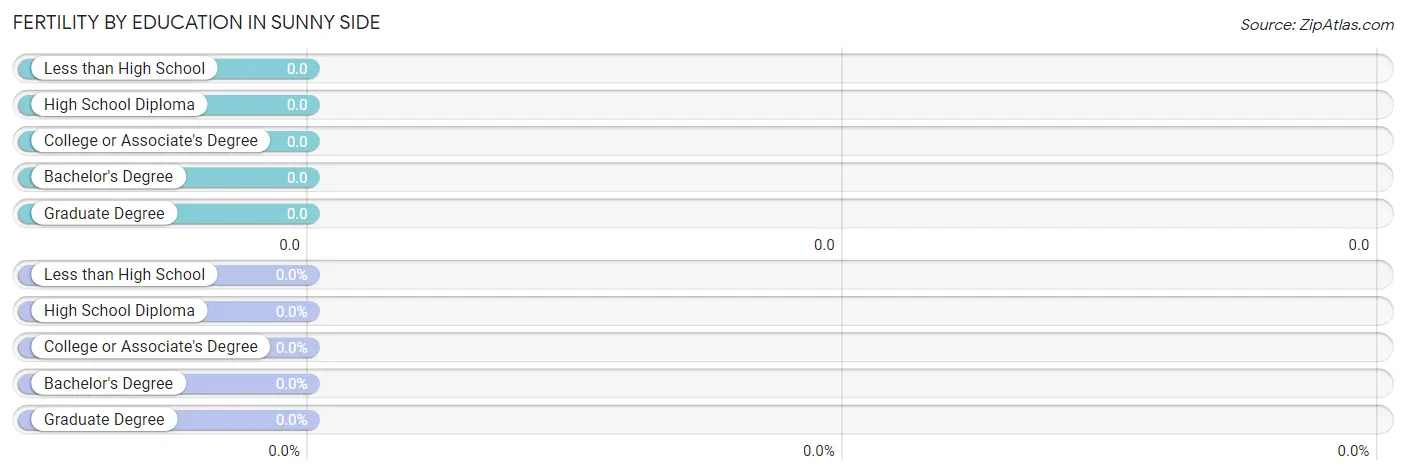
| Educational Attainment | Women with Births | Births / 1,000 Women |
| Less than High School | 0 (0.0%) | 0.0 |
| High School Diploma | 0 (0.0%) | 0.0 |
| College or Associate's Degree | 0 (0.0%) | 0.0 |
| Bachelor's Degree | 0 (0.0%) | 0.0 |
| Graduate Degree | 0 (0.0%) | 0.0 |
| Total | 0 (0.0%) | 0.0 |
Fertility by Education by Marriage Status in Sunny Side
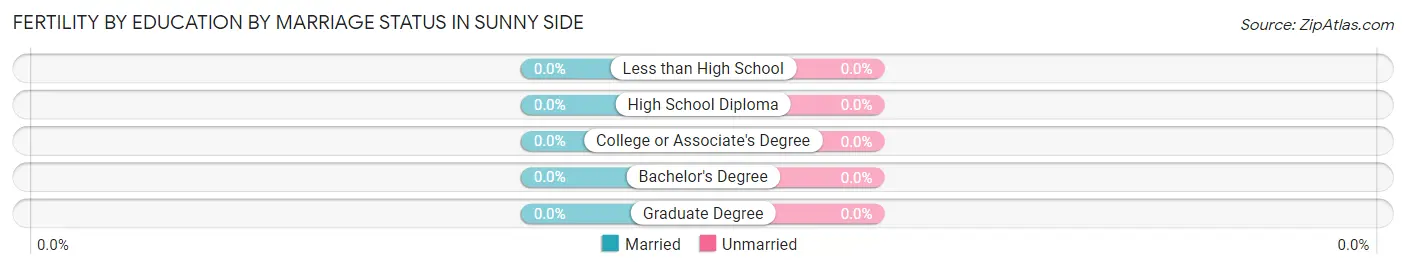
| Educational Attainment | Married | Unmarried |
| Less than High School | 0 (0.0%) | 0 (0.0%) |
| High School Diploma | 0 (0.0%) | 0 (0.0%) |
| College or Associate's Degree | 0 (0.0%) | 0 (0.0%) |
| Bachelor's Degree | 0 (0.0%) | 0 (0.0%) |
| Graduate Degree | 0 (0.0%) | 0 (0.0%) |
| Total | 0 (0.0%) | 0 (0.0%) |
Income in Sunny Side
Income Overview in Sunny Side
| Characteristic | Number | Measure |
| Per Capita Income | 174 | $23,151 |
| Median Family Income | 51 | $0 |
| Mean Family Income | 51 | $80,512 |
| Median Household Income | 70 | $30,833 |
| Mean Household Income | 70 | $66,279 |
| Income Deficit | 51 | $0 |
| Wage / Income Gap (%) | 174 | 0.00% |
| Wage / Income Gap ($) | 174 | 100.00¢ per $1 |
| Gini / Inequality Index | 174 | 0.51 |
Earnings by Sex in Sunny Side
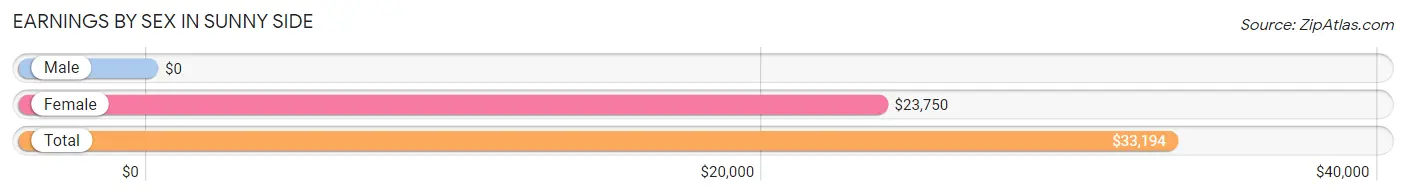
| Sex | Number | Average Earnings |
| Male | 35 (49.3%) | $0 |
| Female | 36 (50.7%) | $23,750 |
| Total | 71 (100.0%) | $33,194 |
Earnings by Sex by Income Bracket in Sunny Side
The most common earnings brackets in Sunny Side are $75,000 to $99,999 for men (16 | 45.7%) and $30,000 to $34,999 for women (9 | 25.0%).
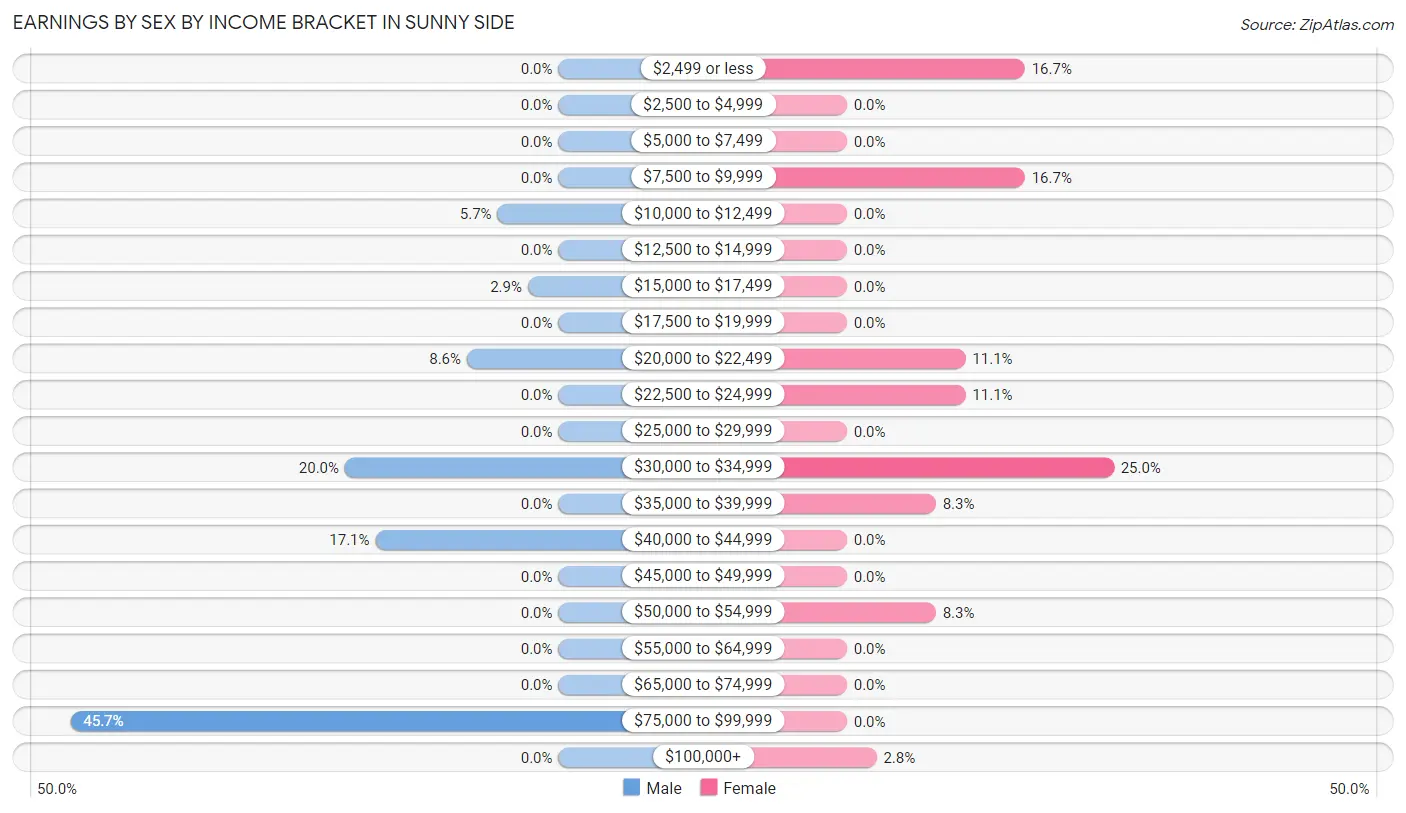
| Income | Male | Female |
| $2,499 or less | 0 (0.0%) | 6 (16.7%) |
| $2,500 to $4,999 | 0 (0.0%) | 0 (0.0%) |
| $5,000 to $7,499 | 0 (0.0%) | 0 (0.0%) |
| $7,500 to $9,999 | 0 (0.0%) | 6 (16.7%) |
| $10,000 to $12,499 | 2 (5.7%) | 0 (0.0%) |
| $12,500 to $14,999 | 0 (0.0%) | 0 (0.0%) |
| $15,000 to $17,499 | 1 (2.9%) | 0 (0.0%) |
| $17,500 to $19,999 | 0 (0.0%) | 0 (0.0%) |
| $20,000 to $22,499 | 3 (8.6%) | 4 (11.1%) |
| $22,500 to $24,999 | 0 (0.0%) | 4 (11.1%) |
| $25,000 to $29,999 | 0 (0.0%) | 0 (0.0%) |
| $30,000 to $34,999 | 7 (20.0%) | 9 (25.0%) |
| $35,000 to $39,999 | 0 (0.0%) | 3 (8.3%) |
| $40,000 to $44,999 | 6 (17.1%) | 0 (0.0%) |
| $45,000 to $49,999 | 0 (0.0%) | 0 (0.0%) |
| $50,000 to $54,999 | 0 (0.0%) | 3 (8.3%) |
| $55,000 to $64,999 | 0 (0.0%) | 0 (0.0%) |
| $65,000 to $74,999 | 0 (0.0%) | 0 (0.0%) |
| $75,000 to $99,999 | 16 (45.7%) | 0 (0.0%) |
| $100,000+ | 0 (0.0%) | 1 (2.8%) |
| Total | 35 (100.0%) | 36 (100.0%) |
Earnings by Sex by Educational Attainment in Sunny Side
| Educational Attainment | Male Income | Female Income |
| Less than High School | - | - |
| High School Diploma | - | - |
| College or Associate's Degree | - | - |
| Bachelor's Degree | - | - |
| Graduate Degree | - | - |
| Total | $77,885 | $23,750 |
Family Income in Sunny Side
Family Income Brackets in Sunny Side
According to the Sunny Side family income data, there are 15 families falling into the $150,000 to $199,999 income range, which is the most common income bracket and makes up 29.4% of all families.
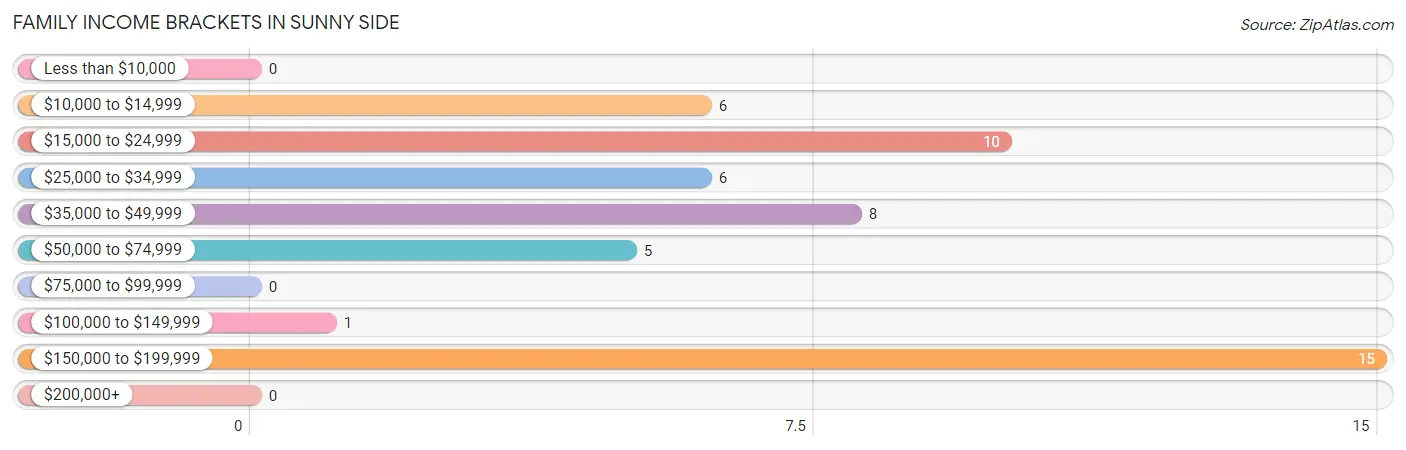
| Income Bracket | # Families | % Families |
| Less than $10,000 | 0 | 0.0% |
| $10,000 to $14,999 | 6 | 11.8% |
| $15,000 to $24,999 | 10 | 19.6% |
| $25,000 to $34,999 | 6 | 11.8% |
| $35,000 to $49,999 | 8 | 15.7% |
| $50,000 to $74,999 | 5 | 9.8% |
| $75,000 to $99,999 | 0 | 0.0% |
| $100,000 to $149,999 | 1 | 2.0% |
| $150,000 to $199,999 | 15 | 29.4% |
| $200,000+ | 0 | 0.0% |
Family Income by Famaliy Size in Sunny Side
2-person families (20 | 39.2%) account for the highest median family income in Sunny Side with $33,750 per family, while 2-person families (20 | 39.2%) have the highest median income of $16,875 per family member.
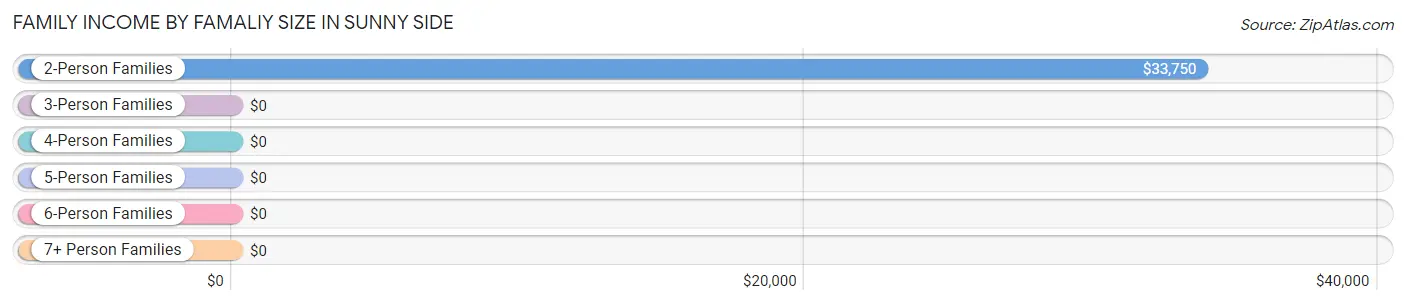
| Income Bracket | # Families | Median Income |
| 2-Person Families | 20 (39.2%) | $33,750 |
| 3-Person Families | 7 (13.7%) | $0 |
| 4-Person Families | 21 (41.2%) | $0 |
| 5-Person Families | 3 (5.9%) | $0 |
| 6-Person Families | 0 (0.0%) | $0 |
| 7+ Person Families | 0 (0.0%) | $0 |
| Total | 51 (100.0%) | $0 |
Family Income by Number of Earners in Sunny Side
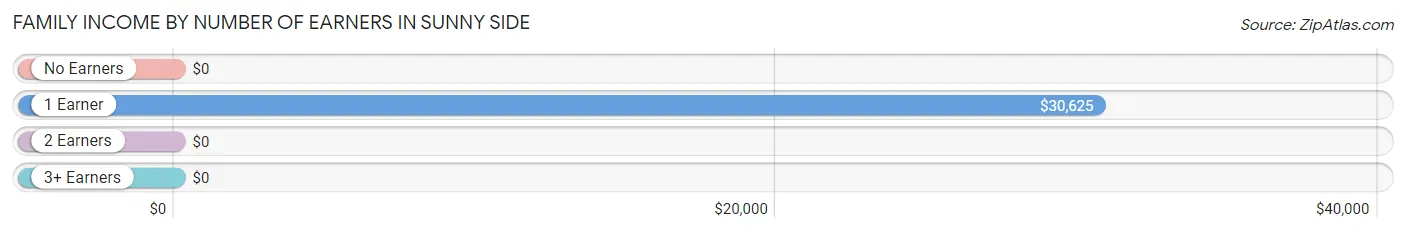
| Number of Earners | # Families | Median Income |
| No Earners | 4 (7.8%) | $0 |
| 1 Earner | 31 (60.8%) | $30,625 |
| 2 Earners | 2 (3.9%) | $0 |
| 3+ Earners | 14 (27.5%) | $0 |
| Total | 51 (100.0%) | $0 |
Household Income in Sunny Side
Household Income Brackets in Sunny Side
With 24 households falling in the category, the $15,000 to $24,999 income range is the most frequent in Sunny Side, accounting for 34.3% of all households.
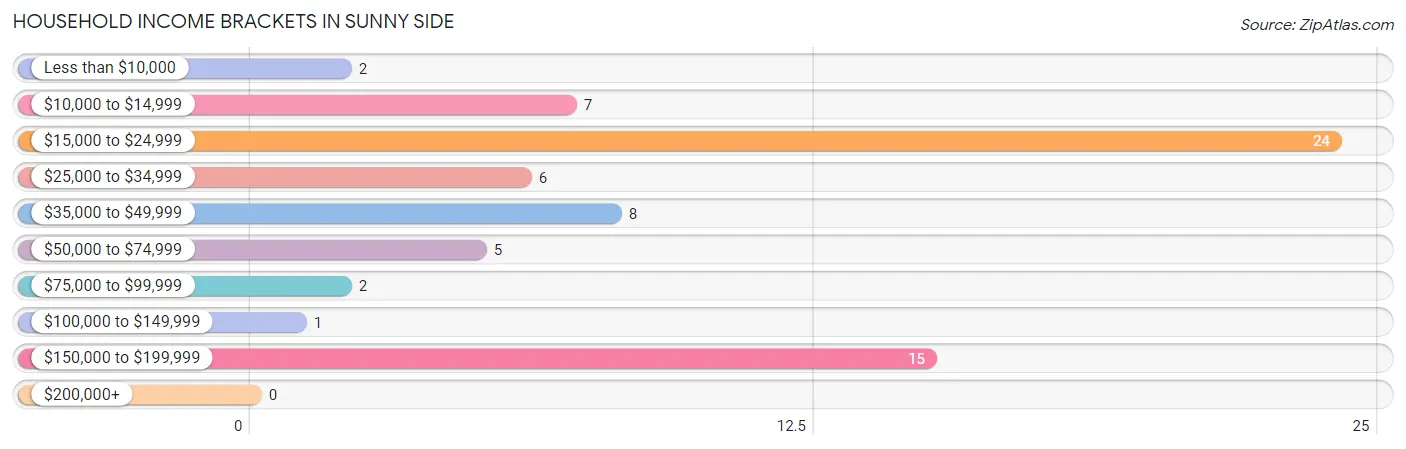
| Income Bracket | # Households | % Households |
| Less than $10,000 | 2 | 2.9% |
| $10,000 to $14,999 | 7 | 10.0% |
| $15,000 to $24,999 | 24 | 34.3% |
| $25,000 to $34,999 | 6 | 8.6% |
| $35,000 to $49,999 | 8 | 11.4% |
| $50,000 to $74,999 | 5 | 7.1% |
| $75,000 to $99,999 | 2 | 2.9% |
| $100,000 to $149,999 | 1 | 1.4% |
| $150,000 to $199,999 | 15 | 21.4% |
| $200,000+ | 0 | 0.0% |
Household Income by Householder Age in Sunny Side
The median household income in Sunny Side is $30,833, with the highest median household income of $192,788 found in the 45 to 64 years age bracket for the primary householder. A total of 23 households (32.9%) fall into this category. Meanwhile, the 15 to 24 years age bracket for the primary householder has the lowest median household income of $0, with 6 households (8.6%) in this group.
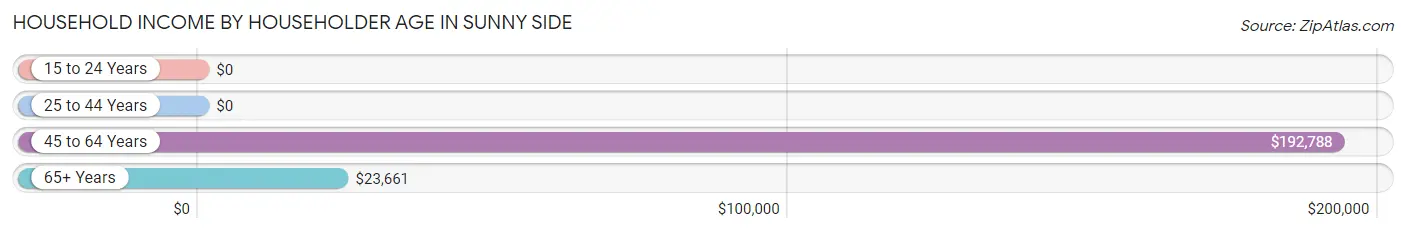
| Income Bracket | # Households | Median Income |
| 15 to 24 Years | 6 (8.6%) | $0 |
| 25 to 44 Years | 22 (31.4%) | $0 |
| 45 to 64 Years | 23 (32.9%) | $192,788 |
| 65+ Years | 19 (27.1%) | $23,661 |
| Total | 70 (100.0%) | $30,833 |
Poverty in Sunny Side
Income Below Poverty by Sex and Age in Sunny Side
With 12.0% poverty level for males and 17.6% for females among the residents of Sunny Side, 12 to 14 year old males and 25 to 34 year old females are the most vulnerable to poverty, with 7 males (63.6%) and 6 females (46.2%) in their respective age groups living below the poverty level.
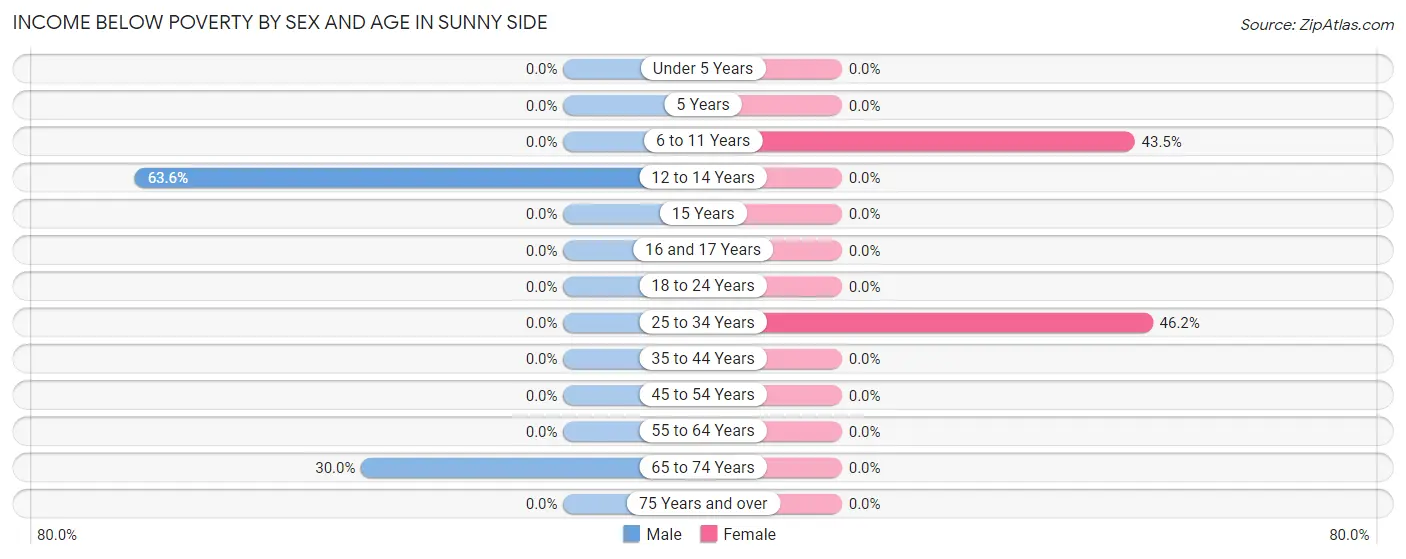
| Age Bracket | Male | Female |
| Under 5 Years | 0 (0.0%) | 0 (0.0%) |
| 5 Years | 0 (0.0%) | 0 (0.0%) |
| 6 to 11 Years | 0 (0.0%) | 10 (43.5%) |
| 12 to 14 Years | 7 (63.6%) | 0 (0.0%) |
| 15 Years | 0 (0.0%) | 0 (0.0%) |
| 16 and 17 Years | 0 (0.0%) | 0 (0.0%) |
| 18 to 24 Years | 0 (0.0%) | 0 (0.0%) |
| 25 to 34 Years | 0 (0.0%) | 6 (46.2%) |
| 35 to 44 Years | 0 (0.0%) | 0 (0.0%) |
| 45 to 54 Years | 0 (0.0%) | 0 (0.0%) |
| 55 to 64 Years | 0 (0.0%) | 0 (0.0%) |
| 65 to 74 Years | 3 (30.0%) | 0 (0.0%) |
| 75 Years and over | 0 (0.0%) | 0 (0.0%) |
| Total | 10 (12.0%) | 16 (17.6%) |
Income Above Poverty by Sex and Age in Sunny Side
According to the poverty statistics in Sunny Side, males aged under 5 years and females aged 5 years are the age groups that are most secure financially, with 100.0% of males and 100.0% of females in these age groups living above the poverty line.
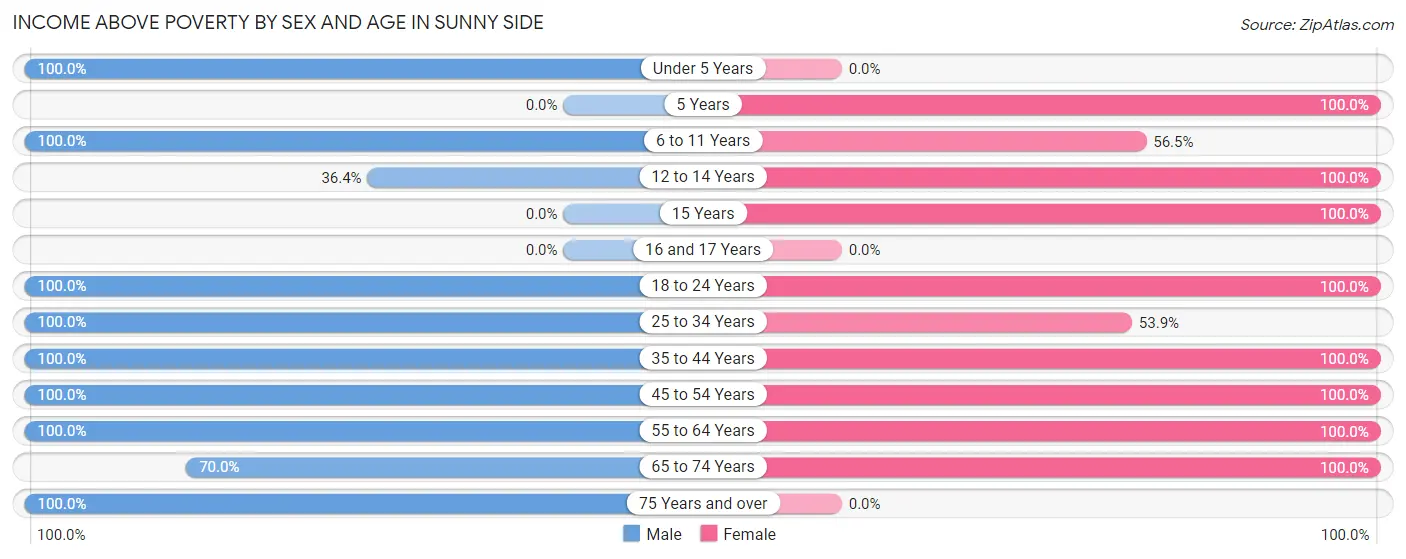
| Age Bracket | Male | Female |
| Under 5 Years | 22 (100.0%) | 0 (0.0%) |
| 5 Years | 0 (0.0%) | 2 (100.0%) |
| 6 to 11 Years | 3 (100.0%) | 13 (56.5%) |
| 12 to 14 Years | 4 (36.4%) | 3 (100.0%) |
| 15 Years | 0 (0.0%) | 1 (100.0%) |
| 16 and 17 Years | 0 (0.0%) | 0 (0.0%) |
| 18 to 24 Years | 7 (100.0%) | 6 (100.0%) |
| 25 to 34 Years | 11 (100.0%) | 7 (53.8%) |
| 35 to 44 Years | 2 (100.0%) | 4 (100.0%) |
| 45 to 54 Years | 14 (100.0%) | 15 (100.0%) |
| 55 to 64 Years | 2 (100.0%) | 9 (100.0%) |
| 65 to 74 Years | 7 (70.0%) | 15 (100.0%) |
| 75 Years and over | 1 (100.0%) | 0 (0.0%) |
| Total | 73 (87.9%) | 75 (82.4%) |
Income Below Poverty Among Married-Couple Families in Sunny Side
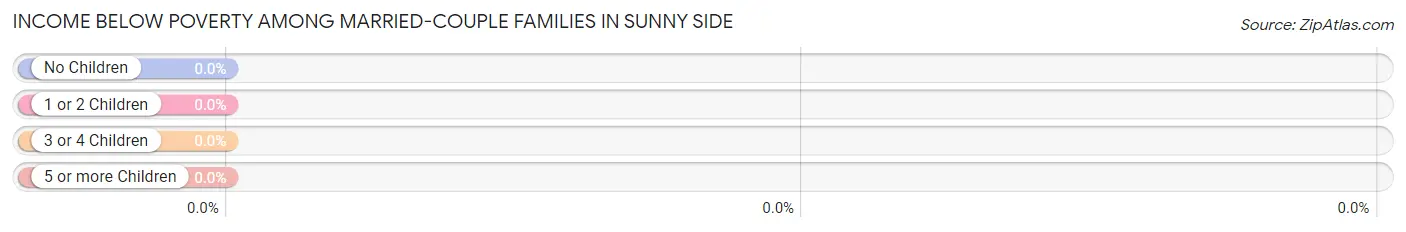
| Children | Above Poverty | Below Poverty |
| No Children | 5 (100.0%) | 0 (0.0%) |
| 1 or 2 Children | 21 (100.0%) | 0 (0.0%) |
| 3 or 4 Children | 0 (0.0%) | 0 (0.0%) |
| 5 or more Children | 0 (0.0%) | 0 (0.0%) |
| Total | 26 (100.0%) | 0 (0.0%) |
Income Below Poverty Among Single-Parent Households in Sunny Side
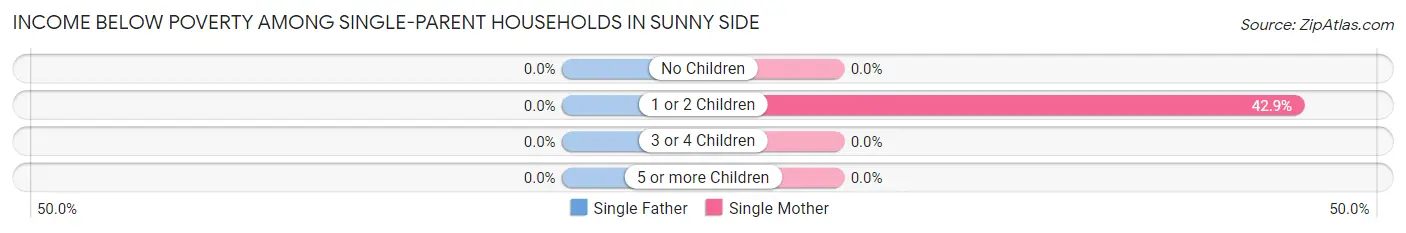
| Children | Single Father | Single Mother |
| No Children | 0 (0.0%) | 0 (0.0%) |
| 1 or 2 Children | 0 (0.0%) | 6 (42.9%) |
| 3 or 4 Children | 0 (0.0%) | 0 (0.0%) |
| 5 or more Children | 0 (0.0%) | 0 (0.0%) |
| Total | 0 (0.0%) | 6 (31.6%) |
Income Below Poverty Among Married-Couple vs Single-Parent Households in Sunny Side
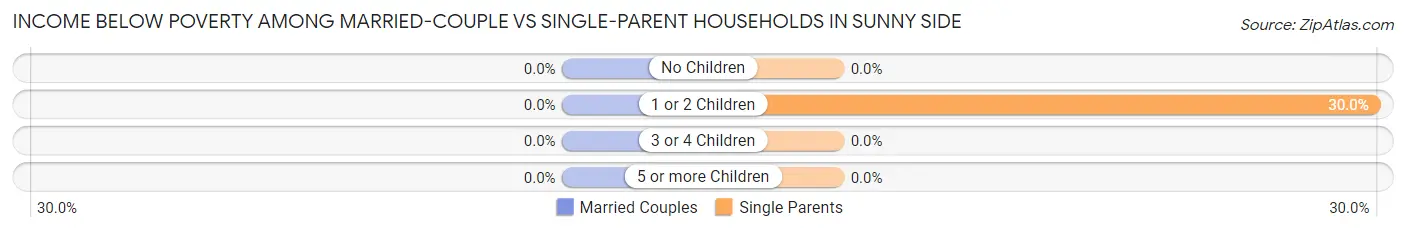
| Children | Married-Couple Families | Single-Parent Households |
| No Children | 0 (0.0%) | 0 (0.0%) |
| 1 or 2 Children | 0 (0.0%) | 6 (30.0%) |
| 3 or 4 Children | 0 (0.0%) | 0 (0.0%) |
| 5 or more Children | 0 (0.0%) | 0 (0.0%) |
| Total | 0 (0.0%) | 6 (24.0%) |
Employment Characteristics in Sunny Side
Employment by Class of Employer in Sunny Side
Among the 64 employed individuals in Sunny Side, private company employees (44 | 68.8%), self-employed (incorporated) (13 | 20.3%), and state government employees (4 | 6.2%) make up the most common classes of employment.
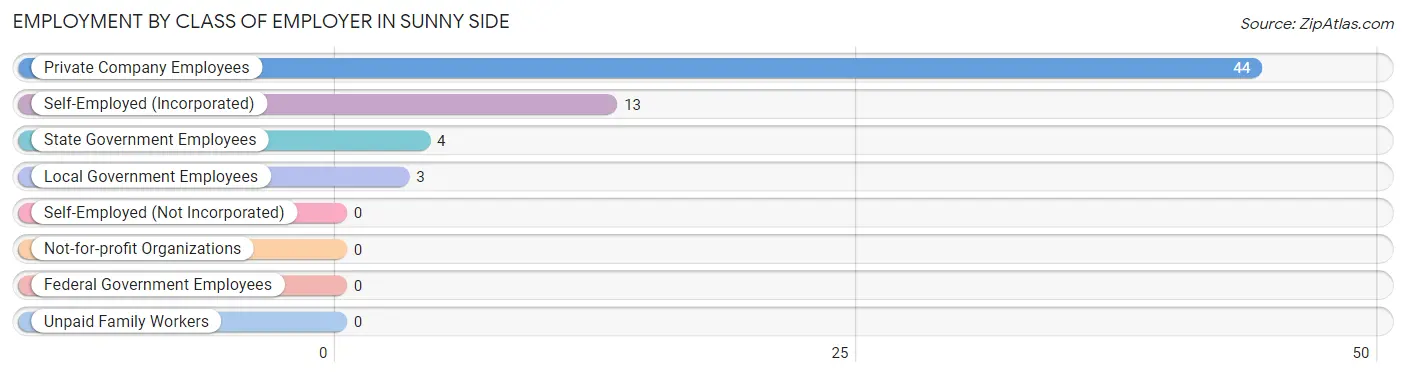
| Employer Class | # Employees | % Employees |
| Private Company Employees | 44 | 68.8% |
| Self-Employed (Incorporated) | 13 | 20.3% |
| Self-Employed (Not Incorporated) | 0 | 0.0% |
| Not-for-profit Organizations | 0 | 0.0% |
| Local Government Employees | 3 | 4.7% |
| State Government Employees | 4 | 6.2% |
| Federal Government Employees | 0 | 0.0% |
| Unpaid Family Workers | 0 | 0.0% |
| Total | 64 | 100.0% |
Employment Status by Age in Sunny Side
According to the labor force statistics for Sunny Side, out of the total population over 16 years of age (109), 59.6% or 65 individuals are in the labor force, with 1.5% or 1 of them unemployed. The age group with the highest labor force participation rate is 30 to 34 years, with 100.0% or 12 individuals in the labor force. Within the labor force, the 60 to 64 years age range has the highest percentage of unemployed individuals, with 50.0% or 1 of them being unemployed.
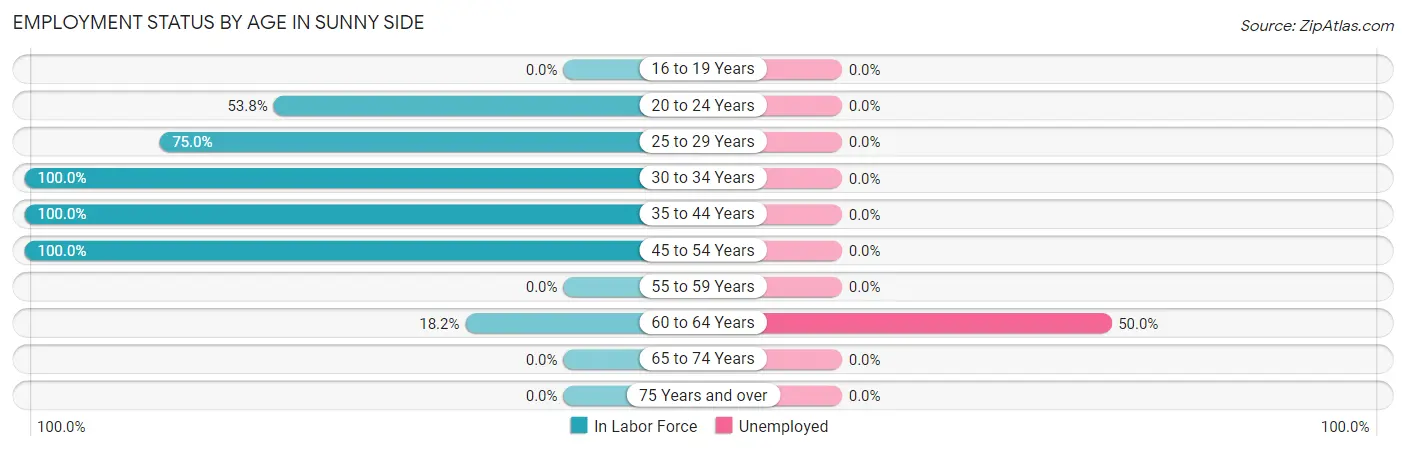
| Age Bracket | In Labor Force | Unemployed |
| 16 to 19 Years | 0 (0.0%) | 0 (0.0%) |
| 20 to 24 Years | 7 (53.8%) | 0 (0.0%) |
| 25 to 29 Years | 9 (75.0%) | 0 (0.0%) |
| 30 to 34 Years | 12 (100.0%) | 0 (0.0%) |
| 35 to 44 Years | 6 (100.0%) | 0 (0.0%) |
| 45 to 54 Years | 29 (100.0%) | 0 (0.0%) |
| 55 to 59 Years | 0 (0.0%) | 0 (0.0%) |
| 60 to 64 Years | 2 (18.2%) | 1 (50.0%) |
| 65 to 74 Years | 0 (0.0%) | 0 (0.0%) |
| 75 Years and over | 0 (0.0%) | 0 (0.0%) |
| Total | 65 (59.6%) | 1 (1.5%) |
Employment Status by Educational Attainment in Sunny Side
According to labor force statistics for Sunny Side, 82.9% of individuals (58) out of the total population between 25 and 64 years of age (70) are in the labor force, with 1.7% or 1 of them being unemployed. The group with the highest labor force participation rate are those with the educational attainment of less than high school, with 100.0% or 19 individuals in the labor force. Within the labor force, individuals with bachelor's degree or higher education have the highest percentage of unemployment, with 16.7% or 1 of them being unemployed.
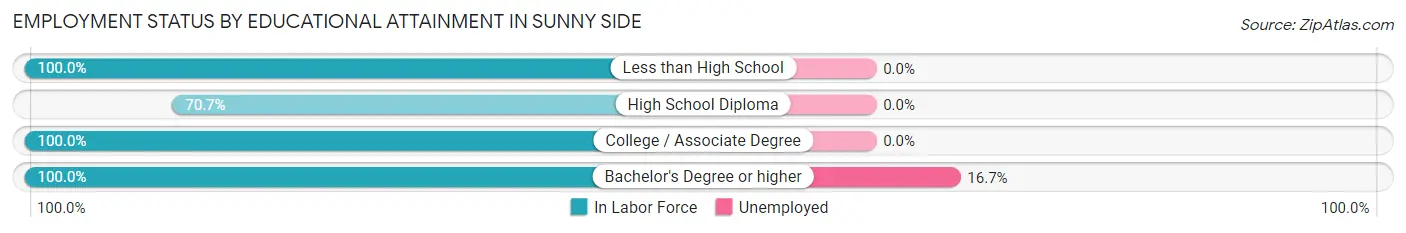
| Educational Attainment | In Labor Force | Unemployed |
| Less than High School | 19 (100.0%) | 0 (0.0%) |
| High School Diploma | 29 (70.7%) | 0 (0.0%) |
| College / Associate Degree | 4 (100.0%) | 0 (0.0%) |
| Bachelor's Degree or higher | 6 (100.0%) | 1 (16.7%) |
| Total | 58 (82.9%) | 1 (1.7%) |
Employment Occupations by Sex in Sunny Side
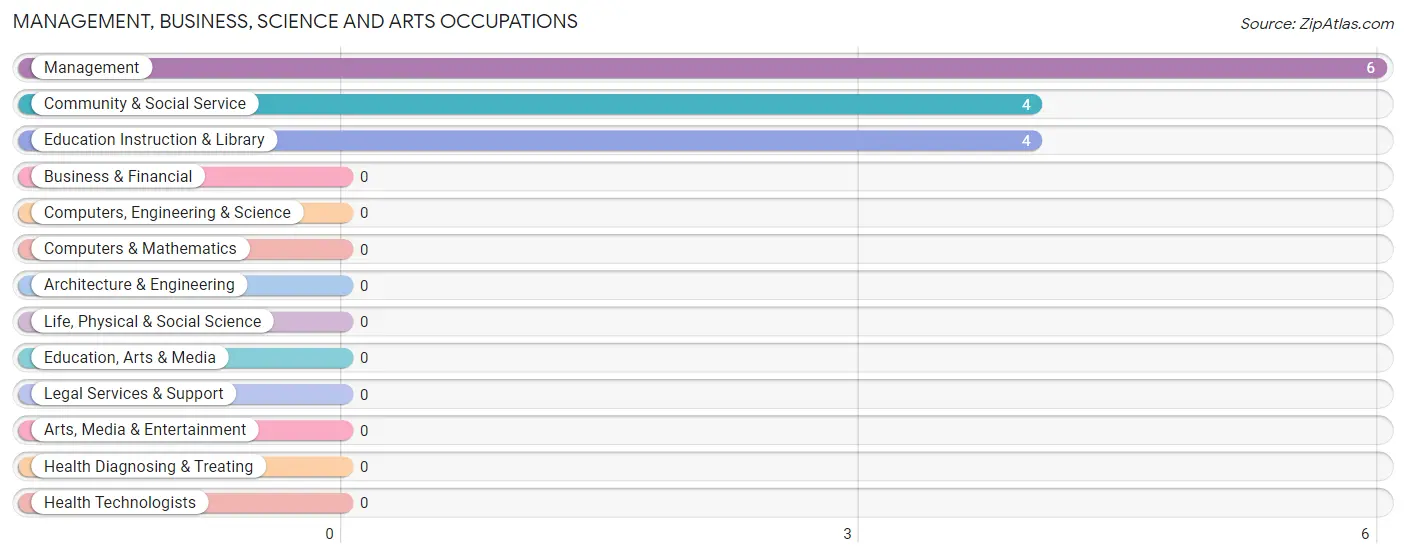
Management, Business, Science and Arts Occupations
The most common Management, Business, Science and Arts occupations in Sunny Side are Management (6 | 9.4%), Community & Social Service (4 | 6.2%), and Education Instruction & Library (4 | 6.2%).
Management, Business, Science and Arts Occupations by Sex
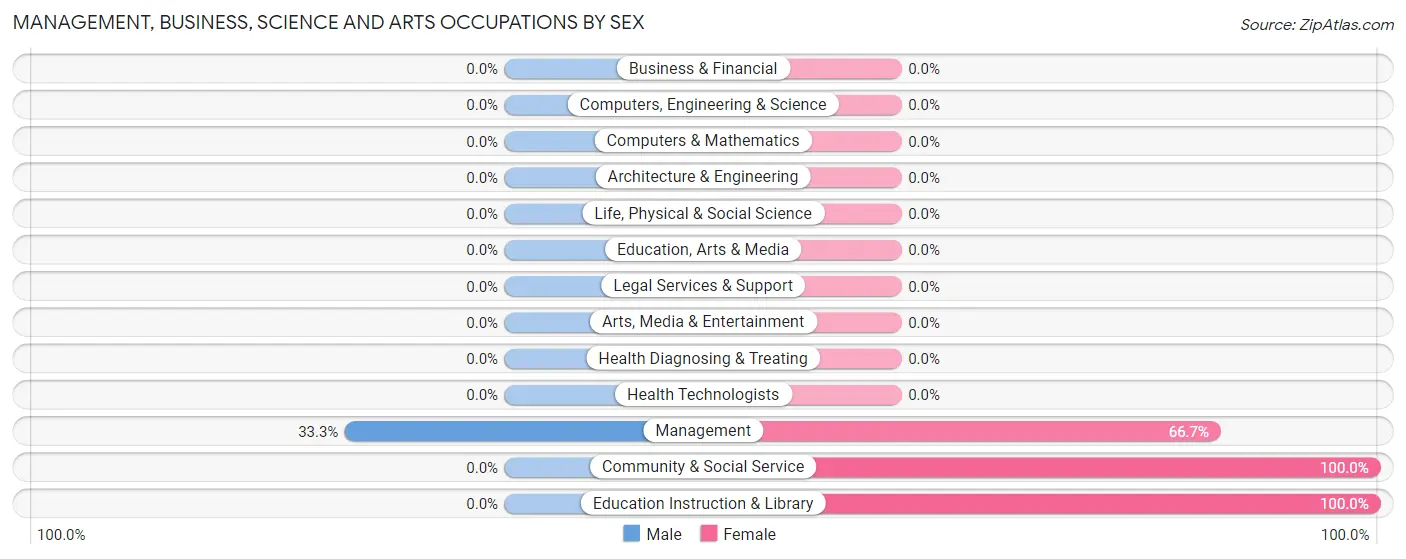
| Occupation | Male | Female |
| Management | 2 (33.3%) | 4 (66.7%) |
| Business & Financial | 0 (0.0%) | 0 (0.0%) |
| Computers, Engineering & Science | 0 (0.0%) | 0 (0.0%) |
| Computers & Mathematics | 0 (0.0%) | 0 (0.0%) |
| Architecture & Engineering | 0 (0.0%) | 0 (0.0%) |
| Life, Physical & Social Science | 0 (0.0%) | 0 (0.0%) |
| Community & Social Service | 0 (0.0%) | 4 (100.0%) |
| Education, Arts & Media | 0 (0.0%) | 0 (0.0%) |
| Legal Services & Support | 0 (0.0%) | 0 (0.0%) |
| Education Instruction & Library | 0 (0.0%) | 4 (100.0%) |
| Arts, Media & Entertainment | 0 (0.0%) | 0 (0.0%) |
| Health Diagnosing & Treating | 0 (0.0%) | 0 (0.0%) |
| Health Technologists | 0 (0.0%) | 0 (0.0%) |
| Total (Category) | 2 (20.0%) | 8 (80.0%) |
| Total (Overall) | 34 (53.1%) | 30 (46.9%) |
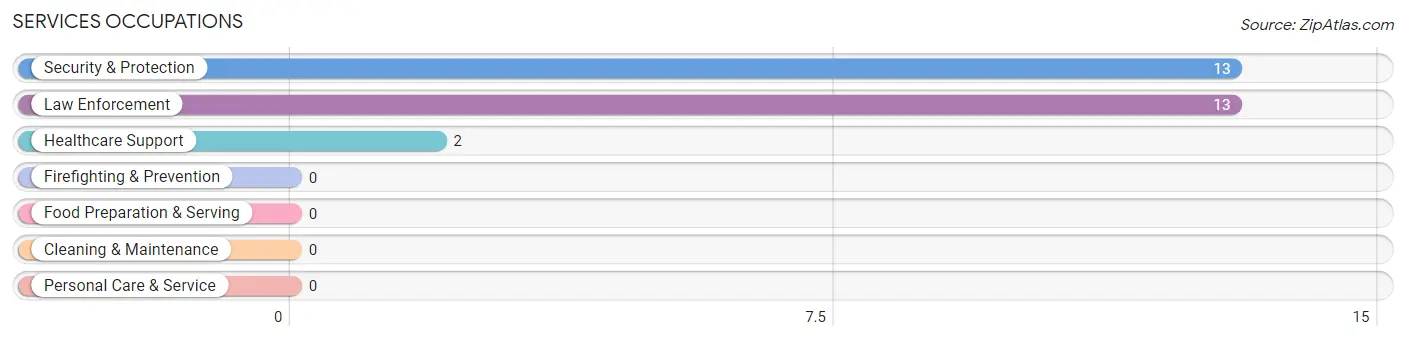
Services Occupations
The most common Services occupations in Sunny Side are Security & Protection (13 | 20.3%), Law Enforcement (13 | 20.3%), and Healthcare Support (2 | 3.1%).
Services Occupations by Sex
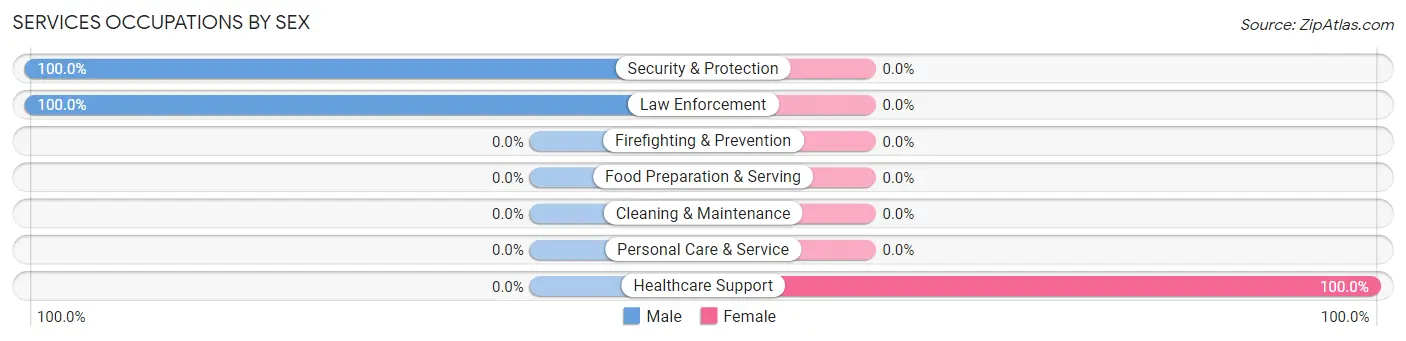
| Occupation | Male | Female |
| Healthcare Support | 0 (0.0%) | 2 (100.0%) |
| Security & Protection | 13 (100.0%) | 0 (0.0%) |
| Firefighting & Prevention | 0 (0.0%) | 0 (0.0%) |
| Law Enforcement | 13 (100.0%) | 0 (0.0%) |
| Food Preparation & Serving | 0 (0.0%) | 0 (0.0%) |
| Cleaning & Maintenance | 0 (0.0%) | 0 (0.0%) |
| Personal Care & Service | 0 (0.0%) | 0 (0.0%) |
| Total (Category) | 13 (86.7%) | 2 (13.3%) |
| Total (Overall) | 34 (53.1%) | 30 (46.9%) |
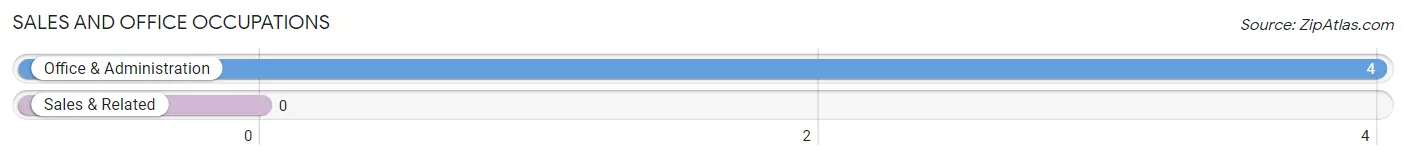
Sales and Office Occupations
The most common Sales and Office occupations in Sunny Side are , and Office & Administration (4 | 6.2%).
Sales and Office Occupations by Sex
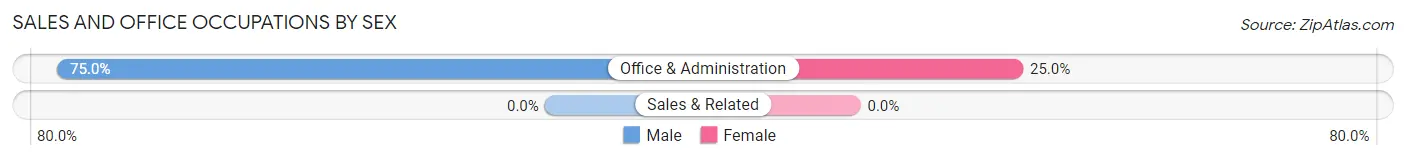
| Occupation | Male | Female |
| Sales & Related | 0 (0.0%) | 0 (0.0%) |
| Office & Administration | 3 (75.0%) | 1 (25.0%) |
| Total (Category) | 3 (75.0%) | 1 (25.0%) |
| Total (Overall) | 34 (53.1%) | 30 (46.9%) |
Natural Resources, Construction and Maintenance Occupations
The most common Natural Resources, Construction and Maintenance occupations in Sunny Side are , and Construction & Extraction (7 | 10.9%).
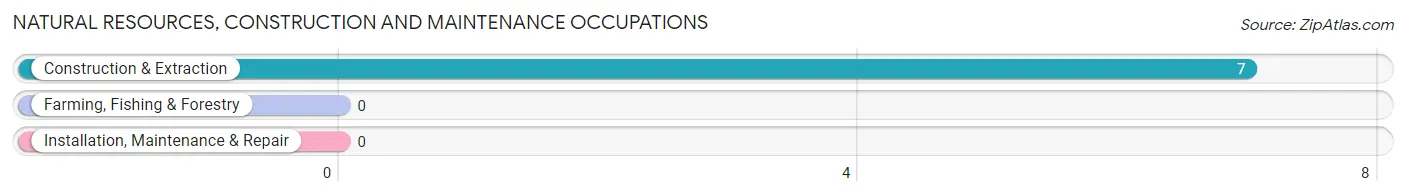
Natural Resources, Construction and Maintenance Occupations by Sex
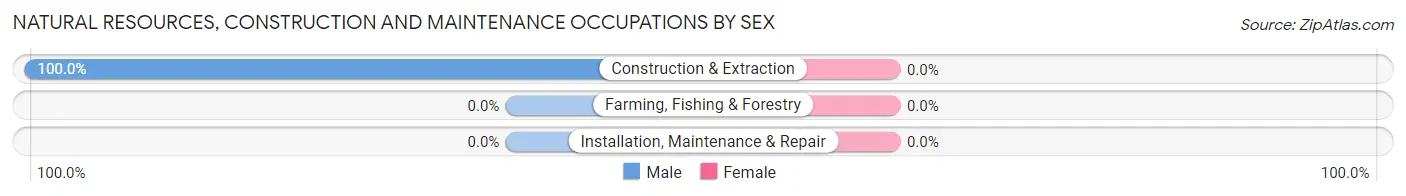
| Occupation | Male | Female |
| Farming, Fishing & Forestry | 0 (0.0%) | 0 (0.0%) |
| Construction & Extraction | 7 (100.0%) | 0 (0.0%) |
| Installation, Maintenance & Repair | 0 (0.0%) | 0 (0.0%) |
| Total (Category) | 7 (100.0%) | 0 (0.0%) |
| Total (Overall) | 34 (53.1%) | 30 (46.9%) |
Production, Transportation and Moving Occupations
The most common Production, Transportation and Moving occupations in Sunny Side are Transportation (15 | 23.4%), Production (9 | 14.1%), and Material Moving (4 | 6.2%).
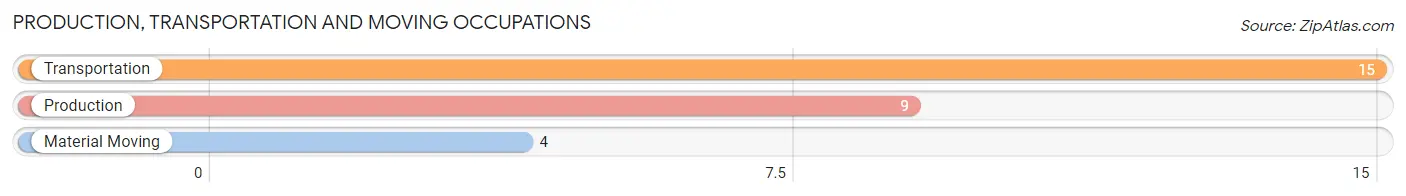
Production, Transportation and Moving Occupations by Sex
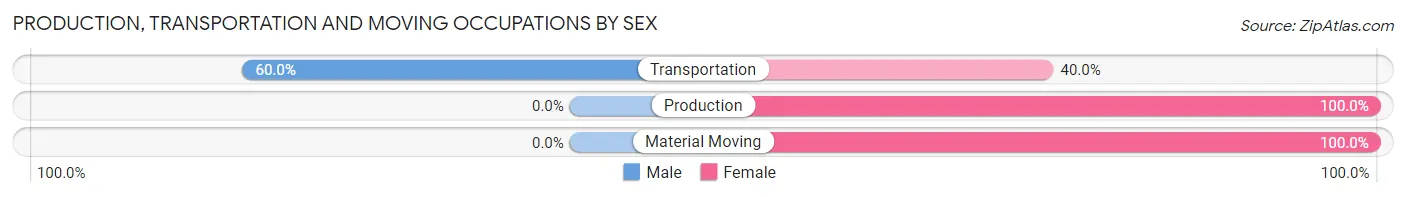
| Occupation | Male | Female |
| Production | 0 (0.0%) | 9 (100.0%) |
| Transportation | 9 (60.0%) | 6 (40.0%) |
| Material Moving | 0 (0.0%) | 4 (100.0%) |
| Total (Category) | 9 (32.1%) | 19 (67.9%) |
| Total (Overall) | 34 (53.1%) | 30 (46.9%) |
Employment Industries by Sex in Sunny Side
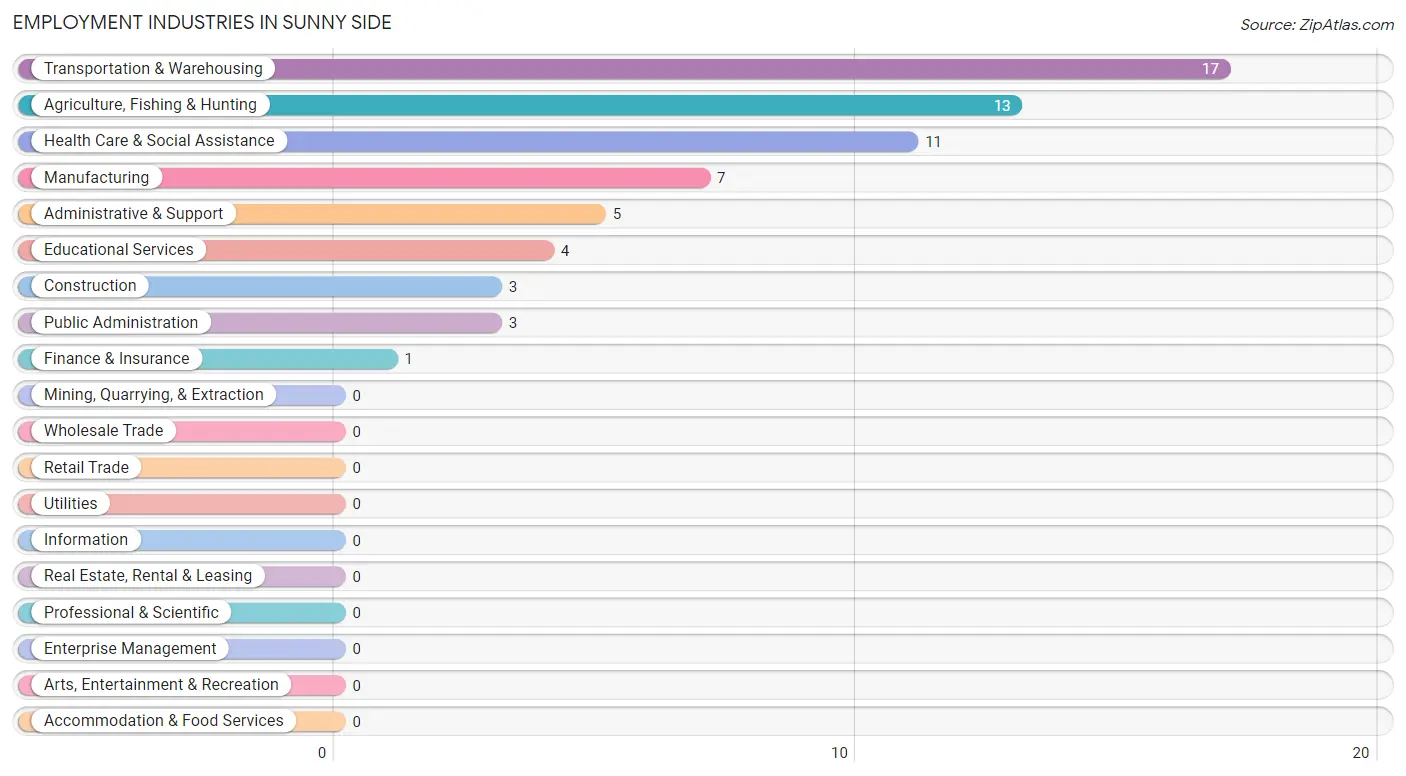
Employment Industries in Sunny Side
The major employment industries in Sunny Side include Transportation & Warehousing (17 | 26.6%), Agriculture, Fishing & Hunting (13 | 20.3%), Health Care & Social Assistance (11 | 17.2%), Manufacturing (7 | 10.9%), and Administrative & Support (5 | 7.8%).
Employment Industries by Sex in Sunny Side
The Sunny Side industries that see more men than women are Agriculture, Fishing & Hunting (100.0%), Construction (100.0%), and Manufacturing (100.0%), whereas the industries that tend to have a higher number of women are Finance & Insurance (100.0%), Administrative & Support (100.0%), and Educational Services (100.0%).
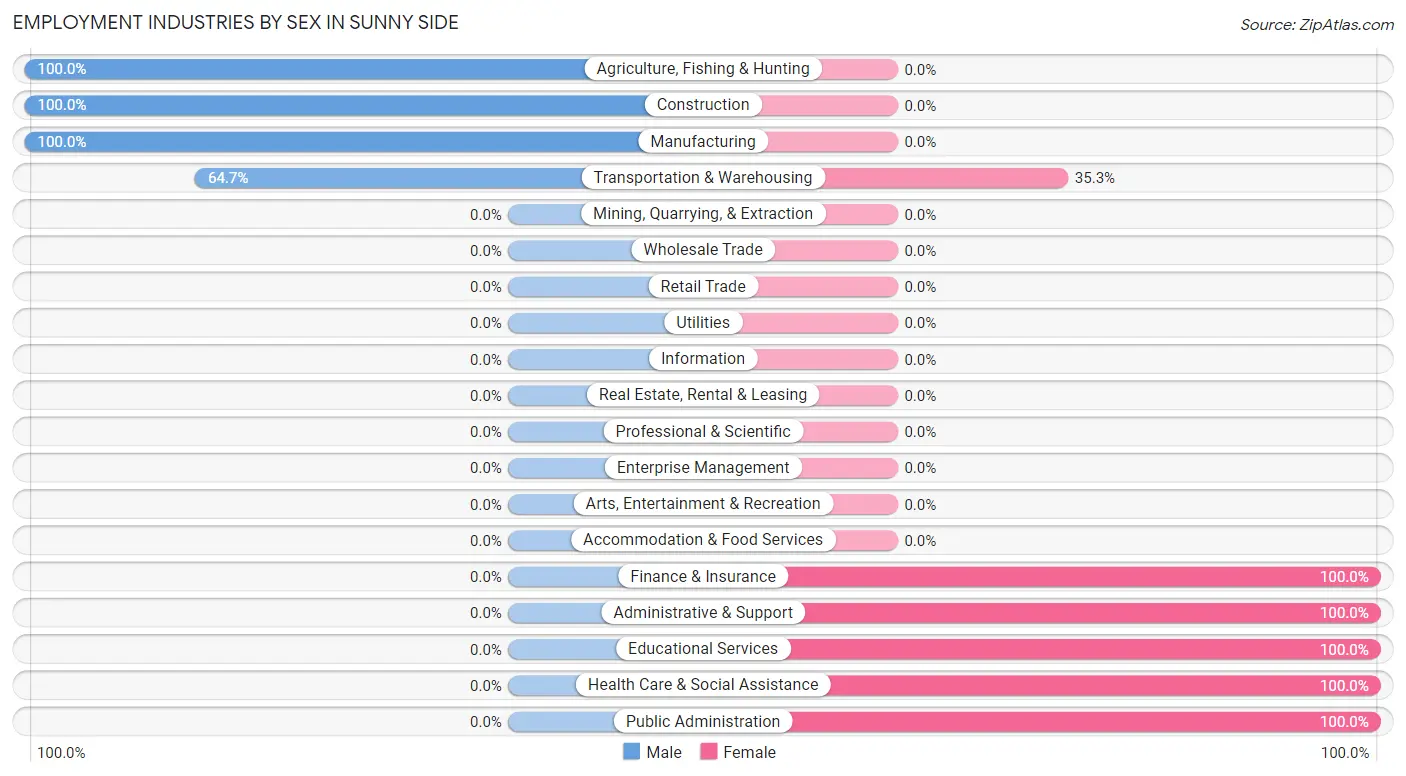
| Industry | Male | Female |
| Agriculture, Fishing & Hunting | 13 (100.0%) | 0 (0.0%) |
| Mining, Quarrying, & Extraction | 0 (0.0%) | 0 (0.0%) |
| Construction | 3 (100.0%) | 0 (0.0%) |
| Manufacturing | 7 (100.0%) | 0 (0.0%) |
| Wholesale Trade | 0 (0.0%) | 0 (0.0%) |
| Retail Trade | 0 (0.0%) | 0 (0.0%) |
| Transportation & Warehousing | 11 (64.7%) | 6 (35.3%) |
| Utilities | 0 (0.0%) | 0 (0.0%) |
| Information | 0 (0.0%) | 0 (0.0%) |
| Finance & Insurance | 0 (0.0%) | 1 (100.0%) |
| Real Estate, Rental & Leasing | 0 (0.0%) | 0 (0.0%) |
| Professional & Scientific | 0 (0.0%) | 0 (0.0%) |
| Enterprise Management | 0 (0.0%) | 0 (0.0%) |
| Administrative & Support | 0 (0.0%) | 5 (100.0%) |
| Educational Services | 0 (0.0%) | 4 (100.0%) |
| Health Care & Social Assistance | 0 (0.0%) | 11 (100.0%) |
| Arts, Entertainment & Recreation | 0 (0.0%) | 0 (0.0%) |
| Accommodation & Food Services | 0 (0.0%) | 0 (0.0%) |
| Public Administration | 0 (0.0%) | 3 (100.0%) |
| Total | 34 (53.1%) | 30 (46.9%) |
Education in Sunny Side
School Enrollment in Sunny Side
The most common levels of schooling among the 43 students in Sunny Side are middle school (27 | 62.8%), elementary school (13 | 30.2%), and kindergarten (2 | 4.6%).
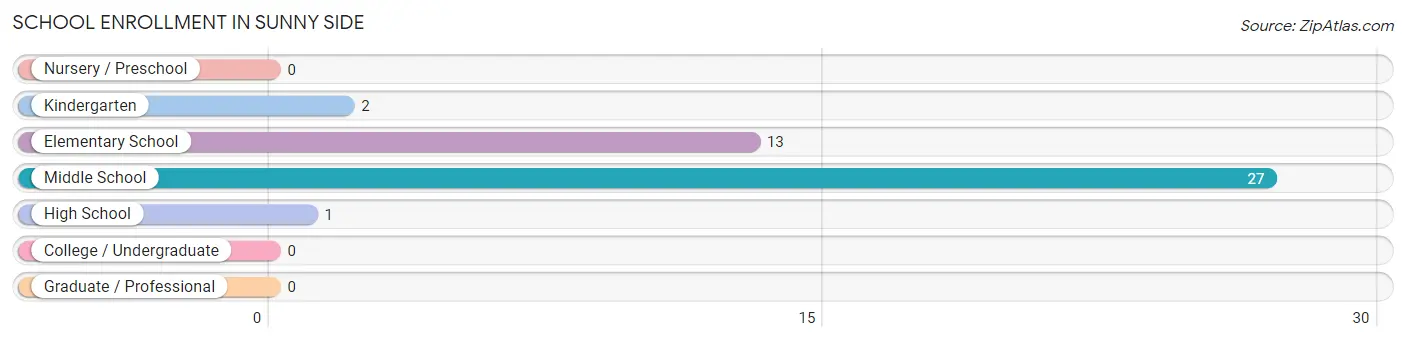
| School Level | # Students | % Students |
| Nursery / Preschool | 0 | 0.0% |
| Kindergarten | 2 | 4.6% |
| Elementary School | 13 | 30.2% |
| Middle School | 27 | 62.8% |
| High School | 1 | 2.3% |
| College / Undergraduate | 0 | 0.0% |
| Graduate / Professional | 0 | 0.0% |
| Total | 43 | 100.0% |
School Enrollment by Age by Funding Source in Sunny Side
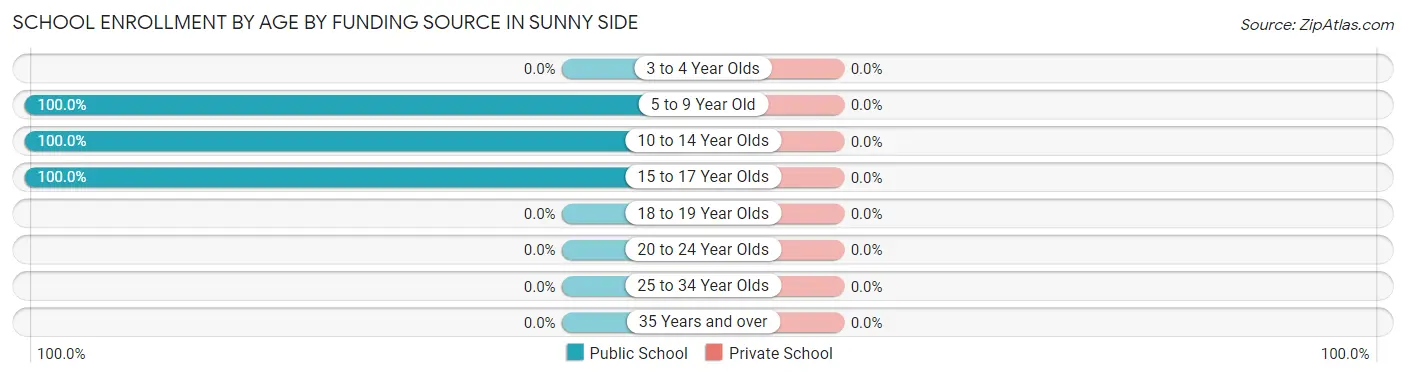
| Age Bracket | Public School | Private School |
| 3 to 4 Year Olds | 0 (0.0%) | 0 (0.0%) |
| 5 to 9 Year Old | 5 (100.0%) | 0 (0.0%) |
| 10 to 14 Year Olds | 37 (100.0%) | 0 (0.0%) |
| 15 to 17 Year Olds | 1 (100.0%) | 0 (0.0%) |
| 18 to 19 Year Olds | 0 (0.0%) | 0 (0.0%) |
| 20 to 24 Year Olds | 0 (0.0%) | 0 (0.0%) |
| 25 to 34 Year Olds | 0 (0.0%) | 0 (0.0%) |
| 35 Years and over | 0 (0.0%) | 0 (0.0%) |
| Total | 43 (100.0%) | 0 (0.0%) |
Educational Attainment by Field of Study in Sunny Side
Education (4 | 50.0%), bio, nature & agricultural (2 | 25.0%), physical & health sciences (1 | 12.5%), and science & technology (1 | 12.5%) are the most common fields of study among 8 individuals in Sunny Side who have obtained a bachelor's degree or higher.
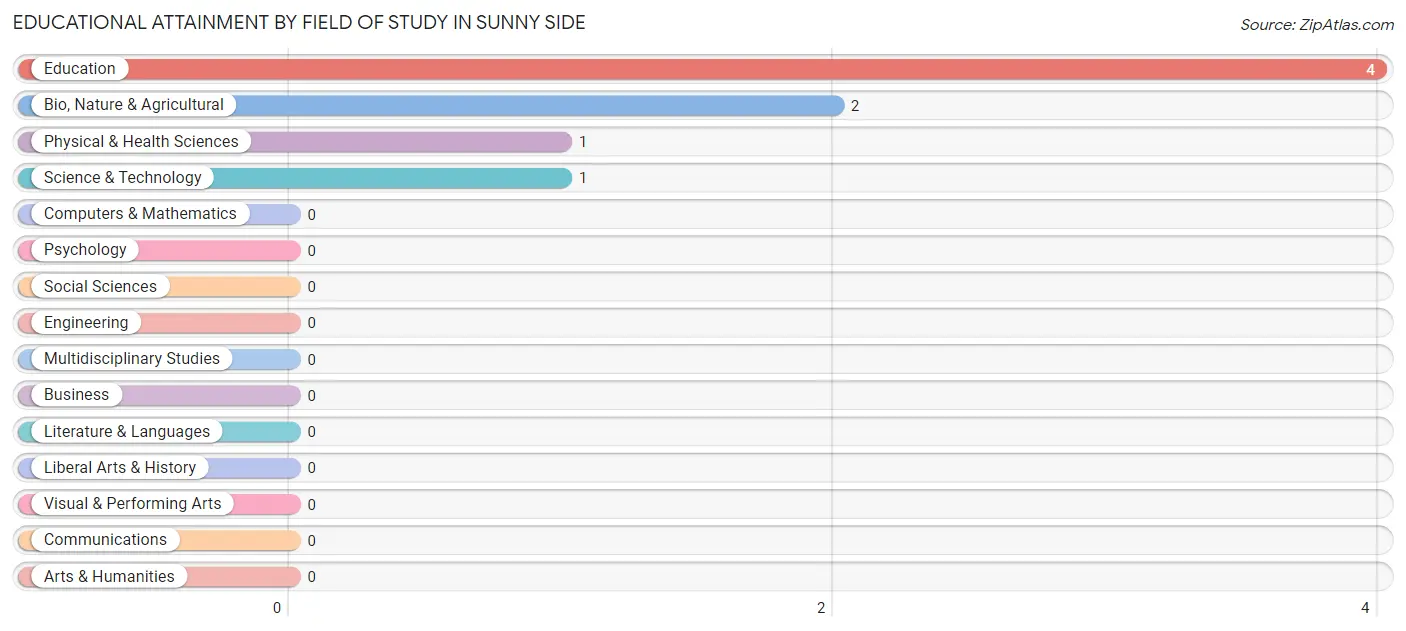
| Field of Study | # Graduates | % Graduates |
| Computers & Mathematics | 0 | 0.0% |
| Bio, Nature & Agricultural | 2 | 25.0% |
| Physical & Health Sciences | 1 | 12.5% |
| Psychology | 0 | 0.0% |
| Social Sciences | 0 | 0.0% |
| Engineering | 0 | 0.0% |
| Multidisciplinary Studies | 0 | 0.0% |
| Science & Technology | 1 | 12.5% |
| Business | 0 | 0.0% |
| Education | 4 | 50.0% |
| Literature & Languages | 0 | 0.0% |
| Liberal Arts & History | 0 | 0.0% |
| Visual & Performing Arts | 0 | 0.0% |
| Communications | 0 | 0.0% |
| Arts & Humanities | 0 | 0.0% |
| Total | 8 | 100.0% |
Transportation & Commute in Sunny Side
Vehicle Availability by Sex in Sunny Side
The most prevalent vehicle ownership categories in Sunny Side are males with 2 vehicles (23, accounting for 67.6%) and females with 2 vehicles (22, making up 76.7%).
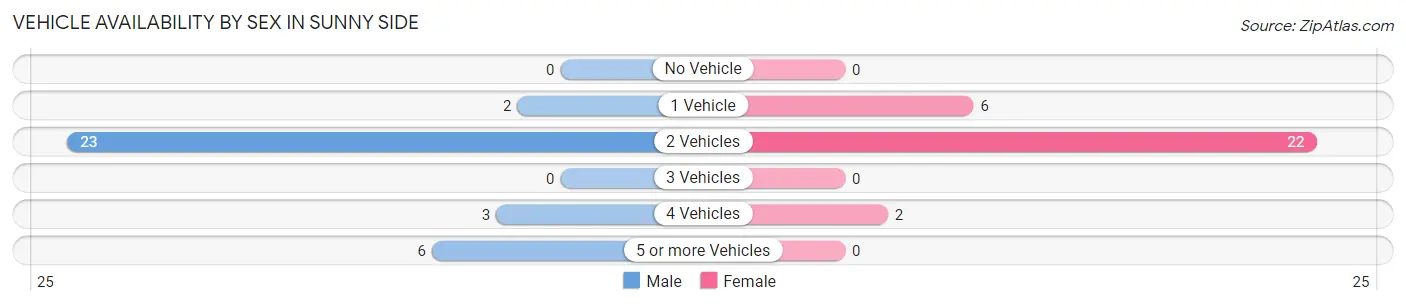
| Vehicles Available | Male | Female |
| No Vehicle | 0 (0.0%) | 0 (0.0%) |
| 1 Vehicle | 2 (5.9%) | 6 (20.0%) |
| 2 Vehicles | 23 (67.6%) | 22 (73.3%) |
| 3 Vehicles | 0 (0.0%) | 0 (0.0%) |
| 4 Vehicles | 3 (8.8%) | 2 (6.7%) |
| 5 or more Vehicles | 6 (17.6%) | 0 (0.0%) |
| Total | 34 (100.0%) | 30 (100.0%) |
Commute Time in Sunny Side
The most frequently occuring commute durations in Sunny Side are 45 to 59 minutes (23 commuters, 40.4%), 10 to 14 minutes (13 commuters, 22.8%), and 35 to 39 minutes (9 commuters, 15.8%).
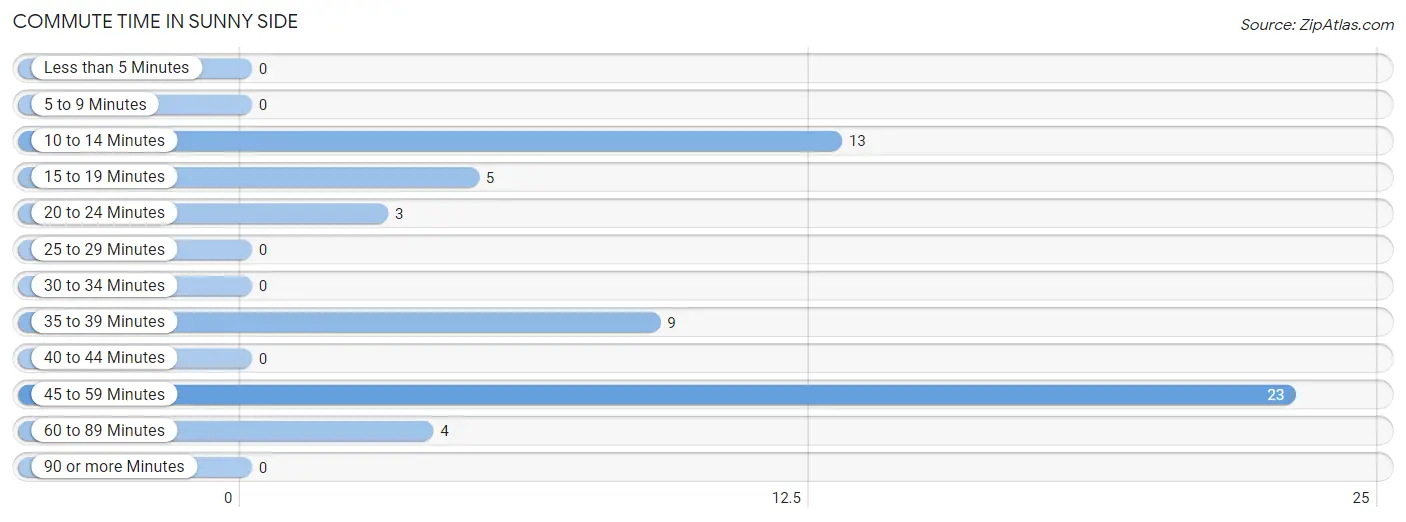
| Commute Time | # Commuters | % Commuters |
| Less than 5 Minutes | 0 | 0.0% |
| 5 to 9 Minutes | 0 | 0.0% |
| 10 to 14 Minutes | 13 | 22.8% |
| 15 to 19 Minutes | 5 | 8.8% |
| 20 to 24 Minutes | 3 | 5.3% |
| 25 to 29 Minutes | 0 | 0.0% |
| 30 to 34 Minutes | 0 | 0.0% |
| 35 to 39 Minutes | 9 | 15.8% |
| 40 to 44 Minutes | 0 | 0.0% |
| 45 to 59 Minutes | 23 | 40.4% |
| 60 to 89 Minutes | 4 | 7.0% |
| 90 or more Minutes | 0 | 0.0% |
Commute Time by Sex in Sunny Side
The most common commute times in Sunny Side are 45 to 59 minutes (13 commuters, 41.9%) for males and 45 to 59 minutes (10 commuters, 38.5%) for females.
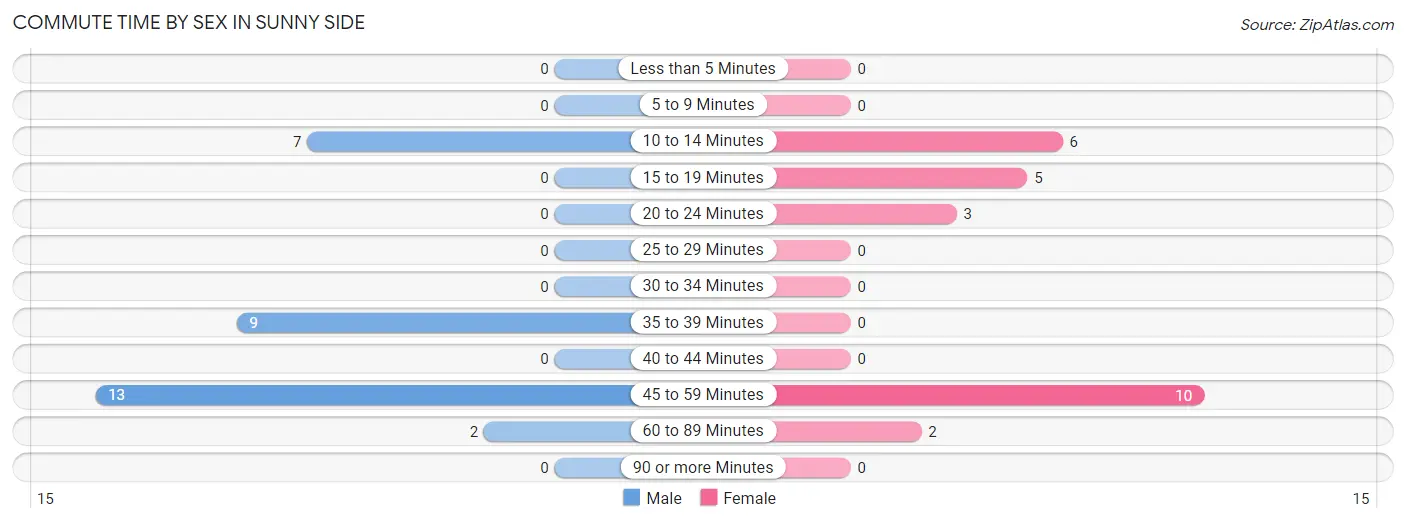
| Commute Time | Male | Female |
| Less than 5 Minutes | 0 (0.0%) | 0 (0.0%) |
| 5 to 9 Minutes | 0 (0.0%) | 0 (0.0%) |
| 10 to 14 Minutes | 7 (22.6%) | 6 (23.1%) |
| 15 to 19 Minutes | 0 (0.0%) | 5 (19.2%) |
| 20 to 24 Minutes | 0 (0.0%) | 3 (11.5%) |
| 25 to 29 Minutes | 0 (0.0%) | 0 (0.0%) |
| 30 to 34 Minutes | 0 (0.0%) | 0 (0.0%) |
| 35 to 39 Minutes | 9 (29.0%) | 0 (0.0%) |
| 40 to 44 Minutes | 0 (0.0%) | 0 (0.0%) |
| 45 to 59 Minutes | 13 (41.9%) | 10 (38.5%) |
| 60 to 89 Minutes | 2 (6.5%) | 2 (7.7%) |
| 90 or more Minutes | 0 (0.0%) | 0 (0.0%) |
Time of Departure to Work by Sex in Sunny Side
The most frequent times of departure to work in Sunny Side are 9:00 AM to 9:59 AM (14, 45.2%) for males and 5:30 AM to 5:59 AM (9, 34.6%) for females.
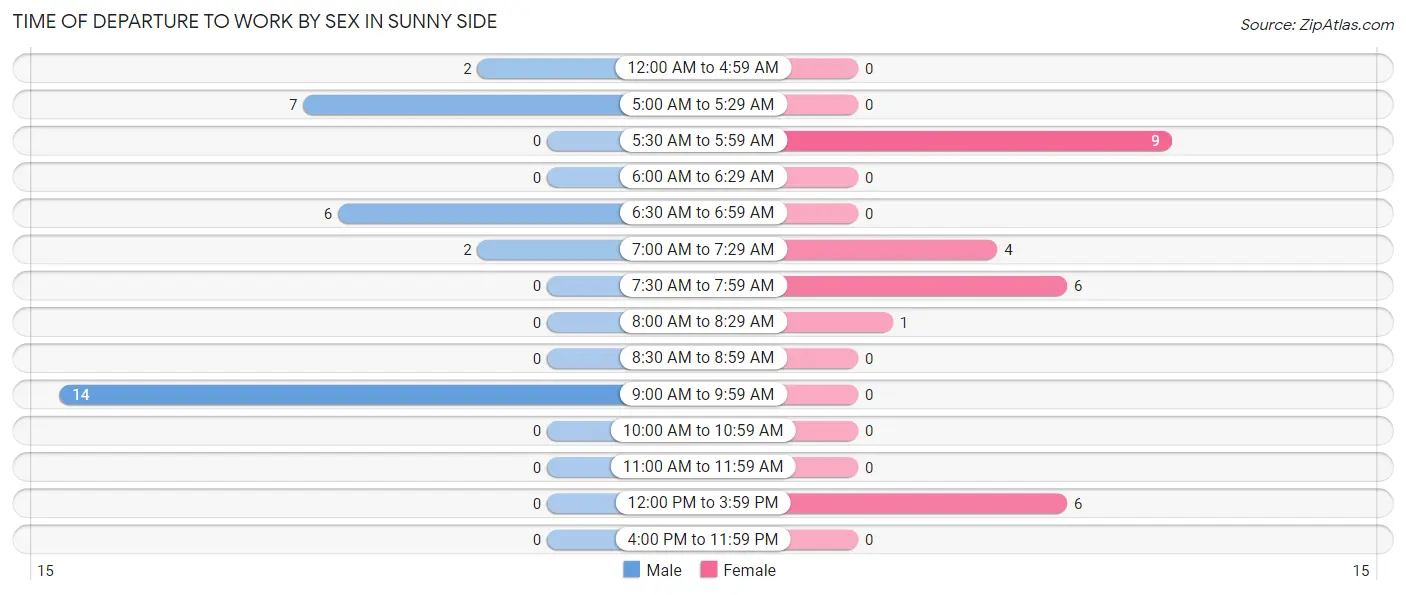
| Time of Departure | Male | Female |
| 12:00 AM to 4:59 AM | 2 (6.5%) | 0 (0.0%) |
| 5:00 AM to 5:29 AM | 7 (22.6%) | 0 (0.0%) |
| 5:30 AM to 5:59 AM | 0 (0.0%) | 9 (34.6%) |
| 6:00 AM to 6:29 AM | 0 (0.0%) | 0 (0.0%) |
| 6:30 AM to 6:59 AM | 6 (19.4%) | 0 (0.0%) |
| 7:00 AM to 7:29 AM | 2 (6.5%) | 4 (15.4%) |
| 7:30 AM to 7:59 AM | 0 (0.0%) | 6 (23.1%) |
| 8:00 AM to 8:29 AM | 0 (0.0%) | 1 (3.8%) |
| 8:30 AM to 8:59 AM | 0 (0.0%) | 0 (0.0%) |
| 9:00 AM to 9:59 AM | 14 (45.2%) | 0 (0.0%) |
| 10:00 AM to 10:59 AM | 0 (0.0%) | 0 (0.0%) |
| 11:00 AM to 11:59 AM | 0 (0.0%) | 0 (0.0%) |
| 12:00 PM to 3:59 PM | 0 (0.0%) | 6 (23.1%) |
| 4:00 PM to 11:59 PM | 0 (0.0%) | 0 (0.0%) |
| Total | 31 (100.0%) | 26 (100.0%) |
Housing Occupancy in Sunny Side
Occupancy by Ownership in Sunny Side
Of the total 70 dwellings in Sunny Side, owner-occupied units account for 37 (52.9%), while renter-occupied units make up 33 (47.1%).
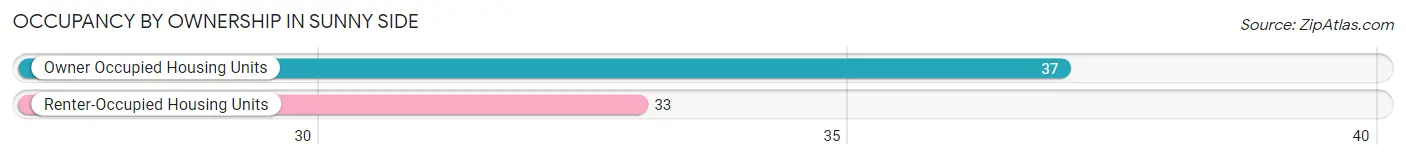
| Occupancy | # Housing Units | % Housing Units |
| Owner Occupied Housing Units | 37 | 52.9% |
| Renter-Occupied Housing Units | 33 | 47.1% |
| Total Occupied Housing Units | 70 | 100.0% |
Occupancy by Household Size in Sunny Side
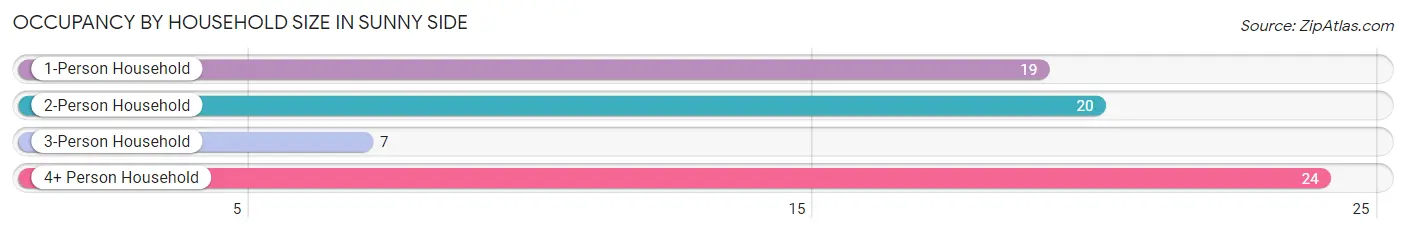
| Household Size | # Housing Units | % Housing Units |
| 1-Person Household | 19 | 27.1% |
| 2-Person Household | 20 | 28.6% |
| 3-Person Household | 7 | 10.0% |
| 4+ Person Household | 24 | 34.3% |
| Total Housing Units | 70 | 100.0% |
Occupancy by Ownership by Household Size in Sunny Side
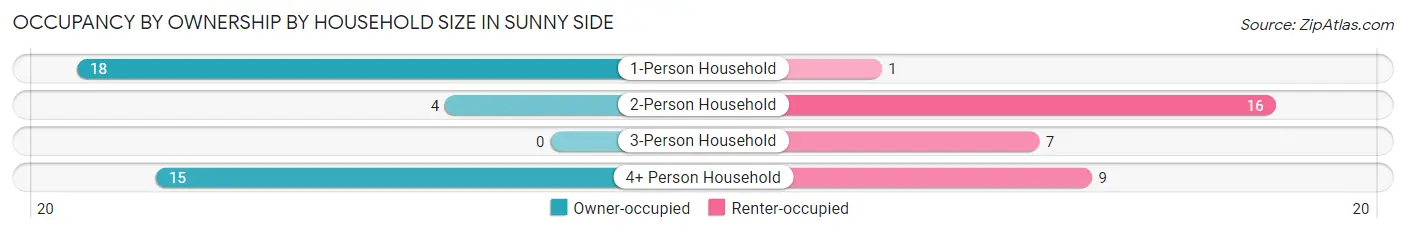
| Household Size | Owner-occupied | Renter-occupied |
| 1-Person Household | 18 (94.7%) | 1 (5.3%) |
| 2-Person Household | 4 (20.0%) | 16 (80.0%) |
| 3-Person Household | 0 (0.0%) | 7 (100.0%) |
| 4+ Person Household | 15 (62.5%) | 9 (37.5%) |
| Total Housing Units | 37 (52.9%) | 33 (47.1%) |
Occupancy by Educational Attainment in Sunny Side
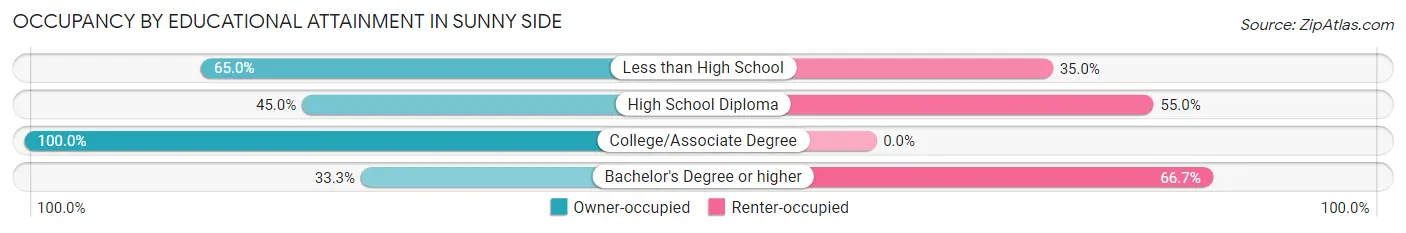
| Household Size | Owner-occupied | Renter-occupied |
| Less than High School | 13 (65.0%) | 7 (35.0%) |
| High School Diploma | 18 (45.0%) | 22 (55.0%) |
| College/Associate Degree | 4 (100.0%) | 0 (0.0%) |
| Bachelor's Degree or higher | 2 (33.3%) | 4 (66.7%) |
Occupancy by Age of Householder in Sunny Side
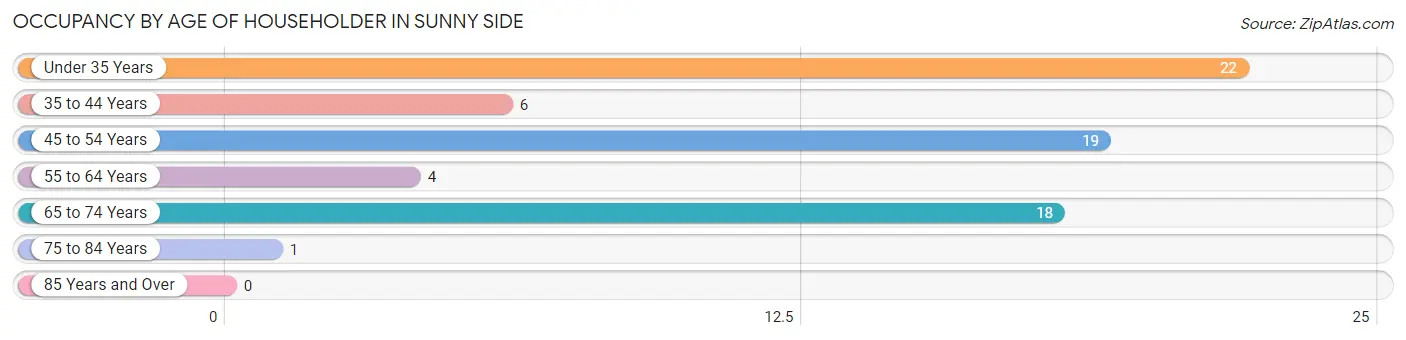
| Age Bracket | # Households | % Households |
| Under 35 Years | 22 | 31.4% |
| 35 to 44 Years | 6 | 8.6% |
| 45 to 54 Years | 19 | 27.1% |
| 55 to 64 Years | 4 | 5.7% |
| 65 to 74 Years | 18 | 25.7% |
| 75 to 84 Years | 1 | 1.4% |
| 85 Years and Over | 0 | 0.0% |
| Total | 70 | 100.0% |
Housing Finances in Sunny Side
Median Income by Occupancy in Sunny Side
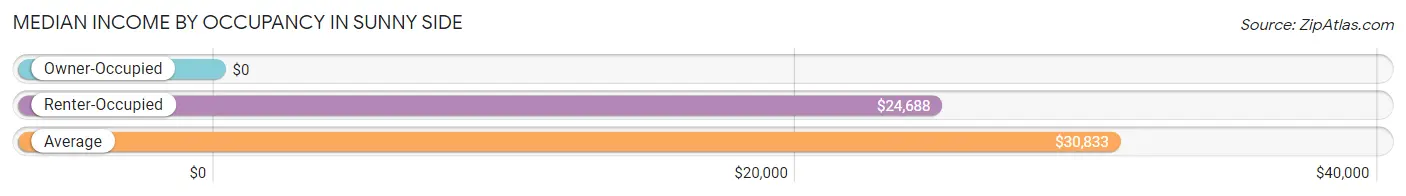
| Occupancy Type | # Households | Median Income |
| Owner-Occupied | 37 (52.9%) | $0 |
| Renter-Occupied | 33 (47.1%) | $24,688 |
| Average | 70 (100.0%) | $30,833 |
Occupancy by Householder Income Bracket in Sunny Side
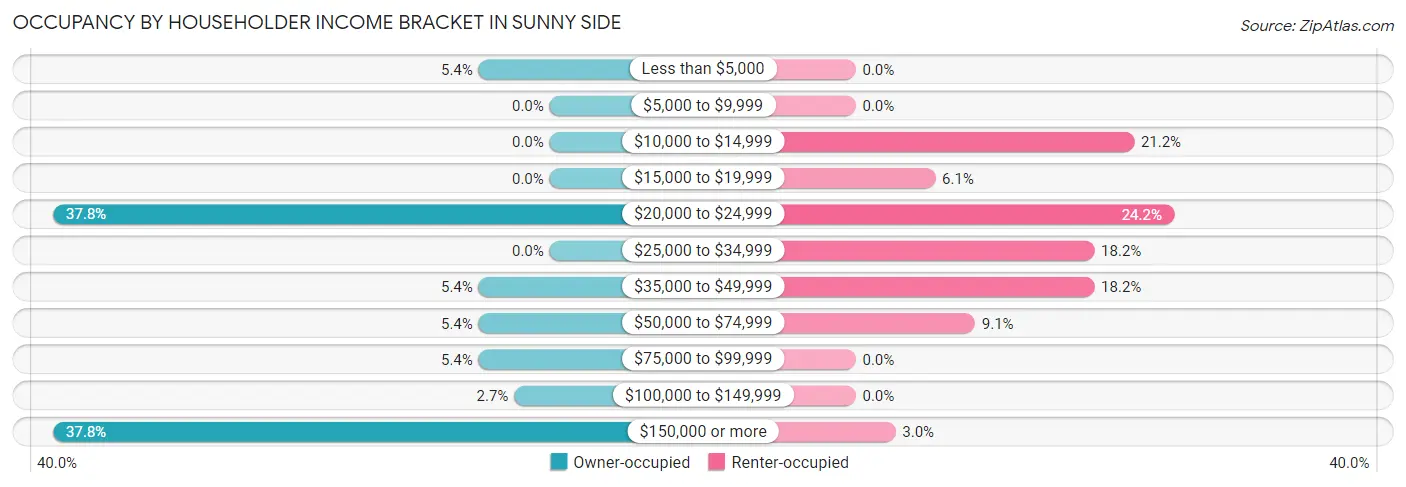
| Income Bracket | Owner-occupied | Renter-occupied |
| Less than $5,000 | 2 (5.4%) | 0 (0.0%) |
| $5,000 to $9,999 | 0 (0.0%) | 0 (0.0%) |
| $10,000 to $14,999 | 0 (0.0%) | 7 (21.2%) |
| $15,000 to $19,999 | 0 (0.0%) | 2 (6.1%) |
| $20,000 to $24,999 | 14 (37.8%) | 8 (24.2%) |
| $25,000 to $34,999 | 0 (0.0%) | 6 (18.2%) |
| $35,000 to $49,999 | 2 (5.4%) | 6 (18.2%) |
| $50,000 to $74,999 | 2 (5.4%) | 3 (9.1%) |
| $75,000 to $99,999 | 2 (5.4%) | 0 (0.0%) |
| $100,000 to $149,999 | 1 (2.7%) | 0 (0.0%) |
| $150,000 or more | 14 (37.8%) | 1 (3.0%) |
| Total | 37 (100.0%) | 33 (100.0%) |
Monthly Housing Cost Tiers in Sunny Side
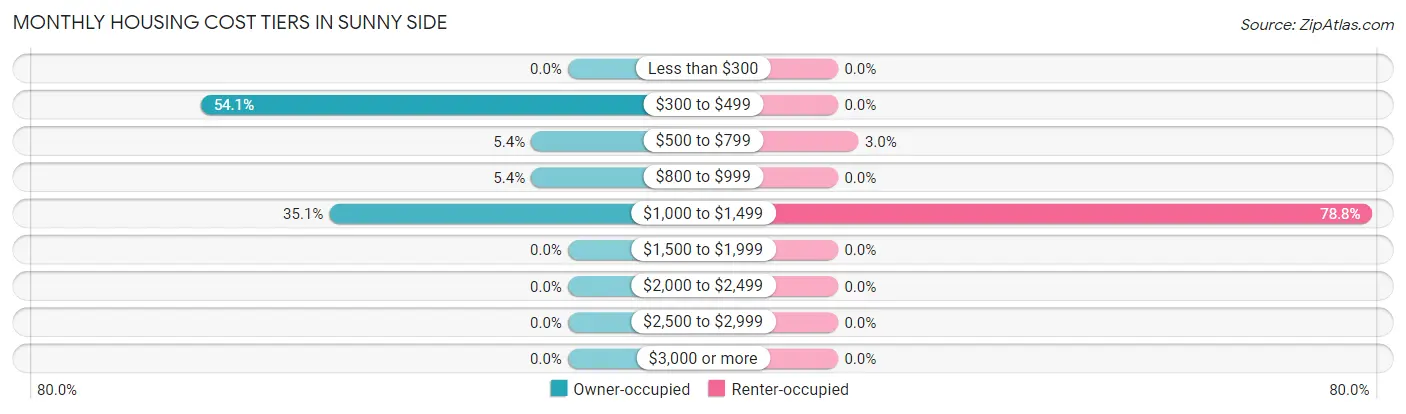
| Monthly Cost | Owner-occupied | Renter-occupied |
| Less than $300 | 0 (0.0%) | 0 (0.0%) |
| $300 to $499 | 20 (54.0%) | 0 (0.0%) |
| $500 to $799 | 2 (5.4%) | 1 (3.0%) |
| $800 to $999 | 2 (5.4%) | 0 (0.0%) |
| $1,000 to $1,499 | 13 (35.1%) | 26 (78.8%) |
| $1,500 to $1,999 | 0 (0.0%) | 0 (0.0%) |
| $2,000 to $2,499 | 0 (0.0%) | 0 (0.0%) |
| $2,500 to $2,999 | 0 (0.0%) | 0 (0.0%) |
| $3,000 or more | 0 (0.0%) | 0 (0.0%) |
| Total | 37 (100.0%) | 33 (100.0%) |
Physical Housing Characteristics in Sunny Side
Housing Structures in Sunny Side
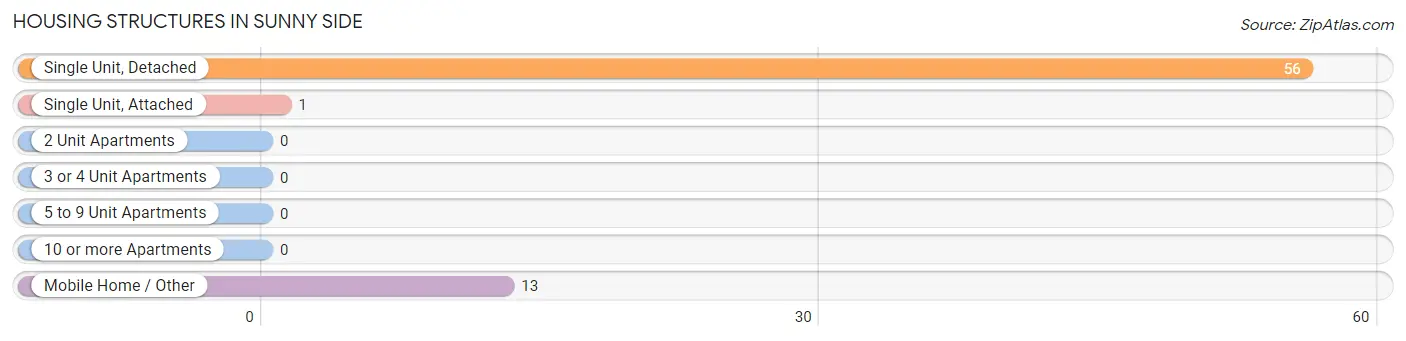
| Structure Type | # Housing Units | % Housing Units |
| Single Unit, Detached | 56 | 80.0% |
| Single Unit, Attached | 1 | 1.4% |
| 2 Unit Apartments | 0 | 0.0% |
| 3 or 4 Unit Apartments | 0 | 0.0% |
| 5 to 9 Unit Apartments | 0 | 0.0% |
| 10 or more Apartments | 0 | 0.0% |
| Mobile Home / Other | 13 | 18.6% |
| Total | 70 | 100.0% |
Housing Structures by Occupancy in Sunny Side
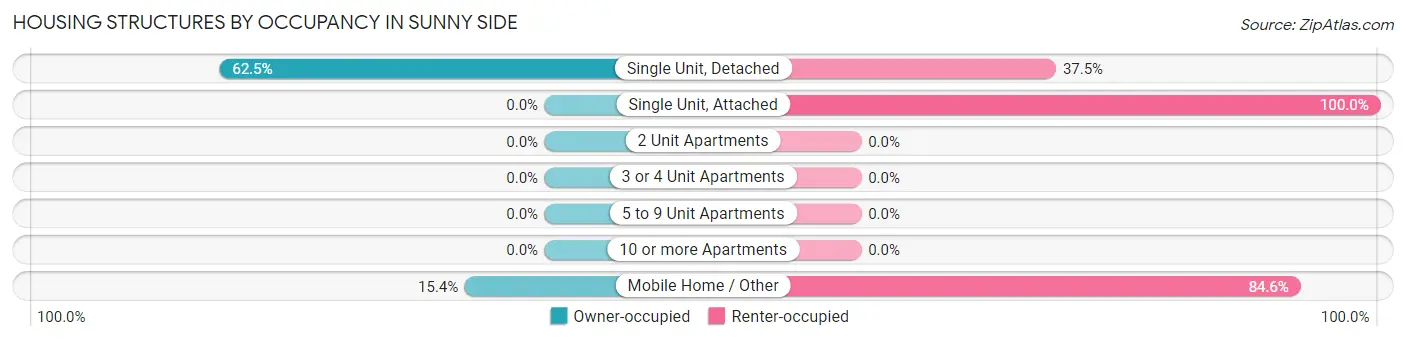
| Structure Type | Owner-occupied | Renter-occupied |
| Single Unit, Detached | 35 (62.5%) | 21 (37.5%) |
| Single Unit, Attached | 0 (0.0%) | 1 (100.0%) |
| 2 Unit Apartments | 0 (0.0%) | 0 (0.0%) |
| 3 or 4 Unit Apartments | 0 (0.0%) | 0 (0.0%) |
| 5 to 9 Unit Apartments | 0 (0.0%) | 0 (0.0%) |
| 10 or more Apartments | 0 (0.0%) | 0 (0.0%) |
| Mobile Home / Other | 2 (15.4%) | 11 (84.6%) |
| Total | 37 (52.9%) | 33 (47.1%) |
Housing Structures by Number of Rooms in Sunny Side
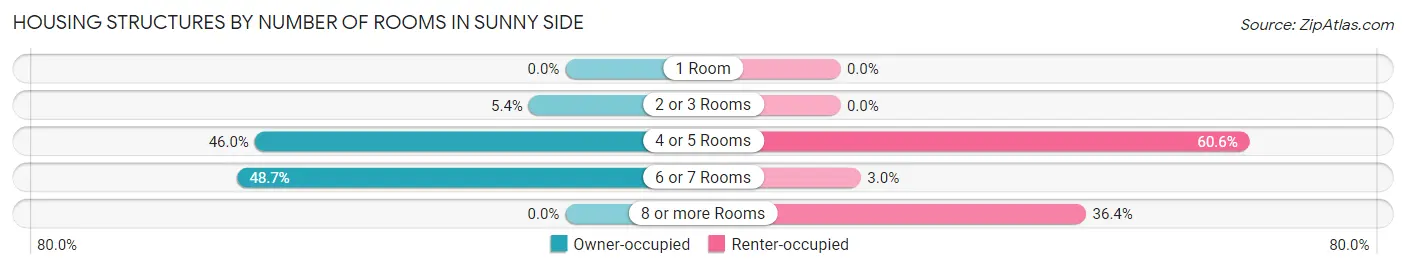
| Number of Rooms | Owner-occupied | Renter-occupied |
| 1 Room | 0 (0.0%) | 0 (0.0%) |
| 2 or 3 Rooms | 2 (5.4%) | 0 (0.0%) |
| 4 or 5 Rooms | 17 (46.0%) | 20 (60.6%) |
| 6 or 7 Rooms | 18 (48.6%) | 1 (3.0%) |
| 8 or more Rooms | 0 (0.0%) | 12 (36.4%) |
| Total | 37 (100.0%) | 33 (100.0%) |
Housing Structure by Heating Type in Sunny Side
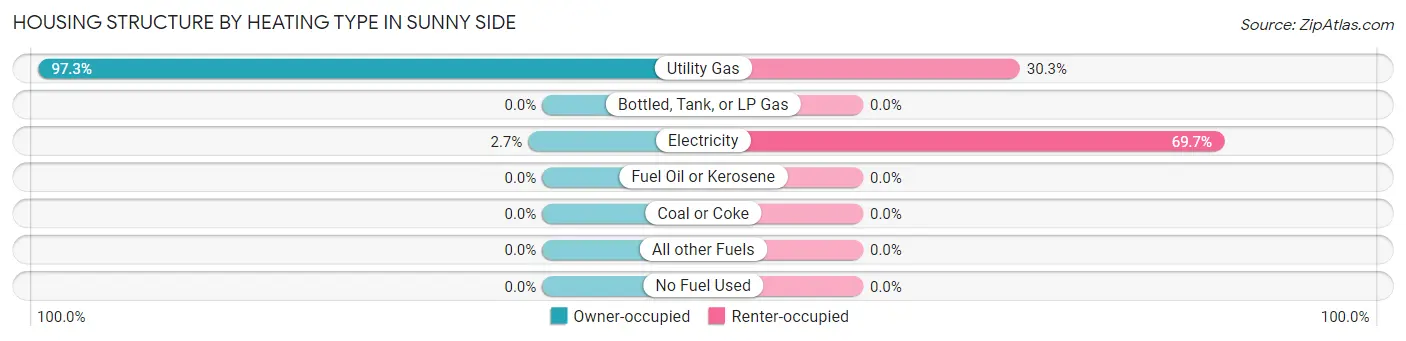
| Heating Type | Owner-occupied | Renter-occupied |
| Utility Gas | 36 (97.3%) | 10 (30.3%) |
| Bottled, Tank, or LP Gas | 0 (0.0%) | 0 (0.0%) |
| Electricity | 1 (2.7%) | 23 (69.7%) |
| Fuel Oil or Kerosene | 0 (0.0%) | 0 (0.0%) |
| Coal or Coke | 0 (0.0%) | 0 (0.0%) |
| All other Fuels | 0 (0.0%) | 0 (0.0%) |
| No Fuel Used | 0 (0.0%) | 0 (0.0%) |
| Total | 37 (100.0%) | 33 (100.0%) |
Household Vehicle Usage in Sunny Side
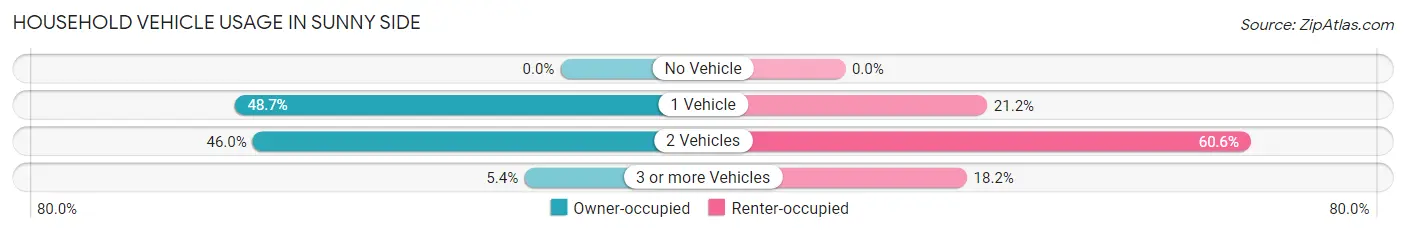
| Vehicles per Household | Owner-occupied | Renter-occupied |
| No Vehicle | 0 (0.0%) | 0 (0.0%) |
| 1 Vehicle | 18 (48.6%) | 7 (21.2%) |
| 2 Vehicles | 17 (46.0%) | 20 (60.6%) |
| 3 or more Vehicles | 2 (5.4%) | 6 (18.2%) |
| Total | 37 (100.0%) | 33 (100.0%) |
Real Estate & Mortgages in Sunny Side
Real Estate and Mortgage Overview in Sunny Side
| Characteristic | Without Mortgage | With Mortgage |
| Housing Units | 22 | 15 |
| Median Property Value | $108,900 | $0 |
| Median Household Income | - | - |
| Monthly Housing Costs | $436 | $0 |
| Real Estate Taxes | $693 | $0 |
Property Value by Mortgage Status in Sunny Side
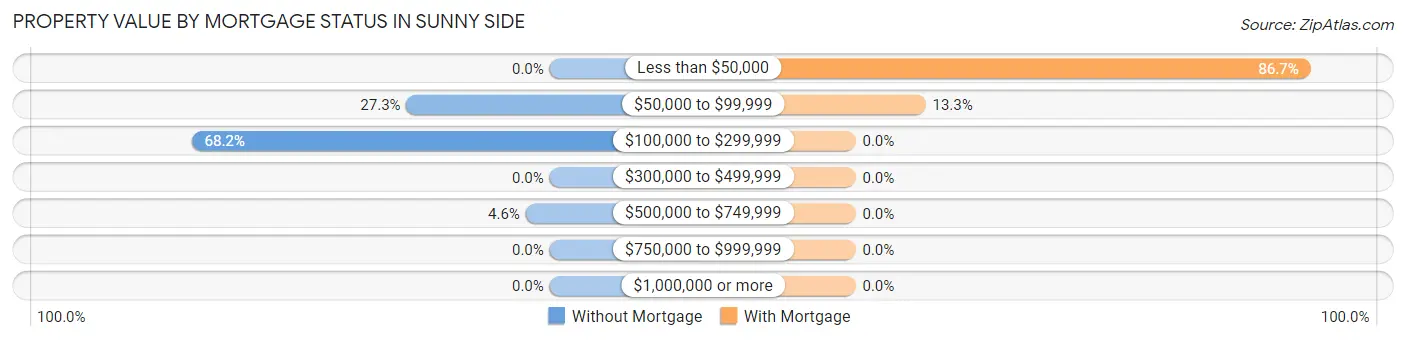
| Property Value | Without Mortgage | With Mortgage |
| Less than $50,000 | 0 (0.0%) | 13 (86.7%) |
| $50,000 to $99,999 | 6 (27.3%) | 2 (13.3%) |
| $100,000 to $299,999 | 15 (68.2%) | 0 (0.0%) |
| $300,000 to $499,999 | 0 (0.0%) | 0 (0.0%) |
| $500,000 to $749,999 | 1 (4.5%) | 0 (0.0%) |
| $750,000 to $999,999 | 0 (0.0%) | 0 (0.0%) |
| $1,000,000 or more | 0 (0.0%) | 0 (0.0%) |
| Total | 22 (100.0%) | 15 (100.0%) |
Household Income by Mortgage Status in Sunny Side
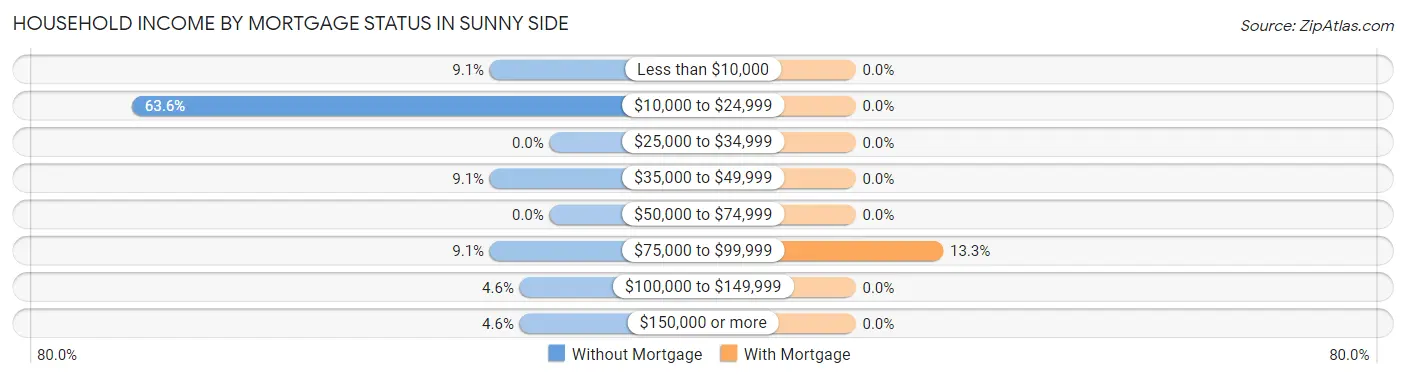
| Household Income | Without Mortgage | With Mortgage |
| Less than $10,000 | 2 (9.1%) | 0 (0.0%) |
| $10,000 to $24,999 | 14 (63.6%) | 0 (0.0%) |
| $25,000 to $34,999 | 0 (0.0%) | 0 (0.0%) |
| $35,000 to $49,999 | 2 (9.1%) | 0 (0.0%) |
| $50,000 to $74,999 | 0 (0.0%) | 0 (0.0%) |
| $75,000 to $99,999 | 2 (9.1%) | 2 (13.3%) |
| $100,000 to $149,999 | 1 (4.5%) | 0 (0.0%) |
| $150,000 or more | 1 (4.5%) | 0 (0.0%) |
| Total | 22 (100.0%) | 15 (100.0%) |
Property Value to Household Income Ratio in Sunny Side
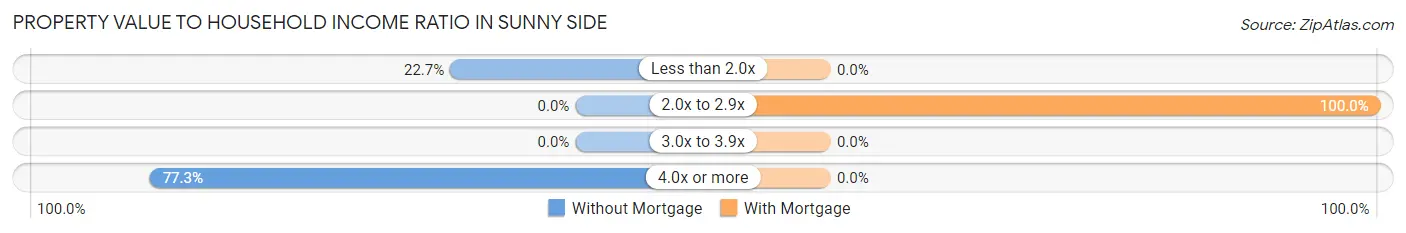
| Value-to-Income Ratio | Without Mortgage | With Mortgage |
| Less than 2.0x | 5 (22.7%) | 0 (0.0%) |
| 2.0x to 2.9x | 0 (0.0%) | 15 (100.0%) |
| 3.0x to 3.9x | 0 (0.0%) | 0 (0.0%) |
| 4.0x or more | 17 (77.3%) | 0 (0.0%) |
| Total | 22 (100.0%) | 15 (100.0%) |
Real Estate Taxes by Mortgage Status in Sunny Side
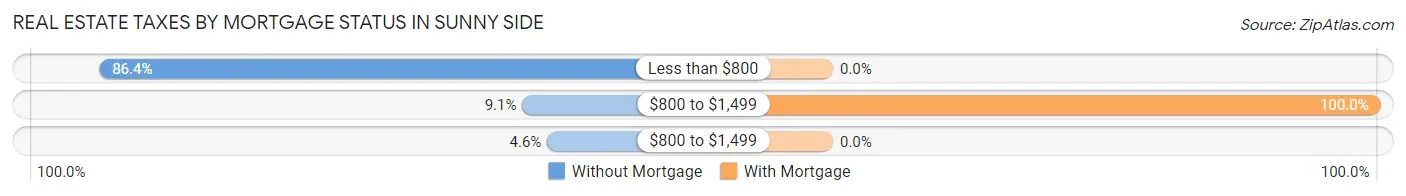
| Property Taxes | Without Mortgage | With Mortgage |
| Less than $800 | 19 (86.4%) | 0 (0.0%) |
| $800 to $1,499 | 2 (9.1%) | 15 (100.0%) |
| $800 to $1,499 | 1 (4.5%) | 0 (0.0%) |
| Total | 22 (100.0%) | 15 (100.0%) |
Health & Disability in Sunny Side
Health Insurance Coverage by Age in Sunny Side
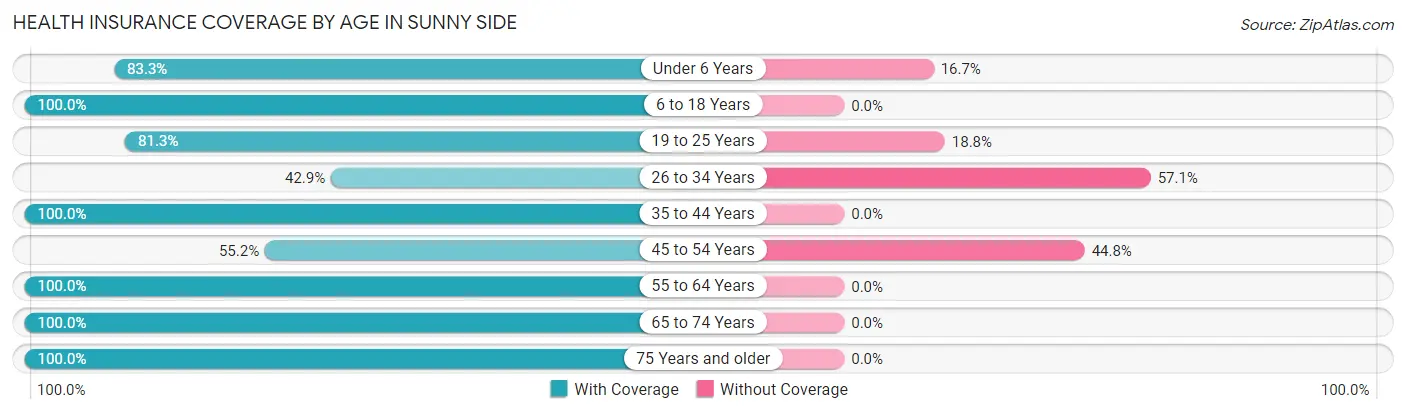
| Age Bracket | With Coverage | Without Coverage |
| Under 6 Years | 20 (83.3%) | 4 (16.7%) |
| 6 to 18 Years | 41 (100.0%) | 0 (0.0%) |
| 19 to 25 Years | 13 (81.2%) | 3 (18.8%) |
| 26 to 34 Years | 9 (42.9%) | 12 (57.1%) |
| 35 to 44 Years | 6 (100.0%) | 0 (0.0%) |
| 45 to 54 Years | 16 (55.2%) | 13 (44.8%) |
| 55 to 64 Years | 11 (100.0%) | 0 (0.0%) |
| 65 to 74 Years | 25 (100.0%) | 0 (0.0%) |
| 75 Years and older | 1 (100.0%) | 0 (0.0%) |
| Total | 142 (81.6%) | 32 (18.4%) |
Health Insurance Coverage by Citizenship Status in Sunny Side
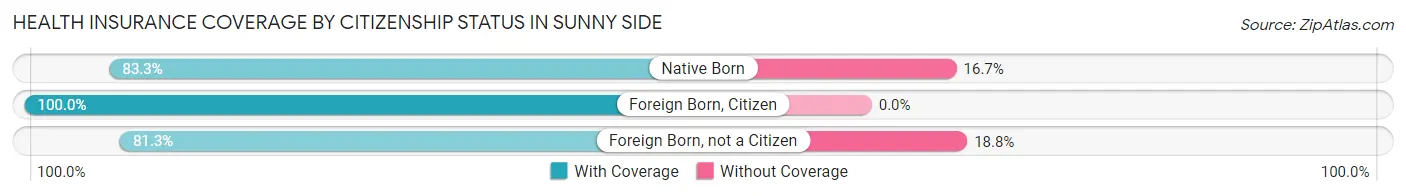
| Citizenship Status | With Coverage | Without Coverage |
| Native Born | 20 (83.3%) | 4 (16.7%) |
| Foreign Born, Citizen | 41 (100.0%) | 0 (0.0%) |
| Foreign Born, not a Citizen | 13 (81.2%) | 3 (18.8%) |
Health Insurance Coverage by Household Income in Sunny Side
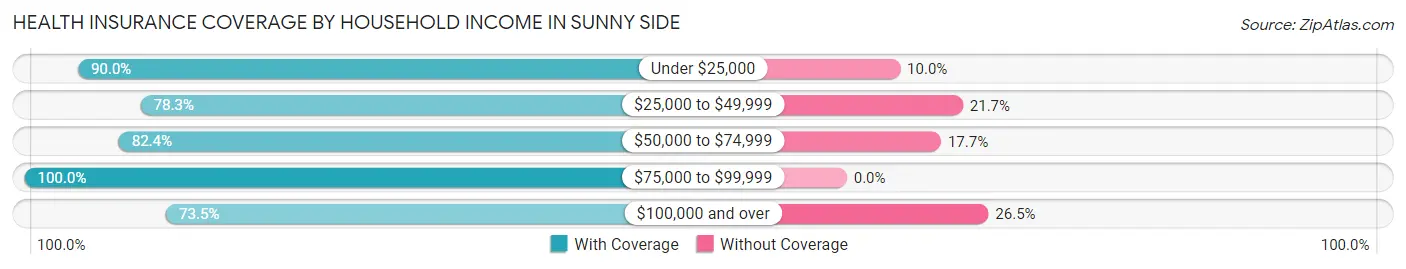
| Household Income | With Coverage | Without Coverage |
| Under $25,000 | 54 (90.0%) | 6 (10.0%) |
| $25,000 to $49,999 | 36 (78.3%) | 10 (21.7%) |
| $50,000 to $74,999 | 14 (82.4%) | 3 (17.6%) |
| $75,000 to $99,999 | 2 (100.0%) | 0 (0.0%) |
| $100,000 and over | 36 (73.5%) | 13 (26.5%) |
Public vs Private Health Insurance Coverage by Age in Sunny Side
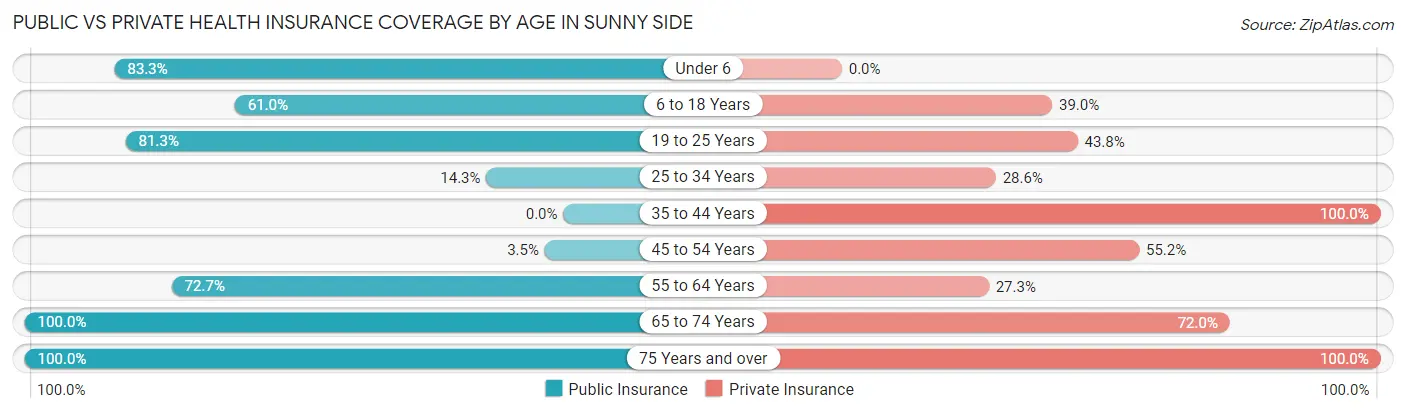
| Age Bracket | Public Insurance | Private Insurance |
| Under 6 | 20 (83.3%) | 0 (0.0%) |
| 6 to 18 Years | 25 (61.0%) | 16 (39.0%) |
| 19 to 25 Years | 13 (81.2%) | 7 (43.8%) |
| 25 to 34 Years | 3 (14.3%) | 6 (28.6%) |
| 35 to 44 Years | 0 (0.0%) | 6 (100.0%) |
| 45 to 54 Years | 1 (3.5%) | 16 (55.2%) |
| 55 to 64 Years | 8 (72.7%) | 3 (27.3%) |
| 65 to 74 Years | 25 (100.0%) | 18 (72.0%) |
| 75 Years and over | 1 (100.0%) | 1 (100.0%) |
| Total | 96 (55.2%) | 73 (41.9%) |
Disability Status by Sex by Age in Sunny Side
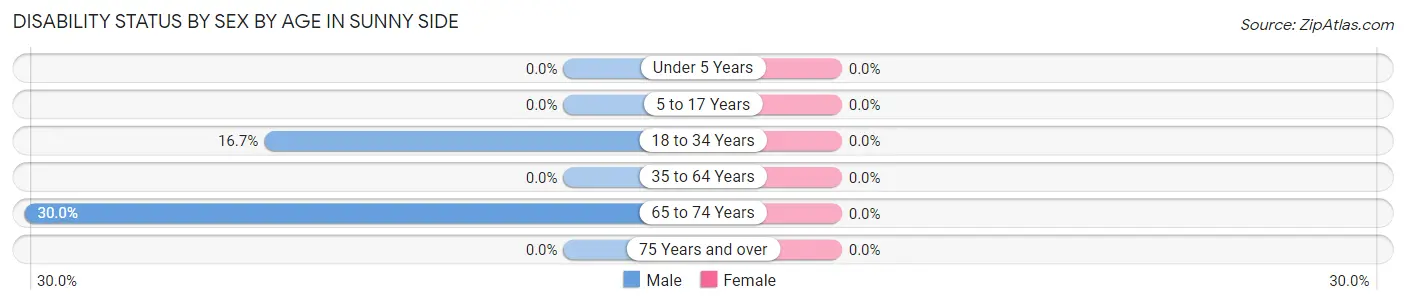
| Age Bracket | Male | Female |
| Under 5 Years | 0 (0.0%) | 0 (0.0%) |
| 5 to 17 Years | 0 (0.0%) | 0 (0.0%) |
| 18 to 34 Years | 3 (16.7%) | 0 (0.0%) |
| 35 to 64 Years | 0 (0.0%) | 0 (0.0%) |
| 65 to 74 Years | 3 (30.0%) | 0 (0.0%) |
| 75 Years and over | 0 (0.0%) | 0 (0.0%) |
Disability Class by Sex by Age in Sunny Side
Disability Class: Hearing Difficulty
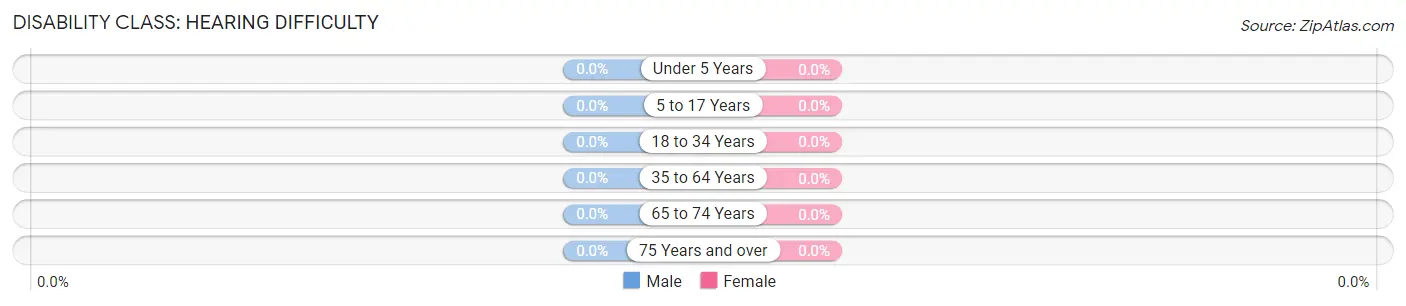
| Age Bracket | Male | Female |
| Under 5 Years | 0 (0.0%) | 0 (0.0%) |
| 5 to 17 Years | 0 (0.0%) | 0 (0.0%) |
| 18 to 34 Years | 0 (0.0%) | 0 (0.0%) |
| 35 to 64 Years | 0 (0.0%) | 0 (0.0%) |
| 65 to 74 Years | 0 (0.0%) | 0 (0.0%) |
| 75 Years and over | 0 (0.0%) | 0 (0.0%) |
Disability Class: Vision Difficulty
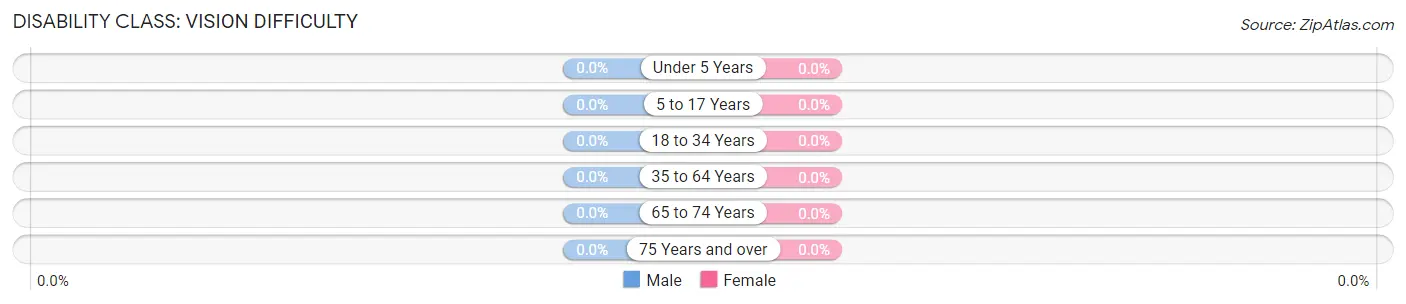
| Age Bracket | Male | Female |
| Under 5 Years | 0 (0.0%) | 0 (0.0%) |
| 5 to 17 Years | 0 (0.0%) | 0 (0.0%) |
| 18 to 34 Years | 0 (0.0%) | 0 (0.0%) |
| 35 to 64 Years | 0 (0.0%) | 0 (0.0%) |
| 65 to 74 Years | 0 (0.0%) | 0 (0.0%) |
| 75 Years and over | 0 (0.0%) | 0 (0.0%) |
Disability Class: Cognitive Difficulty
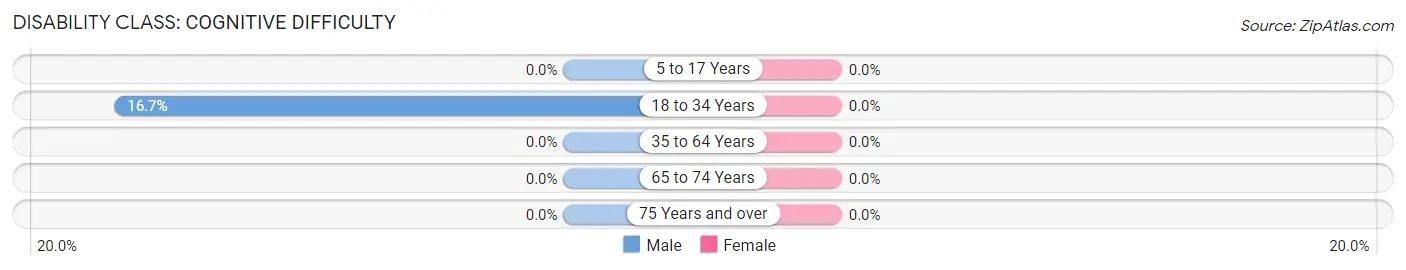
| Age Bracket | Male | Female |
| 5 to 17 Years | 0 (0.0%) | 0 (0.0%) |
| 18 to 34 Years | 3 (16.7%) | 0 (0.0%) |
| 35 to 64 Years | 0 (0.0%) | 0 (0.0%) |
| 65 to 74 Years | 0 (0.0%) | 0 (0.0%) |
| 75 Years and over | 0 (0.0%) | 0 (0.0%) |
Disability Class: Ambulatory Difficulty
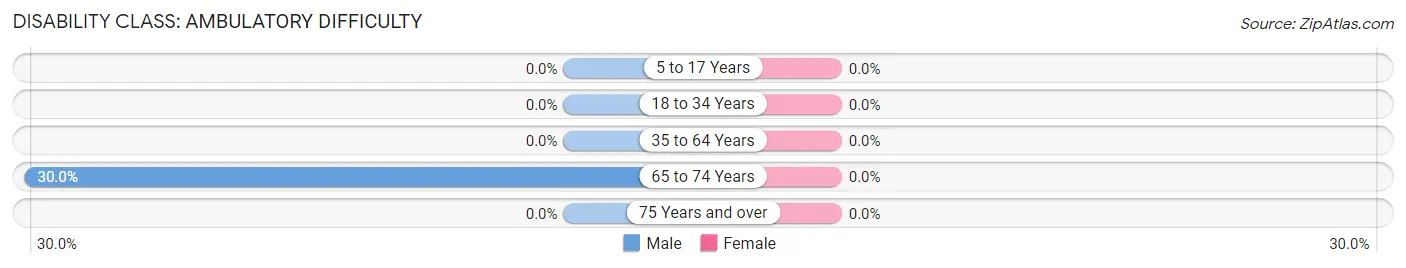
| Age Bracket | Male | Female |
| 5 to 17 Years | 0 (0.0%) | 0 (0.0%) |
| 18 to 34 Years | 0 (0.0%) | 0 (0.0%) |
| 35 to 64 Years | 0 (0.0%) | 0 (0.0%) |
| 65 to 74 Years | 3 (30.0%) | 0 (0.0%) |
| 75 Years and over | 0 (0.0%) | 0 (0.0%) |
Disability Class: Self-Care Difficulty
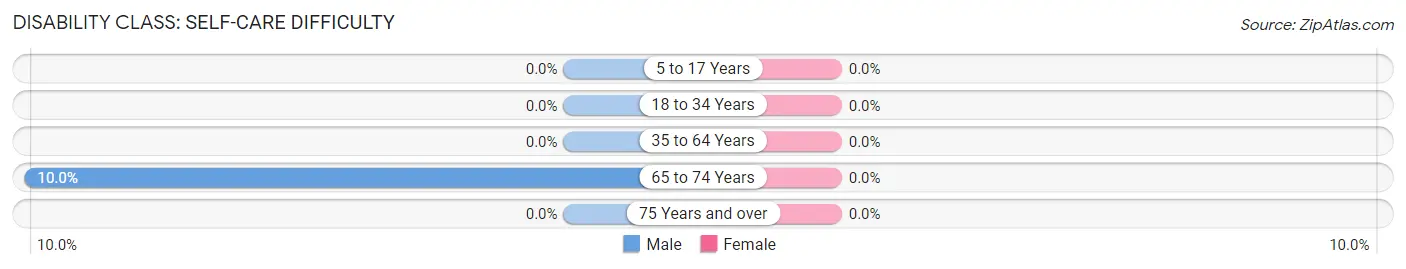
| Age Bracket | Male | Female |
| 5 to 17 Years | 0 (0.0%) | 0 (0.0%) |
| 18 to 34 Years | 0 (0.0%) | 0 (0.0%) |
| 35 to 64 Years | 0 (0.0%) | 0 (0.0%) |
| 65 to 74 Years | 1 (10.0%) | 0 (0.0%) |
| 75 Years and over | 0 (0.0%) | 0 (0.0%) |
Technology Access in Sunny Side
Computing Device Access in Sunny Side
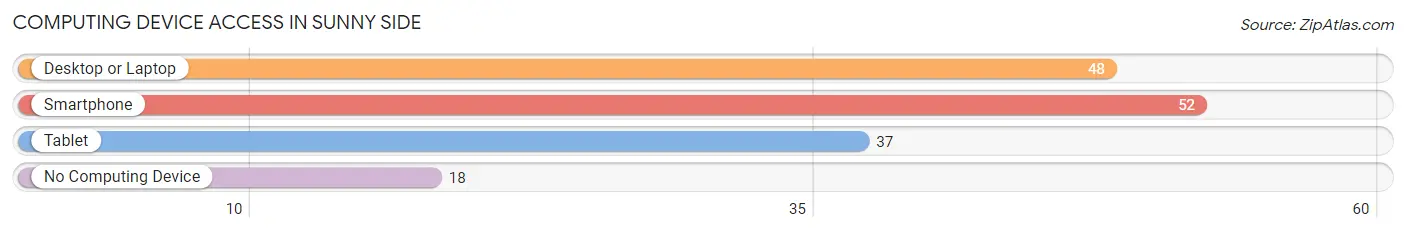
| Device Type | # Households | % Households |
| Desktop or Laptop | 48 | 68.6% |
| Smartphone | 52 | 74.3% |
| Tablet | 37 | 52.9% |
| No Computing Device | 18 | 25.7% |
| Total | 70 | 100.0% |
Internet Access in Sunny Side
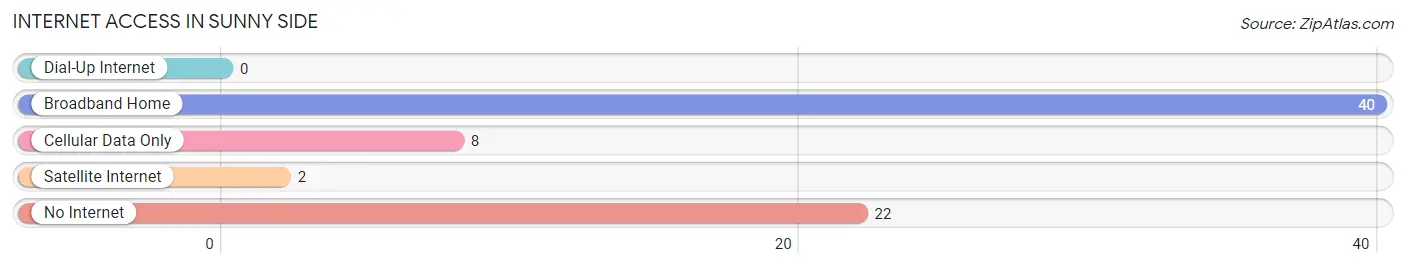
| Internet Type | # Households | % Households |
| Dial-Up Internet | 0 | 0.0% |
| Broadband Home | 40 | 57.1% |
| Cellular Data Only | 8 | 11.4% |
| Satellite Internet | 2 | 2.9% |
| No Internet | 22 | 31.4% |
| Total | 70 | 100.0% |
Sunny Side Summary
Sunny Side, Georgia is a small town located in the south-central part of the state, about 30 miles south of Atlanta. It is part of the Atlanta metropolitan area and is situated in the foothills of the Appalachian Mountains. The town has a population of approximately 4,000 people and is known for its rural charm and friendly atmosphere.
History
Sunny Side was founded in 1820 by a group of settlers from North Carolina. The town was originally called “Sunny Side of the Mountain” due to its location in the foothills of the Appalachian Mountains. The town was incorporated in 1872 and was named after the sunny side of the mountain.
The town was a small farming community until the late 19th century when the railroad came through. This allowed for the development of the town and the growth of the local economy. The town was also home to a number of mills and factories, which provided employment for many of the town’s residents.
In the early 20th century, Sunny Side was a popular tourist destination due to its proximity to Atlanta and the surrounding mountains. The town was also home to a number of resorts and hotels, which attracted visitors from all over the country.
Geography
Sunny Side is located in the south-central part of Georgia, about 30 miles south of Atlanta. The town is situated in the foothills of the Appalachian Mountains and is surrounded by rolling hills and forests. The town is located on the banks of the Chattahoochee River, which provides a scenic backdrop for the town.
The climate in Sunny Side is mild and temperate, with hot summers and mild winters. The average temperature in the summer is around 80 degrees Fahrenheit, while the average temperature in the winter is around 50 degrees Fahrenheit.
Economy
Sunny Side’s economy is largely based on agriculture and tourism. The town is home to a number of farms, which produce a variety of crops, including corn, soybeans, and cotton. The town is also home to a number of tourist attractions, including the Sunny Side Museum, which showcases the town’s history and culture.
The town is also home to a number of small businesses, including restaurants, shops, and other services. The town is also home to a number of manufacturing companies, which provide employment for many of the town’s residents.
Demographics
As of the 2010 census, the population of Sunny Side was 4,000 people. The town is predominantly white, with a small African American population. The median household income in the town is $45,000, and the median age is 37 years old.
Sunny Side is a small town with a friendly atmosphere and a strong sense of community. The town is home to a number of churches, schools, and other organizations, which provide a sense of community and support for the town’s residents. The town is also home to a number of parks and recreational areas, which provide a place for residents to relax and enjoy the outdoors.
Common Questions
What is the Total Population of Sunny Side?
Total Population of Sunny Side is 174.
What is the Total Male Population of Sunny Side?
Total Male Population of Sunny Side is 83.
What is the Total Female Population of Sunny Side?
Total Female Population of Sunny Side is 91.
What is the Ratio of Males per 100 Females in Sunny Side?
There are 91.21 Males per 100 Females in Sunny Side.
What is the Ratio of Females per 100 Males in Sunny Side?
There are 109.64 Females per 100 Males in Sunny Side.
What is the Median Population Age in Sunny Side?
Median Population Age in Sunny Side is 29.5 Years.
What is the Average Family Size in Sunny Side
Average Family Size in Sunny Side is 3.0 People.
What is the Average Household Size in Sunny Side
Average Household Size in Sunny Side is 2.5 People.
What is Per Capita Income in Sunny Side?
Per Capita income in Sunny Side is $23,151.
What is the Median Household income in Sunny Side?
Median Household Income in Sunny Side is $30,833.
What is Inequality or Gini Index in Sunny Side?
Inequality or Gini Index in Sunny Side is 0.51.
How Large is the Labor Force in Sunny Side?
There are 65 People in the Labor Forcein in Sunny Side.
What is the Percentage of People in the Labor Force in Sunny Side?
59.6% of People are in the Labor Force in Sunny Side.
What is the Unemployment Rate in Sunny Side?
Unemployment Rate in Sunny Side is 1.5%.