Sumner, GA
Sumner Map
Sumner Overview
404
TOTAL POPULATION
169
MALE POPULATION
235
FEMALE POPULATION
71.91
MALES / 100 FEMALES
139.05
FEMALES / 100 MALES
40.0
MEDIAN AGE
3.3
AVG FAMILY SIZE
2.6
AVG HOUSEHOLD SIZE
$24,658
PER CAPITA INCOME
$52,500
AVG FAMILY INCOME
$46,786
AVG HOUSEHOLD INCOME
0.43
INEQUALITY / GINI INDEX
170
LABOR FORCE [ PEOPLE ]
53.1%
PERCENT IN LABOR FORCE
3.5%
UNEMPLOYMENT RATE
Sumner Zip Codes
Sumner Area Codes
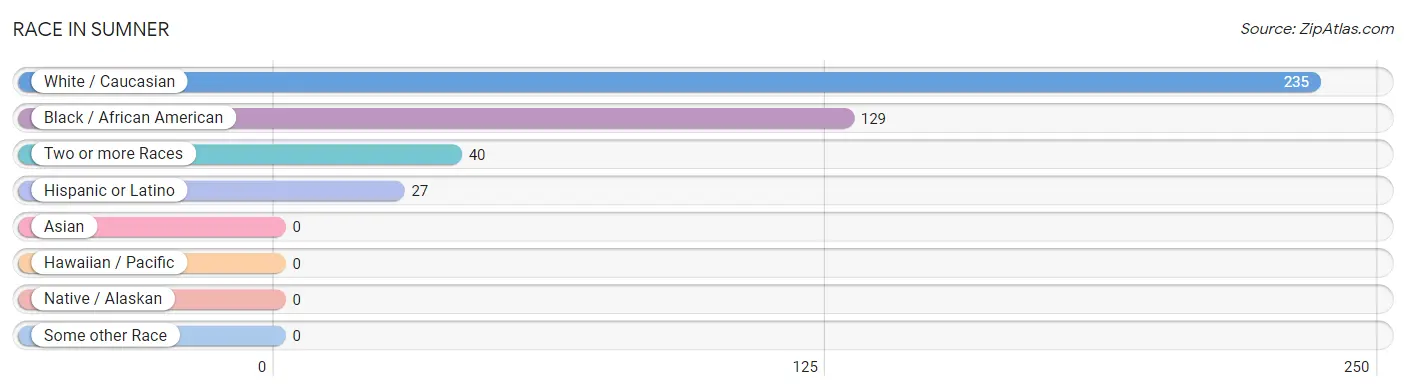
Race in Sumner
The most populous races in Sumner are White / Caucasian (235 | 58.2%), Black / African American (129 | 31.9%), and Two or more Races (40 | 9.9%).
| Race | # Population | % Population |
| Asian | 0 | 0.0% |
| Black / African American | 129 | 31.9% |
| Hawaiian / Pacific | 0 | 0.0% |
| Hispanic or Latino | 27 | 6.7% |
| Native / Alaskan | 0 | 0.0% |
| White / Caucasian | 235 | 58.2% |
| Two or more Races | 40 | 9.9% |
| Some other Race | 0 | 0.0% |
| Total | 404 | 100.0% |
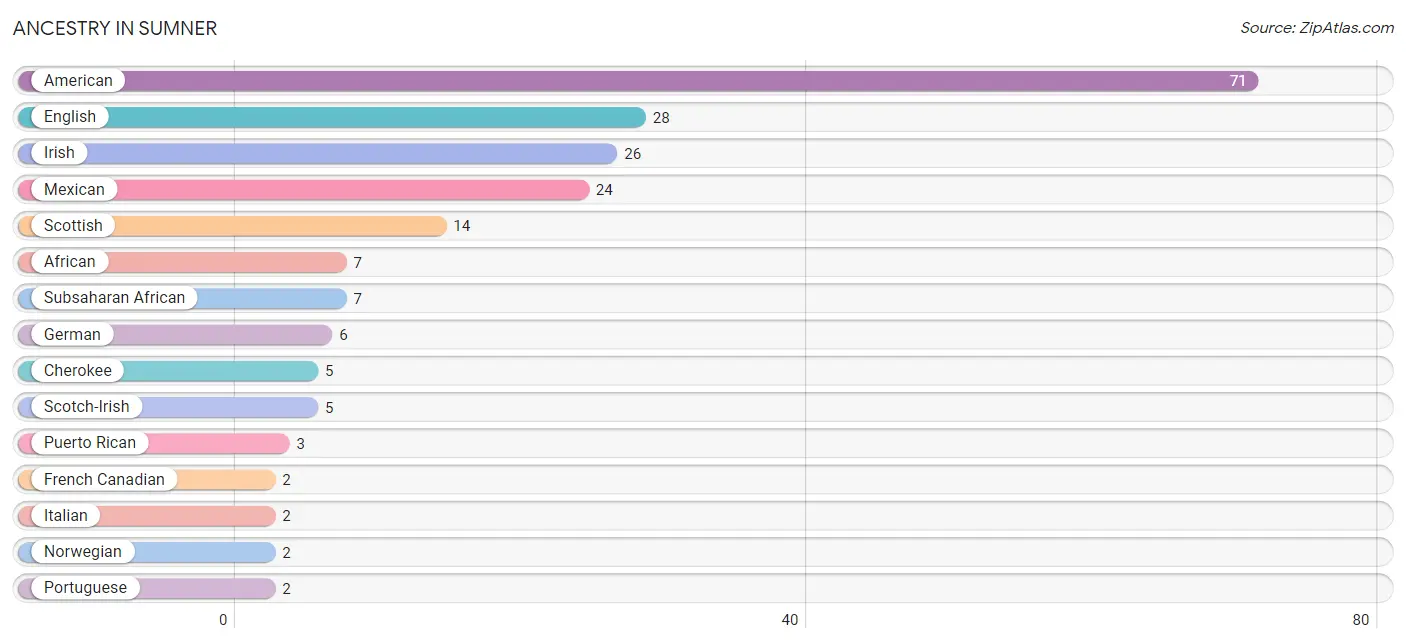
Ancestry in Sumner
The most populous ancestries reported in Sumner are American (71 | 17.6%), English (28 | 6.9%), Irish (26 | 6.4%), Mexican (24 | 5.9%), and Scottish (14 | 3.5%), together accounting for 40.4% of all Sumner residents.
| Ancestry | # Population | % Population |
| African | 7 | 1.7% |
| American | 71 | 17.6% |
| Cherokee | 5 | 1.2% |
| Creek | 1 | 0.3% |
| English | 28 | 6.9% |
| French Canadian | 2 | 0.5% |
| German | 6 | 1.5% |
| Irish | 26 | 6.4% |
| Italian | 2 | 0.5% |
| Mexican | 24 | 5.9% |
| Norwegian | 2 | 0.5% |
| Pakistani | 1 | 0.3% |
| Polish | 1 | 0.3% |
| Portuguese | 2 | 0.5% |
| Puerto Rican | 3 | 0.7% |
| Scotch-Irish | 5 | 1.2% |
| Scottish | 14 | 3.5% |
| Subsaharan African | 7 | 1.7% | View All 18 Rows |
Immigrants in Sumner

| Immigration Origin | # Population | % Population | View All 0 Rows |
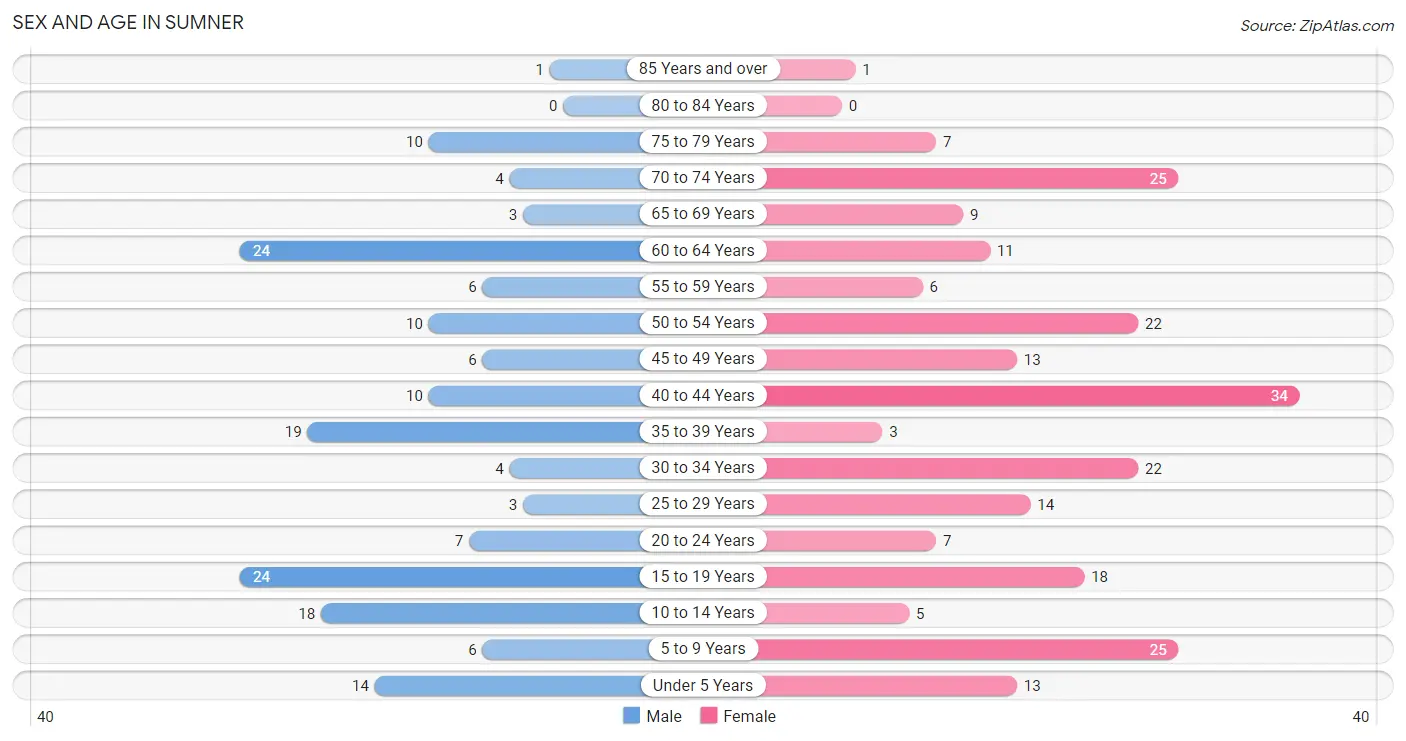
Sex and Age in Sumner
Sex and Age in Sumner
The most populous age groups in Sumner are 15 to 19 Years (24 | 14.2%) for men and 40 to 44 Years (34 | 14.5%) for women.
| Age Bracket | Male | Female |
| Under 5 Years | 14 (8.3%) | 13 (5.5%) |
| 5 to 9 Years | 6 (3.5%) | 25 (10.6%) |
| 10 to 14 Years | 18 (10.6%) | 5 (2.1%) |
| 15 to 19 Years | 24 (14.2%) | 18 (7.7%) |
| 20 to 24 Years | 7 (4.1%) | 7 (3.0%) |
| 25 to 29 Years | 3 (1.8%) | 14 (6.0%) |
| 30 to 34 Years | 4 (2.4%) | 22 (9.4%) |
| 35 to 39 Years | 19 (11.2%) | 3 (1.3%) |
| 40 to 44 Years | 10 (5.9%) | 34 (14.5%) |
| 45 to 49 Years | 6 (3.5%) | 13 (5.5%) |
| 50 to 54 Years | 10 (5.9%) | 22 (9.4%) |
| 55 to 59 Years | 6 (3.5%) | 6 (2.5%) |
| 60 to 64 Years | 24 (14.2%) | 11 (4.7%) |
| 65 to 69 Years | 3 (1.8%) | 9 (3.8%) |
| 70 to 74 Years | 4 (2.4%) | 25 (10.6%) |
| 75 to 79 Years | 10 (5.9%) | 7 (3.0%) |
| 80 to 84 Years | 0 (0.0%) | 0 (0.0%) |
| 85 Years and over | 1 (0.6%) | 1 (0.4%) |
| Total | 169 (100.0%) | 235 (100.0%) |
Families and Households in Sumner
Median Family Size in Sumner
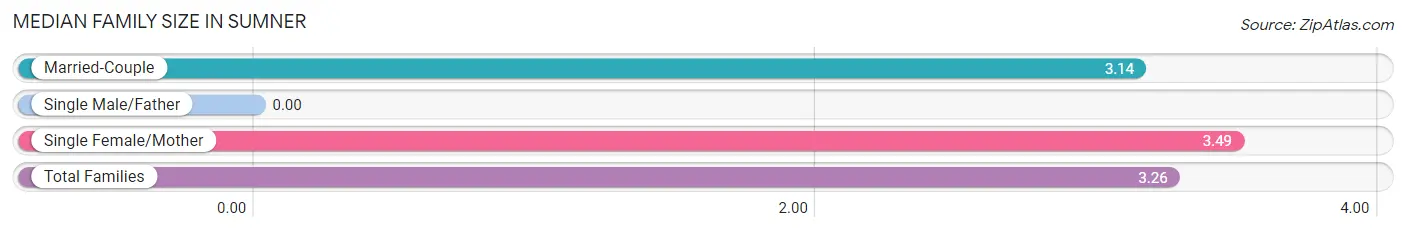
| Family Type | # Families | Family Size |
| Married-Couple | 69 (66.3%) | 3.14 |
| Single Male/Father | 0 (0.0%) | - |
| Single Female/Mother | 35 (33.7%) | 3.49 |
| Total Families | 104 (100.0%) | 3.26 |
Median Household Size in Sumner
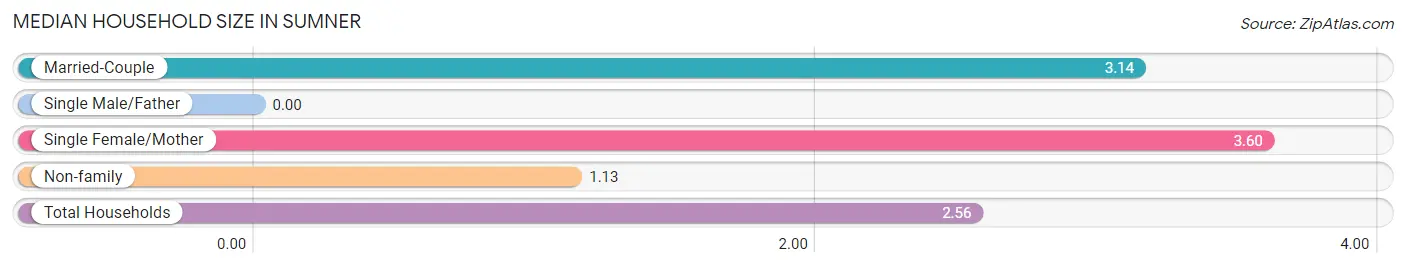
| Household Type | # Households | Household Size |
| Married-Couple | 69 (43.7%) | 3.14 |
| Single Male/Father | 0 (0.0%) | - |
| Single Female/Mother | 35 (22.2%) | 3.60 |
| Non-family | 54 (34.2%) | 1.13 |
| Total Households | 158 (100.0%) | 2.56 |
Household Size by Marriage Status in Sumner
Out of a total of 158 households in Sumner, 104 (65.8%) are family households, while 54 (34.2%) are nonfamily households. The most numerous type of family households are 2-person households, comprising 48, and the most common type of nonfamily households are 1-person households, comprising 48.
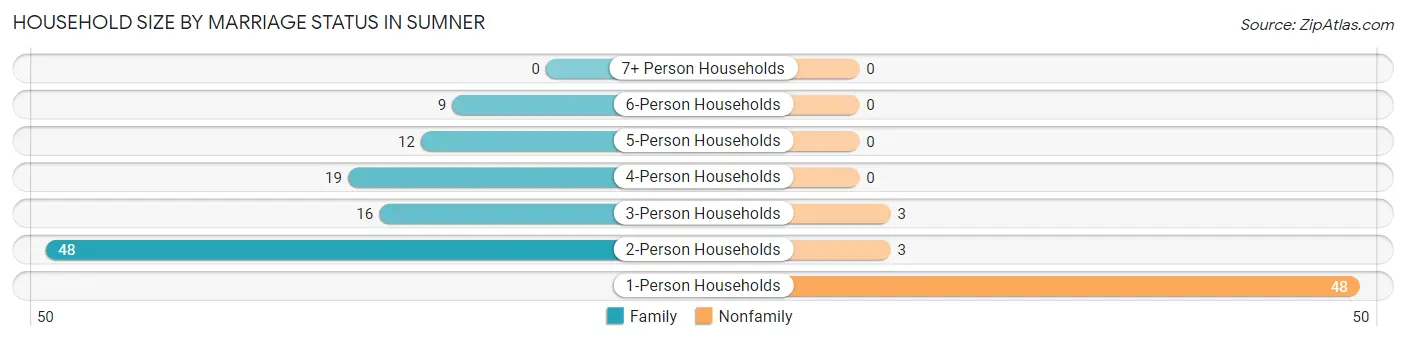
| Household Size | Family Households | Nonfamily Households |
| 1-Person Households | - | 48 (30.4%) |
| 2-Person Households | 48 (30.4%) | 3 (1.9%) |
| 3-Person Households | 16 (10.1%) | 3 (1.9%) |
| 4-Person Households | 19 (12.0%) | 0 (0.0%) |
| 5-Person Households | 12 (7.6%) | 0 (0.0%) |
| 6-Person Households | 9 (5.7%) | 0 (0.0%) |
| 7+ Person Households | 0 (0.0%) | 0 (0.0%) |
| Total | 104 (65.8%) | 54 (34.2%) |
Female Fertility in Sumner
Fertility by Age in Sumner
Average fertility rate in Sumner is 59.0 births per 1,000 women. Women in the age bracket of 20 to 34 years have the highest fertility rate with 163.0 births per 1,000 women. Women in the age bracket of 20 to 34 years acount for 100.0% of all women with births.
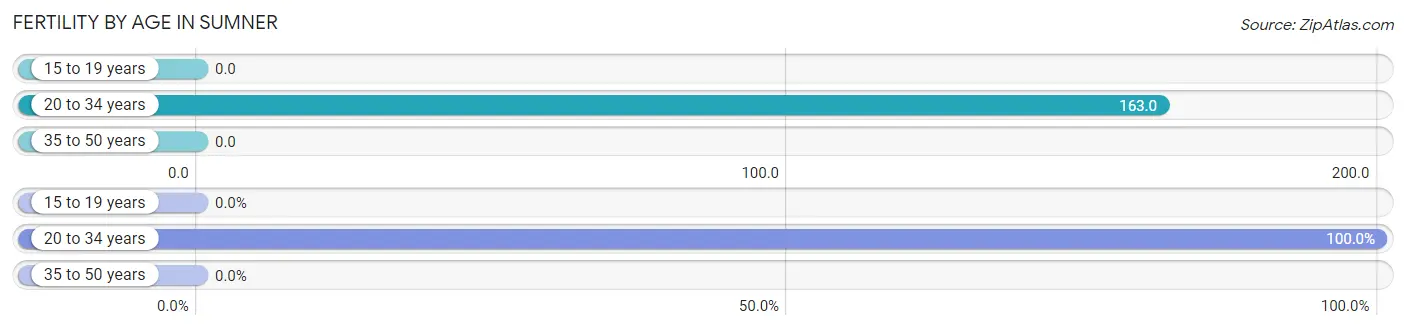
| Age Bracket | Women with Births | Births / 1,000 Women |
| 15 to 19 years | 0 (0.0%) | 0.0 |
| 20 to 34 years | 7 (100.0%) | 163.0 |
| 35 to 50 years | 0 (0.0%) | 0.0 |
| Total | 7 (100.0%) | 59.0 |
Fertility by Age by Marriage Status in Sumner
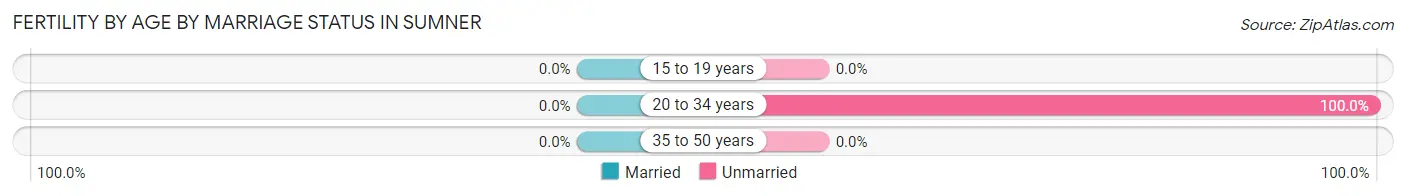
| Age Bracket | Married | Unmarried |
| 15 to 19 years | 0 (0.0%) | 0 (0.0%) |
| 20 to 34 years | 0 (0.0%) | 7 (100.0%) |
| 35 to 50 years | 0 (0.0%) | 0 (0.0%) |
| Total | 0 (0.0%) | 7 (100.0%) |
Fertility by Education in Sumner
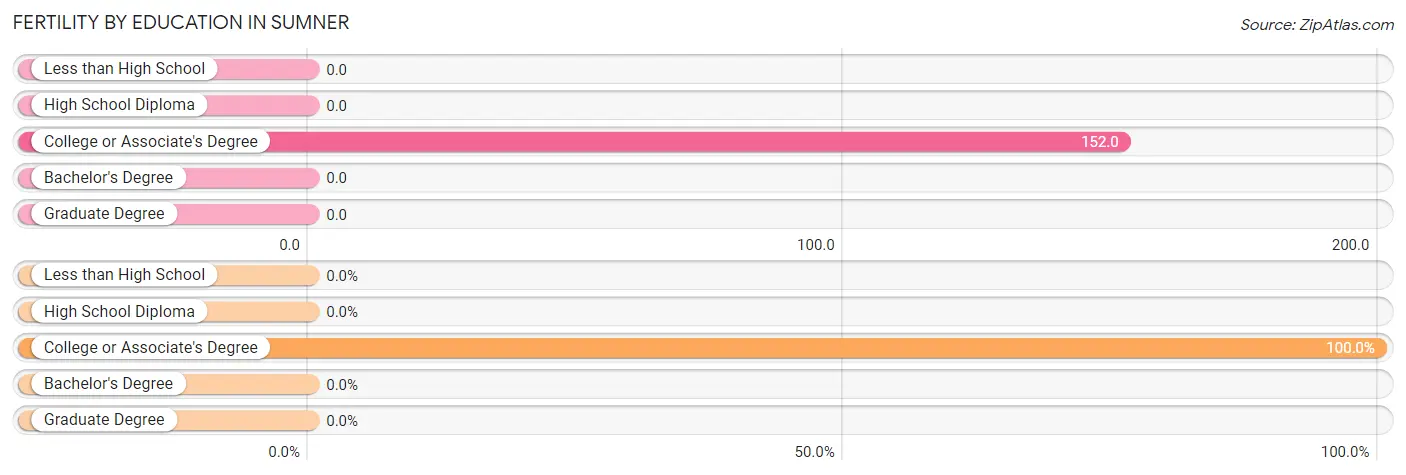
| Educational Attainment | Women with Births | Births / 1,000 Women |
| Less than High School | 0 (0.0%) | 0.0 |
| High School Diploma | 0 (0.0%) | 0.0 |
| College or Associate's Degree | 7 (100.0%) | 152.0 |
| Bachelor's Degree | 0 (0.0%) | 0.0 |
| Graduate Degree | 0 (0.0%) | 0.0 |
| Total | 7 (100.0%) | 59.0 |
Fertility by Education by Marriage Status in Sumner
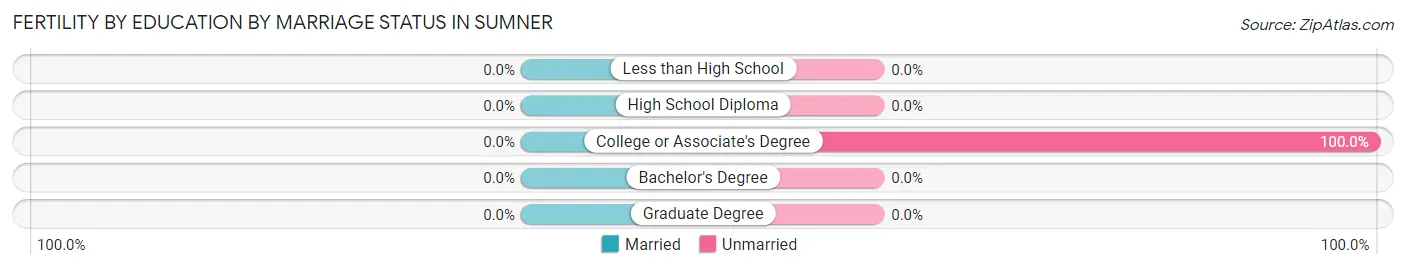
| Educational Attainment | Married | Unmarried |
| Less than High School | 0 (0.0%) | 0 (0.0%) |
| High School Diploma | 0 (0.0%) | 0 (0.0%) |
| College or Associate's Degree | 0 (0.0%) | 7 (100.0%) |
| Bachelor's Degree | 0 (0.0%) | 0 (0.0%) |
| Graduate Degree | 0 (0.0%) | 0 (0.0%) |
| Total | 0 (0.0%) | 7 (100.0%) |
Income in Sumner
Income Overview in Sumner
Per Capita Income in Sumner is $24,658, while median incomes of families and households are $52,500 and $46,786 respectively.
| Characteristic | Number | Measure |
| Per Capita Income | 404 | $24,658 |
| Median Family Income | 104 | $52,500 |
| Mean Family Income | 104 | $64,760 |
| Median Household Income | 158 | $46,786 |
| Mean Household Income | 158 | $63,006 |
| Income Deficit | 104 | $0 |
| Wage / Income Gap (%) | 404 | 0.00% |
| Wage / Income Gap ($) | 404 | 100.00¢ per $1 |
| Gini / Inequality Index | 404 | 0.43 |
Earnings by Sex in Sumner
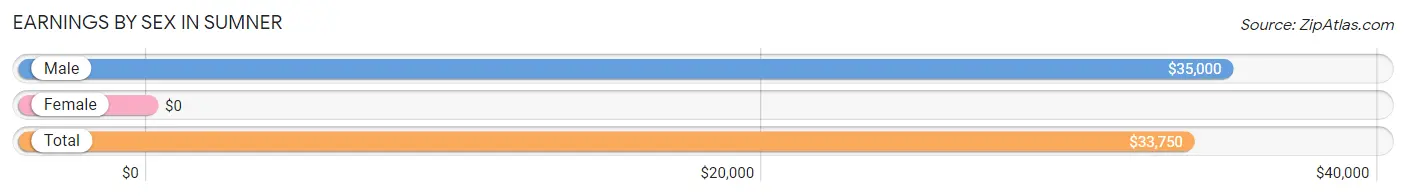
| Sex | Number | Average Earnings |
| Male | 86 (46.7%) | $35,000 |
| Female | 98 (53.3%) | $0 |
| Total | 184 (100.0%) | $33,750 |
Earnings by Sex by Income Bracket in Sumner
The most common earnings brackets in Sumner are $20,000 to $22,499 for men (11 | 12.8%) and $5,000 to $7,499 for women (18 | 18.4%).
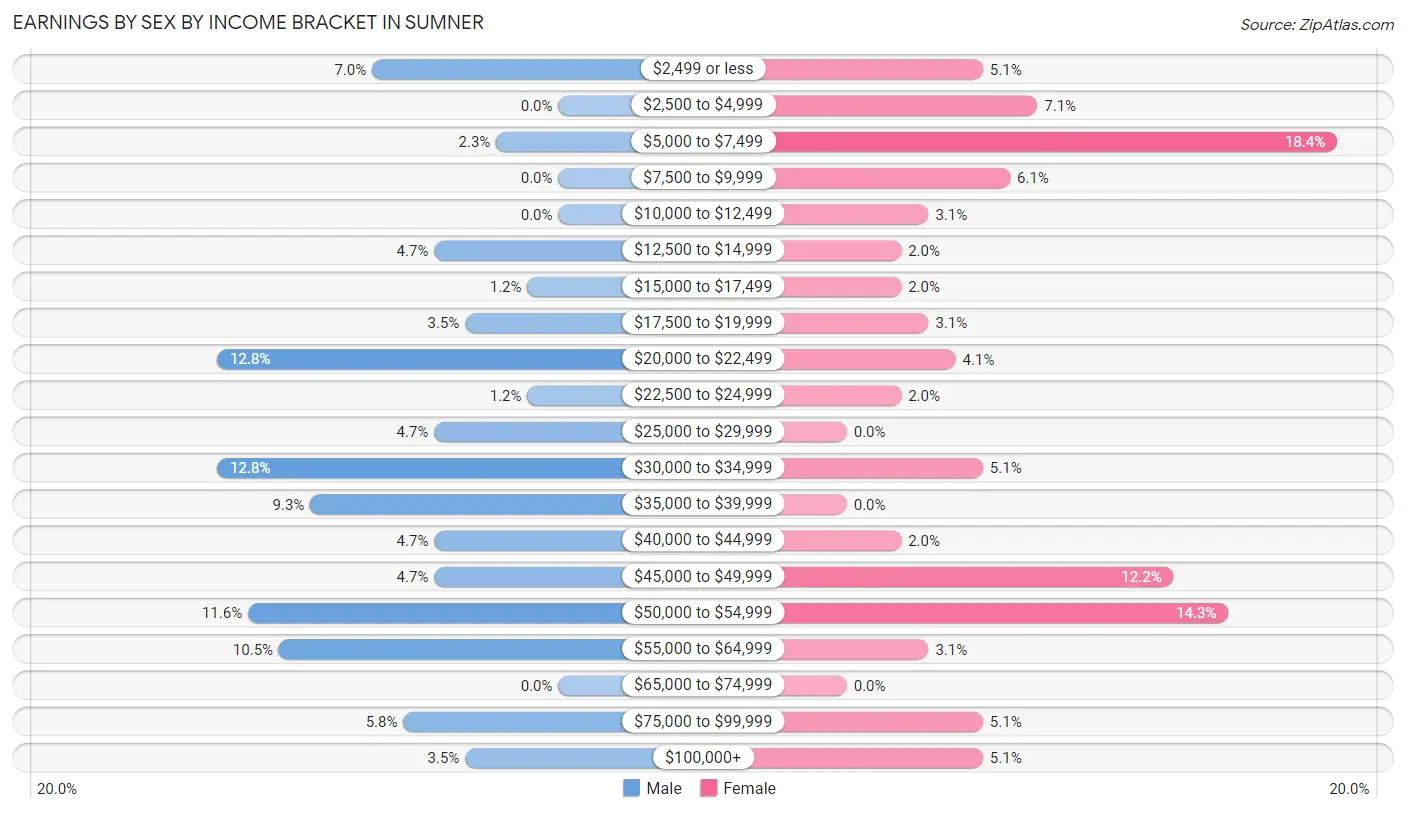
| Income | Male | Female |
| $2,499 or less | 6 (7.0%) | 5 (5.1%) |
| $2,500 to $4,999 | 0 (0.0%) | 7 (7.1%) |
| $5,000 to $7,499 | 2 (2.3%) | 18 (18.4%) |
| $7,500 to $9,999 | 0 (0.0%) | 6 (6.1%) |
| $10,000 to $12,499 | 0 (0.0%) | 3 (3.1%) |
| $12,500 to $14,999 | 4 (4.6%) | 2 (2.0%) |
| $15,000 to $17,499 | 1 (1.2%) | 2 (2.0%) |
| $17,500 to $19,999 | 3 (3.5%) | 3 (3.1%) |
| $20,000 to $22,499 | 11 (12.8%) | 4 (4.1%) |
| $22,500 to $24,999 | 1 (1.2%) | 2 (2.0%) |
| $25,000 to $29,999 | 4 (4.6%) | 0 (0.0%) |
| $30,000 to $34,999 | 11 (12.8%) | 5 (5.1%) |
| $35,000 to $39,999 | 8 (9.3%) | 0 (0.0%) |
| $40,000 to $44,999 | 4 (4.6%) | 2 (2.0%) |
| $45,000 to $49,999 | 4 (4.6%) | 12 (12.2%) |
| $50,000 to $54,999 | 10 (11.6%) | 14 (14.3%) |
| $55,000 to $64,999 | 9 (10.5%) | 3 (3.1%) |
| $65,000 to $74,999 | 0 (0.0%) | 0 (0.0%) |
| $75,000 to $99,999 | 5 (5.8%) | 5 (5.1%) |
| $100,000+ | 3 (3.5%) | 5 (5.1%) |
| Total | 86 (100.0%) | 98 (100.0%) |
Earnings by Sex by Educational Attainment in Sumner
Average earnings in Sumner are $43,438 for men and $44,375 for women, a difference of 2.1%. Men with an educational attainment of high school diploma enjoy the highest average annual earnings of $45,938, while those with high school diploma education earn the least with $45,938. Women with an educational attainment of high school diploma earn the most with the average annual earnings of $51,250, while those with college or associate's degree education have the smallest earnings of $43,750.
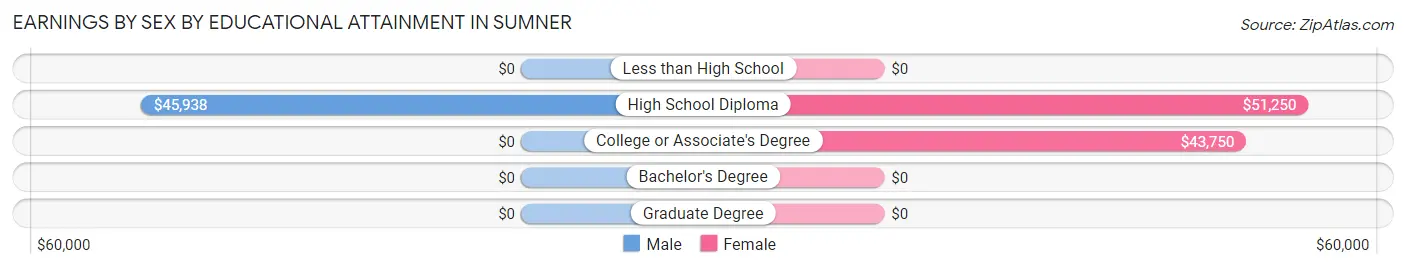
| Educational Attainment | Male Income | Female Income |
| Less than High School | - | - |
| High School Diploma | $45,938 | $51,250 |
| College or Associate's Degree | - | - |
| Bachelor's Degree | - | - |
| Graduate Degree | - | - |
| Total | $43,438 | $44,375 |
Family Income in Sumner
Family Income Brackets in Sumner
According to the Sumner family income data, there are 22 families falling into the $100,000 to $149,999 income range, which is the most common income bracket and makes up 21.1% of all families.
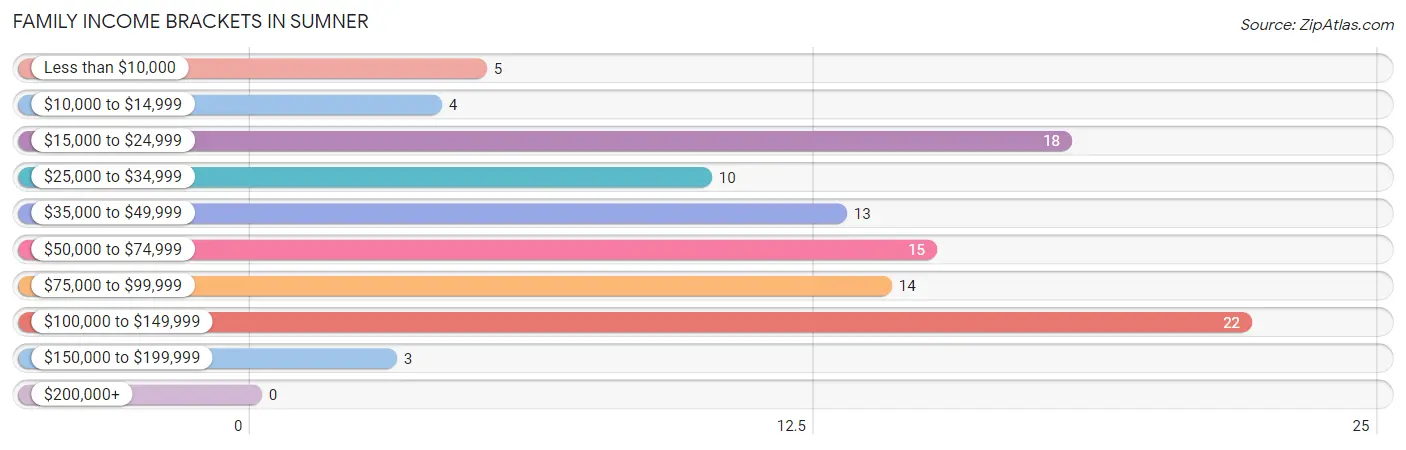
| Income Bracket | # Families | % Families |
| Less than $10,000 | 5 | 4.8% |
| $10,000 to $14,999 | 4 | 3.8% |
| $15,000 to $24,999 | 18 | 17.3% |
| $25,000 to $34,999 | 10 | 9.6% |
| $35,000 to $49,999 | 13 | 12.5% |
| $50,000 to $74,999 | 15 | 14.4% |
| $75,000 to $99,999 | 14 | 13.5% |
| $100,000 to $149,999 | 22 | 21.2% |
| $150,000 to $199,999 | 3 | 2.9% |
| $200,000+ | 0 | 0.0% |
Family Income by Famaliy Size in Sumner
4-person families (17 | 16.4%) account for the highest median family income in Sumner with $78,750 per family, while 2-person families (48 | 46.2%) have the highest median income of $25,625 per family member.
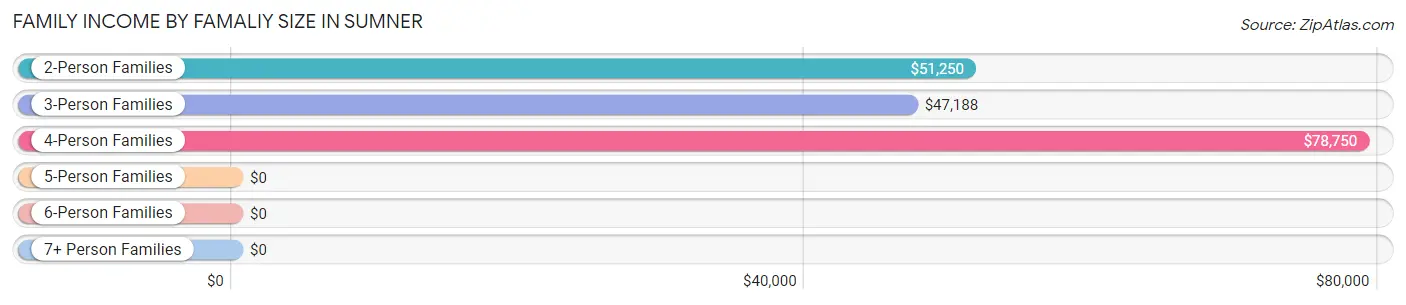
| Income Bracket | # Families | Median Income |
| 2-Person Families | 48 (46.2%) | $51,250 |
| 3-Person Families | 19 (18.3%) | $47,188 |
| 4-Person Families | 17 (16.4%) | $78,750 |
| 5-Person Families | 11 (10.6%) | $0 |
| 6-Person Families | 9 (8.6%) | $0 |
| 7+ Person Families | 0 (0.0%) | $0 |
| Total | 104 (100.0%) | $52,500 |
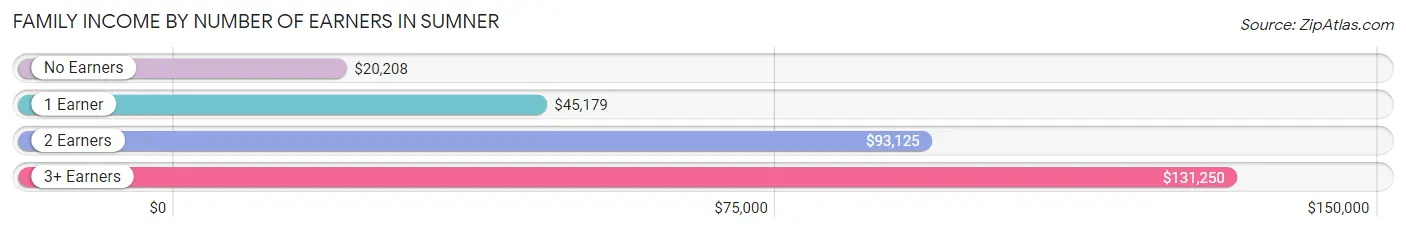
Family Income by Number of Earners in Sumner
The median family income in Sumner is $52,500, with families comprising 3+ earners (15) having the highest median family income of $131,250, while families with no earners (23) have the lowest median family income of $20,208, accounting for 14.4% and 22.1% of families, respectively.
| Number of Earners | # Families | Median Income |
| No Earners | 23 (22.1%) | $20,208 |
| 1 Earner | 37 (35.6%) | $45,179 |
| 2 Earners | 29 (27.9%) | $93,125 |
| 3+ Earners | 15 (14.4%) | $131,250 |
| Total | 104 (100.0%) | $52,500 |
Household Income in Sumner
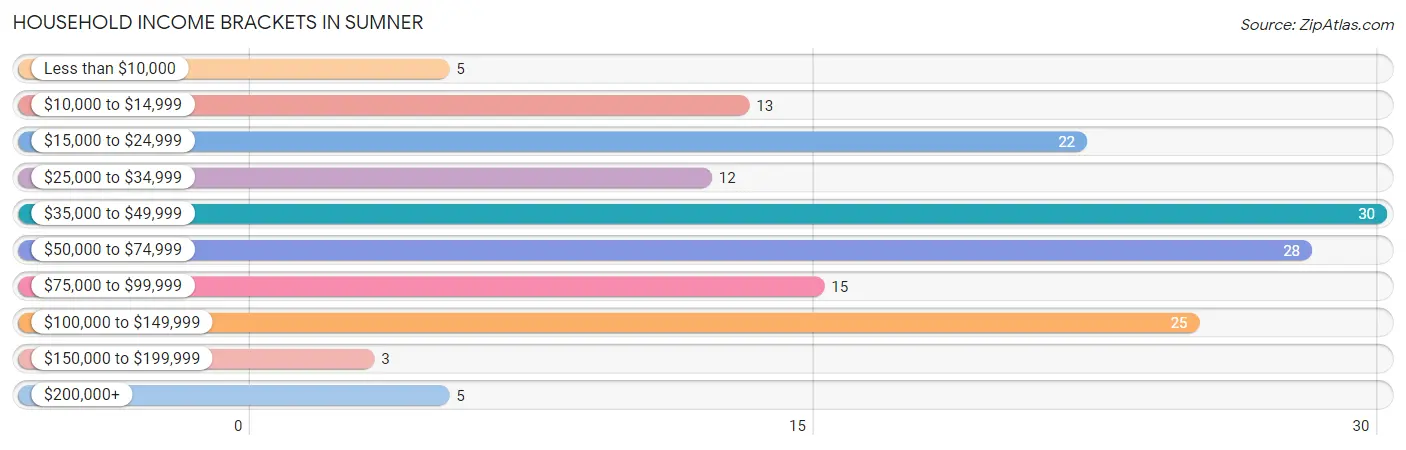
Household Income Brackets in Sumner
With 30 households falling in the category, the $35,000 to $49,999 income range is the most frequent in Sumner, accounting for 19.0% of all households. In contrast, only 3 households (1.9%) fall into the $150,000 to $199,999 income bracket, making it the least populous group.
| Income Bracket | # Households | % Households |
| Less than $10,000 | 5 | 3.2% |
| $10,000 to $14,999 | 13 | 8.2% |
| $15,000 to $24,999 | 22 | 13.9% |
| $25,000 to $34,999 | 12 | 7.6% |
| $35,000 to $49,999 | 30 | 19.0% |
| $50,000 to $74,999 | 28 | 17.7% |
| $75,000 to $99,999 | 15 | 9.5% |
| $100,000 to $149,999 | 25 | 15.8% |
| $150,000 to $199,999 | 3 | 1.9% |
| $200,000+ | 5 | 3.2% |
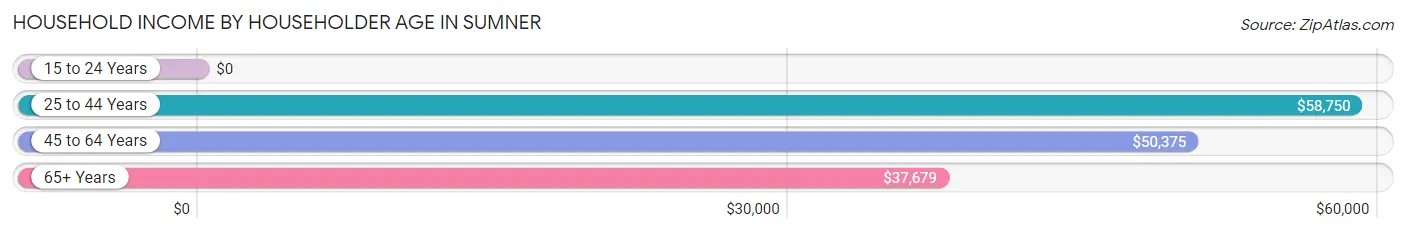
Household Income by Householder Age in Sumner
The median household income in Sumner is $46,786, with the highest median household income of $58,750 found in the 25 to 44 years age bracket for the primary householder. A total of 59 households (37.3%) fall into this category.
| Income Bracket | # Households | Median Income |
| 15 to 24 Years | 0 (0.0%) | $0 |
| 25 to 44 Years | 59 (37.3%) | $58,750 |
| 45 to 64 Years | 55 (34.8%) | $50,375 |
| 65+ Years | 44 (27.9%) | $37,679 |
| Total | 158 (100.0%) | $46,786 |
Poverty in Sumner
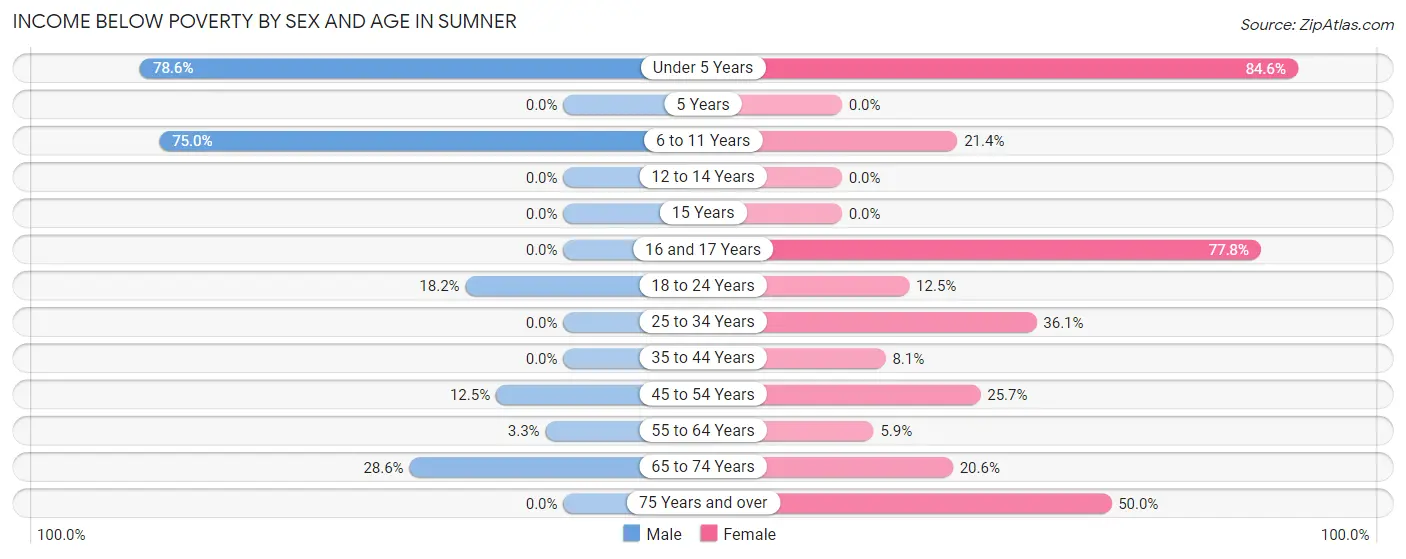
Income Below Poverty by Sex and Age in Sumner
With 15.4% poverty level for males and 26.8% for females among the residents of Sumner, under 5 year old males and under 5 year old females are the most vulnerable to poverty, with 11 males (78.6%) and 11 females (84.6%) in their respective age groups living below the poverty level.
| Age Bracket | Male | Female |
| Under 5 Years | 11 (78.6%) | 11 (84.6%) |
| 5 Years | 0 (0.0%) | 0 (0.0%) |
| 6 to 11 Years | 6 (75.0%) | 6 (21.4%) |
| 12 to 14 Years | 0 (0.0%) | 0 (0.0%) |
| 15 Years | 0 (0.0%) | 0 (0.0%) |
| 16 and 17 Years | 0 (0.0%) | 7 (77.8%) |
| 18 to 24 Years | 4 (18.2%) | 2 (12.5%) |
| 25 to 34 Years | 0 (0.0%) | 13 (36.1%) |
| 35 to 44 Years | 0 (0.0%) | 3 (8.1%) |
| 45 to 54 Years | 2 (12.5%) | 9 (25.7%) |
| 55 to 64 Years | 1 (3.3%) | 1 (5.9%) |
| 65 to 74 Years | 2 (28.6%) | 7 (20.6%) |
| 75 Years and over | 0 (0.0%) | 4 (50.0%) |
| Total | 26 (15.4%) | 63 (26.8%) |
Income Above Poverty by Sex and Age in Sumner
According to the poverty statistics in Sumner, males aged 12 to 14 years and females aged 12 to 14 years are the age groups that are most secure financially, with 100.0% of males and 100.0% of females in these age groups living above the poverty line.
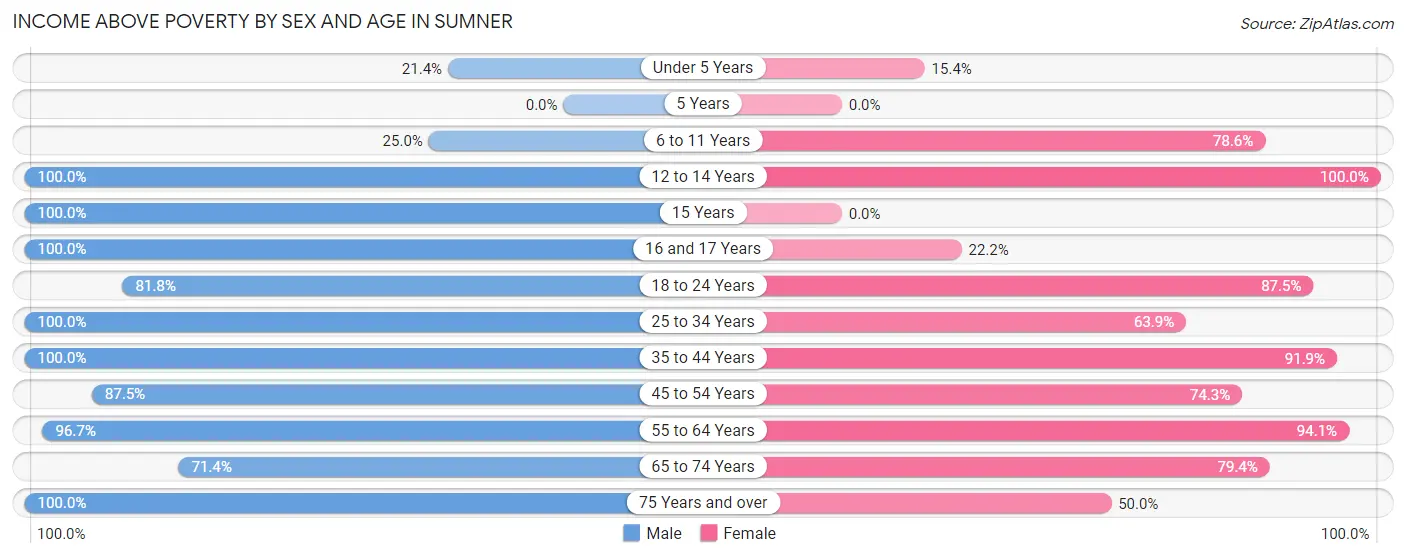
| Age Bracket | Male | Female |
| Under 5 Years | 3 (21.4%) | 2 (15.4%) |
| 5 Years | 0 (0.0%) | 0 (0.0%) |
| 6 to 11 Years | 2 (25.0%) | 22 (78.6%) |
| 12 to 14 Years | 16 (100.0%) | 2 (100.0%) |
| 15 Years | 3 (100.0%) | 0 (0.0%) |
| 16 and 17 Years | 6 (100.0%) | 2 (22.2%) |
| 18 to 24 Years | 18 (81.8%) | 14 (87.5%) |
| 25 to 34 Years | 7 (100.0%) | 23 (63.9%) |
| 35 to 44 Years | 29 (100.0%) | 34 (91.9%) |
| 45 to 54 Years | 14 (87.5%) | 26 (74.3%) |
| 55 to 64 Years | 29 (96.7%) | 16 (94.1%) |
| 65 to 74 Years | 5 (71.4%) | 27 (79.4%) |
| 75 Years and over | 11 (100.0%) | 4 (50.0%) |
| Total | 143 (84.6%) | 172 (73.2%) |
Income Below Poverty Among Married-Couple Families in Sumner
The poverty statistics for married-couple families in Sumner show that 5.8% or 4 of the total 69 families live below the poverty line. Families with 1 or 2 children have the highest poverty rate of 10.5%, comprising of 2 families. On the other hand, families with 3 or 4 children have the lowest poverty rate of 0.0%, which includes 0 families.
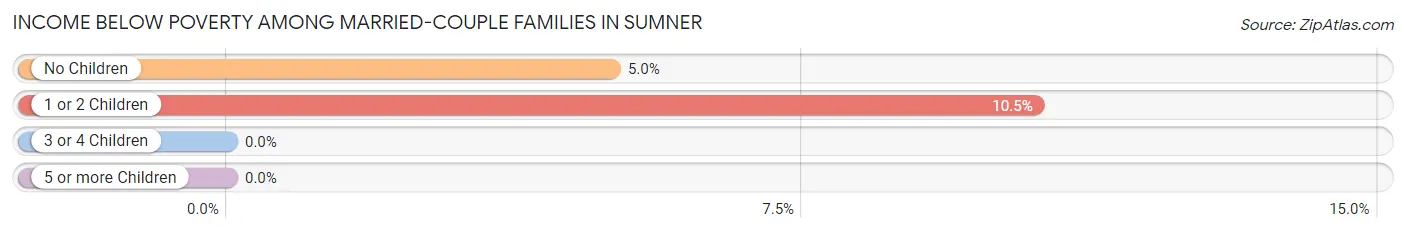
| Children | Above Poverty | Below Poverty |
| No Children | 38 (95.0%) | 2 (5.0%) |
| 1 or 2 Children | 17 (89.5%) | 2 (10.5%) |
| 3 or 4 Children | 10 (100.0%) | 0 (0.0%) |
| 5 or more Children | 0 (0.0%) | 0 (0.0%) |
| Total | 65 (94.2%) | 4 (5.8%) |
Income Below Poverty Among Single-Parent Households in Sumner
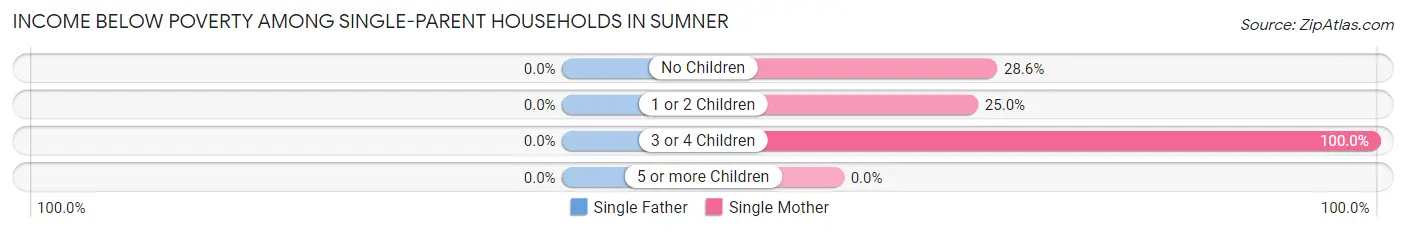
| Children | Single Father | Single Mother |
| No Children | 0 (0.0%) | 2 (28.6%) |
| 1 or 2 Children | 0 (0.0%) | 5 (25.0%) |
| 3 or 4 Children | 0 (0.0%) | 8 (100.0%) |
| 5 or more Children | 0 (0.0%) | 0 (0.0%) |
| Total | 0 (0.0%) | 15 (42.9%) |
Income Below Poverty Among Married-Couple vs Single-Parent Households in Sumner
The poverty data for Sumner shows that 4 of the married-couple family households (5.8%) and 15 of the single-parent households (42.9%) are living below the poverty level. Within the married-couple family households, those with 1 or 2 children have the highest poverty rate, with 2 households (10.5%) falling below the poverty line. Among the single-parent households, those with 3 or 4 children have the highest poverty rate, with 8 household (100.0%) living below poverty.
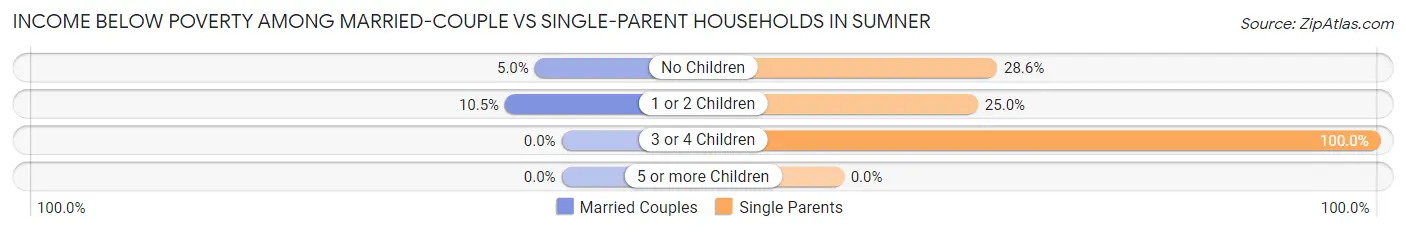
| Children | Married-Couple Families | Single-Parent Households |
| No Children | 2 (5.0%) | 2 (28.6%) |
| 1 or 2 Children | 2 (10.5%) | 5 (25.0%) |
| 3 or 4 Children | 0 (0.0%) | 8 (100.0%) |
| 5 or more Children | 0 (0.0%) | 0 (0.0%) |
| Total | 4 (5.8%) | 15 (42.9%) |
Employment Characteristics in Sumner
Employment by Class of Employer in Sumner
Among the 162 employed individuals in Sumner, private company employees (114 | 70.4%), self-employed (not incorporated) (16 | 9.9%), and local government employees (12 | 7.4%) make up the most common classes of employment.
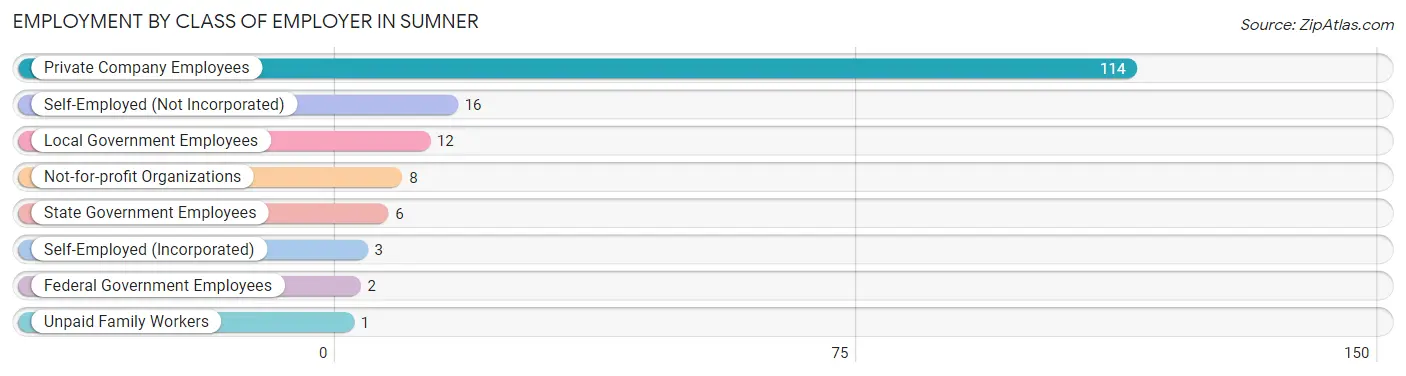
| Employer Class | # Employees | % Employees |
| Private Company Employees | 114 | 70.4% |
| Self-Employed (Incorporated) | 3 | 1.8% |
| Self-Employed (Not Incorporated) | 16 | 9.9% |
| Not-for-profit Organizations | 8 | 4.9% |
| Local Government Employees | 12 | 7.4% |
| State Government Employees | 6 | 3.7% |
| Federal Government Employees | 2 | 1.2% |
| Unpaid Family Workers | 1 | 0.6% |
| Total | 162 | 100.0% |
Employment Status by Age in Sumner
According to the labor force statistics for Sumner, out of the total population over 16 years of age (320), 53.1% or 170 individuals are in the labor force, with 3.5% or 6 of them unemployed. The age group with the highest labor force participation rate is 30 to 34 years, with 92.3% or 24 individuals in the labor force. Within the labor force, the 16 to 19 years age range has the highest percentage of unemployed individuals, with 18.2% or 4 of them being unemployed.
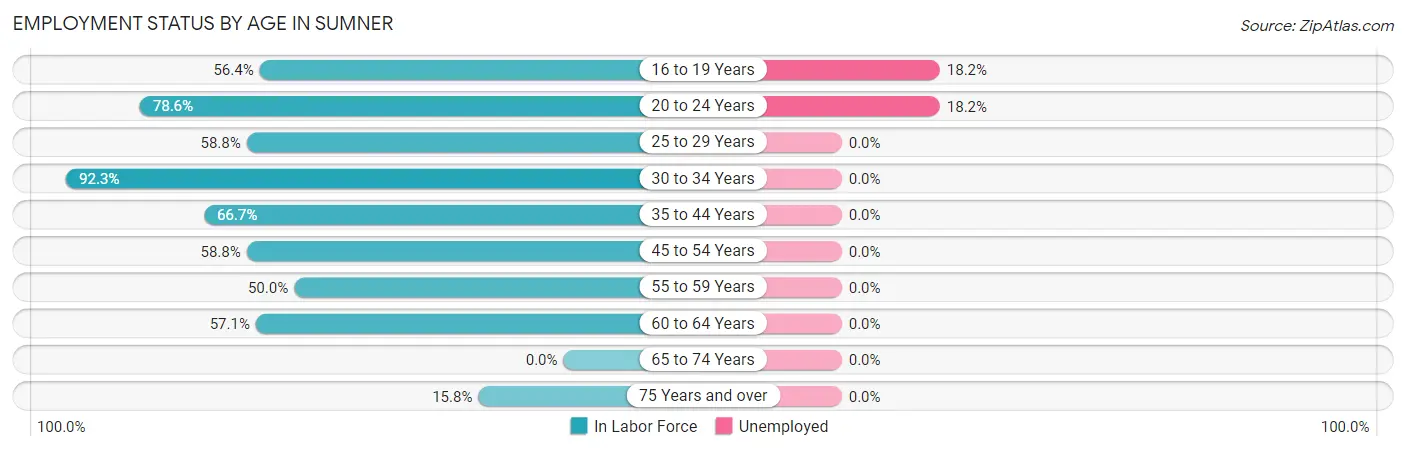
| Age Bracket | In Labor Force | Unemployed |
| 16 to 19 Years | 22 (56.4%) | 4 (18.2%) |
| 20 to 24 Years | 11 (78.6%) | 2 (18.2%) |
| 25 to 29 Years | 10 (58.8%) | 0 (0.0%) |
| 30 to 34 Years | 24 (92.3%) | 0 (0.0%) |
| 35 to 44 Years | 44 (66.7%) | 0 (0.0%) |
| 45 to 54 Years | 30 (58.8%) | 0 (0.0%) |
| 55 to 59 Years | 6 (50.0%) | 0 (0.0%) |
| 60 to 64 Years | 20 (57.1%) | 0 (0.0%) |
| 65 to 74 Years | 0 (0.0%) | 0 (0.0%) |
| 75 Years and over | 3 (15.8%) | 0 (0.0%) |
| Total | 170 (53.1%) | 6 (3.5%) |
Employment Status by Educational Attainment in Sumner
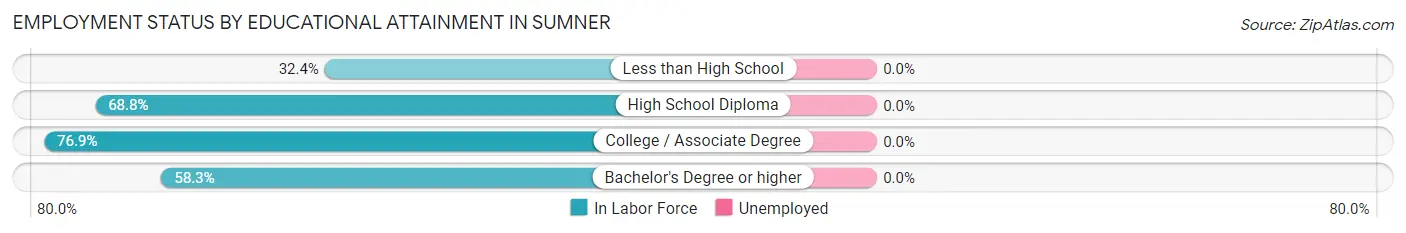
| Educational Attainment | In Labor Force | Unemployed |
| Less than High School | 12 (32.4%) | 0 (0.0%) |
| High School Diploma | 55 (68.8%) | 0 (0.0%) |
| College / Associate Degree | 60 (76.9%) | 0 (0.0%) |
| Bachelor's Degree or higher | 7 (58.3%) | 0 (0.0%) |
| Total | 134 (64.7%) | 0 (0.0%) |
Employment Occupations by Sex in Sumner
Management, Business, Science and Arts Occupations
The most common Management, Business, Science and Arts occupations in Sumner are Community & Social Service (12 | 7.3%), Computers, Engineering & Science (7 | 4.3%), Management (6 | 3.7%), Education Instruction & Library (6 | 3.7%), and Business & Financial (5 | 3.0%).
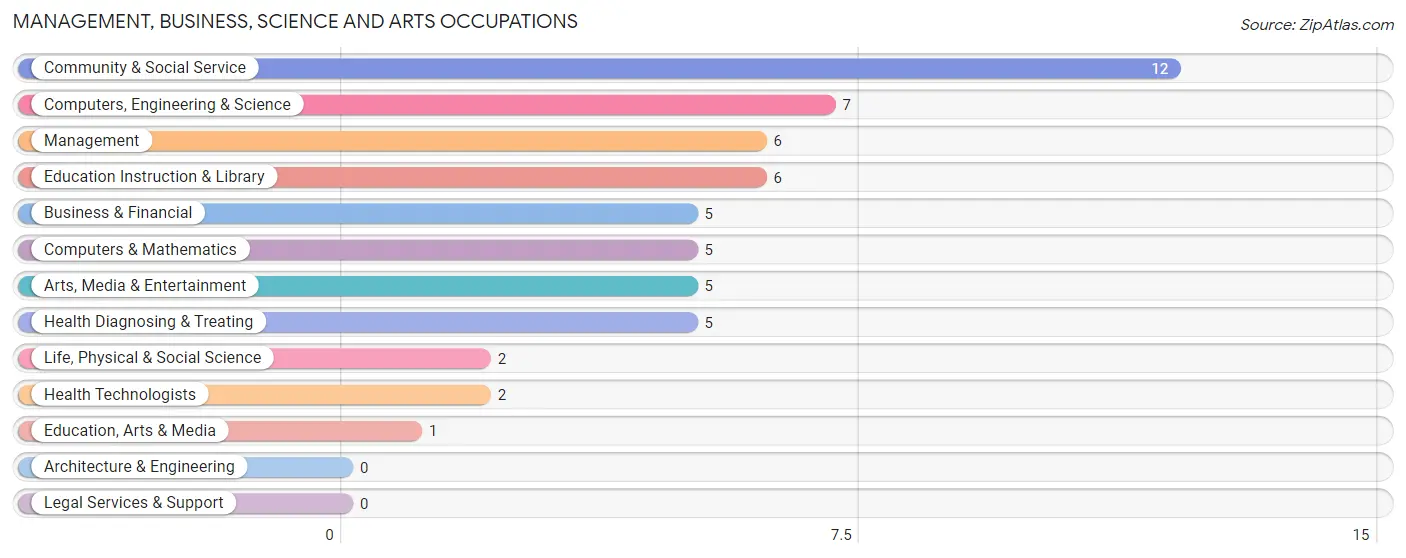
Management, Business, Science and Arts Occupations by Sex
Within the Management, Business, Science and Arts occupations in Sumner, the most male-oriented occupations are Management (100.0%), Life, Physical & Social Science (100.0%), and Business & Financial (40.0%), while the most female-oriented occupations are Computers & Mathematics (100.0%), Education, Arts & Media (100.0%), and Education Instruction & Library (100.0%).
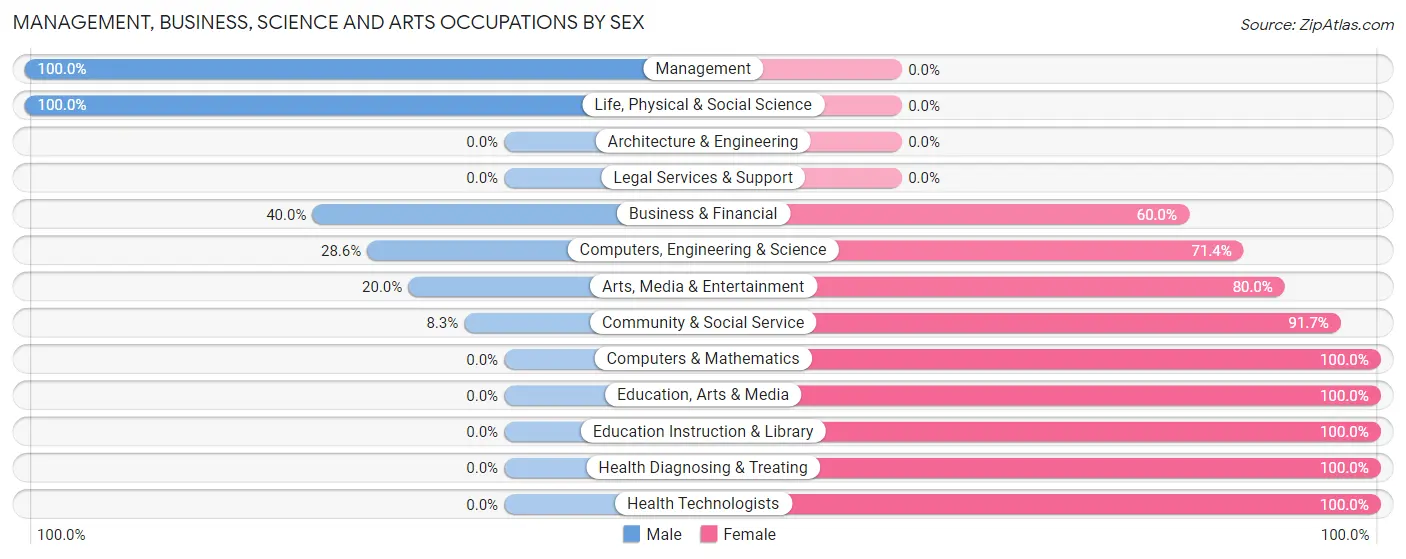
| Occupation | Male | Female |
| Management | 6 (100.0%) | 0 (0.0%) |
| Business & Financial | 2 (40.0%) | 3 (60.0%) |
| Computers, Engineering & Science | 2 (28.6%) | 5 (71.4%) |
| Computers & Mathematics | 0 (0.0%) | 5 (100.0%) |
| Architecture & Engineering | 0 (0.0%) | 0 (0.0%) |
| Life, Physical & Social Science | 2 (100.0%) | 0 (0.0%) |
| Community & Social Service | 1 (8.3%) | 11 (91.7%) |
| Education, Arts & Media | 0 (0.0%) | 1 (100.0%) |
| Legal Services & Support | 0 (0.0%) | 0 (0.0%) |
| Education Instruction & Library | 0 (0.0%) | 6 (100.0%) |
| Arts, Media & Entertainment | 1 (20.0%) | 4 (80.0%) |
| Health Diagnosing & Treating | 0 (0.0%) | 5 (100.0%) |
| Health Technologists | 0 (0.0%) | 2 (100.0%) |
| Total (Category) | 11 (31.4%) | 24 (68.6%) |
| Total (Overall) | 81 (49.4%) | 83 (50.6%) |
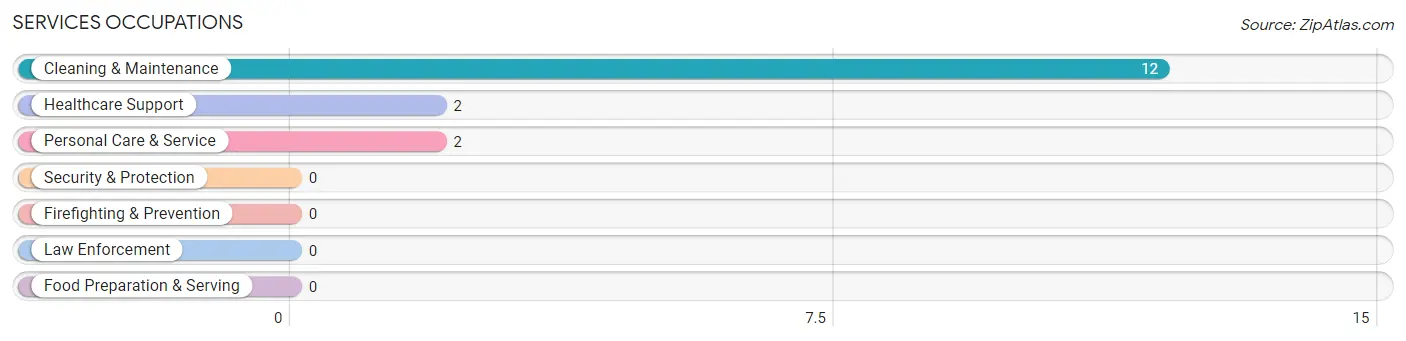
Services Occupations
The most common Services occupations in Sumner are Cleaning & Maintenance (12 | 7.3%), Healthcare Support (2 | 1.2%), and Personal Care & Service (2 | 1.2%).
Services Occupations by Sex
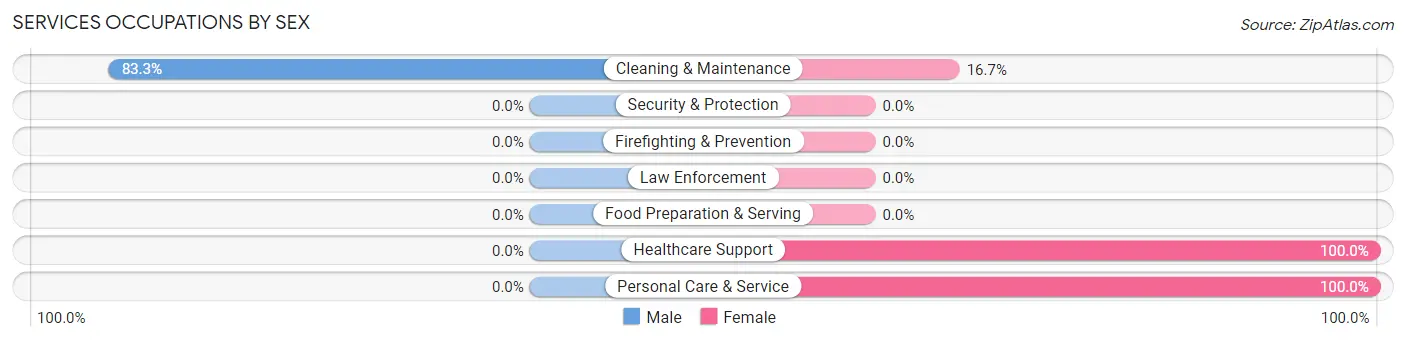
| Occupation | Male | Female |
| Healthcare Support | 0 (0.0%) | 2 (100.0%) |
| Security & Protection | 0 (0.0%) | 0 (0.0%) |
| Firefighting & Prevention | 0 (0.0%) | 0 (0.0%) |
| Law Enforcement | 0 (0.0%) | 0 (0.0%) |
| Food Preparation & Serving | 0 (0.0%) | 0 (0.0%) |
| Cleaning & Maintenance | 10 (83.3%) | 2 (16.7%) |
| Personal Care & Service | 0 (0.0%) | 2 (100.0%) |
| Total (Category) | 10 (62.5%) | 6 (37.5%) |
| Total (Overall) | 81 (49.4%) | 83 (50.6%) |
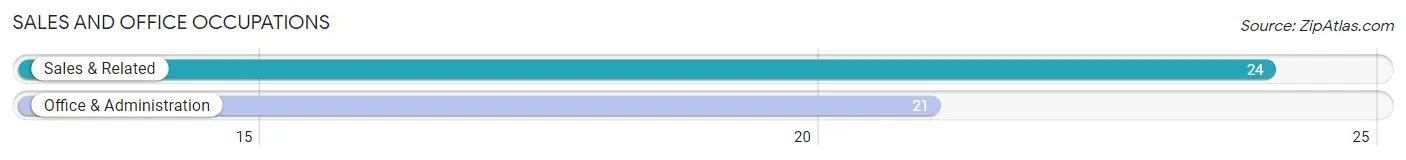
Sales and Office Occupations
The most common Sales and Office occupations in Sumner are Sales & Related (24 | 14.6%), and Office & Administration (21 | 12.8%).
Sales and Office Occupations by Sex
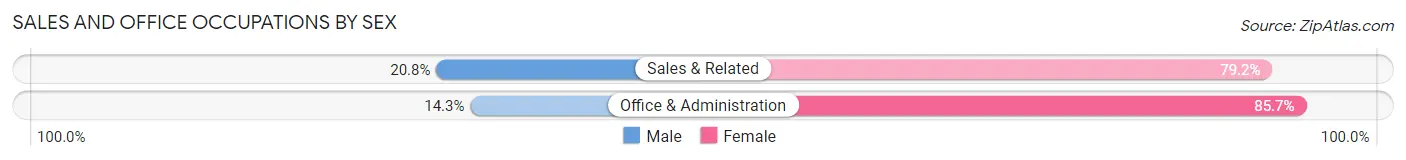
| Occupation | Male | Female |
| Sales & Related | 5 (20.8%) | 19 (79.2%) |
| Office & Administration | 3 (14.3%) | 18 (85.7%) |
| Total (Category) | 8 (17.8%) | 37 (82.2%) |
| Total (Overall) | 81 (49.4%) | 83 (50.6%) |
Natural Resources, Construction and Maintenance Occupations
The most common Natural Resources, Construction and Maintenance occupations in Sumner are Installation, Maintenance & Repair (7 | 4.3%), and Farming, Fishing & Forestry (3 | 1.8%).
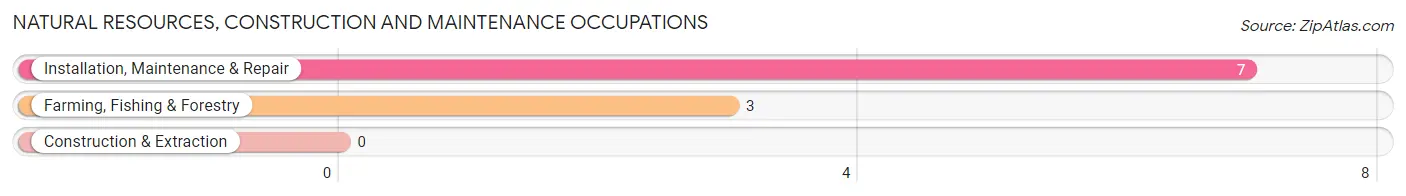
Natural Resources, Construction and Maintenance Occupations by Sex
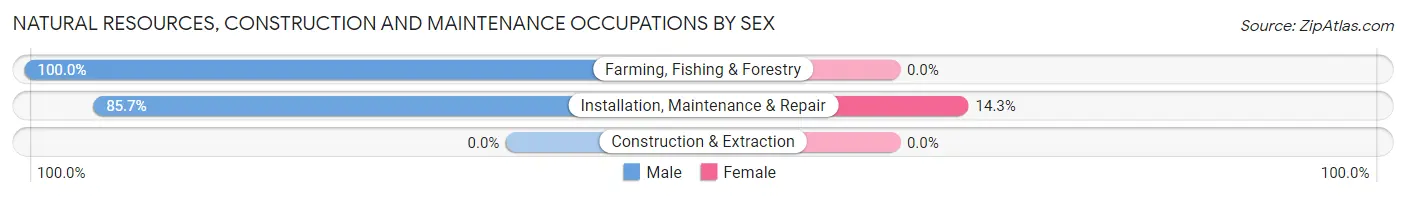
| Occupation | Male | Female |
| Farming, Fishing & Forestry | 3 (100.0%) | 0 (0.0%) |
| Construction & Extraction | 0 (0.0%) | 0 (0.0%) |
| Installation, Maintenance & Repair | 6 (85.7%) | 1 (14.3%) |
| Total (Category) | 9 (90.0%) | 1 (10.0%) |
| Total (Overall) | 81 (49.4%) | 83 (50.6%) |
Production, Transportation and Moving Occupations
The most common Production, Transportation and Moving occupations in Sumner are Transportation (36 | 22.0%), Material Moving (19 | 11.6%), and Production (3 | 1.8%).
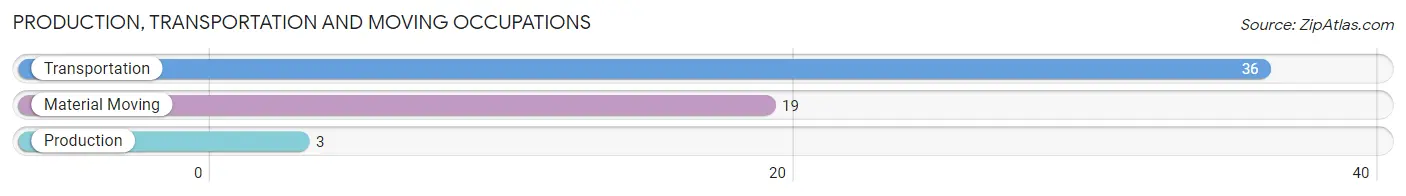
Production, Transportation and Moving Occupations by Sex
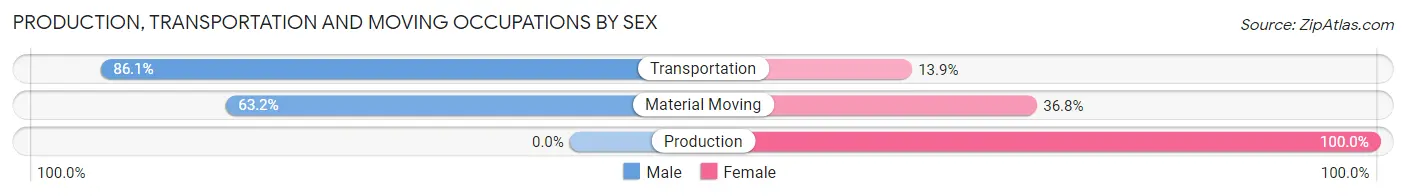
| Occupation | Male | Female |
| Production | 0 (0.0%) | 3 (100.0%) |
| Transportation | 31 (86.1%) | 5 (13.9%) |
| Material Moving | 12 (63.2%) | 7 (36.8%) |
| Total (Category) | 43 (74.1%) | 15 (25.9%) |
| Total (Overall) | 81 (49.4%) | 83 (50.6%) |
Employment Industries by Sex in Sumner
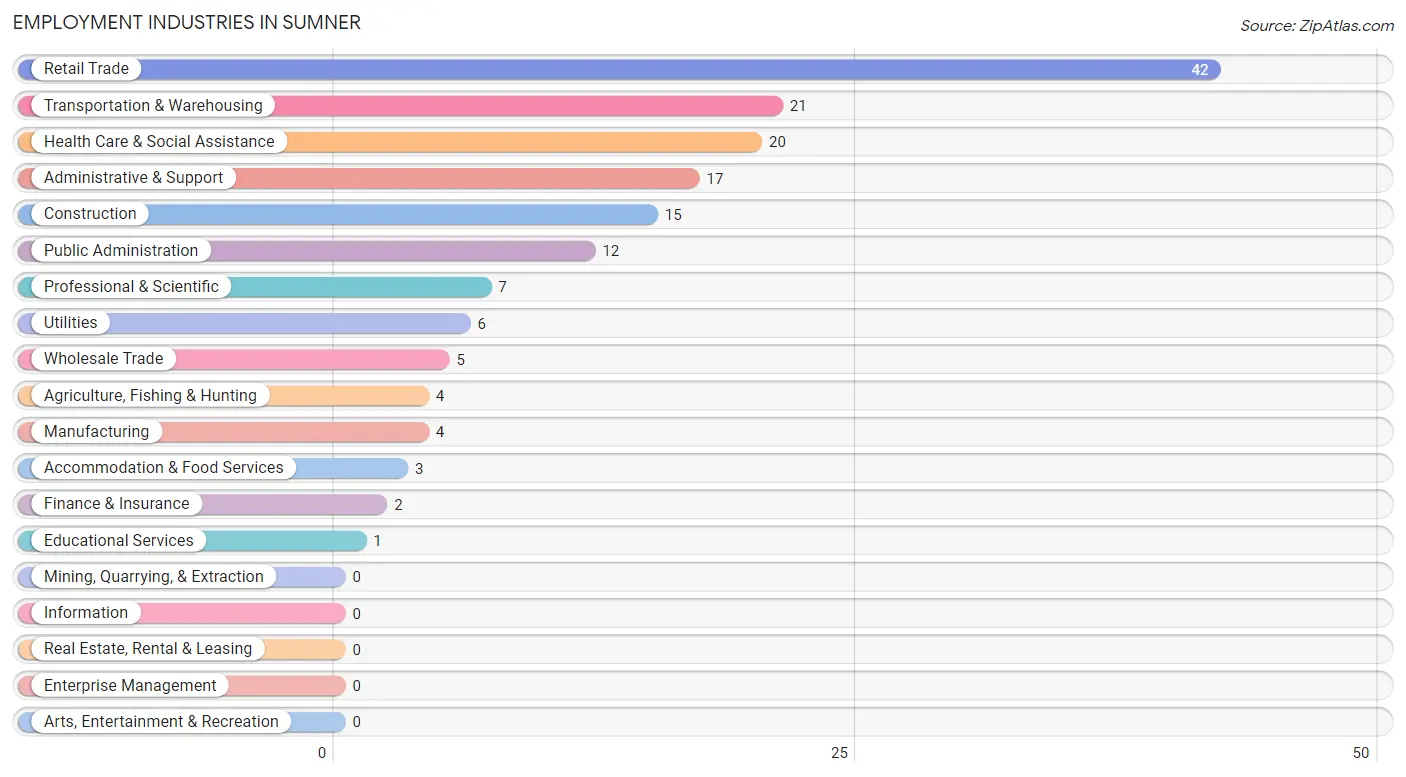
Employment Industries in Sumner
The major employment industries in Sumner include Retail Trade (42 | 25.6%), Transportation & Warehousing (21 | 12.8%), Health Care & Social Assistance (20 | 12.2%), Administrative & Support (17 | 10.4%), and Construction (15 | 9.1%).
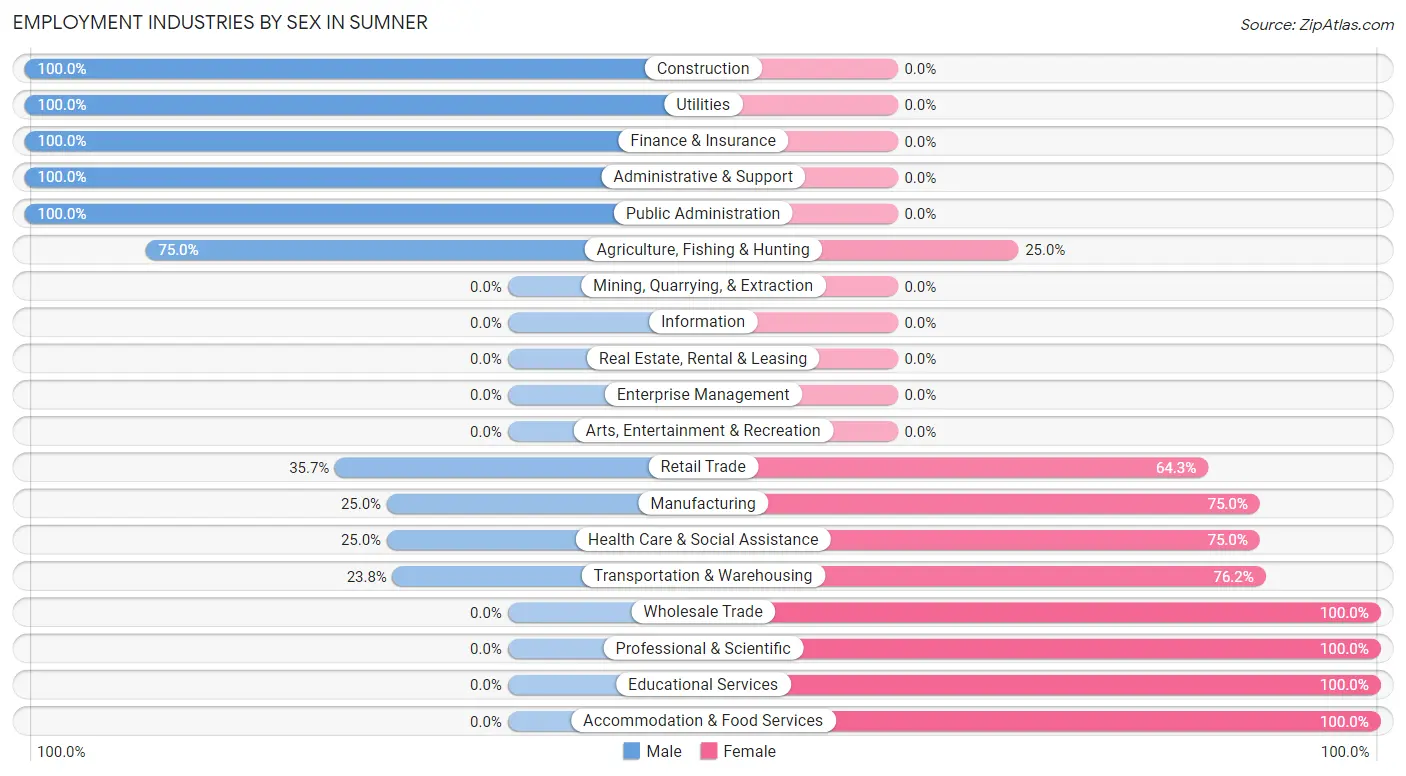
Employment Industries by Sex in Sumner
The Sumner industries that see more men than women are Construction (100.0%), Utilities (100.0%), and Finance & Insurance (100.0%), whereas the industries that tend to have a higher number of women are Wholesale Trade (100.0%), Professional & Scientific (100.0%), and Educational Services (100.0%).
| Industry | Male | Female |
| Agriculture, Fishing & Hunting | 3 (75.0%) | 1 (25.0%) |
| Mining, Quarrying, & Extraction | 0 (0.0%) | 0 (0.0%) |
| Construction | 15 (100.0%) | 0 (0.0%) |
| Manufacturing | 1 (25.0%) | 3 (75.0%) |
| Wholesale Trade | 0 (0.0%) | 5 (100.0%) |
| Retail Trade | 15 (35.7%) | 27 (64.3%) |
| Transportation & Warehousing | 5 (23.8%) | 16 (76.2%) |
| Utilities | 6 (100.0%) | 0 (0.0%) |
| Information | 0 (0.0%) | 0 (0.0%) |
| Finance & Insurance | 2 (100.0%) | 0 (0.0%) |
| Real Estate, Rental & Leasing | 0 (0.0%) | 0 (0.0%) |
| Professional & Scientific | 0 (0.0%) | 7 (100.0%) |
| Enterprise Management | 0 (0.0%) | 0 (0.0%) |
| Administrative & Support | 17 (100.0%) | 0 (0.0%) |
| Educational Services | 0 (0.0%) | 1 (100.0%) |
| Health Care & Social Assistance | 5 (25.0%) | 15 (75.0%) |
| Arts, Entertainment & Recreation | 0 (0.0%) | 0 (0.0%) |
| Accommodation & Food Services | 0 (0.0%) | 3 (100.0%) |
| Public Administration | 12 (100.0%) | 0 (0.0%) |
| Total | 81 (49.4%) | 83 (50.6%) |
Education in Sumner
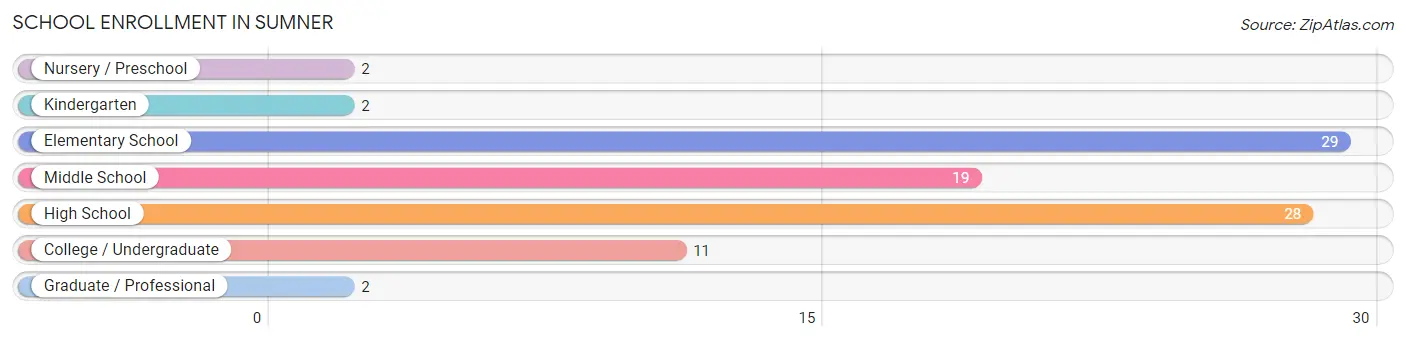
School Enrollment in Sumner
The most common levels of schooling among the 93 students in Sumner are elementary school (29 | 31.2%), high school (28 | 30.1%), and middle school (19 | 20.4%).
| School Level | # Students | % Students |
| Nursery / Preschool | 2 | 2.1% |
| Kindergarten | 2 | 2.1% |
| Elementary School | 29 | 31.2% |
| Middle School | 19 | 20.4% |
| High School | 28 | 30.1% |
| College / Undergraduate | 11 | 11.8% |
| Graduate / Professional | 2 | 2.1% |
| Total | 93 | 100.0% |
School Enrollment by Age by Funding Source in Sumner
Out of a total of 93 students who are enrolled in schools in Sumner, 11 (11.8%) attend a private institution, while the remaining 82 (88.2%) are enrolled in public schools. The age group of 20 to 24 year olds has the highest likelihood of being enrolled in private schools, with 3 (42.9% in the age bracket) enrolled. Conversely, the age group of 3 to 4 year olds has the lowest likelihood of being enrolled in a private school, with 2 (100.0% in the age bracket) attending a public institution.
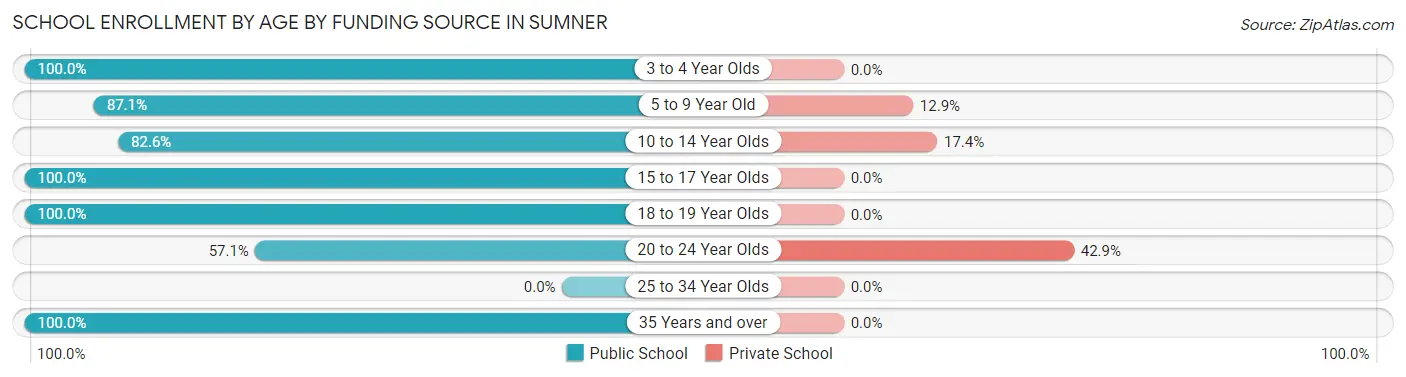
| Age Bracket | Public School | Private School |
| 3 to 4 Year Olds | 2 (100.0%) | 0 (0.0%) |
| 5 to 9 Year Old | 27 (87.1%) | 4 (12.9%) |
| 10 to 14 Year Olds | 19 (82.6%) | 4 (17.4%) |
| 15 to 17 Year Olds | 18 (100.0%) | 0 (0.0%) |
| 18 to 19 Year Olds | 4 (100.0%) | 0 (0.0%) |
| 20 to 24 Year Olds | 4 (57.1%) | 3 (42.9%) |
| 25 to 34 Year Olds | 0 (0.0%) | 0 (0.0%) |
| 35 Years and over | 8 (100.0%) | 0 (0.0%) |
| Total | 82 (88.2%) | 11 (11.8%) |
Educational Attainment by Field of Study in Sumner
Education (9 | 50.0%), liberal arts & history (5 | 27.8%), psychology (2 | 11.1%), and science & technology (2 | 11.1%) are the most common fields of study among 18 individuals in Sumner who have obtained a bachelor's degree or higher.
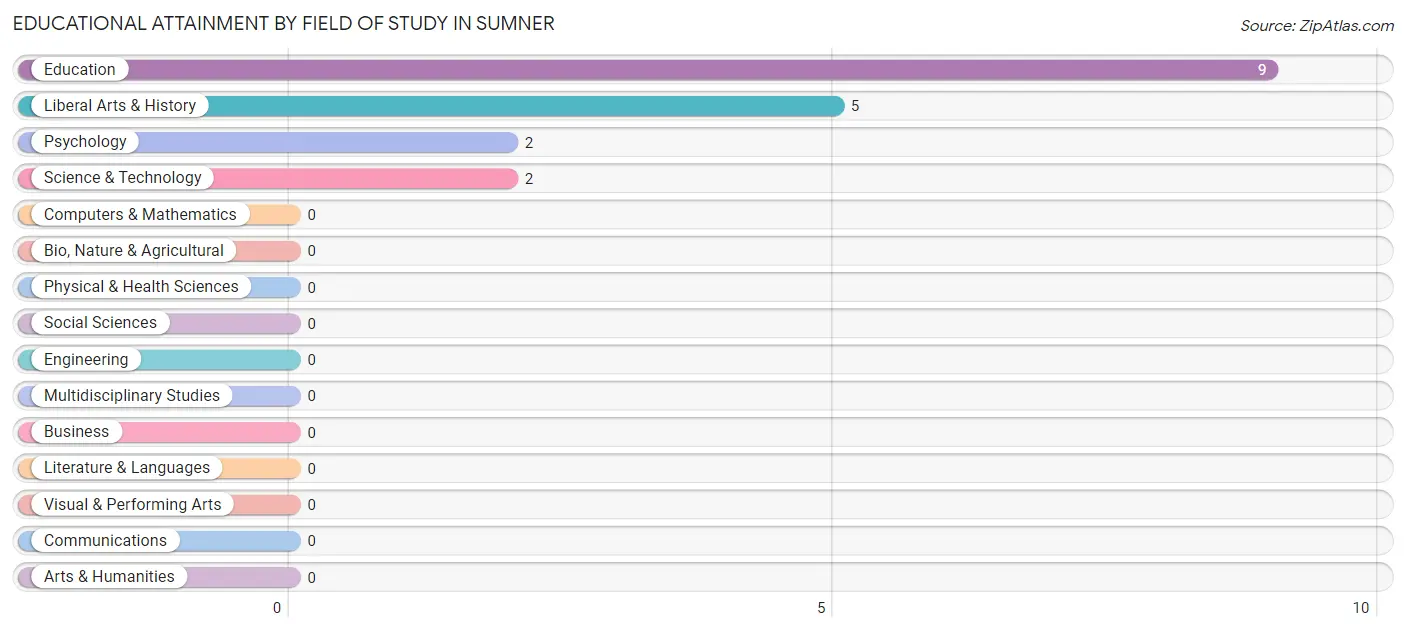
| Field of Study | # Graduates | % Graduates |
| Computers & Mathematics | 0 | 0.0% |
| Bio, Nature & Agricultural | 0 | 0.0% |
| Physical & Health Sciences | 0 | 0.0% |
| Psychology | 2 | 11.1% |
| Social Sciences | 0 | 0.0% |
| Engineering | 0 | 0.0% |
| Multidisciplinary Studies | 0 | 0.0% |
| Science & Technology | 2 | 11.1% |
| Business | 0 | 0.0% |
| Education | 9 | 50.0% |
| Literature & Languages | 0 | 0.0% |
| Liberal Arts & History | 5 | 27.8% |
| Visual & Performing Arts | 0 | 0.0% |
| Communications | 0 | 0.0% |
| Arts & Humanities | 0 | 0.0% |
| Total | 18 | 100.0% |
Transportation & Commute in Sumner
Vehicle Availability by Sex in Sumner
The most prevalent vehicle ownership categories in Sumner are males with 2 vehicles (28, accounting for 34.6%) and females with 2 vehicles (28, making up 34.6%).
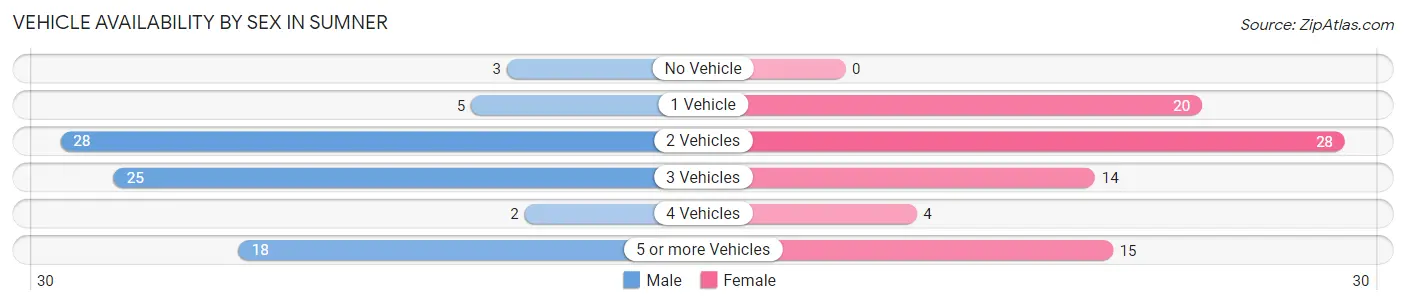
| Vehicles Available | Male | Female |
| No Vehicle | 3 (3.7%) | 0 (0.0%) |
| 1 Vehicle | 5 (6.2%) | 20 (24.7%) |
| 2 Vehicles | 28 (34.6%) | 28 (34.6%) |
| 3 Vehicles | 25 (30.9%) | 14 (17.3%) |
| 4 Vehicles | 2 (2.5%) | 4 (4.9%) |
| 5 or more Vehicles | 18 (22.2%) | 15 (18.5%) |
| Total | 81 (100.0%) | 81 (100.0%) |
Commute Time in Sumner
The most frequently occuring commute durations in Sumner are 20 to 24 minutes (37 commuters, 25.5%), 45 to 59 minutes (22 commuters, 15.2%), and 60 to 89 minutes (16 commuters, 11.0%).
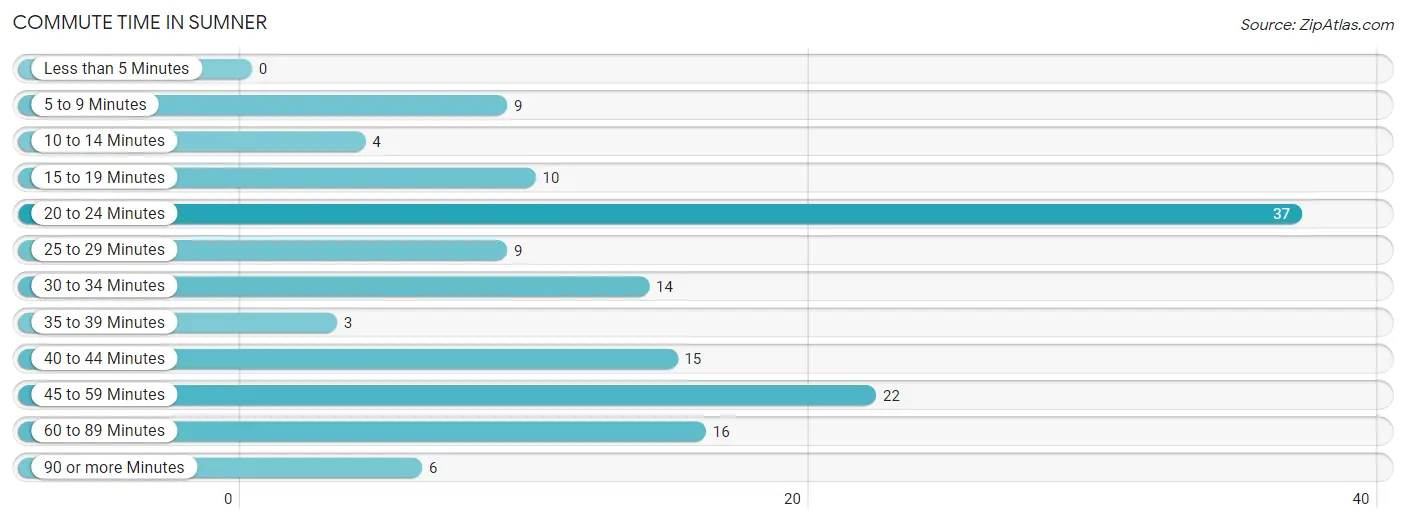
| Commute Time | # Commuters | % Commuters |
| Less than 5 Minutes | 0 | 0.0% |
| 5 to 9 Minutes | 9 | 6.2% |
| 10 to 14 Minutes | 4 | 2.8% |
| 15 to 19 Minutes | 10 | 6.9% |
| 20 to 24 Minutes | 37 | 25.5% |
| 25 to 29 Minutes | 9 | 6.2% |
| 30 to 34 Minutes | 14 | 9.7% |
| 35 to 39 Minutes | 3 | 2.1% |
| 40 to 44 Minutes | 15 | 10.3% |
| 45 to 59 Minutes | 22 | 15.2% |
| 60 to 89 Minutes | 16 | 11.0% |
| 90 or more Minutes | 6 | 4.1% |
Commute Time by Sex in Sumner
The most common commute times in Sumner are 40 to 44 minutes (15 commuters, 20.3%) for males and 20 to 24 minutes (24 commuters, 33.8%) for females.
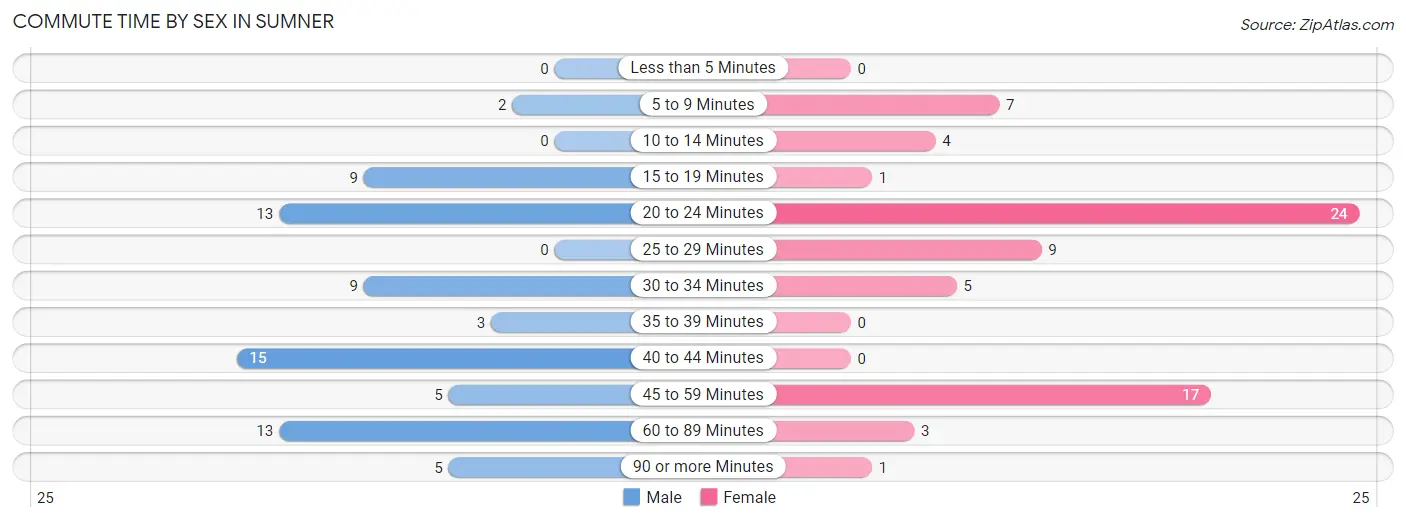
| Commute Time | Male | Female |
| Less than 5 Minutes | 0 (0.0%) | 0 (0.0%) |
| 5 to 9 Minutes | 2 (2.7%) | 7 (9.9%) |
| 10 to 14 Minutes | 0 (0.0%) | 4 (5.6%) |
| 15 to 19 Minutes | 9 (12.2%) | 1 (1.4%) |
| 20 to 24 Minutes | 13 (17.6%) | 24 (33.8%) |
| 25 to 29 Minutes | 0 (0.0%) | 9 (12.7%) |
| 30 to 34 Minutes | 9 (12.2%) | 5 (7.0%) |
| 35 to 39 Minutes | 3 (4.1%) | 0 (0.0%) |
| 40 to 44 Minutes | 15 (20.3%) | 0 (0.0%) |
| 45 to 59 Minutes | 5 (6.8%) | 17 (23.9%) |
| 60 to 89 Minutes | 13 (17.6%) | 3 (4.2%) |
| 90 or more Minutes | 5 (6.8%) | 1 (1.4%) |
Time of Departure to Work by Sex in Sumner
The most frequent times of departure to work in Sumner are 6:30 AM to 6:59 AM (24, 32.4%) for males and 7:00 AM to 7:29 AM (28, 39.4%) for females.
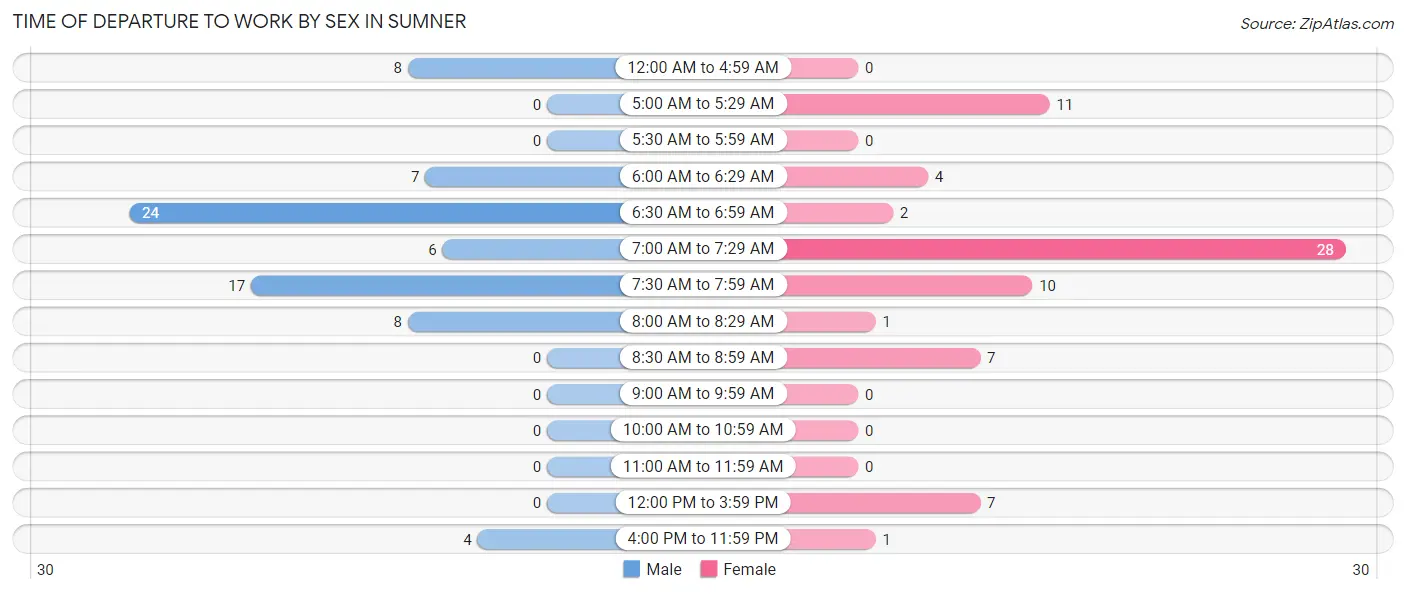
| Time of Departure | Male | Female |
| 12:00 AM to 4:59 AM | 8 (10.8%) | 0 (0.0%) |
| 5:00 AM to 5:29 AM | 0 (0.0%) | 11 (15.5%) |
| 5:30 AM to 5:59 AM | 0 (0.0%) | 0 (0.0%) |
| 6:00 AM to 6:29 AM | 7 (9.5%) | 4 (5.6%) |
| 6:30 AM to 6:59 AM | 24 (32.4%) | 2 (2.8%) |
| 7:00 AM to 7:29 AM | 6 (8.1%) | 28 (39.4%) |
| 7:30 AM to 7:59 AM | 17 (23.0%) | 10 (14.1%) |
| 8:00 AM to 8:29 AM | 8 (10.8%) | 1 (1.4%) |
| 8:30 AM to 8:59 AM | 0 (0.0%) | 7 (9.9%) |
| 9:00 AM to 9:59 AM | 0 (0.0%) | 0 (0.0%) |
| 10:00 AM to 10:59 AM | 0 (0.0%) | 0 (0.0%) |
| 11:00 AM to 11:59 AM | 0 (0.0%) | 0 (0.0%) |
| 12:00 PM to 3:59 PM | 0 (0.0%) | 7 (9.9%) |
| 4:00 PM to 11:59 PM | 4 (5.4%) | 1 (1.4%) |
| Total | 74 (100.0%) | 71 (100.0%) |
Housing Occupancy in Sumner
Occupancy by Ownership in Sumner
Of the total 158 dwellings in Sumner, owner-occupied units account for 103 (65.2%), while renter-occupied units make up 55 (34.8%).
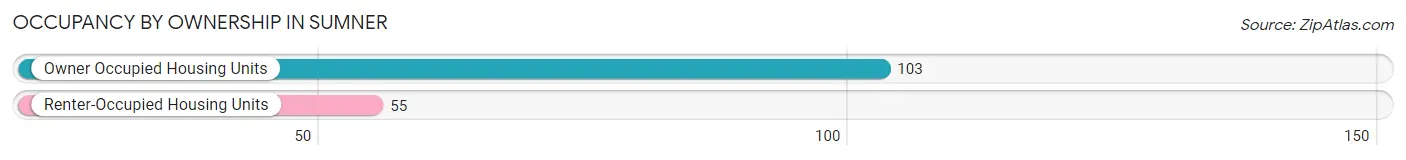
| Occupancy | # Housing Units | % Housing Units |
| Owner Occupied Housing Units | 103 | 65.2% |
| Renter-Occupied Housing Units | 55 | 34.8% |
| Total Occupied Housing Units | 158 | 100.0% |
Occupancy by Household Size in Sumner
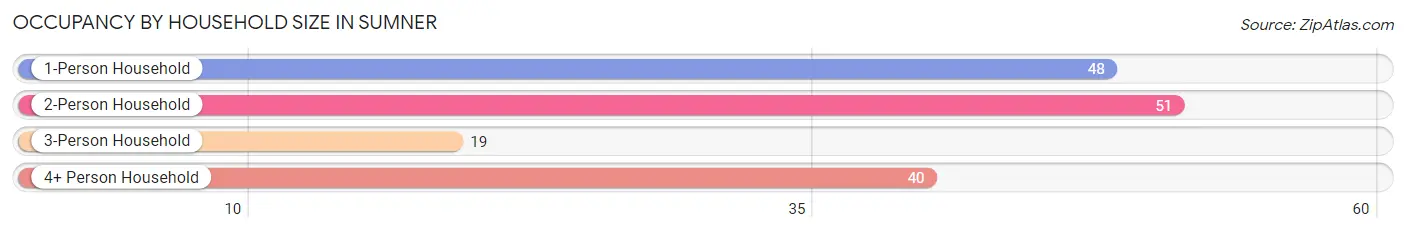
| Household Size | # Housing Units | % Housing Units |
| 1-Person Household | 48 | 30.4% |
| 2-Person Household | 51 | 32.3% |
| 3-Person Household | 19 | 12.0% |
| 4+ Person Household | 40 | 25.3% |
| Total Housing Units | 158 | 100.0% |
Occupancy by Ownership by Household Size in Sumner
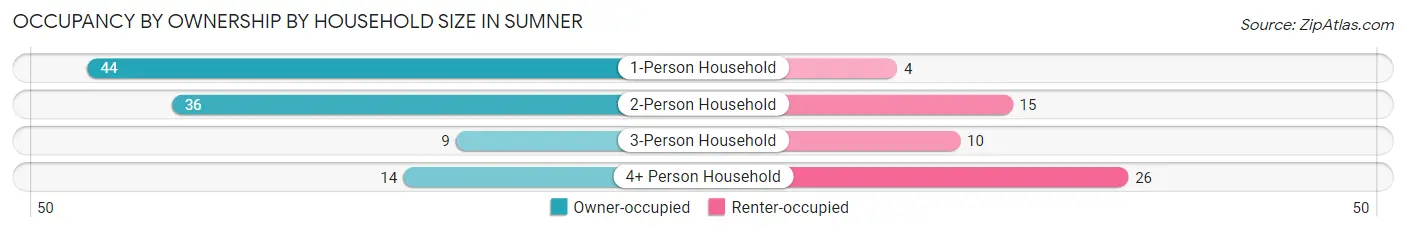
| Household Size | Owner-occupied | Renter-occupied |
| 1-Person Household | 44 (91.7%) | 4 (8.3%) |
| 2-Person Household | 36 (70.6%) | 15 (29.4%) |
| 3-Person Household | 9 (47.4%) | 10 (52.6%) |
| 4+ Person Household | 14 (35.0%) | 26 (65.0%) |
| Total Housing Units | 103 (65.2%) | 55 (34.8%) |
Occupancy by Educational Attainment in Sumner
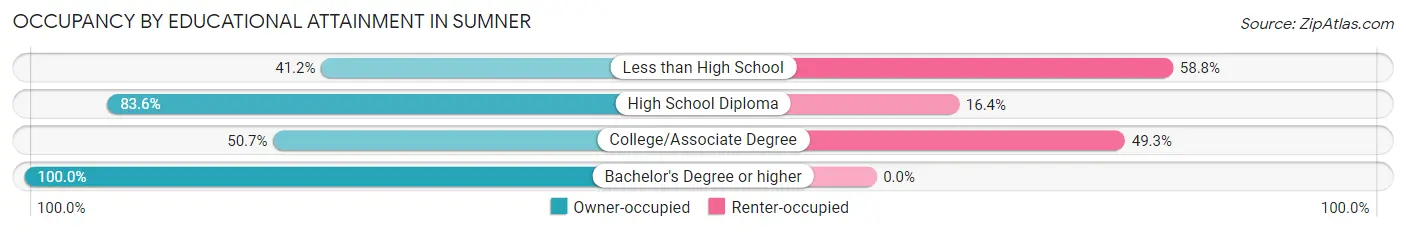
| Household Size | Owner-occupied | Renter-occupied |
| Less than High School | 7 (41.2%) | 10 (58.8%) |
| High School Diploma | 51 (83.6%) | 10 (16.4%) |
| College/Associate Degree | 36 (50.7%) | 35 (49.3%) |
| Bachelor's Degree or higher | 9 (100.0%) | 0 (0.0%) |
Occupancy by Age of Householder in Sumner
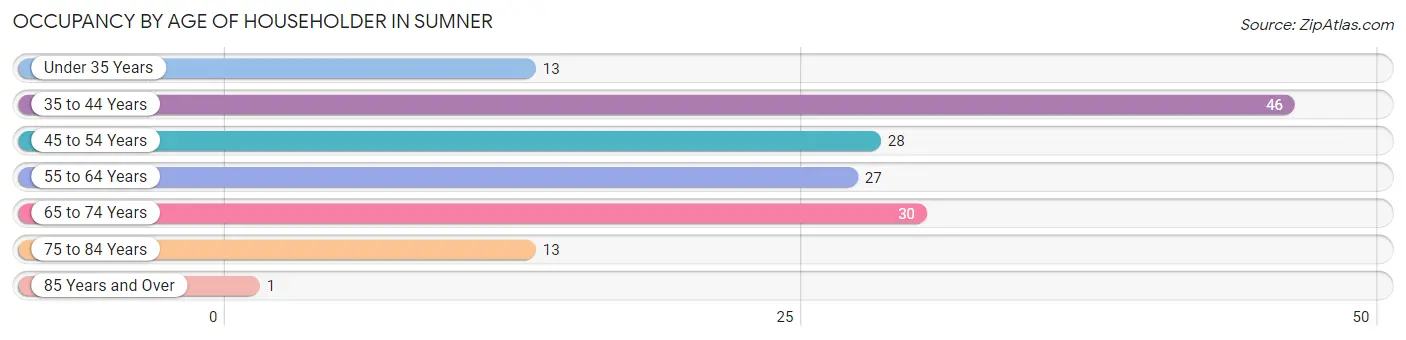
| Age Bracket | # Households | % Households |
| Under 35 Years | 13 | 8.2% |
| 35 to 44 Years | 46 | 29.1% |
| 45 to 54 Years | 28 | 17.7% |
| 55 to 64 Years | 27 | 17.1% |
| 65 to 74 Years | 30 | 19.0% |
| 75 to 84 Years | 13 | 8.2% |
| 85 Years and Over | 1 | 0.6% |
| Total | 158 | 100.0% |
Housing Finances in Sumner
Median Income by Occupancy in Sumner
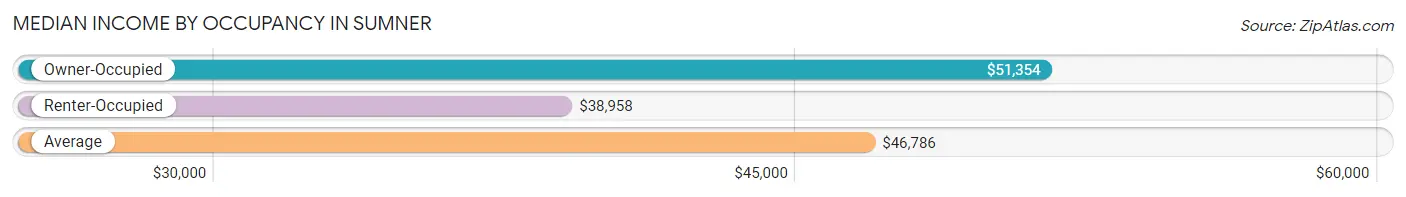
| Occupancy Type | # Households | Median Income |
| Owner-Occupied | 103 (65.2%) | $51,354 |
| Renter-Occupied | 55 (34.8%) | $38,958 |
| Average | 158 (100.0%) | $46,786 |
Occupancy by Householder Income Bracket in Sumner
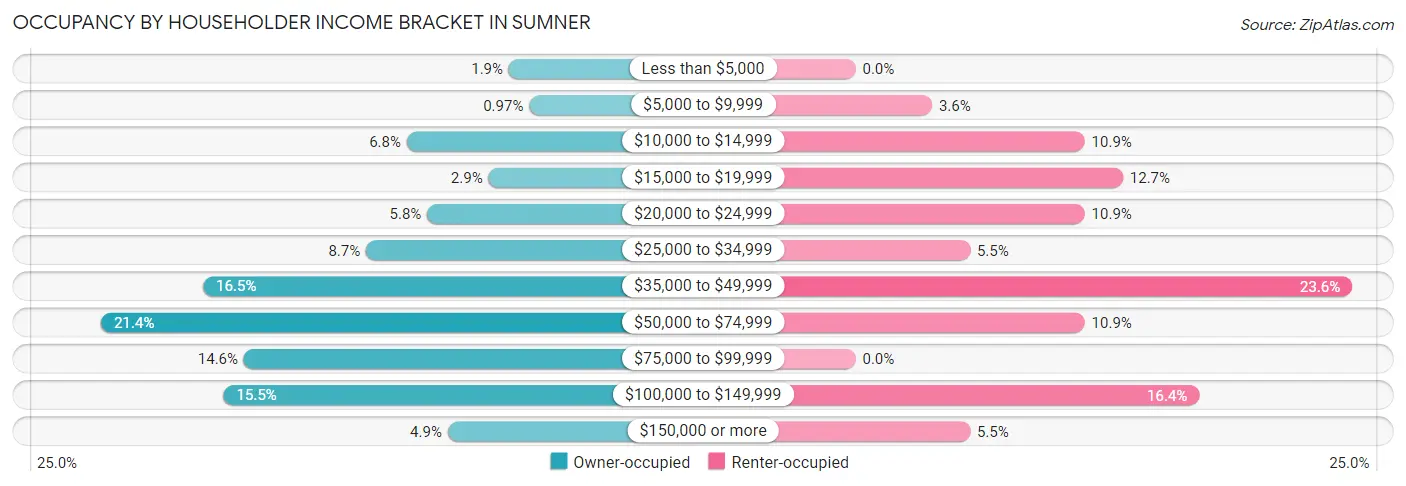
| Income Bracket | Owner-occupied | Renter-occupied |
| Less than $5,000 | 2 (1.9%) | 0 (0.0%) |
| $5,000 to $9,999 | 1 (1.0%) | 2 (3.6%) |
| $10,000 to $14,999 | 7 (6.8%) | 6 (10.9%) |
| $15,000 to $19,999 | 3 (2.9%) | 7 (12.7%) |
| $20,000 to $24,999 | 6 (5.8%) | 6 (10.9%) |
| $25,000 to $34,999 | 9 (8.7%) | 3 (5.4%) |
| $35,000 to $49,999 | 17 (16.5%) | 13 (23.6%) |
| $50,000 to $74,999 | 22 (21.4%) | 6 (10.9%) |
| $75,000 to $99,999 | 15 (14.6%) | 0 (0.0%) |
| $100,000 to $149,999 | 16 (15.5%) | 9 (16.4%) |
| $150,000 or more | 5 (4.9%) | 3 (5.4%) |
| Total | 103 (100.0%) | 55 (100.0%) |
Monthly Housing Cost Tiers in Sumner
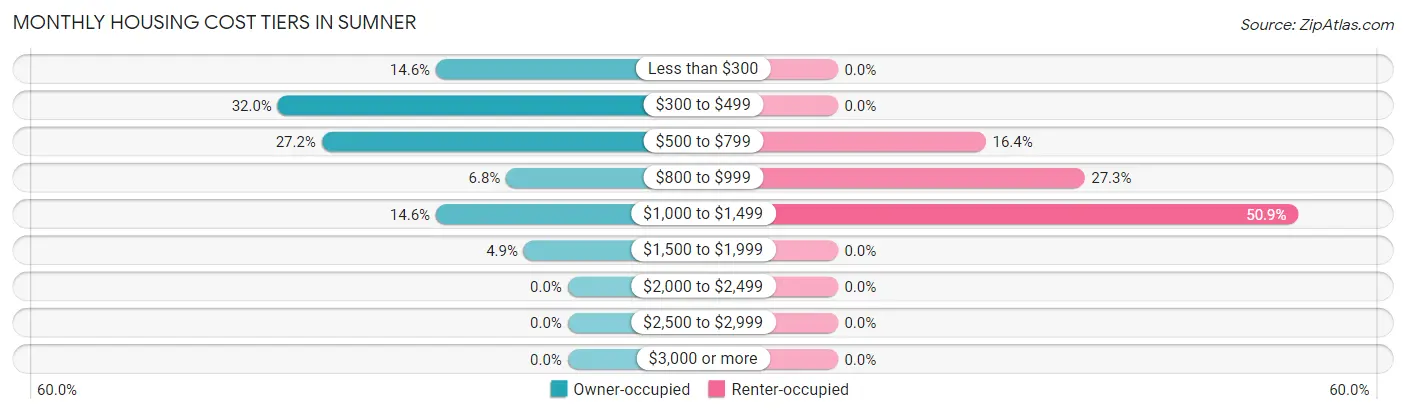
| Monthly Cost | Owner-occupied | Renter-occupied |
| Less than $300 | 15 (14.6%) | 0 (0.0%) |
| $300 to $499 | 33 (32.0%) | 0 (0.0%) |
| $500 to $799 | 28 (27.2%) | 9 (16.4%) |
| $800 to $999 | 7 (6.8%) | 15 (27.3%) |
| $1,000 to $1,499 | 15 (14.6%) | 28 (50.9%) |
| $1,500 to $1,999 | 5 (4.9%) | 0 (0.0%) |
| $2,000 to $2,499 | 0 (0.0%) | 0 (0.0%) |
| $2,500 to $2,999 | 0 (0.0%) | 0 (0.0%) |
| $3,000 or more | 0 (0.0%) | 0 (0.0%) |
| Total | 103 (100.0%) | 55 (100.0%) |
Physical Housing Characteristics in Sumner
Housing Structures in Sumner
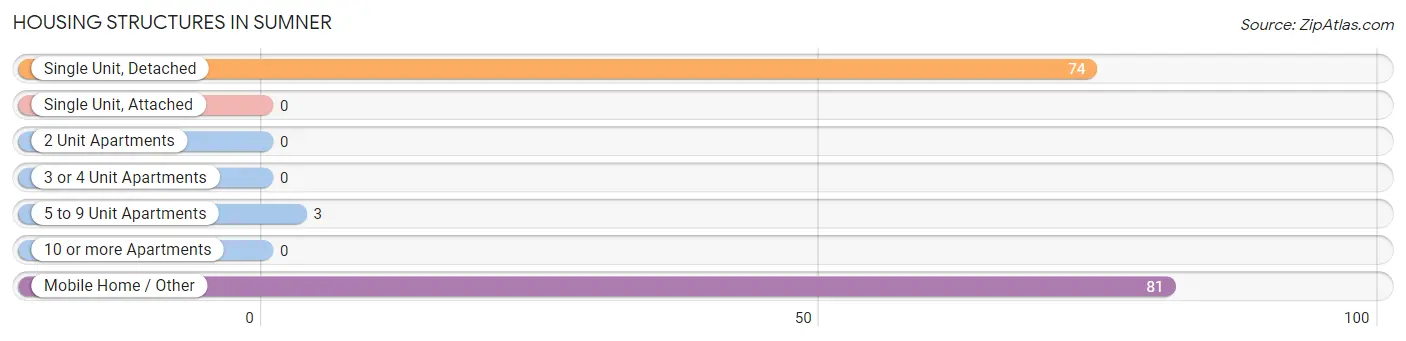
| Structure Type | # Housing Units | % Housing Units |
| Single Unit, Detached | 74 | 46.8% |
| Single Unit, Attached | 0 | 0.0% |
| 2 Unit Apartments | 0 | 0.0% |
| 3 or 4 Unit Apartments | 0 | 0.0% |
| 5 to 9 Unit Apartments | 3 | 1.9% |
| 10 or more Apartments | 0 | 0.0% |
| Mobile Home / Other | 81 | 51.3% |
| Total | 158 | 100.0% |
Housing Structures by Occupancy in Sumner
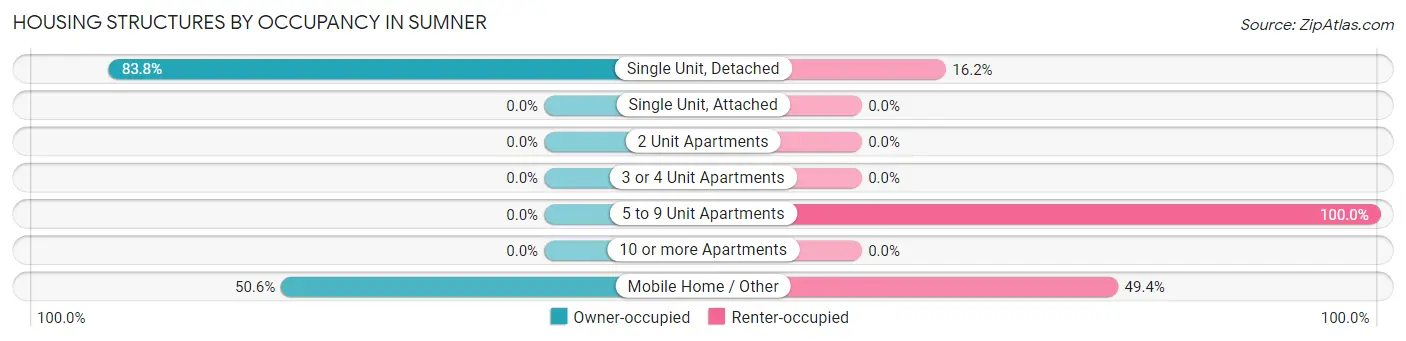
| Structure Type | Owner-occupied | Renter-occupied |
| Single Unit, Detached | 62 (83.8%) | 12 (16.2%) |
| Single Unit, Attached | 0 (0.0%) | 0 (0.0%) |
| 2 Unit Apartments | 0 (0.0%) | 0 (0.0%) |
| 3 or 4 Unit Apartments | 0 (0.0%) | 0 (0.0%) |
| 5 to 9 Unit Apartments | 0 (0.0%) | 3 (100.0%) |
| 10 or more Apartments | 0 (0.0%) | 0 (0.0%) |
| Mobile Home / Other | 41 (50.6%) | 40 (49.4%) |
| Total | 103 (65.2%) | 55 (34.8%) |
Housing Structures by Number of Rooms in Sumner
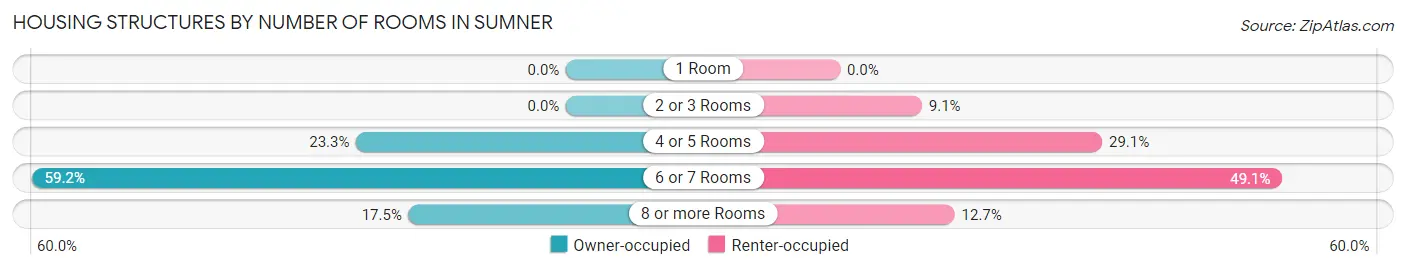
| Number of Rooms | Owner-occupied | Renter-occupied |
| 1 Room | 0 (0.0%) | 0 (0.0%) |
| 2 or 3 Rooms | 0 (0.0%) | 5 (9.1%) |
| 4 or 5 Rooms | 24 (23.3%) | 16 (29.1%) |
| 6 or 7 Rooms | 61 (59.2%) | 27 (49.1%) |
| 8 or more Rooms | 18 (17.5%) | 7 (12.7%) |
| Total | 103 (100.0%) | 55 (100.0%) |
Housing Structure by Heating Type in Sumner
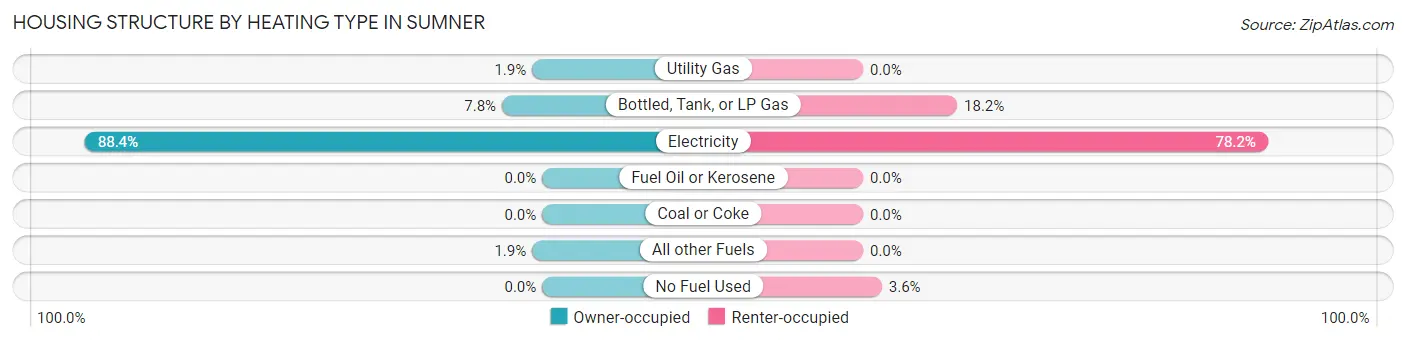
| Heating Type | Owner-occupied | Renter-occupied |
| Utility Gas | 2 (1.9%) | 0 (0.0%) |
| Bottled, Tank, or LP Gas | 8 (7.8%) | 10 (18.2%) |
| Electricity | 91 (88.3%) | 43 (78.2%) |
| Fuel Oil or Kerosene | 0 (0.0%) | 0 (0.0%) |
| Coal or Coke | 0 (0.0%) | 0 (0.0%) |
| All other Fuels | 2 (1.9%) | 0 (0.0%) |
| No Fuel Used | 0 (0.0%) | 2 (3.6%) |
| Total | 103 (100.0%) | 55 (100.0%) |
Household Vehicle Usage in Sumner
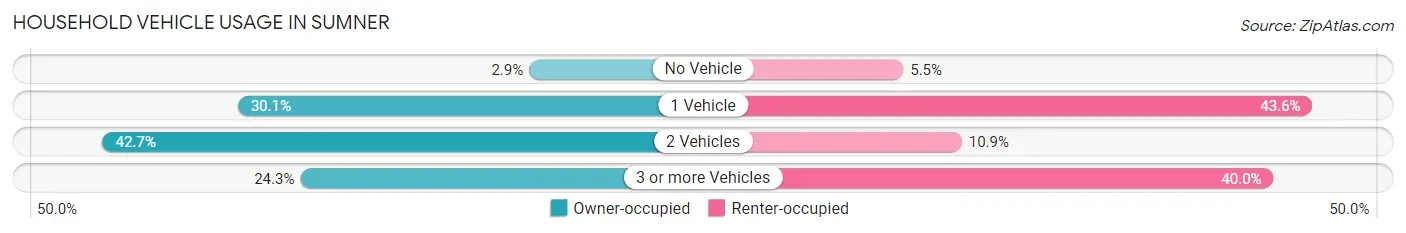
| Vehicles per Household | Owner-occupied | Renter-occupied |
| No Vehicle | 3 (2.9%) | 3 (5.4%) |
| 1 Vehicle | 31 (30.1%) | 24 (43.6%) |
| 2 Vehicles | 44 (42.7%) | 6 (10.9%) |
| 3 or more Vehicles | 25 (24.3%) | 22 (40.0%) |
| Total | 103 (100.0%) | 55 (100.0%) |
Real Estate & Mortgages in Sumner
Real Estate and Mortgage Overview in Sumner
| Characteristic | Without Mortgage | With Mortgage |
| Housing Units | 64 | 39 |
| Median Property Value | $57,500 | $101,000 |
| Median Household Income | $57,857 | $0 |
| Monthly Housing Costs | $430 | $0 |
| Real Estate Taxes | $648 | $2 |
Property Value by Mortgage Status in Sumner
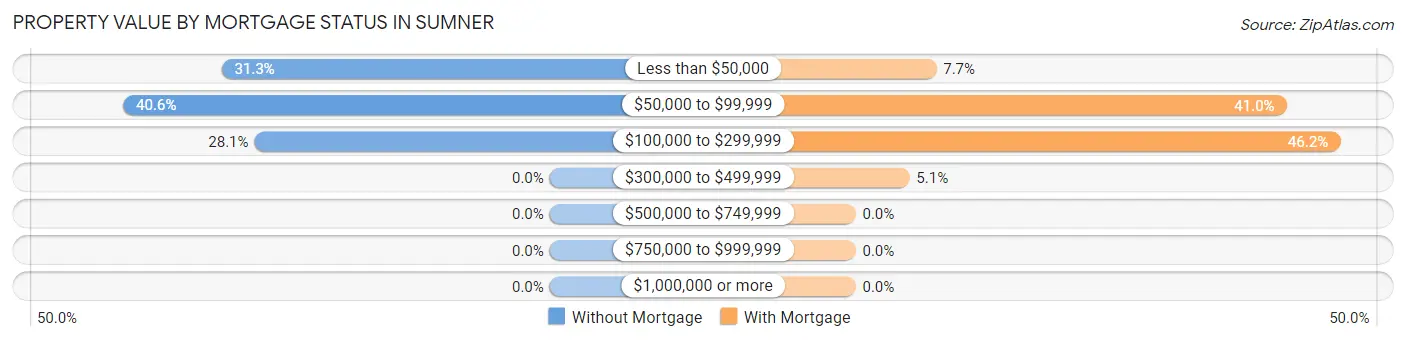
| Property Value | Without Mortgage | With Mortgage |
| Less than $50,000 | 20 (31.2%) | 3 (7.7%) |
| $50,000 to $99,999 | 26 (40.6%) | 16 (41.0%) |
| $100,000 to $299,999 | 18 (28.1%) | 18 (46.2%) |
| $300,000 to $499,999 | 0 (0.0%) | 2 (5.1%) |
| $500,000 to $749,999 | 0 (0.0%) | 0 (0.0%) |
| $750,000 to $999,999 | 0 (0.0%) | 0 (0.0%) |
| $1,000,000 or more | 0 (0.0%) | 0 (0.0%) |
| Total | 64 (100.0%) | 39 (100.0%) |
Household Income by Mortgage Status in Sumner
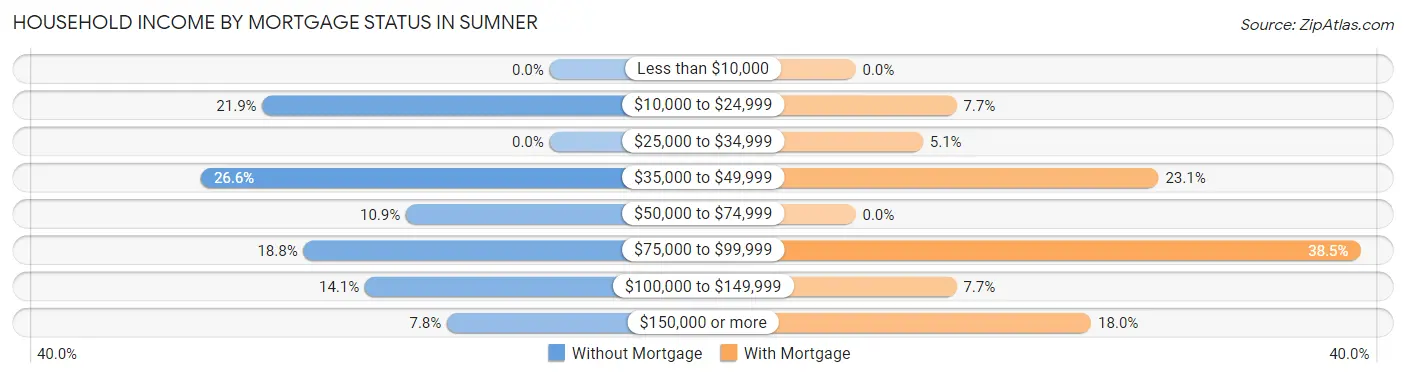
| Household Income | Without Mortgage | With Mortgage |
| Less than $10,000 | 0 (0.0%) | 0 (0.0%) |
| $10,000 to $24,999 | 14 (21.9%) | 3 (7.7%) |
| $25,000 to $34,999 | 0 (0.0%) | 2 (5.1%) |
| $35,000 to $49,999 | 17 (26.6%) | 9 (23.1%) |
| $50,000 to $74,999 | 7 (10.9%) | 0 (0.0%) |
| $75,000 to $99,999 | 12 (18.8%) | 15 (38.5%) |
| $100,000 to $149,999 | 9 (14.1%) | 3 (7.7%) |
| $150,000 or more | 5 (7.8%) | 7 (17.9%) |
| Total | 64 (100.0%) | 39 (100.0%) |
Property Value to Household Income Ratio in Sumner
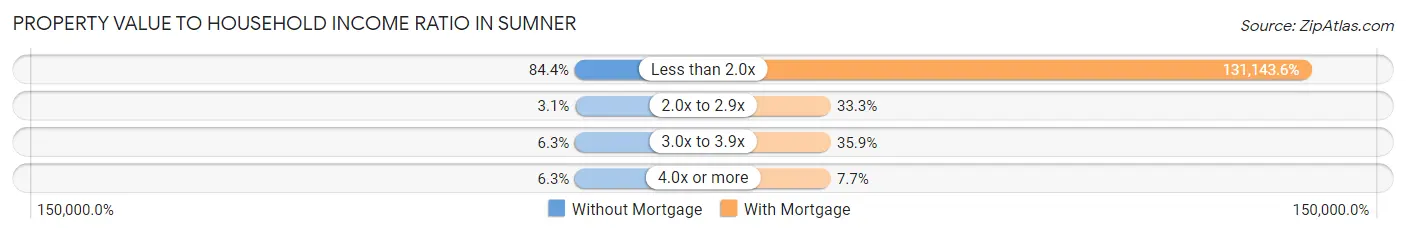
| Value-to-Income Ratio | Without Mortgage | With Mortgage |
| Less than 2.0x | 54 (84.4%) | 51,146 (131,143.6%) |
| 2.0x to 2.9x | 2 (3.1%) | 13 (33.3%) |
| 3.0x to 3.9x | 4 (6.2%) | 14 (35.9%) |
| 4.0x or more | 4 (6.2%) | 3 (7.7%) |
| Total | 64 (100.0%) | 39 (100.0%) |
Real Estate Taxes by Mortgage Status in Sumner
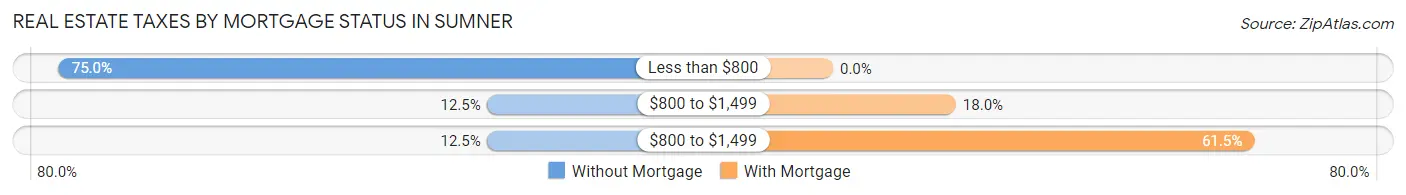
| Property Taxes | Without Mortgage | With Mortgage |
| Less than $800 | 48 (75.0%) | 0 (0.0%) |
| $800 to $1,499 | 8 (12.5%) | 7 (17.9%) |
| $800 to $1,499 | 8 (12.5%) | 24 (61.5%) |
| Total | 64 (100.0%) | 39 (100.0%) |
Health & Disability in Sumner
Health Insurance Coverage by Age in Sumner
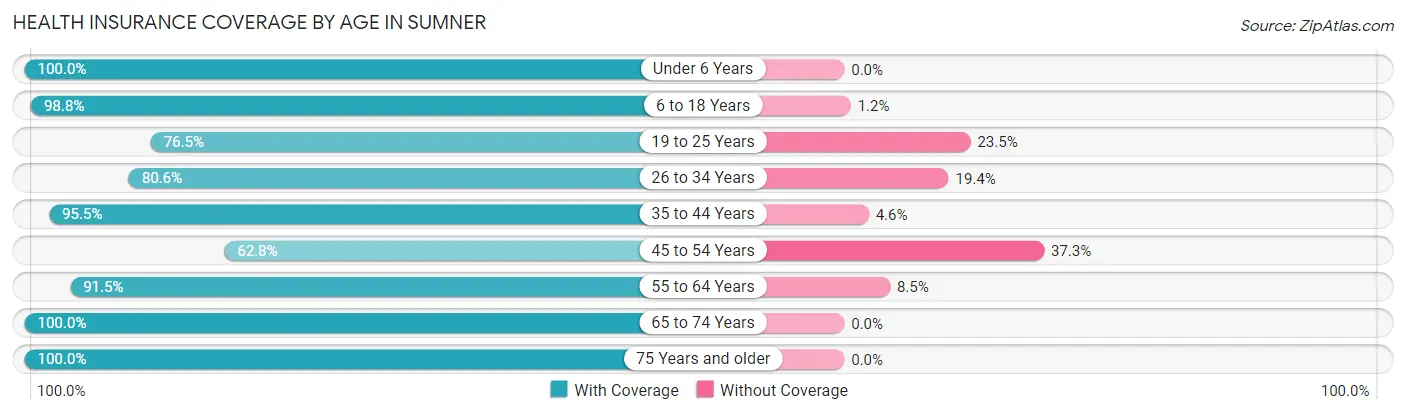
| Age Bracket | With Coverage | Without Coverage |
| Under 6 Years | 27 (100.0%) | 0 (0.0%) |
| 6 to 18 Years | 82 (98.8%) | 1 (1.2%) |
| 19 to 25 Years | 26 (76.5%) | 8 (23.5%) |
| 26 to 34 Years | 29 (80.6%) | 7 (19.4%) |
| 35 to 44 Years | 63 (95.5%) | 3 (4.5%) |
| 45 to 54 Years | 32 (62.7%) | 19 (37.2%) |
| 55 to 64 Years | 43 (91.5%) | 4 (8.5%) |
| 65 to 74 Years | 41 (100.0%) | 0 (0.0%) |
| 75 Years and older | 19 (100.0%) | 0 (0.0%) |
| Total | 362 (89.6%) | 42 (10.4%) |
Health Insurance Coverage by Citizenship Status in Sumner
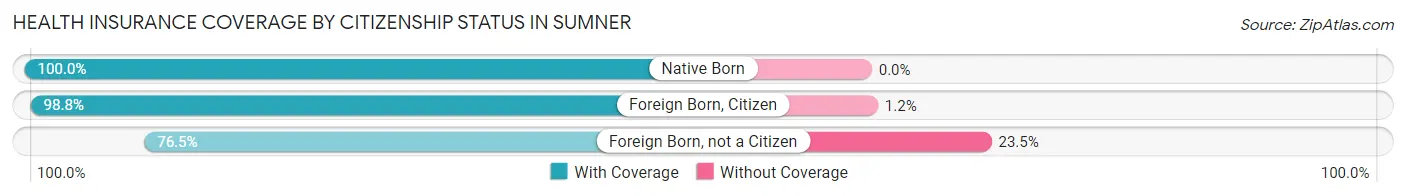
| Citizenship Status | With Coverage | Without Coverage |
| Native Born | 27 (100.0%) | 0 (0.0%) |
| Foreign Born, Citizen | 82 (98.8%) | 1 (1.2%) |
| Foreign Born, not a Citizen | 26 (76.5%) | 8 (23.5%) |
Health Insurance Coverage by Household Income in Sumner
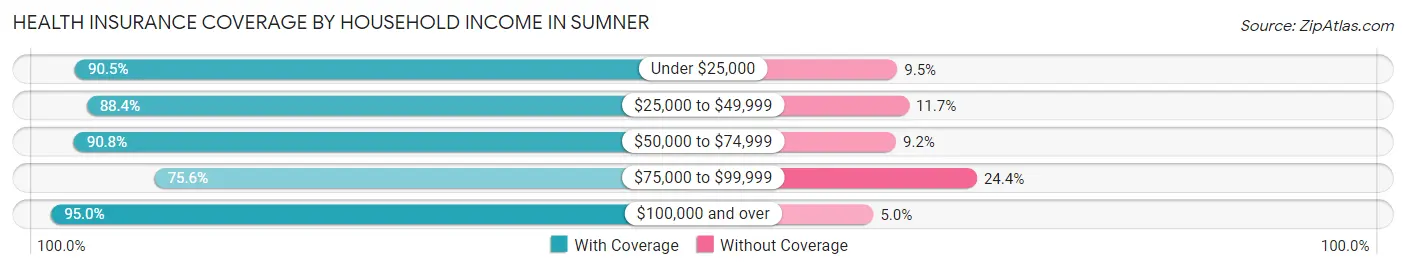
| Household Income | With Coverage | Without Coverage |
| Under $25,000 | 86 (90.5%) | 9 (9.5%) |
| $25,000 to $49,999 | 91 (88.3%) | 12 (11.7%) |
| $50,000 to $74,999 | 59 (90.8%) | 6 (9.2%) |
| $75,000 to $99,999 | 31 (75.6%) | 10 (24.4%) |
| $100,000 and over | 95 (95.0%) | 5 (5.0%) |
Public vs Private Health Insurance Coverage by Age in Sumner
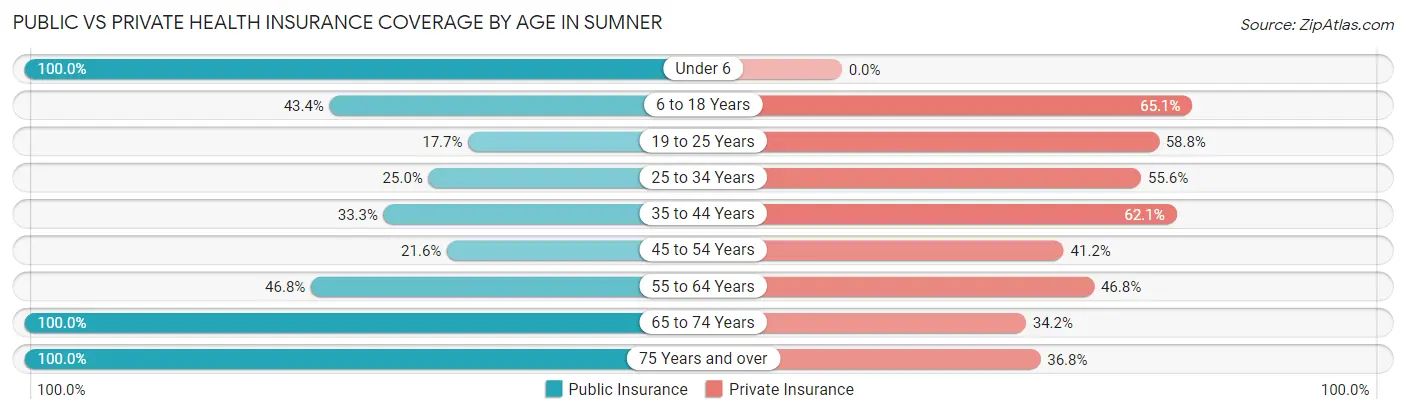
| Age Bracket | Public Insurance | Private Insurance |
| Under 6 | 27 (100.0%) | 0 (0.0%) |
| 6 to 18 Years | 36 (43.4%) | 54 (65.1%) |
| 19 to 25 Years | 6 (17.6%) | 20 (58.8%) |
| 25 to 34 Years | 9 (25.0%) | 20 (55.6%) |
| 35 to 44 Years | 22 (33.3%) | 41 (62.1%) |
| 45 to 54 Years | 11 (21.6%) | 21 (41.2%) |
| 55 to 64 Years | 22 (46.8%) | 22 (46.8%) |
| 65 to 74 Years | 41 (100.0%) | 14 (34.2%) |
| 75 Years and over | 19 (100.0%) | 7 (36.8%) |
| Total | 193 (47.8%) | 199 (49.3%) |
Disability Status by Sex by Age in Sumner
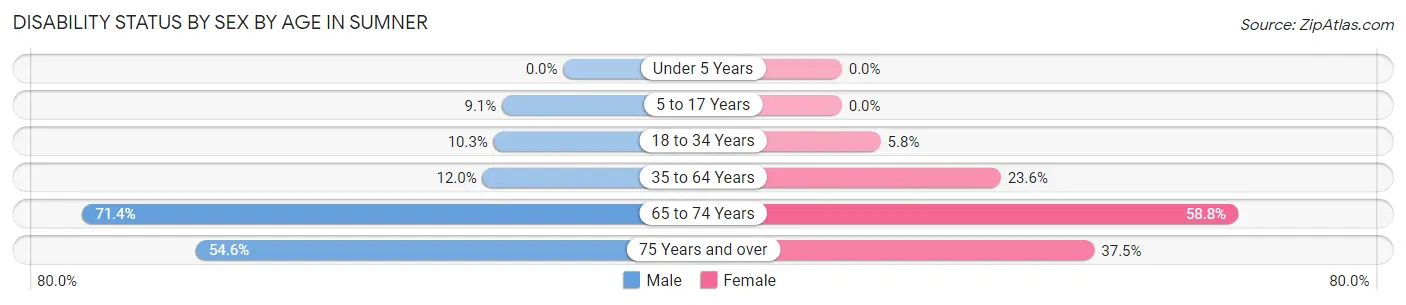
| Age Bracket | Male | Female |
| Under 5 Years | 0 (0.0%) | 0 (0.0%) |
| 5 to 17 Years | 3 (9.1%) | 0 (0.0%) |
| 18 to 34 Years | 3 (10.3%) | 3 (5.8%) |
| 35 to 64 Years | 9 (12.0%) | 21 (23.6%) |
| 65 to 74 Years | 5 (71.4%) | 20 (58.8%) |
| 75 Years and over | 6 (54.5%) | 3 (37.5%) |
Disability Class by Sex by Age in Sumner
Disability Class: Hearing Difficulty
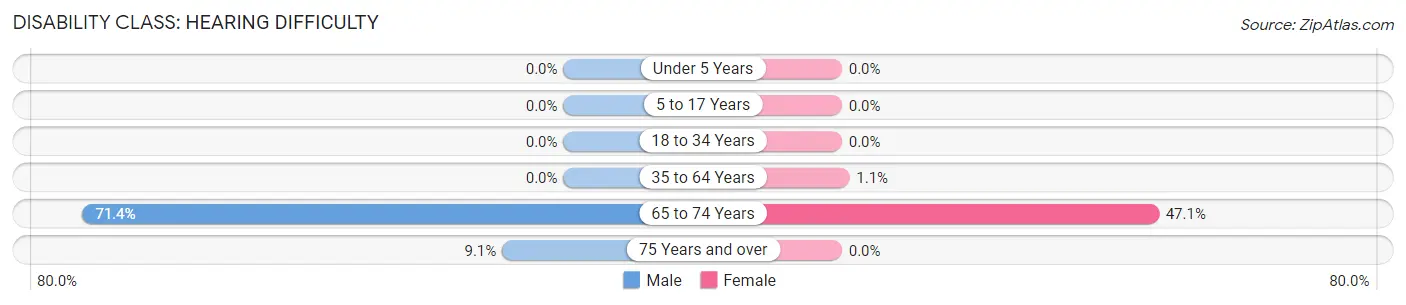
| Age Bracket | Male | Female |
| Under 5 Years | 0 (0.0%) | 0 (0.0%) |
| 5 to 17 Years | 0 (0.0%) | 0 (0.0%) |
| 18 to 34 Years | 0 (0.0%) | 0 (0.0%) |
| 35 to 64 Years | 0 (0.0%) | 1 (1.1%) |
| 65 to 74 Years | 5 (71.4%) | 16 (47.1%) |
| 75 Years and over | 1 (9.1%) | 0 (0.0%) |
Disability Class: Vision Difficulty
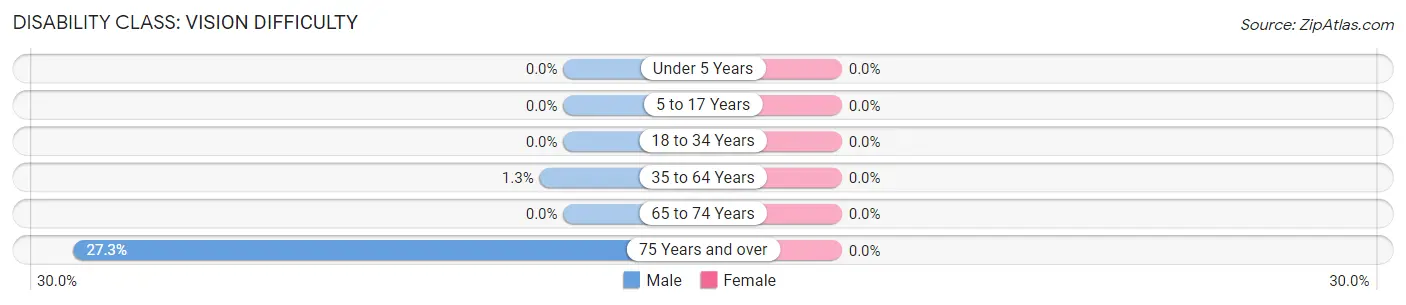
| Age Bracket | Male | Female |
| Under 5 Years | 0 (0.0%) | 0 (0.0%) |
| 5 to 17 Years | 0 (0.0%) | 0 (0.0%) |
| 18 to 34 Years | 0 (0.0%) | 0 (0.0%) |
| 35 to 64 Years | 1 (1.3%) | 0 (0.0%) |
| 65 to 74 Years | 0 (0.0%) | 0 (0.0%) |
| 75 Years and over | 3 (27.3%) | 0 (0.0%) |
Disability Class: Cognitive Difficulty
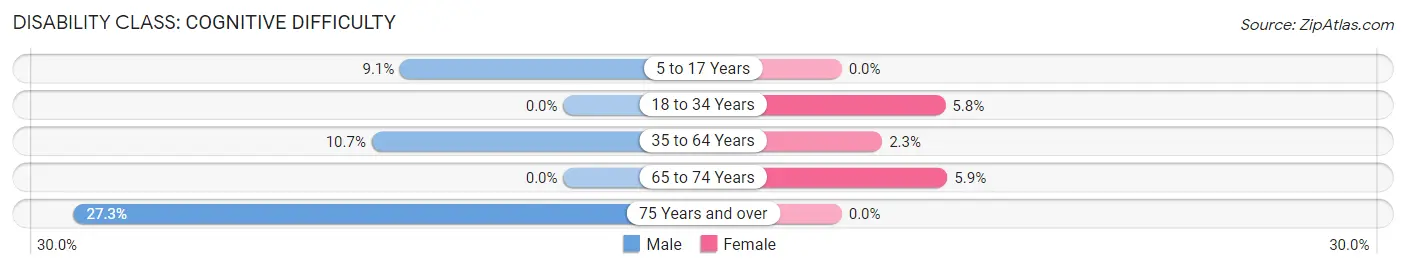
| Age Bracket | Male | Female |
| 5 to 17 Years | 3 (9.1%) | 0 (0.0%) |
| 18 to 34 Years | 0 (0.0%) | 3 (5.8%) |
| 35 to 64 Years | 8 (10.7%) | 2 (2.2%) |
| 65 to 74 Years | 0 (0.0%) | 2 (5.9%) |
| 75 Years and over | 3 (27.3%) | 0 (0.0%) |
Disability Class: Ambulatory Difficulty
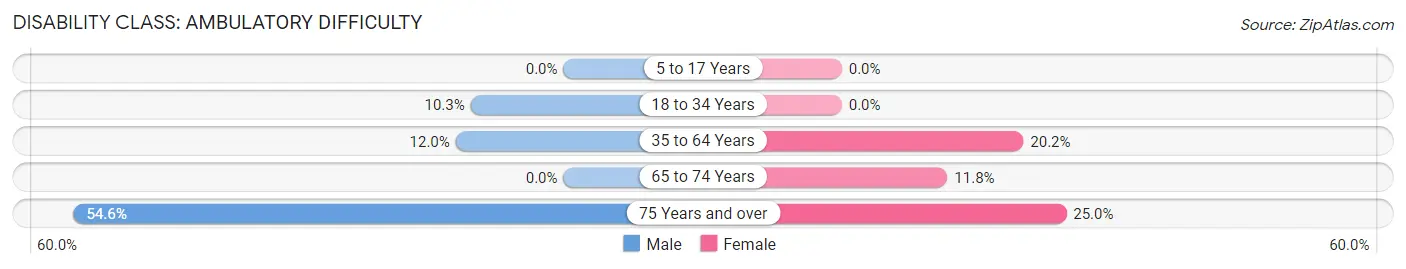
| Age Bracket | Male | Female |
| 5 to 17 Years | 0 (0.0%) | 0 (0.0%) |
| 18 to 34 Years | 3 (10.3%) | 0 (0.0%) |
| 35 to 64 Years | 9 (12.0%) | 18 (20.2%) |
| 65 to 74 Years | 0 (0.0%) | 4 (11.8%) |
| 75 Years and over | 6 (54.5%) | 2 (25.0%) |
Disability Class: Self-Care Difficulty
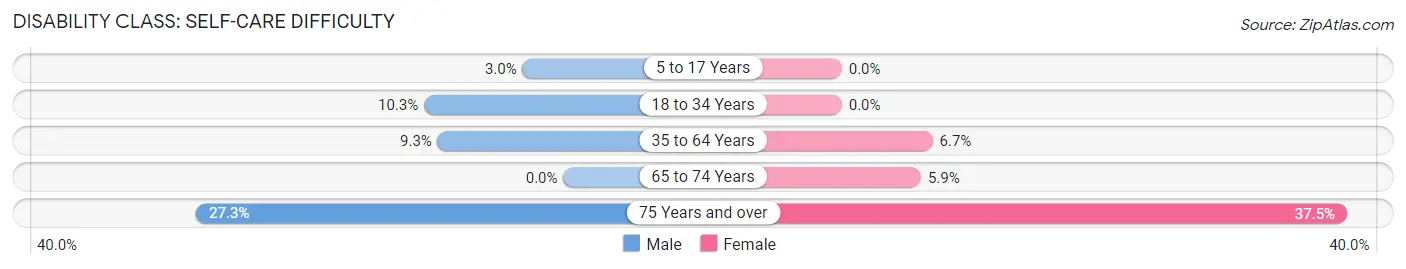
| Age Bracket | Male | Female |
| 5 to 17 Years | 1 (3.0%) | 0 (0.0%) |
| 18 to 34 Years | 3 (10.3%) | 0 (0.0%) |
| 35 to 64 Years | 7 (9.3%) | 6 (6.7%) |
| 65 to 74 Years | 0 (0.0%) | 2 (5.9%) |
| 75 Years and over | 3 (27.3%) | 3 (37.5%) |
Technology Access in Sumner
Computing Device Access in Sumner
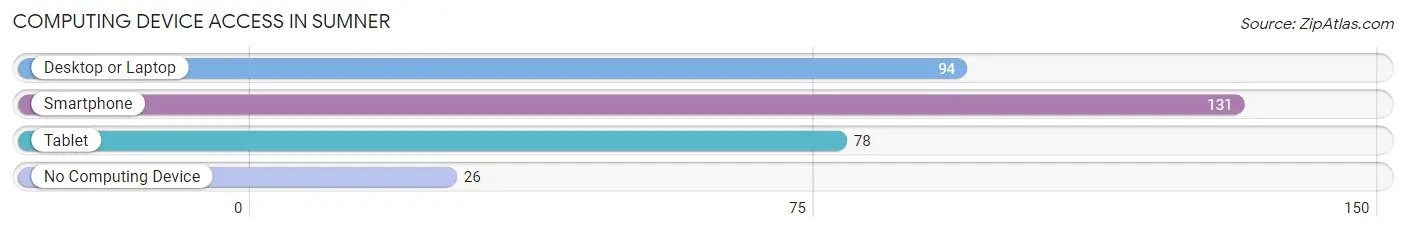
| Device Type | # Households | % Households |
| Desktop or Laptop | 94 | 59.5% |
| Smartphone | 131 | 82.9% |
| Tablet | 78 | 49.4% |
| No Computing Device | 26 | 16.5% |
| Total | 158 | 100.0% |
Internet Access in Sumner
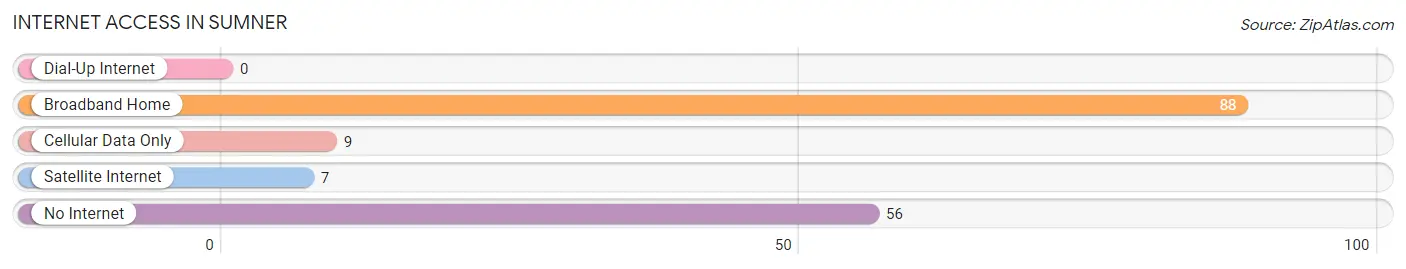
| Internet Type | # Households | % Households |
| Dial-Up Internet | 0 | 0.0% |
| Broadband Home | 88 | 55.7% |
| Cellular Data Only | 9 | 5.7% |
| Satellite Internet | 7 | 4.4% |
| No Internet | 56 | 35.4% |
| Total | 158 | 100.0% |
Sumner Summary
Sumner, Georgia is a small town located in the northwest corner of the state, near the Alabama border. It is part of the Chattahoochee Valley region and is situated in the foothills of the Appalachian Mountains. The town was founded in 1832 and has a population of just over 1,000 people.
Geography
Sumner is located in the northwest corner of Georgia, near the Alabama border. It is part of the Chattahoochee Valley region and is situated in the foothills of the Appalachian Mountains. The town is located on the banks of the Chattahoochee River, which provides a natural border between Georgia and Alabama. The town is surrounded by rolling hills and lush forests, making it a popular destination for outdoor recreation.
History
Sumner was founded in 1832 by settlers from North Carolina. The town was named after General Jethro Sumner, a Revolutionary War hero. The town quickly grew and became a center of commerce and industry in the region. In the late 19th century, the town was home to several cotton mills and other manufacturing businesses. The town also had a thriving agricultural industry, with cotton, corn, and other crops being grown in the area.
In the early 20th century, the town began to decline as the cotton industry moved away from the area. The town was also affected by the Great Depression, which caused many businesses to close. However, the town was able to survive and remain a small, rural community.
Economy
Sumner’s economy is largely based on agriculture and tourism. The town is home to several farms, which produce cotton, corn, and other crops. The town also has a thriving tourism industry, with visitors coming to the area to enjoy the natural beauty of the Appalachian Mountains.
The town also has several small businesses, including restaurants, shops, and other services. The town is also home to a few manufacturing businesses, which produce a variety of products.
Demographics
As of the 2010 census, Sumner had a population of 1,072 people. The town is predominantly white, with African Americans making up about 10% of the population. The median household income is $31,250, and the median age is 41.
Conclusion
Sumner, Georgia is a small town located in the northwest corner of the state, near the Alabama border. It is part of the Chattahoochee Valley region and is situated in the foothills of the Appalachian Mountains. The town was founded in 1832 and has a population of just over 1,000 people. The town’s economy is largely based on agriculture and tourism, and it is home to several small businesses. The town is predominantly white, with African Americans making up about 10% of the population. Sumner is a small, rural community that has managed to survive despite the decline of the cotton industry and the Great Depression.
Common Questions
What is the Total Population of Sumner?
Total Population of Sumner is 404.
What is the Total Male Population of Sumner?
Total Male Population of Sumner is 169.
What is the Total Female Population of Sumner?
Total Female Population of Sumner is 235.
What is the Ratio of Males per 100 Females in Sumner?
There are 71.91 Males per 100 Females in Sumner.
What is the Ratio of Females per 100 Males in Sumner?
There are 139.05 Females per 100 Males in Sumner.
What is the Median Population Age in Sumner?
Median Population Age in Sumner is 40.0 Years.
What is the Average Family Size in Sumner
Average Family Size in Sumner is 3.3 People.
What is the Average Household Size in Sumner
Average Household Size in Sumner is 2.6 People.
What is Per Capita Income in Sumner?
Per Capita income in Sumner is $24,658.
What is the Median Family Income in Sumner?
Median Family Income in Sumner is $52,500.
What is the Median Household income in Sumner?
Median Household Income in Sumner is $46,786.
What is Inequality or Gini Index in Sumner?
Inequality or Gini Index in Sumner is 0.43.
How Large is the Labor Force in Sumner?
There are 170 People in the Labor Forcein in Sumner.
What is the Percentage of People in the Labor Force in Sumner?
53.1% of People are in the Labor Force in Sumner.
What is the Unemployment Rate in Sumner?
Unemployment Rate in Sumner is 3.5%.