Reed Creek, GA
Reed Creek Map
Reed Creek Overview
2,803
TOTAL POPULATION
1,393
MALE POPULATION
1,410
FEMALE POPULATION
98.79
MALES / 100 FEMALES
101.22
FEMALES / 100 MALES
60.1
MEDIAN AGE
2.5
AVG FAMILY SIZE
2.0
AVG HOUSEHOLD SIZE
$43,373
PER CAPITA INCOME
$96,983
AVG FAMILY INCOME
$68,765
AVG HOUSEHOLD INCOME
33.7%
WAGE / INCOME GAP [ % ]
66.3¢/ $1
WAGE / INCOME GAP [ $ ]
0.47
INEQUALITY / GINI INDEX
1,112
LABOR FORCE [ PEOPLE ]
41.6%
PERCENT IN LABOR FORCE
5.3%
UNEMPLOYMENT RATE
Race in Reed Creek
The most populous races in Reed Creek are White / Caucasian (2,611 | 93.1%), Two or more Races (123 | 4.4%), and Black / African American (69 | 2.5%).
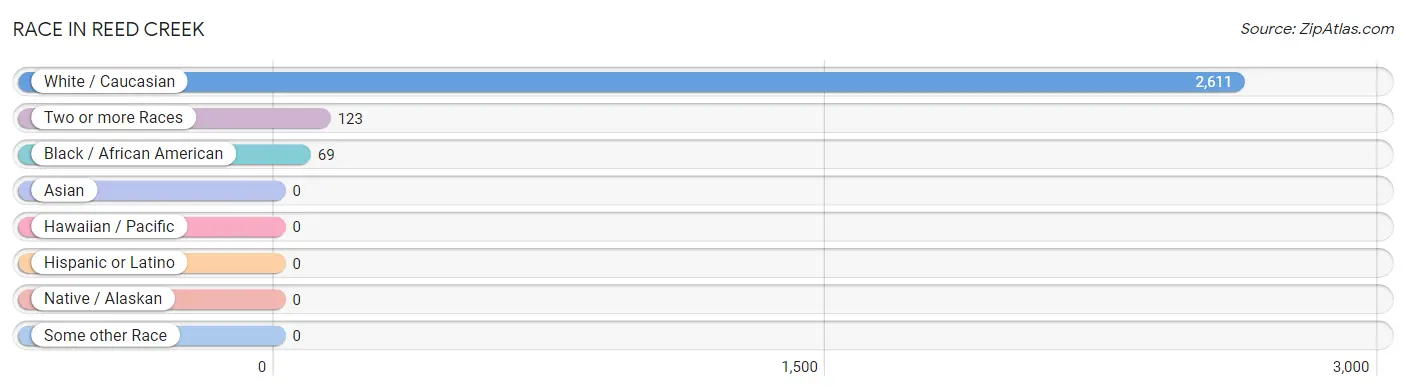
| Race | # Population | % Population |
| Asian | 0 | 0.0% |
| Black / African American | 69 | 2.5% |
| Hawaiian / Pacific | 0 | 0.0% |
| Hispanic or Latino | 0 | 0.0% |
| Native / Alaskan | 0 | 0.0% |
| White / Caucasian | 2,611 | 93.1% |
| Two or more Races | 123 | 4.4% |
| Some other Race | 0 | 0.0% |
| Total | 2,803 | 100.0% |
Ancestry in Reed Creek
The most populous ancestries reported in Reed Creek are German (451 | 16.1%), American (348 | 12.4%), Irish (311 | 11.1%), English (188 | 6.7%), and Polish (129 | 4.6%), together accounting for 50.9% of all Reed Creek residents.
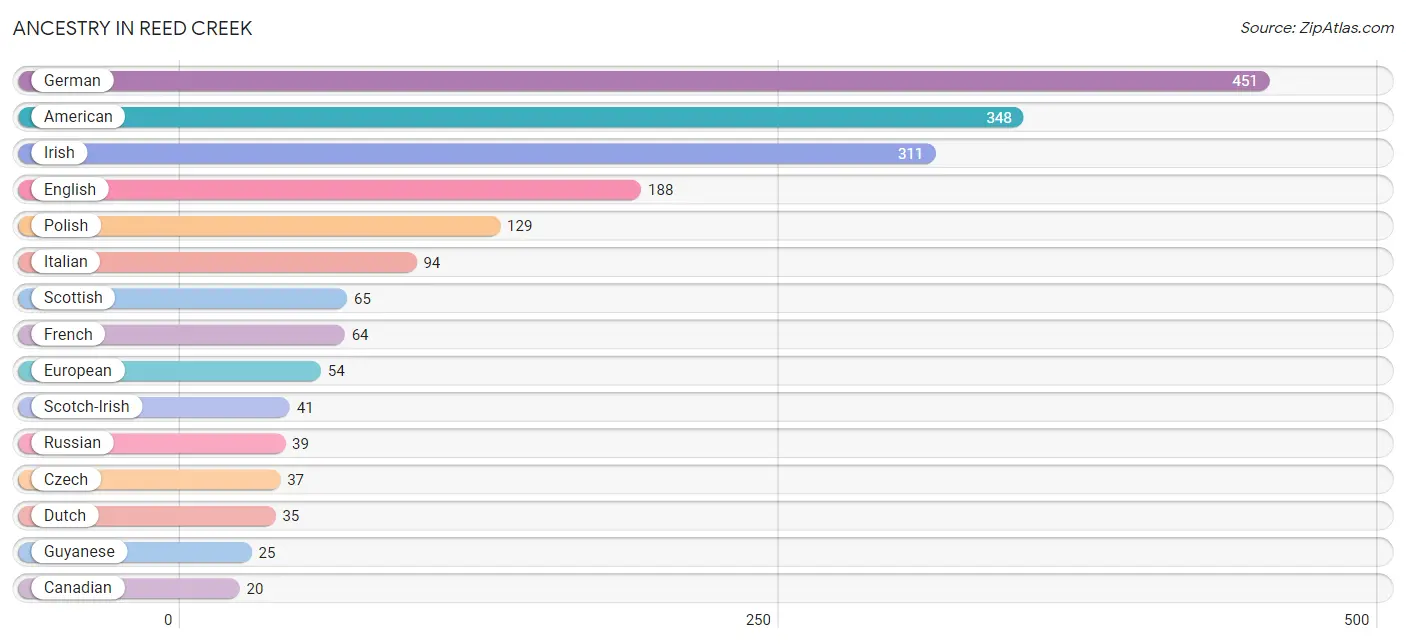
| Ancestry | # Population | % Population |
| American | 348 | 12.4% |
| Canadian | 20 | 0.7% |
| Chickasaw | 3 | 0.1% |
| Czech | 37 | 1.3% |
| Dutch | 35 | 1.3% |
| English | 188 | 6.7% |
| European | 54 | 1.9% |
| French | 64 | 2.3% |
| French American Indian | 18 | 0.6% |
| French Canadian | 6 | 0.2% |
| German | 451 | 16.1% |
| Guyanese | 25 | 0.9% |
| Hungarian | 18 | 0.6% |
| Irish | 311 | 11.1% |
| Italian | 94 | 3.4% |
| Norwegian | 19 | 0.7% |
| Polish | 129 | 4.6% |
| Portuguese | 15 | 0.5% |
| Russian | 39 | 1.4% |
| Scotch-Irish | 41 | 1.5% |
| Scottish | 65 | 2.3% |
| Swedish | 13 | 0.5% |
| Welsh | 6 | 0.2% | View All 23 Rows |
Immigrants in Reed Creek
The most numerous immigrant groups reported in Reed Creek came from Guyana (25 | 0.9%), Latin America (25 | 0.9%), South America (25 | 0.9%), and Canada (6 | 0.2%), together accounting for 2.9% of all Reed Creek residents.
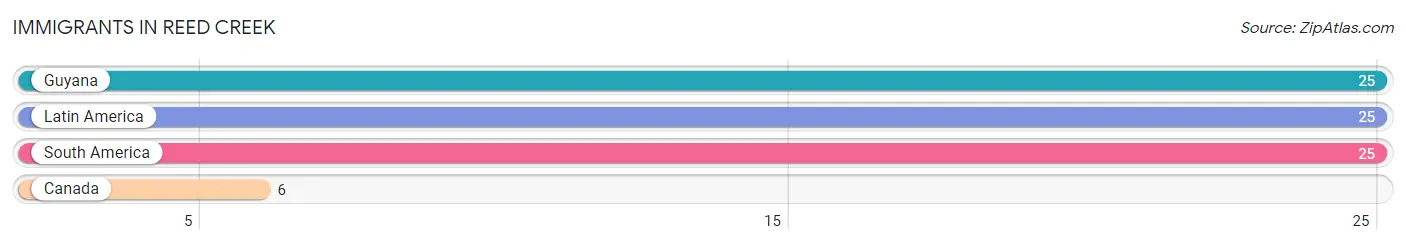
| Immigration Origin | # Population | % Population |
| Canada | 6 | 0.2% |
| Guyana | 25 | 0.9% |
| Latin America | 25 | 0.9% |
| South America | 25 | 0.9% | View All 4 Rows |
Sex and Age in Reed Creek
Sex and Age in Reed Creek
The most populous age groups in Reed Creek are 55 to 59 Years (202 | 14.5%) for men and 65 to 69 Years (188 | 13.3%) for women.
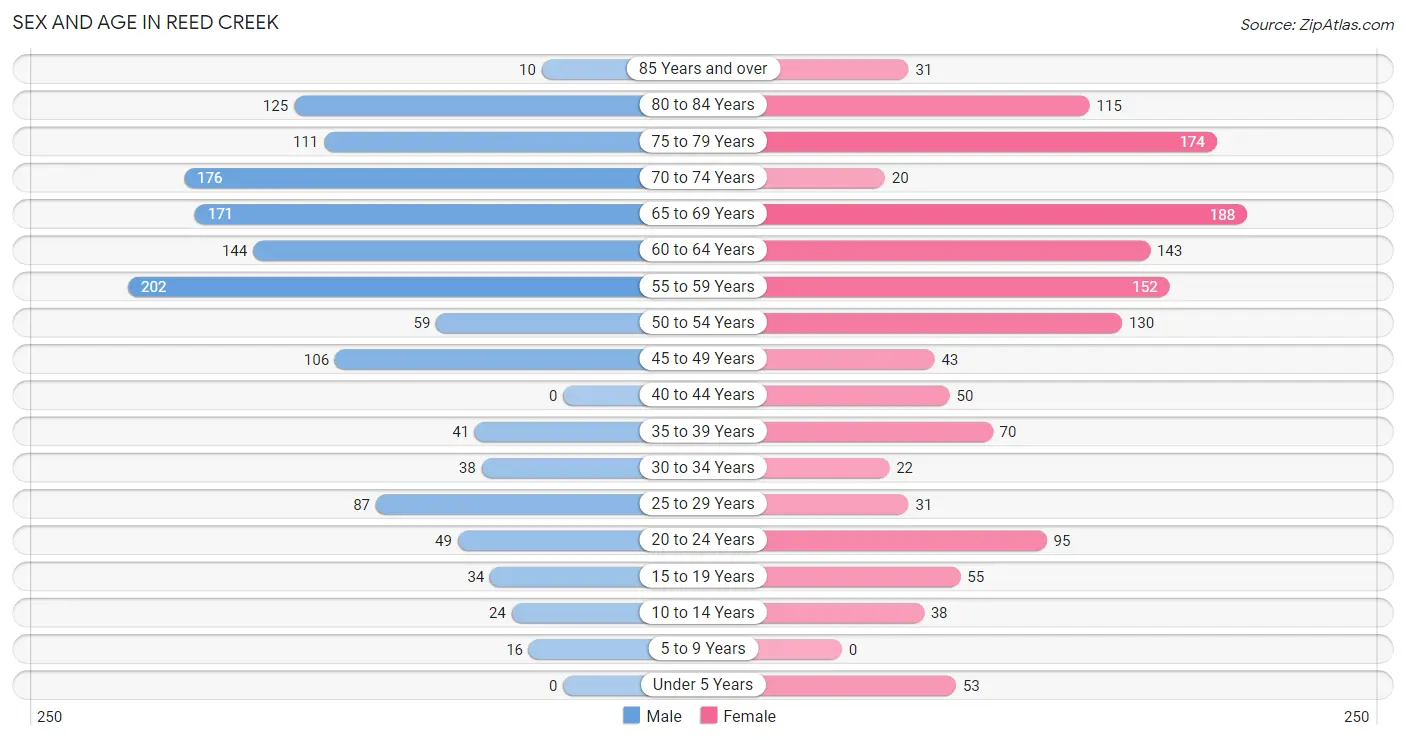
| Age Bracket | Male | Female |
| Under 5 Years | 0 (0.0%) | 53 (3.8%) |
| 5 to 9 Years | 16 (1.1%) | 0 (0.0%) |
| 10 to 14 Years | 24 (1.7%) | 38 (2.7%) |
| 15 to 19 Years | 34 (2.4%) | 55 (3.9%) |
| 20 to 24 Years | 49 (3.5%) | 95 (6.7%) |
| 25 to 29 Years | 87 (6.2%) | 31 (2.2%) |
| 30 to 34 Years | 38 (2.7%) | 22 (1.6%) |
| 35 to 39 Years | 41 (2.9%) | 70 (5.0%) |
| 40 to 44 Years | 0 (0.0%) | 50 (3.5%) |
| 45 to 49 Years | 106 (7.6%) | 43 (3.0%) |
| 50 to 54 Years | 59 (4.2%) | 130 (9.2%) |
| 55 to 59 Years | 202 (14.5%) | 152 (10.8%) |
| 60 to 64 Years | 144 (10.3%) | 143 (10.1%) |
| 65 to 69 Years | 171 (12.3%) | 188 (13.3%) |
| 70 to 74 Years | 176 (12.6%) | 20 (1.4%) |
| 75 to 79 Years | 111 (8.0%) | 174 (12.3%) |
| 80 to 84 Years | 125 (9.0%) | 115 (8.2%) |
| 85 Years and over | 10 (0.7%) | 31 (2.2%) |
| Total | 1,393 (100.0%) | 1,410 (100.0%) |
Families and Households in Reed Creek
Median Family Size in Reed Creek
The median family size in Reed Creek is 2.55 persons per family, with single male/father families (40 | 4.8%) accounting for the largest median family size of 3.38 persons per family. On the other hand, married-couple families (737 | 88.8%) represent the smallest median family size with 2.48 persons per family.
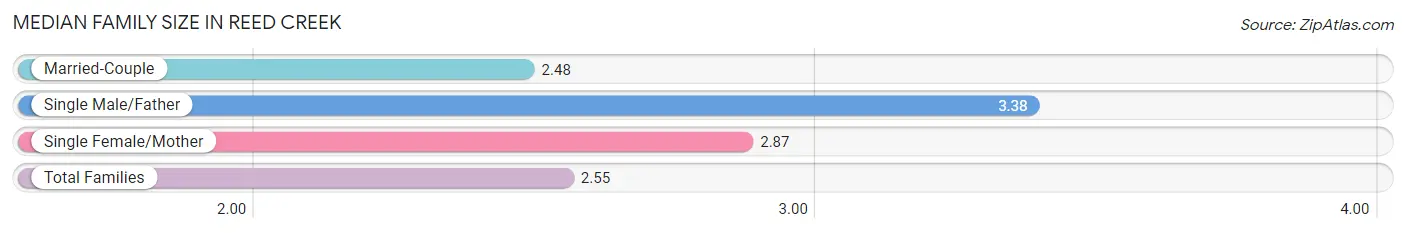
| Family Type | # Families | Family Size |
| Married-Couple | 737 (88.8%) | 2.48 |
| Single Male/Father | 40 (4.8%) | 3.38 |
| Single Female/Mother | 53 (6.4%) | 2.87 |
| Total Families | 830 (100.0%) | 2.55 |
Median Household Size in Reed Creek
The median household size in Reed Creek is 2.04 persons per household, with single male/father households (40 | 2.9%) accounting for the largest median household size of 3.38 persons per household. non-family households (546 | 39.7%) represent the smallest median household size with 1.20 persons per household.
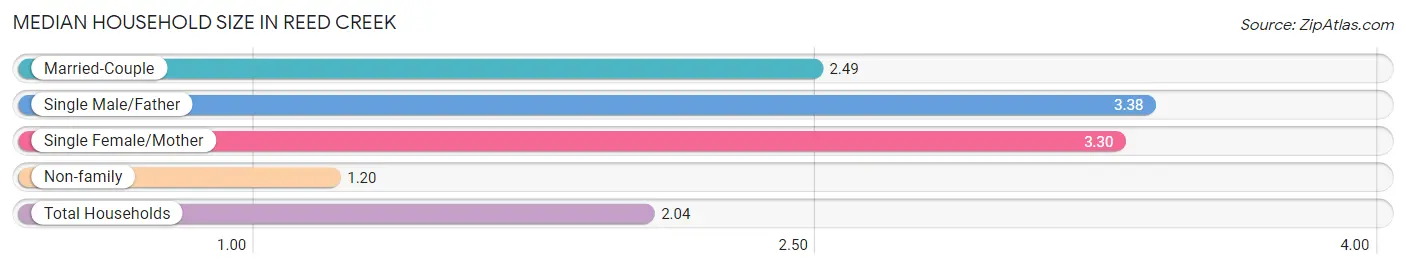
| Household Type | # Households | Household Size |
| Married-Couple | 737 (53.6%) | 2.49 |
| Single Male/Father | 40 (2.9%) | 3.38 |
| Single Female/Mother | 53 (3.8%) | 3.30 |
| Non-family | 546 (39.7%) | 1.20 |
| Total Households | 1,376 (100.0%) | 2.04 |
Household Size by Marriage Status in Reed Creek
Out of a total of 1,376 households in Reed Creek, 830 (60.3%) are family households, while 546 (39.7%) are nonfamily households. The most numerous type of family households are 2-person households, comprising 561, and the most common type of nonfamily households are 1-person households, comprising 436.
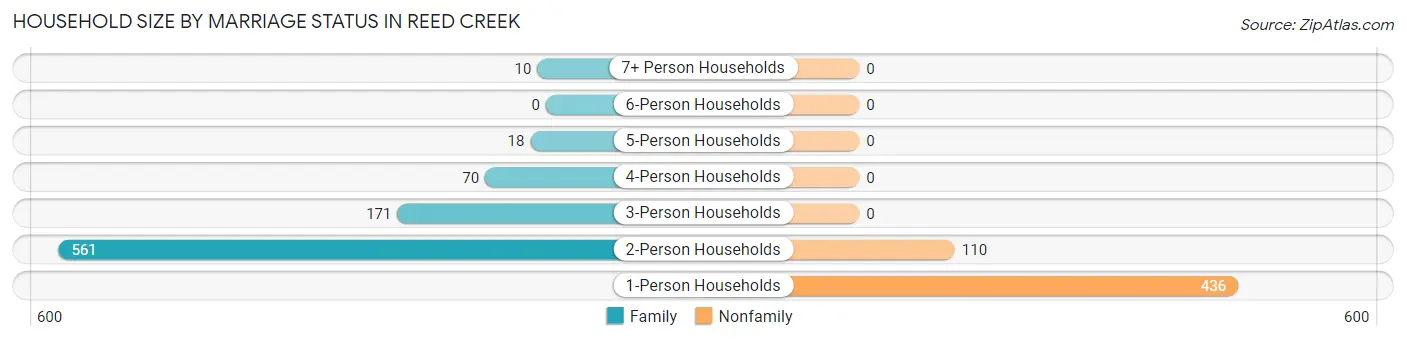
| Household Size | Family Households | Nonfamily Households |
| 1-Person Households | - | 436 (31.7%) |
| 2-Person Households | 561 (40.8%) | 110 (8.0%) |
| 3-Person Households | 171 (12.4%) | 0 (0.0%) |
| 4-Person Households | 70 (5.1%) | 0 (0.0%) |
| 5-Person Households | 18 (1.3%) | 0 (0.0%) |
| 6-Person Households | 0 (0.0%) | 0 (0.0%) |
| 7+ Person Households | 10 (0.7%) | 0 (0.0%) |
| Total | 830 (60.3%) | 546 (39.7%) |
Female Fertility in Reed Creek
Fertility by Age in Reed Creek
Average fertility rate in Reed Creek is 58.0 births per 1,000 women. Women in the age bracket of 20 to 34 years have the highest fertility rate with 149.0 births per 1,000 women. Women in the age bracket of 20 to 34 years acount for 100.0% of all women with births.
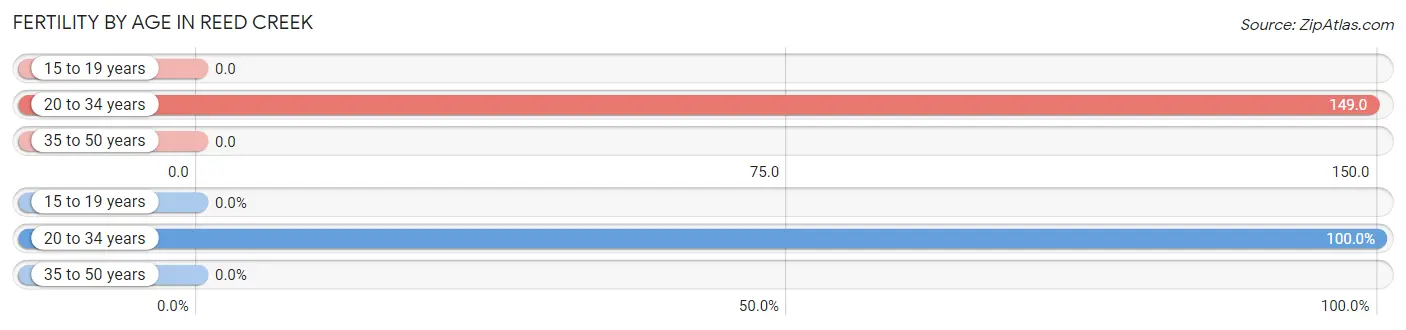
| Age Bracket | Women with Births | Births / 1,000 Women |
| 15 to 19 years | 0 (0.0%) | 0.0 |
| 20 to 34 years | 22 (100.0%) | 149.0 |
| 35 to 50 years | 0 (0.0%) | 0.0 |
| Total | 22 (100.0%) | 58.0 |
Fertility by Age by Marriage Status in Reed Creek
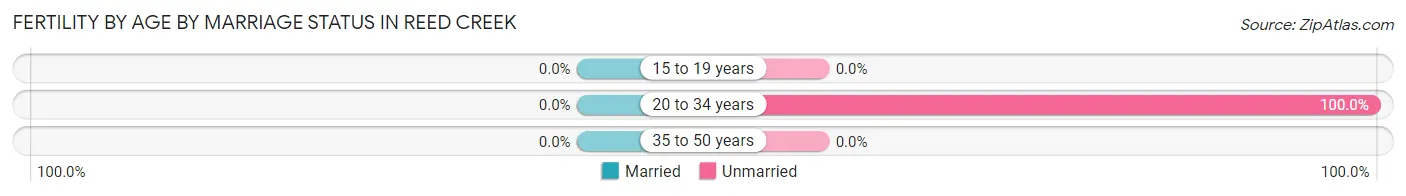
| Age Bracket | Married | Unmarried |
| 15 to 19 years | 0 (0.0%) | 0 (0.0%) |
| 20 to 34 years | 0 (0.0%) | 22 (100.0%) |
| 35 to 50 years | 0 (0.0%) | 0 (0.0%) |
| Total | 0 (0.0%) | 22 (100.0%) |
Fertility by Education in Reed Creek
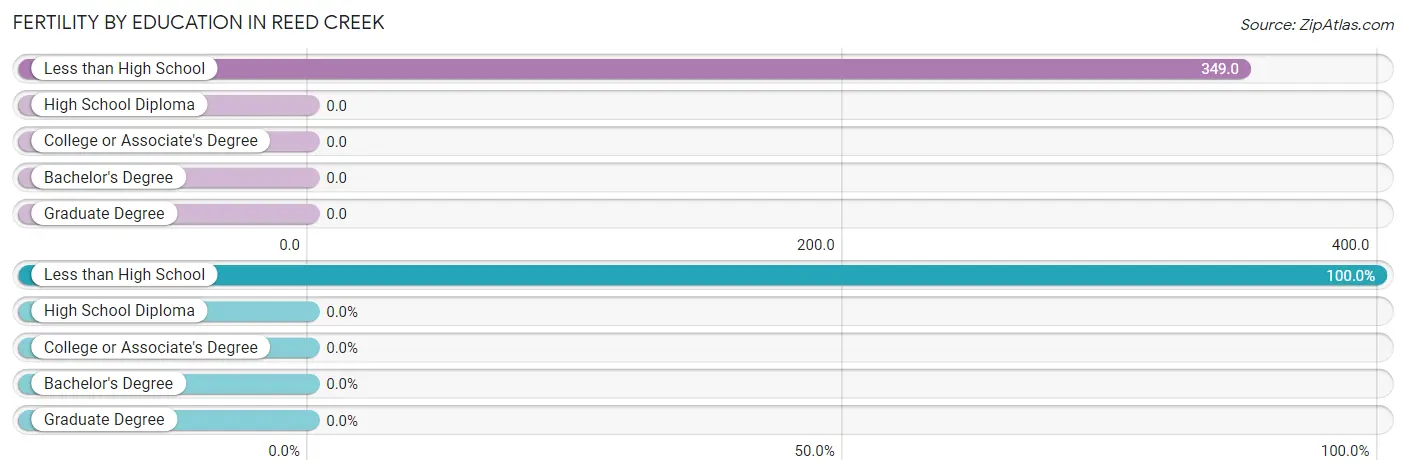
| Educational Attainment | Women with Births | Births / 1,000 Women |
| Less than High School | 22 (100.0%) | 349.0 |
| High School Diploma | 0 (0.0%) | 0.0 |
| College or Associate's Degree | 0 (0.0%) | 0.0 |
| Bachelor's Degree | 0 (0.0%) | 0.0 |
| Graduate Degree | 0 (0.0%) | 0.0 |
| Total | 22 (100.0%) | 58.0 |
Fertility by Education by Marriage Status in Reed Creek
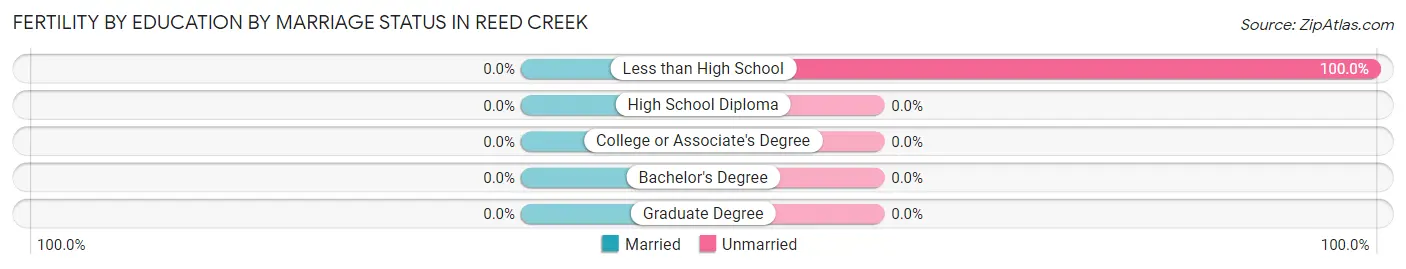
| Educational Attainment | Married | Unmarried |
| Less than High School | 0 (0.0%) | 22 (100.0%) |
| High School Diploma | 0 (0.0%) | 0 (0.0%) |
| College or Associate's Degree | 0 (0.0%) | 0 (0.0%) |
| Bachelor's Degree | 0 (0.0%) | 0 (0.0%) |
| Graduate Degree | 0 (0.0%) | 0 (0.0%) |
| Total | 0 (0.0%) | 22 (100.0%) |
Income in Reed Creek
Income Overview in Reed Creek
Per Capita Income in Reed Creek is $43,373, while median incomes of families and households are $96,983 and $68,765 respectively.
| Characteristic | Number | Measure |
| Per Capita Income | 2,803 | $43,373 |
| Median Family Income | 830 | $96,983 |
| Mean Family Income | 830 | $115,793 |
| Median Household Income | 1,376 | $68,765 |
| Mean Household Income | 1,376 | $88,812 |
| Income Deficit | 830 | $0 |
| Wage / Income Gap (%) | 2,803 | 33.68% |
| Wage / Income Gap ($) | 2,803 | 66.32¢ per $1 |
| Gini / Inequality Index | 2,803 | 0.47 |
Earnings by Sex in Reed Creek
Average Earnings in Reed Creek are $53,902, $58,750 for men and $38,963 for women, a difference of 33.7%.
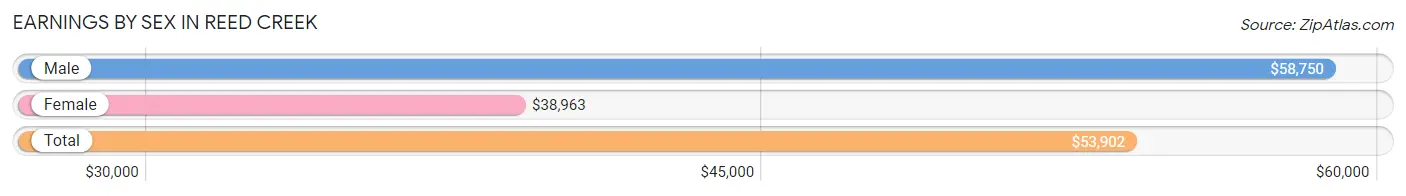
| Sex | Number | Average Earnings |
| Male | 674 (53.5%) | $58,750 |
| Female | 585 (46.5%) | $38,963 |
| Total | 1,259 (100.0%) | $53,902 |
Earnings by Sex by Income Bracket in Reed Creek
The most common earnings brackets in Reed Creek are $100,000+ for men (144 | 21.4%) and $2,499 or less for women (118 | 20.2%).
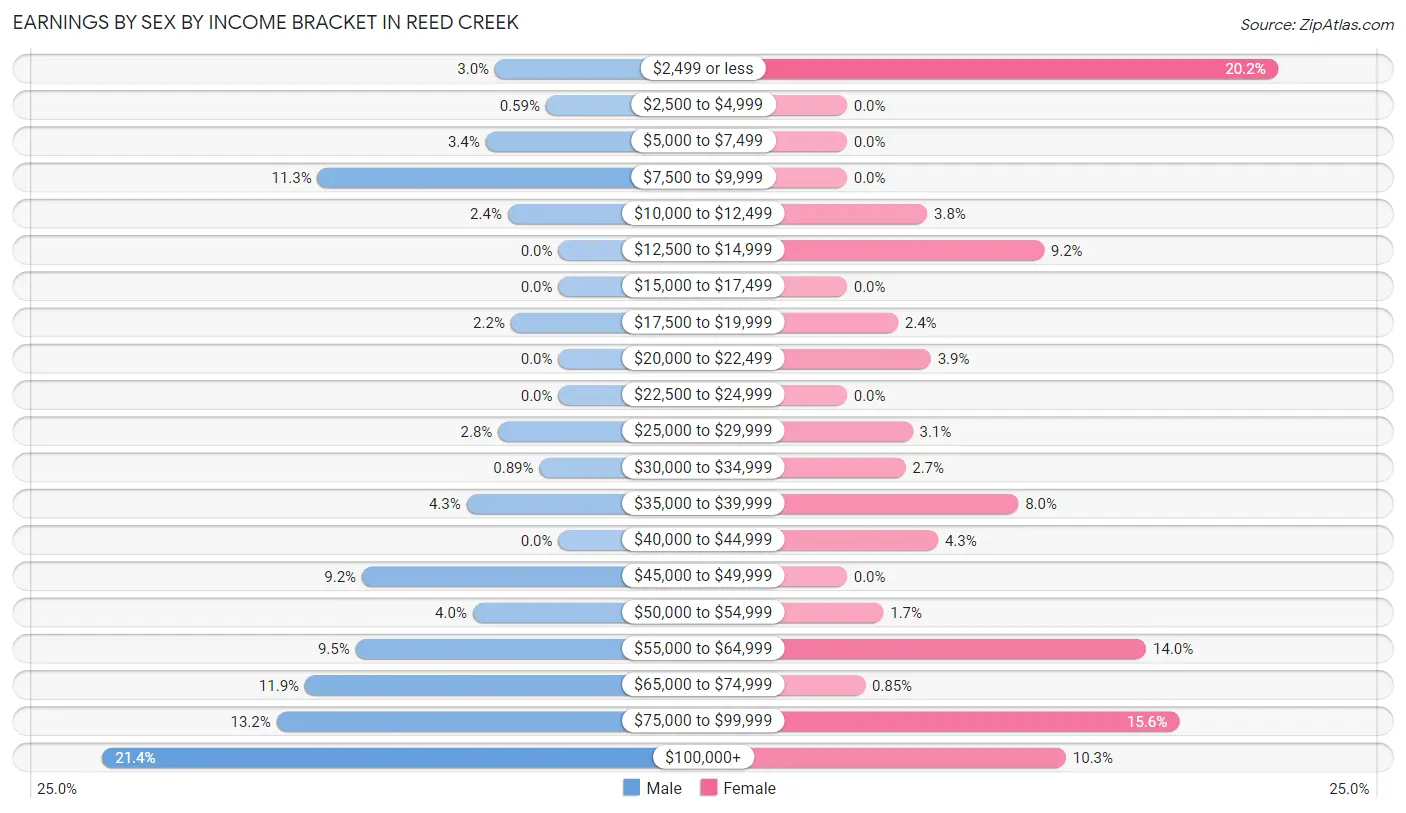
| Income | Male | Female |
| $2,499 or less | 20 (3.0%) | 118 (20.2%) |
| $2,500 to $4,999 | 4 (0.6%) | 0 (0.0%) |
| $5,000 to $7,499 | 23 (3.4%) | 0 (0.0%) |
| $7,500 to $9,999 | 76 (11.3%) | 0 (0.0%) |
| $10,000 to $12,499 | 16 (2.4%) | 22 (3.8%) |
| $12,500 to $14,999 | 0 (0.0%) | 54 (9.2%) |
| $15,000 to $17,499 | 0 (0.0%) | 0 (0.0%) |
| $17,500 to $19,999 | 15 (2.2%) | 14 (2.4%) |
| $20,000 to $22,499 | 0 (0.0%) | 23 (3.9%) |
| $22,500 to $24,999 | 0 (0.0%) | 0 (0.0%) |
| $25,000 to $29,999 | 19 (2.8%) | 18 (3.1%) |
| $30,000 to $34,999 | 6 (0.9%) | 16 (2.7%) |
| $35,000 to $39,999 | 29 (4.3%) | 47 (8.0%) |
| $40,000 to $44,999 | 0 (0.0%) | 25 (4.3%) |
| $45,000 to $49,999 | 62 (9.2%) | 0 (0.0%) |
| $50,000 to $54,999 | 27 (4.0%) | 10 (1.7%) |
| $55,000 to $64,999 | 64 (9.5%) | 82 (14.0%) |
| $65,000 to $74,999 | 80 (11.9%) | 5 (0.9%) |
| $75,000 to $99,999 | 89 (13.2%) | 91 (15.6%) |
| $100,000+ | 144 (21.4%) | 60 (10.3%) |
| Total | 674 (100.0%) | 585 (100.0%) |
Earnings by Sex by Educational Attainment in Reed Creek
Average earnings in Reed Creek are $64,766 for men and $41,950 for women, a difference of 35.2%. Men with an educational attainment of bachelor's degree enjoy the highest average annual earnings of $76,319, while those with high school diploma education earn the least with $46,458. Women with an educational attainment of college or associate's degree earn the most with the average annual earnings of $56,974, while those with bachelor's degree education have the smallest earnings of $55,865.
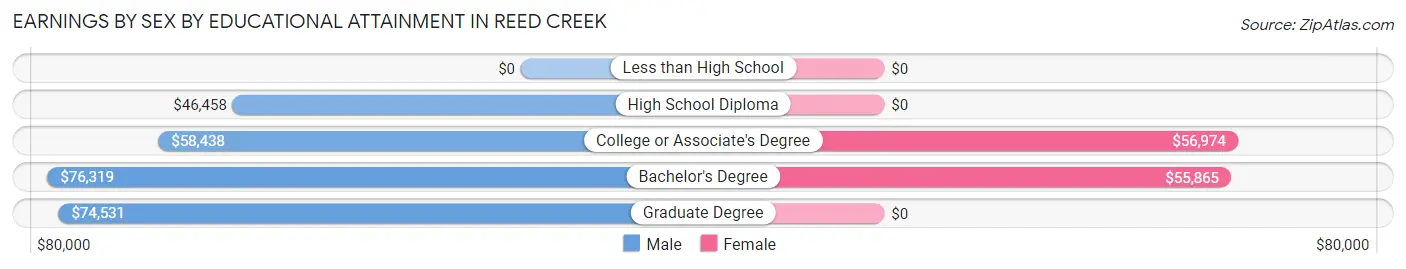
| Educational Attainment | Male Income | Female Income |
| Less than High School | - | - |
| High School Diploma | $46,458 | $0 |
| College or Associate's Degree | $58,438 | $56,974 |
| Bachelor's Degree | $76,319 | $55,865 |
| Graduate Degree | $74,531 | $0 |
| Total | $64,766 | $41,950 |
Family Income in Reed Creek
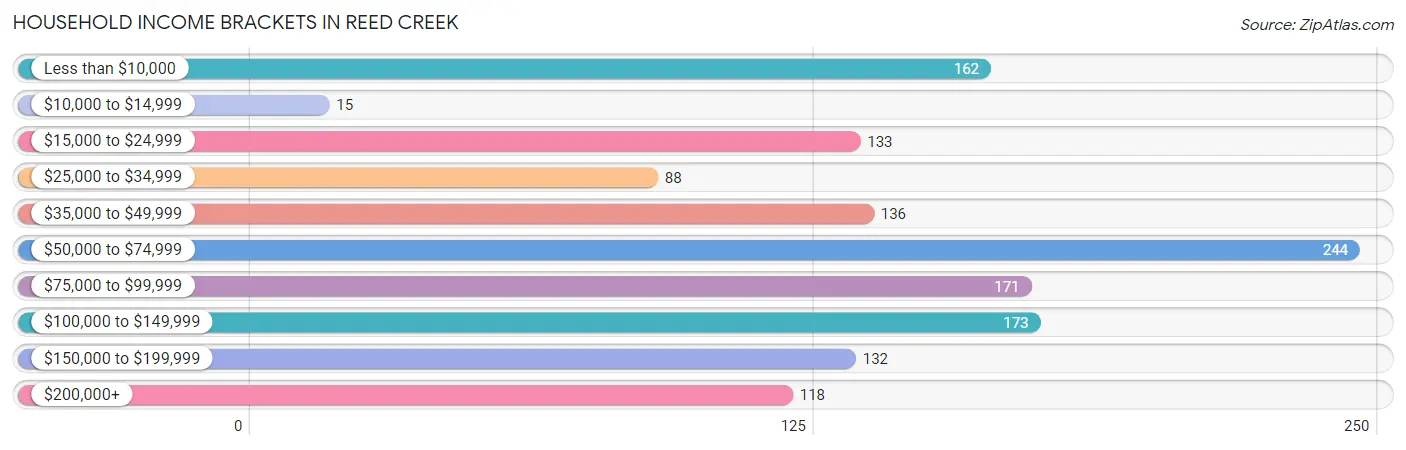
Family Income Brackets in Reed Creek
According to the Reed Creek family income data, there are 174 families falling into the $100,000 to $149,999 income range, which is the most common income bracket and makes up 21.0% of all families. Conversely, the $10,000 to $14,999 income bracket is the least frequent group with only 6 families (0.7%) belonging to this category.
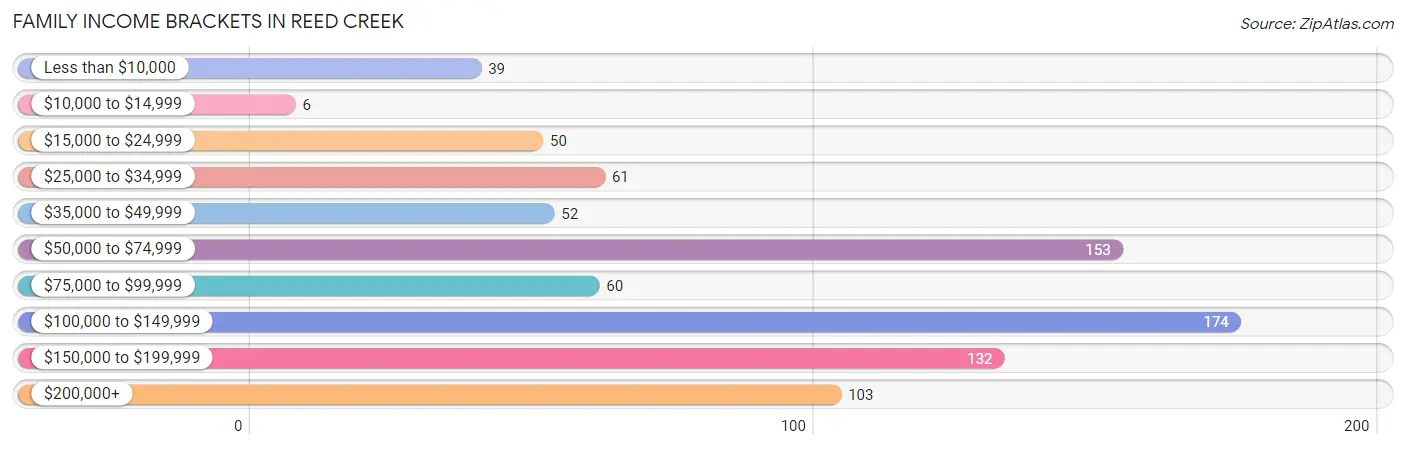
| Income Bracket | # Families | % Families |
| Less than $10,000 | 39 | 4.7% |
| $10,000 to $14,999 | 6 | 0.7% |
| $15,000 to $24,999 | 50 | 6.0% |
| $25,000 to $34,999 | 61 | 7.3% |
| $35,000 to $49,999 | 52 | 6.3% |
| $50,000 to $74,999 | 153 | 18.4% |
| $75,000 to $99,999 | 60 | 7.2% |
| $100,000 to $149,999 | 174 | 21.0% |
| $150,000 to $199,999 | 132 | 15.9% |
| $200,000+ | 103 | 12.4% |
Family Income by Famaliy Size in Reed Creek
4-person families (48 | 5.8%) account for the highest median family income in Reed Creek with $210,156 per family, while 4-person families (48 | 5.8%) have the highest median income of $52,539 per family member.
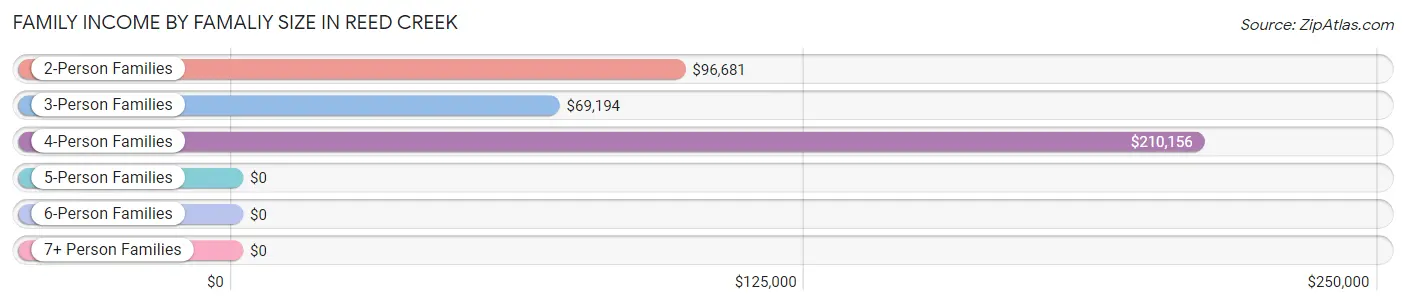
| Income Bracket | # Families | Median Income |
| 2-Person Families | 561 (67.6%) | $96,681 |
| 3-Person Families | 193 (23.3%) | $69,194 |
| 4-Person Families | 48 (5.8%) | $210,156 |
| 5-Person Families | 18 (2.2%) | $0 |
| 6-Person Families | 10 (1.2%) | $0 |
| 7+ Person Families | 0 (0.0%) | $0 |
| Total | 830 (100.0%) | $96,983 |
Family Income by Number of Earners in Reed Creek
The median family income in Reed Creek is $96,983, with families comprising 3+ earners (55) having the highest median family income of $181,979, while families with no earners (324) have the lowest median family income of $65,893, accounting for 6.6% and 39.0% of families, respectively.
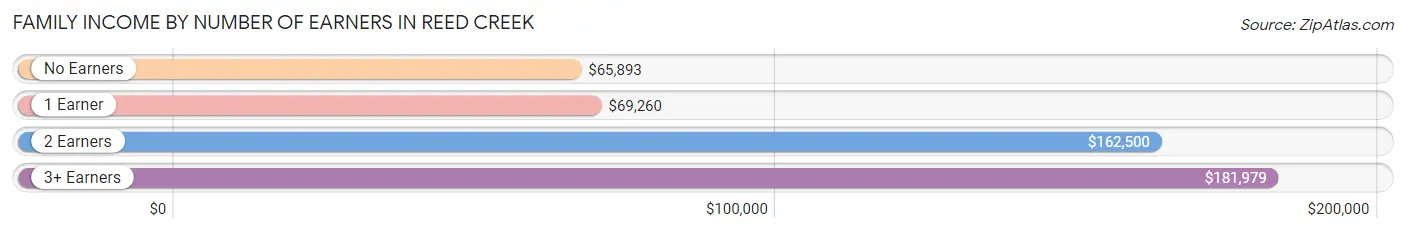
| Number of Earners | # Families | Median Income |
| No Earners | 324 (39.0%) | $65,893 |
| 1 Earner | 267 (32.2%) | $69,260 |
| 2 Earners | 184 (22.2%) | $162,500 |
| 3+ Earners | 55 (6.6%) | $181,979 |
| Total | 830 (100.0%) | $96,983 |
Household Income in Reed Creek
Household Income Brackets in Reed Creek
With 244 households falling in the category, the $50,000 to $74,999 income range is the most frequent in Reed Creek, accounting for 17.7% of all households. In contrast, only 15 households (1.1%) fall into the $10,000 to $14,999 income bracket, making it the least populous group.
| Income Bracket | # Households | % Households |
| Less than $10,000 | 162 | 11.8% |
| $10,000 to $14,999 | 15 | 1.1% |
| $15,000 to $24,999 | 133 | 9.7% |
| $25,000 to $34,999 | 88 | 6.4% |
| $35,000 to $49,999 | 136 | 9.9% |
| $50,000 to $74,999 | 244 | 17.7% |
| $75,000 to $99,999 | 171 | 12.4% |
| $100,000 to $149,999 | 173 | 12.6% |
| $150,000 to $199,999 | 132 | 9.6% |
| $200,000+ | 118 | 8.6% |
Household Income by Householder Age in Reed Creek
The median household income in Reed Creek is $68,765, with the highest median household income of $95,982 found in the 25 to 44 years age bracket for the primary householder. A total of 85 households (6.2%) fall into this category. Meanwhile, the 15 to 24 years age bracket for the primary householder has the lowest median household income of $0, with 27 households (2.0%) in this group.
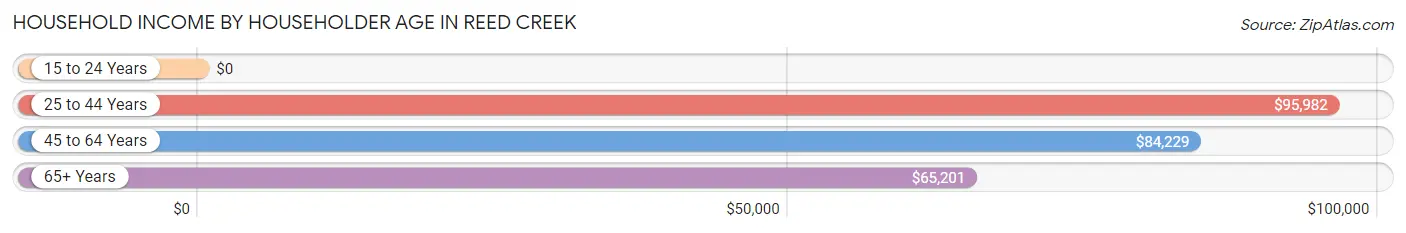
| Income Bracket | # Households | Median Income |
| 15 to 24 Years | 27 (2.0%) | $0 |
| 25 to 44 Years | 85 (6.2%) | $95,982 |
| 45 to 64 Years | 631 (45.9%) | $84,229 |
| 65+ Years | 633 (46.0%) | $65,201 |
| Total | 1,376 (100.0%) | $68,765 |
Poverty in Reed Creek
Income Below Poverty by Sex and Age in Reed Creek
With 11.9% poverty level for males and 11.4% for females among the residents of Reed Creek, 65 to 74 year old males and 12 to 14 year old females are the most vulnerable to poverty, with 102 males (29.4%) and 21 females (67.7%) in their respective age groups living below the poverty level.
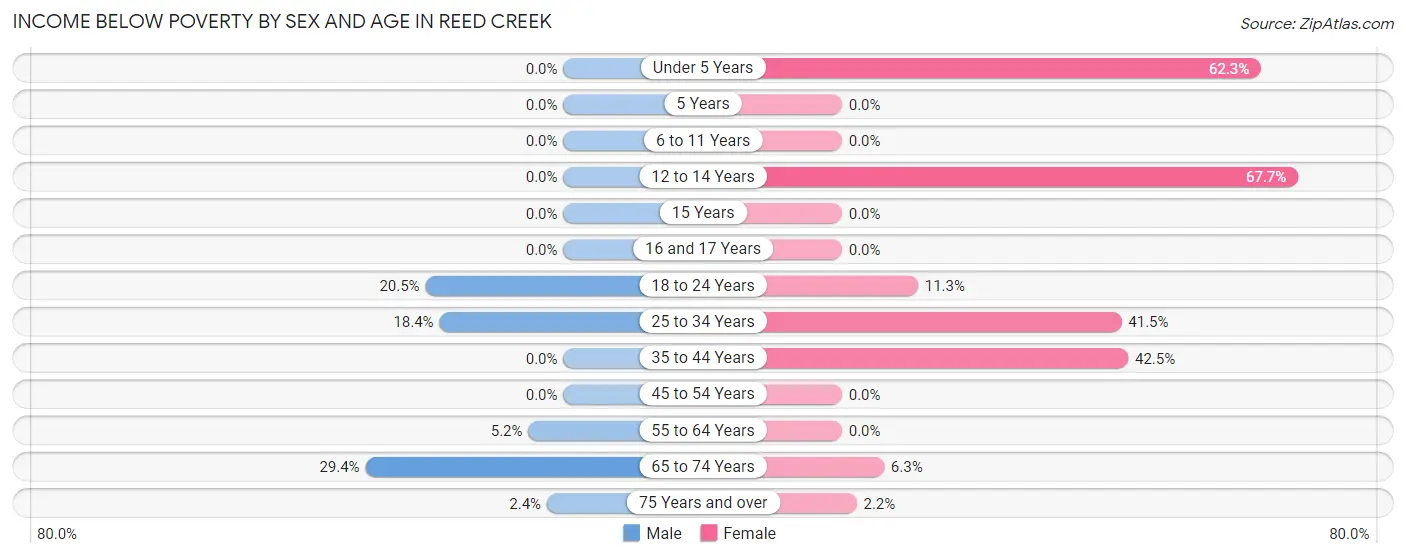
| Age Bracket | Male | Female |
| Under 5 Years | 0 (0.0%) | 33 (62.3%) |
| 5 Years | 0 (0.0%) | 0 (0.0%) |
| 6 to 11 Years | 0 (0.0%) | 0 (0.0%) |
| 12 to 14 Years | 0 (0.0%) | 21 (67.7%) |
| 15 Years | 0 (0.0%) | 0 (0.0%) |
| 16 and 17 Years | 0 (0.0%) | 0 (0.0%) |
| 18 to 24 Years | 17 (20.5%) | 14 (11.3%) |
| 25 to 34 Years | 23 (18.4%) | 22 (41.5%) |
| 35 to 44 Years | 0 (0.0%) | 51 (42.5%) |
| 45 to 54 Years | 0 (0.0%) | 0 (0.0%) |
| 55 to 64 Years | 18 (5.2%) | 0 (0.0%) |
| 65 to 74 Years | 102 (29.4%) | 13 (6.2%) |
| 75 Years and over | 6 (2.4%) | 7 (2.2%) |
| Total | 166 (11.9%) | 161 (11.4%) |
Income Above Poverty by Sex and Age in Reed Creek
According to the poverty statistics in Reed Creek, males aged 6 to 11 years and females aged 6 to 11 years are the age groups that are most secure financially, with 100.0% of males and 100.0% of females in these age groups living above the poverty line.
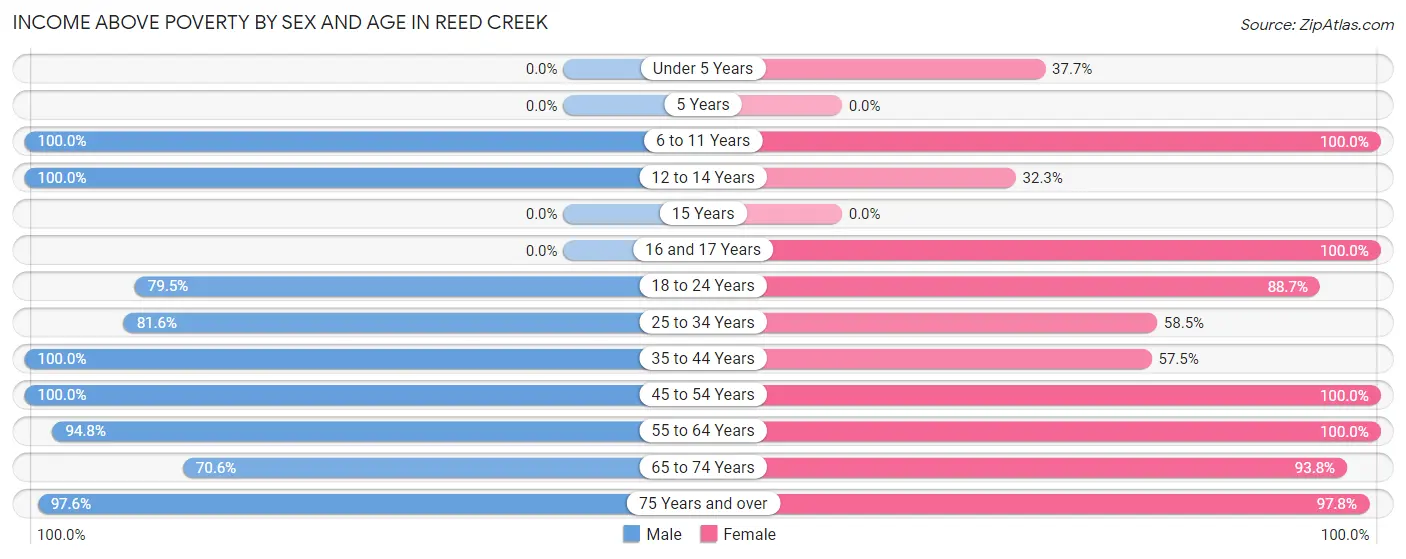
| Age Bracket | Male | Female |
| Under 5 Years | 0 (0.0%) | 20 (37.7%) |
| 5 Years | 0 (0.0%) | 0 (0.0%) |
| 6 to 11 Years | 16 (100.0%) | 7 (100.0%) |
| 12 to 14 Years | 24 (100.0%) | 10 (32.3%) |
| 15 Years | 0 (0.0%) | 0 (0.0%) |
| 16 and 17 Years | 0 (0.0%) | 26 (100.0%) |
| 18 to 24 Years | 66 (79.5%) | 110 (88.7%) |
| 25 to 34 Years | 102 (81.6%) | 31 (58.5%) |
| 35 to 44 Years | 41 (100.0%) | 69 (57.5%) |
| 45 to 54 Years | 165 (100.0%) | 173 (100.0%) |
| 55 to 64 Years | 328 (94.8%) | 295 (100.0%) |
| 65 to 74 Years | 245 (70.6%) | 195 (93.8%) |
| 75 Years and over | 240 (97.6%) | 313 (97.8%) |
| Total | 1,227 (88.1%) | 1,249 (88.6%) |
Income Below Poverty Among Married-Couple Families in Reed Creek
The poverty statistics for married-couple families in Reed Creek show that 3.1% or 23 of the total 737 families live below the poverty line. Families with no children have the highest poverty rate of 3.2%, comprising of 23 families. On the other hand, families with 1 or 2 children have the lowest poverty rate of 0.0%, which includes 0 families.
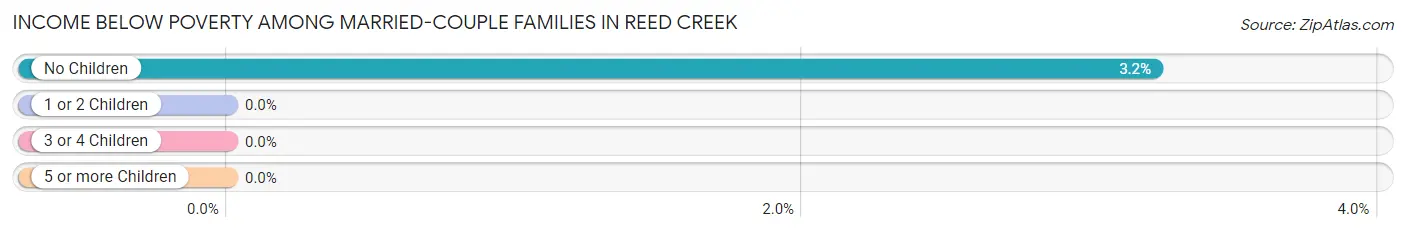
| Children | Above Poverty | Below Poverty |
| No Children | 691 (96.8%) | 23 (3.2%) |
| 1 or 2 Children | 23 (100.0%) | 0 (0.0%) |
| 3 or 4 Children | 0 (0.0%) | 0 (0.0%) |
| 5 or more Children | 0 (0.0%) | 0 (0.0%) |
| Total | 714 (96.9%) | 23 (3.1%) |
Income Below Poverty Among Single-Parent Households in Reed Creek
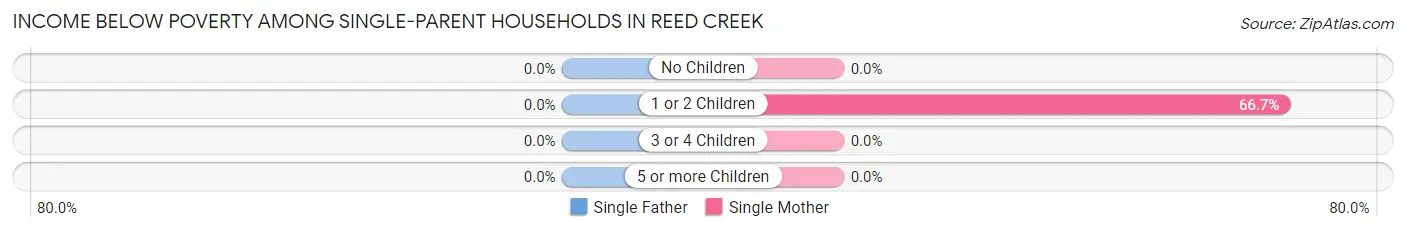
| Children | Single Father | Single Mother |
| No Children | 0 (0.0%) | 0 (0.0%) |
| 1 or 2 Children | 0 (0.0%) | 22 (66.7%) |
| 3 or 4 Children | 0 (0.0%) | 0 (0.0%) |
| 5 or more Children | 0 (0.0%) | 0 (0.0%) |
| Total | 0 (0.0%) | 22 (41.5%) |
Income Below Poverty Among Married-Couple vs Single-Parent Households in Reed Creek
The poverty data for Reed Creek shows that 23 of the married-couple family households (3.1%) and 22 of the single-parent households (23.7%) are living below the poverty level. Within the married-couple family households, those with no children have the highest poverty rate, with 23 households (3.2%) falling below the poverty line. Among the single-parent households, those with 1 or 2 children have the highest poverty rate, with 22 household (31.9%) living below poverty.
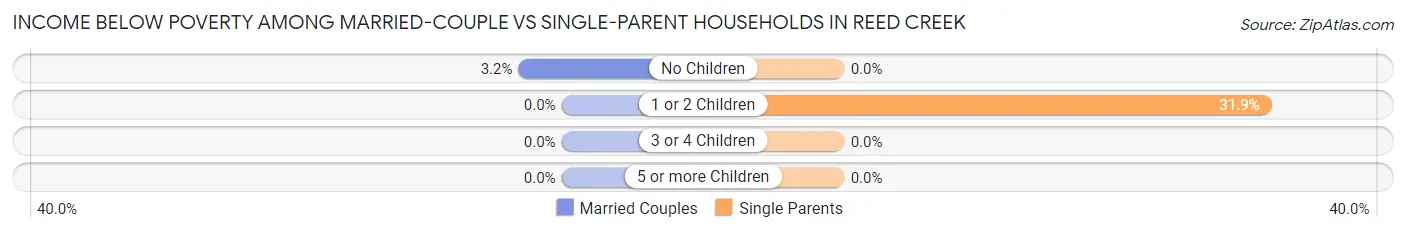
| Children | Married-Couple Families | Single-Parent Households |
| No Children | 23 (3.2%) | 0 (0.0%) |
| 1 or 2 Children | 0 (0.0%) | 22 (31.9%) |
| 3 or 4 Children | 0 (0.0%) | 0 (0.0%) |
| 5 or more Children | 0 (0.0%) | 0 (0.0%) |
| Total | 23 (3.1%) | 22 (23.7%) |
Employment Characteristics in Reed Creek
Employment by Class of Employer in Reed Creek
Among the 1,053 employed individuals in Reed Creek, private company employees (655 | 62.2%), not-for-profit organizations (127 | 12.1%), and self-employed (not incorporated) (105 | 10.0%) make up the most common classes of employment.
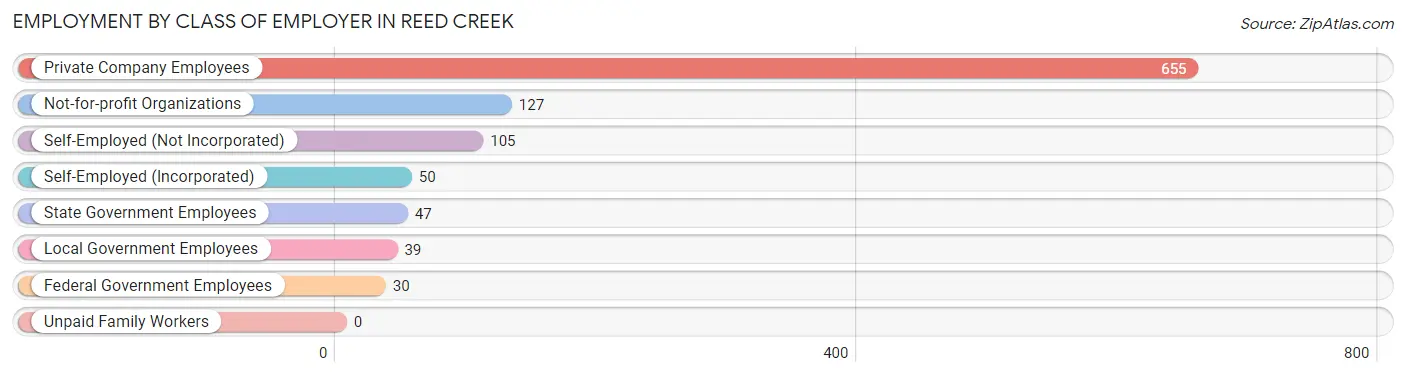
| Employer Class | # Employees | % Employees |
| Private Company Employees | 655 | 62.2% |
| Self-Employed (Incorporated) | 50 | 4.8% |
| Self-Employed (Not Incorporated) | 105 | 10.0% |
| Not-for-profit Organizations | 127 | 12.1% |
| Local Government Employees | 39 | 3.7% |
| State Government Employees | 47 | 4.5% |
| Federal Government Employees | 30 | 2.9% |
| Unpaid Family Workers | 0 | 0.0% |
| Total | 1,053 | 100.0% |
Employment Status by Age in Reed Creek
According to the labor force statistics for Reed Creek, out of the total population over 16 years of age (2,672), 41.6% or 1,112 individuals are in the labor force, with 5.3% or 59 of them unemployed. The age group with the highest labor force participation rate is 25 to 29 years, with 93.2% or 110 individuals in the labor force. Within the labor force, the 35 to 44 years age range has the highest percentage of unemployed individuals, with 38.9% or 58 of them being unemployed.
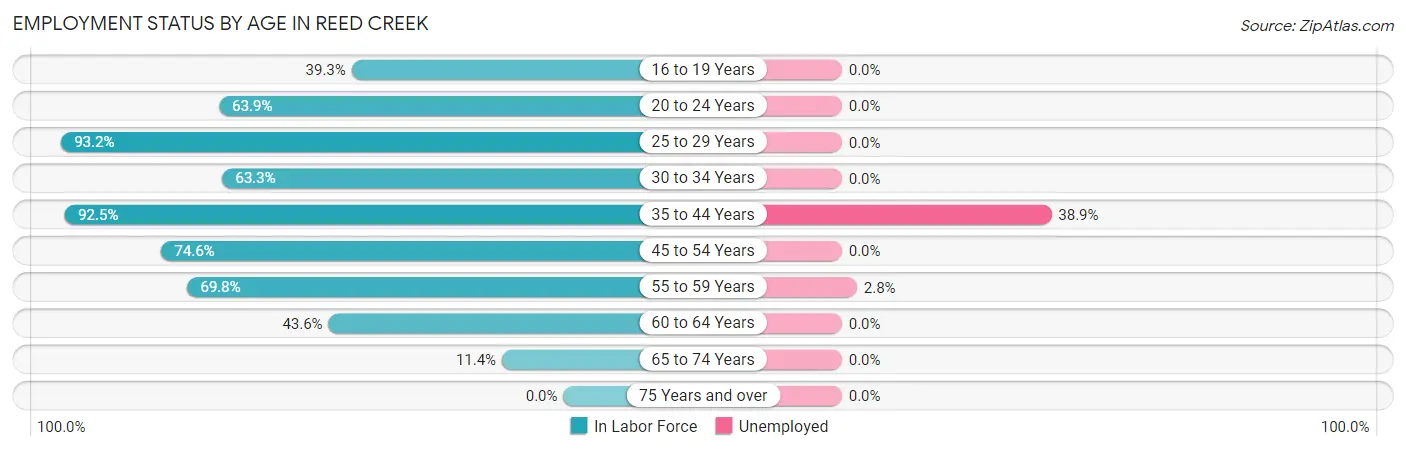
| Age Bracket | In Labor Force | Unemployed |
| 16 to 19 Years | 35 (39.3%) | 0 (0.0%) |
| 20 to 24 Years | 92 (63.9%) | 0 (0.0%) |
| 25 to 29 Years | 110 (93.2%) | 0 (0.0%) |
| 30 to 34 Years | 38 (63.3%) | 0 (0.0%) |
| 35 to 44 Years | 149 (92.5%) | 58 (38.9%) |
| 45 to 54 Years | 252 (74.6%) | 0 (0.0%) |
| 55 to 59 Years | 247 (69.8%) | 7 (2.8%) |
| 60 to 64 Years | 125 (43.6%) | 0 (0.0%) |
| 65 to 74 Years | 63 (11.4%) | 0 (0.0%) |
| 75 Years and over | 0 (0.0%) | 0 (0.0%) |
| Total | 1,112 (41.6%) | 59 (5.3%) |
Employment Status by Educational Attainment in Reed Creek
According to labor force statistics for Reed Creek, 69.9% of individuals (921) out of the total population between 25 and 64 years of age (1,318) are in the labor force, with 6.4% or 59 of them being unemployed. The group with the highest labor force participation rate are those with the educational attainment of college / associate degree, with 74.9% or 340 individuals in the labor force. Within the labor force, individuals with high school diploma education have the highest percentage of unemployment, with 21.6% or 51 of them being unemployed.
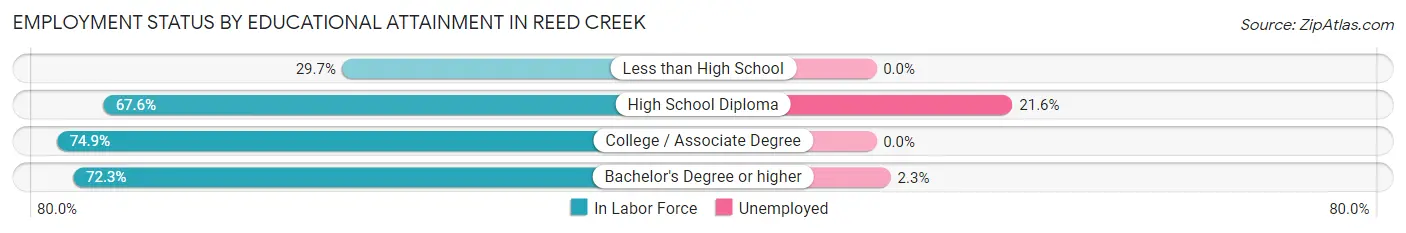
| Educational Attainment | In Labor Force | Unemployed |
| Less than High School | 19 (29.7%) | 0 (0.0%) |
| High School Diploma | 236 (67.6%) | 75 (21.6%) |
| College / Associate Degree | 340 (74.9%) | 0 (0.0%) |
| Bachelor's Degree or higher | 326 (72.3%) | 10 (2.3%) |
| Total | 921 (69.9%) | 84 (6.4%) |
Employment Occupations by Sex in Reed Creek
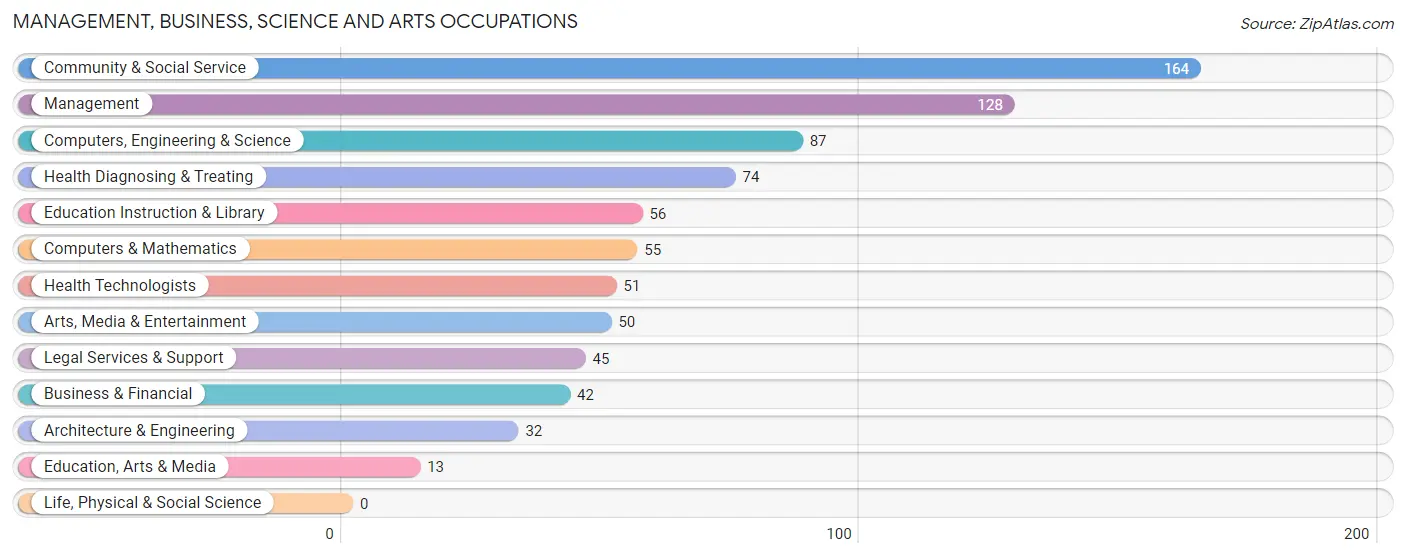
Management, Business, Science and Arts Occupations
The most common Management, Business, Science and Arts occupations in Reed Creek are Community & Social Service (164 | 15.9%), Management (128 | 12.4%), Computers, Engineering & Science (87 | 8.4%), Health Diagnosing & Treating (74 | 7.1%), and Education Instruction & Library (56 | 5.4%).
Management, Business, Science and Arts Occupations by Sex
Within the Management, Business, Science and Arts occupations in Reed Creek, the most male-oriented occupations are Architecture & Engineering (100.0%), Computers, Engineering & Science (86.2%), and Computers & Mathematics (78.2%), while the most female-oriented occupations are Education, Arts & Media (100.0%), Health Technologists (100.0%), and Health Diagnosing & Treating (83.8%).
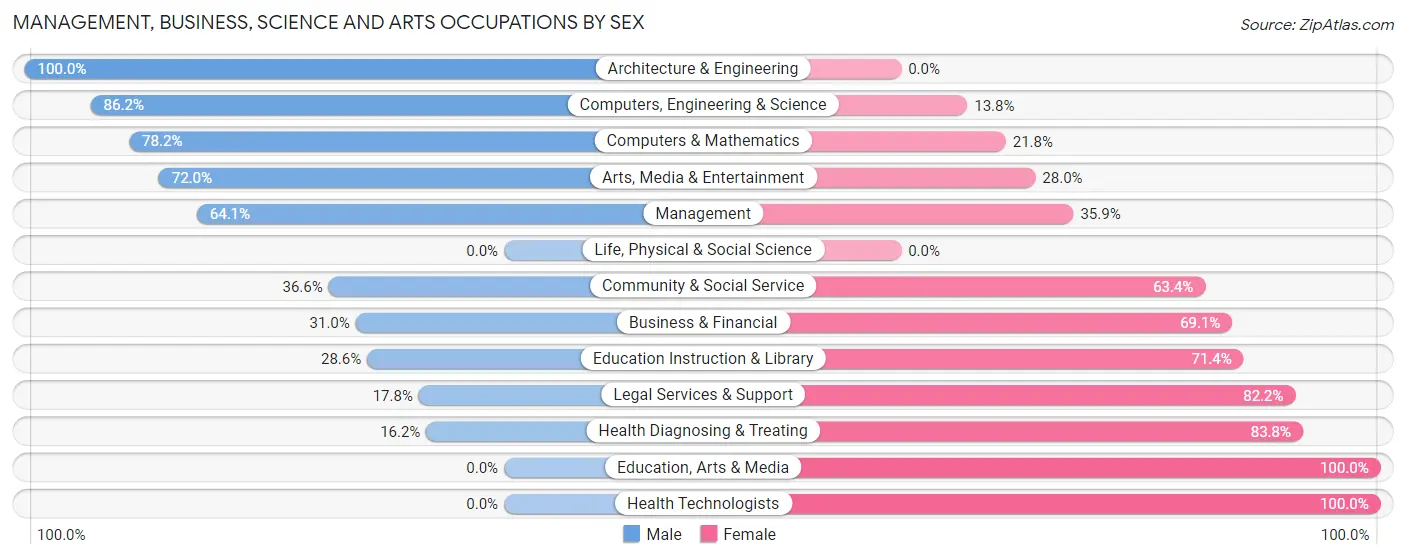
| Occupation | Male | Female |
| Management | 82 (64.1%) | 46 (35.9%) |
| Business & Financial | 13 (30.9%) | 29 (69.1%) |
| Computers, Engineering & Science | 75 (86.2%) | 12 (13.8%) |
| Computers & Mathematics | 43 (78.2%) | 12 (21.8%) |
| Architecture & Engineering | 32 (100.0%) | 0 (0.0%) |
| Life, Physical & Social Science | 0 (0.0%) | 0 (0.0%) |
| Community & Social Service | 60 (36.6%) | 104 (63.4%) |
| Education, Arts & Media | 0 (0.0%) | 13 (100.0%) |
| Legal Services & Support | 8 (17.8%) | 37 (82.2%) |
| Education Instruction & Library | 16 (28.6%) | 40 (71.4%) |
| Arts, Media & Entertainment | 36 (72.0%) | 14 (28.0%) |
| Health Diagnosing & Treating | 12 (16.2%) | 62 (83.8%) |
| Health Technologists | 0 (0.0%) | 51 (100.0%) |
| Total (Category) | 242 (48.9%) | 253 (51.1%) |
| Total (Overall) | 537 (51.9%) | 498 (48.1%) |
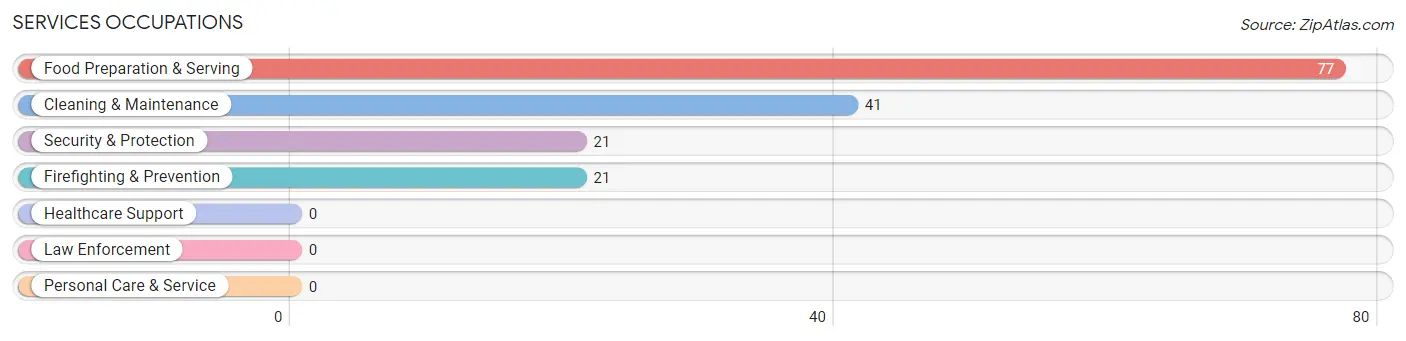
Services Occupations
The most common Services occupations in Reed Creek are Food Preparation & Serving (77 | 7.4%), Cleaning & Maintenance (41 | 4.0%), Security & Protection (21 | 2.0%), and Firefighting & Prevention (21 | 2.0%).
Services Occupations by Sex
Within the Services occupations in Reed Creek, the most male-oriented occupations are Security & Protection (100.0%), Firefighting & Prevention (100.0%), and Cleaning & Maintenance (85.4%), while the most female-oriented occupations are Food Preparation & Serving (70.1%), and Cleaning & Maintenance (14.6%).
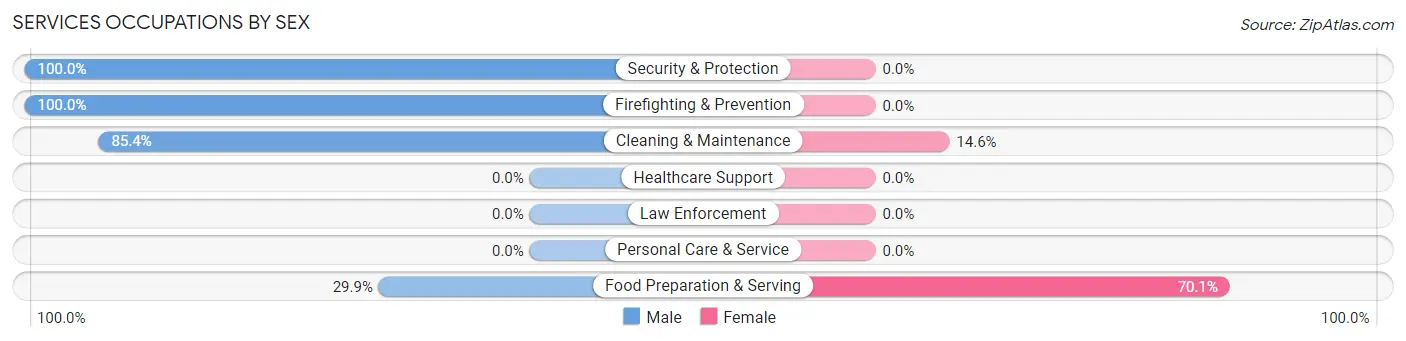
| Occupation | Male | Female |
| Healthcare Support | 0 (0.0%) | 0 (0.0%) |
| Security & Protection | 21 (100.0%) | 0 (0.0%) |
| Firefighting & Prevention | 21 (100.0%) | 0 (0.0%) |
| Law Enforcement | 0 (0.0%) | 0 (0.0%) |
| Food Preparation & Serving | 23 (29.9%) | 54 (70.1%) |
| Cleaning & Maintenance | 35 (85.4%) | 6 (14.6%) |
| Personal Care & Service | 0 (0.0%) | 0 (0.0%) |
| Total (Category) | 79 (56.8%) | 60 (43.2%) |
| Total (Overall) | 537 (51.9%) | 498 (48.1%) |
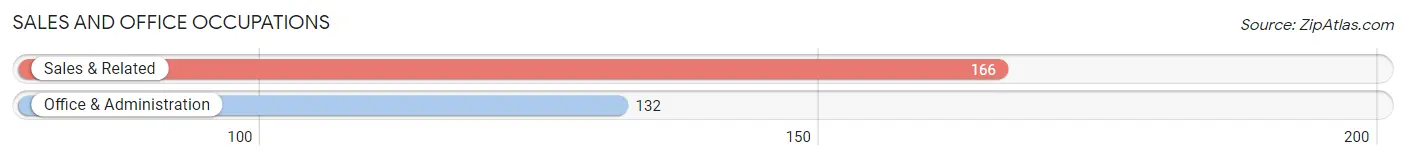
Sales and Office Occupations
The most common Sales and Office occupations in Reed Creek are Sales & Related (166 | 16.0%), and Office & Administration (132 | 12.8%).
Sales and Office Occupations by Sex
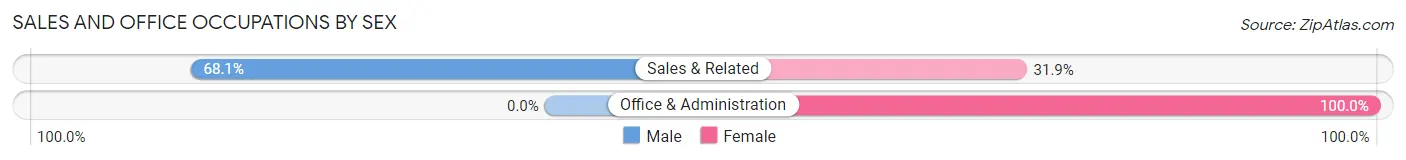
| Occupation | Male | Female |
| Sales & Related | 113 (68.1%) | 53 (31.9%) |
| Office & Administration | 0 (0.0%) | 132 (100.0%) |
| Total (Category) | 113 (37.9%) | 185 (62.1%) |
| Total (Overall) | 537 (51.9%) | 498 (48.1%) |
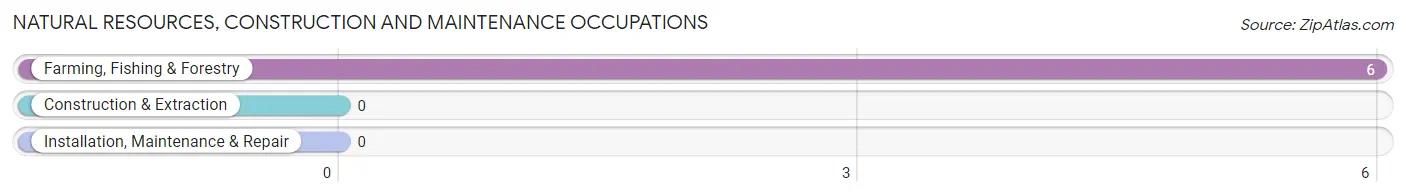
Natural Resources, Construction and Maintenance Occupations
The most common Natural Resources, Construction and Maintenance occupations in Reed Creek are , and Farming, Fishing & Forestry (6 | 0.6%).
Natural Resources, Construction and Maintenance Occupations by Sex
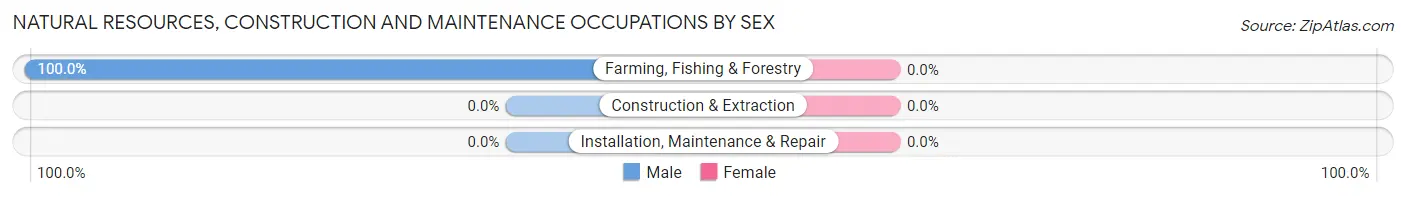
| Occupation | Male | Female |
| Farming, Fishing & Forestry | 6 (100.0%) | 0 (0.0%) |
| Construction & Extraction | 0 (0.0%) | 0 (0.0%) |
| Installation, Maintenance & Repair | 0 (0.0%) | 0 (0.0%) |
| Total (Category) | 6 (100.0%) | 0 (0.0%) |
| Total (Overall) | 537 (51.9%) | 498 (48.1%) |
Production, Transportation and Moving Occupations
The most common Production, Transportation and Moving occupations in Reed Creek are Production (88 | 8.5%), and Material Moving (9 | 0.9%).
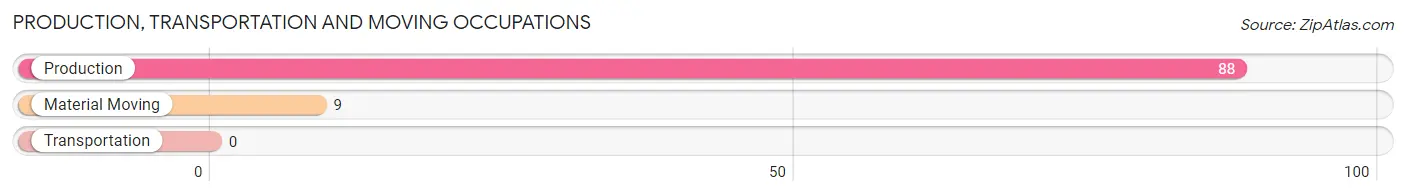
Production, Transportation and Moving Occupations by Sex
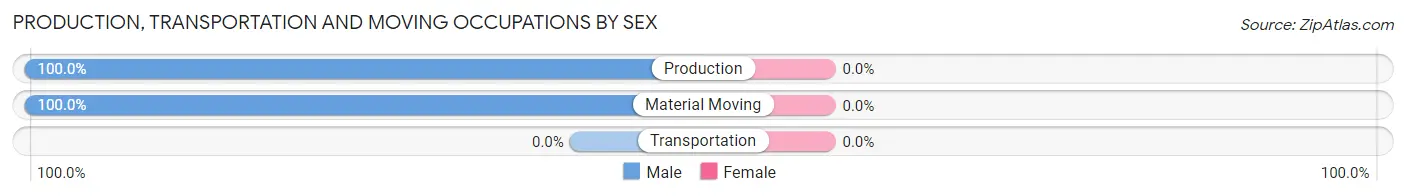
| Occupation | Male | Female |
| Production | 88 (100.0%) | 0 (0.0%) |
| Transportation | 0 (0.0%) | 0 (0.0%) |
| Material Moving | 9 (100.0%) | 0 (0.0%) |
| Total (Category) | 97 (100.0%) | 0 (0.0%) |
| Total (Overall) | 537 (51.9%) | 498 (48.1%) |
Employment Industries by Sex in Reed Creek
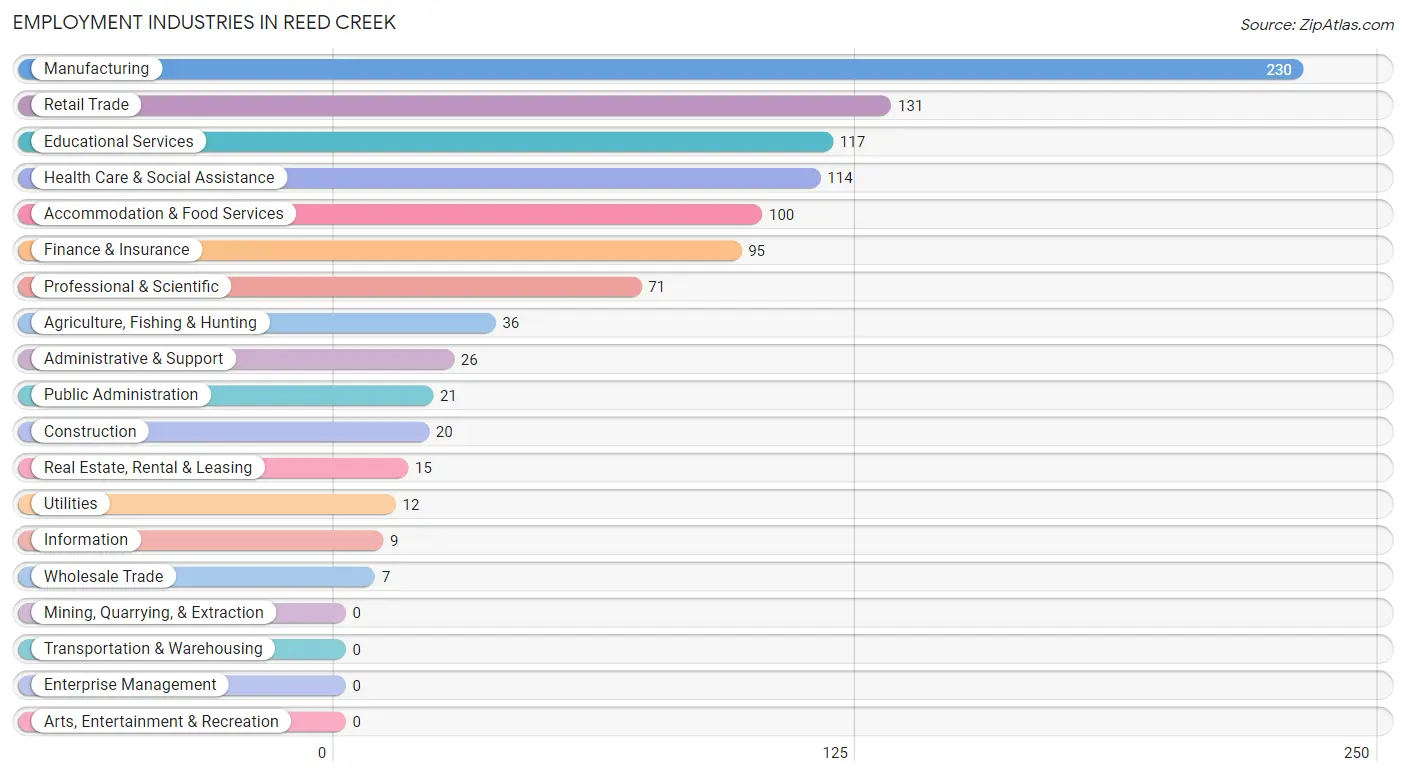
Employment Industries in Reed Creek
The major employment industries in Reed Creek include Manufacturing (230 | 22.2%), Retail Trade (131 | 12.7%), Educational Services (117 | 11.3%), Health Care & Social Assistance (114 | 11.0%), and Accommodation & Food Services (100 | 9.7%).
Employment Industries by Sex in Reed Creek
The Reed Creek industries that see more men than women are Agriculture, Fishing & Hunting (100.0%), Construction (100.0%), and Utilities (100.0%), whereas the industries that tend to have a higher number of women are Wholesale Trade (100.0%), Information (100.0%), and Health Care & Social Assistance (88.6%).
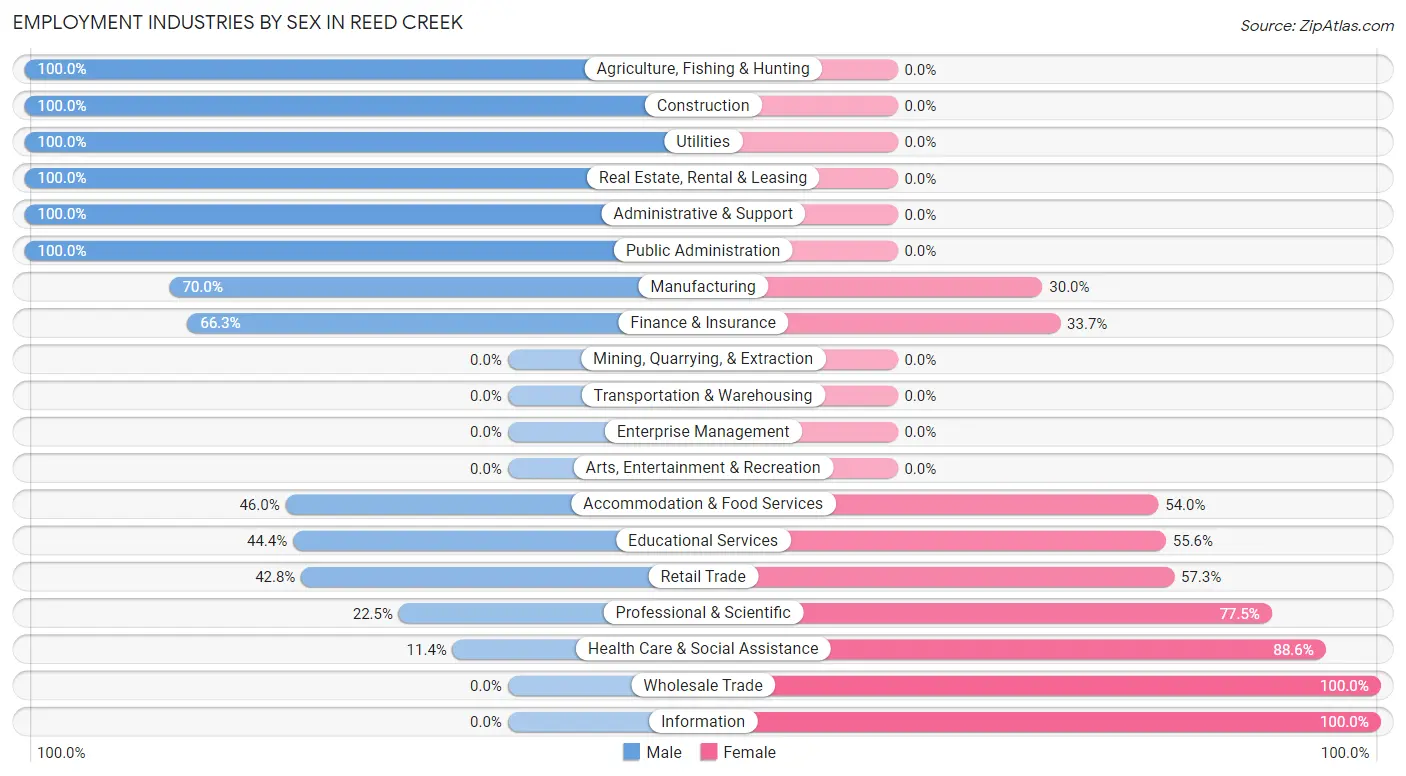
| Industry | Male | Female |
| Agriculture, Fishing & Hunting | 36 (100.0%) | 0 (0.0%) |
| Mining, Quarrying, & Extraction | 0 (0.0%) | 0 (0.0%) |
| Construction | 20 (100.0%) | 0 (0.0%) |
| Manufacturing | 161 (70.0%) | 69 (30.0%) |
| Wholesale Trade | 0 (0.0%) | 7 (100.0%) |
| Retail Trade | 56 (42.7%) | 75 (57.3%) |
| Transportation & Warehousing | 0 (0.0%) | 0 (0.0%) |
| Utilities | 12 (100.0%) | 0 (0.0%) |
| Information | 0 (0.0%) | 9 (100.0%) |
| Finance & Insurance | 63 (66.3%) | 32 (33.7%) |
| Real Estate, Rental & Leasing | 15 (100.0%) | 0 (0.0%) |
| Professional & Scientific | 16 (22.5%) | 55 (77.5%) |
| Enterprise Management | 0 (0.0%) | 0 (0.0%) |
| Administrative & Support | 26 (100.0%) | 0 (0.0%) |
| Educational Services | 52 (44.4%) | 65 (55.6%) |
| Health Care & Social Assistance | 13 (11.4%) | 101 (88.6%) |
| Arts, Entertainment & Recreation | 0 (0.0%) | 0 (0.0%) |
| Accommodation & Food Services | 46 (46.0%) | 54 (54.0%) |
| Public Administration | 21 (100.0%) | 0 (0.0%) |
| Total | 537 (51.9%) | 498 (48.1%) |
Education in Reed Creek
School Enrollment in Reed Creek
The most common levels of schooling among the 221 students in Reed Creek are college / undergraduate (100 | 45.3%), middle school (52 | 23.5%), and high school (41 | 18.5%).
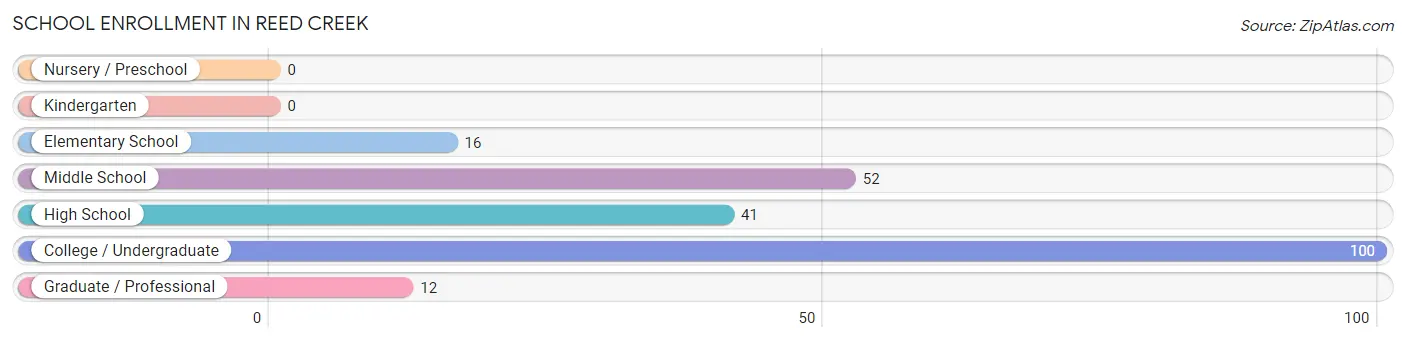
| School Level | # Students | % Students |
| Nursery / Preschool | 0 | 0.0% |
| Kindergarten | 0 | 0.0% |
| Elementary School | 16 | 7.2% |
| Middle School | 52 | 23.5% |
| High School | 41 | 18.5% |
| College / Undergraduate | 100 | 45.3% |
| Graduate / Professional | 12 | 5.4% |
| Total | 221 | 100.0% |
School Enrollment by Age by Funding Source in Reed Creek
Out of a total of 221 students who are enrolled in schools in Reed Creek, 45 (20.4%) attend a private institution, while the remaining 176 (79.6%) are enrolled in public schools. The age group of 15 to 17 year olds has the highest likelihood of being enrolled in private schools, with 26 (100.0% in the age bracket) enrolled. Conversely, the age group of 5 to 9 year old has the lowest likelihood of being enrolled in a private school, with 16 (100.0% in the age bracket) attending a public institution.
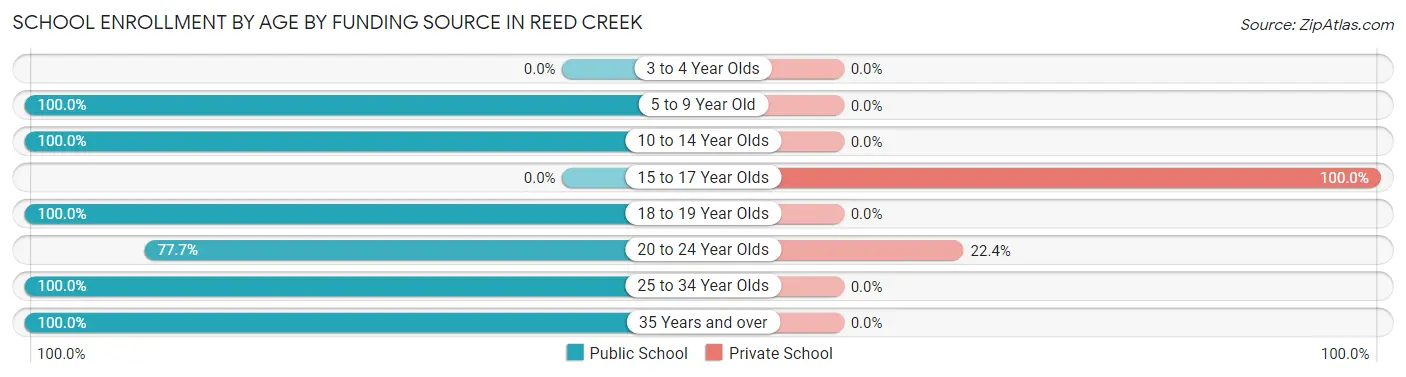
| Age Bracket | Public School | Private School |
| 3 to 4 Year Olds | 0 (0.0%) | 0 (0.0%) |
| 5 to 9 Year Old | 16 (100.0%) | 0 (0.0%) |
| 10 to 14 Year Olds | 62 (100.0%) | 0 (0.0%) |
| 15 to 17 Year Olds | 0 (0.0%) | 26 (100.0%) |
| 18 to 19 Year Olds | 5 (100.0%) | 0 (0.0%) |
| 20 to 24 Year Olds | 66 (77.6%) | 19 (22.4%) |
| 25 to 34 Year Olds | 20 (100.0%) | 0 (0.0%) |
| 35 Years and over | 7 (100.0%) | 0 (0.0%) |
| Total | 176 (79.6%) | 45 (20.4%) |
Educational Attainment by Field of Study in Reed Creek
Business (217 | 25.6%), education (149 | 17.6%), social sciences (94 | 11.1%), computers & mathematics (78 | 9.2%), and communications (64 | 7.5%) are the most common fields of study among 848 individuals in Reed Creek who have obtained a bachelor's degree or higher.
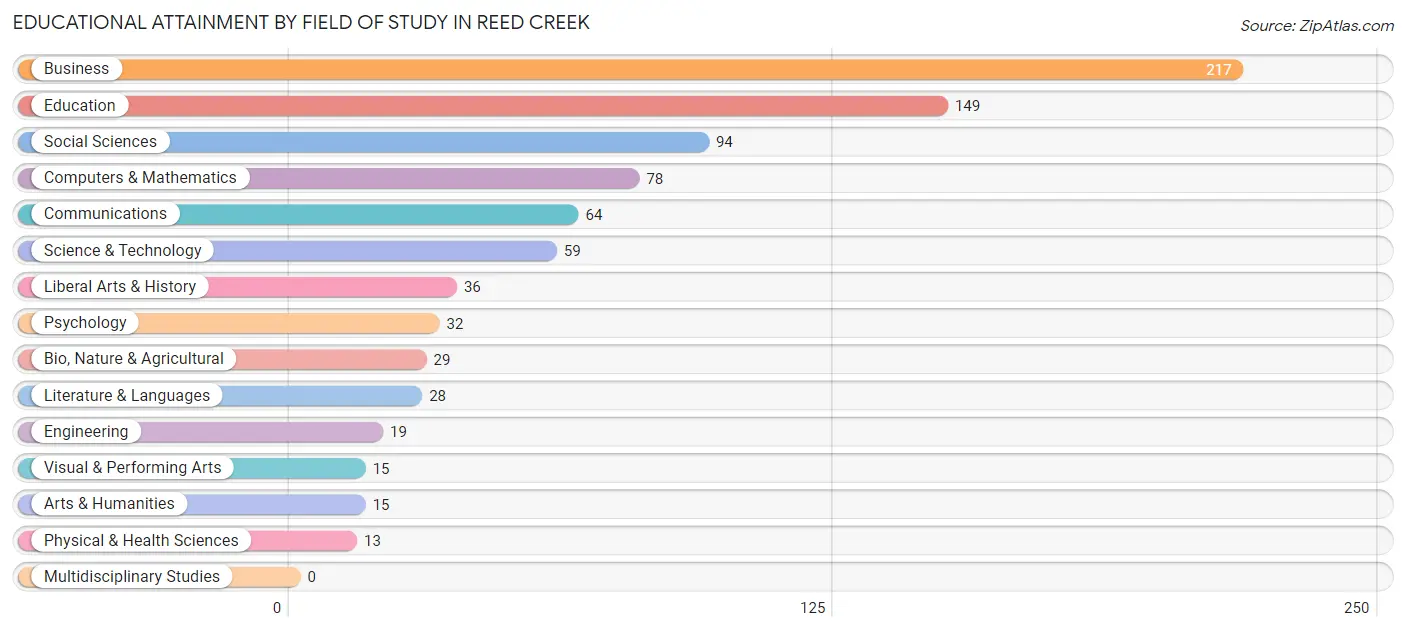
| Field of Study | # Graduates | % Graduates |
| Computers & Mathematics | 78 | 9.2% |
| Bio, Nature & Agricultural | 29 | 3.4% |
| Physical & Health Sciences | 13 | 1.5% |
| Psychology | 32 | 3.8% |
| Social Sciences | 94 | 11.1% |
| Engineering | 19 | 2.2% |
| Multidisciplinary Studies | 0 | 0.0% |
| Science & Technology | 59 | 7.0% |
| Business | 217 | 25.6% |
| Education | 149 | 17.6% |
| Literature & Languages | 28 | 3.3% |
| Liberal Arts & History | 36 | 4.3% |
| Visual & Performing Arts | 15 | 1.8% |
| Communications | 64 | 7.5% |
| Arts & Humanities | 15 | 1.8% |
| Total | 848 | 100.0% |
Transportation & Commute in Reed Creek
Vehicle Availability by Sex in Reed Creek
The most prevalent vehicle ownership categories in Reed Creek are males with 3 vehicles (195, accounting for 35.1%) and females with 3 vehicles (175, making up 39.2%).
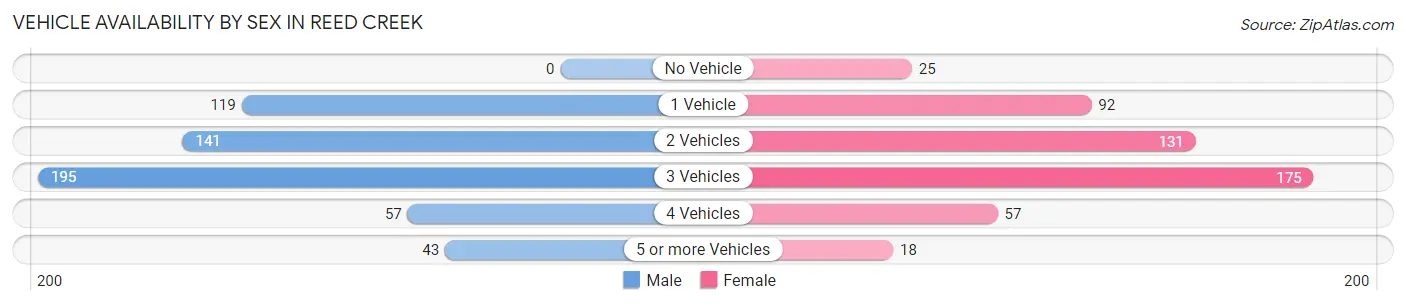
| Vehicles Available | Male | Female |
| No Vehicle | 0 (0.0%) | 25 (5.0%) |
| 1 Vehicle | 119 (21.4%) | 92 (18.5%) |
| 2 Vehicles | 141 (25.4%) | 131 (26.3%) |
| 3 Vehicles | 195 (35.1%) | 175 (35.1%) |
| 4 Vehicles | 57 (10.3%) | 57 (11.5%) |
| 5 or more Vehicles | 43 (7.7%) | 18 (3.6%) |
| Total | 555 (100.0%) | 498 (100.0%) |
Commute Time in Reed Creek
The most frequently occuring commute durations in Reed Creek are 15 to 19 minutes (165 commuters, 18.7%), 30 to 34 minutes (132 commuters, 14.9%), and 10 to 14 minutes (120 commuters, 13.6%).
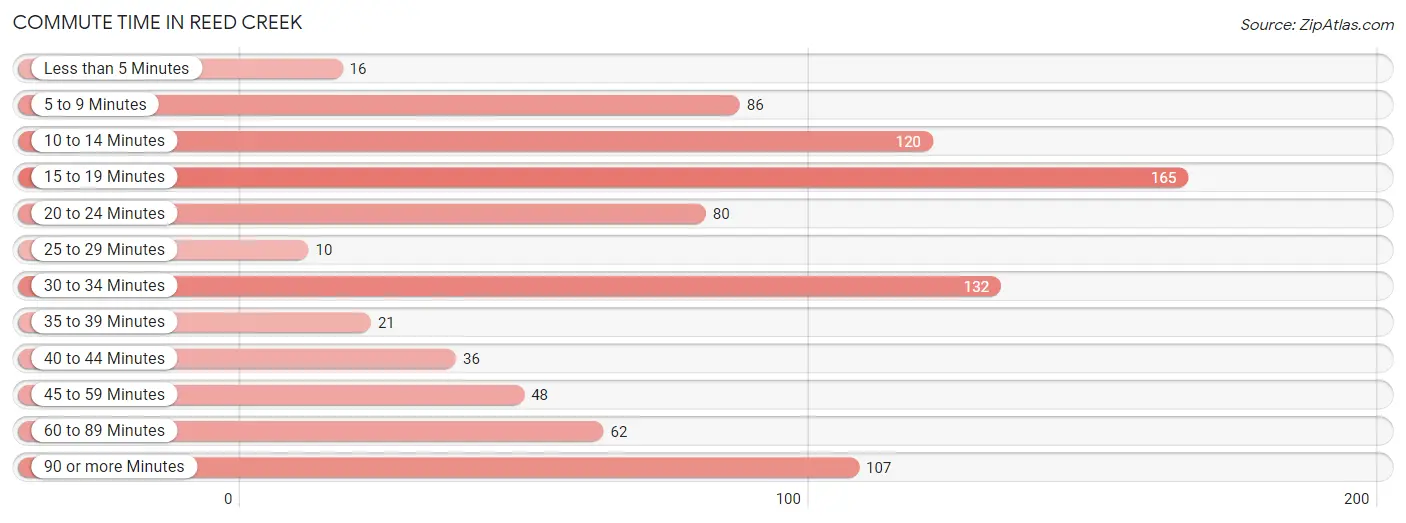
| Commute Time | # Commuters | % Commuters |
| Less than 5 Minutes | 16 | 1.8% |
| 5 to 9 Minutes | 86 | 9.7% |
| 10 to 14 Minutes | 120 | 13.6% |
| 15 to 19 Minutes | 165 | 18.7% |
| 20 to 24 Minutes | 80 | 9.1% |
| 25 to 29 Minutes | 10 | 1.1% |
| 30 to 34 Minutes | 132 | 14.9% |
| 35 to 39 Minutes | 21 | 2.4% |
| 40 to 44 Minutes | 36 | 4.1% |
| 45 to 59 Minutes | 48 | 5.4% |
| 60 to 89 Minutes | 62 | 7.0% |
| 90 or more Minutes | 107 | 12.1% |
Commute Time by Sex in Reed Creek
The most common commute times in Reed Creek are 30 to 34 minutes (74 commuters, 16.1%) for males and 15 to 19 minutes (115 commuters, 27.1%) for females.
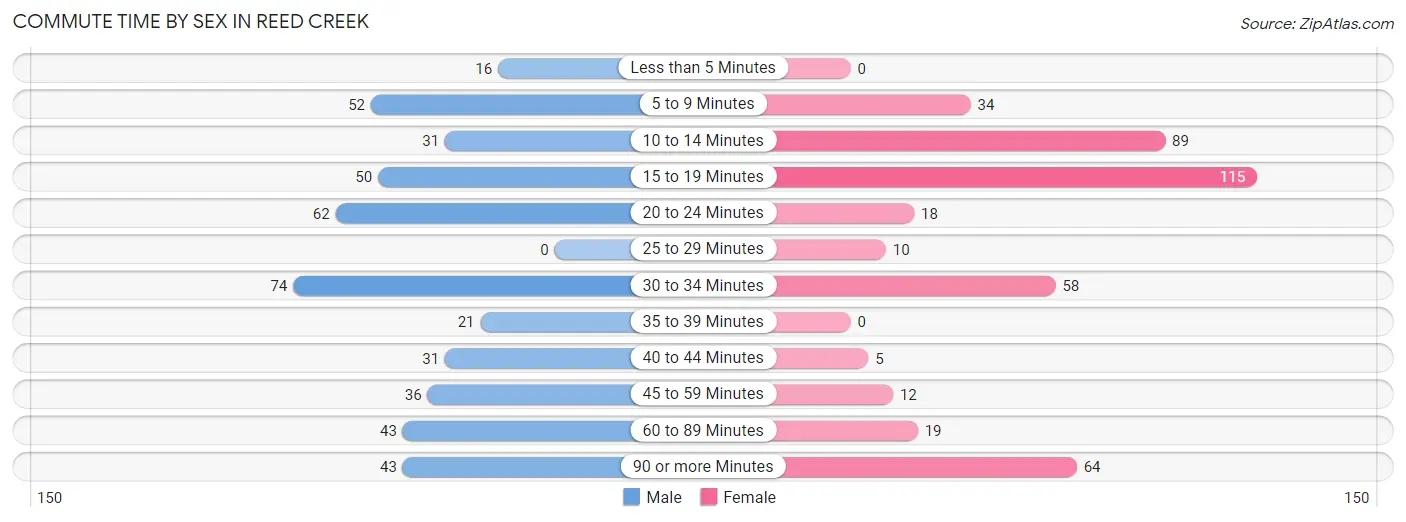
| Commute Time | Male | Female |
| Less than 5 Minutes | 16 (3.5%) | 0 (0.0%) |
| 5 to 9 Minutes | 52 (11.3%) | 34 (8.0%) |
| 10 to 14 Minutes | 31 (6.8%) | 89 (21.0%) |
| 15 to 19 Minutes | 50 (10.9%) | 115 (27.1%) |
| 20 to 24 Minutes | 62 (13.5%) | 18 (4.3%) |
| 25 to 29 Minutes | 0 (0.0%) | 10 (2.4%) |
| 30 to 34 Minutes | 74 (16.1%) | 58 (13.7%) |
| 35 to 39 Minutes | 21 (4.6%) | 0 (0.0%) |
| 40 to 44 Minutes | 31 (6.8%) | 5 (1.2%) |
| 45 to 59 Minutes | 36 (7.8%) | 12 (2.8%) |
| 60 to 89 Minutes | 43 (9.4%) | 19 (4.5%) |
| 90 or more Minutes | 43 (9.4%) | 64 (15.1%) |
Time of Departure to Work by Sex in Reed Creek
The most frequent times of departure to work in Reed Creek are 7:30 AM to 7:59 AM (190, 41.4%) for males and 7:30 AM to 7:59 AM (103, 24.3%) for females.
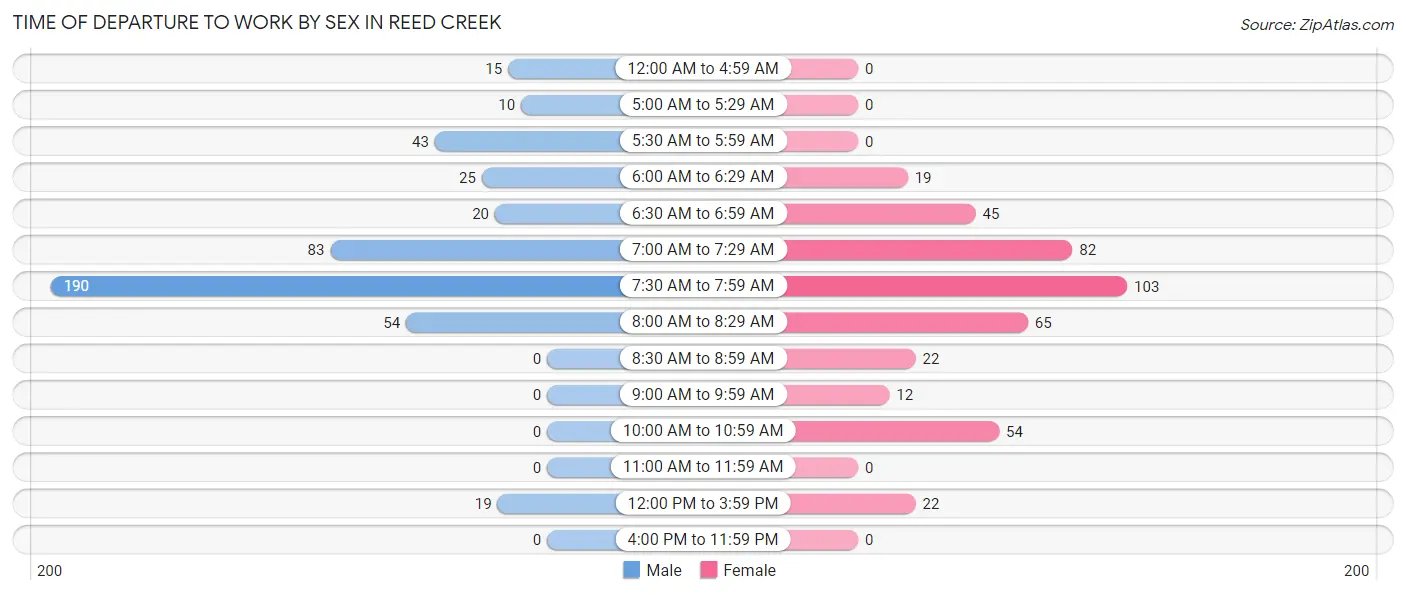
| Time of Departure | Male | Female |
| 12:00 AM to 4:59 AM | 15 (3.3%) | 0 (0.0%) |
| 5:00 AM to 5:29 AM | 10 (2.2%) | 0 (0.0%) |
| 5:30 AM to 5:59 AM | 43 (9.4%) | 0 (0.0%) |
| 6:00 AM to 6:29 AM | 25 (5.4%) | 19 (4.5%) |
| 6:30 AM to 6:59 AM | 20 (4.4%) | 45 (10.6%) |
| 7:00 AM to 7:29 AM | 83 (18.1%) | 82 (19.3%) |
| 7:30 AM to 7:59 AM | 190 (41.4%) | 103 (24.3%) |
| 8:00 AM to 8:29 AM | 54 (11.8%) | 65 (15.3%) |
| 8:30 AM to 8:59 AM | 0 (0.0%) | 22 (5.2%) |
| 9:00 AM to 9:59 AM | 0 (0.0%) | 12 (2.8%) |
| 10:00 AM to 10:59 AM | 0 (0.0%) | 54 (12.7%) |
| 11:00 AM to 11:59 AM | 0 (0.0%) | 0 (0.0%) |
| 12:00 PM to 3:59 PM | 19 (4.1%) | 22 (5.2%) |
| 4:00 PM to 11:59 PM | 0 (0.0%) | 0 (0.0%) |
| Total | 459 (100.0%) | 424 (100.0%) |
Housing Occupancy in Reed Creek
Occupancy by Ownership in Reed Creek
Of the total 1,376 dwellings in Reed Creek, owner-occupied units account for 1,296 (94.2%), while renter-occupied units make up 80 (5.8%).
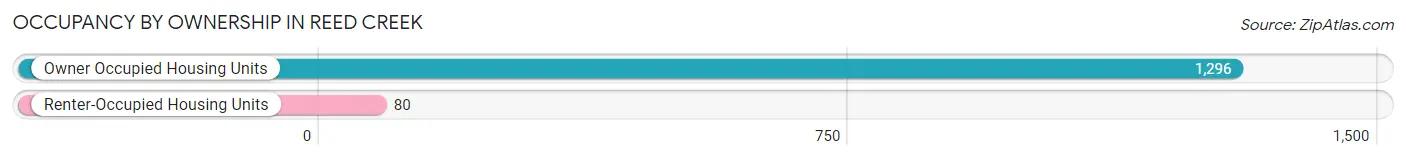
| Occupancy | # Housing Units | % Housing Units |
| Owner Occupied Housing Units | 1,296 | 94.2% |
| Renter-Occupied Housing Units | 80 | 5.8% |
| Total Occupied Housing Units | 1,376 | 100.0% |
Occupancy by Household Size in Reed Creek
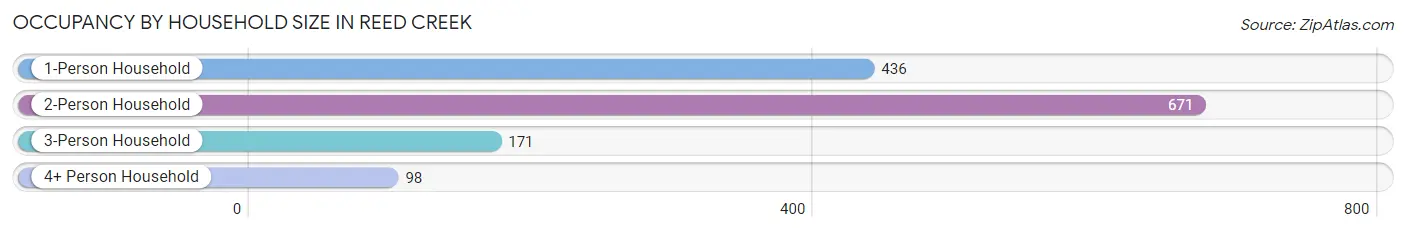
| Household Size | # Housing Units | % Housing Units |
| 1-Person Household | 436 | 31.7% |
| 2-Person Household | 671 | 48.8% |
| 3-Person Household | 171 | 12.4% |
| 4+ Person Household | 98 | 7.1% |
| Total Housing Units | 1,376 | 100.0% |
Occupancy by Ownership by Household Size in Reed Creek
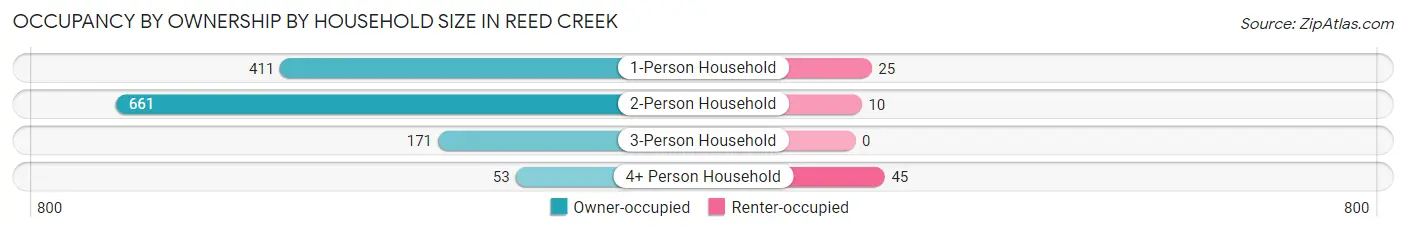
| Household Size | Owner-occupied | Renter-occupied |
| 1-Person Household | 411 (94.3%) | 25 (5.7%) |
| 2-Person Household | 661 (98.5%) | 10 (1.5%) |
| 3-Person Household | 171 (100.0%) | 0 (0.0%) |
| 4+ Person Household | 53 (54.1%) | 45 (45.9%) |
| Total Housing Units | 1,296 (94.2%) | 80 (5.8%) |
Occupancy by Educational Attainment in Reed Creek
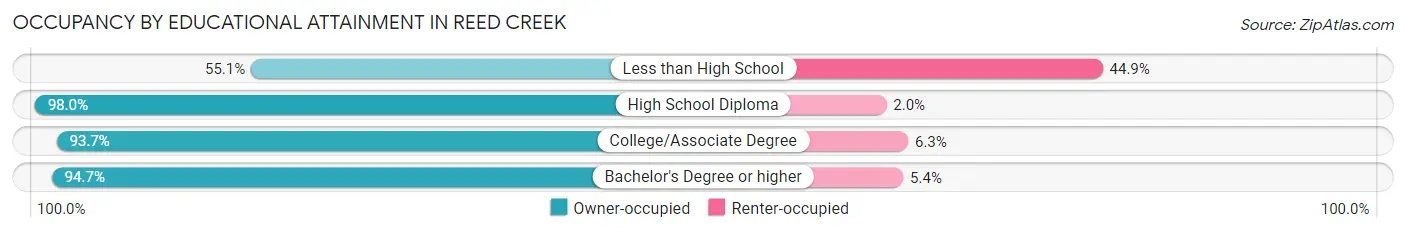
| Household Size | Owner-occupied | Renter-occupied |
| Less than High School | 27 (55.1%) | 22 (44.9%) |
| High School Diploma | 486 (98.0%) | 10 (2.0%) |
| College/Associate Degree | 341 (93.7%) | 23 (6.3%) |
| Bachelor's Degree or higher | 442 (94.7%) | 25 (5.3%) |
Occupancy by Age of Householder in Reed Creek
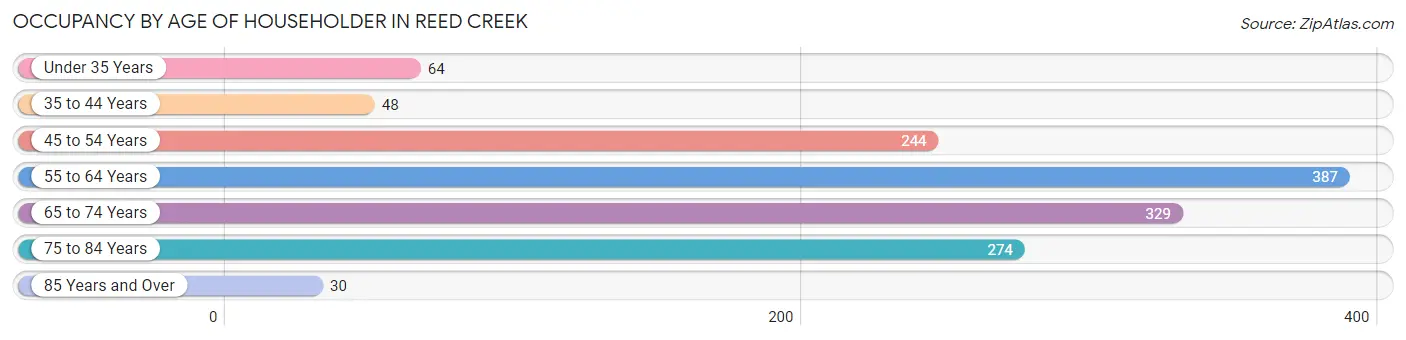
| Age Bracket | # Households | % Households |
| Under 35 Years | 64 | 4.6% |
| 35 to 44 Years | 48 | 3.5% |
| 45 to 54 Years | 244 | 17.7% |
| 55 to 64 Years | 387 | 28.1% |
| 65 to 74 Years | 329 | 23.9% |
| 75 to 84 Years | 274 | 19.9% |
| 85 Years and Over | 30 | 2.2% |
| Total | 1,376 | 100.0% |
Housing Finances in Reed Creek
Median Income by Occupancy in Reed Creek
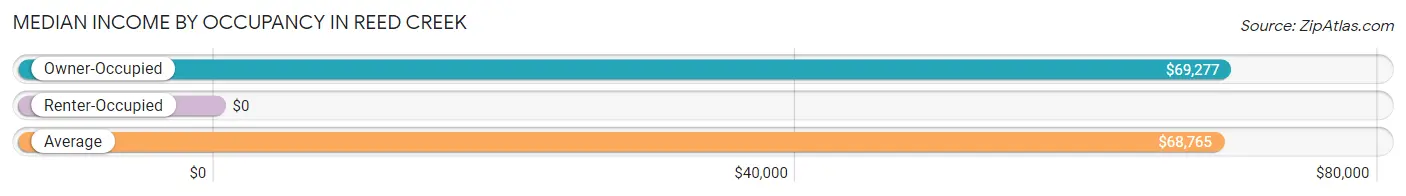
| Occupancy Type | # Households | Median Income |
| Owner-Occupied | 1,296 (94.2%) | $69,277 |
| Renter-Occupied | 80 (5.8%) | $0 |
| Average | 1,376 (100.0%) | $68,765 |
Occupancy by Householder Income Bracket in Reed Creek
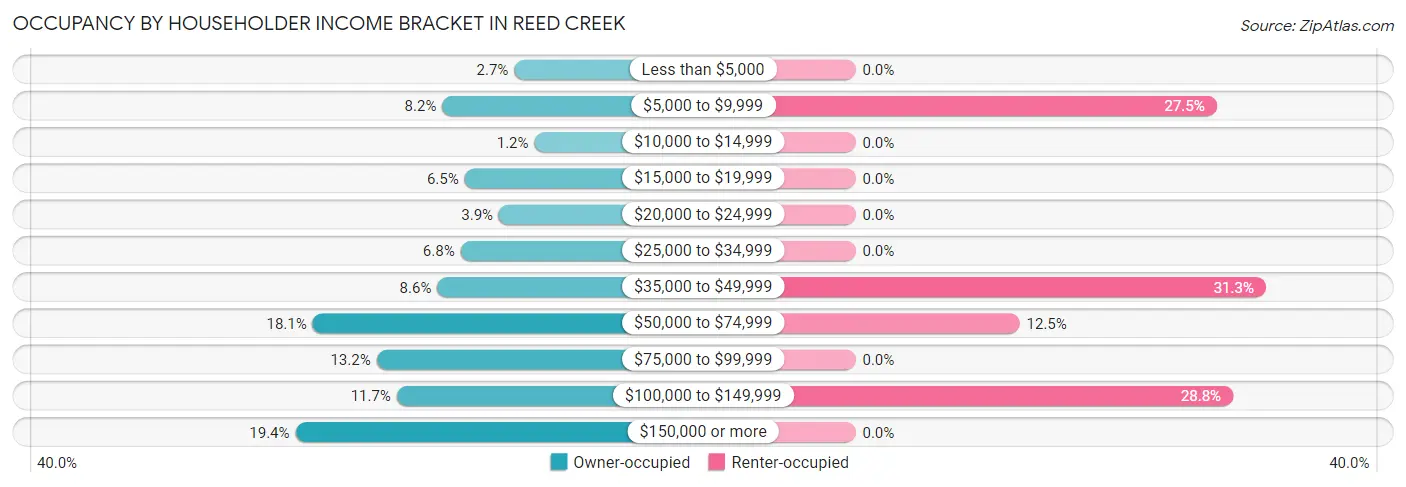
| Income Bracket | Owner-occupied | Renter-occupied |
| Less than $5,000 | 35 (2.7%) | 0 (0.0%) |
| $5,000 to $9,999 | 106 (8.2%) | 22 (27.5%) |
| $10,000 to $14,999 | 15 (1.2%) | 0 (0.0%) |
| $15,000 to $19,999 | 84 (6.5%) | 0 (0.0%) |
| $20,000 to $24,999 | 50 (3.9%) | 0 (0.0%) |
| $25,000 to $34,999 | 88 (6.8%) | 0 (0.0%) |
| $35,000 to $49,999 | 111 (8.6%) | 25 (31.2%) |
| $50,000 to $74,999 | 234 (18.1%) | 10 (12.5%) |
| $75,000 to $99,999 | 171 (13.2%) | 0 (0.0%) |
| $100,000 to $149,999 | 151 (11.7%) | 23 (28.7%) |
| $150,000 or more | 251 (19.4%) | 0 (0.0%) |
| Total | 1,296 (100.0%) | 80 (100.0%) |
Monthly Housing Cost Tiers in Reed Creek
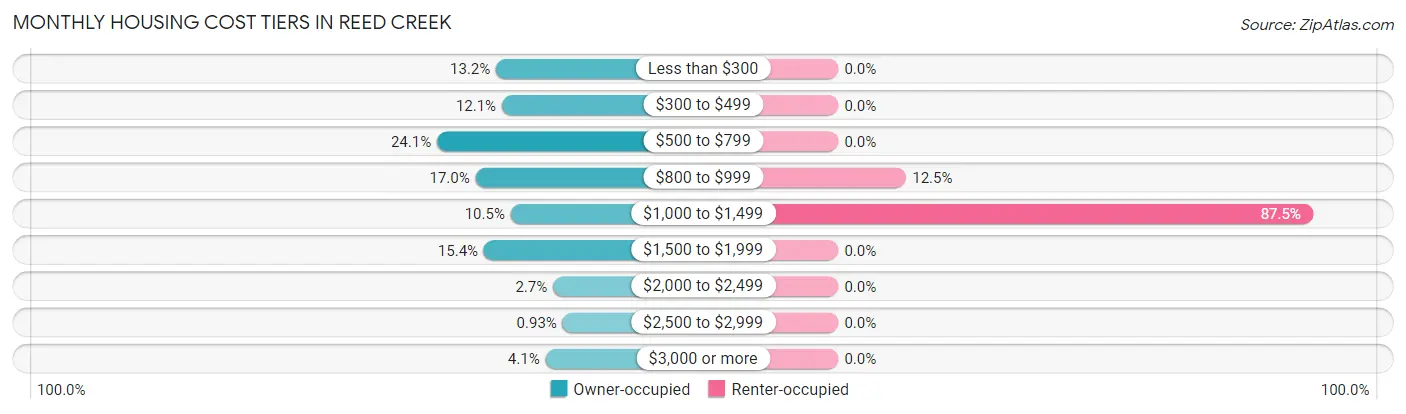
| Monthly Cost | Owner-occupied | Renter-occupied |
| Less than $300 | 171 (13.2%) | 0 (0.0%) |
| $300 to $499 | 157 (12.1%) | 0 (0.0%) |
| $500 to $799 | 312 (24.1%) | 0 (0.0%) |
| $800 to $999 | 220 (17.0%) | 10 (12.5%) |
| $1,000 to $1,499 | 136 (10.5%) | 70 (87.5%) |
| $1,500 to $1,999 | 200 (15.4%) | 0 (0.0%) |
| $2,000 to $2,499 | 35 (2.7%) | 0 (0.0%) |
| $2,500 to $2,999 | 12 (0.9%) | 0 (0.0%) |
| $3,000 or more | 53 (4.1%) | 0 (0.0%) |
| Total | 1,296 (100.0%) | 80 (100.0%) |
Physical Housing Characteristics in Reed Creek
Housing Structures in Reed Creek
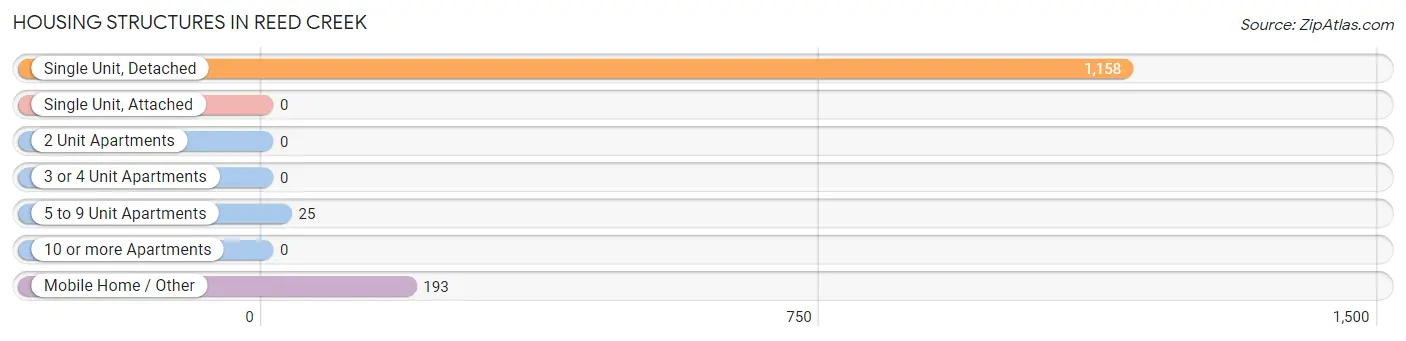
| Structure Type | # Housing Units | % Housing Units |
| Single Unit, Detached | 1,158 | 84.2% |
| Single Unit, Attached | 0 | 0.0% |
| 2 Unit Apartments | 0 | 0.0% |
| 3 or 4 Unit Apartments | 0 | 0.0% |
| 5 to 9 Unit Apartments | 25 | 1.8% |
| 10 or more Apartments | 0 | 0.0% |
| Mobile Home / Other | 193 | 14.0% |
| Total | 1,376 | 100.0% |
Housing Structures by Occupancy in Reed Creek
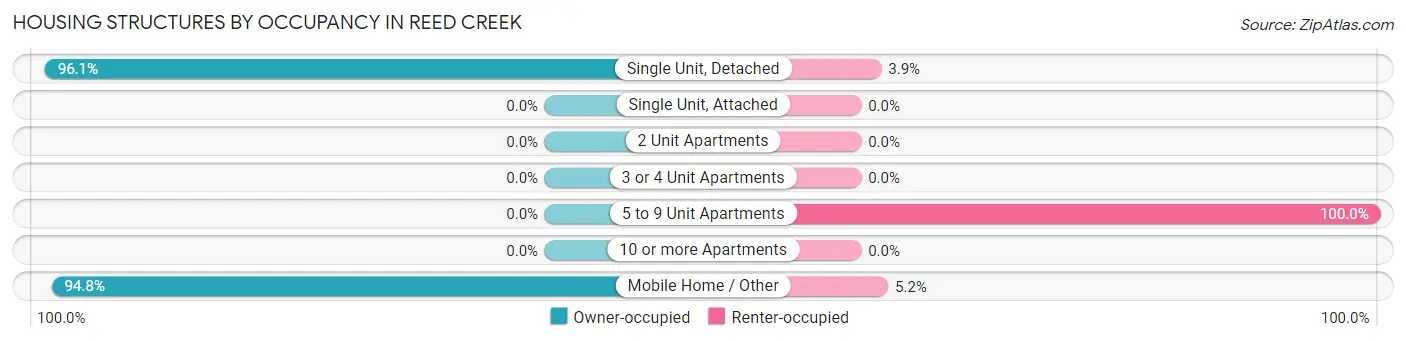
| Structure Type | Owner-occupied | Renter-occupied |
| Single Unit, Detached | 1,113 (96.1%) | 45 (3.9%) |
| Single Unit, Attached | 0 (0.0%) | 0 (0.0%) |
| 2 Unit Apartments | 0 (0.0%) | 0 (0.0%) |
| 3 or 4 Unit Apartments | 0 (0.0%) | 0 (0.0%) |
| 5 to 9 Unit Apartments | 0 (0.0%) | 25 (100.0%) |
| 10 or more Apartments | 0 (0.0%) | 0 (0.0%) |
| Mobile Home / Other | 183 (94.8%) | 10 (5.2%) |
| Total | 1,296 (94.2%) | 80 (5.8%) |
Housing Structures by Number of Rooms in Reed Creek
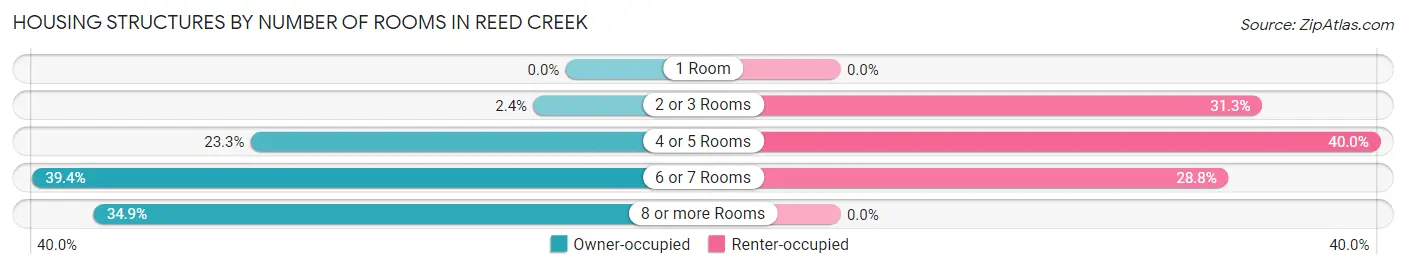
| Number of Rooms | Owner-occupied | Renter-occupied |
| 1 Room | 0 (0.0%) | 0 (0.0%) |
| 2 or 3 Rooms | 31 (2.4%) | 25 (31.2%) |
| 4 or 5 Rooms | 302 (23.3%) | 32 (40.0%) |
| 6 or 7 Rooms | 511 (39.4%) | 23 (28.7%) |
| 8 or more Rooms | 452 (34.9%) | 0 (0.0%) |
| Total | 1,296 (100.0%) | 80 (100.0%) |
Housing Structure by Heating Type in Reed Creek
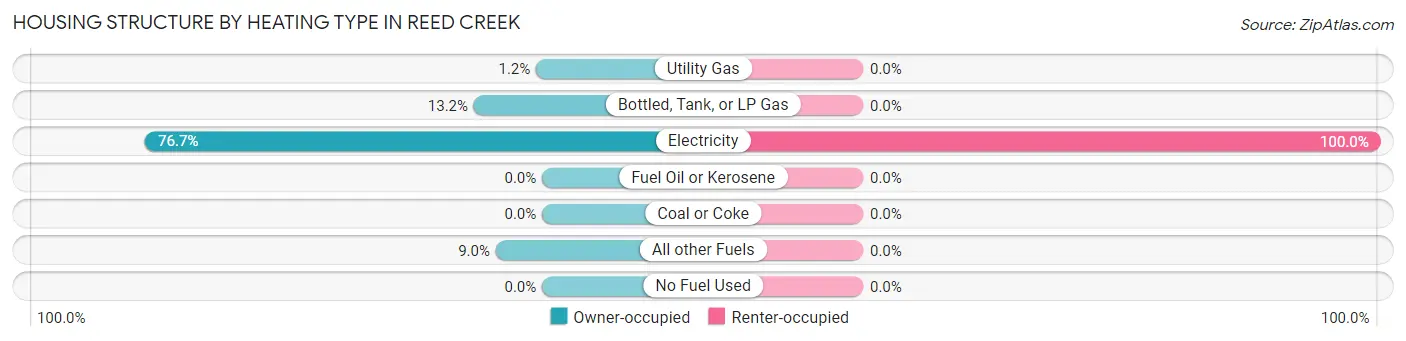
| Heating Type | Owner-occupied | Renter-occupied |
| Utility Gas | 15 (1.2%) | 0 (0.0%) |
| Bottled, Tank, or LP Gas | 171 (13.2%) | 0 (0.0%) |
| Electricity | 994 (76.7%) | 80 (100.0%) |
| Fuel Oil or Kerosene | 0 (0.0%) | 0 (0.0%) |
| Coal or Coke | 0 (0.0%) | 0 (0.0%) |
| All other Fuels | 116 (8.9%) | 0 (0.0%) |
| No Fuel Used | 0 (0.0%) | 0 (0.0%) |
| Total | 1,296 (100.0%) | 80 (100.0%) |
Household Vehicle Usage in Reed Creek
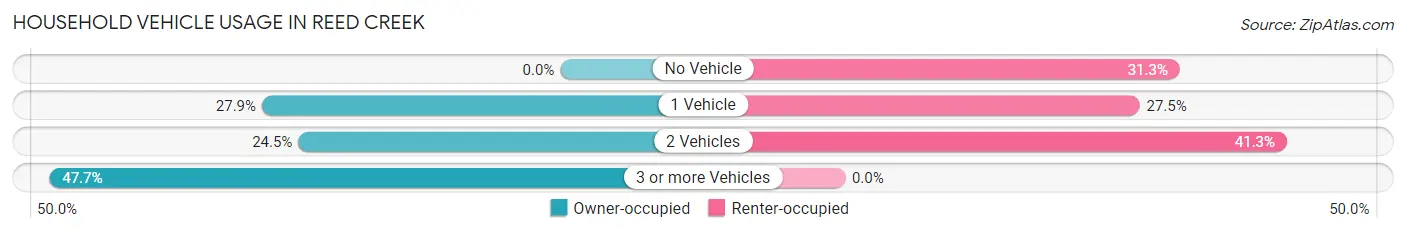
| Vehicles per Household | Owner-occupied | Renter-occupied |
| No Vehicle | 0 (0.0%) | 25 (31.2%) |
| 1 Vehicle | 361 (27.9%) | 22 (27.5%) |
| 2 Vehicles | 317 (24.5%) | 33 (41.2%) |
| 3 or more Vehicles | 618 (47.7%) | 0 (0.0%) |
| Total | 1,296 (100.0%) | 80 (100.0%) |
Real Estate & Mortgages in Reed Creek
Real Estate and Mortgage Overview in Reed Creek
| Characteristic | Without Mortgage | With Mortgage |
| Housing Units | 673 | 623 |
| Median Property Value | $242,000 | $267,400 |
| Median Household Income | $65,915 | $151 |
| Monthly Housing Costs | $510 | $53 |
| Real Estate Taxes | $1,411 | $0 |
Property Value by Mortgage Status in Reed Creek
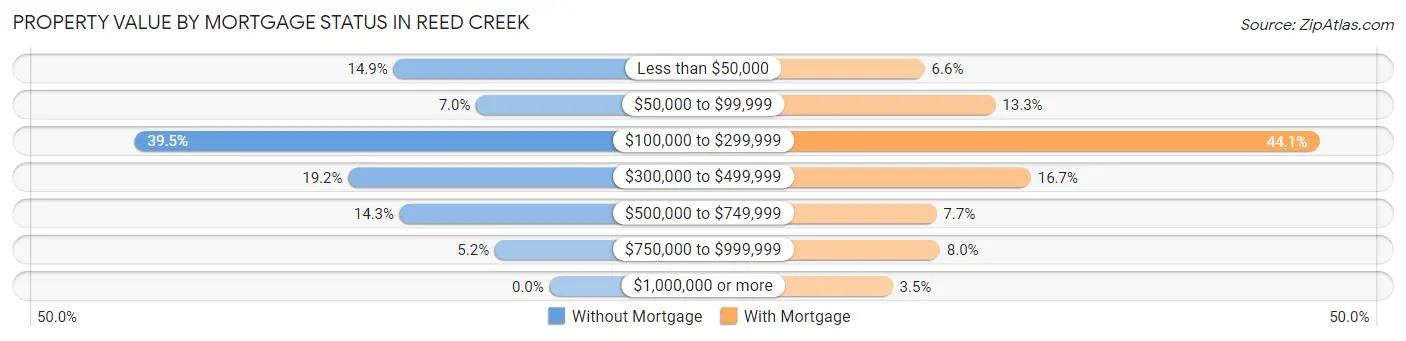
| Property Value | Without Mortgage | With Mortgage |
| Less than $50,000 | 100 (14.9%) | 41 (6.6%) |
| $50,000 to $99,999 | 47 (7.0%) | 83 (13.3%) |
| $100,000 to $299,999 | 266 (39.5%) | 275 (44.1%) |
| $300,000 to $499,999 | 129 (19.2%) | 104 (16.7%) |
| $500,000 to $749,999 | 96 (14.3%) | 48 (7.7%) |
| $750,000 to $999,999 | 35 (5.2%) | 50 (8.0%) |
| $1,000,000 or more | 0 (0.0%) | 22 (3.5%) |
| Total | 673 (100.0%) | 623 (100.0%) |
Household Income by Mortgage Status in Reed Creek
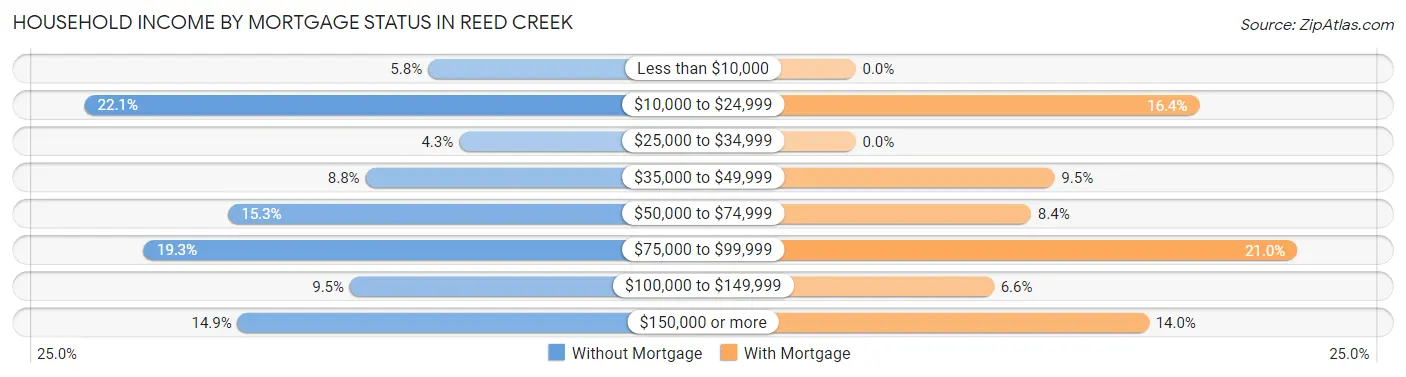
| Household Income | Without Mortgage | With Mortgage |
| Less than $10,000 | 39 (5.8%) | 0 (0.0%) |
| $10,000 to $24,999 | 149 (22.1%) | 102 (16.4%) |
| $25,000 to $34,999 | 29 (4.3%) | 0 (0.0%) |
| $35,000 to $49,999 | 59 (8.8%) | 59 (9.5%) |
| $50,000 to $74,999 | 103 (15.3%) | 52 (8.4%) |
| $75,000 to $99,999 | 130 (19.3%) | 131 (21.0%) |
| $100,000 to $149,999 | 64 (9.5%) | 41 (6.6%) |
| $150,000 or more | 100 (14.9%) | 87 (14.0%) |
| Total | 673 (100.0%) | 623 (100.0%) |
Property Value to Household Income Ratio in Reed Creek
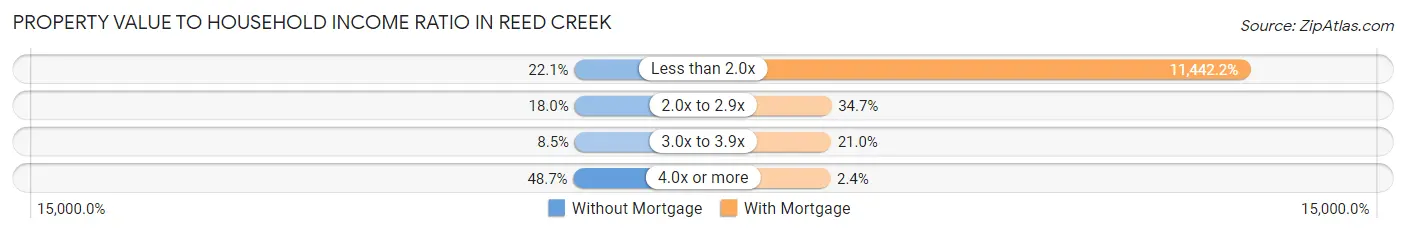
| Value-to-Income Ratio | Without Mortgage | With Mortgage |
| Less than 2.0x | 149 (22.1%) | 71,285 (11,442.2%) |
| 2.0x to 2.9x | 121 (18.0%) | 216 (34.7%) |
| 3.0x to 3.9x | 57 (8.5%) | 131 (21.0%) |
| 4.0x or more | 328 (48.7%) | 15 (2.4%) |
| Total | 673 (100.0%) | 623 (100.0%) |
Real Estate Taxes by Mortgage Status in Reed Creek
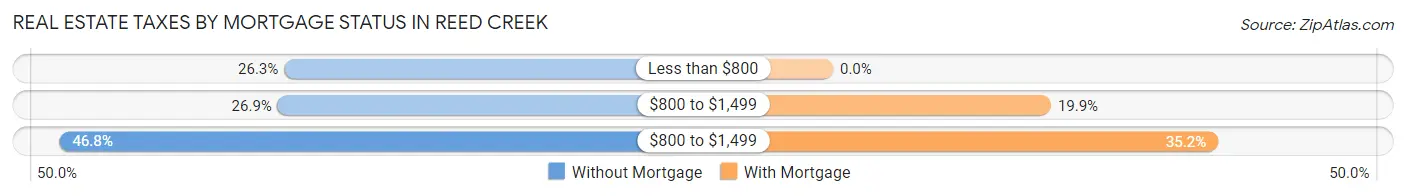
| Property Taxes | Without Mortgage | With Mortgage |
| Less than $800 | 177 (26.3%) | 0 (0.0%) |
| $800 to $1,499 | 181 (26.9%) | 124 (19.9%) |
| $800 to $1,499 | 315 (46.8%) | 219 (35.1%) |
| Total | 673 (100.0%) | 623 (100.0%) |
Health & Disability in Reed Creek
Health Insurance Coverage by Age in Reed Creek
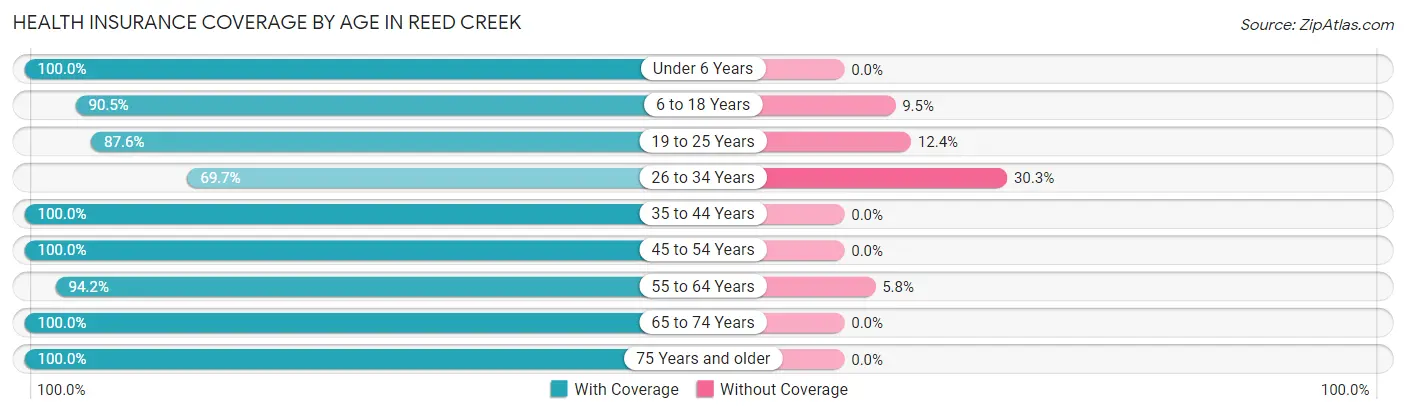
| Age Bracket | With Coverage | Without Coverage |
| Under 6 Years | 53 (100.0%) | 0 (0.0%) |
| 6 to 18 Years | 143 (90.5%) | 15 (9.5%) |
| 19 to 25 Years | 134 (87.6%) | 19 (12.4%) |
| 26 to 34 Years | 124 (69.7%) | 54 (30.3%) |
| 35 to 44 Years | 143 (100.0%) | 0 (0.0%) |
| 45 to 54 Years | 338 (100.0%) | 0 (0.0%) |
| 55 to 64 Years | 604 (94.2%) | 37 (5.8%) |
| 65 to 74 Years | 555 (100.0%) | 0 (0.0%) |
| 75 Years and older | 566 (100.0%) | 0 (0.0%) |
| Total | 2,660 (95.5%) | 125 (4.5%) |
Health Insurance Coverage by Citizenship Status in Reed Creek
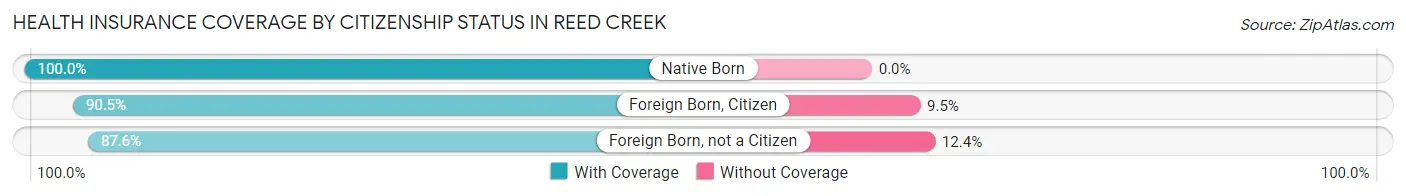
| Citizenship Status | With Coverage | Without Coverage |
| Native Born | 53 (100.0%) | 0 (0.0%) |
| Foreign Born, Citizen | 143 (90.5%) | 15 (9.5%) |
| Foreign Born, not a Citizen | 134 (87.6%) | 19 (12.4%) |
Health Insurance Coverage by Household Income in Reed Creek
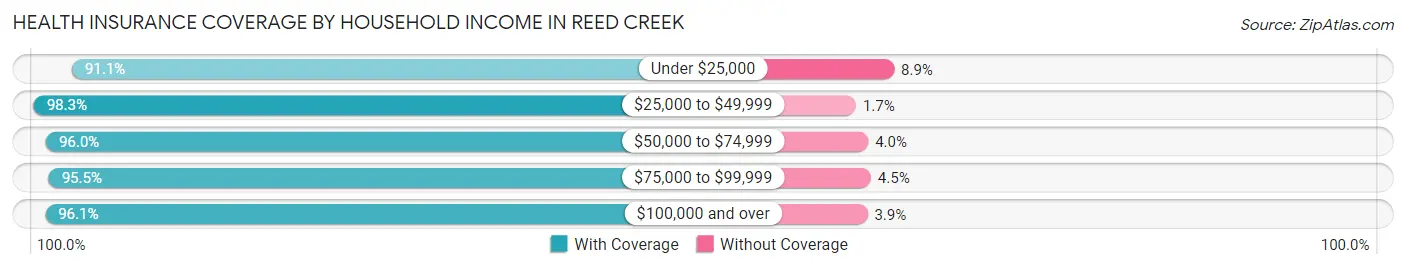
| Household Income | With Coverage | Without Coverage |
| Under $25,000 | 421 (91.1%) | 41 (8.9%) |
| $25,000 to $49,999 | 399 (98.3%) | 7 (1.7%) |
| $50,000 to $74,999 | 455 (96.0%) | 19 (4.0%) |
| $75,000 to $99,999 | 317 (95.5%) | 15 (4.5%) |
| $100,000 and over | 1,068 (96.1%) | 43 (3.9%) |
Public vs Private Health Insurance Coverage by Age in Reed Creek
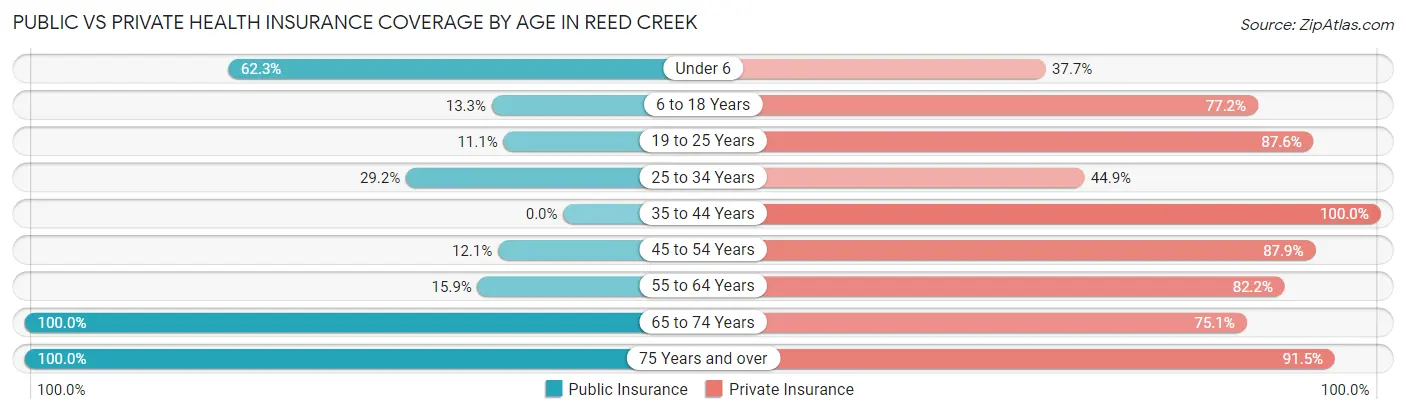
| Age Bracket | Public Insurance | Private Insurance |
| Under 6 | 33 (62.3%) | 20 (37.7%) |
| 6 to 18 Years | 21 (13.3%) | 122 (77.2%) |
| 19 to 25 Years | 17 (11.1%) | 134 (87.6%) |
| 25 to 34 Years | 52 (29.2%) | 80 (44.9%) |
| 35 to 44 Years | 0 (0.0%) | 143 (100.0%) |
| 45 to 54 Years | 41 (12.1%) | 297 (87.9%) |
| 55 to 64 Years | 102 (15.9%) | 527 (82.2%) |
| 65 to 74 Years | 555 (100.0%) | 417 (75.1%) |
| 75 Years and over | 566 (100.0%) | 518 (91.5%) |
| Total | 1,387 (49.8%) | 2,258 (81.1%) |
Disability Status by Sex by Age in Reed Creek
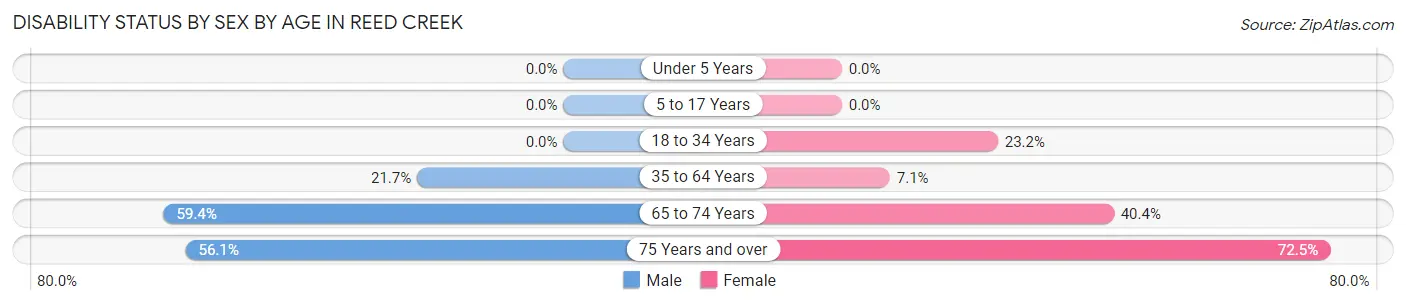
| Age Bracket | Male | Female |
| Under 5 Years | 0 (0.0%) | 0 (0.0%) |
| 5 to 17 Years | 0 (0.0%) | 0 (0.0%) |
| 18 to 34 Years | 0 (0.0%) | 41 (23.2%) |
| 35 to 64 Years | 116 (21.7%) | 42 (7.1%) |
| 65 to 74 Years | 206 (59.4%) | 84 (40.4%) |
| 75 Years and over | 138 (56.1%) | 232 (72.5%) |
Disability Class by Sex by Age in Reed Creek
Disability Class: Hearing Difficulty
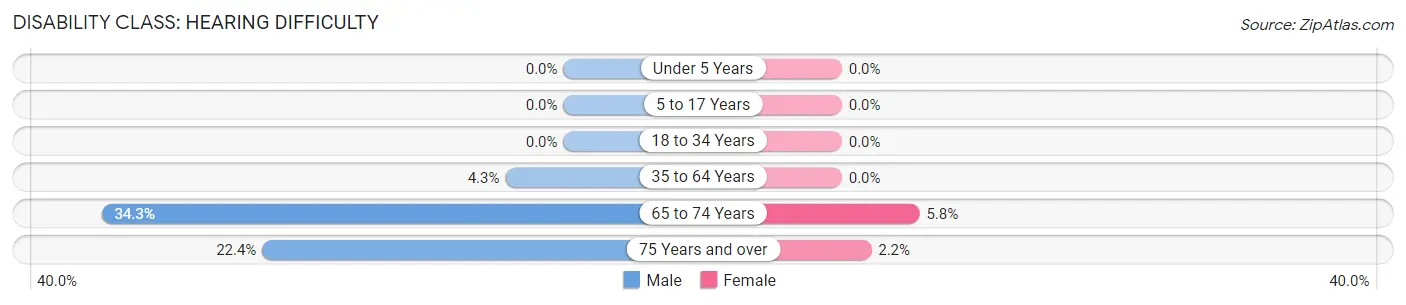
| Age Bracket | Male | Female |
| Under 5 Years | 0 (0.0%) | 0 (0.0%) |
| 5 to 17 Years | 0 (0.0%) | 0 (0.0%) |
| 18 to 34 Years | 0 (0.0%) | 0 (0.0%) |
| 35 to 64 Years | 23 (4.3%) | 0 (0.0%) |
| 65 to 74 Years | 119 (34.3%) | 12 (5.8%) |
| 75 Years and over | 55 (22.4%) | 7 (2.2%) |
Disability Class: Vision Difficulty
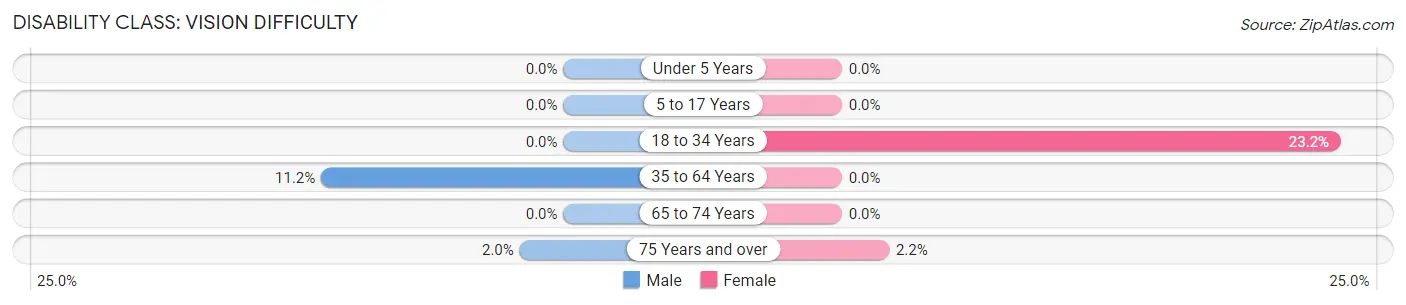
| Age Bracket | Male | Female |
| Under 5 Years | 0 (0.0%) | 0 (0.0%) |
| 5 to 17 Years | 0 (0.0%) | 0 (0.0%) |
| 18 to 34 Years | 0 (0.0%) | 41 (23.2%) |
| 35 to 64 Years | 60 (11.2%) | 0 (0.0%) |
| 65 to 74 Years | 0 (0.0%) | 0 (0.0%) |
| 75 Years and over | 5 (2.0%) | 7 (2.2%) |
Disability Class: Cognitive Difficulty
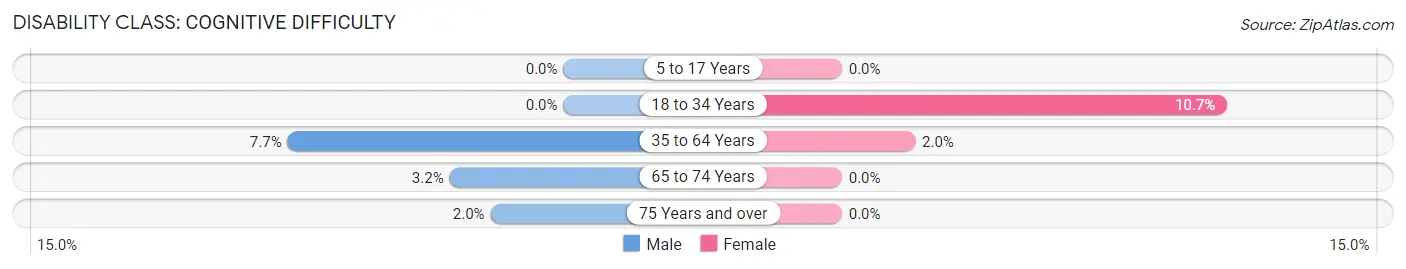
| Age Bracket | Male | Female |
| 5 to 17 Years | 0 (0.0%) | 0 (0.0%) |
| 18 to 34 Years | 0 (0.0%) | 19 (10.7%) |
| 35 to 64 Years | 41 (7.7%) | 12 (2.0%) |
| 65 to 74 Years | 11 (3.2%) | 0 (0.0%) |
| 75 Years and over | 5 (2.0%) | 0 (0.0%) |
Disability Class: Ambulatory Difficulty
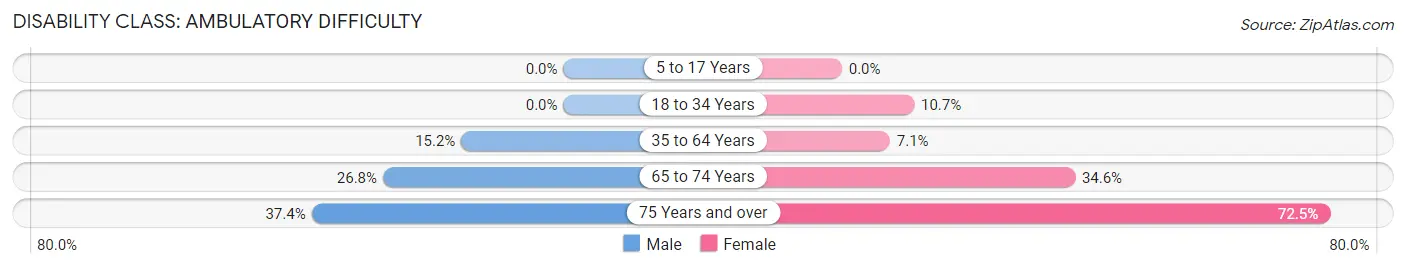
| Age Bracket | Male | Female |
| 5 to 17 Years | 0 (0.0%) | 0 (0.0%) |
| 18 to 34 Years | 0 (0.0%) | 19 (10.7%) |
| 35 to 64 Years | 81 (15.2%) | 42 (7.1%) |
| 65 to 74 Years | 93 (26.8%) | 72 (34.6%) |
| 75 Years and over | 92 (37.4%) | 232 (72.5%) |
Disability Class: Self-Care Difficulty
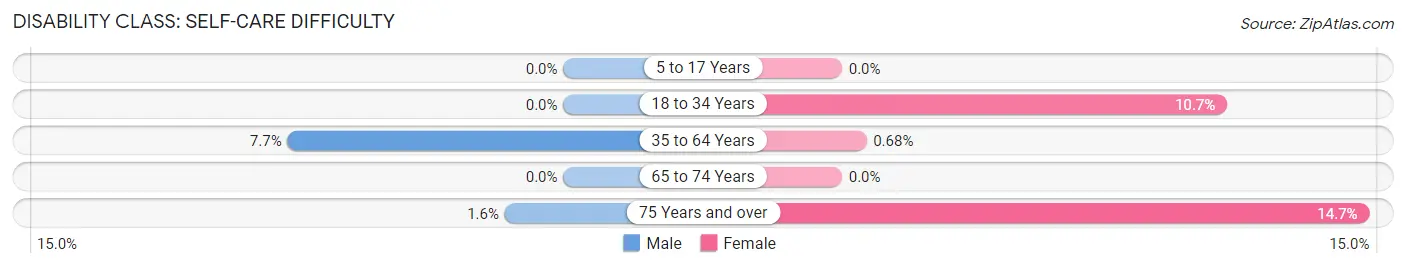
| Age Bracket | Male | Female |
| 5 to 17 Years | 0 (0.0%) | 0 (0.0%) |
| 18 to 34 Years | 0 (0.0%) | 19 (10.7%) |
| 35 to 64 Years | 41 (7.7%) | 4 (0.7%) |
| 65 to 74 Years | 0 (0.0%) | 0 (0.0%) |
| 75 Years and over | 4 (1.6%) | 47 (14.7%) |
Technology Access in Reed Creek
Computing Device Access in Reed Creek
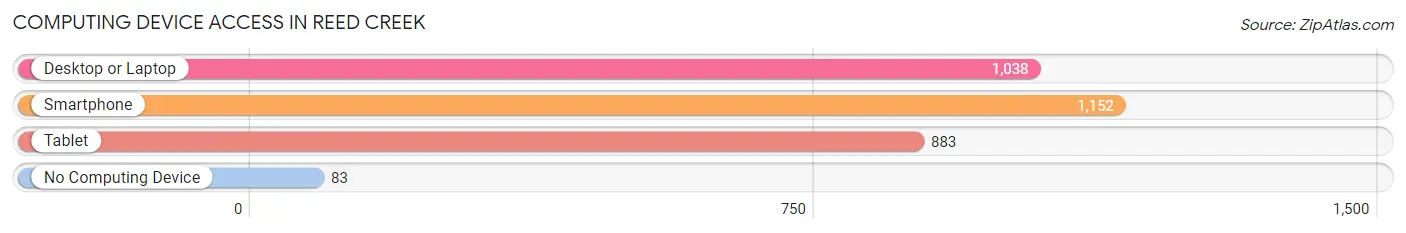
| Device Type | # Households | % Households |
| Desktop or Laptop | 1,038 | 75.4% |
| Smartphone | 1,152 | 83.7% |
| Tablet | 883 | 64.2% |
| No Computing Device | 83 | 6.0% |
| Total | 1,376 | 100.0% |
Internet Access in Reed Creek
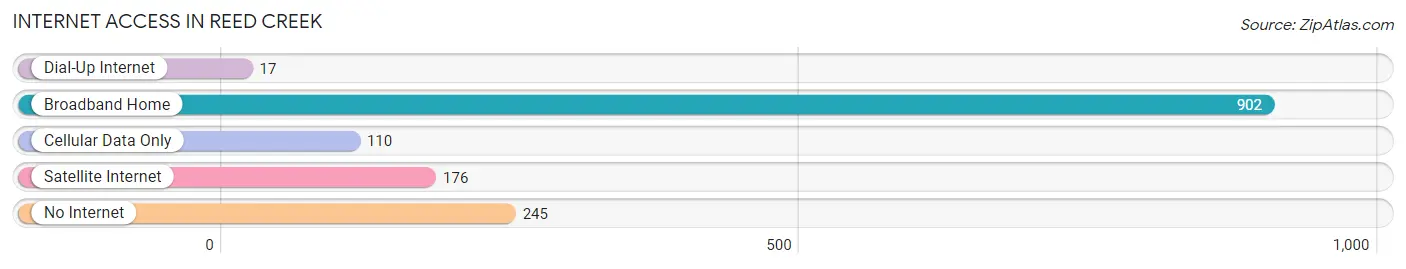
| Internet Type | # Households | % Households |
| Dial-Up Internet | 17 | 1.2% |
| Broadband Home | 902 | 65.5% |
| Cellular Data Only | 110 | 8.0% |
| Satellite Internet | 176 | 12.8% |
| No Internet | 245 | 17.8% |
| Total | 1,376 | 100.0% |
Reed Creek Summary
Reed Creek is a small unincorporated community located in the northeastern corner of Georgia, in the United States. It is situated in the foothills of the Appalachian Mountains, in the Chattahoochee National Forest. The community is located in Habersham County, and is part of the Gainesville, Georgia Metropolitan Statistical Area.
History
Reed Creek was first settled in the early 1800s by a group of settlers from North Carolina. The settlers were attracted to the area due to its abundance of natural resources, including timber, water, and fertile soil. The community was named after a nearby creek, which was named after a local settler, John Reed.
The community grew slowly over the years, and by the late 1800s, it had become a thriving agricultural community. The main crops grown in the area were corn, cotton, and tobacco. The community also had a few small businesses, including a general store, a blacksmith shop, and a sawmill.
In the early 1900s, the community began to decline as many of the residents moved away in search of better economic opportunities. By the mid-1900s, the population had dwindled to just a few dozen people.
Geography
Reed Creek is located in the northeastern corner of Georgia, in the foothills of the Appalachian Mountains. The community is situated in Habersham County, and is part of the Gainesville, Georgia Metropolitan Statistical Area.
The community is located at an elevation of 1,400 feet above sea level. The climate in the area is mild, with temperatures ranging from the mid-50s in the winter to the mid-80s in the summer.
The area around Reed Creek is mostly forested, with a mix of hardwood and pine trees. The nearby Chattahoochee National Forest provides a variety of recreational activities, including camping, hiking, fishing, and hunting.
Economy
The economy of Reed Creek is largely based on agriculture. The main crops grown in the area are corn, cotton, and tobacco. The community also has a few small businesses, including a general store, a blacksmith shop, and a sawmill.
The community is also home to a few small manufacturing companies, which produce a variety of products, including furniture, clothing, and textiles.
Demographics
As of the 2010 census, the population of Reed Creek was estimated to be around 200 people. The racial makeup of the community was 97.5% White, 0.5% African American, 0.5% Native American, and 1.5% from other races.
The median household income in Reed Creek was estimated to be around $30,000, and the median home value was estimated to be around $90,000. The unemployment rate in the community was estimated to be around 8.5%.
Conclusion
Reed Creek is a small unincorporated community located in the northeastern corner of Georgia, in the United States. It is situated in the foothills of the Appalachian Mountains, in the Chattahoochee National Forest. The community is largely agricultural, with a few small businesses and manufacturing companies. The population of Reed Creek is estimated to be around 200 people, with a median household income of around $30,000 and a median home value of around $90,000.
Common Questions
What is the Total Population of Reed Creek?
Total Population of Reed Creek is 2,803.
What is the Total Male Population of Reed Creek?
Total Male Population of Reed Creek is 1,393.
What is the Total Female Population of Reed Creek?
Total Female Population of Reed Creek is 1,410.
What is the Ratio of Males per 100 Females in Reed Creek?
There are 98.79 Males per 100 Females in Reed Creek.
What is the Ratio of Females per 100 Males in Reed Creek?
There are 101.22 Females per 100 Males in Reed Creek.
What is the Median Population Age in Reed Creek?
Median Population Age in Reed Creek is 60.1 Years.
What is the Average Family Size in Reed Creek
Average Family Size in Reed Creek is 2.5 People.
What is the Average Household Size in Reed Creek
Average Household Size in Reed Creek is 2.0 People.
What is Per Capita Income in Reed Creek?
Per Capita income in Reed Creek is $43,373.
What is the Median Family Income in Reed Creek?
Median Family Income in Reed Creek is $96,983.
What is the Median Household income in Reed Creek?
Median Household Income in Reed Creek is $68,765.
What is Income or Wage Gap in Reed Creek?
Income or Wage Gap in Reed Creek is 33.7%.
Women in Reed Creek earn 66.3 cents for every dollar earned by a man.
What is Inequality or Gini Index in Reed Creek?
Inequality or Gini Index in Reed Creek is 0.47.
How Large is the Labor Force in Reed Creek?
There are 1,112 People in the Labor Forcein in Reed Creek.
What is the Percentage of People in the Labor Force in Reed Creek?
41.6% of People are in the Labor Force in Reed Creek.
What is the Unemployment Rate in Reed Creek?
Unemployment Rate in Reed Creek is 5.3%.