Parrott, GA
Parrott Map
Parrott Overview
102
TOTAL POPULATION
58
MALE POPULATION
44
FEMALE POPULATION
131.82
MALES / 100 FEMALES
75.86
FEMALES / 100 MALES
63.0
MEDIAN AGE
2.8
AVG FAMILY SIZE
2.3
AVG HOUSEHOLD SIZE
$38,085
PER CAPITA INCOME
$108,750
AVG FAMILY INCOME
$70,000
AVG HOUSEHOLD INCOME
0.38
INEQUALITY / GINI INDEX
47
LABOR FORCE [ PEOPLE ]
49.0%
PERCENT IN LABOR FORCE
6.4%
UNEMPLOYMENT RATE
Parrott Zip Codes
Parrott Area Codes
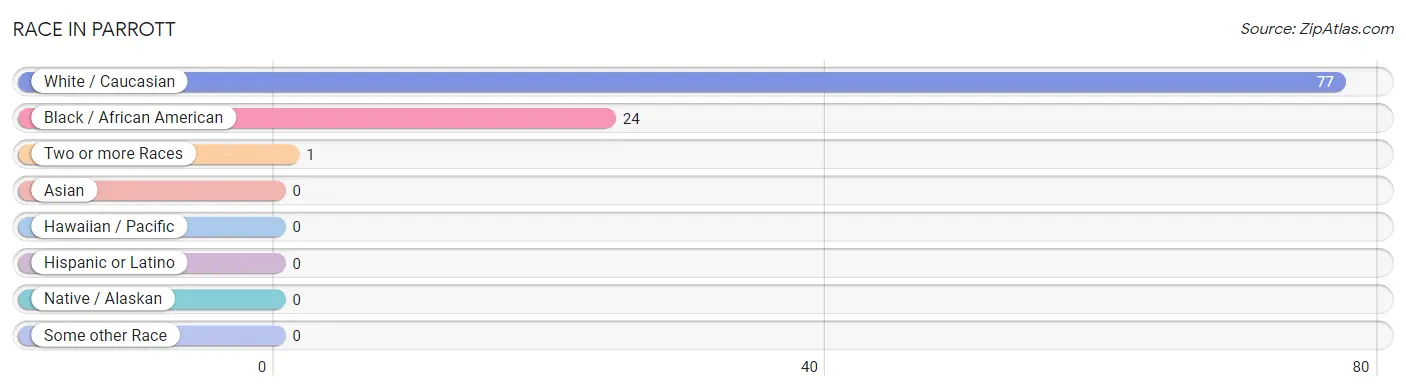
Race in Parrott
The most populous races in Parrott are White / Caucasian (77 | 75.5%), Black / African American (24 | 23.5%), and Two or more Races (1 | 1.0%).
| Race | # Population | % Population |
| Asian | 0 | 0.0% |
| Black / African American | 24 | 23.5% |
| Hawaiian / Pacific | 0 | 0.0% |
| Hispanic or Latino | 0 | 0.0% |
| Native / Alaskan | 0 | 0.0% |
| White / Caucasian | 77 | 75.5% |
| Two or more Races | 1 | 1.0% |
| Some other Race | 0 | 0.0% |
| Total | 102 | 100.0% |
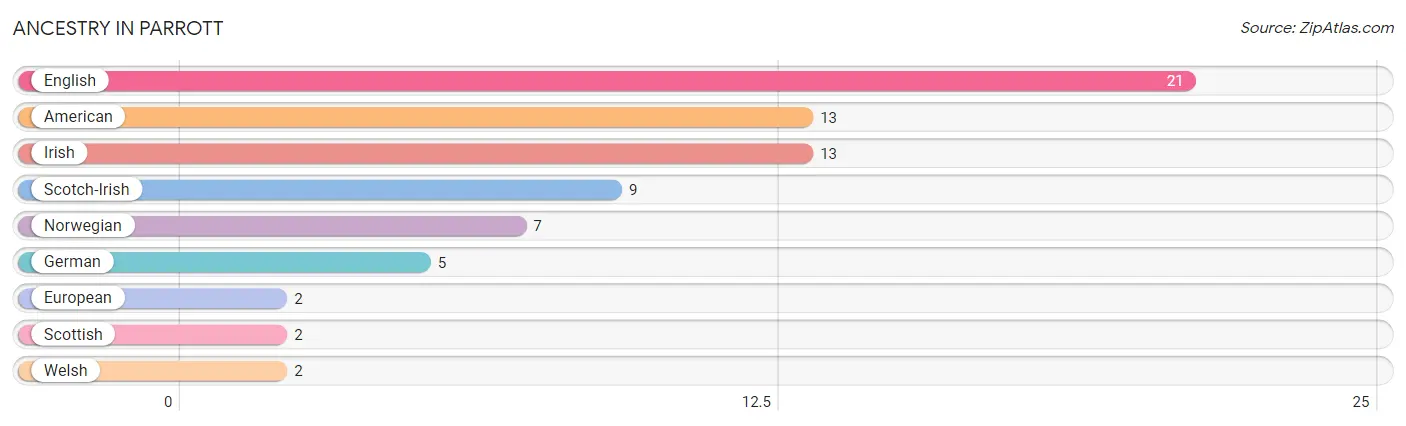
Ancestry in Parrott
The most populous ancestries reported in Parrott are English (21 | 20.6%), American (13 | 12.8%), Irish (13 | 12.8%), Scotch-Irish (9 | 8.8%), and Norwegian (7 | 6.9%), together accounting for 61.8% of all Parrott residents.
| Ancestry | # Population | % Population |
| American | 13 | 12.8% |
| English | 21 | 20.6% |
| European | 2 | 2.0% |
| German | 5 | 4.9% |
| Irish | 13 | 12.8% |
| Norwegian | 7 | 6.9% |
| Scotch-Irish | 9 | 8.8% |
| Scottish | 2 | 2.0% |
| Welsh | 2 | 2.0% | View All 9 Rows |
Immigrants in Parrott

| Immigration Origin | # Population | % Population | View All 0 Rows |
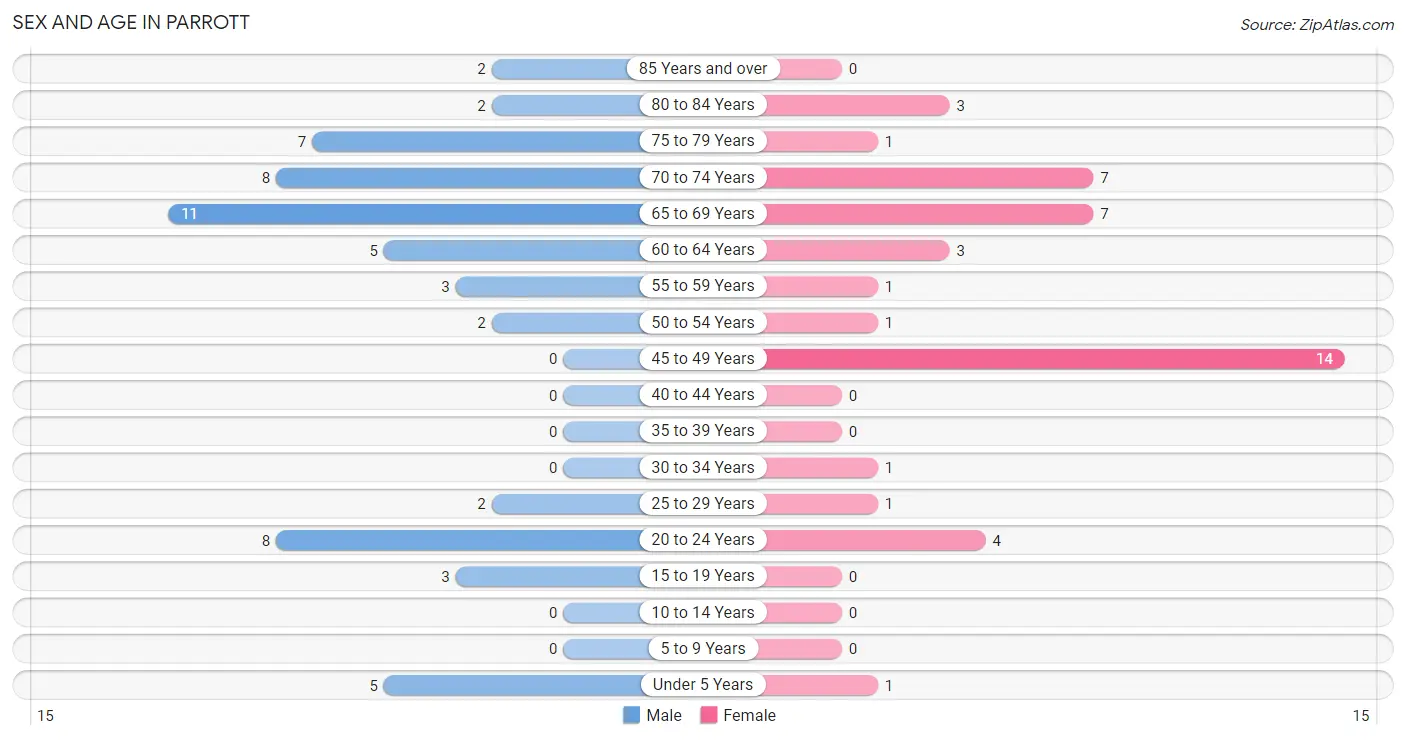
Sex and Age in Parrott
Sex and Age in Parrott
The most populous age groups in Parrott are 65 to 69 Years (11 | 19.0%) for men and 45 to 49 Years (14 | 31.8%) for women.
| Age Bracket | Male | Female |
| Under 5 Years | 5 (8.6%) | 1 (2.3%) |
| 5 to 9 Years | 0 (0.0%) | 0 (0.0%) |
| 10 to 14 Years | 0 (0.0%) | 0 (0.0%) |
| 15 to 19 Years | 3 (5.2%) | 0 (0.0%) |
| 20 to 24 Years | 8 (13.8%) | 4 (9.1%) |
| 25 to 29 Years | 2 (3.5%) | 1 (2.3%) |
| 30 to 34 Years | 0 (0.0%) | 1 (2.3%) |
| 35 to 39 Years | 0 (0.0%) | 0 (0.0%) |
| 40 to 44 Years | 0 (0.0%) | 0 (0.0%) |
| 45 to 49 Years | 0 (0.0%) | 14 (31.8%) |
| 50 to 54 Years | 2 (3.5%) | 1 (2.3%) |
| 55 to 59 Years | 3 (5.2%) | 1 (2.3%) |
| 60 to 64 Years | 5 (8.6%) | 3 (6.8%) |
| 65 to 69 Years | 11 (19.0%) | 7 (15.9%) |
| 70 to 74 Years | 8 (13.8%) | 7 (15.9%) |
| 75 to 79 Years | 7 (12.1%) | 1 (2.3%) |
| 80 to 84 Years | 2 (3.5%) | 3 (6.8%) |
| 85 Years and over | 2 (3.5%) | 0 (0.0%) |
| Total | 58 (100.0%) | 44 (100.0%) |
Families and Households in Parrott
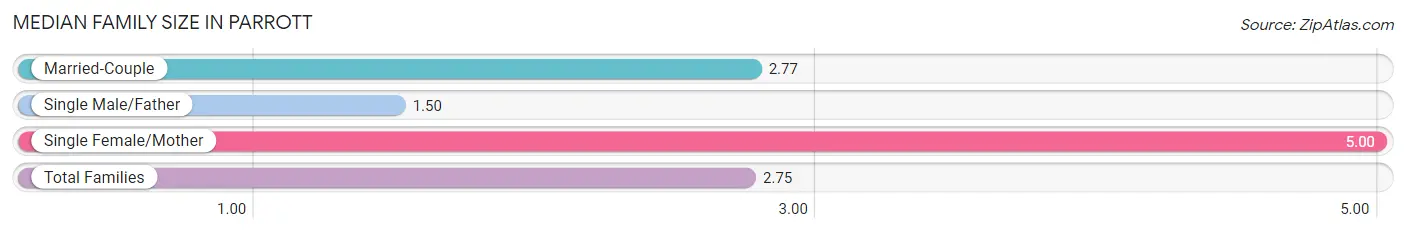
Median Family Size in Parrott
The median family size in Parrott is 2.75 persons per family, with single female/mother families (2 | 6.2%) accounting for the largest median family size of 5 persons per family. On the other hand, single male/father families (4 | 12.5%) represent the smallest median family size with 1.50 persons per family.
| Family Type | # Families | Family Size |
| Married-Couple | 26 (81.2%) | 2.77 |
| Single Male/Father | 4 (12.5%) | 1.50 |
| Single Female/Mother | 2 (6.2%) | 5.00 |
| Total Families | 32 (100.0%) | 2.75 |
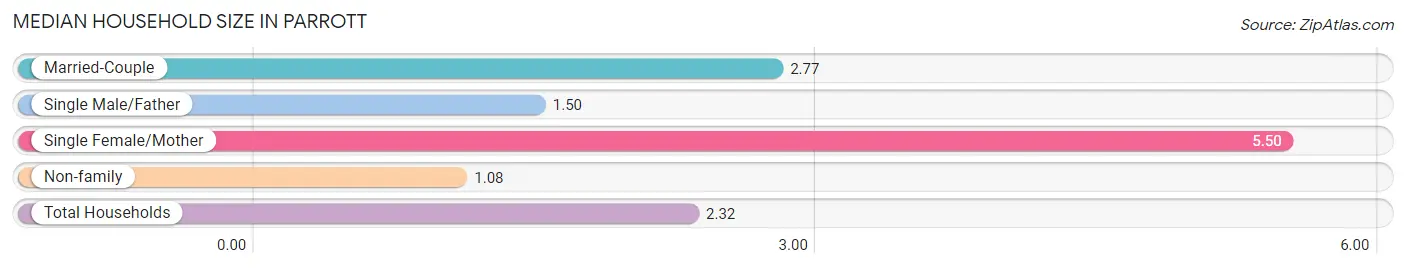
Median Household Size in Parrott
The median household size in Parrott is 2.32 persons per household, with single female/mother households (2 | 4.5%) accounting for the largest median household size of 5.5 persons per household. non-family households (12 | 27.3%) represent the smallest median household size with 1.08 persons per household.
| Household Type | # Households | Household Size |
| Married-Couple | 26 (59.1%) | 2.77 |
| Single Male/Father | 4 (9.1%) | 1.50 |
| Single Female/Mother | 2 (4.5%) | 5.50 |
| Non-family | 12 (27.3%) | 1.08 |
| Total Households | 44 (100.0%) | 2.32 |
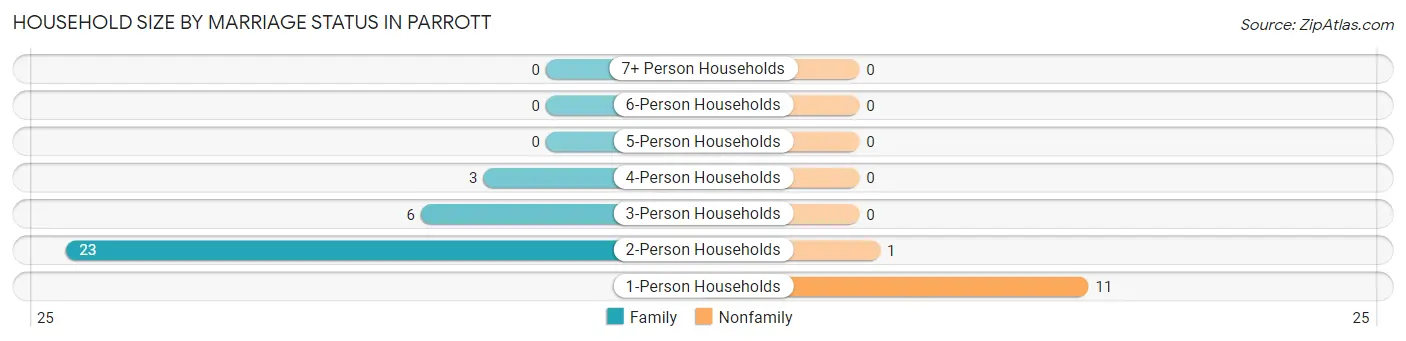
Household Size by Marriage Status in Parrott
Out of a total of 44 households in Parrott, 32 (72.7%) are family households, while 12 (27.3%) are nonfamily households. The most numerous type of family households are 2-person households, comprising 23, and the most common type of nonfamily households are 1-person households, comprising 11.
| Household Size | Family Households | Nonfamily Households |
| 1-Person Households | - | 11 (25.0%) |
| 2-Person Households | 23 (52.3%) | 1 (2.3%) |
| 3-Person Households | 6 (13.6%) | 0 (0.0%) |
| 4-Person Households | 3 (6.8%) | 0 (0.0%) |
| 5-Person Households | 0 (0.0%) | 0 (0.0%) |
| 6-Person Households | 0 (0.0%) | 0 (0.0%) |
| 7+ Person Households | 0 (0.0%) | 0 (0.0%) |
| Total | 32 (72.7%) | 12 (27.3%) |
Female Fertility in Parrott
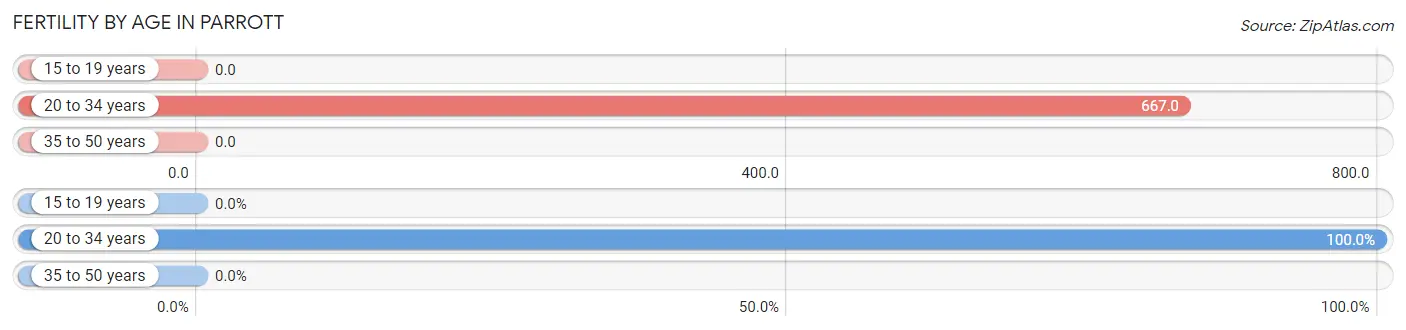
Fertility by Age in Parrott
Average fertility rate in Parrott is 200.0 births per 1,000 women. Women in the age bracket of 20 to 34 years have the highest fertility rate with 667.0 births per 1,000 women. Women in the age bracket of 20 to 34 years acount for 100.0% of all women with births.
| Age Bracket | Women with Births | Births / 1,000 Women |
| 15 to 19 years | 0 (0.0%) | 0.0 |
| 20 to 34 years | 4 (100.0%) | 667.0 |
| 35 to 50 years | 0 (0.0%) | 0.0 |
| Total | 4 (100.0%) | 200.0 |
Fertility by Age by Marriage Status in Parrott
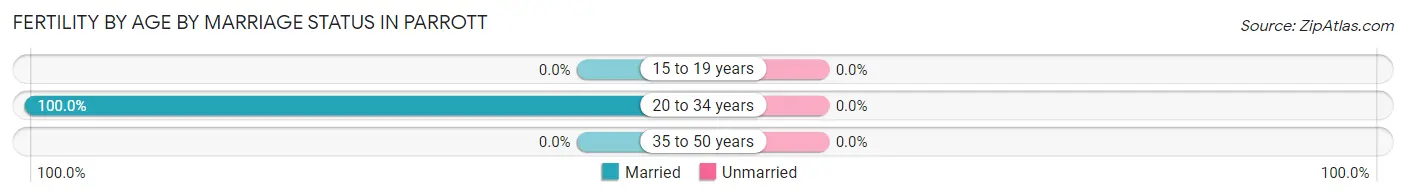
| Age Bracket | Married | Unmarried |
| 15 to 19 years | 0 (0.0%) | 0 (0.0%) |
| 20 to 34 years | 4 (100.0%) | 0 (0.0%) |
| 35 to 50 years | 0 (0.0%) | 0 (0.0%) |
| Total | 4 (100.0%) | 0 (0.0%) |
Fertility by Education in Parrott
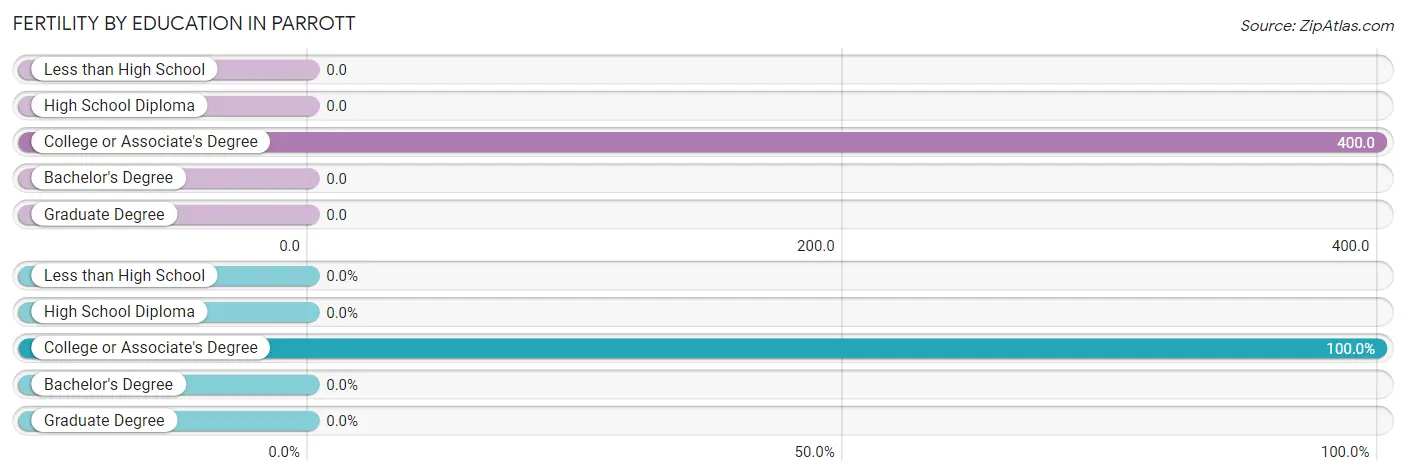
| Educational Attainment | Women with Births | Births / 1,000 Women |
| Less than High School | 0 (0.0%) | 0.0 |
| High School Diploma | 0 (0.0%) | 0.0 |
| College or Associate's Degree | 4 (100.0%) | 400.0 |
| Bachelor's Degree | 0 (0.0%) | 0.0 |
| Graduate Degree | 0 (0.0%) | 0.0 |
| Total | 4 (100.0%) | 200.0 |
Fertility by Education by Marriage Status in Parrott
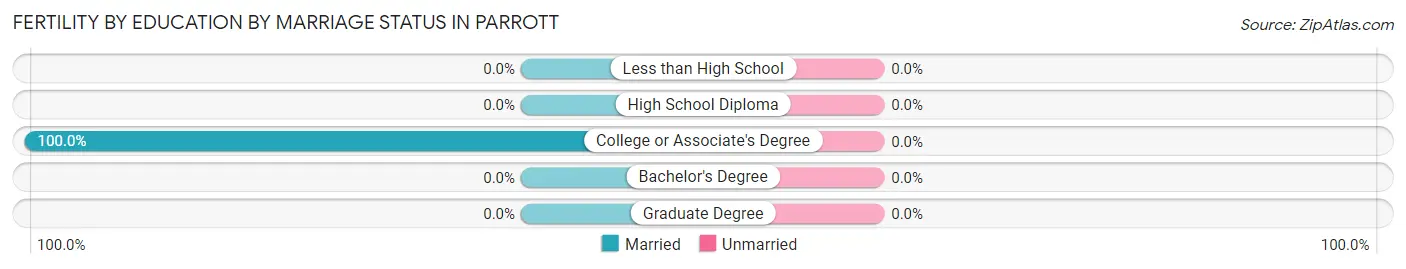
| Educational Attainment | Married | Unmarried |
| Less than High School | 0 (0.0%) | 0 (0.0%) |
| High School Diploma | 0 (0.0%) | 0 (0.0%) |
| College or Associate's Degree | 4 (100.0%) | 0 (0.0%) |
| Bachelor's Degree | 0 (0.0%) | 0 (0.0%) |
| Graduate Degree | 0 (0.0%) | 0 (0.0%) |
| Total | 4 (100.0%) | 0 (0.0%) |
Income in Parrott
Income Overview in Parrott
Per Capita Income in Parrott is $38,085, while median incomes of families and households are $108,750 and $70,000 respectively.
| Characteristic | Number | Measure |
| Per Capita Income | 102 | $38,085 |
| Median Family Income | 32 | $108,750 |
| Mean Family Income | 32 | $105,303 |
| Median Household Income | 44 | $70,000 |
| Mean Household Income | 44 | $85,950 |
| Income Deficit | 32 | $0 |
| Wage / Income Gap (%) | 102 | 0.00% |
| Wage / Income Gap ($) | 102 | 100.00¢ per $1 |
| Gini / Inequality Index | 102 | 0.38 |
Earnings by Sex in Parrott
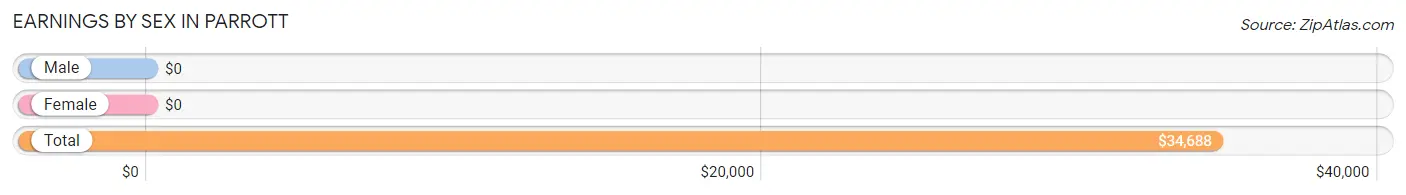
| Sex | Number | Average Earnings |
| Male | 29 (54.7%) | $0 |
| Female | 24 (45.3%) | $0 |
| Total | 53 (100.0%) | $34,688 |
Earnings by Sex by Income Bracket in Parrott
The most common earnings brackets in Parrott are $35,000 to $39,999 for men (10 | 34.5%) and $2,500 to $4,999 for women (11 | 45.8%).
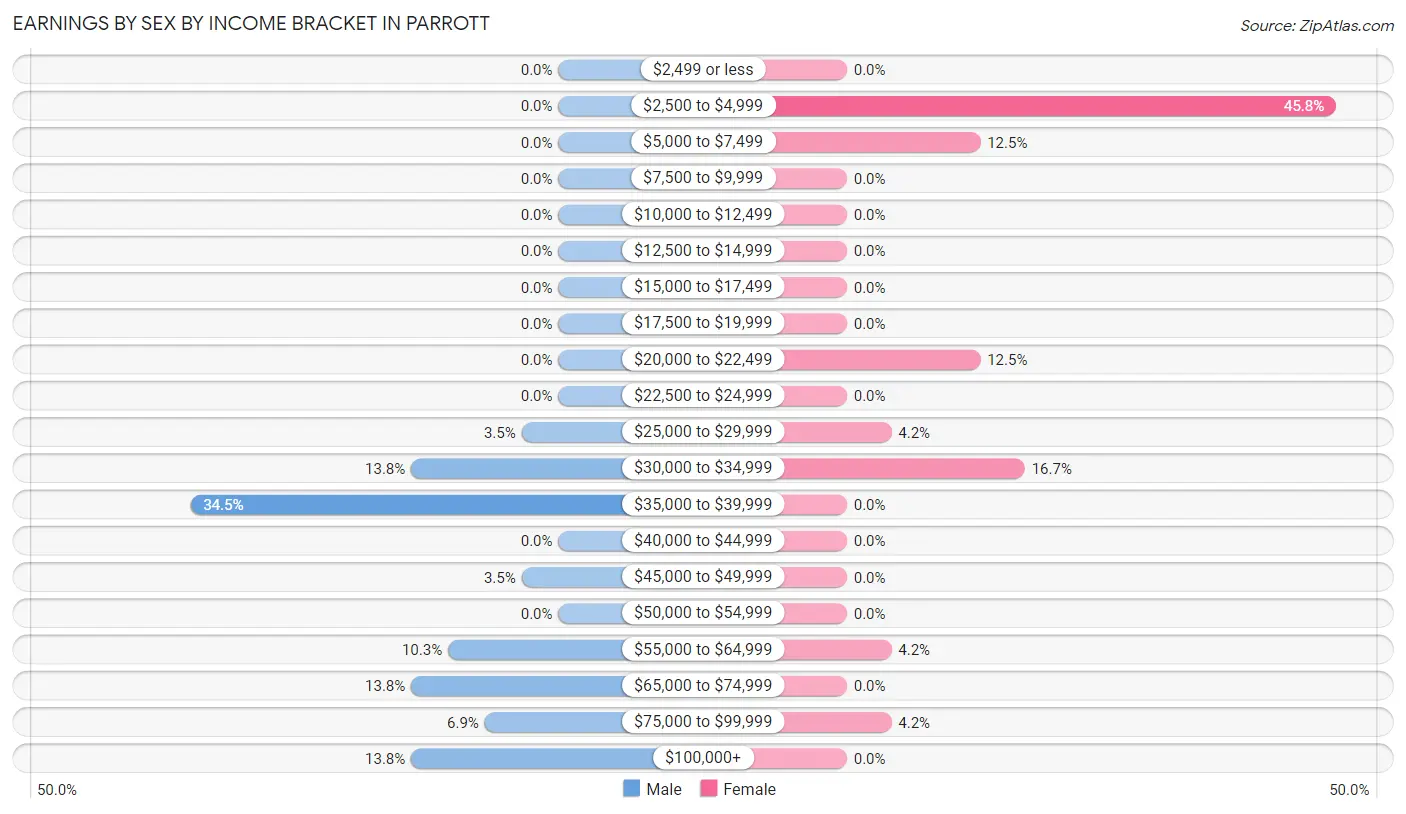
| Income | Male | Female |
| $2,499 or less | 0 (0.0%) | 0 (0.0%) |
| $2,500 to $4,999 | 0 (0.0%) | 11 (45.8%) |
| $5,000 to $7,499 | 0 (0.0%) | 3 (12.5%) |
| $7,500 to $9,999 | 0 (0.0%) | 0 (0.0%) |
| $10,000 to $12,499 | 0 (0.0%) | 0 (0.0%) |
| $12,500 to $14,999 | 0 (0.0%) | 0 (0.0%) |
| $15,000 to $17,499 | 0 (0.0%) | 0 (0.0%) |
| $17,500 to $19,999 | 0 (0.0%) | 0 (0.0%) |
| $20,000 to $22,499 | 0 (0.0%) | 3 (12.5%) |
| $22,500 to $24,999 | 0 (0.0%) | 0 (0.0%) |
| $25,000 to $29,999 | 1 (3.5%) | 1 (4.2%) |
| $30,000 to $34,999 | 4 (13.8%) | 4 (16.7%) |
| $35,000 to $39,999 | 10 (34.5%) | 0 (0.0%) |
| $40,000 to $44,999 | 0 (0.0%) | 0 (0.0%) |
| $45,000 to $49,999 | 1 (3.5%) | 0 (0.0%) |
| $50,000 to $54,999 | 0 (0.0%) | 0 (0.0%) |
| $55,000 to $64,999 | 3 (10.3%) | 1 (4.2%) |
| $65,000 to $74,999 | 4 (13.8%) | 0 (0.0%) |
| $75,000 to $99,999 | 2 (6.9%) | 1 (4.2%) |
| $100,000+ | 4 (13.8%) | 0 (0.0%) |
| Total | 29 (100.0%) | 24 (100.0%) |
Earnings by Sex by Educational Attainment in Parrott
| Educational Attainment | Male Income | Female Income |
| Less than High School | - | - |
| High School Diploma | - | - |
| College or Associate's Degree | - | - |
| Bachelor's Degree | - | - |
| Graduate Degree | - | - |
| Total | $60,833 | $0 |
Family Income in Parrott
Family Income Brackets in Parrott
According to the Parrott family income data, there are 11 families falling into the $100,000 to $149,999 income range, which is the most common income bracket and makes up 34.4% of all families.
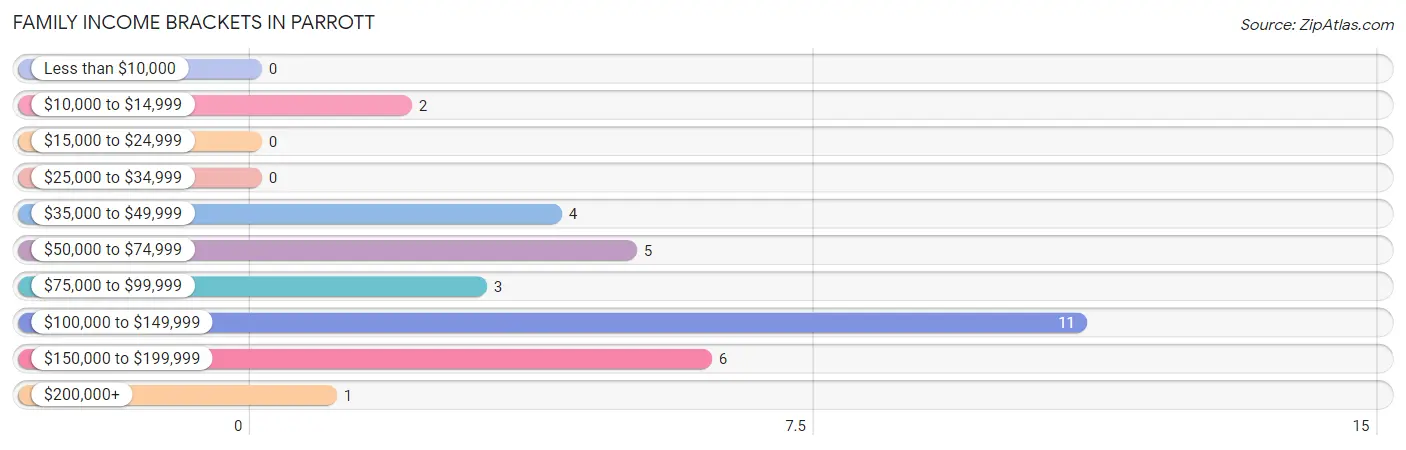
| Income Bracket | # Families | % Families |
| Less than $10,000 | 0 | 0.0% |
| $10,000 to $14,999 | 2 | 6.3% |
| $15,000 to $24,999 | 0 | 0.0% |
| $25,000 to $34,999 | 0 | 0.0% |
| $35,000 to $49,999 | 4 | 12.5% |
| $50,000 to $74,999 | 5 | 15.6% |
| $75,000 to $99,999 | 3 | 9.4% |
| $100,000 to $149,999 | 11 | 34.4% |
| $150,000 to $199,999 | 6 | 18.8% |
| $200,000+ | 1 | 3.1% |
Family Income by Famaliy Size in Parrott
2-person families (23 | 71.9%) account for the highest median family income in Parrott with $113,250 per family, while 2-person families (23 | 71.9%) have the highest median income of $56,625 per family member.
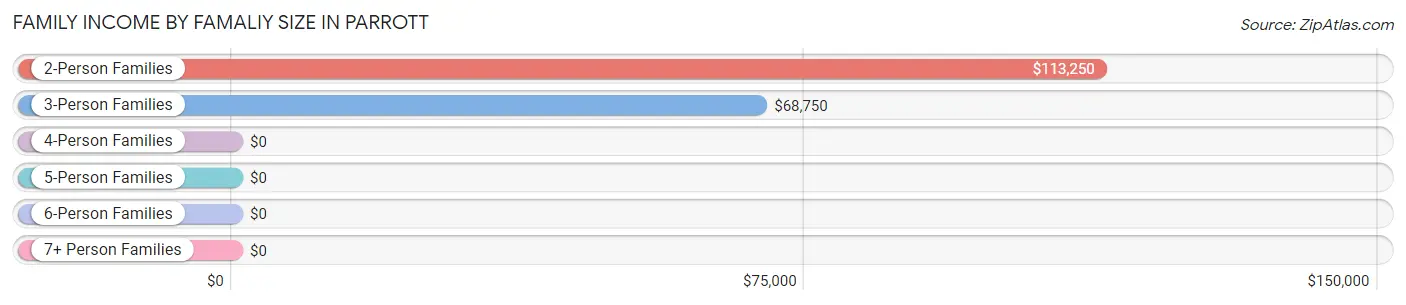
| Income Bracket | # Families | Median Income |
| 2-Person Families | 23 (71.9%) | $113,250 |
| 3-Person Families | 7 (21.9%) | $68,750 |
| 4-Person Families | 2 (6.2%) | $0 |
| 5-Person Families | 0 (0.0%) | $0 |
| 6-Person Families | 0 (0.0%) | $0 |
| 7+ Person Families | 0 (0.0%) | $0 |
| Total | 32 (100.0%) | $108,750 |
Family Income by Number of Earners in Parrott
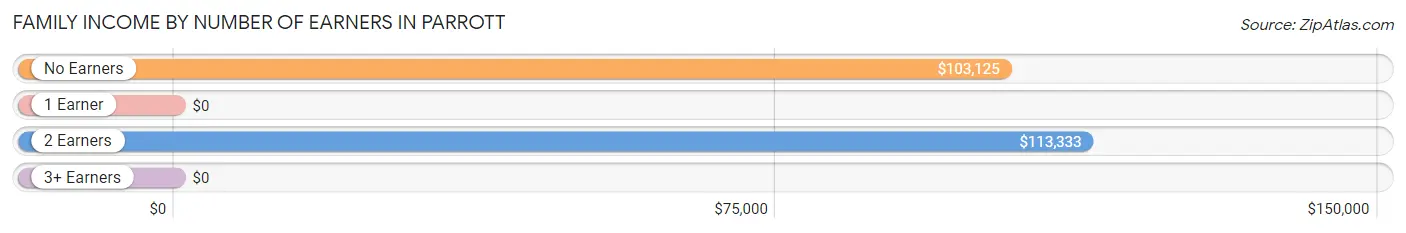
| Number of Earners | # Families | Median Income |
| No Earners | 9 (28.1%) | $103,125 |
| 1 Earner | 5 (15.6%) | $0 |
| 2 Earners | 18 (56.2%) | $113,333 |
| 3+ Earners | 0 (0.0%) | $0 |
| Total | 32 (100.0%) | $108,750 |
Household Income in Parrott
Household Income Brackets in Parrott
With 11 households falling in the category, the $100,000 to $149,999 income range is the most frequent in Parrott, accounting for 25.0% of all households.
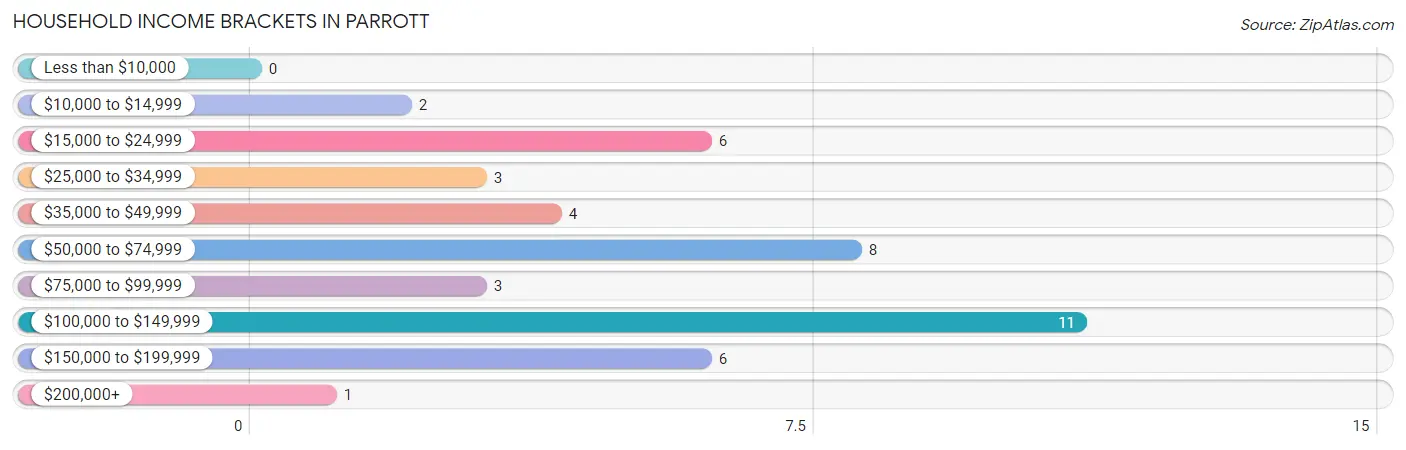
| Income Bracket | # Households | % Households |
| Less than $10,000 | 0 | 0.0% |
| $10,000 to $14,999 | 2 | 4.5% |
| $15,000 to $24,999 | 6 | 13.6% |
| $25,000 to $34,999 | 3 | 6.8% |
| $35,000 to $49,999 | 4 | 9.1% |
| $50,000 to $74,999 | 8 | 18.2% |
| $75,000 to $99,999 | 3 | 6.8% |
| $100,000 to $149,999 | 11 | 25.0% |
| $150,000 to $199,999 | 6 | 13.6% |
| $200,000+ | 1 | 2.3% |
Household Income by Householder Age in Parrott
The median household income in Parrott is $70,000, with the highest median household income of $76,250 found in the 65+ years age bracket for the primary householder. A total of 29 households (65.9%) fall into this category. Meanwhile, the 15 to 24 years age bracket for the primary householder has the lowest median household income of $0, with 4 households (9.1%) in this group.
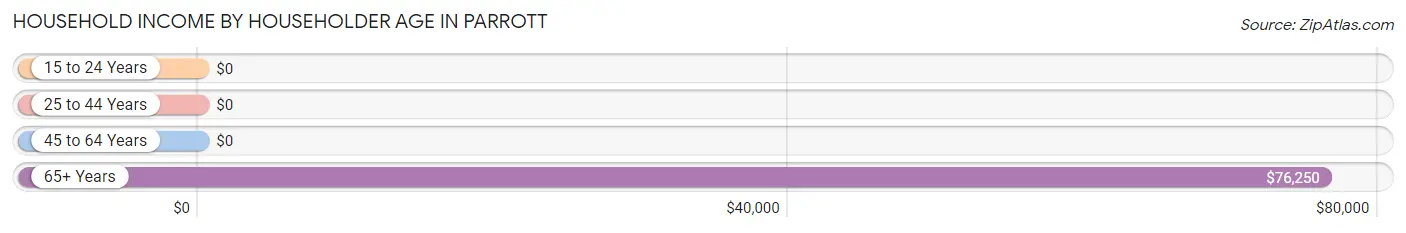
| Income Bracket | # Households | Median Income |
| 15 to 24 Years | 4 (9.1%) | $0 |
| 25 to 44 Years | 1 (2.3%) | $0 |
| 45 to 64 Years | 10 (22.7%) | $0 |
| 65+ Years | 29 (65.9%) | $76,250 |
| Total | 44 (100.0%) | $70,000 |
Poverty in Parrott
Income Below Poverty by Sex and Age in Parrott
With 13.8% poverty level for males and 6.8% for females among the residents of Parrott, 16 and 17 year old males and 55 to 64 year old females are the most vulnerable to poverty, with 3 males (100.0%) and 1 females (25.0%) in their respective age groups living below the poverty level.
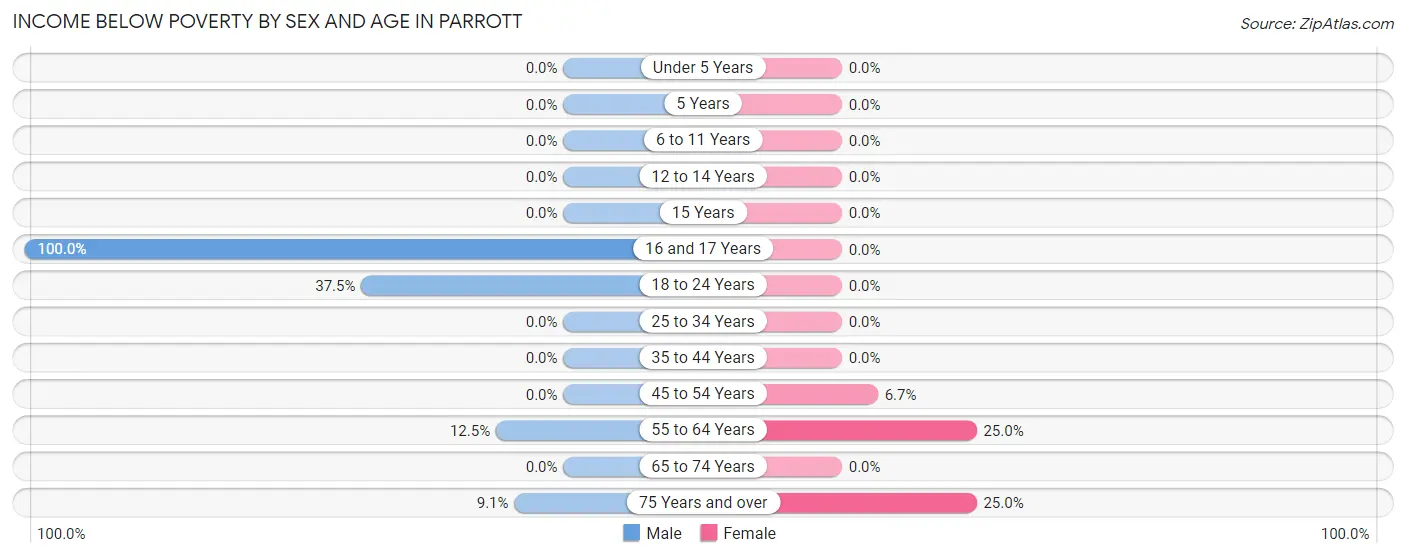
| Age Bracket | Male | Female |
| Under 5 Years | 0 (0.0%) | 0 (0.0%) |
| 5 Years | 0 (0.0%) | 0 (0.0%) |
| 6 to 11 Years | 0 (0.0%) | 0 (0.0%) |
| 12 to 14 Years | 0 (0.0%) | 0 (0.0%) |
| 15 Years | 0 (0.0%) | 0 (0.0%) |
| 16 and 17 Years | 3 (100.0%) | 0 (0.0%) |
| 18 to 24 Years | 3 (37.5%) | 0 (0.0%) |
| 25 to 34 Years | 0 (0.0%) | 0 (0.0%) |
| 35 to 44 Years | 0 (0.0%) | 0 (0.0%) |
| 45 to 54 Years | 0 (0.0%) | 1 (6.7%) |
| 55 to 64 Years | 1 (12.5%) | 1 (25.0%) |
| 65 to 74 Years | 0 (0.0%) | 0 (0.0%) |
| 75 Years and over | 1 (9.1%) | 1 (25.0%) |
| Total | 8 (13.8%) | 3 (6.8%) |
Income Above Poverty by Sex and Age in Parrott
According to the poverty statistics in Parrott, males aged under 5 years and females aged under 5 years are the age groups that are most secure financially, with 100.0% of males and 100.0% of females in these age groups living above the poverty line.
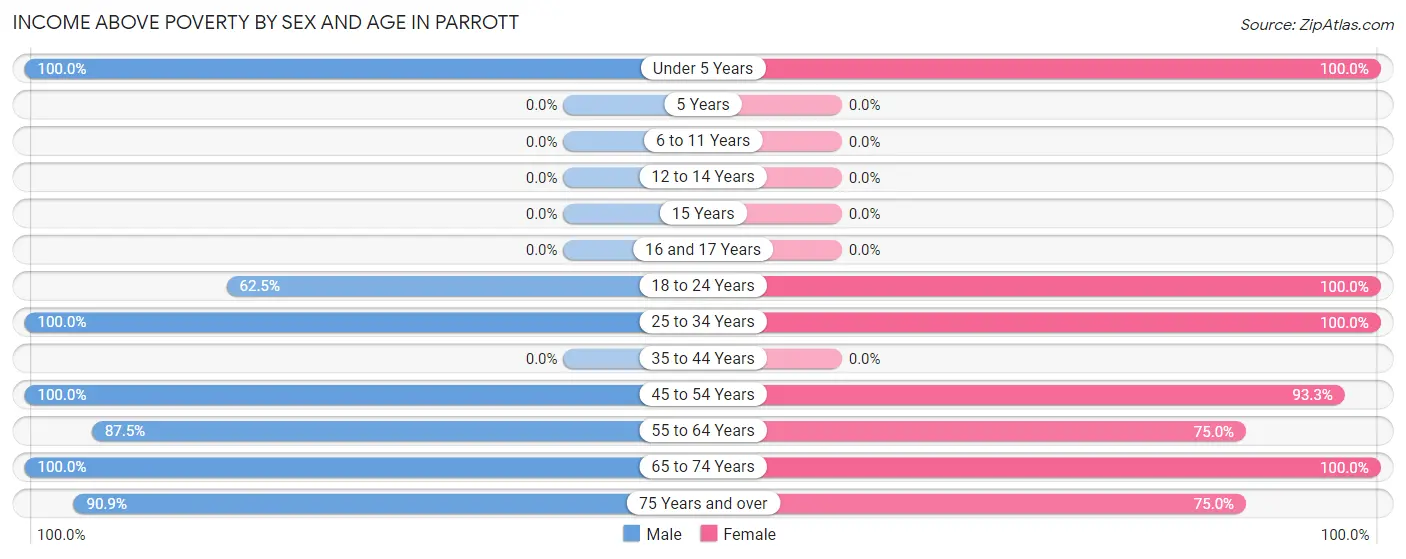
| Age Bracket | Male | Female |
| Under 5 Years | 5 (100.0%) | 1 (100.0%) |
| 5 Years | 0 (0.0%) | 0 (0.0%) |
| 6 to 11 Years | 0 (0.0%) | 0 (0.0%) |
| 12 to 14 Years | 0 (0.0%) | 0 (0.0%) |
| 15 Years | 0 (0.0%) | 0 (0.0%) |
| 16 and 17 Years | 0 (0.0%) | 0 (0.0%) |
| 18 to 24 Years | 5 (62.5%) | 4 (100.0%) |
| 25 to 34 Years | 2 (100.0%) | 2 (100.0%) |
| 35 to 44 Years | 0 (0.0%) | 0 (0.0%) |
| 45 to 54 Years | 2 (100.0%) | 14 (93.3%) |
| 55 to 64 Years | 7 (87.5%) | 3 (75.0%) |
| 65 to 74 Years | 19 (100.0%) | 14 (100.0%) |
| 75 Years and over | 10 (90.9%) | 3 (75.0%) |
| Total | 50 (86.2%) | 41 (93.2%) |
Income Below Poverty Among Married-Couple Families in Parrott
The poverty statistics for married-couple families in Parrott show that 3.8% or 1 of the total 26 families live below the poverty line. Families with no children have the highest poverty rate of 4.8%, comprising of 1 families. On the other hand, families with 1 or 2 children have the lowest poverty rate of 0.0%, which includes 0 families.
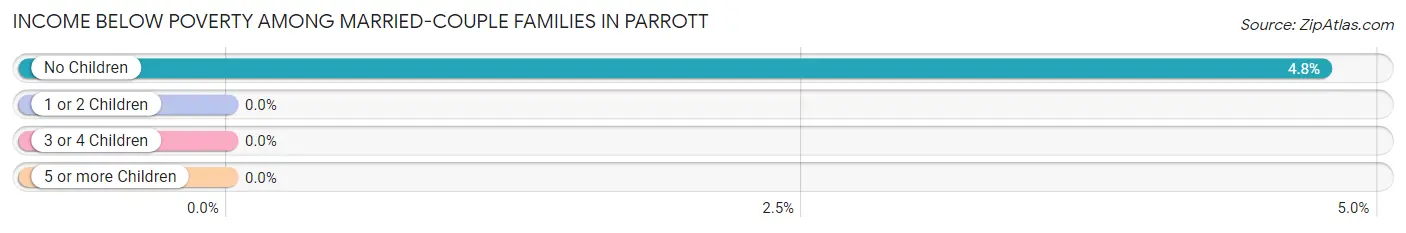
| Children | Above Poverty | Below Poverty |
| No Children | 20 (95.2%) | 1 (4.8%) |
| 1 or 2 Children | 5 (100.0%) | 0 (0.0%) |
| 3 or 4 Children | 0 (0.0%) | 0 (0.0%) |
| 5 or more Children | 0 (0.0%) | 0 (0.0%) |
| Total | 25 (96.2%) | 1 (3.8%) |
Income Below Poverty Among Single-Parent Households in Parrott
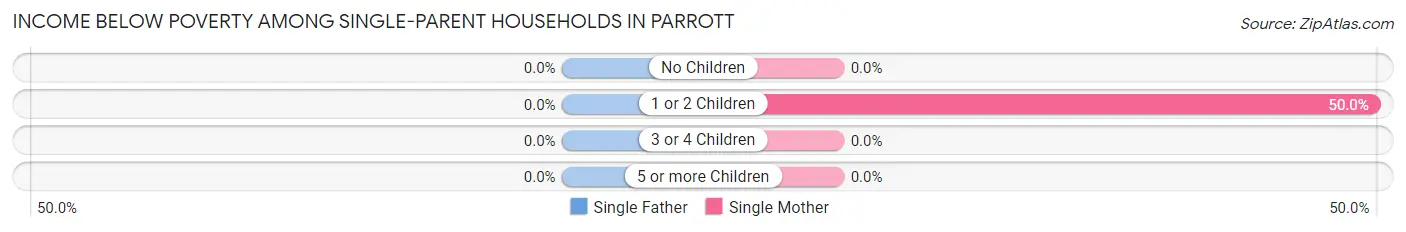
| Children | Single Father | Single Mother |
| No Children | 0 (0.0%) | 0 (0.0%) |
| 1 or 2 Children | 0 (0.0%) | 1 (50.0%) |
| 3 or 4 Children | 0 (0.0%) | 0 (0.0%) |
| 5 or more Children | 0 (0.0%) | 0 (0.0%) |
| Total | 0 (0.0%) | 1 (50.0%) |
Income Below Poverty Among Married-Couple vs Single-Parent Households in Parrott
The poverty data for Parrott shows that 1 of the married-couple family households (3.8%) and 1 of the single-parent households (16.7%) are living below the poverty level. Within the married-couple family households, those with no children have the highest poverty rate, with 1 households (4.8%) falling below the poverty line. Among the single-parent households, those with 1 or 2 children have the highest poverty rate, with 1 household (50.0%) living below poverty.
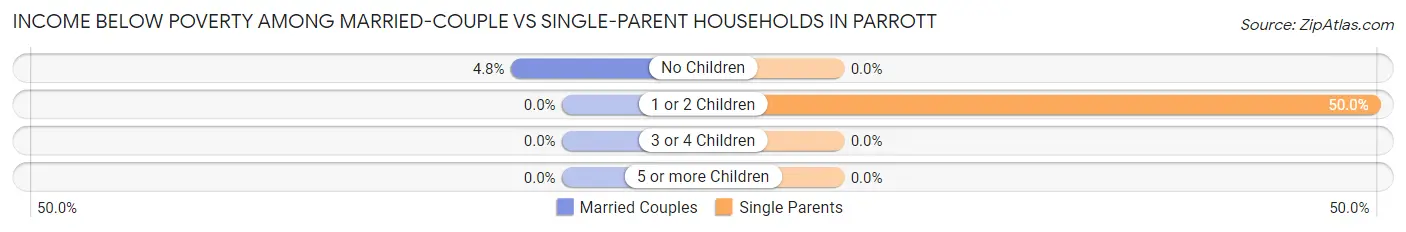
| Children | Married-Couple Families | Single-Parent Households |
| No Children | 1 (4.8%) | 0 (0.0%) |
| 1 or 2 Children | 0 (0.0%) | 1 (50.0%) |
| 3 or 4 Children | 0 (0.0%) | 0 (0.0%) |
| 5 or more Children | 0 (0.0%) | 0 (0.0%) |
| Total | 1 (3.8%) | 1 (16.7%) |
Employment Characteristics in Parrott
Employment by Class of Employer in Parrott
Among the 44 employed individuals in Parrott, private company employees (17 | 38.6%), local government employees (11 | 25.0%), and self-employed (not incorporated) (8 | 18.2%) make up the most common classes of employment.
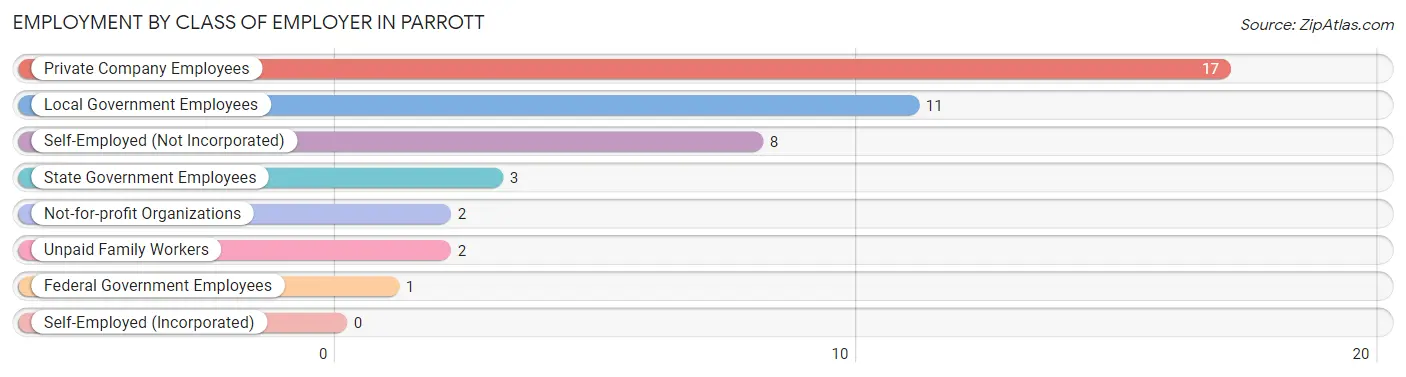
| Employer Class | # Employees | % Employees |
| Private Company Employees | 17 | 38.6% |
| Self-Employed (Incorporated) | 0 | 0.0% |
| Self-Employed (Not Incorporated) | 8 | 18.2% |
| Not-for-profit Organizations | 2 | 4.5% |
| Local Government Employees | 11 | 25.0% |
| State Government Employees | 3 | 6.8% |
| Federal Government Employees | 1 | 2.3% |
| Unpaid Family Workers | 2 | 4.5% |
| Total | 44 | 100.0% |
Employment Status by Age in Parrott
According to the labor force statistics for Parrott, out of the total population over 16 years of age (96), 49.0% or 47 individuals are in the labor force, with 6.4% or 3 of them unemployed. The age group with the highest labor force participation rate is 20 to 24 years, with 100.0% or 12 individuals in the labor force. Within the labor force, the 20 to 24 years age range has the highest percentage of unemployed individuals, with 25.0% or 3 of them being unemployed.
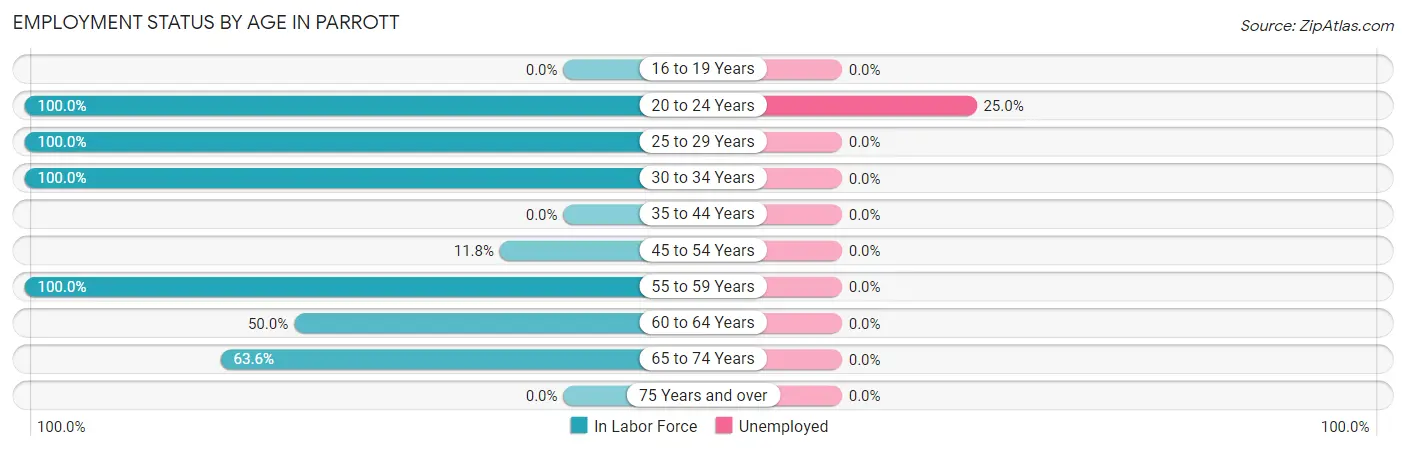
| Age Bracket | In Labor Force | Unemployed |
| 16 to 19 Years | 0 (0.0%) | 0 (0.0%) |
| 20 to 24 Years | 12 (100.0%) | 3 (25.0%) |
| 25 to 29 Years | 3 (100.0%) | 0 (0.0%) |
| 30 to 34 Years | 1 (100.0%) | 0 (0.0%) |
| 35 to 44 Years | 0 (0.0%) | 0 (0.0%) |
| 45 to 54 Years | 2 (11.8%) | 0 (0.0%) |
| 55 to 59 Years | 4 (100.0%) | 0 (0.0%) |
| 60 to 64 Years | 4 (50.0%) | 0 (0.0%) |
| 65 to 74 Years | 21 (63.6%) | 0 (0.0%) |
| 75 Years and over | 0 (0.0%) | 0 (0.0%) |
| Total | 47 (49.0%) | 3 (6.4%) |
Employment Status by Educational Attainment in Parrott
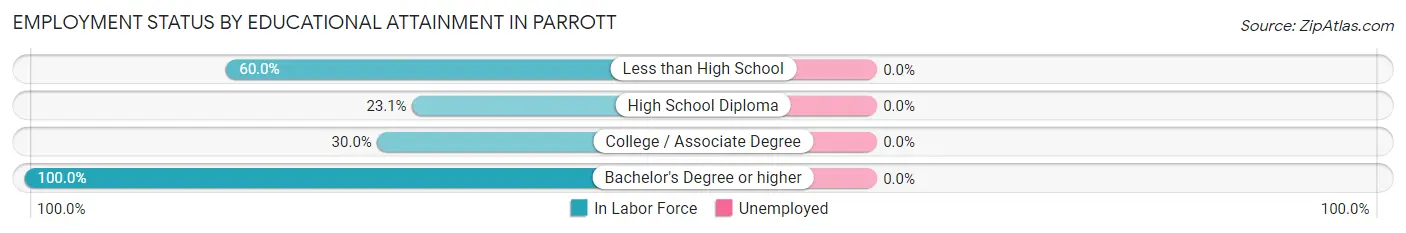
| Educational Attainment | In Labor Force | Unemployed |
| Less than High School | 3 (60.0%) | 0 (0.0%) |
| High School Diploma | 3 (23.1%) | 0 (0.0%) |
| College / Associate Degree | 3 (30.0%) | 0 (0.0%) |
| Bachelor's Degree or higher | 5 (100.0%) | 0 (0.0%) |
| Total | 14 (42.4%) | 0 (0.0%) |
Employment Occupations by Sex in Parrott
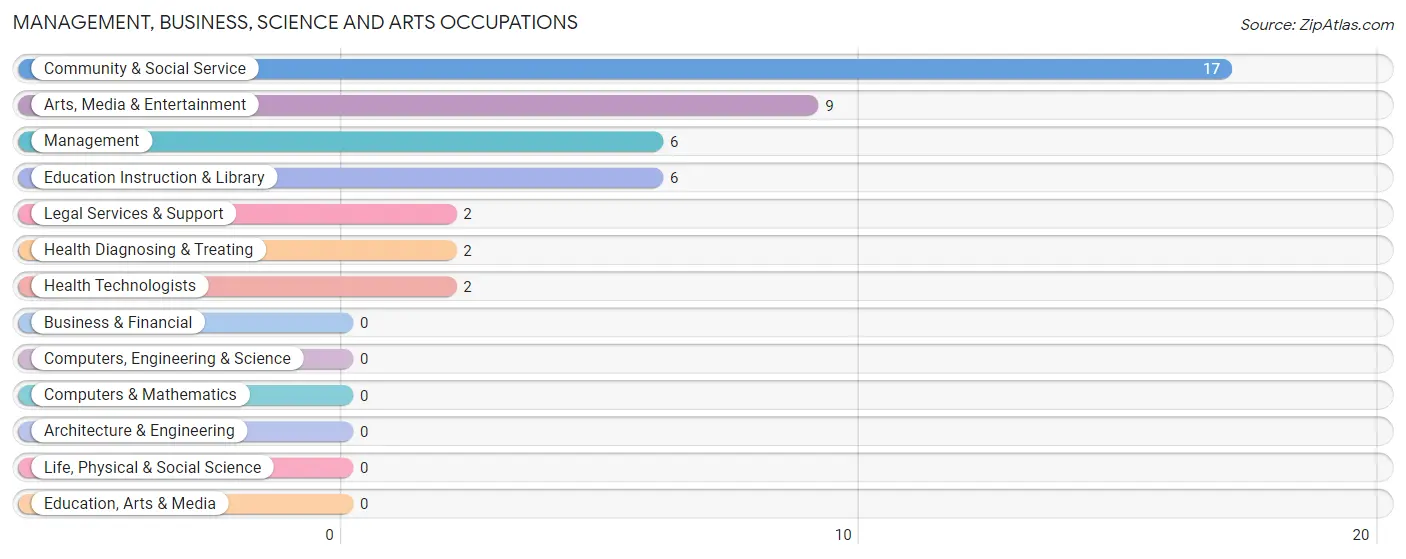
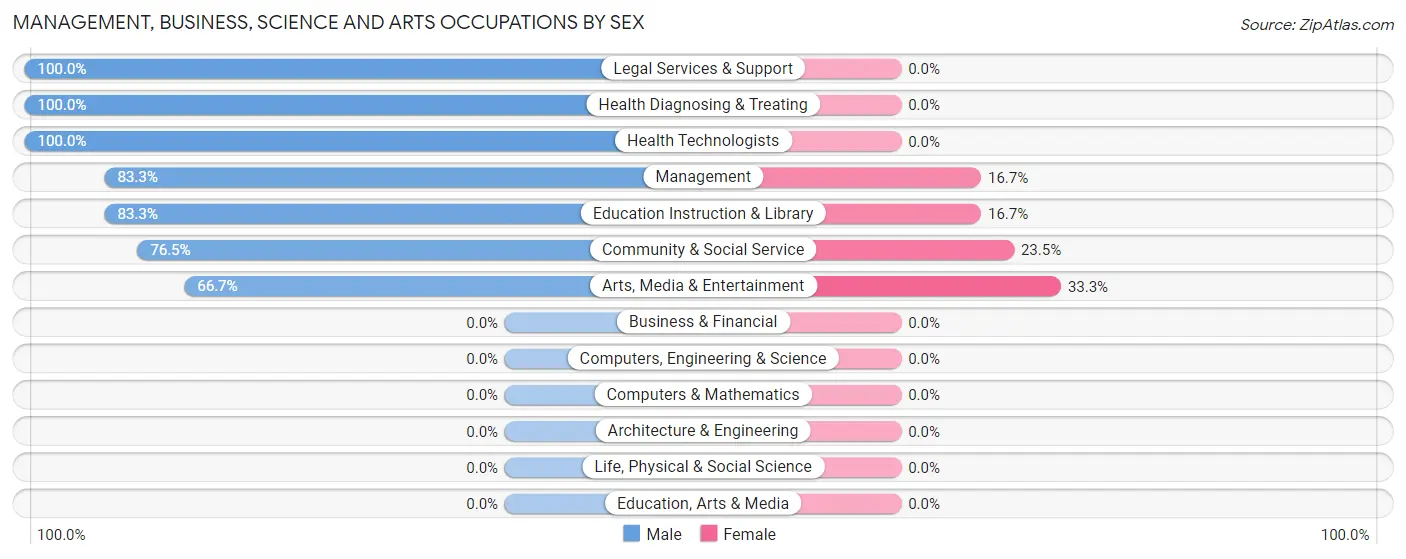
Management, Business, Science and Arts Occupations
The most common Management, Business, Science and Arts occupations in Parrott are Community & Social Service (17 | 38.6%), Arts, Media & Entertainment (9 | 20.4%), Management (6 | 13.6%), Education Instruction & Library (6 | 13.6%), and Legal Services & Support (2 | 4.5%).
Management, Business, Science and Arts Occupations by Sex
Within the Management, Business, Science and Arts occupations in Parrott, the most male-oriented occupations are Legal Services & Support (100.0%), Health Diagnosing & Treating (100.0%), and Health Technologists (100.0%), while the most female-oriented occupations are Arts, Media & Entertainment (33.3%), Community & Social Service (23.5%), and Management (16.7%).
| Occupation | Male | Female |
| Management | 5 (83.3%) | 1 (16.7%) |
| Business & Financial | 0 (0.0%) | 0 (0.0%) |
| Computers, Engineering & Science | 0 (0.0%) | 0 (0.0%) |
| Computers & Mathematics | 0 (0.0%) | 0 (0.0%) |
| Architecture & Engineering | 0 (0.0%) | 0 (0.0%) |
| Life, Physical & Social Science | 0 (0.0%) | 0 (0.0%) |
| Community & Social Service | 13 (76.5%) | 4 (23.5%) |
| Education, Arts & Media | 0 (0.0%) | 0 (0.0%) |
| Legal Services & Support | 2 (100.0%) | 0 (0.0%) |
| Education Instruction & Library | 5 (83.3%) | 1 (16.7%) |
| Arts, Media & Entertainment | 6 (66.7%) | 3 (33.3%) |
| Health Diagnosing & Treating | 2 (100.0%) | 0 (0.0%) |
| Health Technologists | 2 (100.0%) | 0 (0.0%) |
| Total (Category) | 20 (80.0%) | 5 (20.0%) |
| Total (Overall) | 31 (70.5%) | 13 (29.5%) |
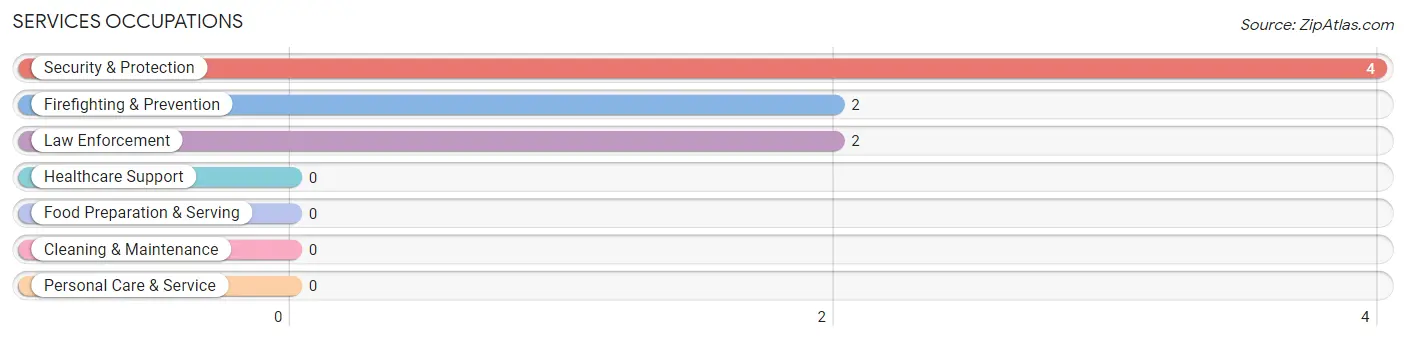
Services Occupations
The most common Services occupations in Parrott are Security & Protection (4 | 9.1%), Firefighting & Prevention (2 | 4.5%), and Law Enforcement (2 | 4.5%).
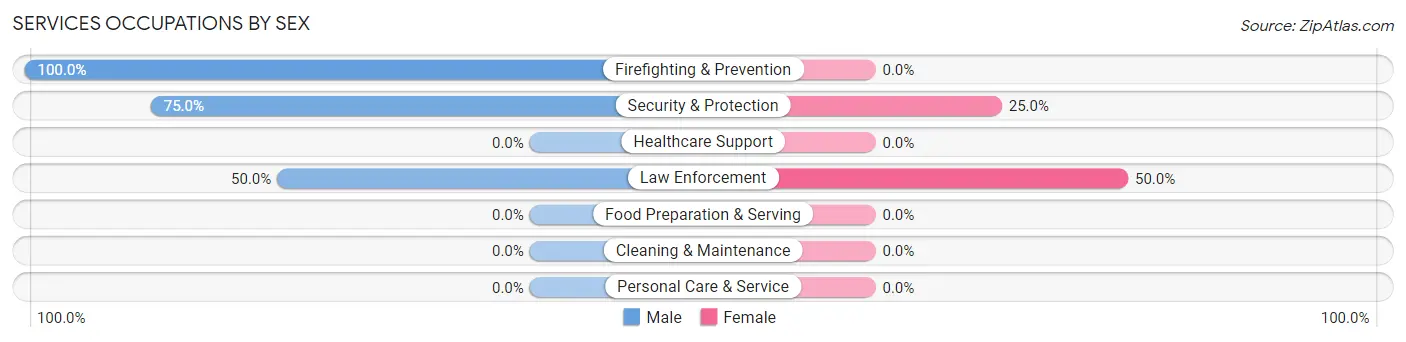
Services Occupations by Sex
Within the Services occupations in Parrott, the most male-oriented occupations are Firefighting & Prevention (100.0%), Security & Protection (75.0%), and Law Enforcement (50.0%), while the most female-oriented occupations are Law Enforcement (50.0%), and Security & Protection (25.0%).
| Occupation | Male | Female |
| Healthcare Support | 0 (0.0%) | 0 (0.0%) |
| Security & Protection | 3 (75.0%) | 1 (25.0%) |
| Firefighting & Prevention | 2 (100.0%) | 0 (0.0%) |
| Law Enforcement | 1 (50.0%) | 1 (50.0%) |
| Food Preparation & Serving | 0 (0.0%) | 0 (0.0%) |
| Cleaning & Maintenance | 0 (0.0%) | 0 (0.0%) |
| Personal Care & Service | 0 (0.0%) | 0 (0.0%) |
| Total (Category) | 3 (75.0%) | 1 (25.0%) |
| Total (Overall) | 31 (70.5%) | 13 (29.5%) |
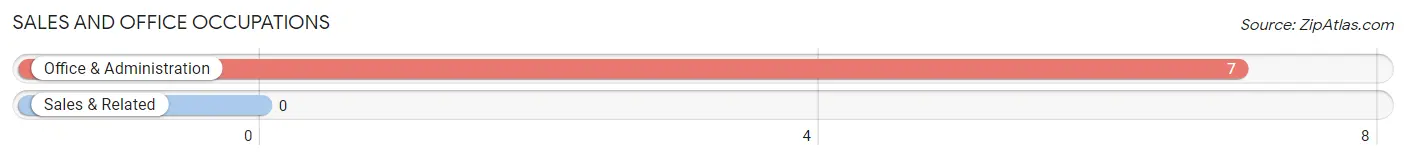
Sales and Office Occupations
The most common Sales and Office occupations in Parrott are , and Office & Administration (7 | 15.9%).
Sales and Office Occupations by Sex

| Occupation | Male | Female |
| Sales & Related | 0 (0.0%) | 0 (0.0%) |
| Office & Administration | 0 (0.0%) | 7 (100.0%) |
| Total (Category) | 0 (0.0%) | 7 (100.0%) |
| Total (Overall) | 31 (70.5%) | 13 (29.5%) |
Natural Resources, Construction and Maintenance Occupations
The most common Natural Resources, Construction and Maintenance occupations in Parrott are , and Installation, Maintenance & Repair (5 | 11.4%).
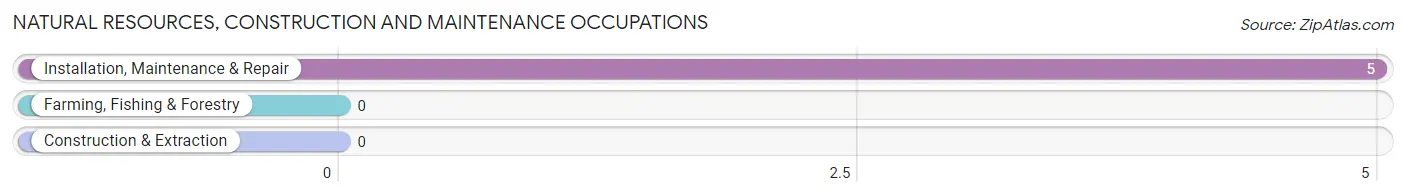
Natural Resources, Construction and Maintenance Occupations by Sex

| Occupation | Male | Female |
| Farming, Fishing & Forestry | 0 (0.0%) | 0 (0.0%) |
| Construction & Extraction | 0 (0.0%) | 0 (0.0%) |
| Installation, Maintenance & Repair | 5 (100.0%) | 0 (0.0%) |
| Total (Category) | 5 (100.0%) | 0 (0.0%) |
| Total (Overall) | 31 (70.5%) | 13 (29.5%) |
Production, Transportation and Moving Occupations
The most common Production, Transportation and Moving occupations in Parrott are , and Material Moving (3 | 6.8%).
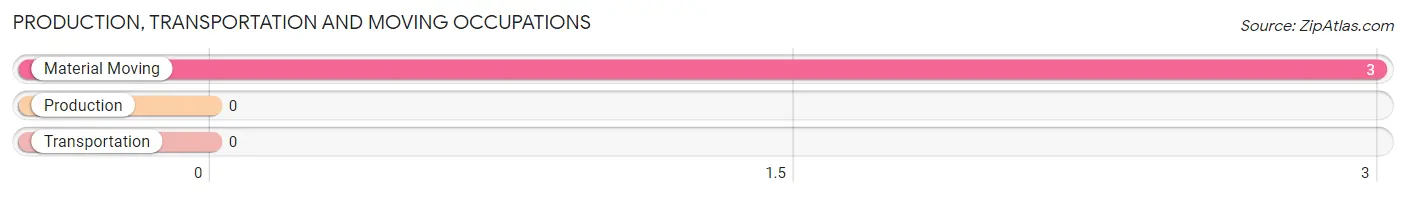
Production, Transportation and Moving Occupations by Sex
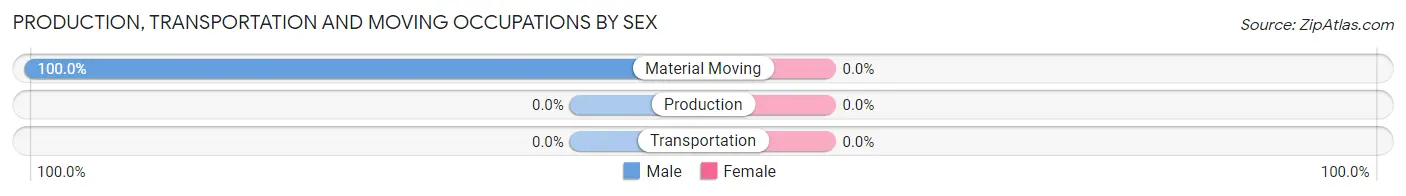
| Occupation | Male | Female |
| Production | 0 (0.0%) | 0 (0.0%) |
| Transportation | 0 (0.0%) | 0 (0.0%) |
| Material Moving | 3 (100.0%) | 0 (0.0%) |
| Total (Category) | 3 (100.0%) | 0 (0.0%) |
| Total (Overall) | 31 (70.5%) | 13 (29.5%) |
Employment Industries by Sex in Parrott
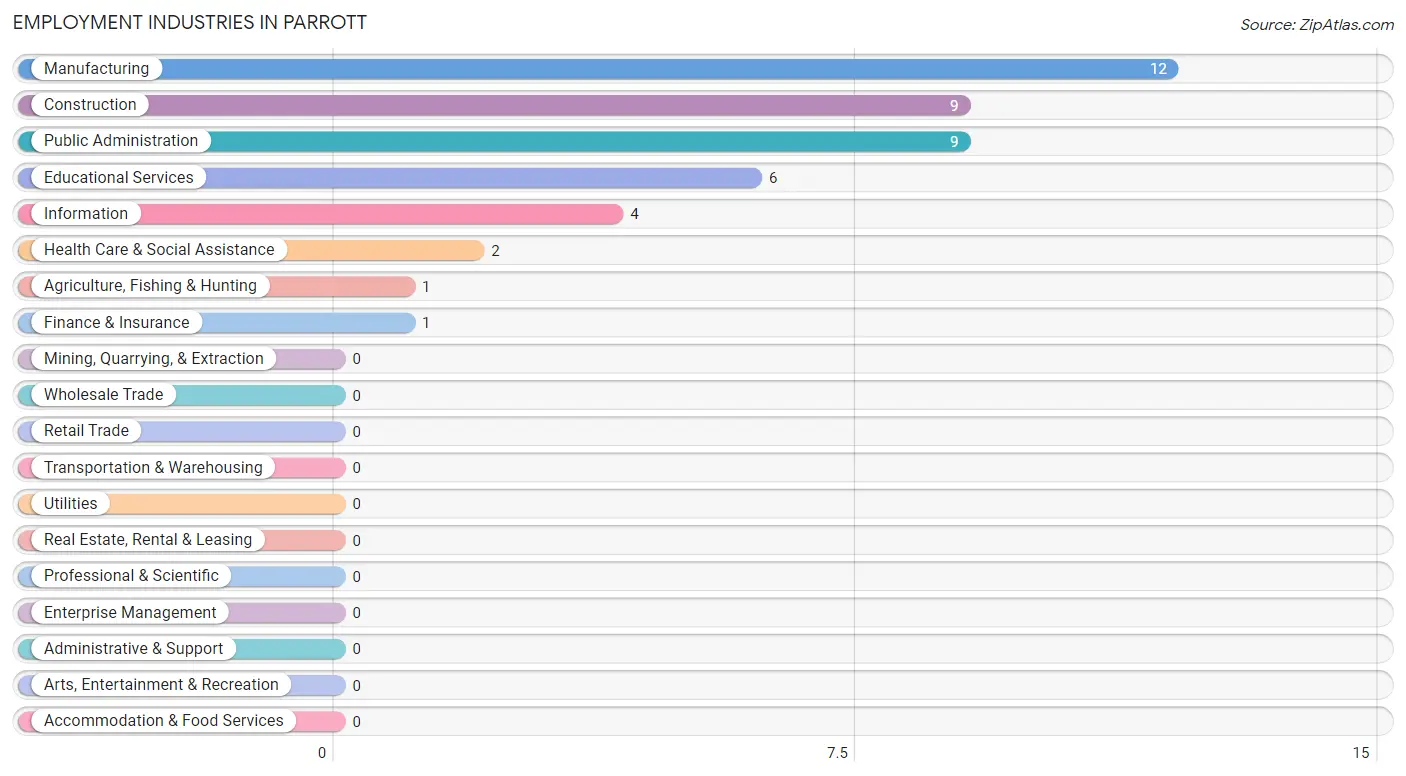
Employment Industries in Parrott
The major employment industries in Parrott include Manufacturing (12 | 27.3%), Construction (9 | 20.4%), Public Administration (9 | 20.4%), Educational Services (6 | 13.6%), and Information (4 | 9.1%).
Employment Industries by Sex in Parrott
The Parrott industries that see more men than women are Agriculture, Fishing & Hunting (100.0%), Information (100.0%), and Health Care & Social Assistance (100.0%), whereas the industries that tend to have a higher number of women are Finance & Insurance (100.0%), Construction (44.4%), and Public Administration (44.4%).
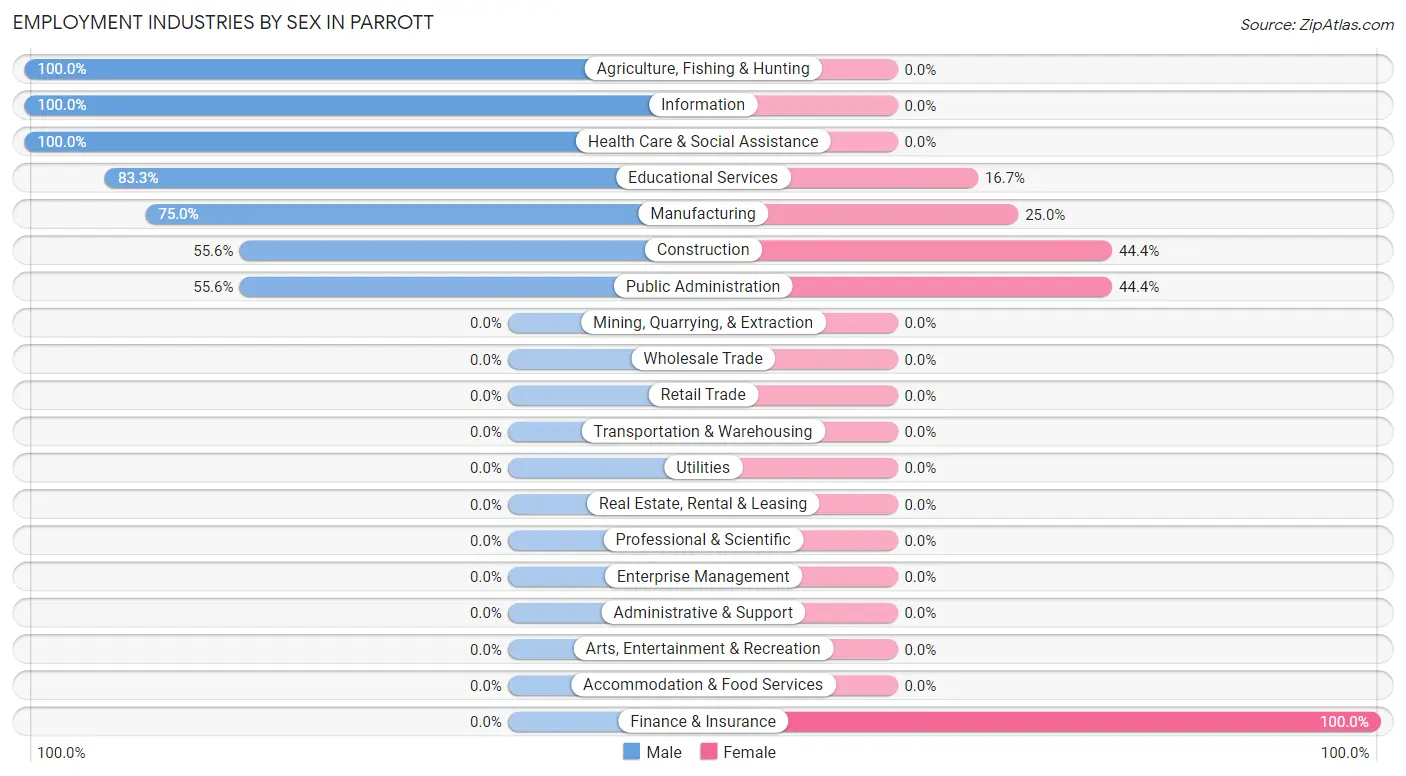
| Industry | Male | Female |
| Agriculture, Fishing & Hunting | 1 (100.0%) | 0 (0.0%) |
| Mining, Quarrying, & Extraction | 0 (0.0%) | 0 (0.0%) |
| Construction | 5 (55.6%) | 4 (44.4%) |
| Manufacturing | 9 (75.0%) | 3 (25.0%) |
| Wholesale Trade | 0 (0.0%) | 0 (0.0%) |
| Retail Trade | 0 (0.0%) | 0 (0.0%) |
| Transportation & Warehousing | 0 (0.0%) | 0 (0.0%) |
| Utilities | 0 (0.0%) | 0 (0.0%) |
| Information | 4 (100.0%) | 0 (0.0%) |
| Finance & Insurance | 0 (0.0%) | 1 (100.0%) |
| Real Estate, Rental & Leasing | 0 (0.0%) | 0 (0.0%) |
| Professional & Scientific | 0 (0.0%) | 0 (0.0%) |
| Enterprise Management | 0 (0.0%) | 0 (0.0%) |
| Administrative & Support | 0 (0.0%) | 0 (0.0%) |
| Educational Services | 5 (83.3%) | 1 (16.7%) |
| Health Care & Social Assistance | 2 (100.0%) | 0 (0.0%) |
| Arts, Entertainment & Recreation | 0 (0.0%) | 0 (0.0%) |
| Accommodation & Food Services | 0 (0.0%) | 0 (0.0%) |
| Public Administration | 5 (55.6%) | 4 (44.4%) |
| Total | 31 (70.5%) | 13 (29.5%) |
Education in Parrott
School Enrollment in Parrott
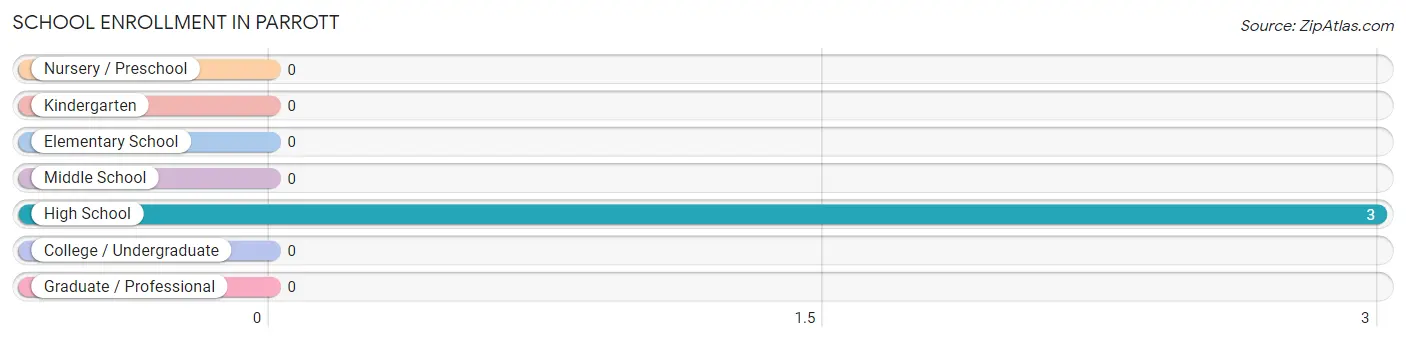
| School Level | # Students | % Students |
| Nursery / Preschool | 0 | 0.0% |
| Kindergarten | 0 | 0.0% |
| Elementary School | 0 | 0.0% |
| Middle School | 0 | 0.0% |
| High School | 3 | 100.0% |
| College / Undergraduate | 0 | 0.0% |
| Graduate / Professional | 0 | 0.0% |
| Total | 3 | 100.0% |
School Enrollment by Age by Funding Source in Parrott
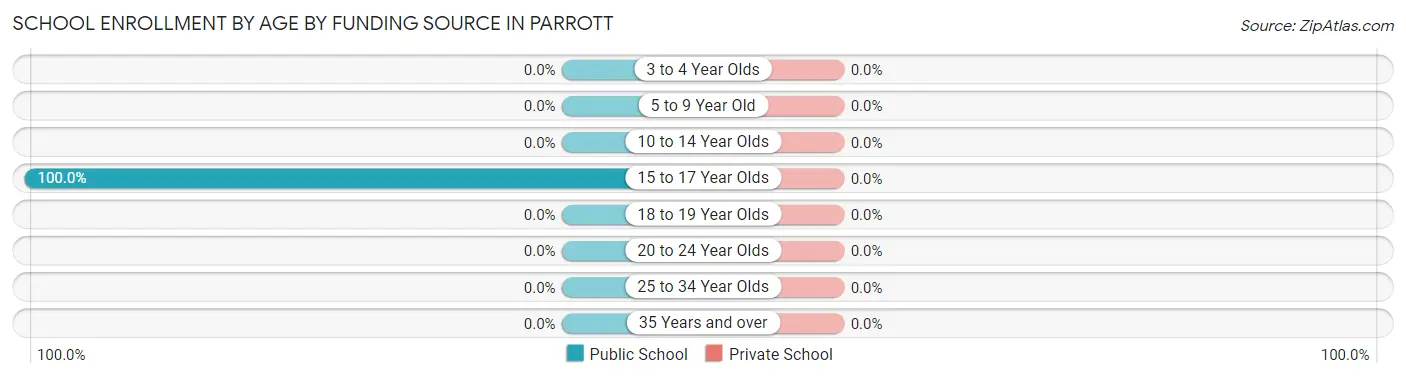
| Age Bracket | Public School | Private School |
| 3 to 4 Year Olds | 0 (0.0%) | 0 (0.0%) |
| 5 to 9 Year Old | 0 (0.0%) | 0 (0.0%) |
| 10 to 14 Year Olds | 0 (0.0%) | 0 (0.0%) |
| 15 to 17 Year Olds | 3 (100.0%) | 0 (0.0%) |
| 18 to 19 Year Olds | 0 (0.0%) | 0 (0.0%) |
| 20 to 24 Year Olds | 0 (0.0%) | 0 (0.0%) |
| 25 to 34 Year Olds | 0 (0.0%) | 0 (0.0%) |
| 35 Years and over | 0 (0.0%) | 0 (0.0%) |
| Total | 3 (100.0%) | 0 (0.0%) |
Educational Attainment by Field of Study in Parrott
Visual & performing arts (15 | 45.5%), education (8 | 24.2%), bio, nature & agricultural (4 | 12.1%), physical & health sciences (2 | 6.1%), and science & technology (2 | 6.1%) are the most common fields of study among 33 individuals in Parrott who have obtained a bachelor's degree or higher.
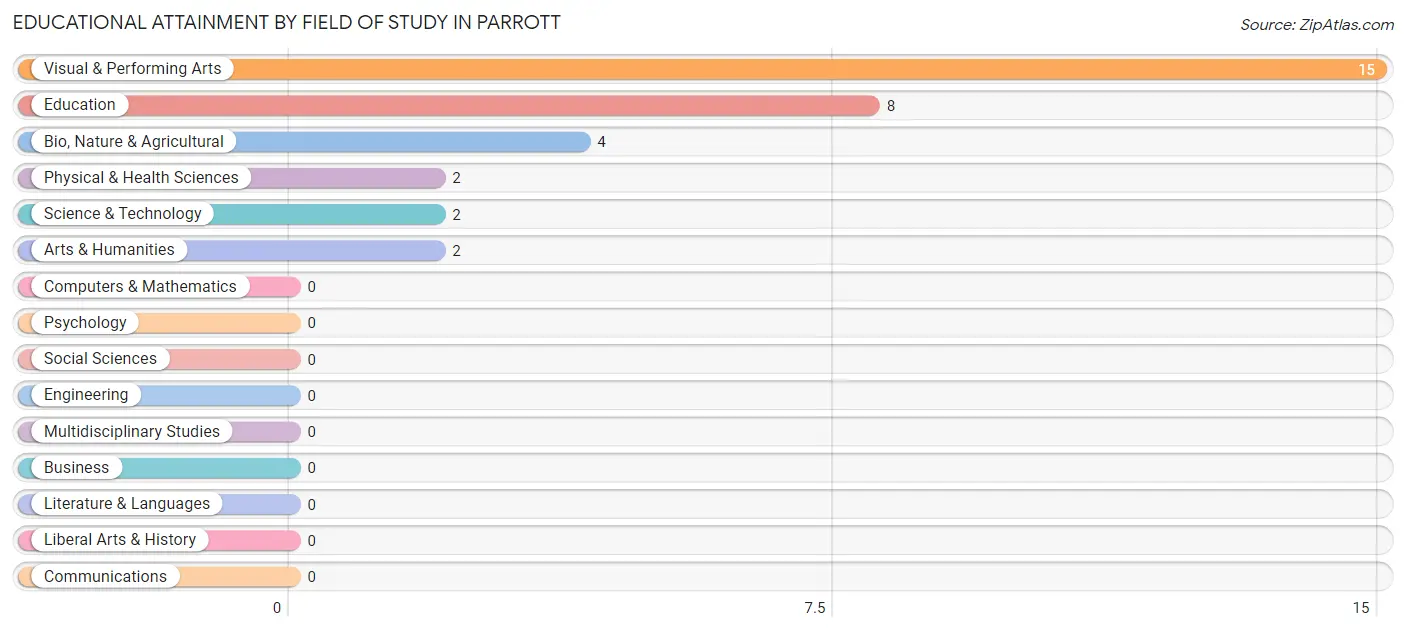
| Field of Study | # Graduates | % Graduates |
| Computers & Mathematics | 0 | 0.0% |
| Bio, Nature & Agricultural | 4 | 12.1% |
| Physical & Health Sciences | 2 | 6.1% |
| Psychology | 0 | 0.0% |
| Social Sciences | 0 | 0.0% |
| Engineering | 0 | 0.0% |
| Multidisciplinary Studies | 0 | 0.0% |
| Science & Technology | 2 | 6.1% |
| Business | 0 | 0.0% |
| Education | 8 | 24.2% |
| Literature & Languages | 0 | 0.0% |
| Liberal Arts & History | 0 | 0.0% |
| Visual & Performing Arts | 15 | 45.5% |
| Communications | 0 | 0.0% |
| Arts & Humanities | 2 | 6.1% |
| Total | 33 | 100.0% |
Transportation & Commute in Parrott
Vehicle Availability by Sex in Parrott
The most prevalent vehicle ownership categories in Parrott are males with 2 vehicles (16, accounting for 51.6%) and females with 2 vehicles (4, making up 123.1%).
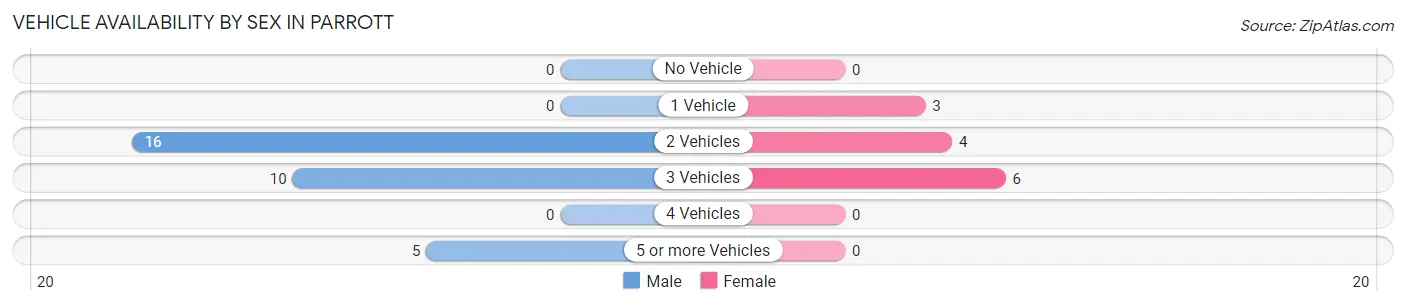
| Vehicles Available | Male | Female |
| No Vehicle | 0 (0.0%) | 0 (0.0%) |
| 1 Vehicle | 0 (0.0%) | 3 (23.1%) |
| 2 Vehicles | 16 (51.6%) | 4 (30.8%) |
| 3 Vehicles | 10 (32.3%) | 6 (46.2%) |
| 4 Vehicles | 0 (0.0%) | 0 (0.0%) |
| 5 or more Vehicles | 5 (16.1%) | 0 (0.0%) |
| Total | 31 (100.0%) | 13 (100.0%) |
Commute Time in Parrott
The most frequently occuring commute durations in Parrott are less than 5 minutes (16 commuters, 36.4%), 45 to 59 minutes (8 commuters, 18.2%), and 30 to 34 minutes (7 commuters, 15.9%).
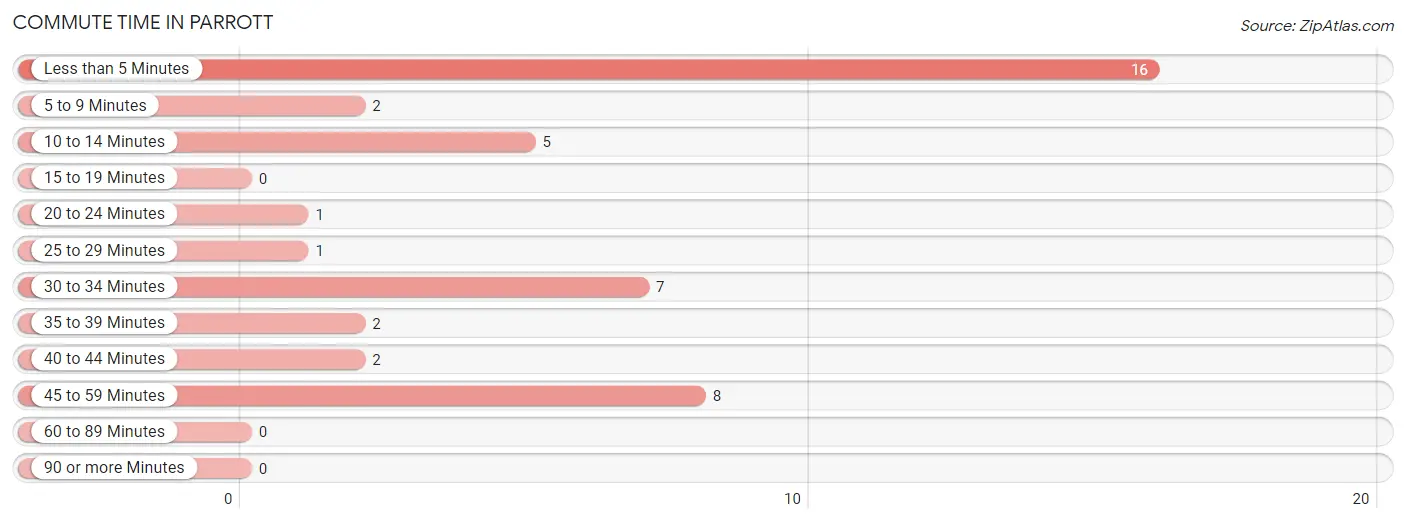
| Commute Time | # Commuters | % Commuters |
| Less than 5 Minutes | 16 | 36.4% |
| 5 to 9 Minutes | 2 | 4.5% |
| 10 to 14 Minutes | 5 | 11.4% |
| 15 to 19 Minutes | 0 | 0.0% |
| 20 to 24 Minutes | 1 | 2.3% |
| 25 to 29 Minutes | 1 | 2.3% |
| 30 to 34 Minutes | 7 | 15.9% |
| 35 to 39 Minutes | 2 | 4.5% |
| 40 to 44 Minutes | 2 | 4.5% |
| 45 to 59 Minutes | 8 | 18.2% |
| 60 to 89 Minutes | 0 | 0.0% |
| 90 or more Minutes | 0 | 0.0% |
Commute Time by Sex in Parrott
The most common commute times in Parrott are less than 5 minutes (9 commuters, 29.0%) for males and less than 5 minutes (7 commuters, 53.8%) for females.
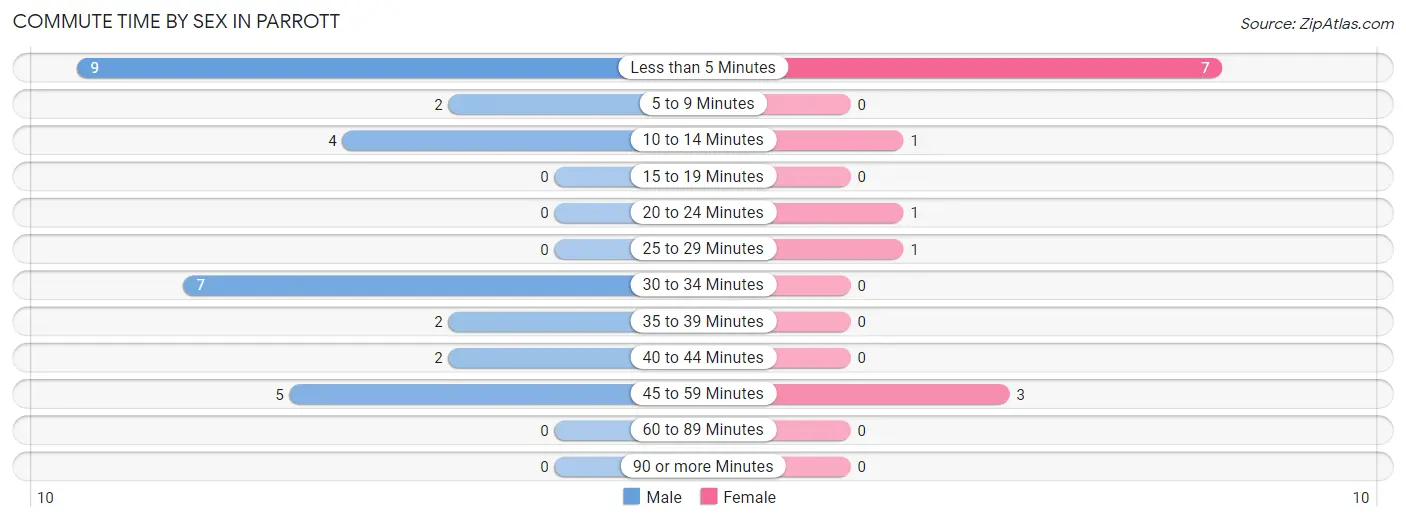
| Commute Time | Male | Female |
| Less than 5 Minutes | 9 (29.0%) | 7 (53.8%) |
| 5 to 9 Minutes | 2 (6.5%) | 0 (0.0%) |
| 10 to 14 Minutes | 4 (12.9%) | 1 (7.7%) |
| 15 to 19 Minutes | 0 (0.0%) | 0 (0.0%) |
| 20 to 24 Minutes | 0 (0.0%) | 1 (7.7%) |
| 25 to 29 Minutes | 0 (0.0%) | 1 (7.7%) |
| 30 to 34 Minutes | 7 (22.6%) | 0 (0.0%) |
| 35 to 39 Minutes | 2 (6.5%) | 0 (0.0%) |
| 40 to 44 Minutes | 2 (6.5%) | 0 (0.0%) |
| 45 to 59 Minutes | 5 (16.1%) | 3 (23.1%) |
| 60 to 89 Minutes | 0 (0.0%) | 0 (0.0%) |
| 90 or more Minutes | 0 (0.0%) | 0 (0.0%) |
Time of Departure to Work by Sex in Parrott
The most frequent times of departure to work in Parrott are 8:00 AM to 8:29 AM (11, 35.5%) for males and 8:00 AM to 8:29 AM (7, 53.8%) for females.
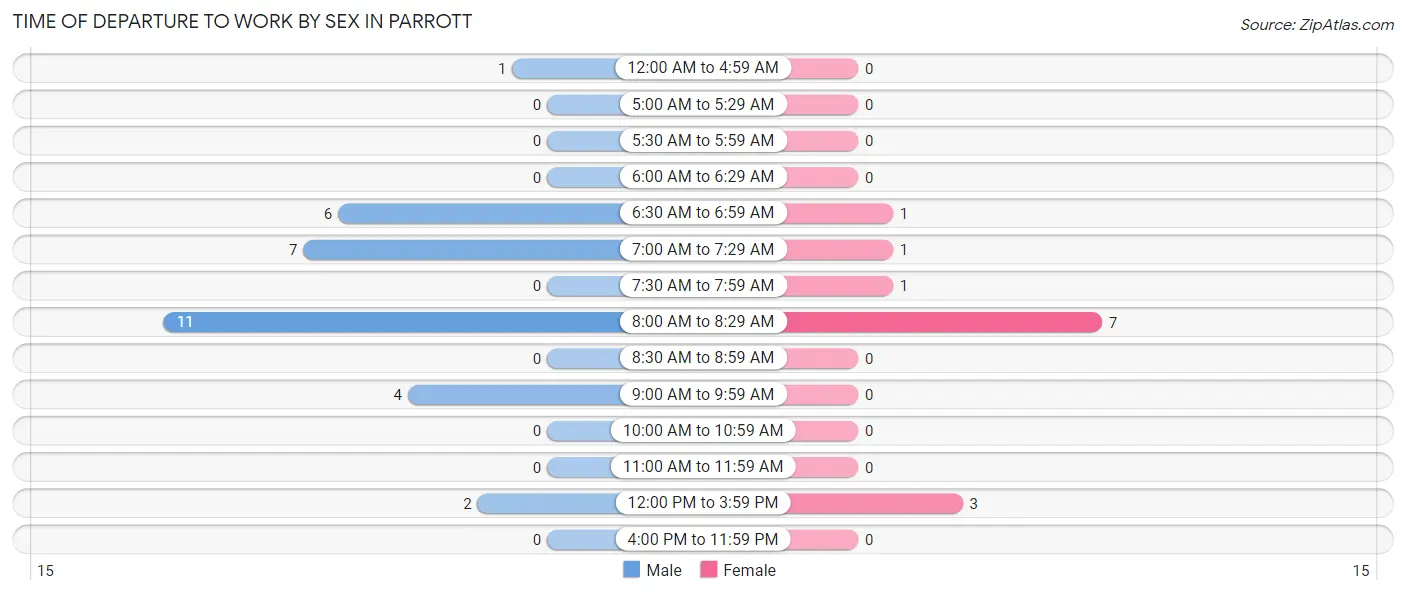
| Time of Departure | Male | Female |
| 12:00 AM to 4:59 AM | 1 (3.2%) | 0 (0.0%) |
| 5:00 AM to 5:29 AM | 0 (0.0%) | 0 (0.0%) |
| 5:30 AM to 5:59 AM | 0 (0.0%) | 0 (0.0%) |
| 6:00 AM to 6:29 AM | 0 (0.0%) | 0 (0.0%) |
| 6:30 AM to 6:59 AM | 6 (19.4%) | 1 (7.7%) |
| 7:00 AM to 7:29 AM | 7 (22.6%) | 1 (7.7%) |
| 7:30 AM to 7:59 AM | 0 (0.0%) | 1 (7.7%) |
| 8:00 AM to 8:29 AM | 11 (35.5%) | 7 (53.8%) |
| 8:30 AM to 8:59 AM | 0 (0.0%) | 0 (0.0%) |
| 9:00 AM to 9:59 AM | 4 (12.9%) | 0 (0.0%) |
| 10:00 AM to 10:59 AM | 0 (0.0%) | 0 (0.0%) |
| 11:00 AM to 11:59 AM | 0 (0.0%) | 0 (0.0%) |
| 12:00 PM to 3:59 PM | 2 (6.5%) | 3 (23.1%) |
| 4:00 PM to 11:59 PM | 0 (0.0%) | 0 (0.0%) |
| Total | 31 (100.0%) | 13 (100.0%) |
Housing Occupancy in Parrott
Occupancy by Ownership in Parrott
Of the total 44 dwellings in Parrott, owner-occupied units account for 36 (81.8%), while renter-occupied units make up 8 (18.2%).
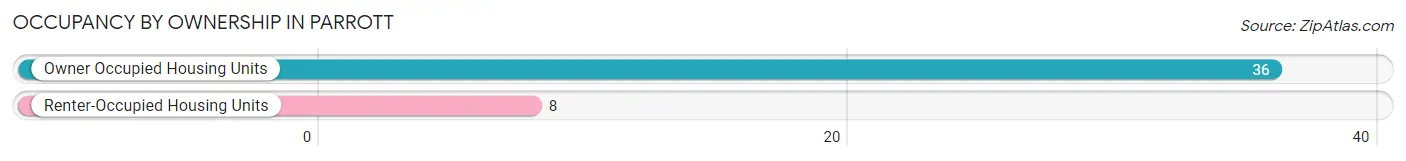
| Occupancy | # Housing Units | % Housing Units |
| Owner Occupied Housing Units | 36 | 81.8% |
| Renter-Occupied Housing Units | 8 | 18.2% |
| Total Occupied Housing Units | 44 | 100.0% |
Occupancy by Household Size in Parrott
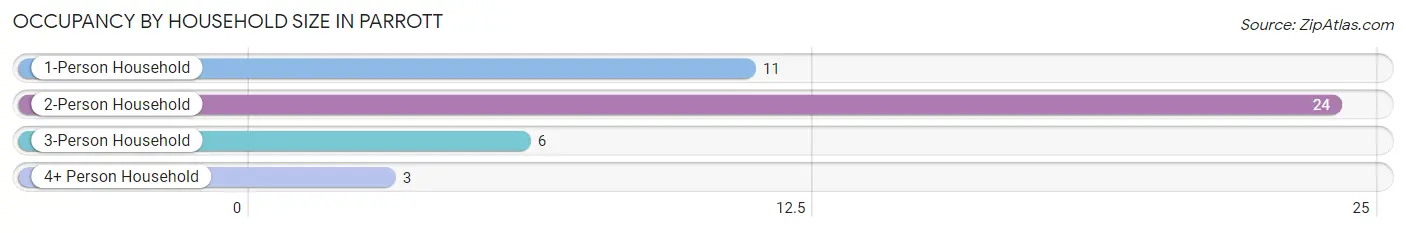
| Household Size | # Housing Units | % Housing Units |
| 1-Person Household | 11 | 25.0% |
| 2-Person Household | 24 | 54.5% |
| 3-Person Household | 6 | 13.6% |
| 4+ Person Household | 3 | 6.8% |
| Total Housing Units | 44 | 100.0% |
Occupancy by Ownership by Household Size in Parrott
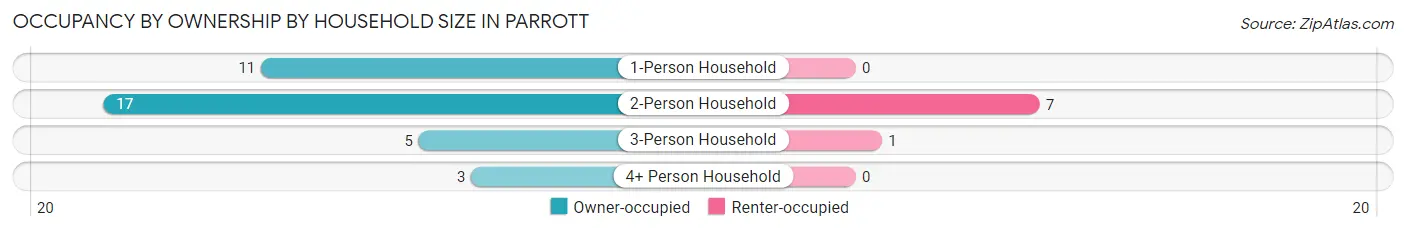
| Household Size | Owner-occupied | Renter-occupied |
| 1-Person Household | 11 (100.0%) | 0 (0.0%) |
| 2-Person Household | 17 (70.8%) | 7 (29.2%) |
| 3-Person Household | 5 (83.3%) | 1 (16.7%) |
| 4+ Person Household | 3 (100.0%) | 0 (0.0%) |
| Total Housing Units | 36 (81.8%) | 8 (18.2%) |
Occupancy by Educational Attainment in Parrott
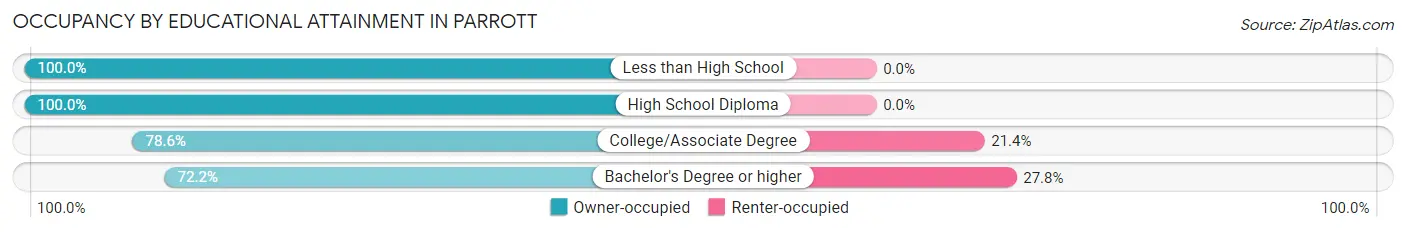
| Household Size | Owner-occupied | Renter-occupied |
| Less than High School | 4 (100.0%) | 0 (0.0%) |
| High School Diploma | 8 (100.0%) | 0 (0.0%) |
| College/Associate Degree | 11 (78.6%) | 3 (21.4%) |
| Bachelor's Degree or higher | 13 (72.2%) | 5 (27.8%) |
Occupancy by Age of Householder in Parrott
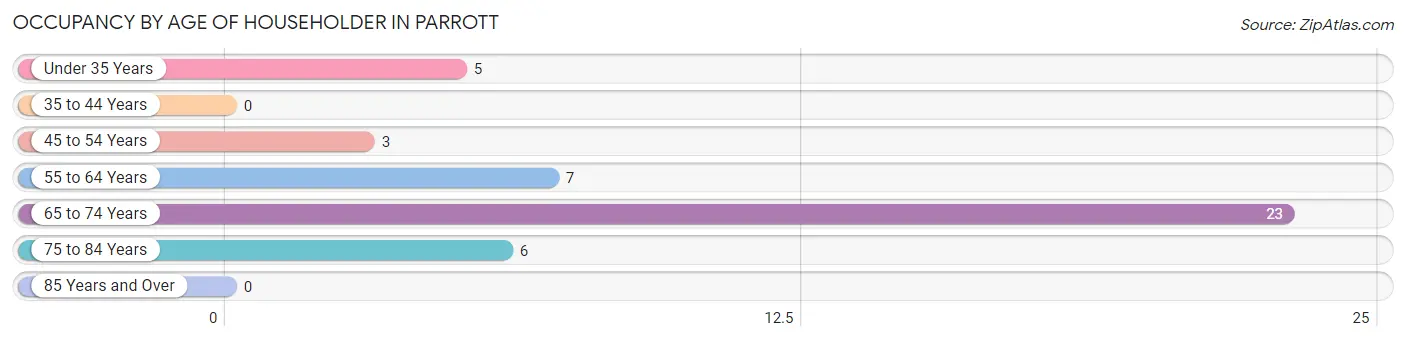
| Age Bracket | # Households | % Households |
| Under 35 Years | 5 | 11.4% |
| 35 to 44 Years | 0 | 0.0% |
| 45 to 54 Years | 3 | 6.8% |
| 55 to 64 Years | 7 | 15.9% |
| 65 to 74 Years | 23 | 52.3% |
| 75 to 84 Years | 6 | 13.6% |
| 85 Years and Over | 0 | 0.0% |
| Total | 44 | 100.0% |
Housing Finances in Parrott
Median Income by Occupancy in Parrott
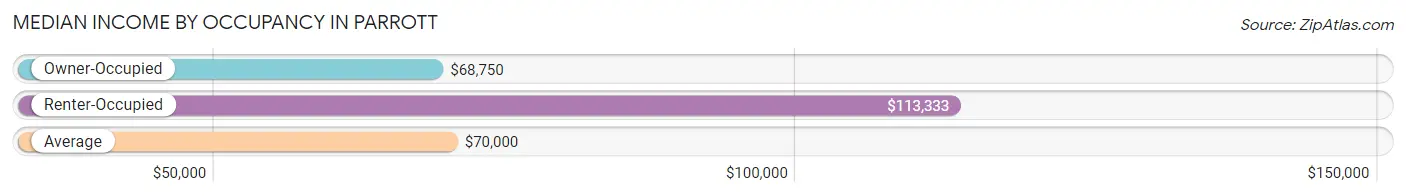
| Occupancy Type | # Households | Median Income |
| Owner-Occupied | 36 (81.8%) | $68,750 |
| Renter-Occupied | 8 (18.2%) | $113,333 |
| Average | 44 (100.0%) | $70,000 |
Occupancy by Householder Income Bracket in Parrott
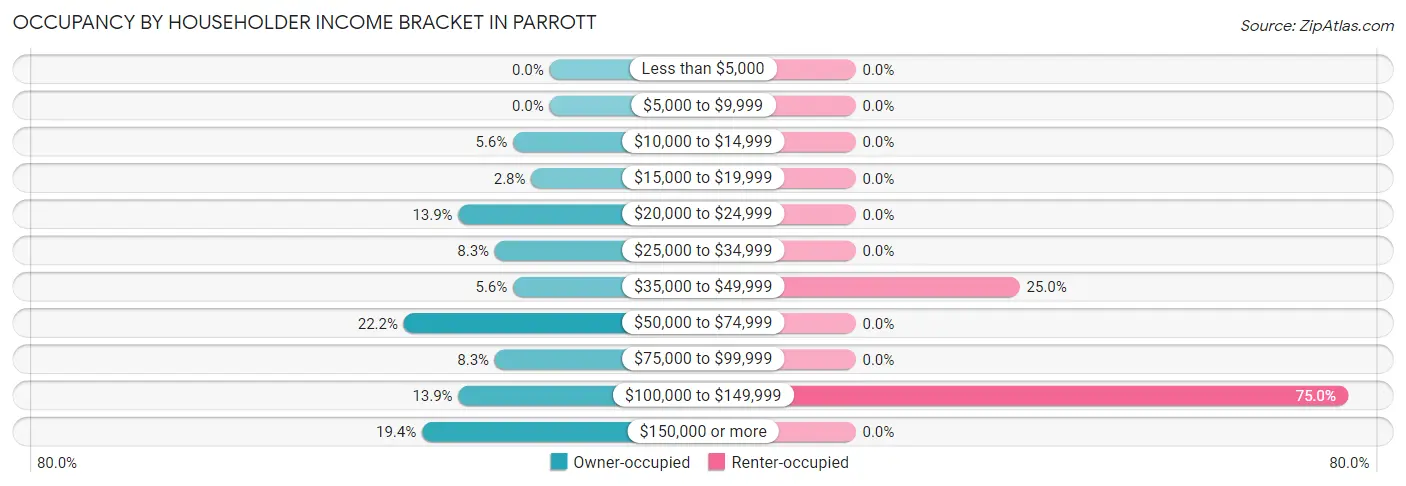
| Income Bracket | Owner-occupied | Renter-occupied |
| Less than $5,000 | 0 (0.0%) | 0 (0.0%) |
| $5,000 to $9,999 | 0 (0.0%) | 0 (0.0%) |
| $10,000 to $14,999 | 2 (5.6%) | 0 (0.0%) |
| $15,000 to $19,999 | 1 (2.8%) | 0 (0.0%) |
| $20,000 to $24,999 | 5 (13.9%) | 0 (0.0%) |
| $25,000 to $34,999 | 3 (8.3%) | 0 (0.0%) |
| $35,000 to $49,999 | 2 (5.6%) | 2 (25.0%) |
| $50,000 to $74,999 | 8 (22.2%) | 0 (0.0%) |
| $75,000 to $99,999 | 3 (8.3%) | 0 (0.0%) |
| $100,000 to $149,999 | 5 (13.9%) | 6 (75.0%) |
| $150,000 or more | 7 (19.4%) | 0 (0.0%) |
| Total | 36 (100.0%) | 8 (100.0%) |
Monthly Housing Cost Tiers in Parrott
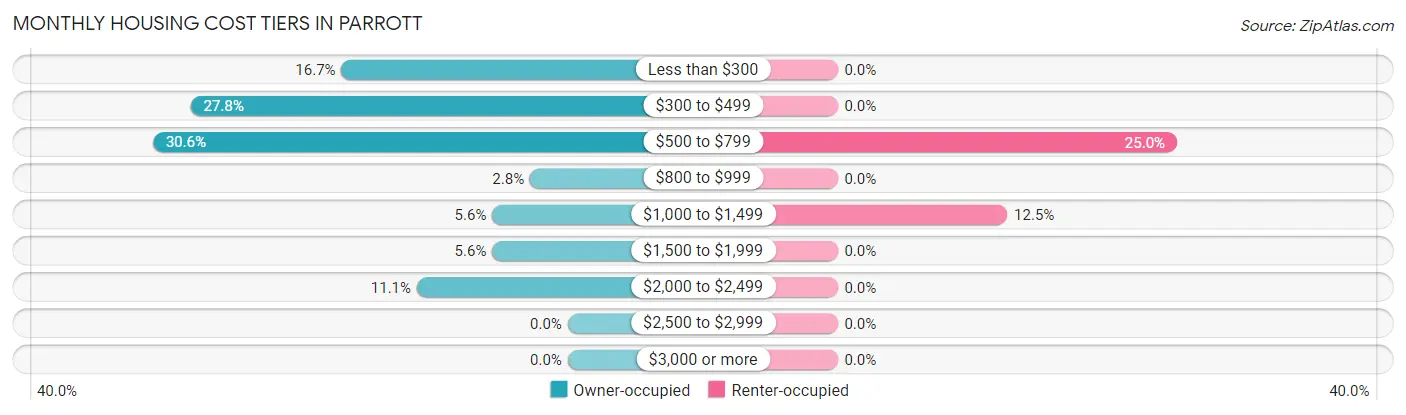
| Monthly Cost | Owner-occupied | Renter-occupied |
| Less than $300 | 6 (16.7%) | 0 (0.0%) |
| $300 to $499 | 10 (27.8%) | 0 (0.0%) |
| $500 to $799 | 11 (30.6%) | 2 (25.0%) |
| $800 to $999 | 1 (2.8%) | 0 (0.0%) |
| $1,000 to $1,499 | 2 (5.6%) | 1 (12.5%) |
| $1,500 to $1,999 | 2 (5.6%) | 0 (0.0%) |
| $2,000 to $2,499 | 4 (11.1%) | 0 (0.0%) |
| $2,500 to $2,999 | 0 (0.0%) | 0 (0.0%) |
| $3,000 or more | 0 (0.0%) | 0 (0.0%) |
| Total | 36 (100.0%) | 8 (100.0%) |
Physical Housing Characteristics in Parrott
Housing Structures in Parrott
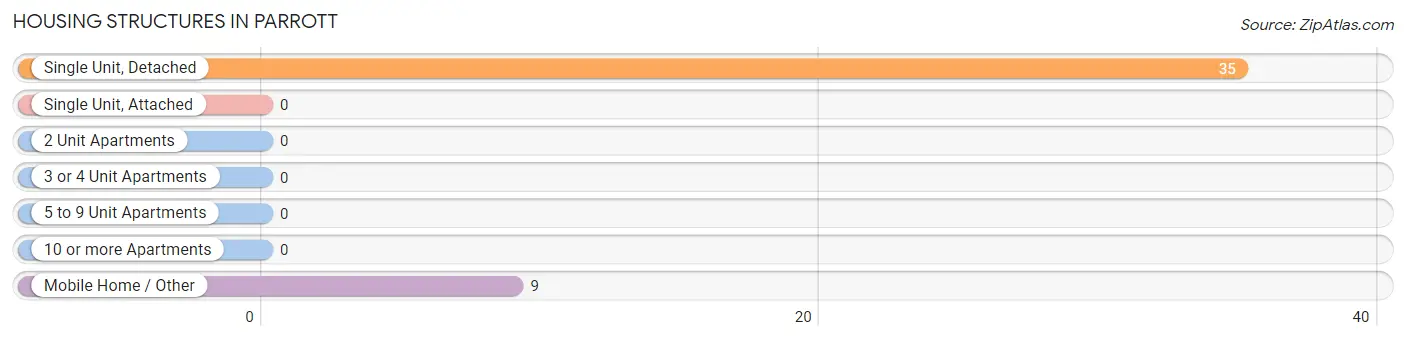
| Structure Type | # Housing Units | % Housing Units |
| Single Unit, Detached | 35 | 79.5% |
| Single Unit, Attached | 0 | 0.0% |
| 2 Unit Apartments | 0 | 0.0% |
| 3 or 4 Unit Apartments | 0 | 0.0% |
| 5 to 9 Unit Apartments | 0 | 0.0% |
| 10 or more Apartments | 0 | 0.0% |
| Mobile Home / Other | 9 | 20.4% |
| Total | 44 | 100.0% |
Housing Structures by Occupancy in Parrott
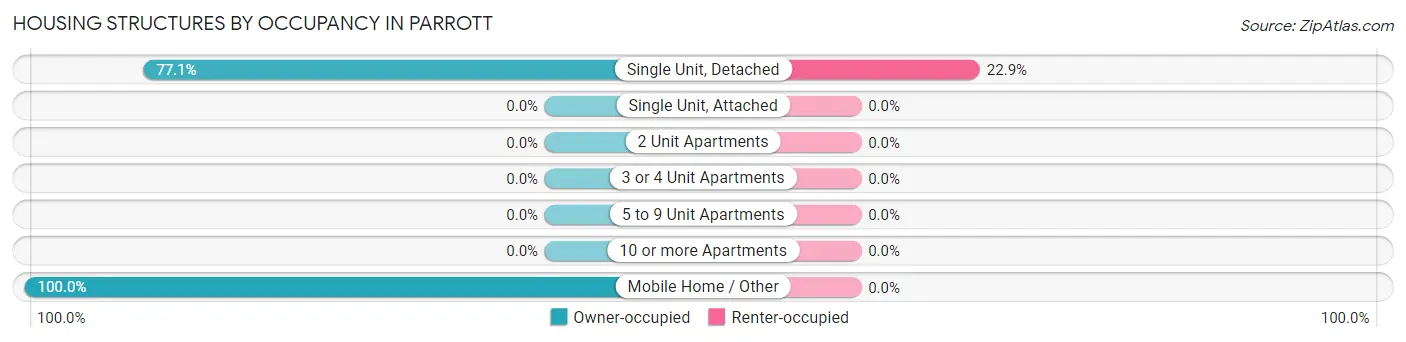
| Structure Type | Owner-occupied | Renter-occupied |
| Single Unit, Detached | 27 (77.1%) | 8 (22.9%) |
| Single Unit, Attached | 0 (0.0%) | 0 (0.0%) |
| 2 Unit Apartments | 0 (0.0%) | 0 (0.0%) |
| 3 or 4 Unit Apartments | 0 (0.0%) | 0 (0.0%) |
| 5 to 9 Unit Apartments | 0 (0.0%) | 0 (0.0%) |
| 10 or more Apartments | 0 (0.0%) | 0 (0.0%) |
| Mobile Home / Other | 9 (100.0%) | 0 (0.0%) |
| Total | 36 (81.8%) | 8 (18.2%) |
Housing Structures by Number of Rooms in Parrott
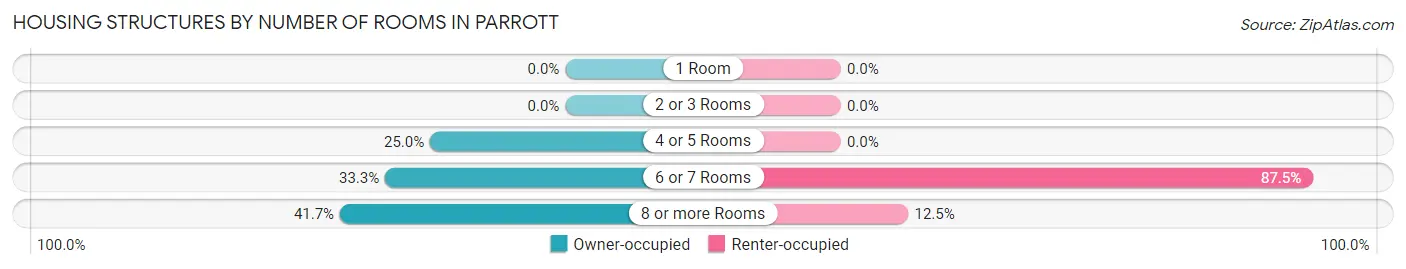
| Number of Rooms | Owner-occupied | Renter-occupied |
| 1 Room | 0 (0.0%) | 0 (0.0%) |
| 2 or 3 Rooms | 0 (0.0%) | 0 (0.0%) |
| 4 or 5 Rooms | 9 (25.0%) | 0 (0.0%) |
| 6 or 7 Rooms | 12 (33.3%) | 7 (87.5%) |
| 8 or more Rooms | 15 (41.7%) | 1 (12.5%) |
| Total | 36 (100.0%) | 8 (100.0%) |
Housing Structure by Heating Type in Parrott
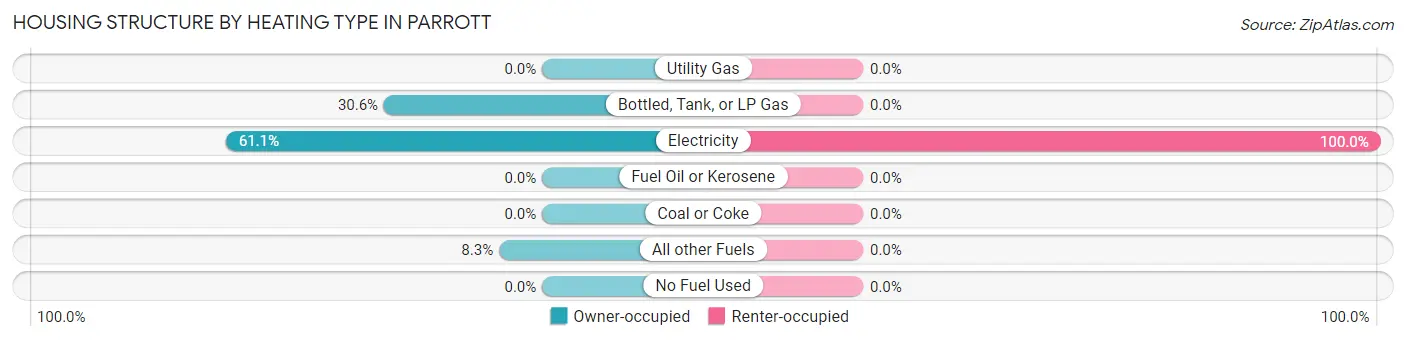
| Heating Type | Owner-occupied | Renter-occupied |
| Utility Gas | 0 (0.0%) | 0 (0.0%) |
| Bottled, Tank, or LP Gas | 11 (30.6%) | 0 (0.0%) |
| Electricity | 22 (61.1%) | 8 (100.0%) |
| Fuel Oil or Kerosene | 0 (0.0%) | 0 (0.0%) |
| Coal or Coke | 0 (0.0%) | 0 (0.0%) |
| All other Fuels | 3 (8.3%) | 0 (0.0%) |
| No Fuel Used | 0 (0.0%) | 0 (0.0%) |
| Total | 36 (100.0%) | 8 (100.0%) |
Household Vehicle Usage in Parrott
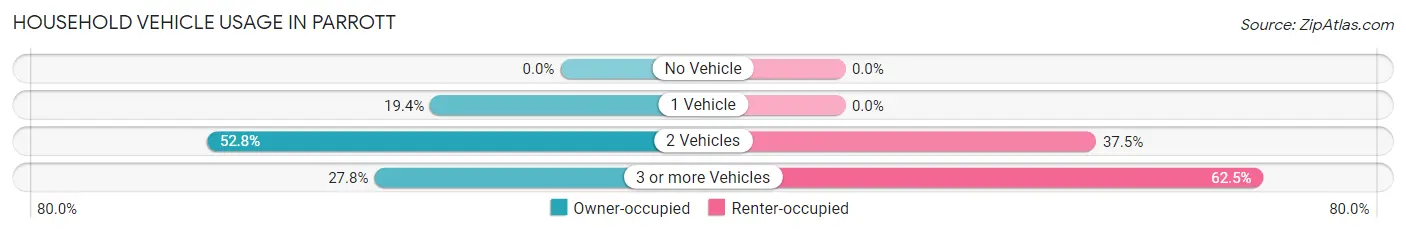
| Vehicles per Household | Owner-occupied | Renter-occupied |
| No Vehicle | 0 (0.0%) | 0 (0.0%) |
| 1 Vehicle | 7 (19.4%) | 0 (0.0%) |
| 2 Vehicles | 19 (52.8%) | 3 (37.5%) |
| 3 or more Vehicles | 10 (27.8%) | 5 (62.5%) |
| Total | 36 (100.0%) | 8 (100.0%) |
Real Estate & Mortgages in Parrott
Real Estate and Mortgage Overview in Parrott
| Characteristic | Without Mortgage | With Mortgage |
| Housing Units | 22 | 14 |
| Median Property Value | $85,000 | $0 |
| Median Household Income | $69,375 | $6 |
| Monthly Housing Costs | $370 | $0 |
| Real Estate Taxes | - | - |
Property Value by Mortgage Status in Parrott
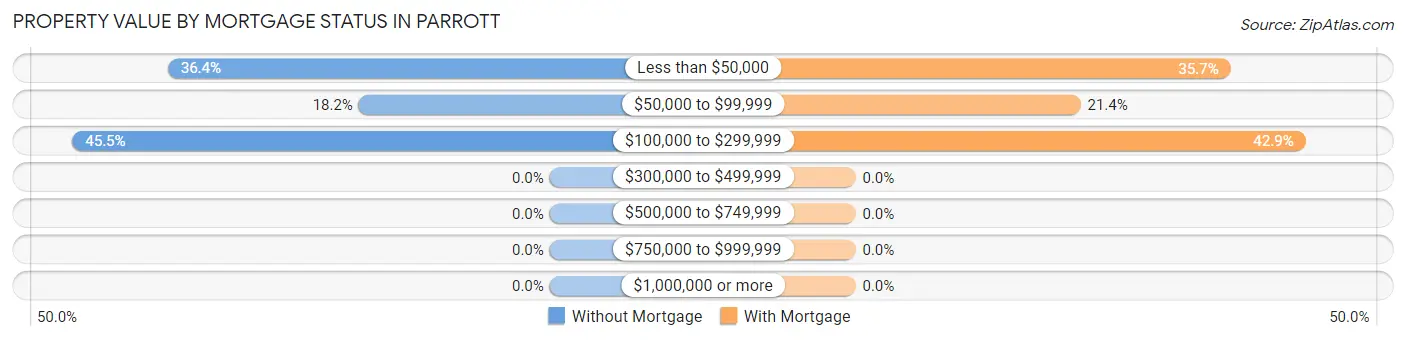
| Property Value | Without Mortgage | With Mortgage |
| Less than $50,000 | 8 (36.4%) | 5 (35.7%) |
| $50,000 to $99,999 | 4 (18.2%) | 3 (21.4%) |
| $100,000 to $299,999 | 10 (45.5%) | 6 (42.9%) |
| $300,000 to $499,999 | 0 (0.0%) | 0 (0.0%) |
| $500,000 to $749,999 | 0 (0.0%) | 0 (0.0%) |
| $750,000 to $999,999 | 0 (0.0%) | 0 (0.0%) |
| $1,000,000 or more | 0 (0.0%) | 0 (0.0%) |
| Total | 22 (100.0%) | 14 (100.0%) |
Household Income by Mortgage Status in Parrott
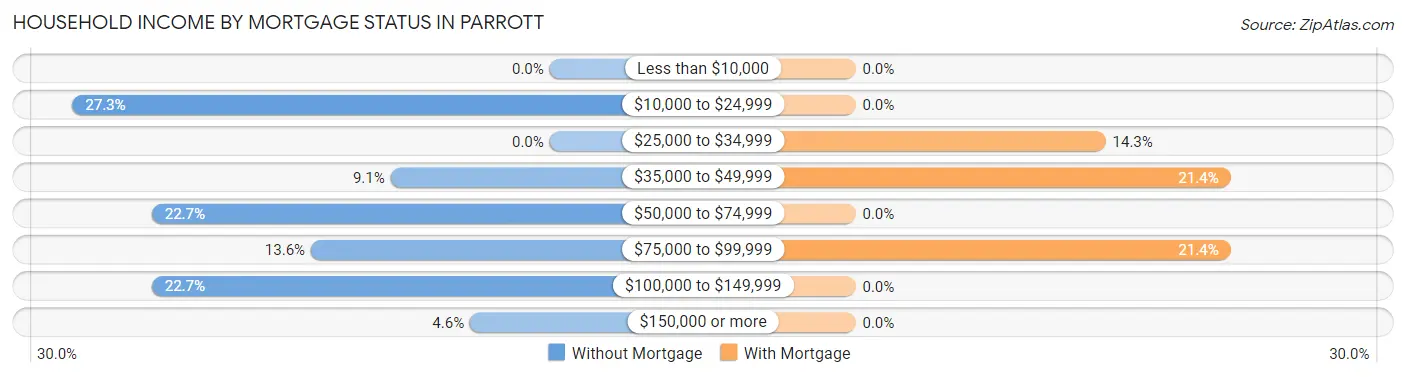
| Household Income | Without Mortgage | With Mortgage |
| Less than $10,000 | 0 (0.0%) | 0 (0.0%) |
| $10,000 to $24,999 | 6 (27.3%) | 0 (0.0%) |
| $25,000 to $34,999 | 0 (0.0%) | 2 (14.3%) |
| $35,000 to $49,999 | 2 (9.1%) | 3 (21.4%) |
| $50,000 to $74,999 | 5 (22.7%) | 0 (0.0%) |
| $75,000 to $99,999 | 3 (13.6%) | 3 (21.4%) |
| $100,000 to $149,999 | 5 (22.7%) | 0 (0.0%) |
| $150,000 or more | 1 (4.5%) | 0 (0.0%) |
| Total | 22 (100.0%) | 14 (100.0%) |
Property Value to Household Income Ratio in Parrott
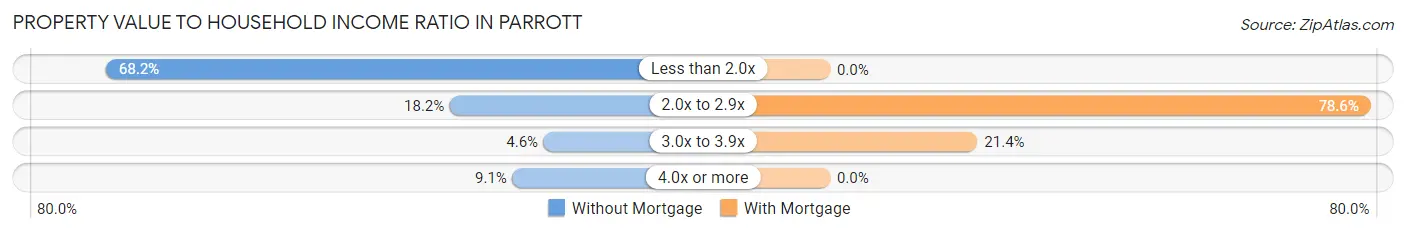
| Value-to-Income Ratio | Without Mortgage | With Mortgage |
| Less than 2.0x | 15 (68.2%) | 0 (0.0%) |
| 2.0x to 2.9x | 4 (18.2%) | 11 (78.6%) |
| 3.0x to 3.9x | 1 (4.5%) | 3 (21.4%) |
| 4.0x or more | 2 (9.1%) | 0 (0.0%) |
| Total | 22 (100.0%) | 14 (100.0%) |
Real Estate Taxes by Mortgage Status in Parrott
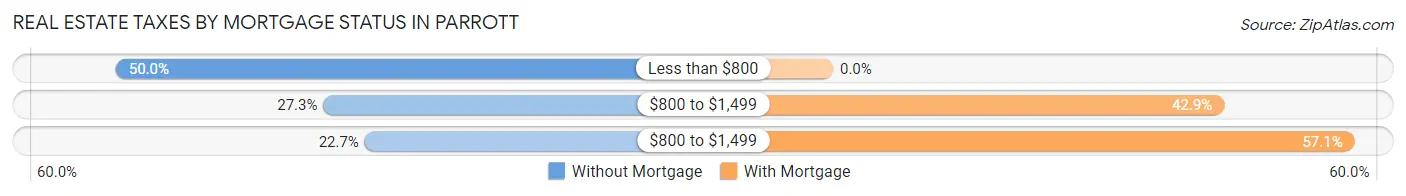
| Property Taxes | Without Mortgage | With Mortgage |
| Less than $800 | 11 (50.0%) | 0 (0.0%) |
| $800 to $1,499 | 6 (27.3%) | 6 (42.9%) |
| $800 to $1,499 | 5 (22.7%) | 8 (57.1%) |
| Total | 22 (100.0%) | 14 (100.0%) |
Health & Disability in Parrott
Health Insurance Coverage by Age in Parrott
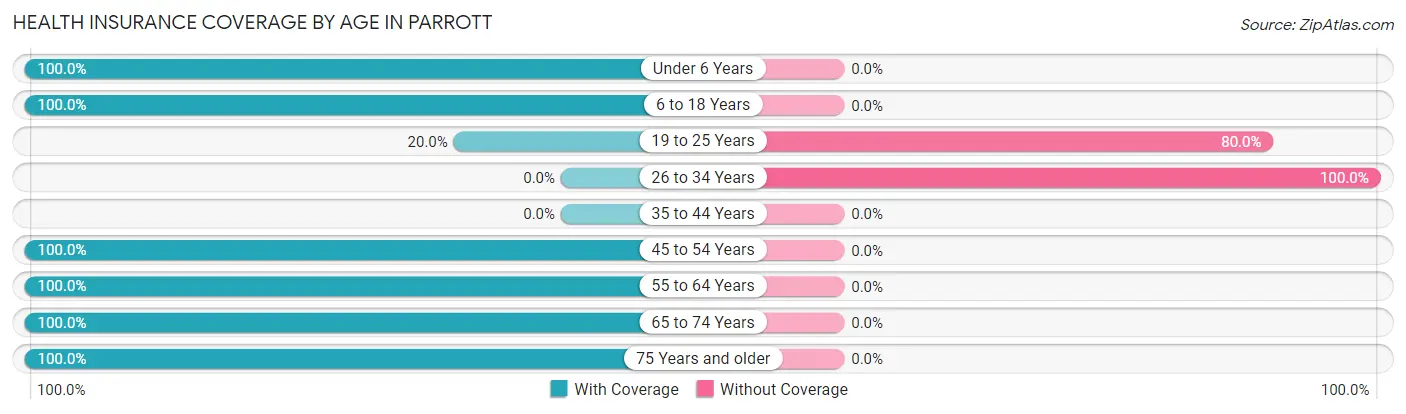
| Age Bracket | With Coverage | Without Coverage |
| Under 6 Years | 6 (100.0%) | 0 (0.0%) |
| 6 to 18 Years | 3 (100.0%) | 0 (0.0%) |
| 19 to 25 Years | 3 (20.0%) | 12 (80.0%) |
| 26 to 34 Years | 0 (0.0%) | 1 (100.0%) |
| 35 to 44 Years | 0 (0.0%) | 0 (0.0%) |
| 45 to 54 Years | 17 (100.0%) | 0 (0.0%) |
| 55 to 64 Years | 12 (100.0%) | 0 (0.0%) |
| 65 to 74 Years | 33 (100.0%) | 0 (0.0%) |
| 75 Years and older | 15 (100.0%) | 0 (0.0%) |
| Total | 89 (87.3%) | 13 (12.8%) |
Health Insurance Coverage by Citizenship Status in Parrott

| Citizenship Status | With Coverage | Without Coverage |
| Native Born | 6 (100.0%) | 0 (0.0%) |
| Foreign Born, Citizen | 3 (100.0%) | 0 (0.0%) |
| Foreign Born, not a Citizen | 3 (20.0%) | 12 (80.0%) |
Health Insurance Coverage by Household Income in Parrott
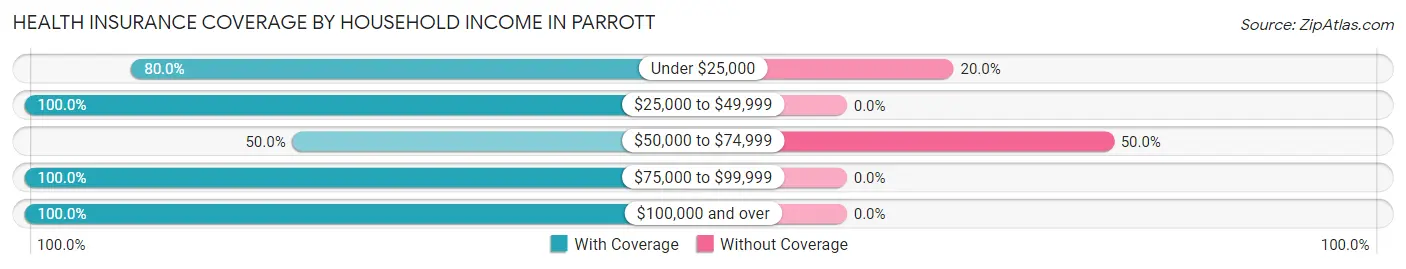
| Household Income | With Coverage | Without Coverage |
| Under $25,000 | 12 (80.0%) | 3 (20.0%) |
| $25,000 to $49,999 | 12 (100.0%) | 0 (0.0%) |
| $50,000 to $74,999 | 10 (50.0%) | 10 (50.0%) |
| $75,000 to $99,999 | 7 (100.0%) | 0 (0.0%) |
| $100,000 and over | 48 (100.0%) | 0 (0.0%) |
Public vs Private Health Insurance Coverage by Age in Parrott
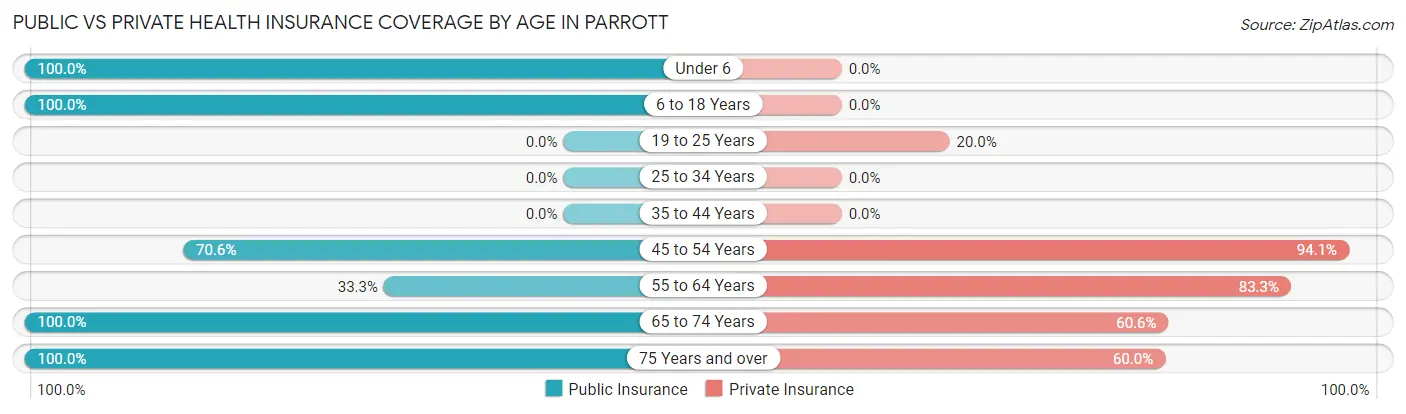
| Age Bracket | Public Insurance | Private Insurance |
| Under 6 | 6 (100.0%) | 0 (0.0%) |
| 6 to 18 Years | 3 (100.0%) | 0 (0.0%) |
| 19 to 25 Years | 0 (0.0%) | 3 (20.0%) |
| 25 to 34 Years | 0 (0.0%) | 0 (0.0%) |
| 35 to 44 Years | 0 (0.0%) | 0 (0.0%) |
| 45 to 54 Years | 12 (70.6%) | 16 (94.1%) |
| 55 to 64 Years | 4 (33.3%) | 10 (83.3%) |
| 65 to 74 Years | 33 (100.0%) | 20 (60.6%) |
| 75 Years and over | 15 (100.0%) | 9 (60.0%) |
| Total | 73 (71.6%) | 58 (56.9%) |
Disability Status by Sex by Age in Parrott
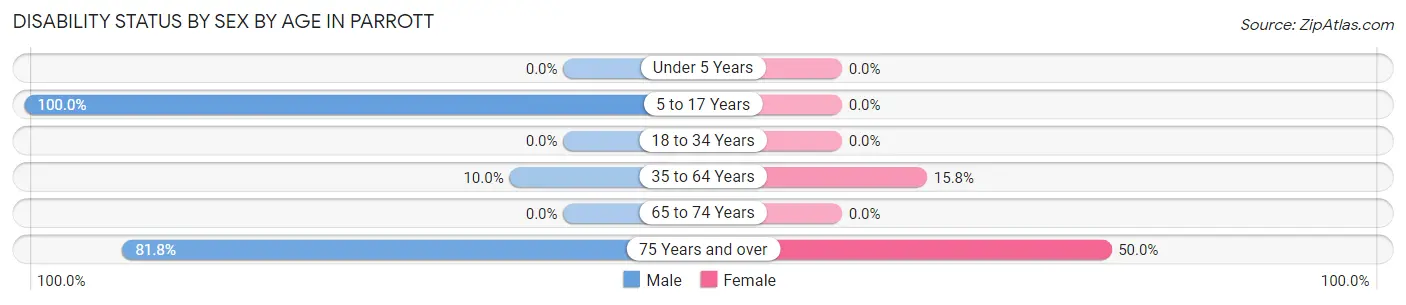
| Age Bracket | Male | Female |
| Under 5 Years | 0 (0.0%) | 0 (0.0%) |
| 5 to 17 Years | 3 (100.0%) | 0 (0.0%) |
| 18 to 34 Years | 0 (0.0%) | 0 (0.0%) |
| 35 to 64 Years | 1 (10.0%) | 3 (15.8%) |
| 65 to 74 Years | 0 (0.0%) | 0 (0.0%) |
| 75 Years and over | 9 (81.8%) | 2 (50.0%) |
Disability Class by Sex by Age in Parrott
Disability Class: Hearing Difficulty
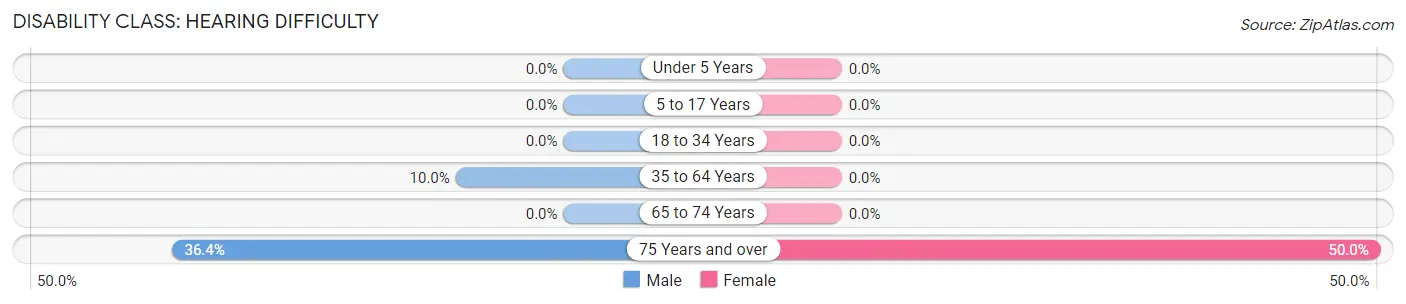
| Age Bracket | Male | Female |
| Under 5 Years | 0 (0.0%) | 0 (0.0%) |
| 5 to 17 Years | 0 (0.0%) | 0 (0.0%) |
| 18 to 34 Years | 0 (0.0%) | 0 (0.0%) |
| 35 to 64 Years | 1 (10.0%) | 0 (0.0%) |
| 65 to 74 Years | 0 (0.0%) | 0 (0.0%) |
| 75 Years and over | 4 (36.4%) | 2 (50.0%) |
Disability Class: Vision Difficulty
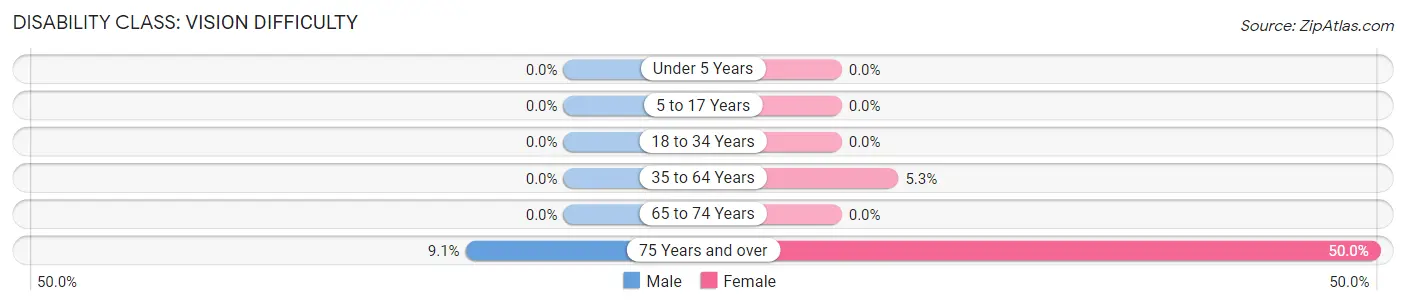
| Age Bracket | Male | Female |
| Under 5 Years | 0 (0.0%) | 0 (0.0%) |
| 5 to 17 Years | 0 (0.0%) | 0 (0.0%) |
| 18 to 34 Years | 0 (0.0%) | 0 (0.0%) |
| 35 to 64 Years | 0 (0.0%) | 1 (5.3%) |
| 65 to 74 Years | 0 (0.0%) | 0 (0.0%) |
| 75 Years and over | 1 (9.1%) | 2 (50.0%) |
Disability Class: Cognitive Difficulty
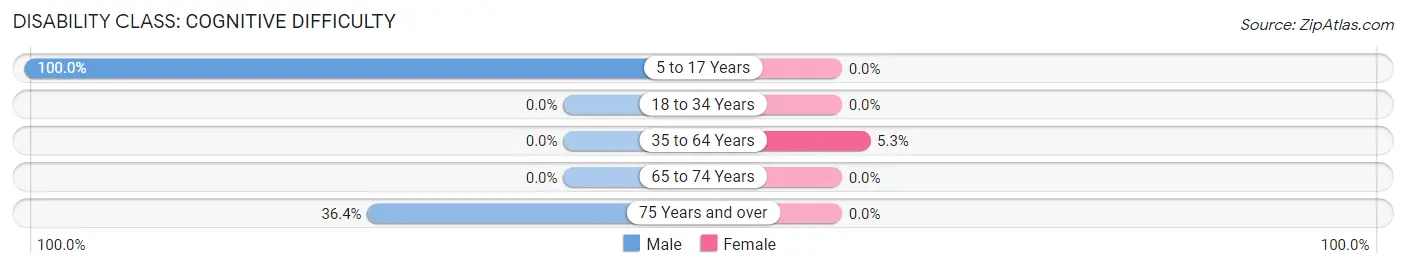
| Age Bracket | Male | Female |
| 5 to 17 Years | 3 (100.0%) | 0 (0.0%) |
| 18 to 34 Years | 0 (0.0%) | 0 (0.0%) |
| 35 to 64 Years | 0 (0.0%) | 1 (5.3%) |
| 65 to 74 Years | 0 (0.0%) | 0 (0.0%) |
| 75 Years and over | 4 (36.4%) | 0 (0.0%) |
Disability Class: Ambulatory Difficulty
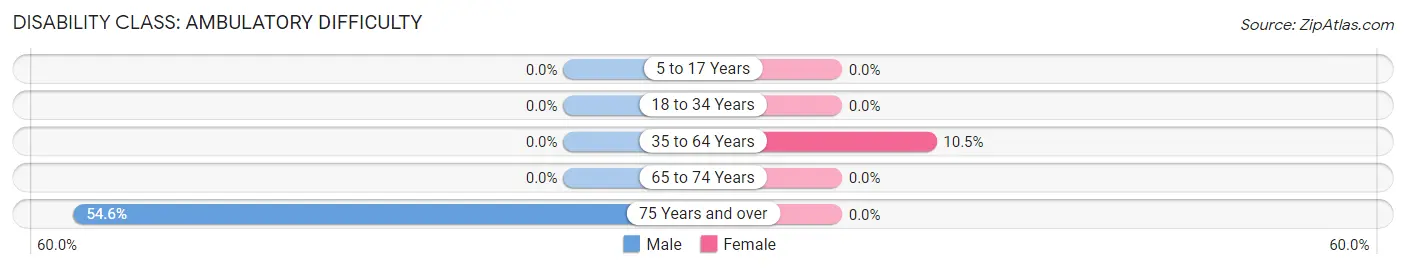
| Age Bracket | Male | Female |
| 5 to 17 Years | 0 (0.0%) | 0 (0.0%) |
| 18 to 34 Years | 0 (0.0%) | 0 (0.0%) |
| 35 to 64 Years | 0 (0.0%) | 2 (10.5%) |
| 65 to 74 Years | 0 (0.0%) | 0 (0.0%) |
| 75 Years and over | 6 (54.5%) | 0 (0.0%) |
Disability Class: Self-Care Difficulty
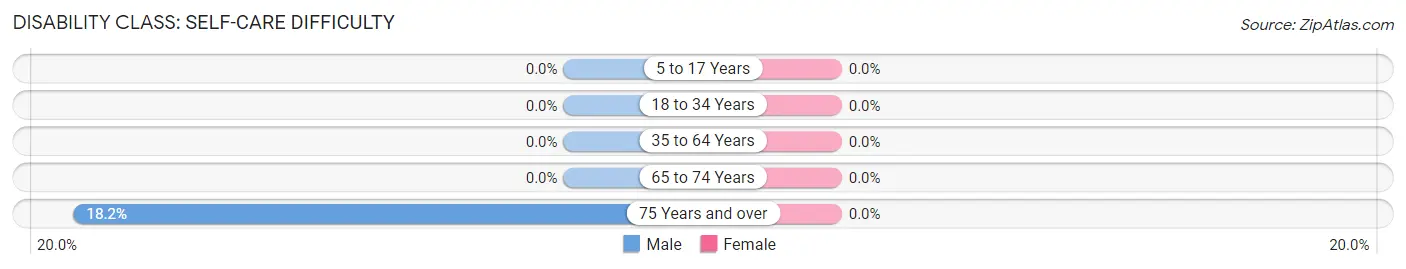
| Age Bracket | Male | Female |
| 5 to 17 Years | 0 (0.0%) | 0 (0.0%) |
| 18 to 34 Years | 0 (0.0%) | 0 (0.0%) |
| 35 to 64 Years | 0 (0.0%) | 0 (0.0%) |
| 65 to 74 Years | 0 (0.0%) | 0 (0.0%) |
| 75 Years and over | 2 (18.2%) | 0 (0.0%) |
Technology Access in Parrott
Computing Device Access in Parrott
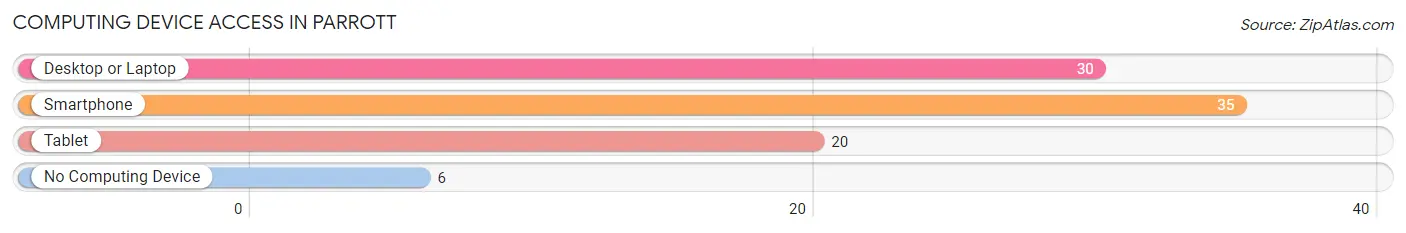
| Device Type | # Households | % Households |
| Desktop or Laptop | 30 | 68.2% |
| Smartphone | 35 | 79.5% |
| Tablet | 20 | 45.5% |
| No Computing Device | 6 | 13.6% |
| Total | 44 | 100.0% |
Internet Access in Parrott
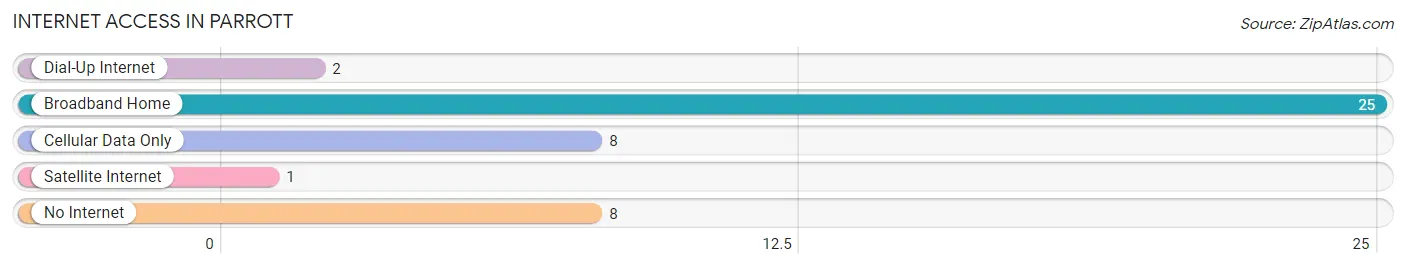
| Internet Type | # Households | % Households |
| Dial-Up Internet | 2 | 4.5% |
| Broadband Home | 25 | 56.8% |
| Cellular Data Only | 8 | 18.2% |
| Satellite Internet | 1 | 2.3% |
| No Internet | 8 | 18.2% |
| Total | 44 | 100.0% |
Parrott Summary
Parrott is a small town located in the southwestern corner of Georgia, in the United States. It is situated in the county of Terrell, and is part of the Albany metropolitan area. The town has a population of approximately 1,000 people, and is known for its rural charm and friendly atmosphere.
History
Parrott was founded in 1883 by a group of settlers from the nearby town of Albany. The town was named after a local family, the Parrott’s, who had a large farm in the area. The town quickly grew, and by the early 1900s it had become a thriving agricultural center. The town was home to several cotton gins, a sawmill, and a grist mill.
In the early 1900s, Parrott was also home to a thriving African-American community. The town had several churches, a school, and a number of businesses. The town was also home to a number of African-American professionals, including doctors, lawyers, and teachers.
In the 1950s, the town began to decline as the local economy shifted away from agriculture. The town’s population began to decline, and many of the businesses closed. In the late 1970s, the town was revitalized by the construction of a new highway, which brought new businesses and residents to the area.
Geography
Parrott is located in the southwestern corner of Georgia, in the county of Terrell. The town is situated on the banks of the Flint River, and is surrounded by rolling hills and forests. The town is located approximately 30 miles from the city of Albany, and is part of the Albany metropolitan area.
The climate in Parrott is humid subtropical, with hot summers and mild winters. The average annual temperature is around 70 degrees Fahrenheit, and the average annual precipitation is around 50 inches.
Economy
The economy of Parrott is largely based on agriculture and tourism. The town is home to several farms, which produce a variety of crops, including cotton, corn, and soybeans. The town is also home to several tourist attractions, including a historic downtown area, a museum, and a number of outdoor recreation areas.
The town is also home to a number of small businesses, including restaurants, shops, and services. The town is served by a number of local and regional transportation services, including bus and rail.
Demographics
As of the 2010 census, the population of Parrott was 1,000 people. The racial makeup of the town was 79.2% White, 17.2% African American, 0.7% Native American, 0.3% Asian, and 2.6% from other races. The median household income was $30,000, and the median family income was $35,000.
Parrott is a small, rural town with a friendly atmosphere and a strong sense of community. The town is home to a diverse population, and is a great place to live and work.
Common Questions
What is the Total Population of Parrott?
Total Population of Parrott is 102.
What is the Total Male Population of Parrott?
Total Male Population of Parrott is 58.
What is the Total Female Population of Parrott?
Total Female Population of Parrott is 44.
What is the Ratio of Males per 100 Females in Parrott?
There are 131.82 Males per 100 Females in Parrott.
What is the Ratio of Females per 100 Males in Parrott?
There are 75.86 Females per 100 Males in Parrott.
What is the Median Population Age in Parrott?
Median Population Age in Parrott is 63.0 Years.
What is the Average Family Size in Parrott
Average Family Size in Parrott is 2.8 People.
What is the Average Household Size in Parrott
Average Household Size in Parrott is 2.3 People.
What is Per Capita Income in Parrott?
Per Capita income in Parrott is $38,085.
What is the Median Family Income in Parrott?
Median Family Income in Parrott is $108,750.
What is the Median Household income in Parrott?
Median Household Income in Parrott is $70,000.
What is Inequality or Gini Index in Parrott?
Inequality or Gini Index in Parrott is 0.38.
How Large is the Labor Force in Parrott?
There are 47 People in the Labor Forcein in Parrott.
What is the Percentage of People in the Labor Force in Parrott?
49.0% of People are in the Labor Force in Parrott.
What is the Unemployment Rate in Parrott?
Unemployment Rate in Parrott is 6.4%.