Oak Park, GA
Oak Park Map
Oak Park Overview
528
TOTAL POPULATION
239
MALE POPULATION
289
FEMALE POPULATION
82.70
MALES / 100 FEMALES
120.92
FEMALES / 100 MALES
31.3
MEDIAN AGE
3.0
AVG FAMILY SIZE
2.6
AVG HOUSEHOLD SIZE
$16,374
PER CAPITA INCOME
$39,432
AVG FAMILY INCOME
$37,727
AVG HOUSEHOLD INCOME
43.7%
WAGE / INCOME GAP [ % ]
56.3¢/ $1
WAGE / INCOME GAP [ $ ]
0.45
INEQUALITY / GINI INDEX
221
LABOR FORCE [ PEOPLE ]
63.3%
PERCENT IN LABOR FORCE
12.7%
UNEMPLOYMENT RATE
Oak Park Area Codes
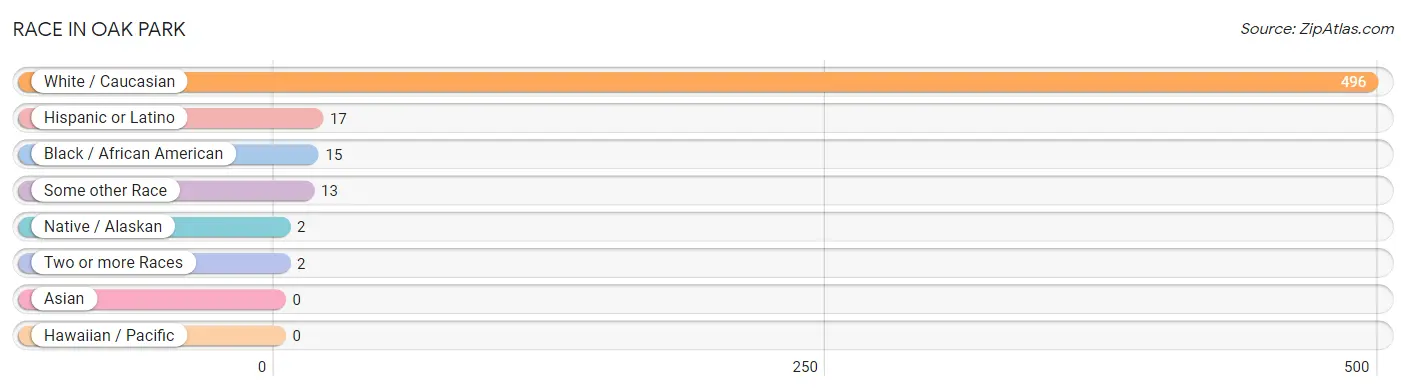
Race in Oak Park
The most populous races in Oak Park are White / Caucasian (496 | 93.9%), Hispanic or Latino (17 | 3.2%), and Black / African American (15 | 2.8%).
| Race | # Population | % Population |
| Asian | 0 | 0.0% |
| Black / African American | 15 | 2.8% |
| Hawaiian / Pacific | 0 | 0.0% |
| Hispanic or Latino | 17 | 3.2% |
| Native / Alaskan | 2 | 0.4% |
| White / Caucasian | 496 | 93.9% |
| Two or more Races | 2 | 0.4% |
| Some other Race | 13 | 2.5% |
| Total | 528 | 100.0% |
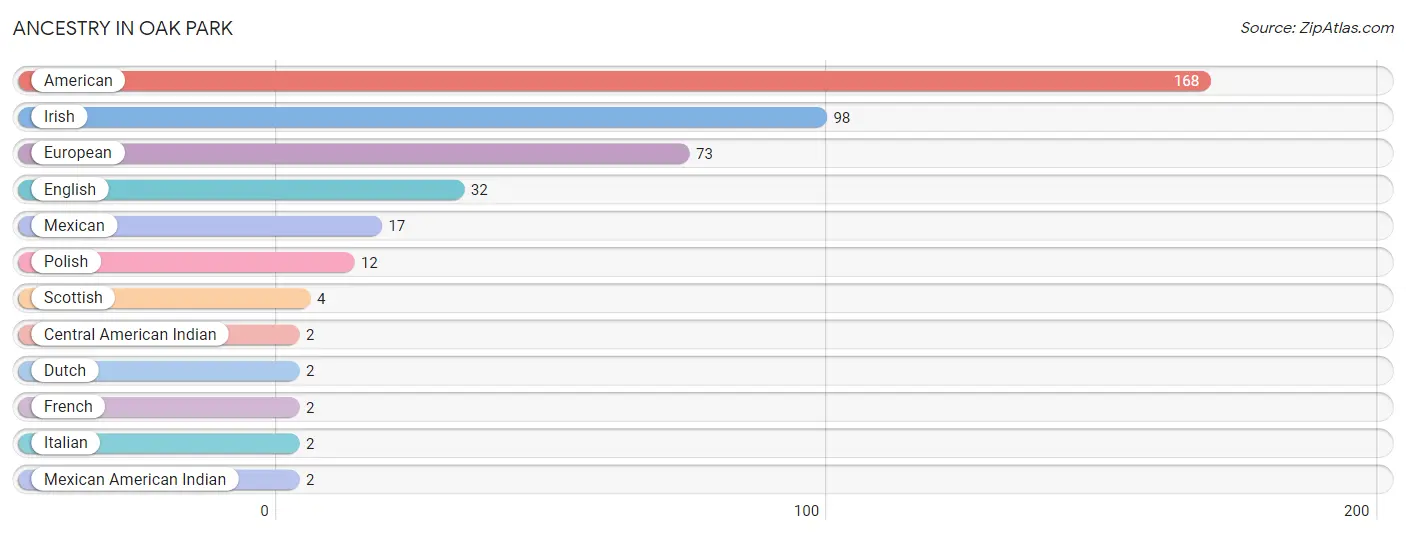
Ancestry in Oak Park
The most populous ancestries reported in Oak Park are American (168 | 31.8%), Irish (98 | 18.6%), European (73 | 13.8%), English (32 | 6.1%), and Mexican (17 | 3.2%), together accounting for 73.5% of all Oak Park residents.
| Ancestry | # Population | % Population |
| American | 168 | 31.8% |
| Central American Indian | 2 | 0.4% |
| Dutch | 2 | 0.4% |
| English | 32 | 6.1% |
| European | 73 | 13.8% |
| French | 2 | 0.4% |
| Irish | 98 | 18.6% |
| Italian | 2 | 0.4% |
| Mexican | 17 | 3.2% |
| Mexican American Indian | 2 | 0.4% |
| Polish | 12 | 2.3% |
| Scottish | 4 | 0.8% | View All 12 Rows |
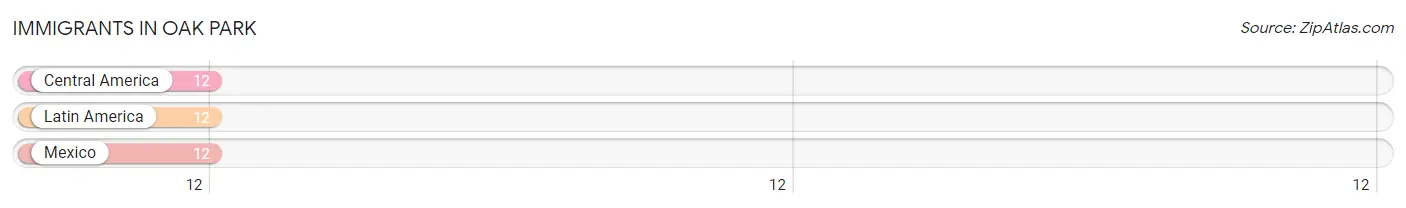
Immigrants in Oak Park
The most numerous immigrant groups reported in Oak Park came from Central America (12 | 2.3%), Latin America (12 | 2.3%), and Mexico (12 | 2.3%), together accounting for 6.8% of all Oak Park residents.
| Immigration Origin | # Population | % Population |
| Central America | 12 | 2.3% |
| Latin America | 12 | 2.3% |
| Mexico | 12 | 2.3% | View All 3 Rows |
Sex and Age in Oak Park
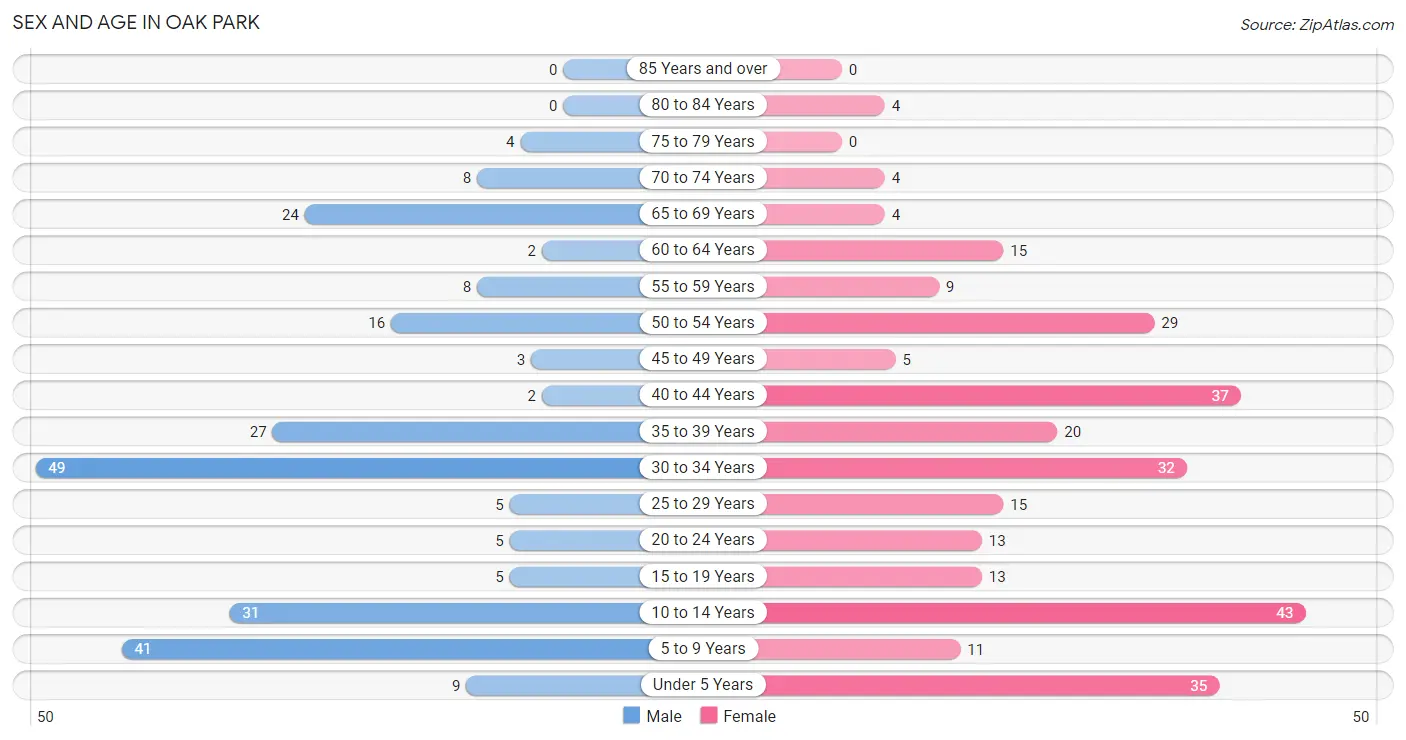
Sex and Age in Oak Park
The most populous age groups in Oak Park are 30 to 34 Years (49 | 20.5%) for men and 10 to 14 Years (43 | 14.9%) for women.
| Age Bracket | Male | Female |
| Under 5 Years | 9 (3.8%) | 35 (12.1%) |
| 5 to 9 Years | 41 (17.2%) | 11 (3.8%) |
| 10 to 14 Years | 31 (13.0%) | 43 (14.9%) |
| 15 to 19 Years | 5 (2.1%) | 13 (4.5%) |
| 20 to 24 Years | 5 (2.1%) | 13 (4.5%) |
| 25 to 29 Years | 5 (2.1%) | 15 (5.2%) |
| 30 to 34 Years | 49 (20.5%) | 32 (11.1%) |
| 35 to 39 Years | 27 (11.3%) | 20 (6.9%) |
| 40 to 44 Years | 2 (0.8%) | 37 (12.8%) |
| 45 to 49 Years | 3 (1.3%) | 5 (1.7%) |
| 50 to 54 Years | 16 (6.7%) | 29 (10.0%) |
| 55 to 59 Years | 8 (3.4%) | 9 (3.1%) |
| 60 to 64 Years | 2 (0.8%) | 15 (5.2%) |
| 65 to 69 Years | 24 (10.0%) | 4 (1.4%) |
| 70 to 74 Years | 8 (3.4%) | 4 (1.4%) |
| 75 to 79 Years | 4 (1.7%) | 0 (0.0%) |
| 80 to 84 Years | 0 (0.0%) | 4 (1.4%) |
| 85 Years and over | 0 (0.0%) | 0 (0.0%) |
| Total | 239 (100.0%) | 289 (100.0%) |
Families and Households in Oak Park
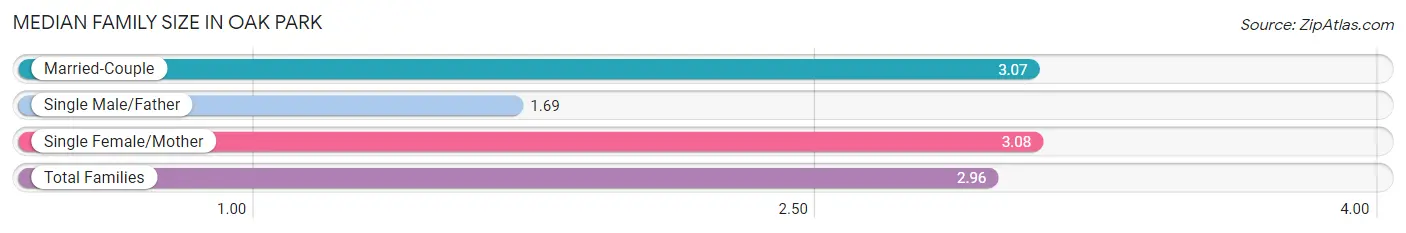
Median Family Size in Oak Park
The median family size in Oak Park is 2.96 persons per family, with single female/mother families (40 | 25.2%) accounting for the largest median family size of 3.08 persons per family. On the other hand, single male/father families (13 | 8.2%) represent the smallest median family size with 1.69 persons per family.
| Family Type | # Families | Family Size |
| Married-Couple | 106 (66.7%) | 3.07 |
| Single Male/Father | 13 (8.2%) | 1.69 |
| Single Female/Mother | 40 (25.2%) | 3.08 |
| Total Families | 159 (100.0%) | 2.96 |
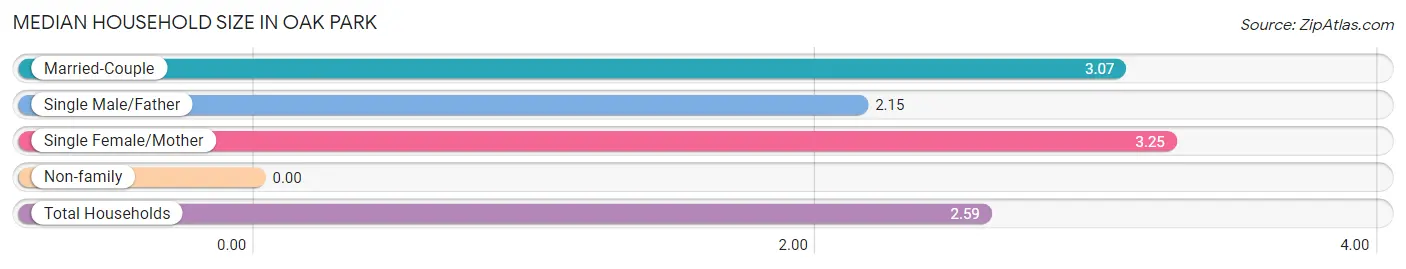
Median Household Size in Oak Park
| Household Type | # Households | Household Size |
| Married-Couple | 106 (52.0%) | 3.07 |
| Single Male/Father | 13 (6.4%) | 2.15 |
| Single Female/Mother | 40 (19.6%) | 3.25 |
| Non-family | 45 (22.1%) | - |
| Total Households | 204 (100.0%) | 2.59 |
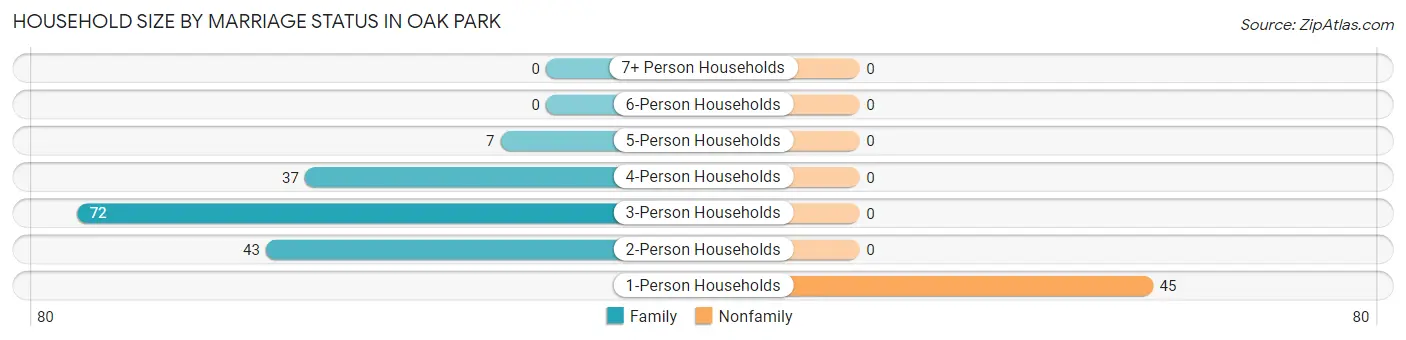
Household Size by Marriage Status in Oak Park
Out of a total of 204 households in Oak Park, 159 (77.9%) are family households, while 45 (22.1%) are nonfamily households. The most numerous type of family households are 3-person households, comprising 72, and the most common type of nonfamily households are 1-person households, comprising 45.
| Household Size | Family Households | Nonfamily Households |
| 1-Person Households | - | 45 (22.1%) |
| 2-Person Households | 43 (21.1%) | 0 (0.0%) |
| 3-Person Households | 72 (35.3%) | 0 (0.0%) |
| 4-Person Households | 37 (18.1%) | 0 (0.0%) |
| 5-Person Households | 7 (3.4%) | 0 (0.0%) |
| 6-Person Households | 0 (0.0%) | 0 (0.0%) |
| 7+ Person Households | 0 (0.0%) | 0 (0.0%) |
| Total | 159 (77.9%) | 45 (22.1%) |
Female Fertility in Oak Park
Fertility by Age in Oak Park
Average fertility rate in Oak Park is 40.0 births per 1,000 women. Women in the age bracket of 20 to 34 years have the highest fertility rate with 100.0 births per 1,000 women. Women in the age bracket of 20 to 34 years acount for 100.0% of all women with births.
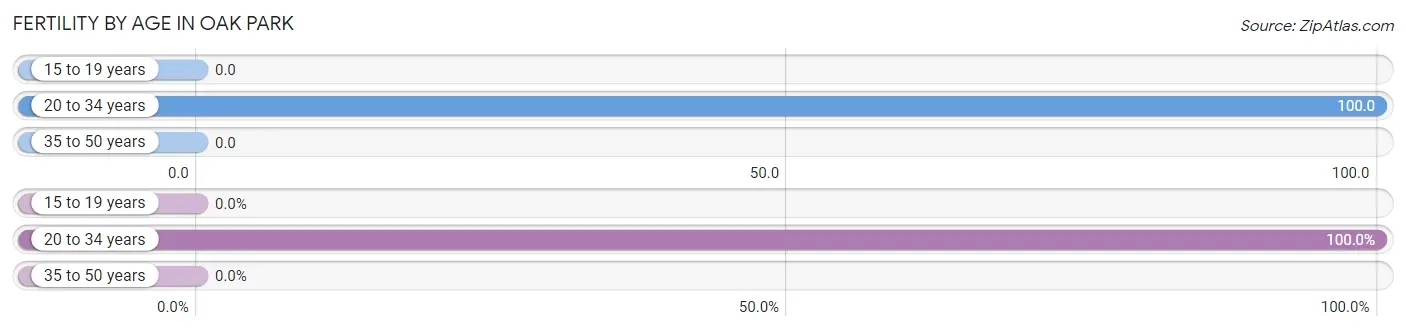
| Age Bracket | Women with Births | Births / 1,000 Women |
| 15 to 19 years | 0 (0.0%) | 0.0 |
| 20 to 34 years | 6 (100.0%) | 100.0 |
| 35 to 50 years | 0 (0.0%) | 0.0 |
| Total | 6 (100.0%) | 40.0 |
Fertility by Age by Marriage Status in Oak Park
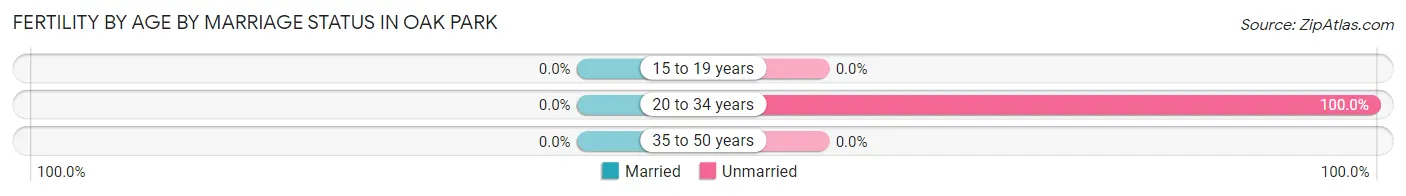
| Age Bracket | Married | Unmarried |
| 15 to 19 years | 0 (0.0%) | 0 (0.0%) |
| 20 to 34 years | 0 (0.0%) | 6 (100.0%) |
| 35 to 50 years | 0 (0.0%) | 0 (0.0%) |
| Total | 0 (0.0%) | 6 (100.0%) |
Fertility by Education in Oak Park
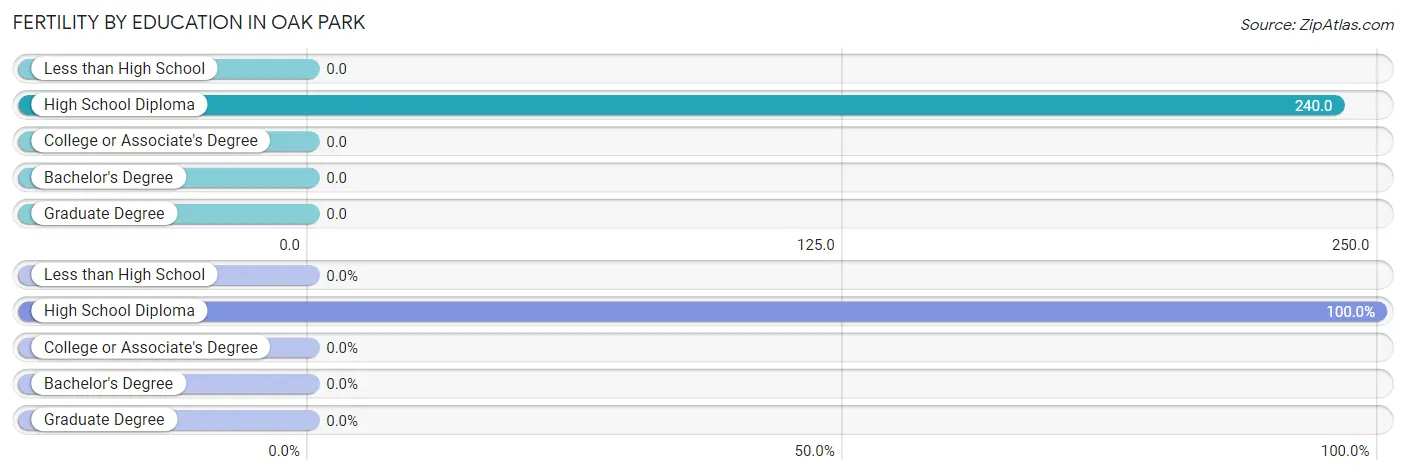
| Educational Attainment | Women with Births | Births / 1,000 Women |
| Less than High School | 0 (0.0%) | 0.0 |
| High School Diploma | 6 (100.0%) | 240.0 |
| College or Associate's Degree | 0 (0.0%) | 0.0 |
| Bachelor's Degree | 0 (0.0%) | 0.0 |
| Graduate Degree | 0 (0.0%) | 0.0 |
| Total | 6 (100.0%) | 40.0 |
Fertility by Education by Marriage Status in Oak Park
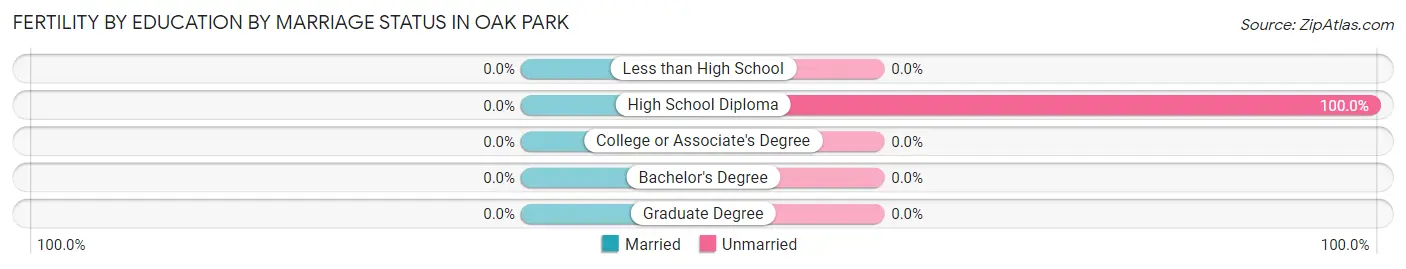
| Educational Attainment | Married | Unmarried |
| Less than High School | 0 (0.0%) | 0 (0.0%) |
| High School Diploma | 0 (0.0%) | 6 (100.0%) |
| College or Associate's Degree | 0 (0.0%) | 0 (0.0%) |
| Bachelor's Degree | 0 (0.0%) | 0 (0.0%) |
| Graduate Degree | 0 (0.0%) | 0 (0.0%) |
| Total | 0 (0.0%) | 6 (100.0%) |
Income in Oak Park
Income Overview in Oak Park
Per Capita Income in Oak Park is $16,374, while median incomes of families and households are $39,432 and $37,727 respectively.
| Characteristic | Number | Measure |
| Per Capita Income | 528 | $16,374 |
| Median Family Income | 159 | $39,432 |
| Mean Family Income | 159 | $48,270 |
| Median Household Income | 204 | $37,727 |
| Mean Household Income | 204 | $41,192 |
| Income Deficit | 159 | $0 |
| Wage / Income Gap (%) | 528 | 43.68% |
| Wage / Income Gap ($) | 528 | 56.32¢ per $1 |
| Gini / Inequality Index | 528 | 0.45 |
Earnings by Sex in Oak Park
Average Earnings in Oak Park are $26,613, $37,543 for men and $21,146 for women, a difference of 43.7%.
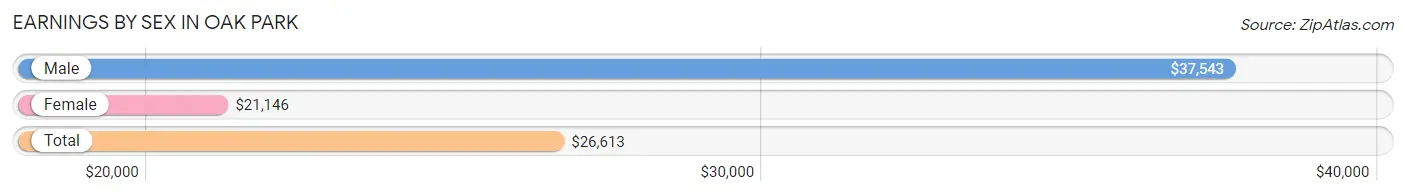
| Sex | Number | Average Earnings |
| Male | 103 (47.7%) | $37,543 |
| Female | 113 (52.3%) | $21,146 |
| Total | 216 (100.0%) | $26,613 |
Earnings by Sex by Income Bracket in Oak Park
The most common earnings brackets in Oak Park are $35,000 to $39,999 for men (32 | 31.1%) and $2,499 or less for women (24 | 21.2%).
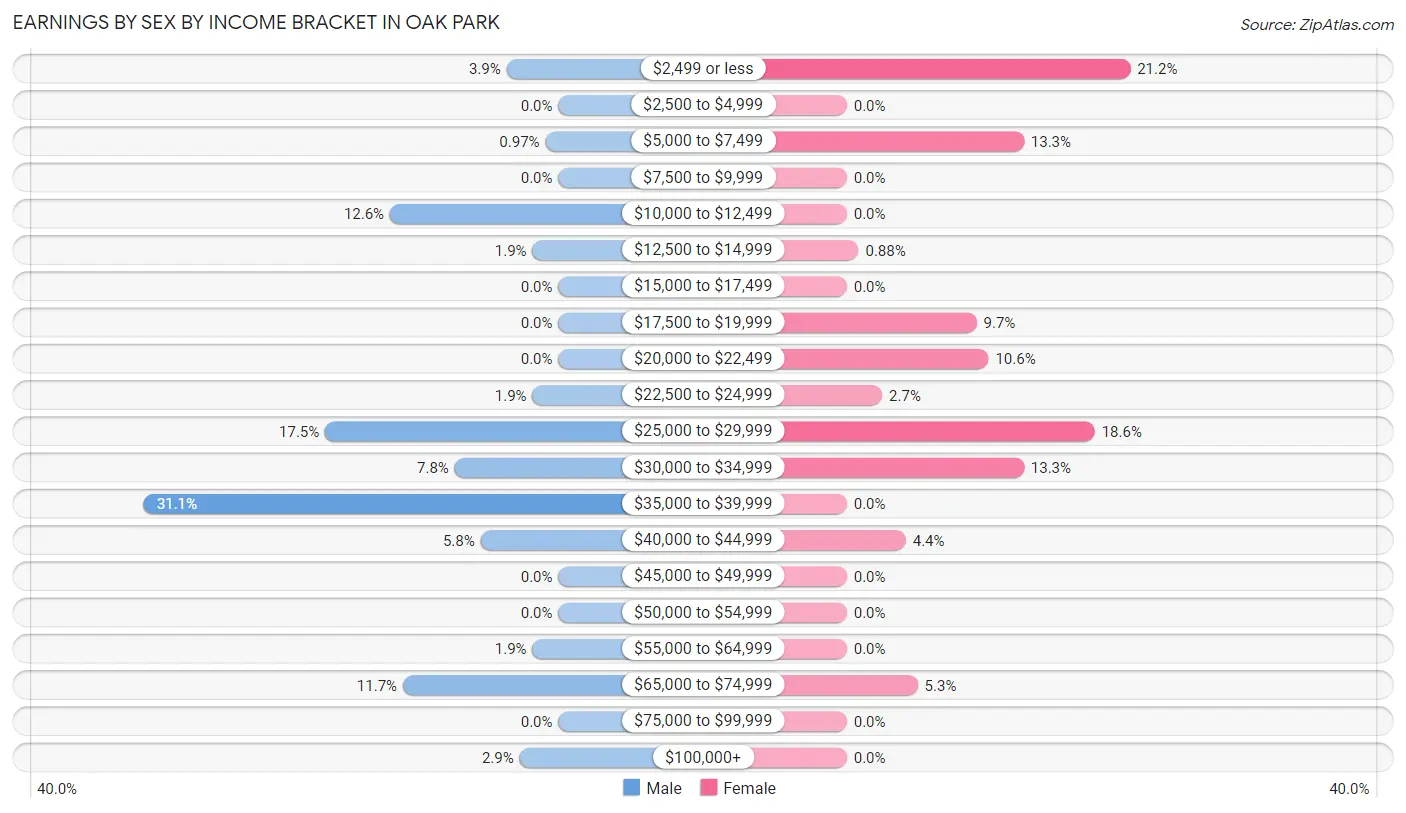
| Income | Male | Female |
| $2,499 or less | 4 (3.9%) | 24 (21.2%) |
| $2,500 to $4,999 | 0 (0.0%) | 0 (0.0%) |
| $5,000 to $7,499 | 1 (1.0%) | 15 (13.3%) |
| $7,500 to $9,999 | 0 (0.0%) | 0 (0.0%) |
| $10,000 to $12,499 | 13 (12.6%) | 0 (0.0%) |
| $12,500 to $14,999 | 2 (1.9%) | 1 (0.9%) |
| $15,000 to $17,499 | 0 (0.0%) | 0 (0.0%) |
| $17,500 to $19,999 | 0 (0.0%) | 11 (9.7%) |
| $20,000 to $22,499 | 0 (0.0%) | 12 (10.6%) |
| $22,500 to $24,999 | 2 (1.9%) | 3 (2.6%) |
| $25,000 to $29,999 | 18 (17.5%) | 21 (18.6%) |
| $30,000 to $34,999 | 8 (7.8%) | 15 (13.3%) |
| $35,000 to $39,999 | 32 (31.1%) | 0 (0.0%) |
| $40,000 to $44,999 | 6 (5.8%) | 5 (4.4%) |
| $45,000 to $49,999 | 0 (0.0%) | 0 (0.0%) |
| $50,000 to $54,999 | 0 (0.0%) | 0 (0.0%) |
| $55,000 to $64,999 | 2 (1.9%) | 0 (0.0%) |
| $65,000 to $74,999 | 12 (11.7%) | 6 (5.3%) |
| $75,000 to $99,999 | 0 (0.0%) | 0 (0.0%) |
| $100,000+ | 3 (2.9%) | 0 (0.0%) |
| Total | 103 (100.0%) | 113 (100.0%) |
Earnings by Sex by Educational Attainment in Oak Park
Average earnings in Oak Park are $37,759 for men and $22,000 for women, a difference of 41.7%. Men with an educational attainment of college or associate's degree enjoy the highest average annual earnings of $67,750, while those with high school diploma education earn the least with $26,471. Women with an educational attainment of college or associate's degree earn the most with the average annual earnings of $25,250, while those with less than high school education have the smallest earnings of $2,499.
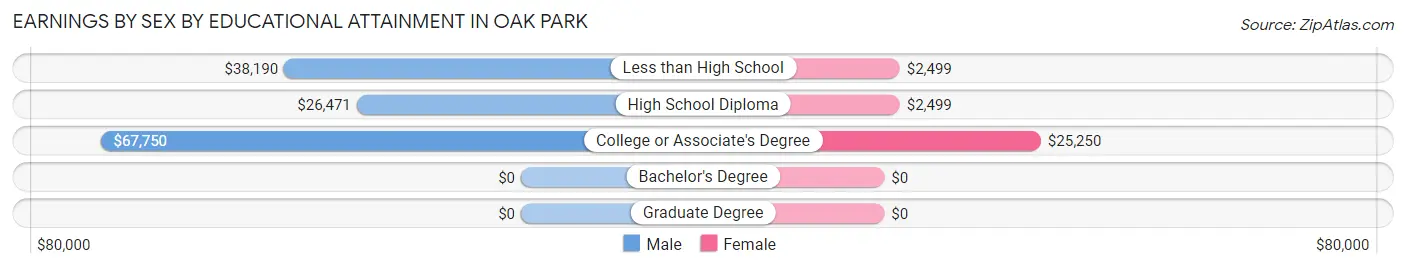
| Educational Attainment | Male Income | Female Income |
| Less than High School | $38,190 | $2,499 |
| High School Diploma | $26,471 | $2,499 |
| College or Associate's Degree | $67,750 | $25,250 |
| Bachelor's Degree | - | - |
| Graduate Degree | - | - |
| Total | $37,759 | $22,000 |
Family Income in Oak Park
Family Income Brackets in Oak Park
According to the Oak Park family income data, there are 55 families falling into the $35,000 to $49,999 income range, which is the most common income bracket and makes up 34.6% of all families.
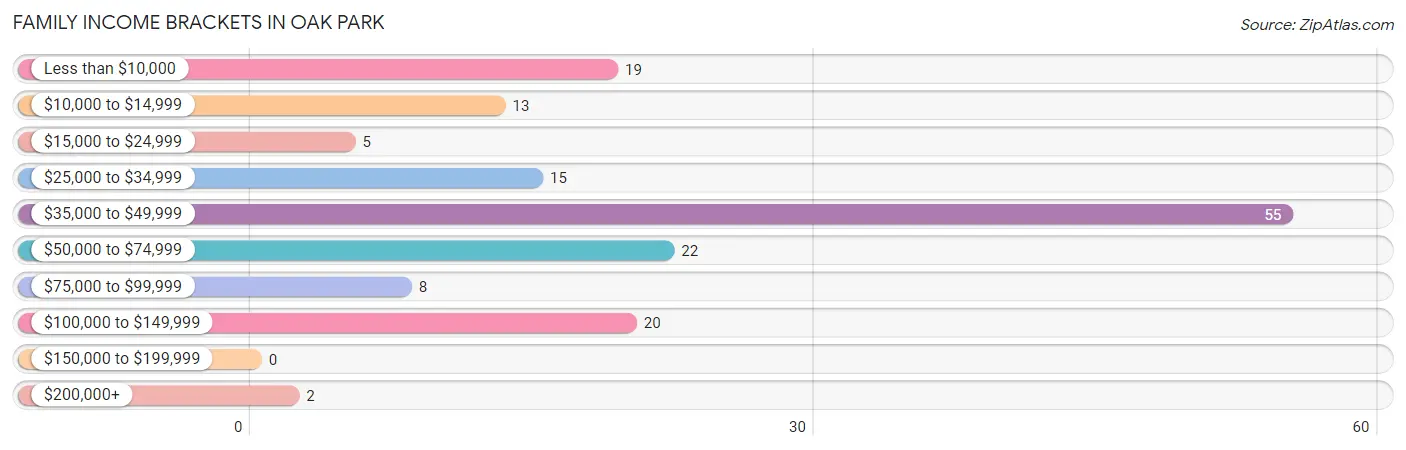
| Income Bracket | # Families | % Families |
| Less than $10,000 | 19 | 11.9% |
| $10,000 to $14,999 | 13 | 8.2% |
| $15,000 to $24,999 | 5 | 3.1% |
| $25,000 to $34,999 | 15 | 9.4% |
| $35,000 to $49,999 | 55 | 34.6% |
| $50,000 to $74,999 | 22 | 13.8% |
| $75,000 to $99,999 | 8 | 5.0% |
| $100,000 to $149,999 | 20 | 12.6% |
| $150,000 to $199,999 | 0 | 0.0% |
| $200,000+ | 2 | 1.3% |
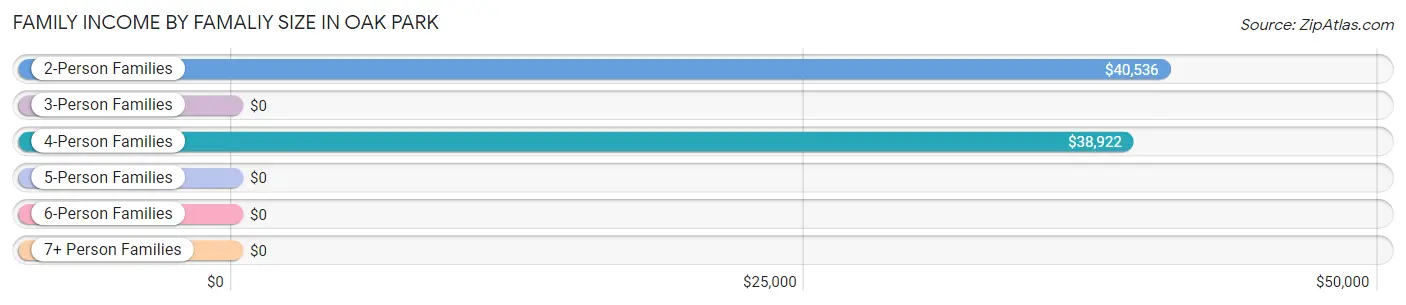
Family Income by Famaliy Size in Oak Park
2-person families (56 | 35.2%) account for the highest median family income in Oak Park with $40,536 per family, while 2-person families (56 | 35.2%) have the highest median income of $20,268 per family member.
| Income Bracket | # Families | Median Income |
| 2-Person Families | 56 (35.2%) | $40,536 |
| 3-Person Families | 63 (39.6%) | $0 |
| 4-Person Families | 33 (20.7%) | $38,922 |
| 5-Person Families | 7 (4.4%) | $0 |
| 6-Person Families | 0 (0.0%) | $0 |
| 7+ Person Families | 0 (0.0%) | $0 |
| Total | 159 (100.0%) | $39,432 |
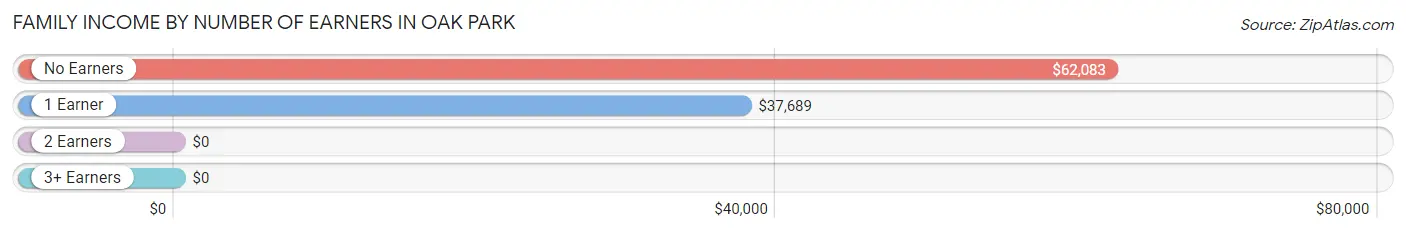
Family Income by Number of Earners in Oak Park
| Number of Earners | # Families | Median Income |
| No Earners | 13 (8.2%) | $62,083 |
| 1 Earner | 107 (67.3%) | $37,689 |
| 2 Earners | 34 (21.4%) | $0 |
| 3+ Earners | 5 (3.1%) | $0 |
| Total | 159 (100.0%) | $39,432 |
Household Income in Oak Park
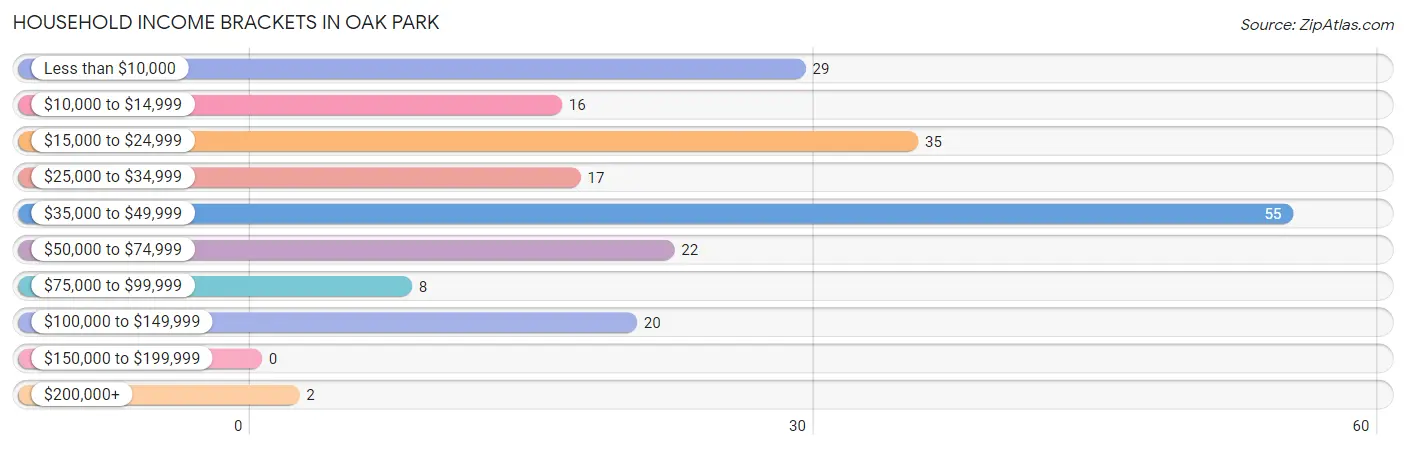
Household Income Brackets in Oak Park
With 55 households falling in the category, the $35,000 to $49,999 income range is the most frequent in Oak Park, accounting for 27.0% of all households.
| Income Bracket | # Households | % Households |
| Less than $10,000 | 29 | 14.2% |
| $10,000 to $14,999 | 16 | 7.8% |
| $15,000 to $24,999 | 35 | 17.2% |
| $25,000 to $34,999 | 17 | 8.3% |
| $35,000 to $49,999 | 55 | 27.0% |
| $50,000 to $74,999 | 22 | 10.8% |
| $75,000 to $99,999 | 8 | 3.9% |
| $100,000 to $149,999 | 20 | 9.8% |
| $150,000 to $199,999 | 0 | 0.0% |
| $200,000+ | 2 | 1.0% |
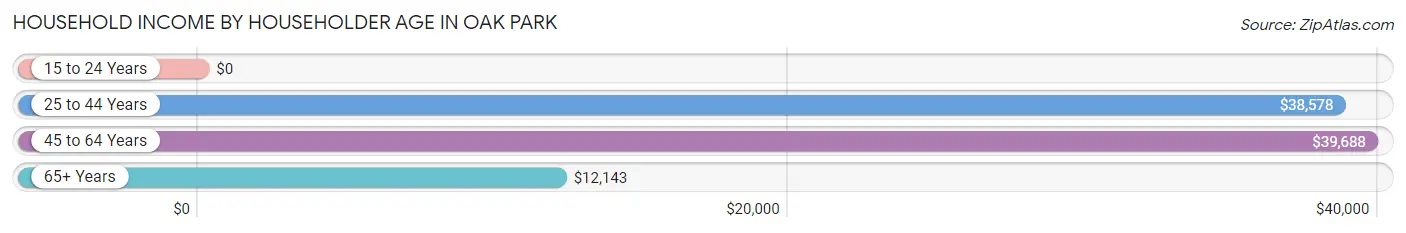
Household Income by Householder Age in Oak Park
The median household income in Oak Park is $37,727, with the highest median household income of $39,688 found in the 45 to 64 years age bracket for the primary householder. A total of 47 households (23.0%) fall into this category. Meanwhile, the 15 to 24 years age bracket for the primary householder has the lowest median household income of $0, with 4 households (2.0%) in this group.
| Income Bracket | # Households | Median Income |
| 15 to 24 Years | 4 (2.0%) | $0 |
| 25 to 44 Years | 113 (55.4%) | $38,578 |
| 45 to 64 Years | 47 (23.0%) | $39,688 |
| 65+ Years | 40 (19.6%) | $12,143 |
| Total | 204 (100.0%) | $37,727 |
Poverty in Oak Park
Income Below Poverty by Sex and Age in Oak Park
With 27.2% poverty level for males and 24.9% for females among the residents of Oak Park, under 5 year old males and under 5 year old females are the most vulnerable to poverty, with 9 males (100.0%) and 35 females (100.0%) in their respective age groups living below the poverty level.
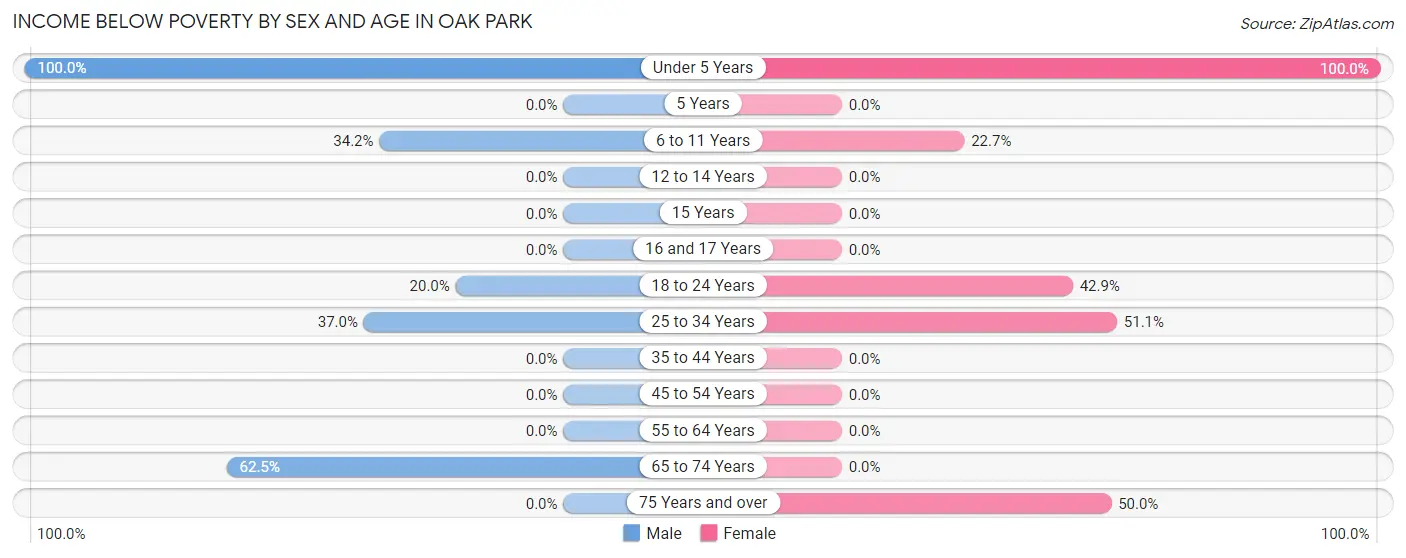
| Age Bracket | Male | Female |
| Under 5 Years | 9 (100.0%) | 35 (100.0%) |
| 5 Years | 0 (0.0%) | 0 (0.0%) |
| 6 to 11 Years | 14 (34.2%) | 5 (22.7%) |
| 12 to 14 Years | 0 (0.0%) | 0 (0.0%) |
| 15 Years | 0 (0.0%) | 0 (0.0%) |
| 16 and 17 Years | 0 (0.0%) | 0 (0.0%) |
| 18 to 24 Years | 2 (20.0%) | 6 (42.9%) |
| 25 to 34 Years | 20 (37.0%) | 24 (51.1%) |
| 35 to 44 Years | 0 (0.0%) | 0 (0.0%) |
| 45 to 54 Years | 0 (0.0%) | 0 (0.0%) |
| 55 to 64 Years | 0 (0.0%) | 0 (0.0%) |
| 65 to 74 Years | 20 (62.5%) | 0 (0.0%) |
| 75 Years and over | 0 (0.0%) | 2 (50.0%) |
| Total | 65 (27.2%) | 72 (24.9%) |
Income Above Poverty by Sex and Age in Oak Park
According to the poverty statistics in Oak Park, males aged 12 to 14 years and females aged 12 to 14 years are the age groups that are most secure financially, with 100.0% of males and 100.0% of females in these age groups living above the poverty line.
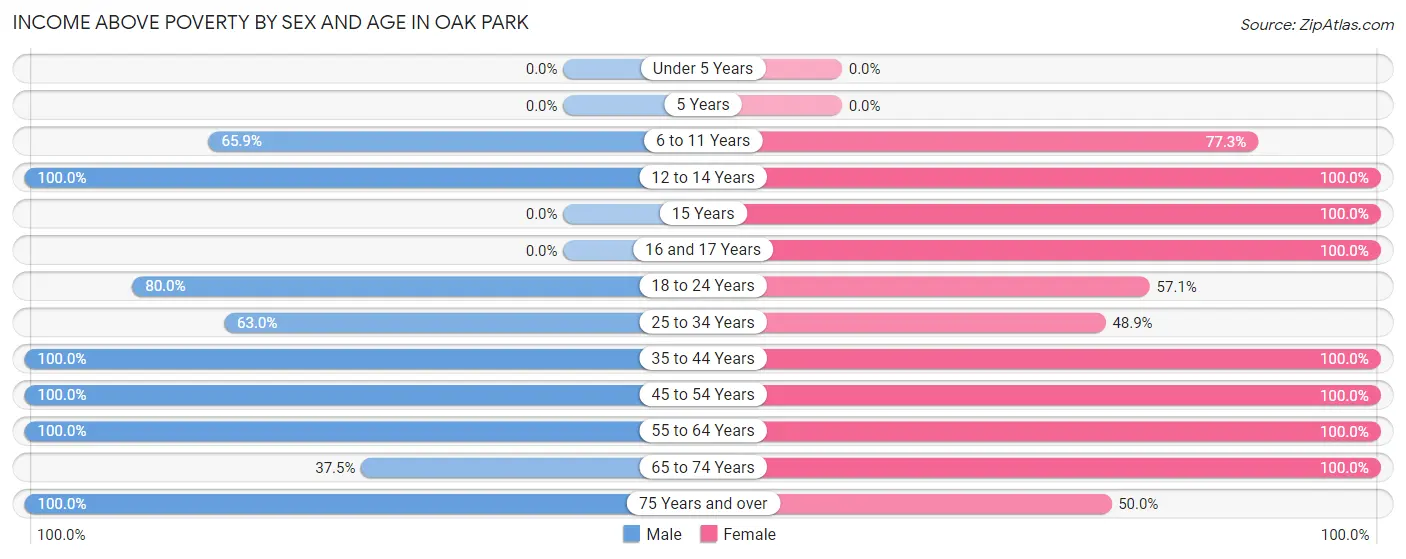
| Age Bracket | Male | Female |
| Under 5 Years | 0 (0.0%) | 0 (0.0%) |
| 5 Years | 0 (0.0%) | 0 (0.0%) |
| 6 to 11 Years | 27 (65.8%) | 17 (77.3%) |
| 12 to 14 Years | 31 (100.0%) | 32 (100.0%) |
| 15 Years | 0 (0.0%) | 9 (100.0%) |
| 16 and 17 Years | 0 (0.0%) | 3 (100.0%) |
| 18 to 24 Years | 8 (80.0%) | 8 (57.1%) |
| 25 to 34 Years | 34 (63.0%) | 23 (48.9%) |
| 35 to 44 Years | 29 (100.0%) | 57 (100.0%) |
| 45 to 54 Years | 19 (100.0%) | 34 (100.0%) |
| 55 to 64 Years | 10 (100.0%) | 24 (100.0%) |
| 65 to 74 Years | 12 (37.5%) | 8 (100.0%) |
| 75 Years and over | 4 (100.0%) | 2 (50.0%) |
| Total | 174 (72.8%) | 217 (75.1%) |
Income Below Poverty Among Married-Couple Families in Oak Park
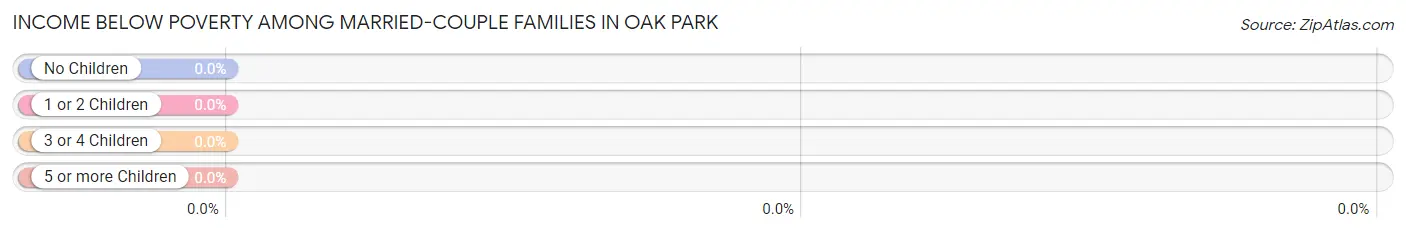
| Children | Above Poverty | Below Poverty |
| No Children | 44 (100.0%) | 0 (0.0%) |
| 1 or 2 Children | 56 (100.0%) | 0 (0.0%) |
| 3 or 4 Children | 6 (100.0%) | 0 (0.0%) |
| 5 or more Children | 0 (0.0%) | 0 (0.0%) |
| Total | 106 (100.0%) | 0 (0.0%) |
Income Below Poverty Among Single-Parent Households in Oak Park
According to the poverty data in Oak Park, 100.0% or 13 single-father households and 60.0% or 24 single-mother households are living below the poverty line. Among single-father households, those with 1 or 2 children have the highest poverty rate, with 13 households (100.0%) experiencing poverty. Likewise, among single-mother households, those with 1 or 2 children have the highest poverty rate, with 24 households (75.0%) falling below the poverty line.
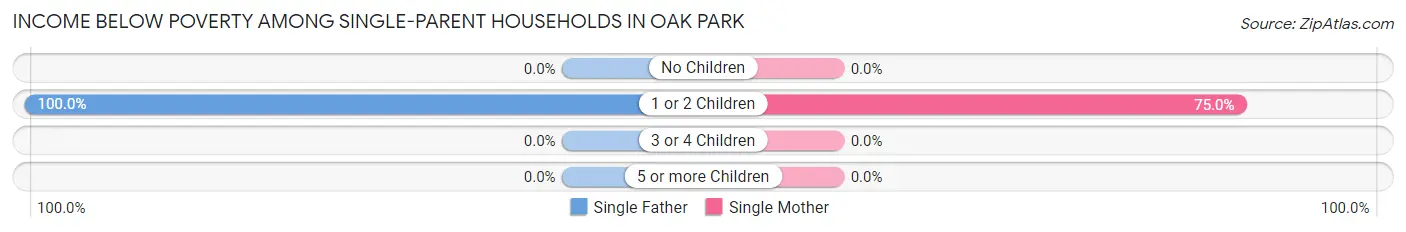
| Children | Single Father | Single Mother |
| No Children | 0 (0.0%) | 0 (0.0%) |
| 1 or 2 Children | 13 (100.0%) | 24 (75.0%) |
| 3 or 4 Children | 0 (0.0%) | 0 (0.0%) |
| 5 or more Children | 0 (0.0%) | 0 (0.0%) |
| Total | 13 (100.0%) | 24 (60.0%) |
Income Below Poverty Among Married-Couple vs Single-Parent Households in Oak Park
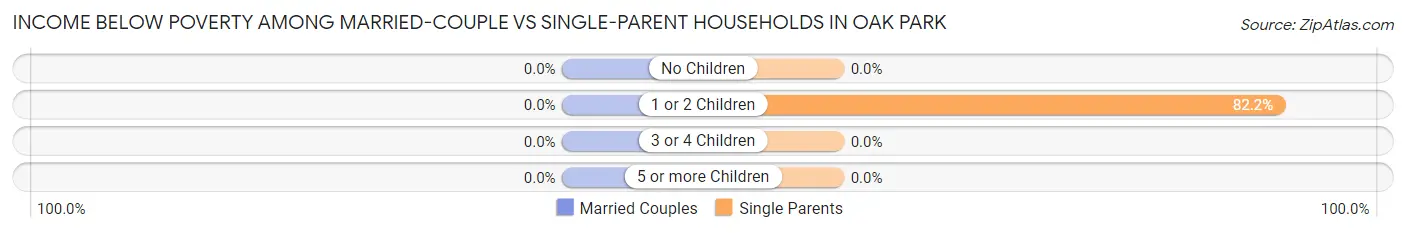
| Children | Married-Couple Families | Single-Parent Households |
| No Children | 0 (0.0%) | 0 (0.0%) |
| 1 or 2 Children | 0 (0.0%) | 37 (82.2%) |
| 3 or 4 Children | 0 (0.0%) | 0 (0.0%) |
| 5 or more Children | 0 (0.0%) | 0 (0.0%) |
| Total | 0 (0.0%) | 37 (69.8%) |
Employment Characteristics in Oak Park
Employment by Class of Employer in Oak Park
Among the 183 employed individuals in Oak Park, private company employees (150 | 82.0%), self-employed (not incorporated) (22 | 12.0%), and local government employees (7 | 3.8%) make up the most common classes of employment.
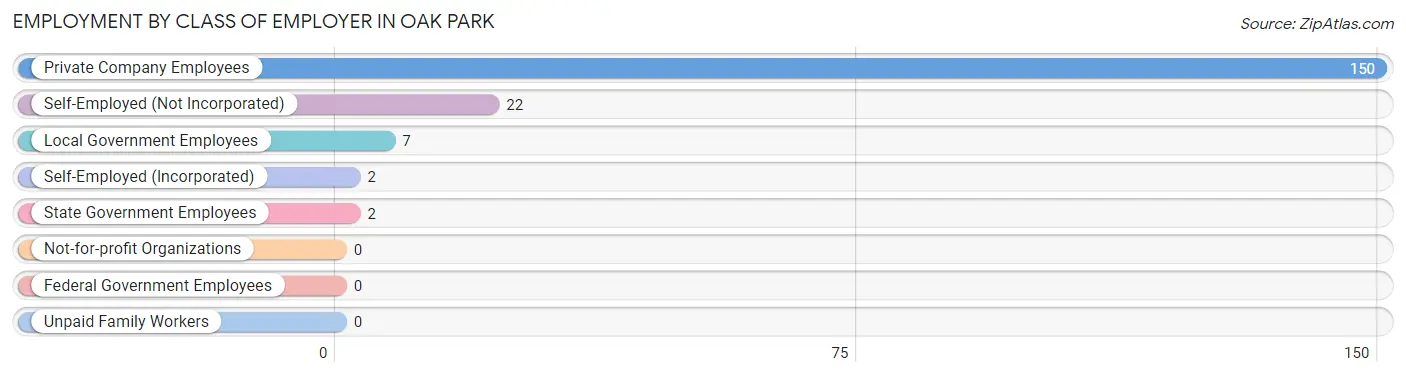
| Employer Class | # Employees | % Employees |
| Private Company Employees | 150 | 82.0% |
| Self-Employed (Incorporated) | 2 | 1.1% |
| Self-Employed (Not Incorporated) | 22 | 12.0% |
| Not-for-profit Organizations | 0 | 0.0% |
| Local Government Employees | 7 | 3.8% |
| State Government Employees | 2 | 1.1% |
| Federal Government Employees | 0 | 0.0% |
| Unpaid Family Workers | 0 | 0.0% |
| Total | 183 | 100.0% |
Employment Status by Age in Oak Park
According to the labor force statistics for Oak Park, out of the total population over 16 years of age (349), 63.3% or 221 individuals are in the labor force, with 12.7% or 28 of them unemployed. The age group with the highest labor force participation rate is 25 to 29 years, with 100.0% or 20 individuals in the labor force. Within the labor force, the 25 to 29 years age range has the highest percentage of unemployed individuals, with 50.0% or 10 of them being unemployed.
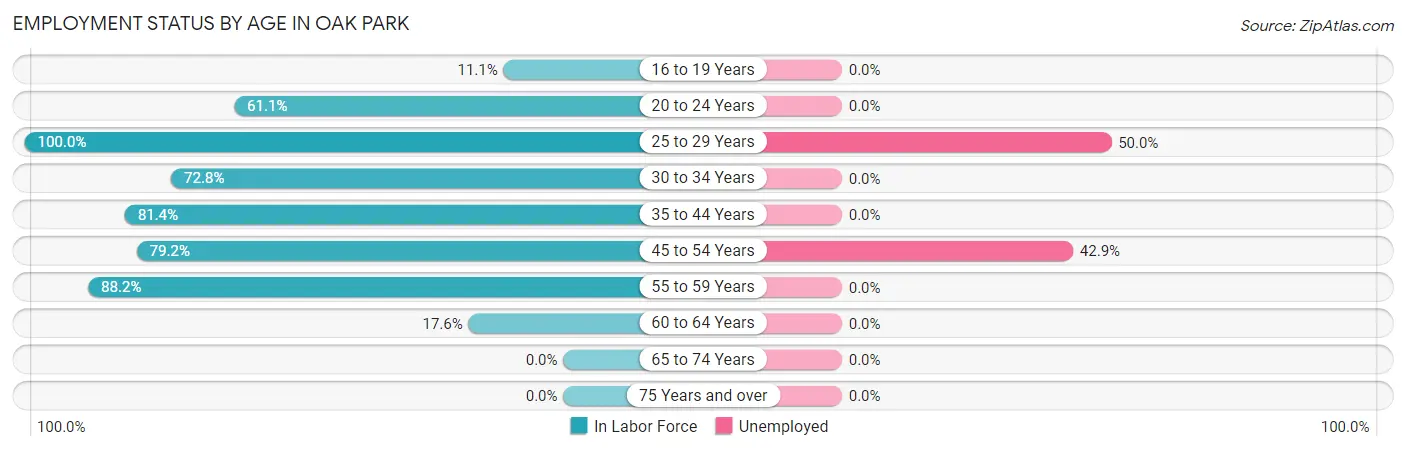
| Age Bracket | In Labor Force | Unemployed |
| 16 to 19 Years | 1 (11.1%) | 0 (0.0%) |
| 20 to 24 Years | 11 (61.1%) | 0 (0.0%) |
| 25 to 29 Years | 20 (100.0%) | 10 (50.0%) |
| 30 to 34 Years | 59 (72.8%) | 0 (0.0%) |
| 35 to 44 Years | 70 (81.4%) | 0 (0.0%) |
| 45 to 54 Years | 42 (79.2%) | 18 (42.9%) |
| 55 to 59 Years | 15 (88.2%) | 0 (0.0%) |
| 60 to 64 Years | 3 (17.6%) | 0 (0.0%) |
| 65 to 74 Years | 0 (0.0%) | 0 (0.0%) |
| 75 Years and over | 0 (0.0%) | 0 (0.0%) |
| Total | 221 (63.3%) | 28 (12.7%) |
Employment Status by Educational Attainment in Oak Park
According to labor force statistics for Oak Park, 76.3% of individuals (209) out of the total population between 25 and 64 years of age (274) are in the labor force, with 13.4% or 28 of them being unemployed. The group with the highest labor force participation rate are those with the educational attainment of college / associate degree, with 81.1% or 77 individuals in the labor force. Within the labor force, individuals with high school diploma education have the highest percentage of unemployment, with 23.8% or 10 of them being unemployed.
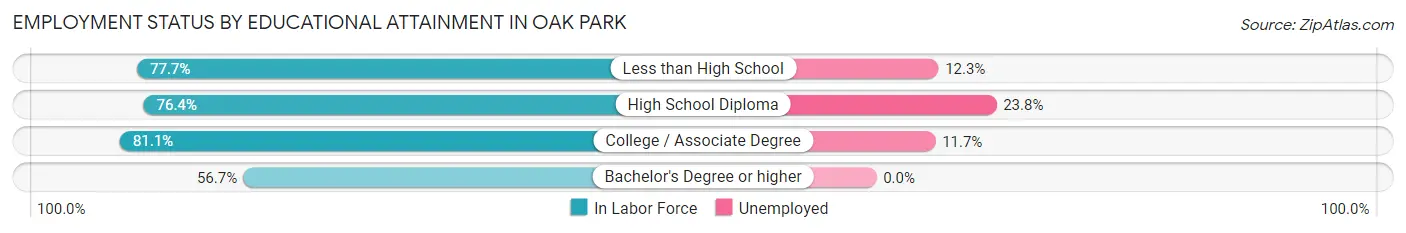
| Educational Attainment | In Labor Force | Unemployed |
| Less than High School | 73 (77.7%) | 12 (12.3%) |
| High School Diploma | 42 (76.4%) | 13 (23.8%) |
| College / Associate Degree | 77 (81.1%) | 11 (11.7%) |
| Bachelor's Degree or higher | 17 (56.7%) | 0 (0.0%) |
| Total | 209 (76.3%) | 37 (13.4%) |
Employment Occupations by Sex in Oak Park
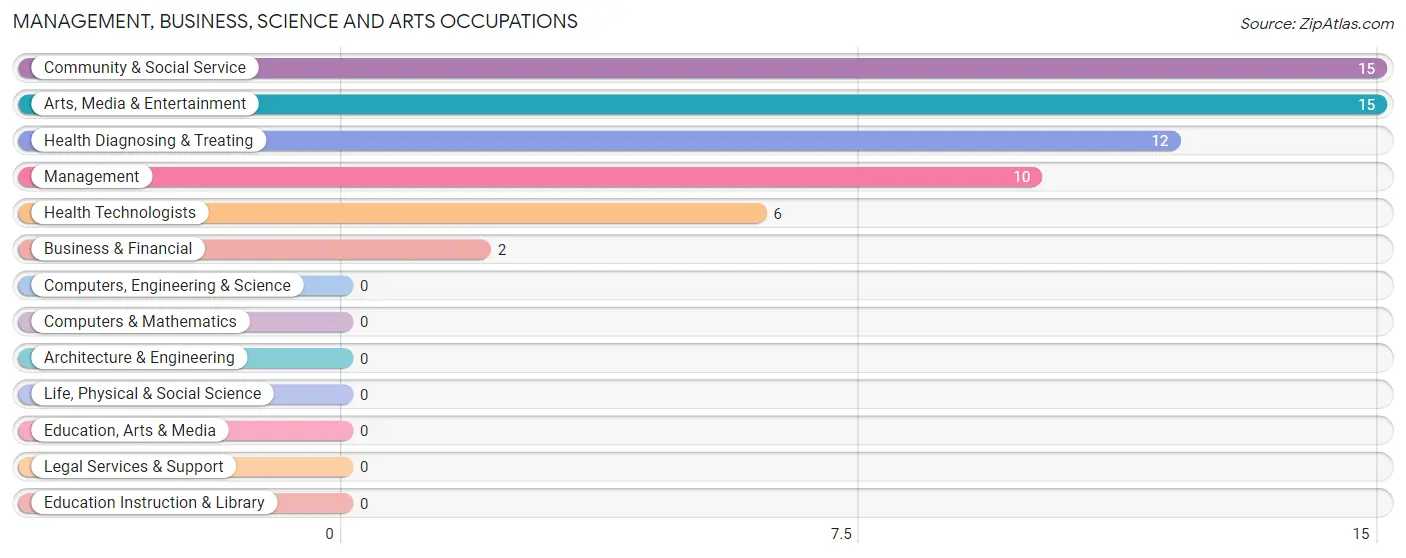
Management, Business, Science and Arts Occupations
The most common Management, Business, Science and Arts occupations in Oak Park are Community & Social Service (15 | 7.8%), Arts, Media & Entertainment (15 | 7.8%), Health Diagnosing & Treating (12 | 6.2%), Management (10 | 5.2%), and Health Technologists (6 | 3.1%).
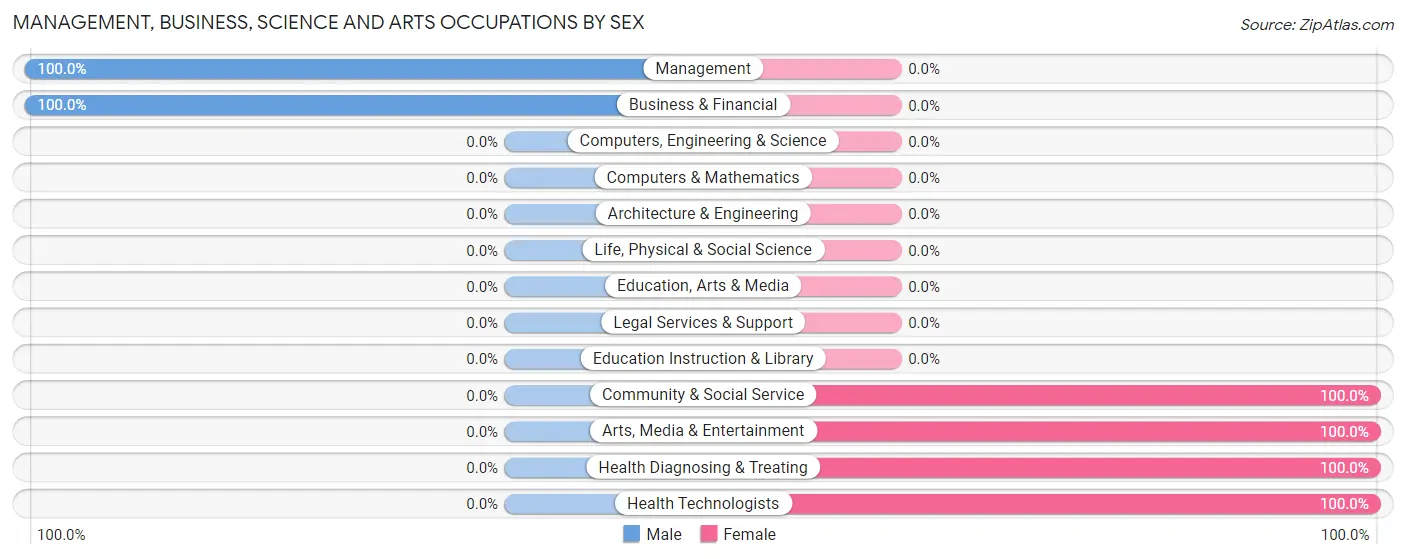
Management, Business, Science and Arts Occupations by Sex
Within the Management, Business, Science and Arts occupations in Oak Park, the most male-oriented occupations are Management (100.0%), and Business & Financial (100.0%), while the most female-oriented occupations are Community & Social Service (100.0%), Arts, Media & Entertainment (100.0%), and Health Diagnosing & Treating (100.0%).
| Occupation | Male | Female |
| Management | 10 (100.0%) | 0 (0.0%) |
| Business & Financial | 2 (100.0%) | 0 (0.0%) |
| Computers, Engineering & Science | 0 (0.0%) | 0 (0.0%) |
| Computers & Mathematics | 0 (0.0%) | 0 (0.0%) |
| Architecture & Engineering | 0 (0.0%) | 0 (0.0%) |
| Life, Physical & Social Science | 0 (0.0%) | 0 (0.0%) |
| Community & Social Service | 0 (0.0%) | 15 (100.0%) |
| Education, Arts & Media | 0 (0.0%) | 0 (0.0%) |
| Legal Services & Support | 0 (0.0%) | 0 (0.0%) |
| Education Instruction & Library | 0 (0.0%) | 0 (0.0%) |
| Arts, Media & Entertainment | 0 (0.0%) | 15 (100.0%) |
| Health Diagnosing & Treating | 0 (0.0%) | 12 (100.0%) |
| Health Technologists | 0 (0.0%) | 6 (100.0%) |
| Total (Category) | 12 (30.8%) | 27 (69.2%) |
| Total (Overall) | 99 (51.3%) | 94 (48.7%) |
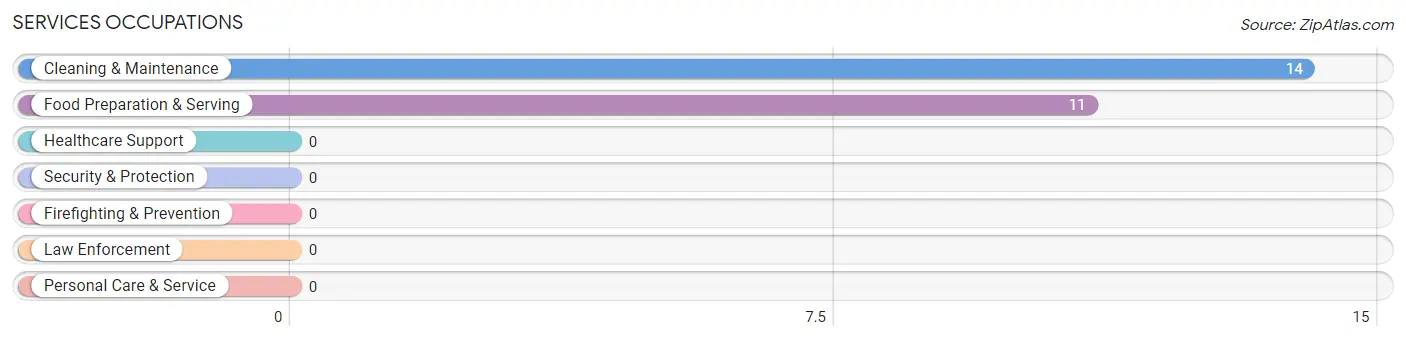
Services Occupations
The most common Services occupations in Oak Park are Cleaning & Maintenance (14 | 7.2%), and Food Preparation & Serving (11 | 5.7%).
Services Occupations by Sex
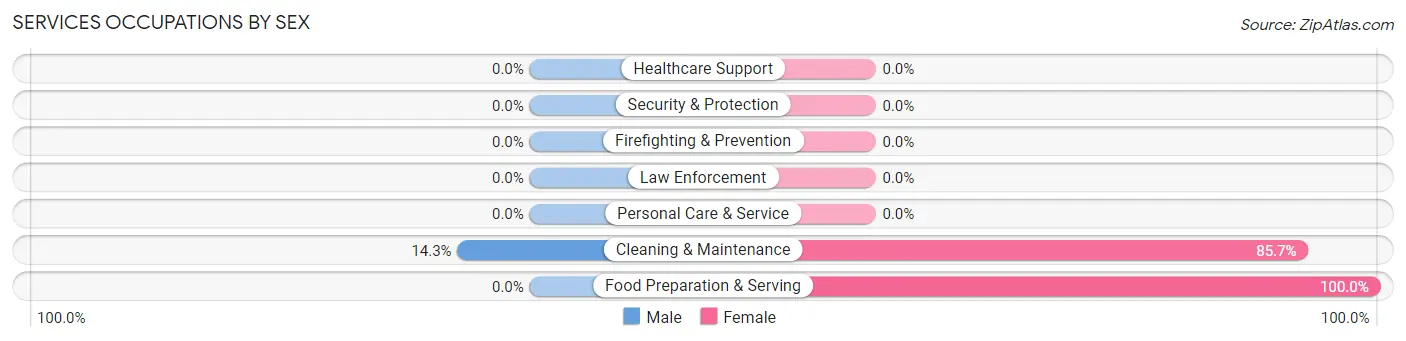
| Occupation | Male | Female |
| Healthcare Support | 0 (0.0%) | 0 (0.0%) |
| Security & Protection | 0 (0.0%) | 0 (0.0%) |
| Firefighting & Prevention | 0 (0.0%) | 0 (0.0%) |
| Law Enforcement | 0 (0.0%) | 0 (0.0%) |
| Food Preparation & Serving | 0 (0.0%) | 11 (100.0%) |
| Cleaning & Maintenance | 2 (14.3%) | 12 (85.7%) |
| Personal Care & Service | 0 (0.0%) | 0 (0.0%) |
| Total (Category) | 2 (8.0%) | 23 (92.0%) |
| Total (Overall) | 99 (51.3%) | 94 (48.7%) |
Sales and Office Occupations
The most common Sales and Office occupations in Oak Park are Sales & Related (41 | 21.2%), and Office & Administration (22 | 11.4%).
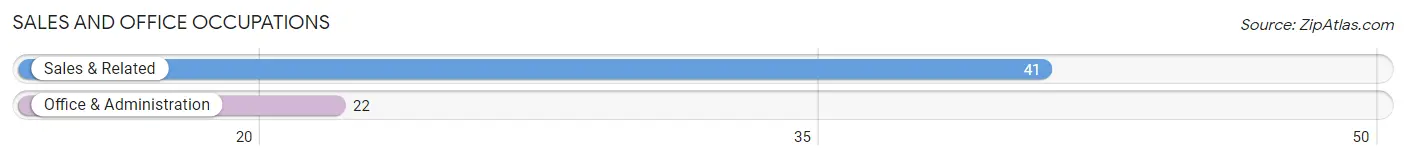
Sales and Office Occupations by Sex
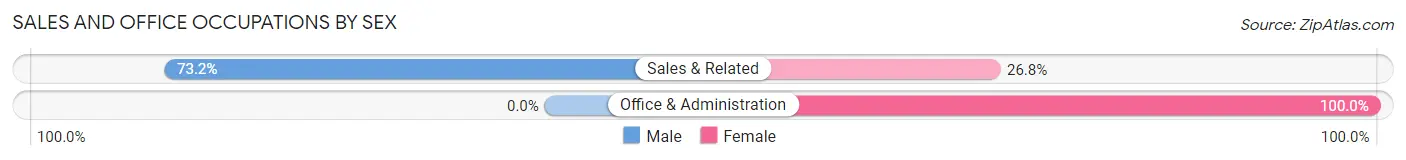
| Occupation | Male | Female |
| Sales & Related | 30 (73.2%) | 11 (26.8%) |
| Office & Administration | 0 (0.0%) | 22 (100.0%) |
| Total (Category) | 30 (47.6%) | 33 (52.4%) |
| Total (Overall) | 99 (51.3%) | 94 (48.7%) |
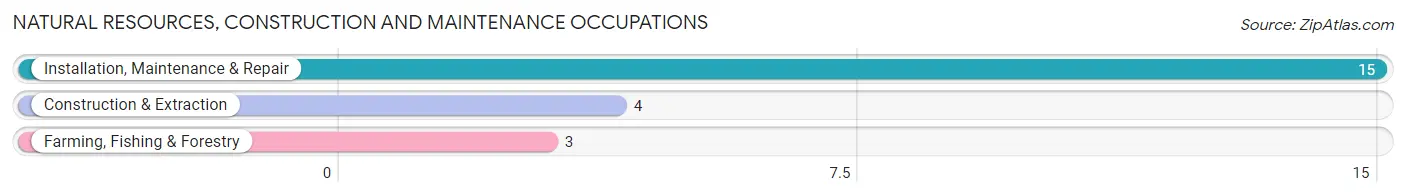
Natural Resources, Construction and Maintenance Occupations
The most common Natural Resources, Construction and Maintenance occupations in Oak Park are Installation, Maintenance & Repair (15 | 7.8%), Construction & Extraction (4 | 2.1%), and Farming, Fishing & Forestry (3 | 1.5%).
Natural Resources, Construction and Maintenance Occupations by Sex
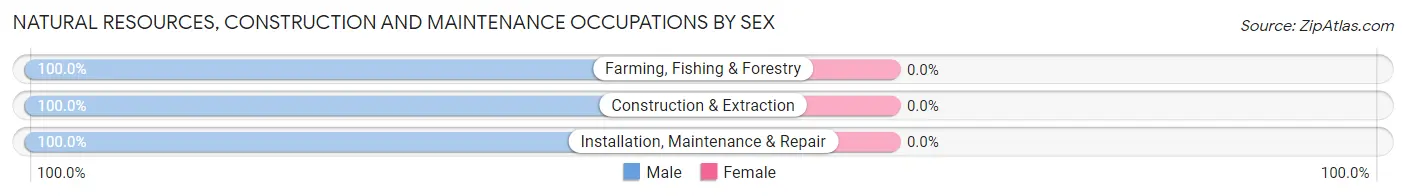
| Occupation | Male | Female |
| Farming, Fishing & Forestry | 3 (100.0%) | 0 (0.0%) |
| Construction & Extraction | 4 (100.0%) | 0 (0.0%) |
| Installation, Maintenance & Repair | 15 (100.0%) | 0 (0.0%) |
| Total (Category) | 22 (100.0%) | 0 (0.0%) |
| Total (Overall) | 99 (51.3%) | 94 (48.7%) |
Production, Transportation and Moving Occupations
The most common Production, Transportation and Moving occupations in Oak Park are Material Moving (19 | 9.8%), Transportation (16 | 8.3%), and Production (9 | 4.7%).
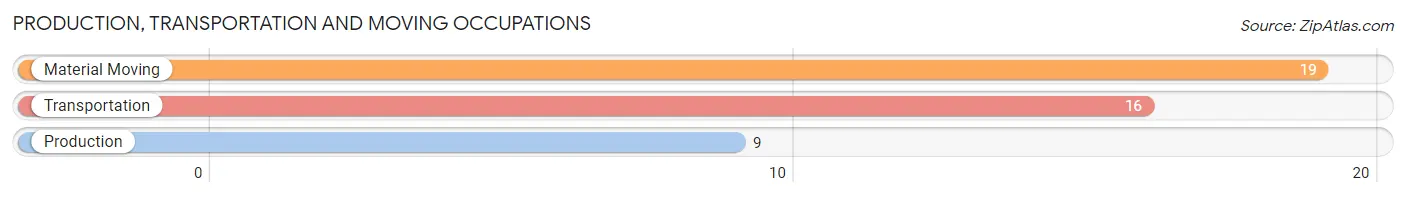
Production, Transportation and Moving Occupations by Sex
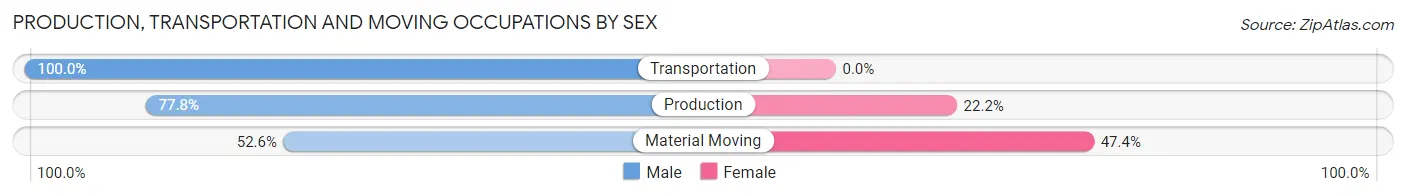
| Occupation | Male | Female |
| Production | 7 (77.8%) | 2 (22.2%) |
| Transportation | 16 (100.0%) | 0 (0.0%) |
| Material Moving | 10 (52.6%) | 9 (47.4%) |
| Total (Category) | 33 (75.0%) | 11 (25.0%) |
| Total (Overall) | 99 (51.3%) | 94 (48.7%) |
Employment Industries by Sex in Oak Park
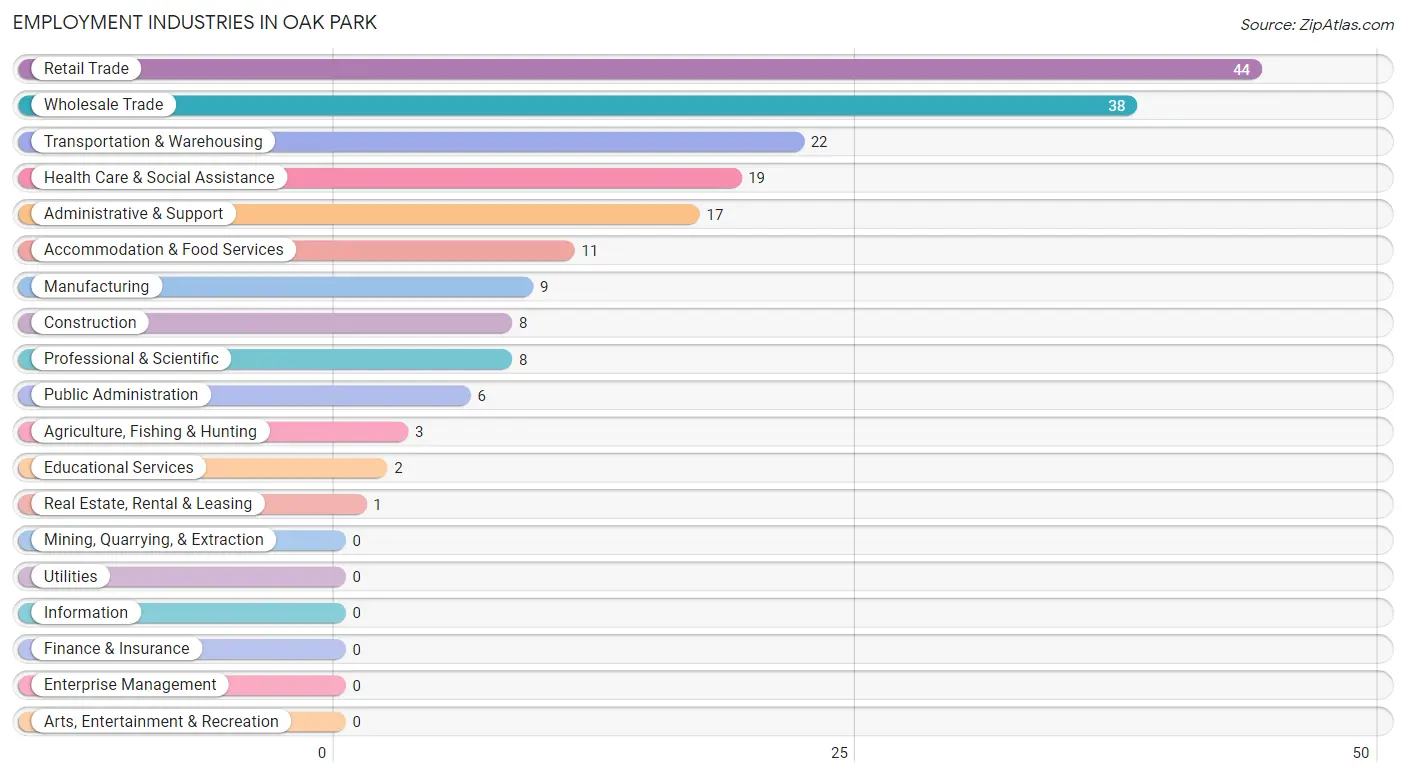
Employment Industries in Oak Park
The major employment industries in Oak Park include Retail Trade (44 | 22.8%), Wholesale Trade (38 | 19.7%), Transportation & Warehousing (22 | 11.4%), Health Care & Social Assistance (19 | 9.8%), and Administrative & Support (17 | 8.8%).
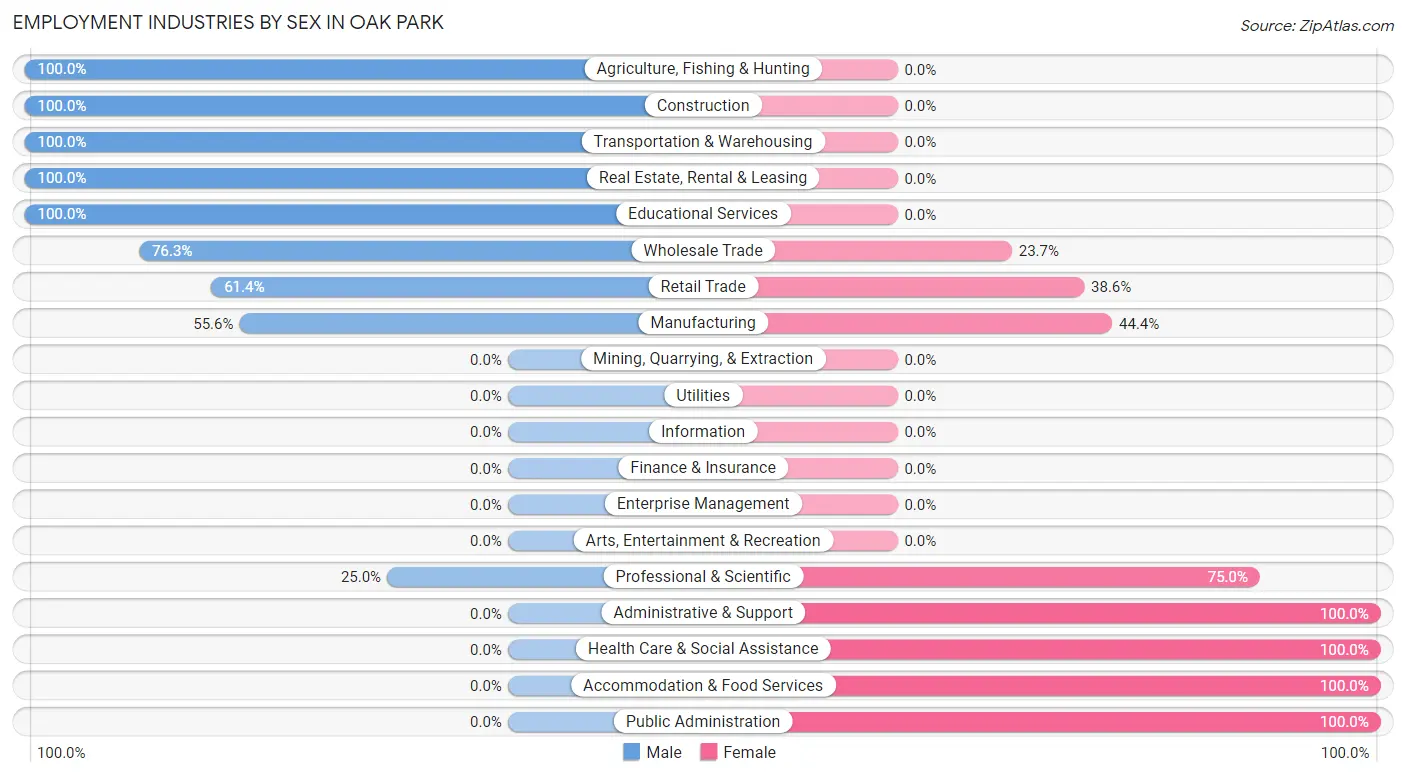
Employment Industries by Sex in Oak Park
The Oak Park industries that see more men than women are Agriculture, Fishing & Hunting (100.0%), Construction (100.0%), and Transportation & Warehousing (100.0%), whereas the industries that tend to have a higher number of women are Administrative & Support (100.0%), Health Care & Social Assistance (100.0%), and Accommodation & Food Services (100.0%).
| Industry | Male | Female |
| Agriculture, Fishing & Hunting | 3 (100.0%) | 0 (0.0%) |
| Mining, Quarrying, & Extraction | 0 (0.0%) | 0 (0.0%) |
| Construction | 8 (100.0%) | 0 (0.0%) |
| Manufacturing | 5 (55.6%) | 4 (44.4%) |
| Wholesale Trade | 29 (76.3%) | 9 (23.7%) |
| Retail Trade | 27 (61.4%) | 17 (38.6%) |
| Transportation & Warehousing | 22 (100.0%) | 0 (0.0%) |
| Utilities | 0 (0.0%) | 0 (0.0%) |
| Information | 0 (0.0%) | 0 (0.0%) |
| Finance & Insurance | 0 (0.0%) | 0 (0.0%) |
| Real Estate, Rental & Leasing | 1 (100.0%) | 0 (0.0%) |
| Professional & Scientific | 2 (25.0%) | 6 (75.0%) |
| Enterprise Management | 0 (0.0%) | 0 (0.0%) |
| Administrative & Support | 0 (0.0%) | 17 (100.0%) |
| Educational Services | 2 (100.0%) | 0 (0.0%) |
| Health Care & Social Assistance | 0 (0.0%) | 19 (100.0%) |
| Arts, Entertainment & Recreation | 0 (0.0%) | 0 (0.0%) |
| Accommodation & Food Services | 0 (0.0%) | 11 (100.0%) |
| Public Administration | 0 (0.0%) | 6 (100.0%) |
| Total | 99 (51.3%) | 94 (48.7%) |
Education in Oak Park
School Enrollment in Oak Park
The most common levels of schooling among the 151 students in Oak Park are middle school (71 | 47.0%), elementary school (38 | 25.2%), and college / undergraduate (19 | 12.6%).
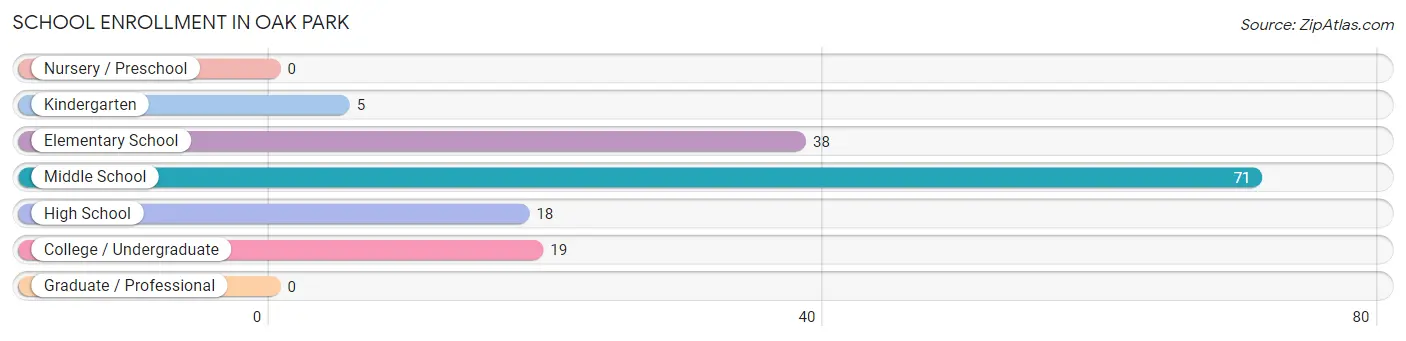
| School Level | # Students | % Students |
| Nursery / Preschool | 0 | 0.0% |
| Kindergarten | 5 | 3.3% |
| Elementary School | 38 | 25.2% |
| Middle School | 71 | 47.0% |
| High School | 18 | 11.9% |
| College / Undergraduate | 19 | 12.6% |
| Graduate / Professional | 0 | 0.0% |
| Total | 151 | 100.0% |
School Enrollment by Age by Funding Source in Oak Park
Out of a total of 151 students who are enrolled in schools in Oak Park, 27 (17.9%) attend a private institution, while the remaining 124 (82.1%) are enrolled in public schools. The age group of 10 to 14 year olds has the highest likelihood of being enrolled in private schools, with 27 (36.5% in the age bracket) enrolled. Conversely, the age group of 5 to 9 year old has the lowest likelihood of being enrolled in a private school, with 43 (100.0% in the age bracket) attending a public institution.
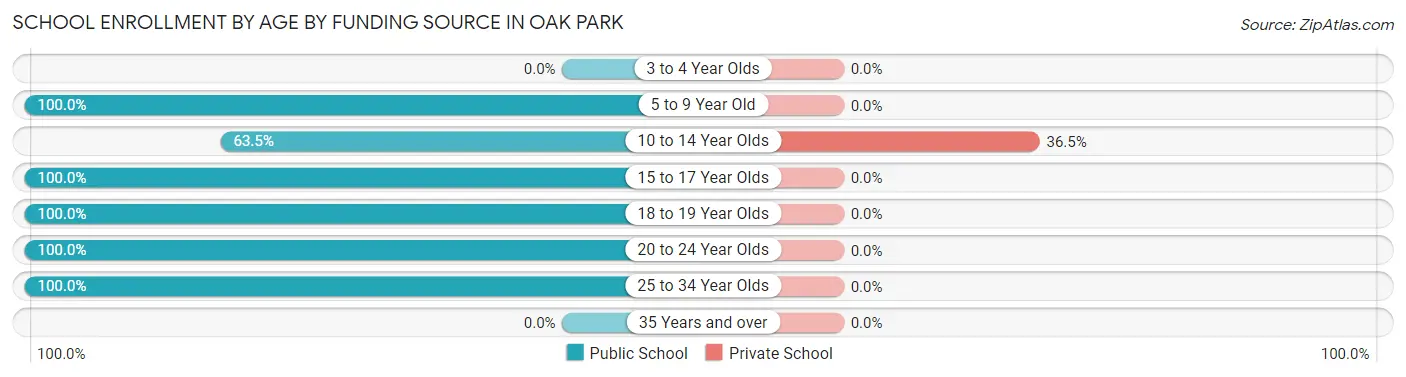
| Age Bracket | Public School | Private School |
| 3 to 4 Year Olds | 0 (0.0%) | 0 (0.0%) |
| 5 to 9 Year Old | 43 (100.0%) | 0 (0.0%) |
| 10 to 14 Year Olds | 47 (63.5%) | 27 (36.5%) |
| 15 to 17 Year Olds | 12 (100.0%) | 0 (0.0%) |
| 18 to 19 Year Olds | 3 (100.0%) | 0 (0.0%) |
| 20 to 24 Year Olds | 4 (100.0%) | 0 (0.0%) |
| 25 to 34 Year Olds | 15 (100.0%) | 0 (0.0%) |
| 35 Years and over | 0 (0.0%) | 0 (0.0%) |
| Total | 124 (82.1%) | 27 (17.9%) |
Educational Attainment by Field of Study in Oak Park
Arts & humanities (15 | 50.0%), psychology (7 | 23.3%), science & technology (5 | 16.7%), and business (3 | 10.0%) are the most common fields of study among 30 individuals in Oak Park who have obtained a bachelor's degree or higher.
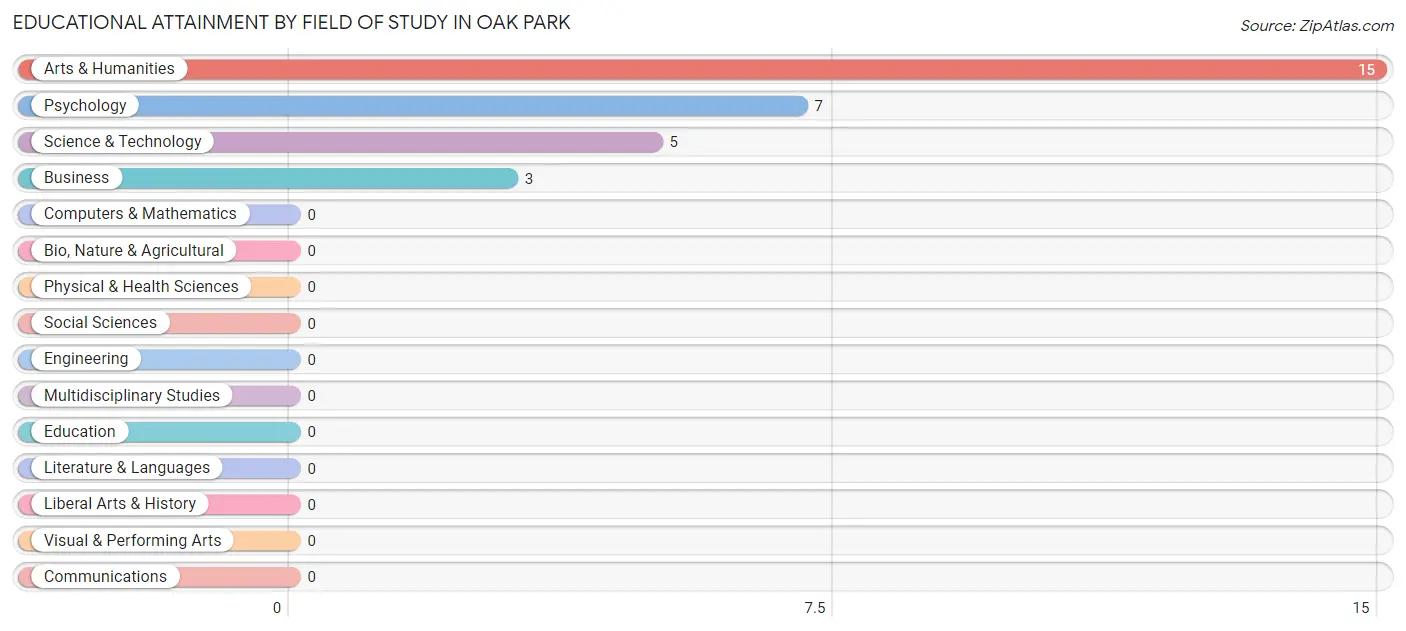
| Field of Study | # Graduates | % Graduates |
| Computers & Mathematics | 0 | 0.0% |
| Bio, Nature & Agricultural | 0 | 0.0% |
| Physical & Health Sciences | 0 | 0.0% |
| Psychology | 7 | 23.3% |
| Social Sciences | 0 | 0.0% |
| Engineering | 0 | 0.0% |
| Multidisciplinary Studies | 0 | 0.0% |
| Science & Technology | 5 | 16.7% |
| Business | 3 | 10.0% |
| Education | 0 | 0.0% |
| Literature & Languages | 0 | 0.0% |
| Liberal Arts & History | 0 | 0.0% |
| Visual & Performing Arts | 0 | 0.0% |
| Communications | 0 | 0.0% |
| Arts & Humanities | 15 | 50.0% |
| Total | 30 | 100.0% |
Transportation & Commute in Oak Park
Vehicle Availability by Sex in Oak Park
The most prevalent vehicle ownership categories in Oak Park are males with 2 vehicles (59, accounting for 60.2%) and females with 2 vehicles (35, making up 69.4%).
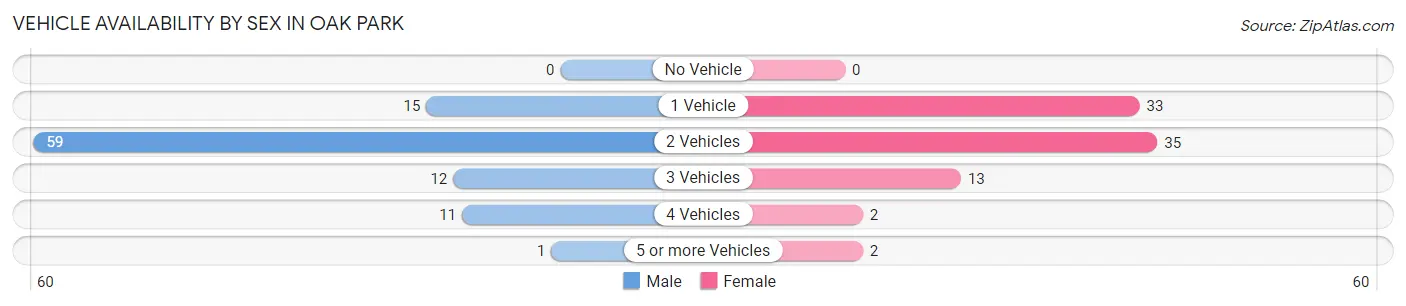
| Vehicles Available | Male | Female |
| No Vehicle | 0 (0.0%) | 0 (0.0%) |
| 1 Vehicle | 15 (15.3%) | 33 (38.8%) |
| 2 Vehicles | 59 (60.2%) | 35 (41.2%) |
| 3 Vehicles | 12 (12.2%) | 13 (15.3%) |
| 4 Vehicles | 11 (11.2%) | 2 (2.4%) |
| 5 or more Vehicles | 1 (1.0%) | 2 (2.4%) |
| Total | 98 (100.0%) | 85 (100.0%) |
Commute Time in Oak Park
The most frequently occuring commute durations in Oak Park are less than 5 minutes (31 commuters, 16.9%), 5 to 9 minutes (30 commuters, 16.4%), and 45 to 59 minutes (25 commuters, 13.7%).
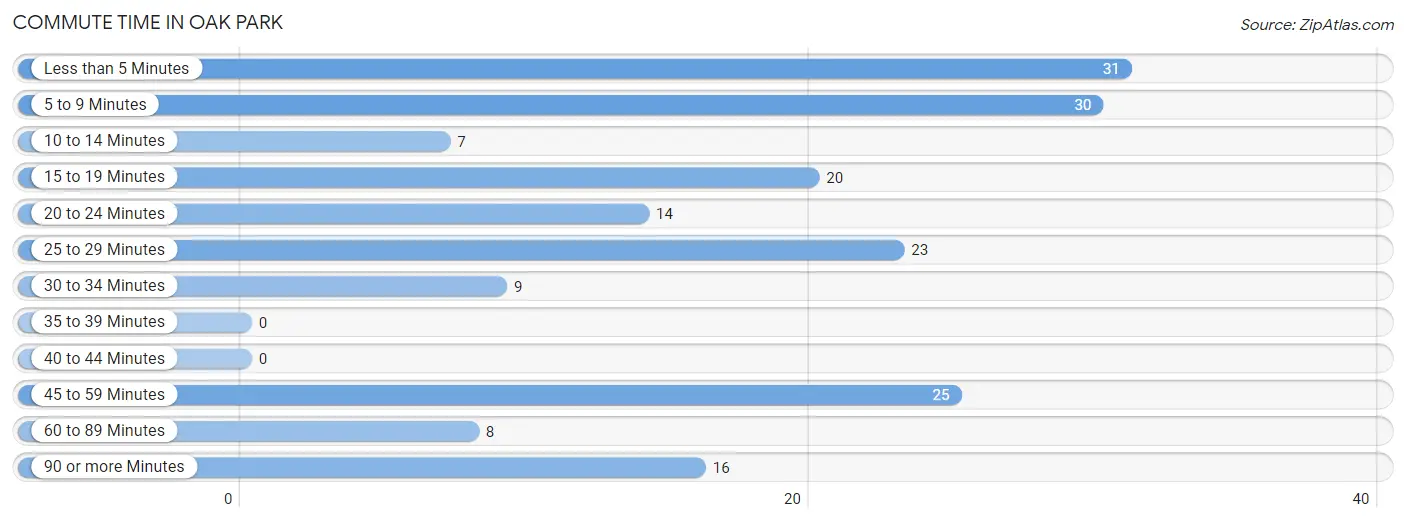
| Commute Time | # Commuters | % Commuters |
| Less than 5 Minutes | 31 | 16.9% |
| 5 to 9 Minutes | 30 | 16.4% |
| 10 to 14 Minutes | 7 | 3.8% |
| 15 to 19 Minutes | 20 | 10.9% |
| 20 to 24 Minutes | 14 | 7.6% |
| 25 to 29 Minutes | 23 | 12.6% |
| 30 to 34 Minutes | 9 | 4.9% |
| 35 to 39 Minutes | 0 | 0.0% |
| 40 to 44 Minutes | 0 | 0.0% |
| 45 to 59 Minutes | 25 | 13.7% |
| 60 to 89 Minutes | 8 | 4.4% |
| 90 or more Minutes | 16 | 8.7% |
Commute Time by Sex in Oak Park
The most common commute times in Oak Park are less than 5 minutes (29 commuters, 29.6%) for males and 5 to 9 minutes (21 commuters, 24.7%) for females.
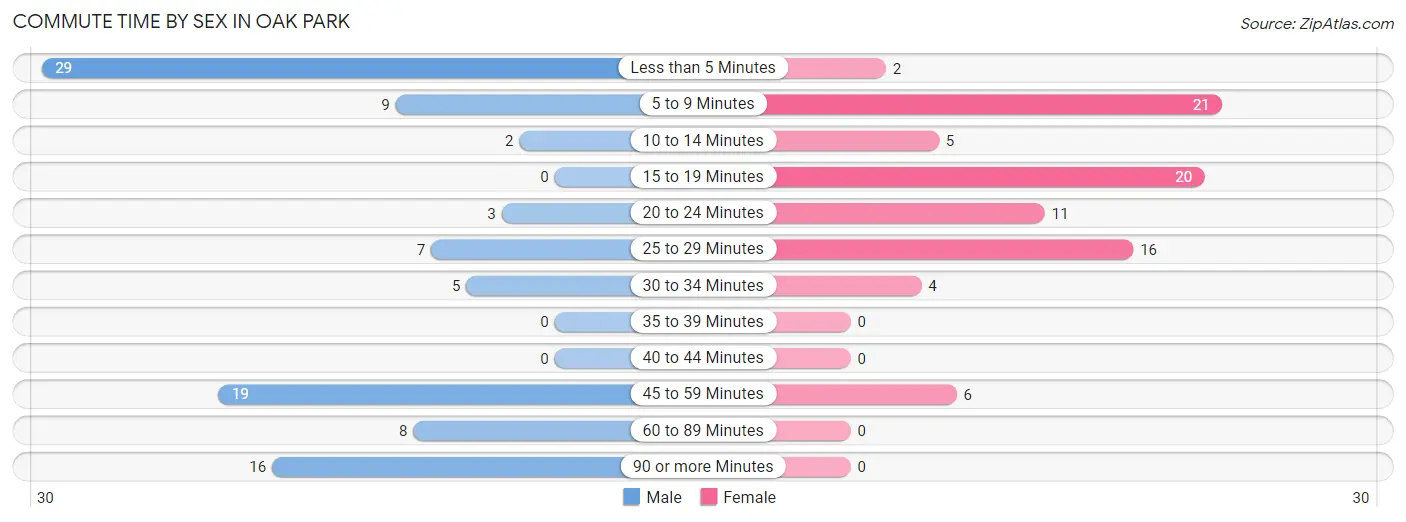
| Commute Time | Male | Female |
| Less than 5 Minutes | 29 (29.6%) | 2 (2.4%) |
| 5 to 9 Minutes | 9 (9.2%) | 21 (24.7%) |
| 10 to 14 Minutes | 2 (2.0%) | 5 (5.9%) |
| 15 to 19 Minutes | 0 (0.0%) | 20 (23.5%) |
| 20 to 24 Minutes | 3 (3.1%) | 11 (12.9%) |
| 25 to 29 Minutes | 7 (7.1%) | 16 (18.8%) |
| 30 to 34 Minutes | 5 (5.1%) | 4 (4.7%) |
| 35 to 39 Minutes | 0 (0.0%) | 0 (0.0%) |
| 40 to 44 Minutes | 0 (0.0%) | 0 (0.0%) |
| 45 to 59 Minutes | 19 (19.4%) | 6 (7.1%) |
| 60 to 89 Minutes | 8 (8.2%) | 0 (0.0%) |
| 90 or more Minutes | 16 (16.3%) | 0 (0.0%) |
Time of Departure to Work by Sex in Oak Park
The most frequent times of departure to work in Oak Park are 5:30 AM to 5:59 AM (47, 48.0%) for males and 8:00 AM to 8:29 AM (22, 25.9%) for females.
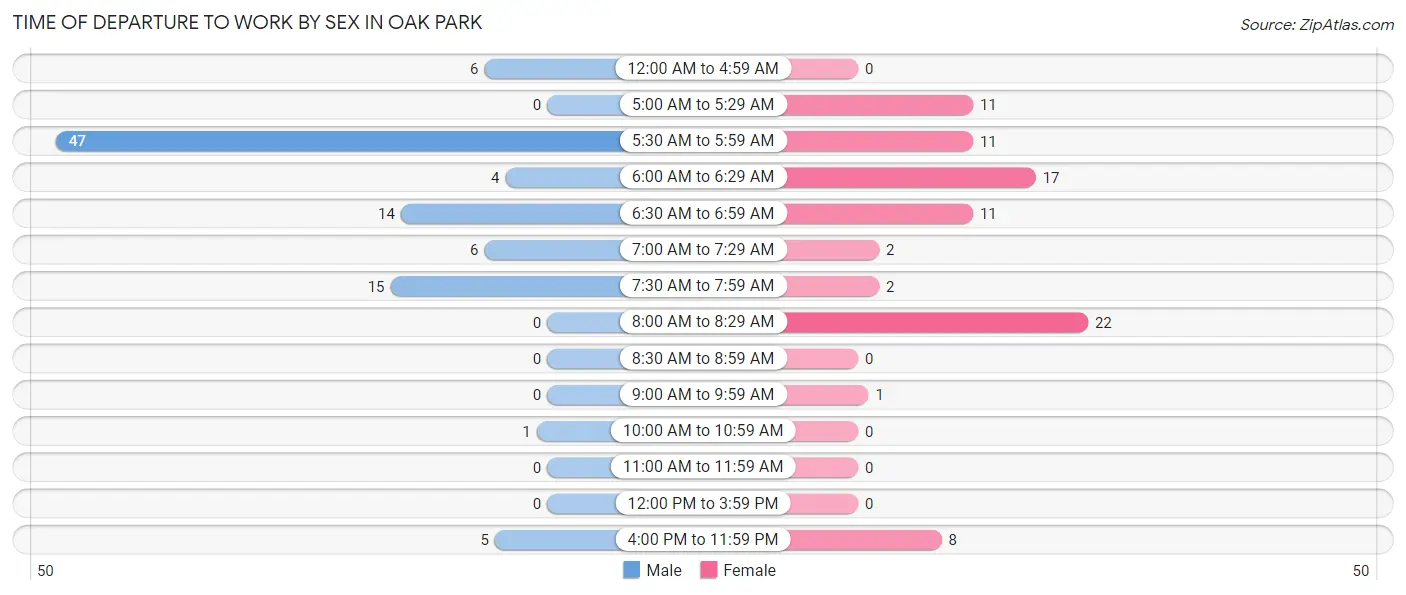
| Time of Departure | Male | Female |
| 12:00 AM to 4:59 AM | 6 (6.1%) | 0 (0.0%) |
| 5:00 AM to 5:29 AM | 0 (0.0%) | 11 (12.9%) |
| 5:30 AM to 5:59 AM | 47 (48.0%) | 11 (12.9%) |
| 6:00 AM to 6:29 AM | 4 (4.1%) | 17 (20.0%) |
| 6:30 AM to 6:59 AM | 14 (14.3%) | 11 (12.9%) |
| 7:00 AM to 7:29 AM | 6 (6.1%) | 2 (2.4%) |
| 7:30 AM to 7:59 AM | 15 (15.3%) | 2 (2.4%) |
| 8:00 AM to 8:29 AM | 0 (0.0%) | 22 (25.9%) |
| 8:30 AM to 8:59 AM | 0 (0.0%) | 0 (0.0%) |
| 9:00 AM to 9:59 AM | 0 (0.0%) | 1 (1.2%) |
| 10:00 AM to 10:59 AM | 1 (1.0%) | 0 (0.0%) |
| 11:00 AM to 11:59 AM | 0 (0.0%) | 0 (0.0%) |
| 12:00 PM to 3:59 PM | 0 (0.0%) | 0 (0.0%) |
| 4:00 PM to 11:59 PM | 5 (5.1%) | 8 (9.4%) |
| Total | 98 (100.0%) | 85 (100.0%) |
Housing Occupancy in Oak Park
Occupancy by Ownership in Oak Park
Of the total 204 dwellings in Oak Park, owner-occupied units account for 115 (56.4%), while renter-occupied units make up 89 (43.6%).
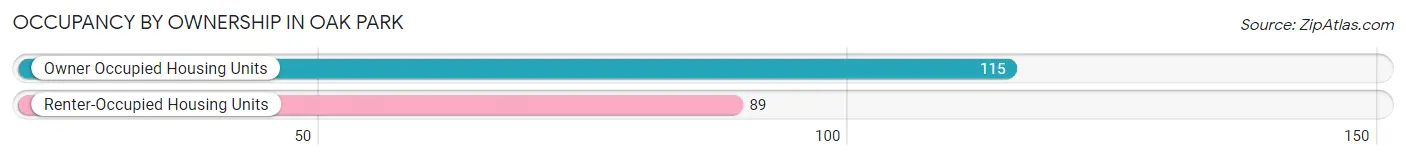
| Occupancy | # Housing Units | % Housing Units |
| Owner Occupied Housing Units | 115 | 56.4% |
| Renter-Occupied Housing Units | 89 | 43.6% |
| Total Occupied Housing Units | 204 | 100.0% |
Occupancy by Household Size in Oak Park
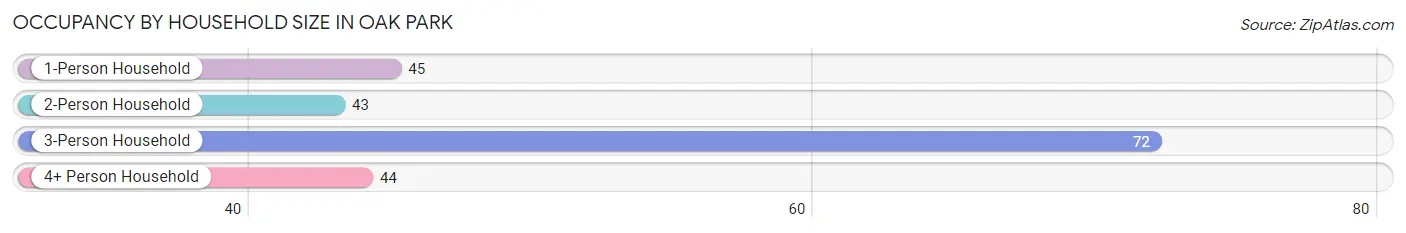
| Household Size | # Housing Units | % Housing Units |
| 1-Person Household | 45 | 22.1% |
| 2-Person Household | 43 | 21.1% |
| 3-Person Household | 72 | 35.3% |
| 4+ Person Household | 44 | 21.6% |
| Total Housing Units | 204 | 100.0% |
Occupancy by Ownership by Household Size in Oak Park
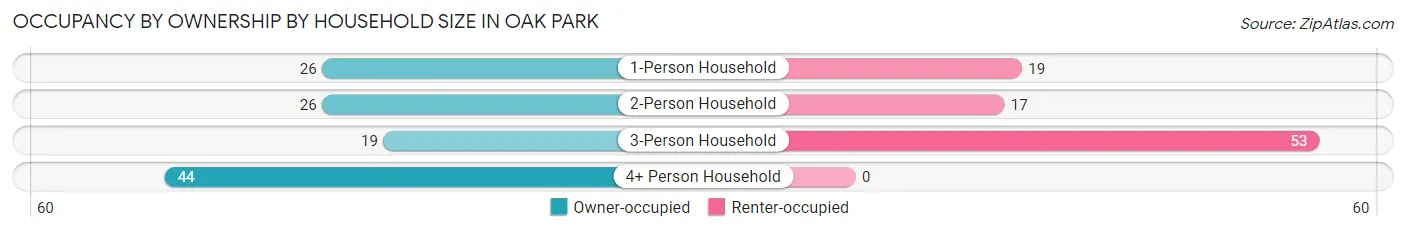
| Household Size | Owner-occupied | Renter-occupied |
| 1-Person Household | 26 (57.8%) | 19 (42.2%) |
| 2-Person Household | 26 (60.5%) | 17 (39.5%) |
| 3-Person Household | 19 (26.4%) | 53 (73.6%) |
| 4+ Person Household | 44 (100.0%) | 0 (0.0%) |
| Total Housing Units | 115 (56.4%) | 89 (43.6%) |
Occupancy by Educational Attainment in Oak Park
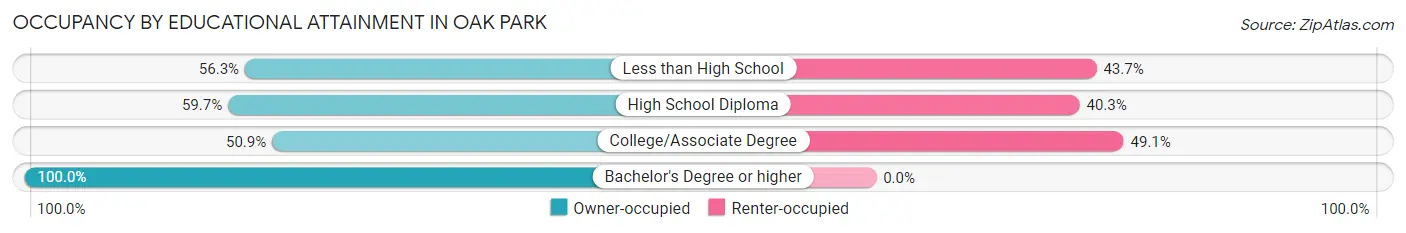
| Household Size | Owner-occupied | Renter-occupied |
| Less than High School | 49 (56.3%) | 38 (43.7%) |
| High School Diploma | 37 (59.7%) | 25 (40.3%) |
| College/Associate Degree | 27 (50.9%) | 26 (49.1%) |
| Bachelor's Degree or higher | 2 (100.0%) | 0 (0.0%) |
Occupancy by Age of Householder in Oak Park
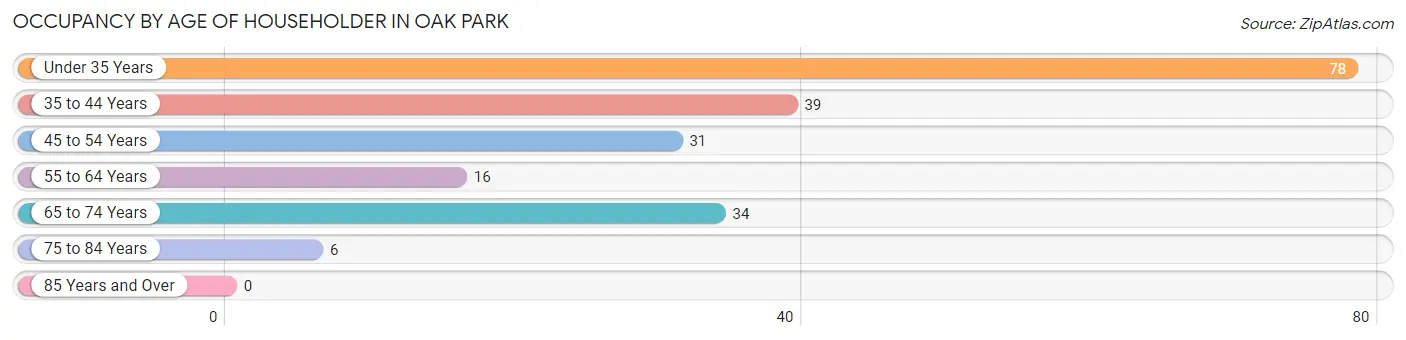
| Age Bracket | # Households | % Households |
| Under 35 Years | 78 | 38.2% |
| 35 to 44 Years | 39 | 19.1% |
| 45 to 54 Years | 31 | 15.2% |
| 55 to 64 Years | 16 | 7.8% |
| 65 to 74 Years | 34 | 16.7% |
| 75 to 84 Years | 6 | 2.9% |
| 85 Years and Over | 0 | 0.0% |
| Total | 204 | 100.0% |
Housing Finances in Oak Park
Median Income by Occupancy in Oak Park
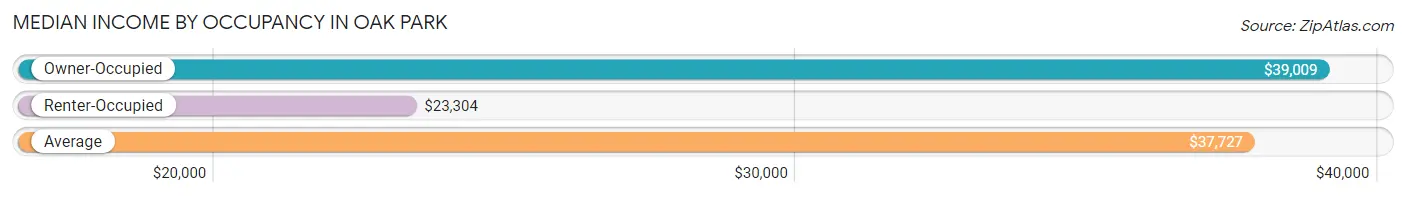
| Occupancy Type | # Households | Median Income |
| Owner-Occupied | 115 (56.4%) | $39,009 |
| Renter-Occupied | 89 (43.6%) | $23,304 |
| Average | 204 (100.0%) | $37,727 |
Occupancy by Householder Income Bracket in Oak Park
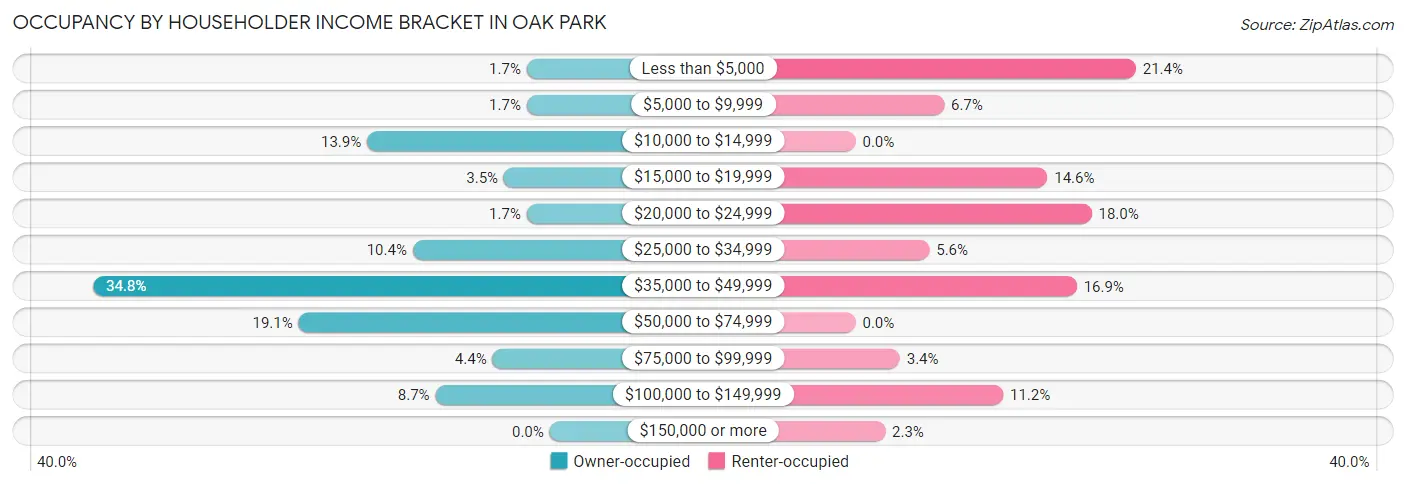
| Income Bracket | Owner-occupied | Renter-occupied |
| Less than $5,000 | 2 (1.7%) | 19 (21.3%) |
| $5,000 to $9,999 | 2 (1.7%) | 6 (6.7%) |
| $10,000 to $14,999 | 16 (13.9%) | 0 (0.0%) |
| $15,000 to $19,999 | 4 (3.5%) | 13 (14.6%) |
| $20,000 to $24,999 | 2 (1.7%) | 16 (18.0%) |
| $25,000 to $34,999 | 12 (10.4%) | 5 (5.6%) |
| $35,000 to $49,999 | 40 (34.8%) | 15 (16.9%) |
| $50,000 to $74,999 | 22 (19.1%) | 0 (0.0%) |
| $75,000 to $99,999 | 5 (4.3%) | 3 (3.4%) |
| $100,000 to $149,999 | 10 (8.7%) | 10 (11.2%) |
| $150,000 or more | 0 (0.0%) | 2 (2.2%) |
| Total | 115 (100.0%) | 89 (100.0%) |
Monthly Housing Cost Tiers in Oak Park
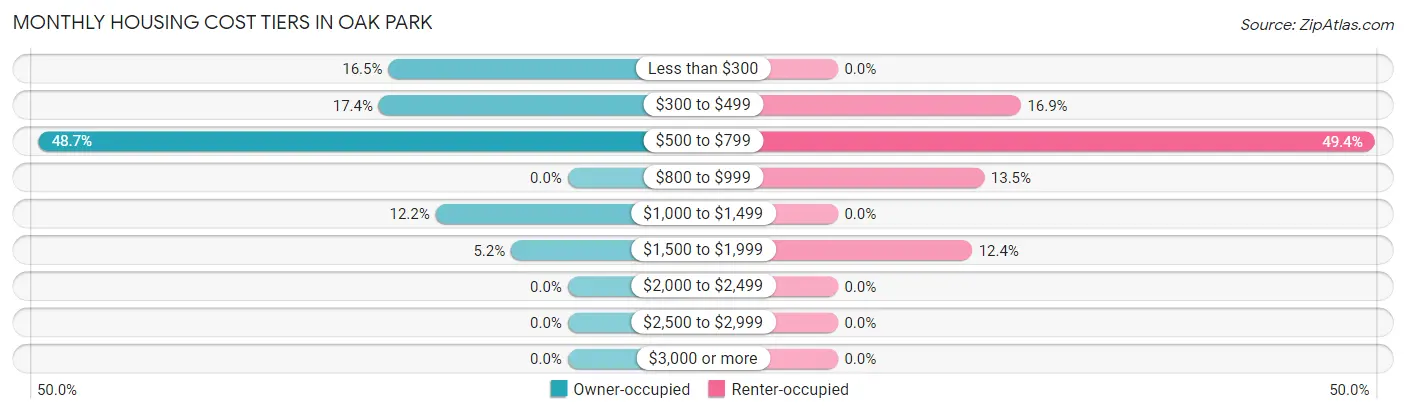
| Monthly Cost | Owner-occupied | Renter-occupied |
| Less than $300 | 19 (16.5%) | 0 (0.0%) |
| $300 to $499 | 20 (17.4%) | 15 (16.9%) |
| $500 to $799 | 56 (48.7%) | 44 (49.4%) |
| $800 to $999 | 0 (0.0%) | 12 (13.5%) |
| $1,000 to $1,499 | 14 (12.2%) | 0 (0.0%) |
| $1,500 to $1,999 | 6 (5.2%) | 11 (12.4%) |
| $2,000 to $2,499 | 0 (0.0%) | 0 (0.0%) |
| $2,500 to $2,999 | 0 (0.0%) | 0 (0.0%) |
| $3,000 or more | 0 (0.0%) | 0 (0.0%) |
| Total | 115 (100.0%) | 89 (100.0%) |
Physical Housing Characteristics in Oak Park
Housing Structures in Oak Park
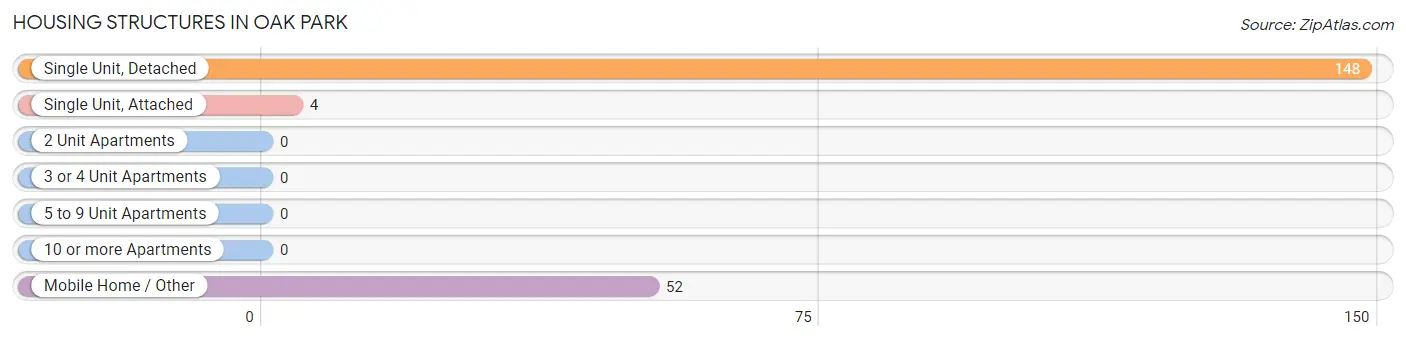
| Structure Type | # Housing Units | % Housing Units |
| Single Unit, Detached | 148 | 72.6% |
| Single Unit, Attached | 4 | 2.0% |
| 2 Unit Apartments | 0 | 0.0% |
| 3 or 4 Unit Apartments | 0 | 0.0% |
| 5 to 9 Unit Apartments | 0 | 0.0% |
| 10 or more Apartments | 0 | 0.0% |
| Mobile Home / Other | 52 | 25.5% |
| Total | 204 | 100.0% |
Housing Structures by Occupancy in Oak Park
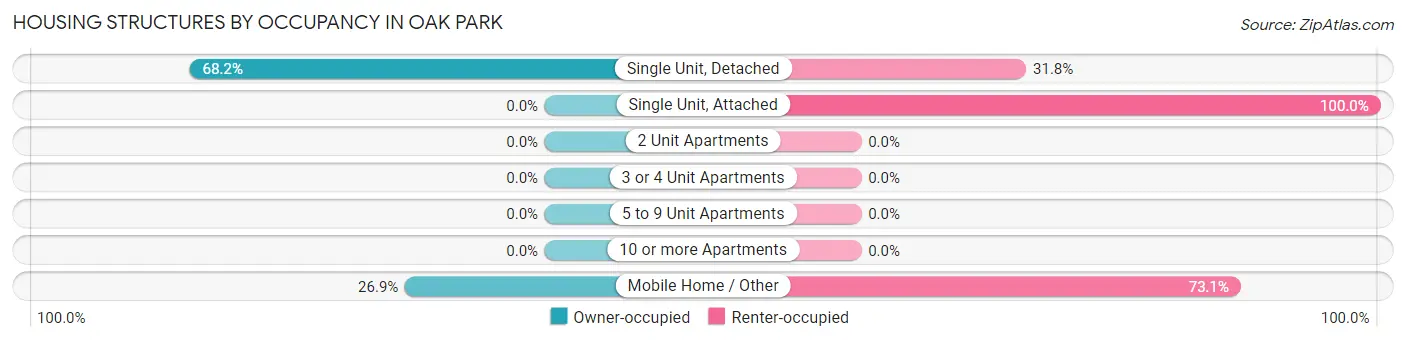
| Structure Type | Owner-occupied | Renter-occupied |
| Single Unit, Detached | 101 (68.2%) | 47 (31.8%) |
| Single Unit, Attached | 0 (0.0%) | 4 (100.0%) |
| 2 Unit Apartments | 0 (0.0%) | 0 (0.0%) |
| 3 or 4 Unit Apartments | 0 (0.0%) | 0 (0.0%) |
| 5 to 9 Unit Apartments | 0 (0.0%) | 0 (0.0%) |
| 10 or more Apartments | 0 (0.0%) | 0 (0.0%) |
| Mobile Home / Other | 14 (26.9%) | 38 (73.1%) |
| Total | 115 (56.4%) | 89 (43.6%) |
Housing Structures by Number of Rooms in Oak Park
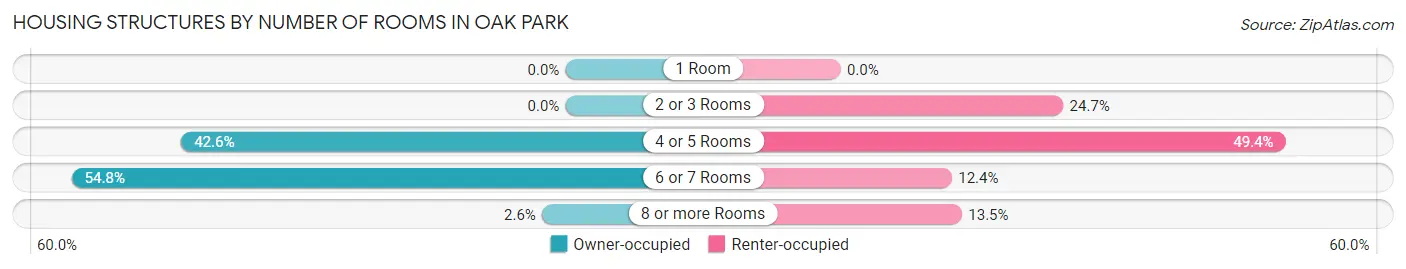
| Number of Rooms | Owner-occupied | Renter-occupied |
| 1 Room | 0 (0.0%) | 0 (0.0%) |
| 2 or 3 Rooms | 0 (0.0%) | 22 (24.7%) |
| 4 or 5 Rooms | 49 (42.6%) | 44 (49.4%) |
| 6 or 7 Rooms | 63 (54.8%) | 11 (12.4%) |
| 8 or more Rooms | 3 (2.6%) | 12 (13.5%) |
| Total | 115 (100.0%) | 89 (100.0%) |
Housing Structure by Heating Type in Oak Park
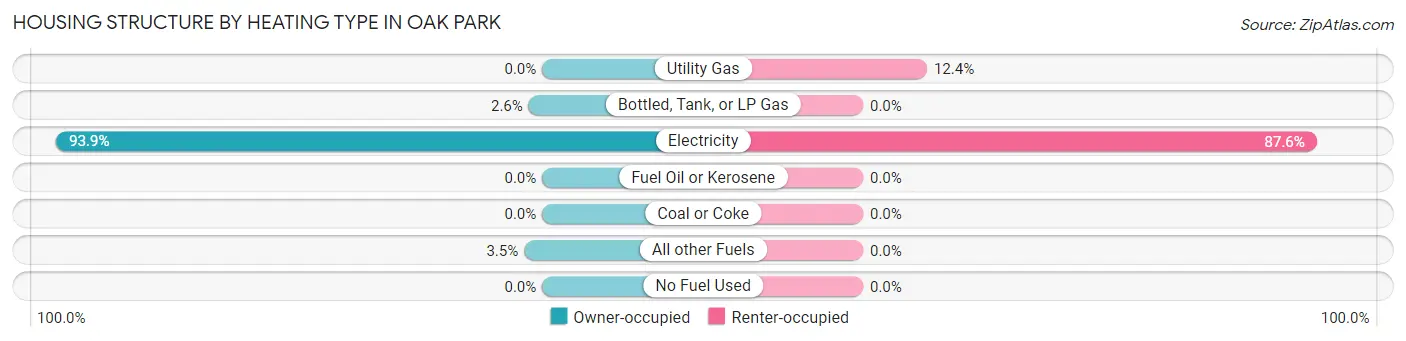
| Heating Type | Owner-occupied | Renter-occupied |
| Utility Gas | 0 (0.0%) | 11 (12.4%) |
| Bottled, Tank, or LP Gas | 3 (2.6%) | 0 (0.0%) |
| Electricity | 108 (93.9%) | 78 (87.6%) |
| Fuel Oil or Kerosene | 0 (0.0%) | 0 (0.0%) |
| Coal or Coke | 0 (0.0%) | 0 (0.0%) |
| All other Fuels | 4 (3.5%) | 0 (0.0%) |
| No Fuel Used | 0 (0.0%) | 0 (0.0%) |
| Total | 115 (100.0%) | 89 (100.0%) |
Household Vehicle Usage in Oak Park
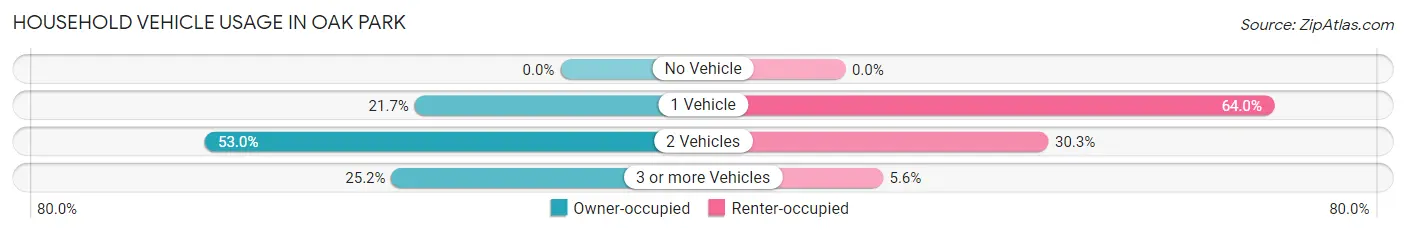
| Vehicles per Household | Owner-occupied | Renter-occupied |
| No Vehicle | 0 (0.0%) | 0 (0.0%) |
| 1 Vehicle | 25 (21.7%) | 57 (64.0%) |
| 2 Vehicles | 61 (53.0%) | 27 (30.3%) |
| 3 or more Vehicles | 29 (25.2%) | 5 (5.6%) |
| Total | 115 (100.0%) | 89 (100.0%) |
Real Estate & Mortgages in Oak Park
Real Estate and Mortgage Overview in Oak Park
| Characteristic | Without Mortgage | With Mortgage |
| Housing Units | 55 | 60 |
| Median Property Value | - | - |
| Median Household Income | $40,417 | $0 |
| Monthly Housing Costs | $417 | $0 |
| Real Estate Taxes | $900 | $7 |
Property Value by Mortgage Status in Oak Park
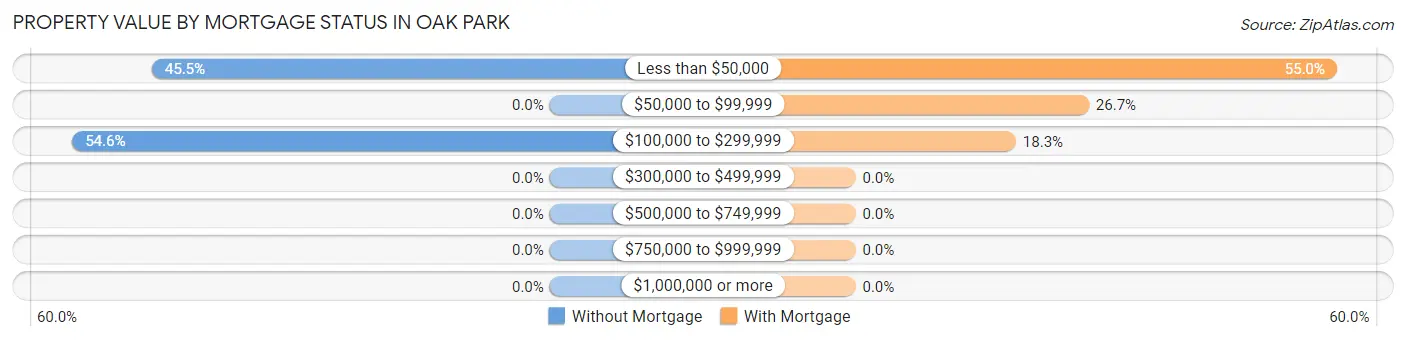
| Property Value | Without Mortgage | With Mortgage |
| Less than $50,000 | 25 (45.5%) | 33 (55.0%) |
| $50,000 to $99,999 | 0 (0.0%) | 16 (26.7%) |
| $100,000 to $299,999 | 30 (54.5%) | 11 (18.3%) |
| $300,000 to $499,999 | 0 (0.0%) | 0 (0.0%) |
| $500,000 to $749,999 | 0 (0.0%) | 0 (0.0%) |
| $750,000 to $999,999 | 0 (0.0%) | 0 (0.0%) |
| $1,000,000 or more | 0 (0.0%) | 0 (0.0%) |
| Total | 55 (100.0%) | 60 (100.0%) |
Household Income by Mortgage Status in Oak Park
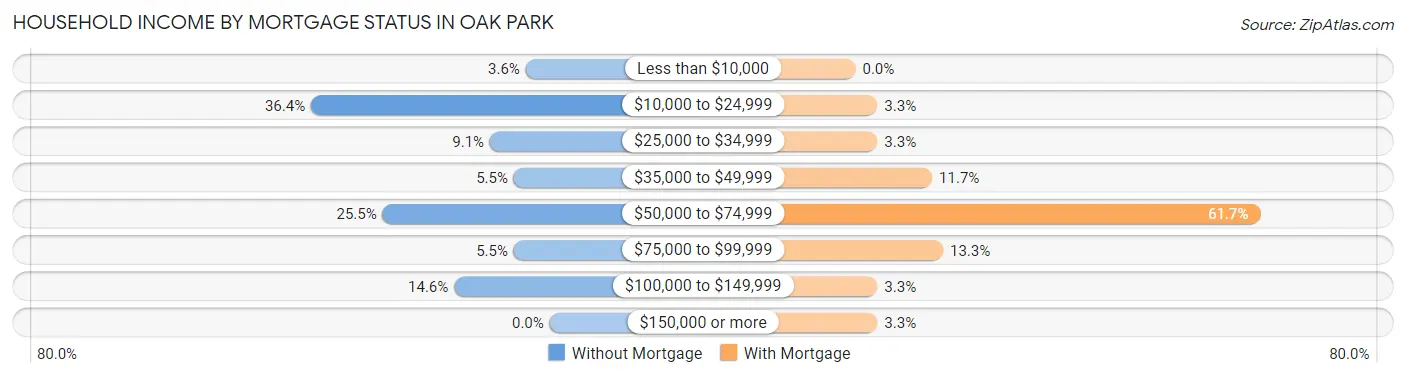
| Household Income | Without Mortgage | With Mortgage |
| Less than $10,000 | 2 (3.6%) | 0 (0.0%) |
| $10,000 to $24,999 | 20 (36.4%) | 2 (3.3%) |
| $25,000 to $34,999 | 5 (9.1%) | 2 (3.3%) |
| $35,000 to $49,999 | 3 (5.4%) | 7 (11.7%) |
| $50,000 to $74,999 | 14 (25.5%) | 37 (61.7%) |
| $75,000 to $99,999 | 3 (5.4%) | 8 (13.3%) |
| $100,000 to $149,999 | 8 (14.5%) | 2 (3.3%) |
| $150,000 or more | 0 (0.0%) | 2 (3.3%) |
| Total | 55 (100.0%) | 60 (100.0%) |
Property Value to Household Income Ratio in Oak Park
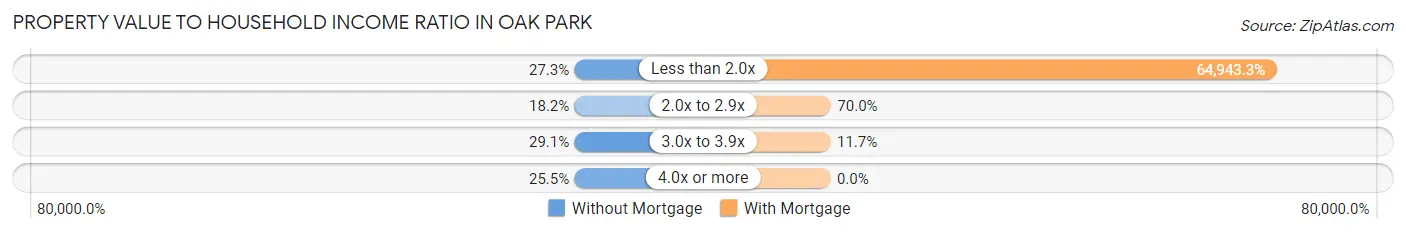
| Value-to-Income Ratio | Without Mortgage | With Mortgage |
| Less than 2.0x | 15 (27.3%) | 38,966 (64,943.3%) |
| 2.0x to 2.9x | 10 (18.2%) | 42 (70.0%) |
| 3.0x to 3.9x | 16 (29.1%) | 7 (11.7%) |
| 4.0x or more | 14 (25.5%) | 0 (0.0%) |
| Total | 55 (100.0%) | 60 (100.0%) |
Real Estate Taxes by Mortgage Status in Oak Park
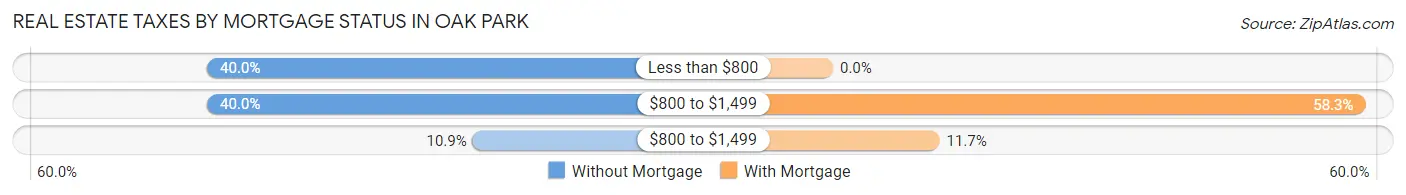
| Property Taxes | Without Mortgage | With Mortgage |
| Less than $800 | 22 (40.0%) | 0 (0.0%) |
| $800 to $1,499 | 22 (40.0%) | 35 (58.3%) |
| $800 to $1,499 | 6 (10.9%) | 7 (11.7%) |
| Total | 55 (100.0%) | 60 (100.0%) |
Health & Disability in Oak Park
Health Insurance Coverage by Age in Oak Park
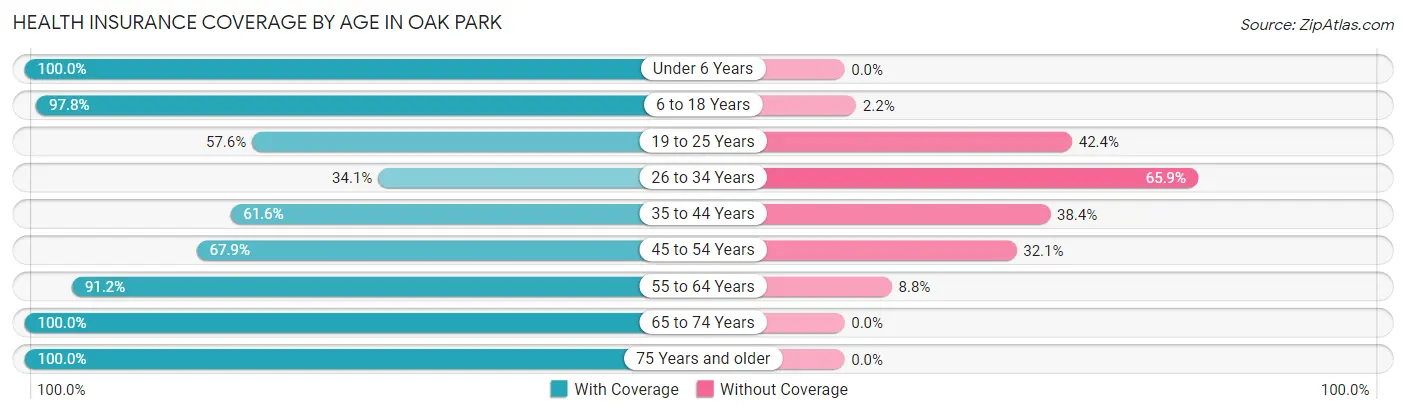
| Age Bracket | With Coverage | Without Coverage |
| Under 6 Years | 44 (100.0%) | 0 (0.0%) |
| 6 to 18 Years | 136 (97.8%) | 3 (2.2%) |
| 19 to 25 Years | 19 (57.6%) | 14 (42.4%) |
| 26 to 34 Years | 31 (34.1%) | 60 (65.9%) |
| 35 to 44 Years | 53 (61.6%) | 33 (38.4%) |
| 45 to 54 Years | 36 (67.9%) | 17 (32.1%) |
| 55 to 64 Years | 31 (91.2%) | 3 (8.8%) |
| 65 to 74 Years | 40 (100.0%) | 0 (0.0%) |
| 75 Years and older | 8 (100.0%) | 0 (0.0%) |
| Total | 398 (75.4%) | 130 (24.6%) |
Health Insurance Coverage by Citizenship Status in Oak Park
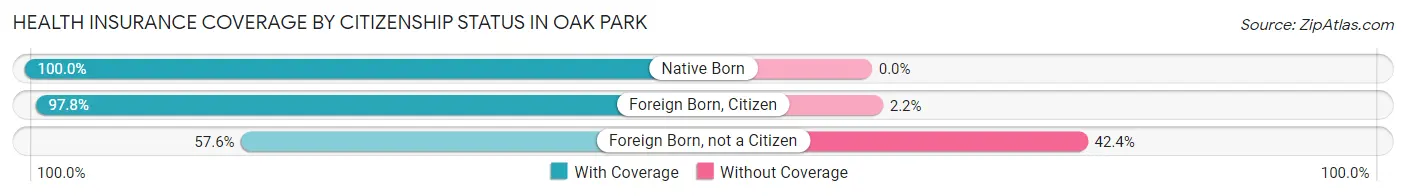
| Citizenship Status | With Coverage | Without Coverage |
| Native Born | 44 (100.0%) | 0 (0.0%) |
| Foreign Born, Citizen | 136 (97.8%) | 3 (2.2%) |
| Foreign Born, not a Citizen | 19 (57.6%) | 14 (42.4%) |
Health Insurance Coverage by Household Income in Oak Park
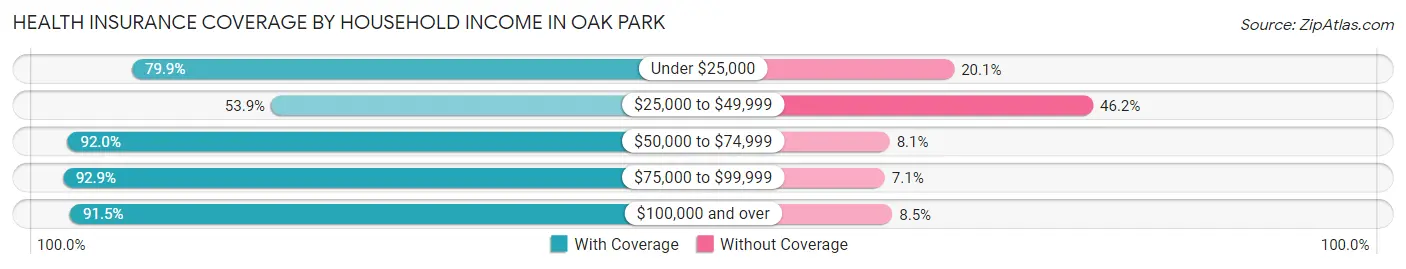
| Household Income | With Coverage | Without Coverage |
| Under $25,000 | 119 (79.9%) | 30 (20.1%) |
| $25,000 to $49,999 | 98 (53.8%) | 84 (46.2%) |
| $50,000 to $74,999 | 80 (91.9%) | 7 (8.1%) |
| $75,000 to $99,999 | 26 (92.9%) | 2 (7.1%) |
| $100,000 and over | 75 (91.5%) | 7 (8.5%) |
Public vs Private Health Insurance Coverage by Age in Oak Park
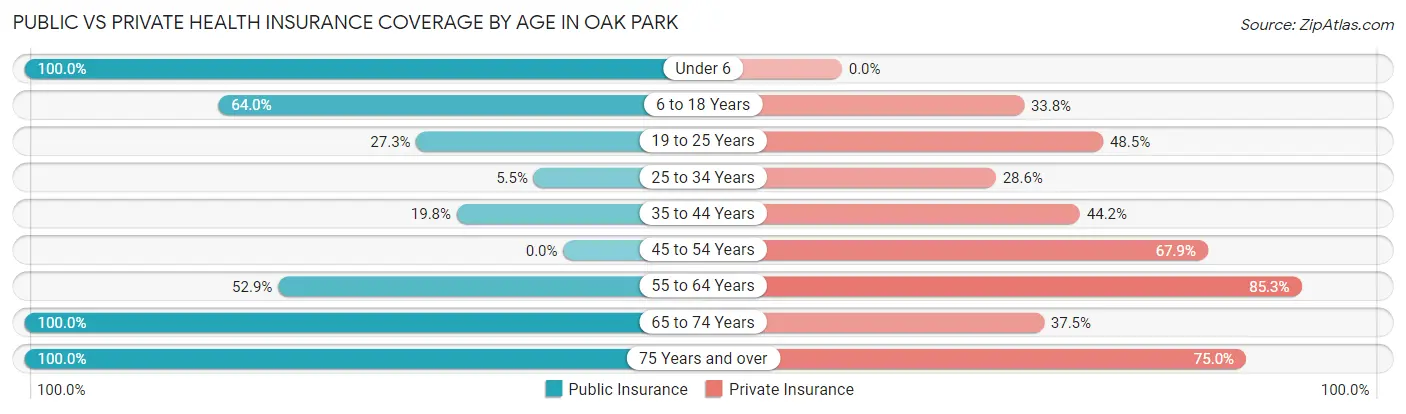
| Age Bracket | Public Insurance | Private Insurance |
| Under 6 | 44 (100.0%) | 0 (0.0%) |
| 6 to 18 Years | 89 (64.0%) | 47 (33.8%) |
| 19 to 25 Years | 9 (27.3%) | 16 (48.5%) |
| 25 to 34 Years | 5 (5.5%) | 26 (28.6%) |
| 35 to 44 Years | 17 (19.8%) | 38 (44.2%) |
| 45 to 54 Years | 0 (0.0%) | 36 (67.9%) |
| 55 to 64 Years | 18 (52.9%) | 29 (85.3%) |
| 65 to 74 Years | 40 (100.0%) | 15 (37.5%) |
| 75 Years and over | 8 (100.0%) | 6 (75.0%) |
| Total | 230 (43.6%) | 213 (40.3%) |
Disability Status by Sex by Age in Oak Park
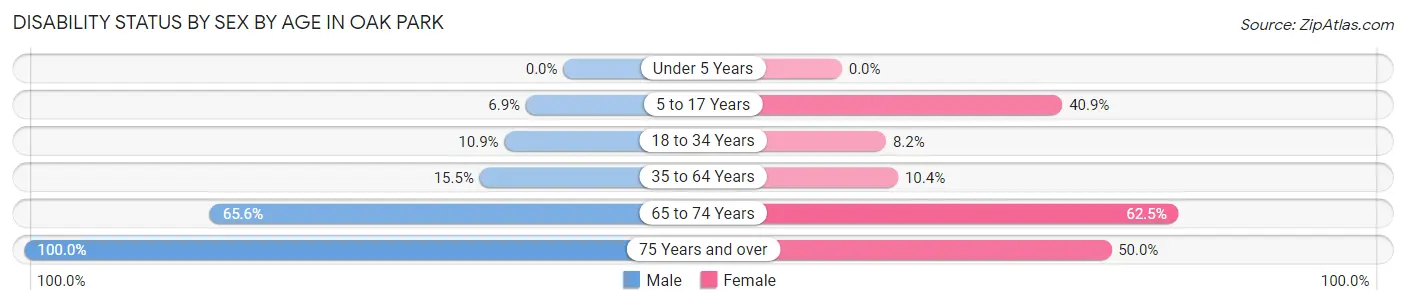
| Age Bracket | Male | Female |
| Under 5 Years | 0 (0.0%) | 0 (0.0%) |
| 5 to 17 Years | 5 (6.9%) | 27 (40.9%) |
| 18 to 34 Years | 7 (10.9%) | 5 (8.2%) |
| 35 to 64 Years | 9 (15.5%) | 12 (10.4%) |
| 65 to 74 Years | 21 (65.6%) | 5 (62.5%) |
| 75 Years and over | 4 (100.0%) | 2 (50.0%) |
Disability Class by Sex by Age in Oak Park
Disability Class: Hearing Difficulty
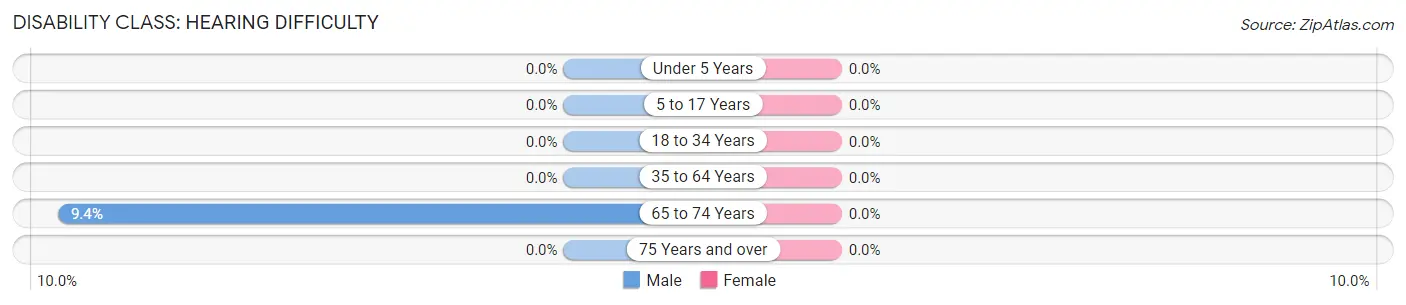
| Age Bracket | Male | Female |
| Under 5 Years | 0 (0.0%) | 0 (0.0%) |
| 5 to 17 Years | 0 (0.0%) | 0 (0.0%) |
| 18 to 34 Years | 0 (0.0%) | 0 (0.0%) |
| 35 to 64 Years | 0 (0.0%) | 0 (0.0%) |
| 65 to 74 Years | 3 (9.4%) | 0 (0.0%) |
| 75 Years and over | 0 (0.0%) | 0 (0.0%) |
Disability Class: Vision Difficulty
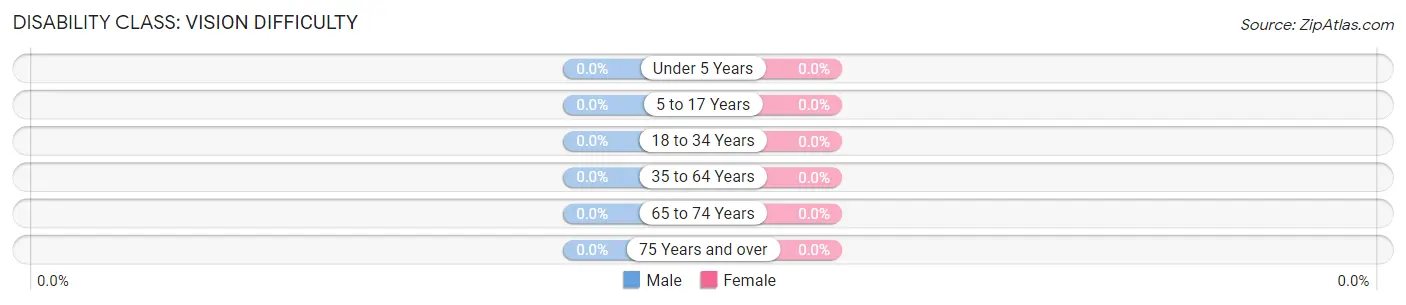
| Age Bracket | Male | Female |
| Under 5 Years | 0 (0.0%) | 0 (0.0%) |
| 5 to 17 Years | 0 (0.0%) | 0 (0.0%) |
| 18 to 34 Years | 0 (0.0%) | 0 (0.0%) |
| 35 to 64 Years | 0 (0.0%) | 0 (0.0%) |
| 65 to 74 Years | 0 (0.0%) | 0 (0.0%) |
| 75 Years and over | 0 (0.0%) | 0 (0.0%) |
Disability Class: Cognitive Difficulty
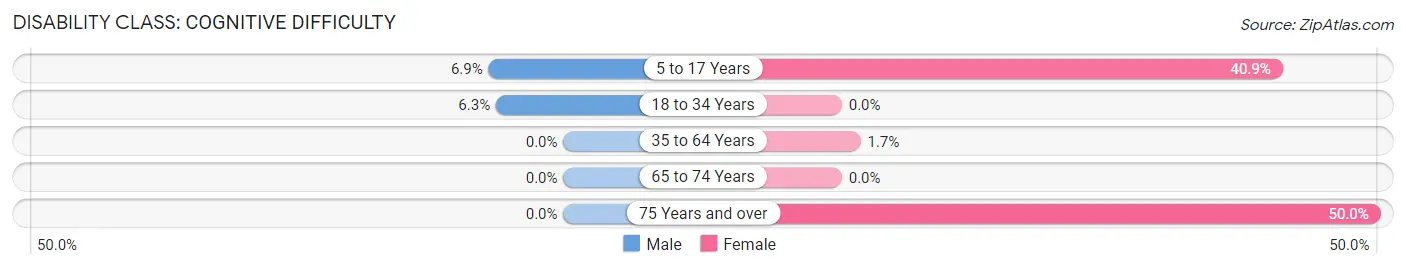
| Age Bracket | Male | Female |
| 5 to 17 Years | 5 (6.9%) | 27 (40.9%) |
| 18 to 34 Years | 4 (6.2%) | 0 (0.0%) |
| 35 to 64 Years | 0 (0.0%) | 2 (1.7%) |
| 65 to 74 Years | 0 (0.0%) | 0 (0.0%) |
| 75 Years and over | 0 (0.0%) | 2 (50.0%) |
Disability Class: Ambulatory Difficulty
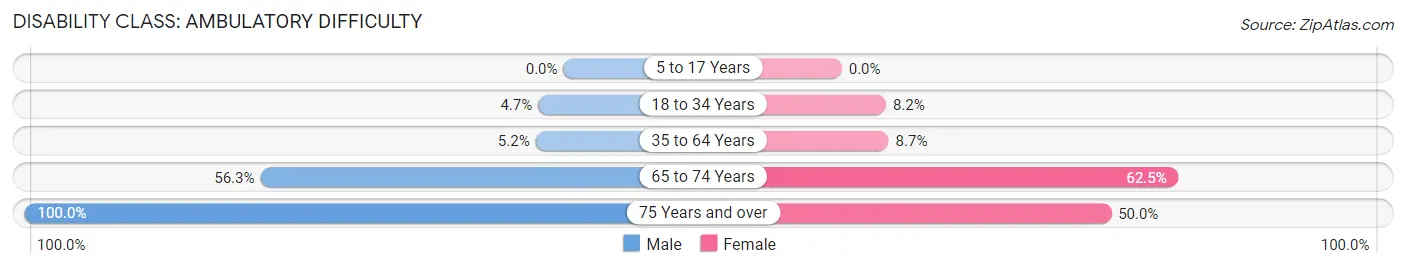
| Age Bracket | Male | Female |
| 5 to 17 Years | 0 (0.0%) | 0 (0.0%) |
| 18 to 34 Years | 3 (4.7%) | 5 (8.2%) |
| 35 to 64 Years | 3 (5.2%) | 10 (8.7%) |
| 65 to 74 Years | 18 (56.2%) | 5 (62.5%) |
| 75 Years and over | 4 (100.0%) | 2 (50.0%) |
Disability Class: Self-Care Difficulty
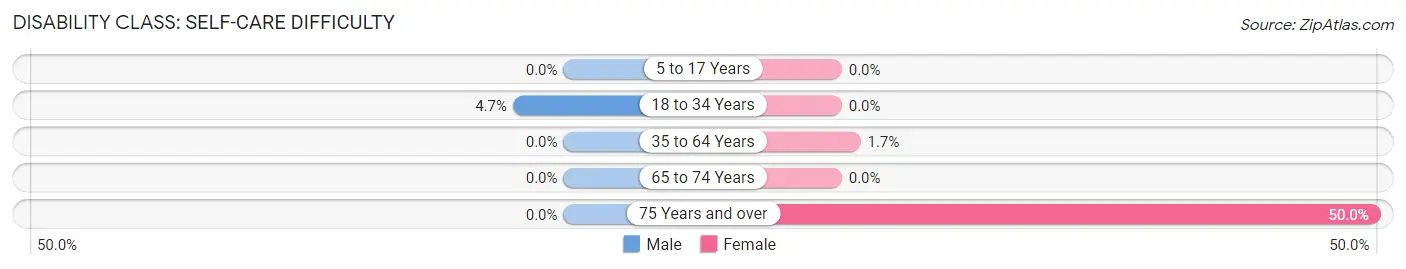
| Age Bracket | Male | Female |
| 5 to 17 Years | 0 (0.0%) | 0 (0.0%) |
| 18 to 34 Years | 3 (4.7%) | 0 (0.0%) |
| 35 to 64 Years | 0 (0.0%) | 2 (1.7%) |
| 65 to 74 Years | 0 (0.0%) | 0 (0.0%) |
| 75 Years and over | 0 (0.0%) | 2 (50.0%) |
Technology Access in Oak Park
Computing Device Access in Oak Park
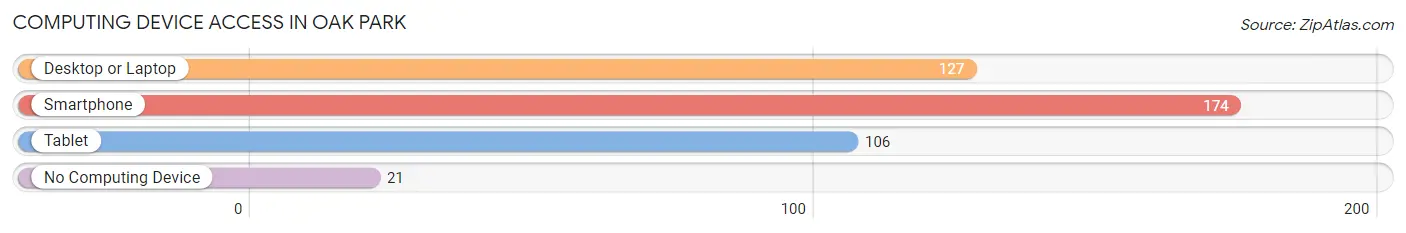
| Device Type | # Households | % Households |
| Desktop or Laptop | 127 | 62.3% |
| Smartphone | 174 | 85.3% |
| Tablet | 106 | 52.0% |
| No Computing Device | 21 | 10.3% |
| Total | 204 | 100.0% |
Internet Access in Oak Park
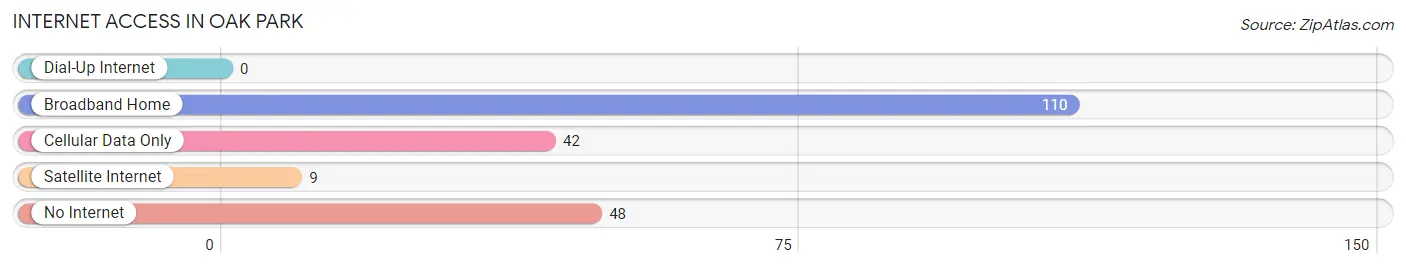
| Internet Type | # Households | % Households |
| Dial-Up Internet | 0 | 0.0% |
| Broadband Home | 110 | 53.9% |
| Cellular Data Only | 42 | 20.6% |
| Satellite Internet | 9 | 4.4% |
| No Internet | 48 | 23.5% |
| Total | 204 | 100.0% |
Oak Park Summary
Oak Park is a small city located in the state of Georgia, United States. It is situated in the northwest corner of the state, in the county of DeKalb. The city is bordered by the cities of Decatur, Avondale Estates, and Stone Mountain. The population of Oak Park was estimated to be 4,845 in 2019.
History
Oak Park was founded in 1887 by a group of settlers from the nearby city of Decatur. The settlers were looking for a place to build a new town and chose the area due to its proximity to the railroad. The town was originally called Oak Park Station, but the name was changed to Oak Park in 1895.
The city was incorporated in 1901 and was the first city in DeKalb County to be incorporated. The city was named after the many oak trees that grew in the area.
In the early 1900s, Oak Park was a thriving community with a variety of businesses, including a cotton gin, a grist mill, a sawmill, and a brickyard. The city also had a post office, a bank, and a hotel.
In the 1920s, the city began to decline due to the Great Depression and the decline of the railroad industry. The city was unable to attract new businesses and the population began to decline.
In the 1950s, the city began to experience a resurgence due to the growth of the Atlanta metropolitan area. The city was able to attract new businesses and the population began to increase.
Geography
Oak Park is located in the northwest corner of the state of Georgia, in the county of DeKalb. The city is bordered by the cities of Decatur, Avondale Estates, and Stone Mountain.
The city has a total area of 1.2 square miles, all of which is land. The city is located at an elevation of 890 feet above sea level.
The city is located in the Piedmont region of Georgia, which is characterized by rolling hills and forests. The city is located in the foothills of the Appalachian Mountains.
Economy
Oak Park is a small city with a limited economy. The city is primarily residential, with most of the population employed in the nearby cities of Decatur and Atlanta.
The city does have some small businesses, including restaurants, retail stores, and professional services. The city also has a few industrial businesses, including a printing company and a metal fabrication company.
Demographics
Oak Park has a population of 4,845, according to the 2019 estimate. The population is primarily African American, with a small percentage of White, Hispanic, and Asian residents.
The median household income in Oak Park is $45,000, which is slightly lower than the median income for the state of Georgia. The median home value in Oak Park is $150,000, which is slightly lower than the median home value for the state of Georgia.
The city has a high rate of poverty, with nearly 30% of the population living below the poverty line. The city also has a high rate of unemployment, with nearly 10% of the population unemployed.
Common Questions
What is the Total Population of Oak Park?
Total Population of Oak Park is 528.
What is the Total Male Population of Oak Park?
Total Male Population of Oak Park is 239.
What is the Total Female Population of Oak Park?
Total Female Population of Oak Park is 289.
What is the Ratio of Males per 100 Females in Oak Park?
There are 82.70 Males per 100 Females in Oak Park.
What is the Ratio of Females per 100 Males in Oak Park?
There are 120.92 Females per 100 Males in Oak Park.
What is the Median Population Age in Oak Park?
Median Population Age in Oak Park is 31.3 Years.
What is the Average Family Size in Oak Park
Average Family Size in Oak Park is 3.0 People.
What is the Average Household Size in Oak Park
Average Household Size in Oak Park is 2.6 People.
What is Per Capita Income in Oak Park?
Per Capita income in Oak Park is $16,374.
What is the Median Family Income in Oak Park?
Median Family Income in Oak Park is $39,432.
What is the Median Household income in Oak Park?
Median Household Income in Oak Park is $37,727.
What is Income or Wage Gap in Oak Park?
Income or Wage Gap in Oak Park is 43.7%.
Women in Oak Park earn 56.3 cents for every dollar earned by a man.
What is Inequality or Gini Index in Oak Park?
Inequality or Gini Index in Oak Park is 0.45.
How Large is the Labor Force in Oak Park?
There are 221 People in the Labor Forcein in Oak Park.
What is the Percentage of People in the Labor Force in Oak Park?
63.3% of People are in the Labor Force in Oak Park.
What is the Unemployment Rate in Oak Park?
Unemployment Rate in Oak Park is 12.7%.