Moreland, GA
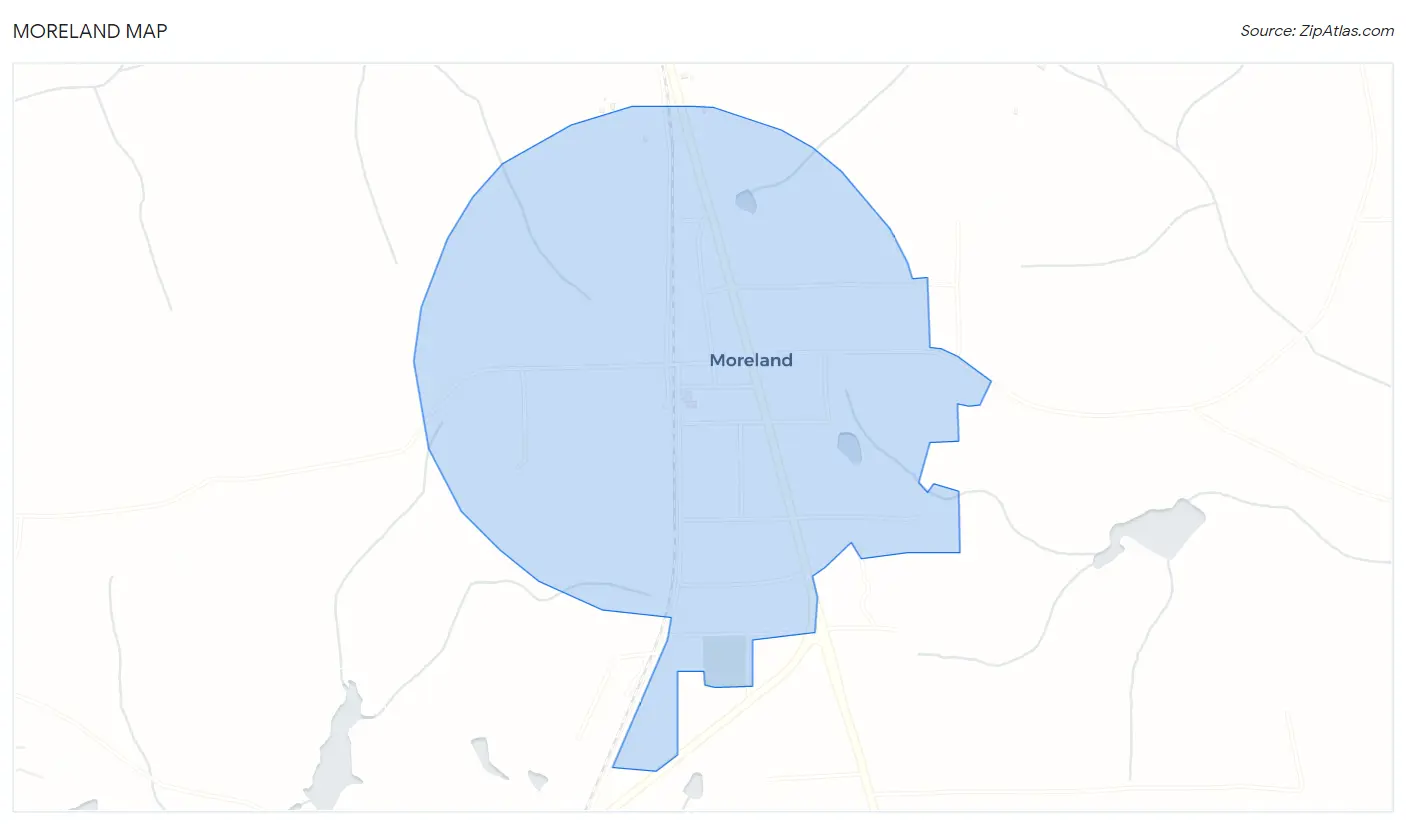
Moreland Map
Moreland Overview
608
TOTAL POPULATION
350
MALE POPULATION
258
FEMALE POPULATION
135.66
MALES / 100 FEMALES
73.71
FEMALES / 100 MALES
31.9
MEDIAN AGE
3.4
AVG FAMILY SIZE
2.9
AVG HOUSEHOLD SIZE
$37,290
PER CAPITA INCOME
$113,958
AVG FAMILY INCOME
$86,250
AVG HOUSEHOLD INCOME
13.5%
WAGE / INCOME GAP [ % ]
86.5¢/ $1
WAGE / INCOME GAP [ $ ]
0.41
INEQUALITY / GINI INDEX
262
LABOR FORCE [ PEOPLE ]
58.2%
PERCENT IN LABOR FORCE
4.2%
UNEMPLOYMENT RATE
Moreland Zip Codes
Moreland Area Codes
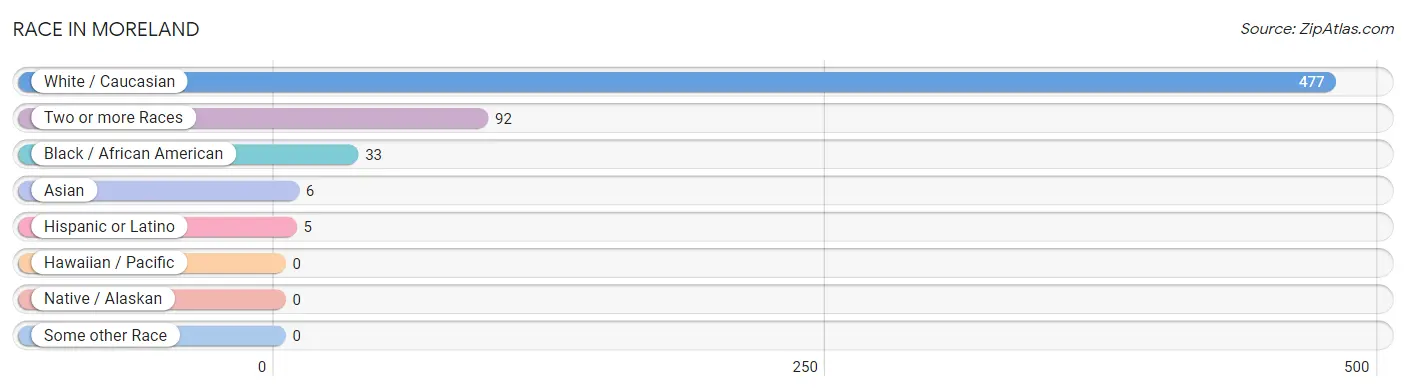
Race in Moreland
The most populous races in Moreland are White / Caucasian (477 | 78.4%), Two or more Races (92 | 15.1%), and Black / African American (33 | 5.4%).
| Race | # Population | % Population |
| Asian | 6 | 1.0% |
| Black / African American | 33 | 5.4% |
| Hawaiian / Pacific | 0 | 0.0% |
| Hispanic or Latino | 5 | 0.8% |
| Native / Alaskan | 0 | 0.0% |
| White / Caucasian | 477 | 78.4% |
| Two or more Races | 92 | 15.1% |
| Some other Race | 0 | 0.0% |
| Total | 608 | 100.0% |
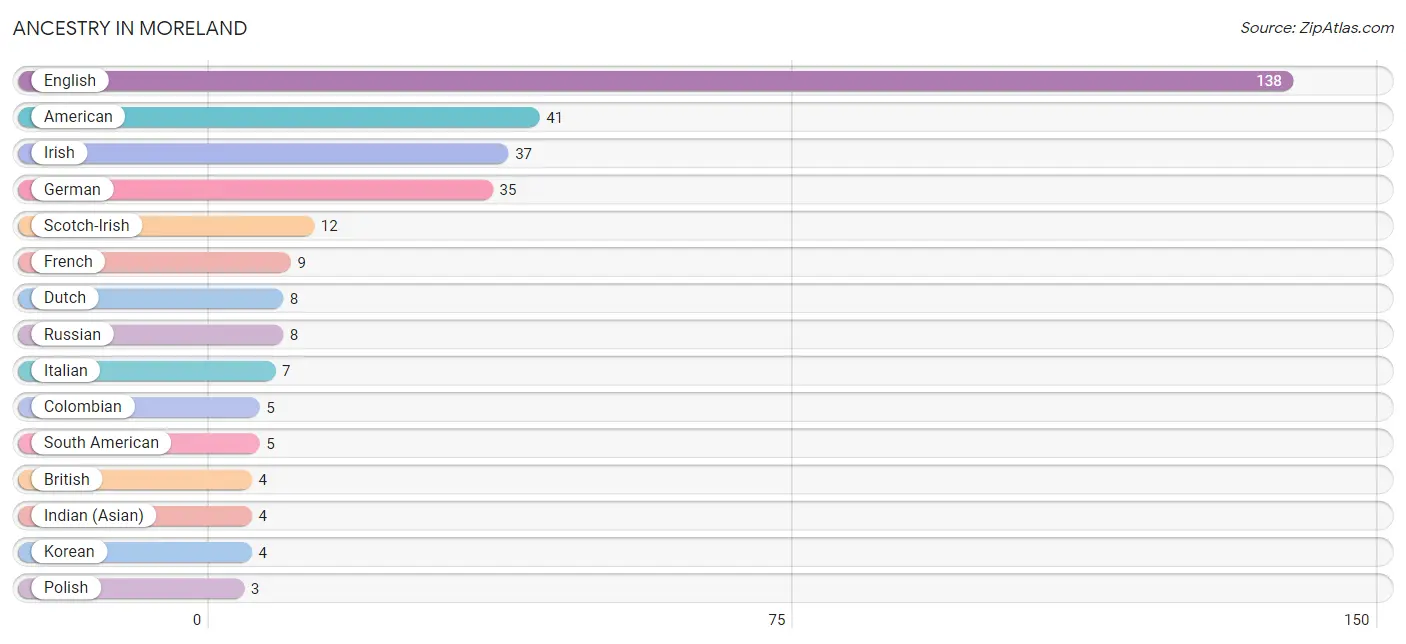
Ancestry in Moreland
The most populous ancestries reported in Moreland are English (138 | 22.7%), American (41 | 6.7%), Irish (37 | 6.1%), German (35 | 5.8%), and Scotch-Irish (12 | 2.0%), together accounting for 43.3% of all Moreland residents.
| Ancestry | # Population | % Population |
| American | 41 | 6.7% |
| Bhutanese | 2 | 0.3% |
| Brazilian | 2 | 0.3% |
| British | 4 | 0.7% |
| Colombian | 5 | 0.8% |
| Dutch | 8 | 1.3% |
| English | 138 | 22.7% |
| French | 9 | 1.5% |
| German | 35 | 5.8% |
| Indian (Asian) | 4 | 0.7% |
| Irish | 37 | 6.1% |
| Italian | 7 | 1.1% |
| Korean | 4 | 0.7% |
| Polish | 3 | 0.5% |
| Russian | 8 | 1.3% |
| Scotch-Irish | 12 | 2.0% |
| Scottish | 1 | 0.2% |
| South American | 5 | 0.8% |
| U.S. Virgin Islander | 1 | 0.2% | View All 19 Rows |
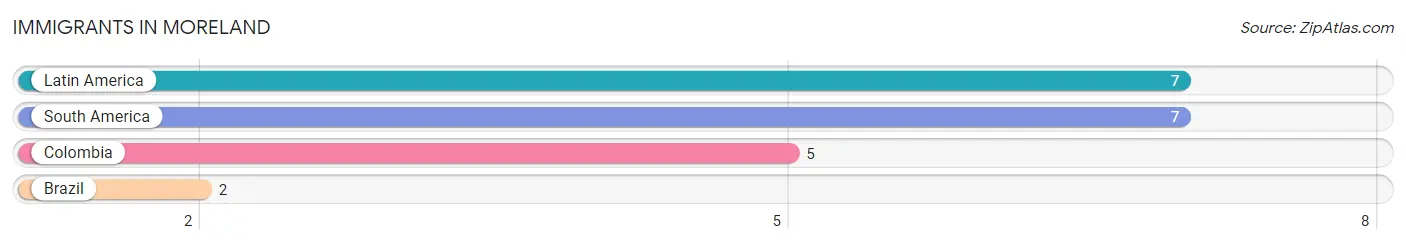
Immigrants in Moreland
The most numerous immigrant groups reported in Moreland came from Latin America (7 | 1.1%), South America (7 | 1.1%), Colombia (5 | 0.8%), and Brazil (2 | 0.3%), together accounting for 3.4% of all Moreland residents.
| Immigration Origin | # Population | % Population |
| Brazil | 2 | 0.3% |
| Colombia | 5 | 0.8% |
| Latin America | 7 | 1.1% |
| South America | 7 | 1.1% | View All 4 Rows |
Sex and Age in Moreland
Sex and Age in Moreland
The most populous age groups in Moreland are Under 5 Years (87 | 24.9%) for men and 55 to 59 Years (34 | 13.2%) for women.
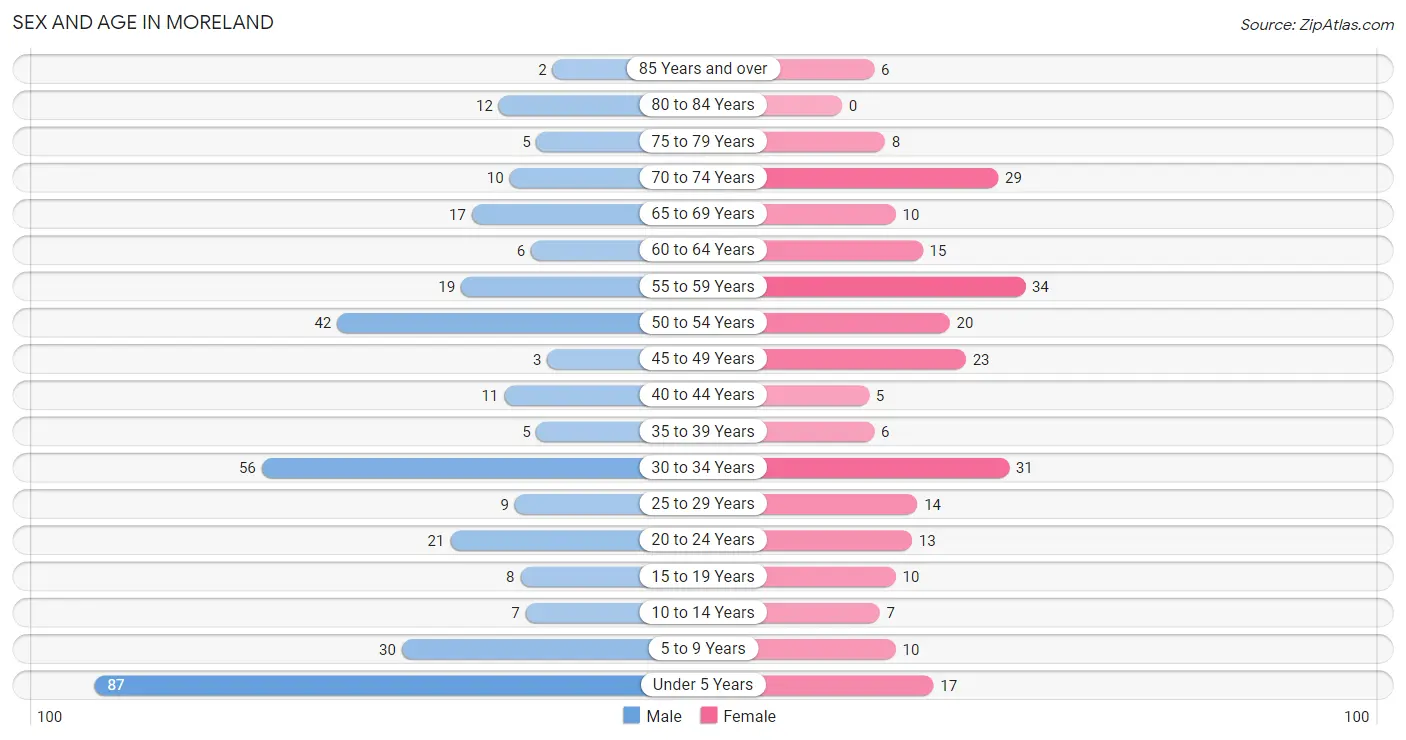
| Age Bracket | Male | Female |
| Under 5 Years | 87 (24.9%) | 17 (6.6%) |
| 5 to 9 Years | 30 (8.6%) | 10 (3.9%) |
| 10 to 14 Years | 7 (2.0%) | 7 (2.7%) |
| 15 to 19 Years | 8 (2.3%) | 10 (3.9%) |
| 20 to 24 Years | 21 (6.0%) | 13 (5.0%) |
| 25 to 29 Years | 9 (2.6%) | 14 (5.4%) |
| 30 to 34 Years | 56 (16.0%) | 31 (12.0%) |
| 35 to 39 Years | 5 (1.4%) | 6 (2.3%) |
| 40 to 44 Years | 11 (3.1%) | 5 (1.9%) |
| 45 to 49 Years | 3 (0.9%) | 23 (8.9%) |
| 50 to 54 Years | 42 (12.0%) | 20 (7.7%) |
| 55 to 59 Years | 19 (5.4%) | 34 (13.2%) |
| 60 to 64 Years | 6 (1.7%) | 15 (5.8%) |
| 65 to 69 Years | 17 (4.9%) | 10 (3.9%) |
| 70 to 74 Years | 10 (2.9%) | 29 (11.2%) |
| 75 to 79 Years | 5 (1.4%) | 8 (3.1%) |
| 80 to 84 Years | 12 (3.4%) | 0 (0.0%) |
| 85 Years and over | 2 (0.6%) | 6 (2.3%) |
| Total | 350 (100.0%) | 258 (100.0%) |
Families and Households in Moreland
Median Family Size in Moreland
The median family size in Moreland is 3.39 persons per family, with single male/father families (9 | 5.7%) accounting for the largest median family size of 4.56 persons per family. On the other hand, married-couple families (136 | 86.6%) represent the smallest median family size with 3.31 persons per family.
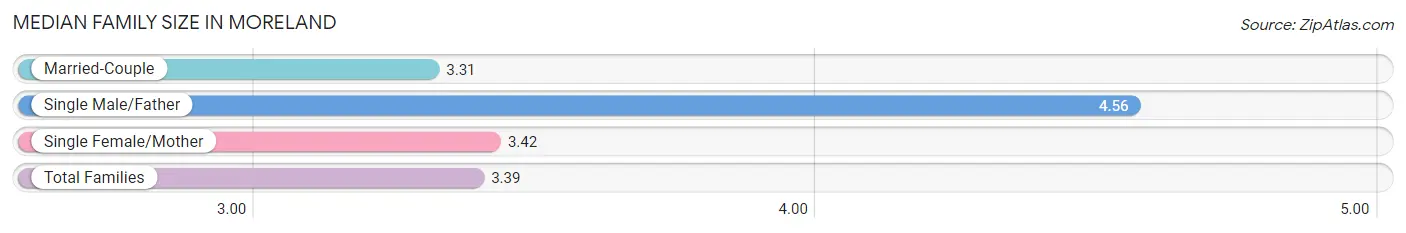
| Family Type | # Families | Family Size |
| Married-Couple | 136 (86.6%) | 3.31 |
| Single Male/Father | 9 (5.7%) | 4.56 |
| Single Female/Mother | 12 (7.6%) | 3.42 |
| Total Families | 157 (100.0%) | 3.39 |
Median Household Size in Moreland
The median household size in Moreland is 2.91 persons per household, with single male/father households (9 | 4.3%) accounting for the largest median household size of 5 persons per household. non-family households (52 | 24.9%) represent the smallest median household size with 1.35 persons per household.
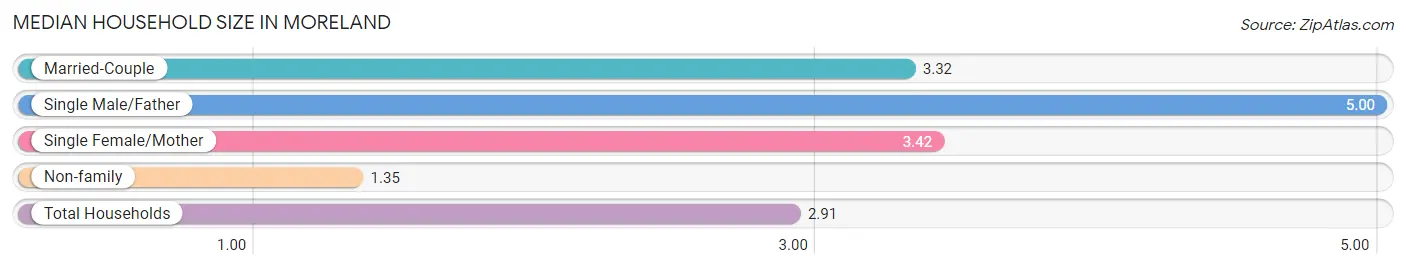
| Household Type | # Households | Household Size |
| Married-Couple | 136 (65.1%) | 3.32 |
| Single Male/Father | 9 (4.3%) | 5.00 |
| Single Female/Mother | 12 (5.7%) | 3.42 |
| Non-family | 52 (24.9%) | 1.35 |
| Total Households | 209 (100.0%) | 2.91 |
Household Size by Marriage Status in Moreland
Out of a total of 209 households in Moreland, 157 (75.1%) are family households, while 52 (24.9%) are nonfamily households. The most numerous type of family households are 2-person households, comprising 66, and the most common type of nonfamily households are 1-person households, comprising 40.
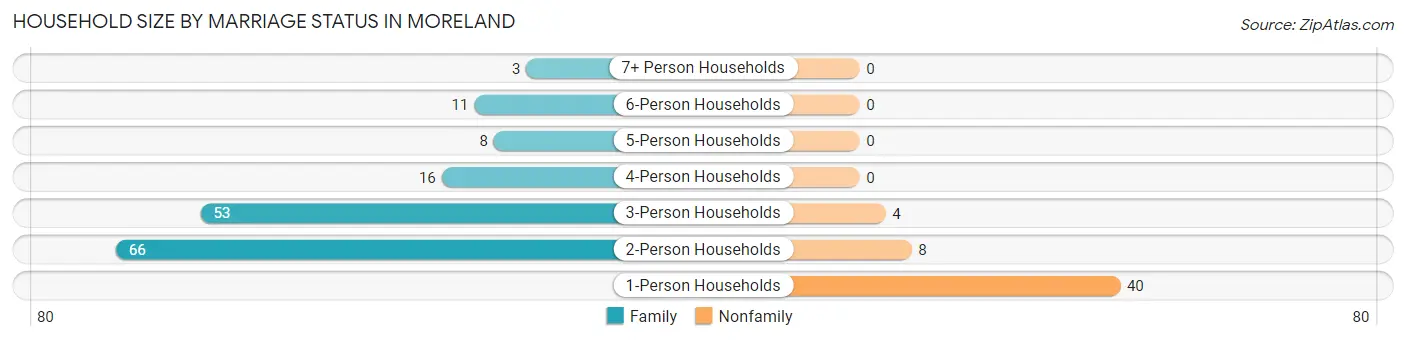
| Household Size | Family Households | Nonfamily Households |
| 1-Person Households | - | 40 (19.1%) |
| 2-Person Households | 66 (31.6%) | 8 (3.8%) |
| 3-Person Households | 53 (25.4%) | 4 (1.9%) |
| 4-Person Households | 16 (7.7%) | 0 (0.0%) |
| 5-Person Households | 8 (3.8%) | 0 (0.0%) |
| 6-Person Households | 11 (5.3%) | 0 (0.0%) |
| 7+ Person Households | 3 (1.4%) | 0 (0.0%) |
| Total | 157 (75.1%) | 52 (24.9%) |
Female Fertility in Moreland
Fertility by Age in Moreland
Average fertility rate in Moreland is 29.0 births per 1,000 women. Women in the age bracket of 20 to 34 years have the highest fertility rate with 52.0 births per 1,000 women. Women in the age bracket of 20 to 34 years acount for 100.0% of all women with births.
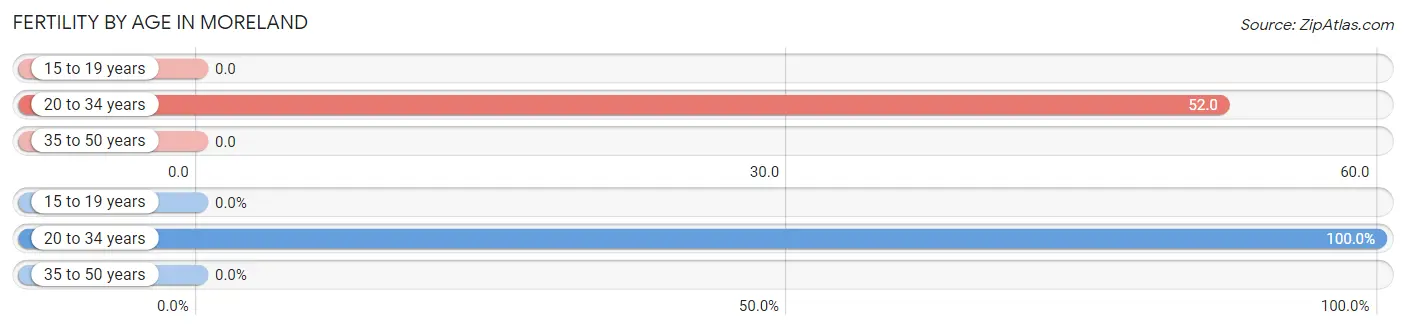
| Age Bracket | Women with Births | Births / 1,000 Women |
| 15 to 19 years | 0 (0.0%) | 0.0 |
| 20 to 34 years | 3 (100.0%) | 52.0 |
| 35 to 50 years | 0 (0.0%) | 0.0 |
| Total | 3 (100.0%) | 29.0 |
Fertility by Age by Marriage Status in Moreland
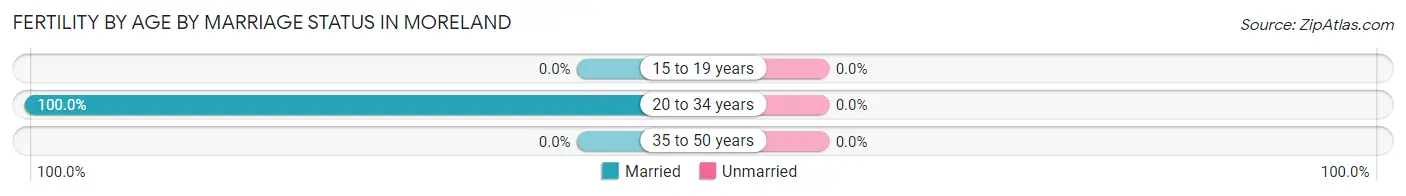
| Age Bracket | Married | Unmarried |
| 15 to 19 years | 0 (0.0%) | 0 (0.0%) |
| 20 to 34 years | 3 (100.0%) | 0 (0.0%) |
| 35 to 50 years | 0 (0.0%) | 0 (0.0%) |
| Total | 3 (100.0%) | 0 (0.0%) |
Fertility by Education in Moreland
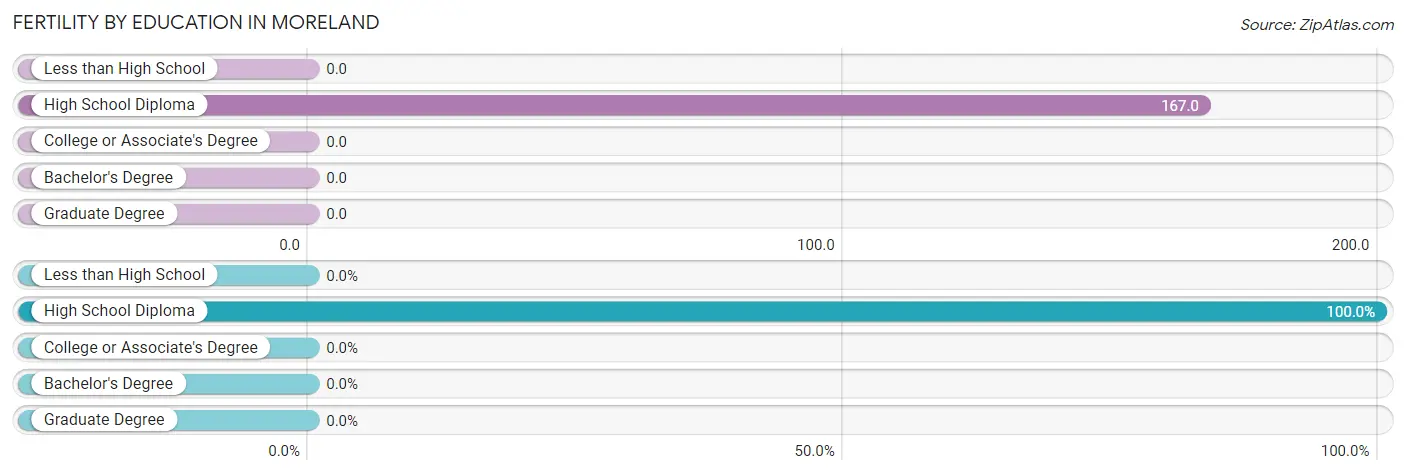
| Educational Attainment | Women with Births | Births / 1,000 Women |
| Less than High School | 0 (0.0%) | 0.0 |
| High School Diploma | 3 (100.0%) | 167.0 |
| College or Associate's Degree | 0 (0.0%) | 0.0 |
| Bachelor's Degree | 0 (0.0%) | 0.0 |
| Graduate Degree | 0 (0.0%) | 0.0 |
| Total | 3 (100.0%) | 29.0 |
Fertility by Education by Marriage Status in Moreland
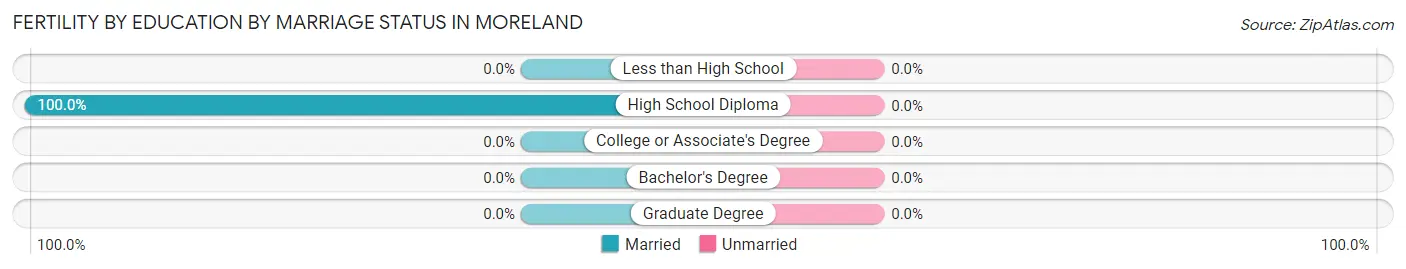
| Educational Attainment | Married | Unmarried |
| Less than High School | 0 (0.0%) | 0 (0.0%) |
| High School Diploma | 3 (100.0%) | 0 (0.0%) |
| College or Associate's Degree | 0 (0.0%) | 0 (0.0%) |
| Bachelor's Degree | 0 (0.0%) | 0 (0.0%) |
| Graduate Degree | 0 (0.0%) | 0 (0.0%) |
| Total | 3 (100.0%) | 0 (0.0%) |
Income in Moreland
Income Overview in Moreland
Per Capita Income in Moreland is $37,290, while median incomes of families and households are $113,958 and $86,250 respectively.
| Characteristic | Number | Measure |
| Per Capita Income | 608 | $37,290 |
| Median Family Income | 157 | $113,958 |
| Mean Family Income | 157 | $135,389 |
| Median Household Income | 209 | $86,250 |
| Mean Household Income | 209 | $111,777 |
| Income Deficit | 157 | $0 |
| Wage / Income Gap (%) | 608 | 13.47% |
| Wage / Income Gap ($) | 608 | 86.53¢ per $1 |
| Gini / Inequality Index | 608 | 0.41 |
Earnings by Sex in Moreland
Average Earnings in Moreland are $58,333, $61,875 for men and $53,542 for women, a difference of 13.5%.
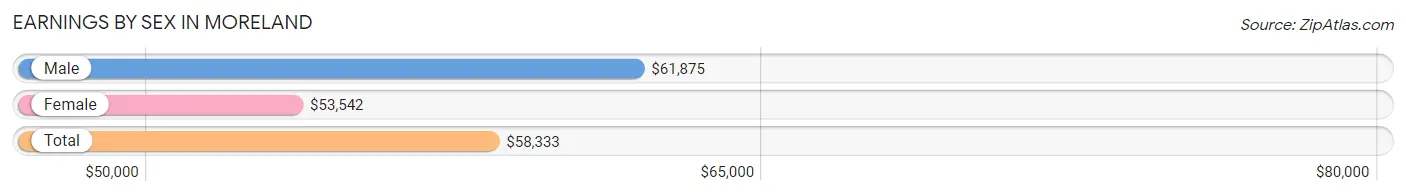
| Sex | Number | Average Earnings |
| Male | 141 (53.8%) | $61,875 |
| Female | 121 (46.2%) | $53,542 |
| Total | 262 (100.0%) | $58,333 |
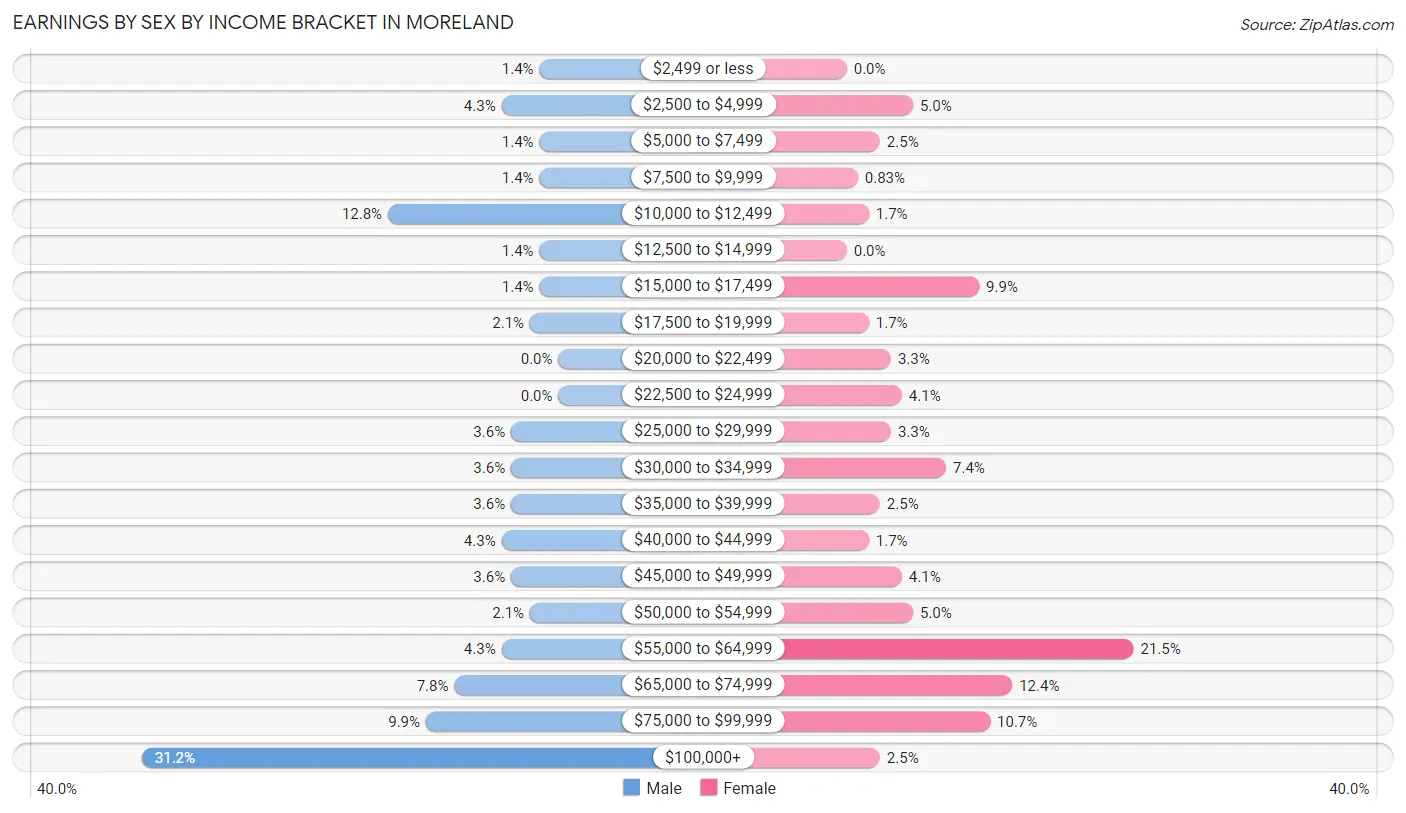
Earnings by Sex by Income Bracket in Moreland
The most common earnings brackets in Moreland are $100,000+ for men (44 | 31.2%) and $55,000 to $64,999 for women (26 | 21.5%).
| Income | Male | Female |
| $2,499 or less | 2 (1.4%) | 0 (0.0%) |
| $2,500 to $4,999 | 6 (4.3%) | 6 (5.0%) |
| $5,000 to $7,499 | 2 (1.4%) | 3 (2.5%) |
| $7,500 to $9,999 | 2 (1.4%) | 1 (0.8%) |
| $10,000 to $12,499 | 18 (12.8%) | 2 (1.7%) |
| $12,500 to $14,999 | 2 (1.4%) | 0 (0.0%) |
| $15,000 to $17,499 | 2 (1.4%) | 12 (9.9%) |
| $17,500 to $19,999 | 3 (2.1%) | 2 (1.7%) |
| $20,000 to $22,499 | 0 (0.0%) | 4 (3.3%) |
| $22,500 to $24,999 | 0 (0.0%) | 5 (4.1%) |
| $25,000 to $29,999 | 5 (3.5%) | 4 (3.3%) |
| $30,000 to $34,999 | 5 (3.5%) | 9 (7.4%) |
| $35,000 to $39,999 | 5 (3.5%) | 3 (2.5%) |
| $40,000 to $44,999 | 6 (4.3%) | 2 (1.7%) |
| $45,000 to $49,999 | 5 (3.5%) | 5 (4.1%) |
| $50,000 to $54,999 | 3 (2.1%) | 6 (5.0%) |
| $55,000 to $64,999 | 6 (4.3%) | 26 (21.5%) |
| $65,000 to $74,999 | 11 (7.8%) | 15 (12.4%) |
| $75,000 to $99,999 | 14 (9.9%) | 13 (10.7%) |
| $100,000+ | 44 (31.2%) | 3 (2.5%) |
| Total | 141 (100.0%) | 121 (100.0%) |
Earnings by Sex by Educational Attainment in Moreland
Average earnings in Moreland are $70,938 for men and $60,625 for women, a difference of 14.5%. Men with an educational attainment of college or associate's degree enjoy the highest average annual earnings of $78,958, while those with college or associate's degree education earn the least with $78,958. Women with an educational attainment of bachelor's degree earn the most with the average annual earnings of $64,167, while those with graduate degree education have the smallest earnings of $31,500.
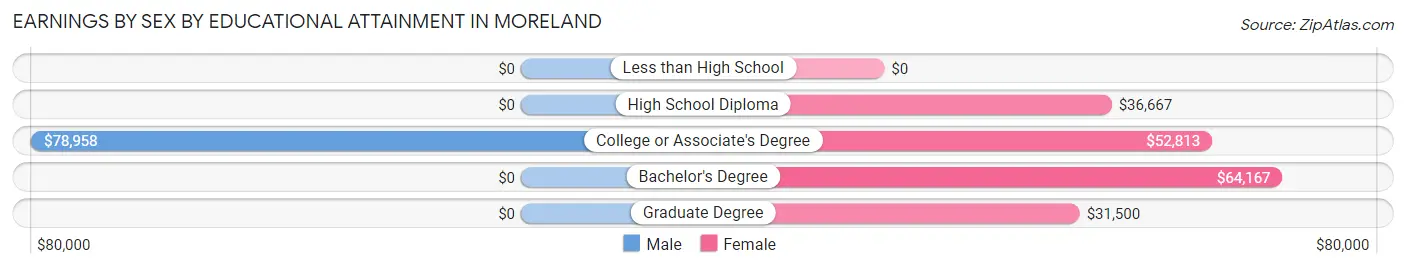
| Educational Attainment | Male Income | Female Income |
| Less than High School | - | - |
| High School Diploma | - | - |
| College or Associate's Degree | $78,958 | $52,813 |
| Bachelor's Degree | - | - |
| Graduate Degree | - | - |
| Total | $70,938 | $60,625 |
Family Income in Moreland
Family Income Brackets in Moreland
According to the Moreland family income data, there are 47 families falling into the $100,000 to $149,999 income range, which is the most common income bracket and makes up 29.9% of all families. Conversely, the less than $10,000 income bracket is the least frequent group with only 1 families (0.6%) belonging to this category.
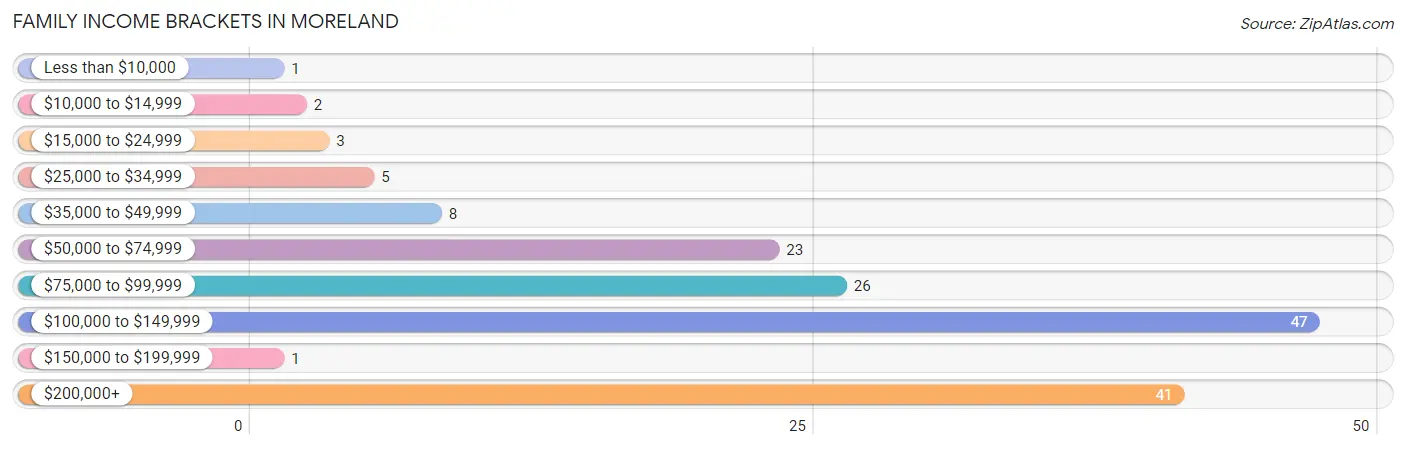
| Income Bracket | # Families | % Families |
| Less than $10,000 | 1 | 0.6% |
| $10,000 to $14,999 | 2 | 1.3% |
| $15,000 to $24,999 | 3 | 1.9% |
| $25,000 to $34,999 | 5 | 3.2% |
| $35,000 to $49,999 | 8 | 5.1% |
| $50,000 to $74,999 | 23 | 14.6% |
| $75,000 to $99,999 | 26 | 16.6% |
| $100,000 to $149,999 | 47 | 29.9% |
| $150,000 to $199,999 | 1 | 0.6% |
| $200,000+ | 41 | 26.1% |
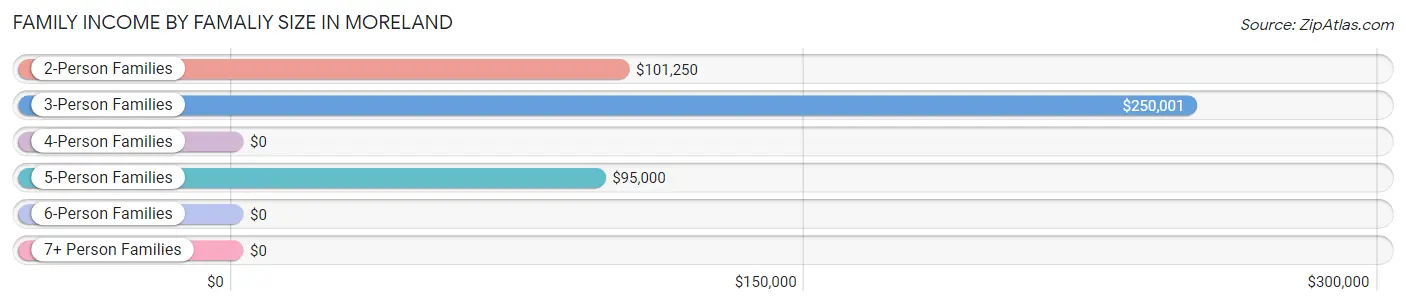
Family Income by Famaliy Size in Moreland
3-person families (53 | 33.8%) account for the highest median family income in Moreland with $250,001 per family, while 3-person families (53 | 33.8%) have the highest median income of $83,334 per family member.
| Income Bracket | # Families | Median Income |
| 2-Person Families | 68 (43.3%) | $101,250 |
| 3-Person Families | 53 (33.8%) | $250,001 |
| 4-Person Families | 14 (8.9%) | $0 |
| 5-Person Families | 8 (5.1%) | $95,000 |
| 6-Person Families | 11 (7.0%) | $0 |
| 7+ Person Families | 3 (1.9%) | $0 |
| Total | 157 (100.0%) | $113,958 |
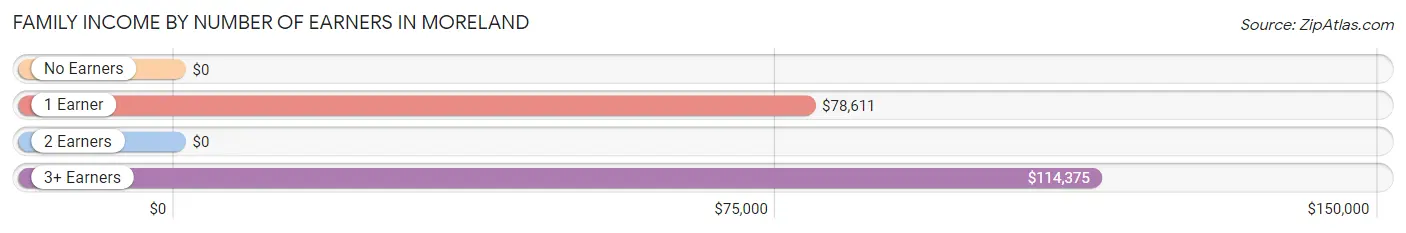
Family Income by Number of Earners in Moreland
| Number of Earners | # Families | Median Income |
| No Earners | 33 (21.0%) | $0 |
| 1 Earner | 34 (21.7%) | $78,611 |
| 2 Earners | 76 (48.4%) | $0 |
| 3+ Earners | 14 (8.9%) | $114,375 |
| Total | 157 (100.0%) | $113,958 |
Household Income in Moreland
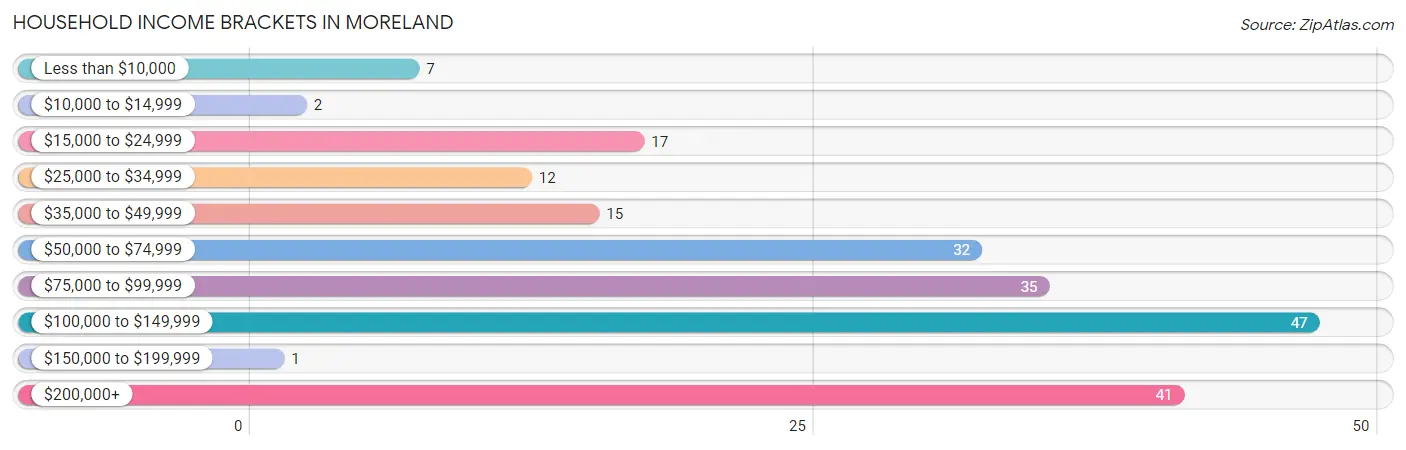
Household Income Brackets in Moreland
With 47 households falling in the category, the $100,000 to $149,999 income range is the most frequent in Moreland, accounting for 22.5% of all households. In contrast, only 1 households (0.5%) fall into the $150,000 to $199,999 income bracket, making it the least populous group.
| Income Bracket | # Households | % Households |
| Less than $10,000 | 7 | 3.3% |
| $10,000 to $14,999 | 2 | 1.0% |
| $15,000 to $24,999 | 17 | 8.1% |
| $25,000 to $34,999 | 12 | 5.7% |
| $35,000 to $49,999 | 15 | 7.2% |
| $50,000 to $74,999 | 32 | 15.3% |
| $75,000 to $99,999 | 35 | 16.7% |
| $100,000 to $149,999 | 47 | 22.5% |
| $150,000 to $199,999 | 1 | 0.5% |
| $200,000+ | 41 | 19.6% |
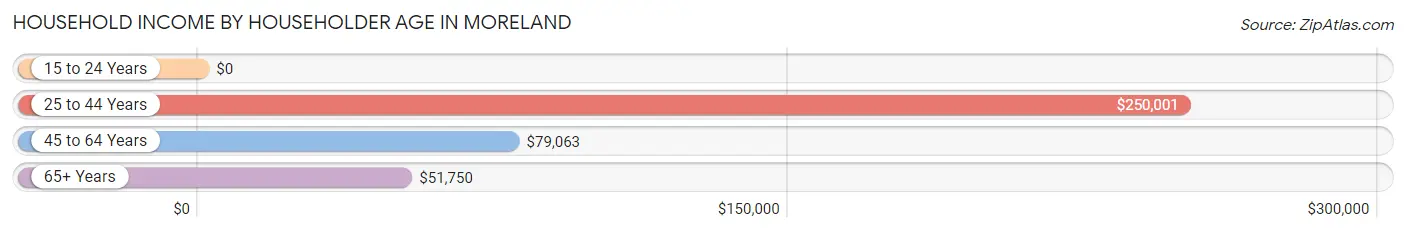
Household Income by Householder Age in Moreland
The median household income in Moreland is $86,250, with the highest median household income of $250,001 found in the 25 to 44 years age bracket for the primary householder. A total of 55 households (26.3%) fall into this category. Meanwhile, the 15 to 24 years age bracket for the primary householder has the lowest median household income of $0, with 5 households (2.4%) in this group.
| Income Bracket | # Households | Median Income |
| 15 to 24 Years | 5 (2.4%) | $0 |
| 25 to 44 Years | 55 (26.3%) | $250,001 |
| 45 to 64 Years | 86 (41.1%) | $79,063 |
| 65+ Years | 63 (30.1%) | $51,750 |
| Total | 209 (100.0%) | $86,250 |
Poverty in Moreland
Income Below Poverty by Sex and Age in Moreland
With 3.1% poverty level for males and 9.7% for females among the residents of Moreland, 6 to 11 year old males and 6 to 11 year old females are the most vulnerable to poverty, with 1 males (33.3%) and 2 females (40.0%) in their respective age groups living below the poverty level.
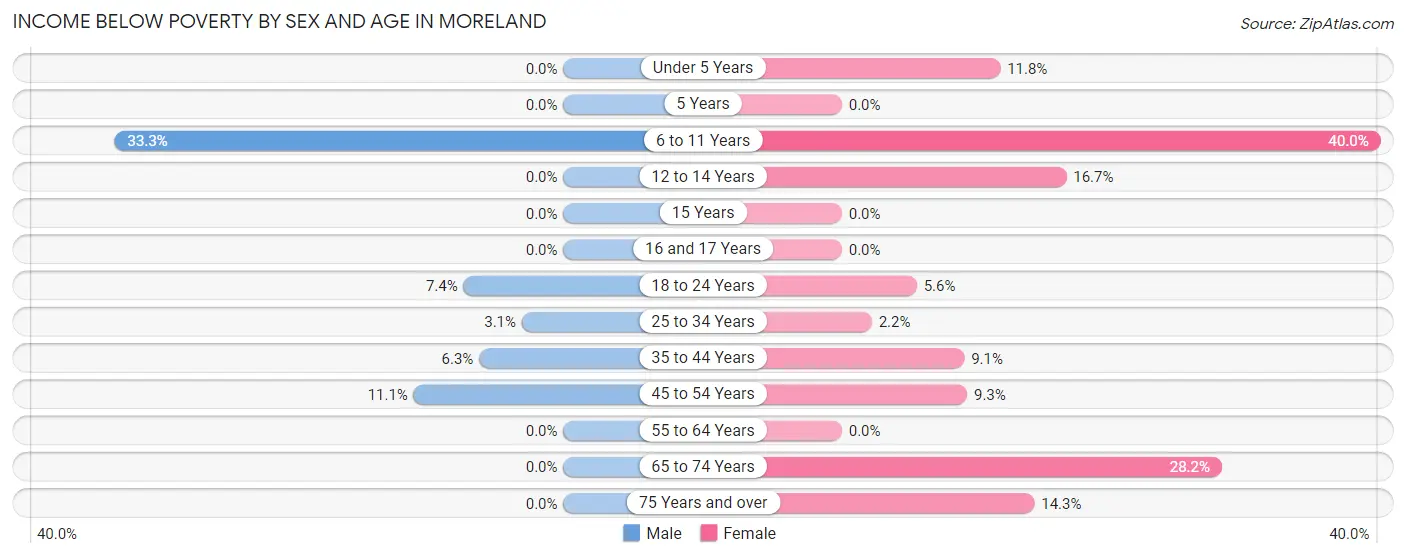
| Age Bracket | Male | Female |
| Under 5 Years | 0 (0.0%) | 2 (11.8%) |
| 5 Years | 0 (0.0%) | 0 (0.0%) |
| 6 to 11 Years | 1 (33.3%) | 2 (40.0%) |
| 12 to 14 Years | 0 (0.0%) | 1 (16.7%) |
| 15 Years | 0 (0.0%) | 0 (0.0%) |
| 16 and 17 Years | 0 (0.0%) | 0 (0.0%) |
| 18 to 24 Years | 2 (7.4%) | 1 (5.6%) |
| 25 to 34 Years | 2 (3.1%) | 1 (2.2%) |
| 35 to 44 Years | 1 (6.2%) | 1 (9.1%) |
| 45 to 54 Years | 5 (11.1%) | 4 (9.3%) |
| 55 to 64 Years | 0 (0.0%) | 0 (0.0%) |
| 65 to 74 Years | 0 (0.0%) | 11 (28.2%) |
| 75 Years and over | 0 (0.0%) | 2 (14.3%) |
| Total | 11 (3.1%) | 25 (9.7%) |
Income Above Poverty by Sex and Age in Moreland
According to the poverty statistics in Moreland, males aged under 5 years and females aged 5 years are the age groups that are most secure financially, with 100.0% of males and 100.0% of females in these age groups living above the poverty line.
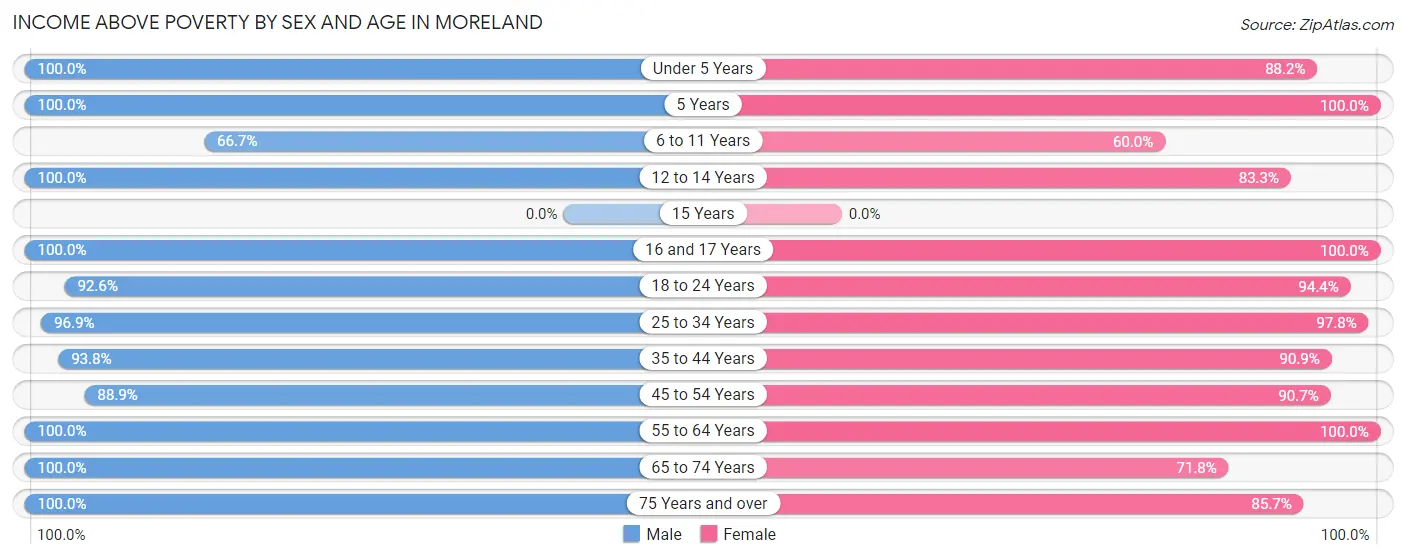
| Age Bracket | Male | Female |
| Under 5 Years | 87 (100.0%) | 15 (88.2%) |
| 5 Years | 28 (100.0%) | 6 (100.0%) |
| 6 to 11 Years | 2 (66.7%) | 3 (60.0%) |
| 12 to 14 Years | 6 (100.0%) | 5 (83.3%) |
| 15 Years | 0 (0.0%) | 0 (0.0%) |
| 16 and 17 Years | 2 (100.0%) | 5 (100.0%) |
| 18 to 24 Years | 25 (92.6%) | 17 (94.4%) |
| 25 to 34 Years | 63 (96.9%) | 44 (97.8%) |
| 35 to 44 Years | 15 (93.8%) | 10 (90.9%) |
| 45 to 54 Years | 40 (88.9%) | 39 (90.7%) |
| 55 to 64 Years | 25 (100.0%) | 49 (100.0%) |
| 65 to 74 Years | 27 (100.0%) | 28 (71.8%) |
| 75 Years and over | 19 (100.0%) | 12 (85.7%) |
| Total | 339 (96.9%) | 233 (90.3%) |
Income Below Poverty Among Married-Couple Families in Moreland
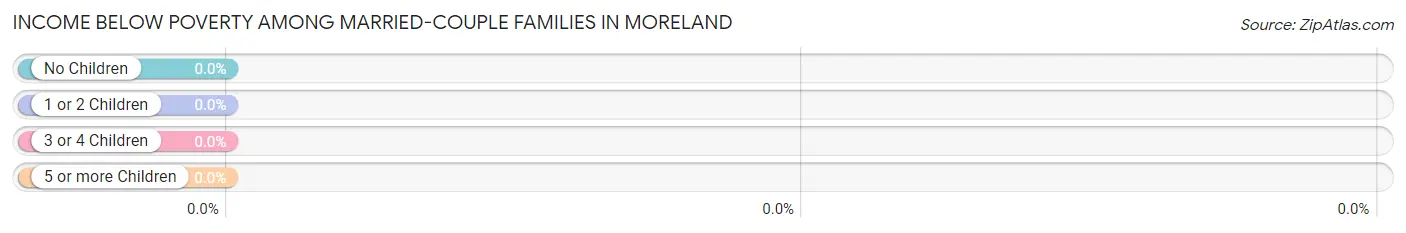
| Children | Above Poverty | Below Poverty |
| No Children | 68 (100.0%) | 0 (0.0%) |
| 1 or 2 Children | 65 (100.0%) | 0 (0.0%) |
| 3 or 4 Children | 3 (100.0%) | 0 (0.0%) |
| 5 or more Children | 0 (0.0%) | 0 (0.0%) |
| Total | 136 (100.0%) | 0 (0.0%) |
Income Below Poverty Among Single-Parent Households in Moreland
According to the poverty data in Moreland, 11.1% or 1 single-father households and 25.0% or 3 single-mother households are living below the poverty line. Among single-father households, those with 1 or 2 children have the highest poverty rate, with 1 households (20.0%) experiencing poverty. Likewise, among single-mother households, those with 1 or 2 children have the highest poverty rate, with 1 households (50.0%) falling below the poverty line.
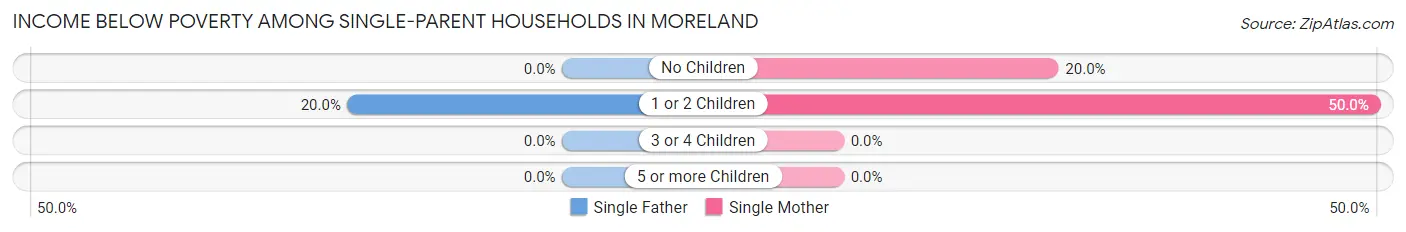
| Children | Single Father | Single Mother |
| No Children | 0 (0.0%) | 2 (20.0%) |
| 1 or 2 Children | 1 (20.0%) | 1 (50.0%) |
| 3 or 4 Children | 0 (0.0%) | 0 (0.0%) |
| 5 or more Children | 0 (0.0%) | 0 (0.0%) |
| Total | 1 (11.1%) | 3 (25.0%) |
Income Below Poverty Among Married-Couple vs Single-Parent Households in Moreland
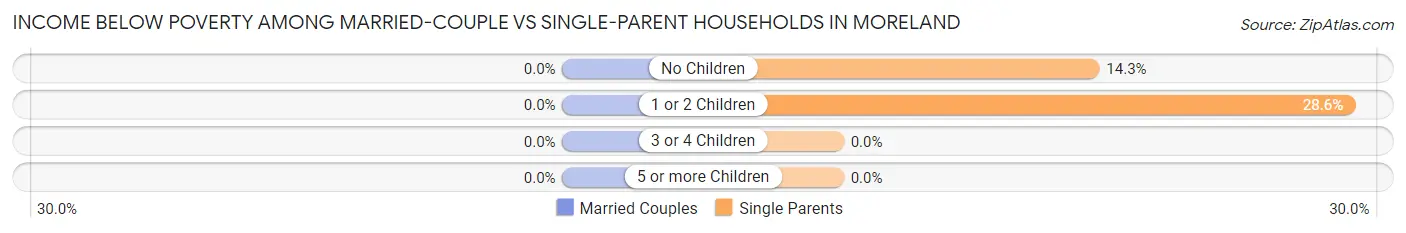
| Children | Married-Couple Families | Single-Parent Households |
| No Children | 0 (0.0%) | 2 (14.3%) |
| 1 or 2 Children | 0 (0.0%) | 2 (28.6%) |
| 3 or 4 Children | 0 (0.0%) | 0 (0.0%) |
| 5 or more Children | 0 (0.0%) | 0 (0.0%) |
| Total | 0 (0.0%) | 4 (19.1%) |
Employment Characteristics in Moreland
Employment by Class of Employer in Moreland
Among the 242 employed individuals in Moreland, private company employees (130 | 53.7%), self-employed (not incorporated) (47 | 19.4%), and local government employees (46 | 19.0%) make up the most common classes of employment.
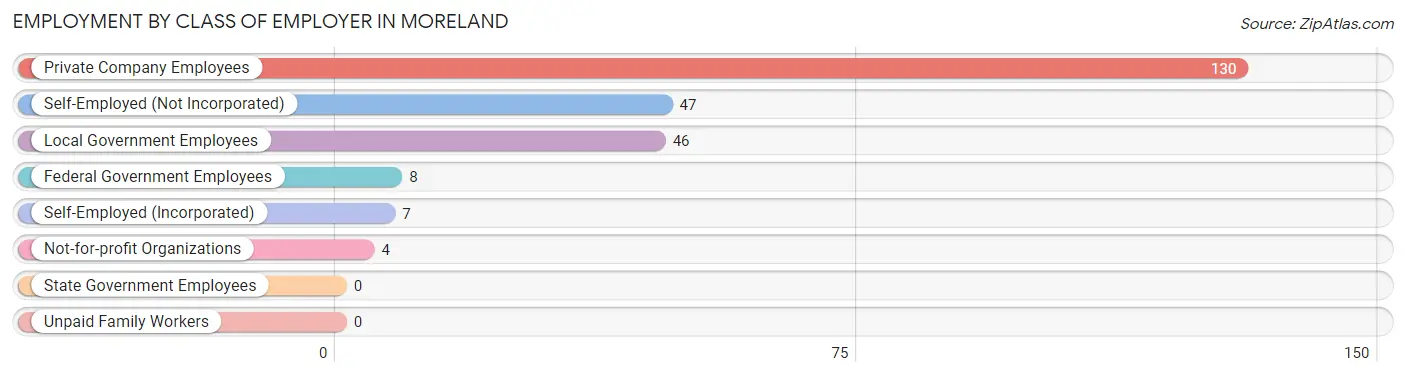
| Employer Class | # Employees | % Employees |
| Private Company Employees | 130 | 53.7% |
| Self-Employed (Incorporated) | 7 | 2.9% |
| Self-Employed (Not Incorporated) | 47 | 19.4% |
| Not-for-profit Organizations | 4 | 1.7% |
| Local Government Employees | 46 | 19.0% |
| State Government Employees | 0 | 0.0% |
| Federal Government Employees | 8 | 3.3% |
| Unpaid Family Workers | 0 | 0.0% |
| Total | 242 | 100.0% |
Employment Status by Age in Moreland
According to the labor force statistics for Moreland, out of the total population over 16 years of age (450), 58.2% or 262 individuals are in the labor force, with 4.2% or 11 of them unemployed. The age group with the highest labor force participation rate is 16 to 19 years, with 88.9% or 16 individuals in the labor force. Within the labor force, the 16 to 19 years age range has the highest percentage of unemployed individuals, with 12.5% or 2 of them being unemployed.
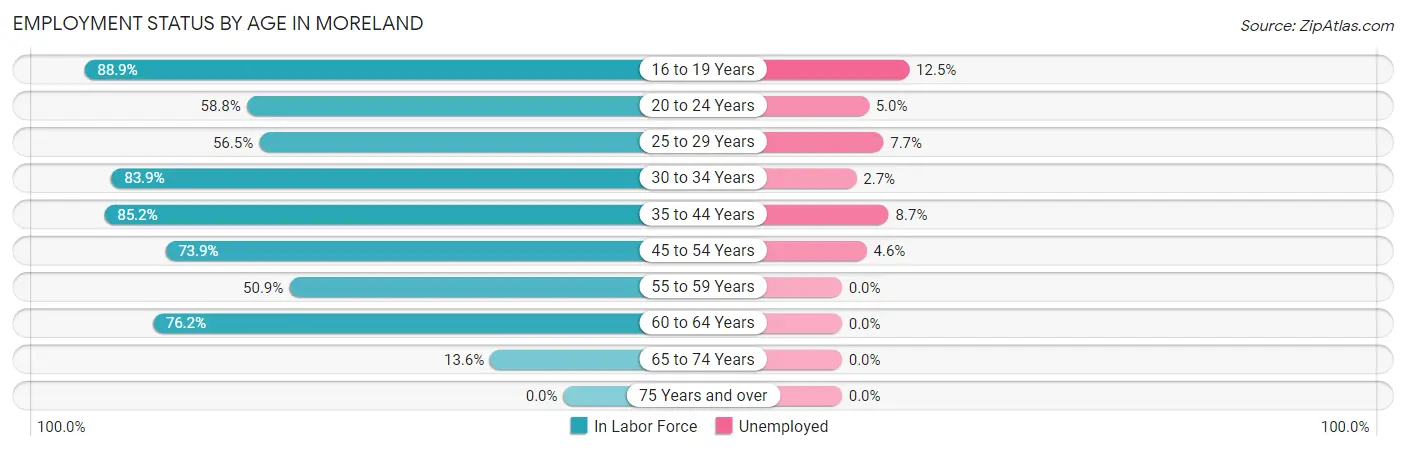
| Age Bracket | In Labor Force | Unemployed |
| 16 to 19 Years | 16 (88.9%) | 2 (12.5%) |
| 20 to 24 Years | 20 (58.8%) | 1 (5.0%) |
| 25 to 29 Years | 13 (56.5%) | 1 (7.7%) |
| 30 to 34 Years | 73 (83.9%) | 2 (2.7%) |
| 35 to 44 Years | 23 (85.2%) | 2 (8.7%) |
| 45 to 54 Years | 65 (73.9%) | 3 (4.6%) |
| 55 to 59 Years | 27 (50.9%) | 0 (0.0%) |
| 60 to 64 Years | 16 (76.2%) | 0 (0.0%) |
| 65 to 74 Years | 9 (13.6%) | 0 (0.0%) |
| 75 Years and over | 0 (0.0%) | 0 (0.0%) |
| Total | 262 (58.2%) | 11 (4.2%) |
Employment Status by Educational Attainment in Moreland
According to labor force statistics for Moreland, 72.6% of individuals (217) out of the total population between 25 and 64 years of age (299) are in the labor force, with 3.7% or 8 of them being unemployed. The group with the highest labor force participation rate are those with the educational attainment of bachelor's degree or higher, with 93.7% or 74 individuals in the labor force. Within the labor force, individuals with high school diploma education have the highest percentage of unemployment, with 5.4% or 5 of them being unemployed.
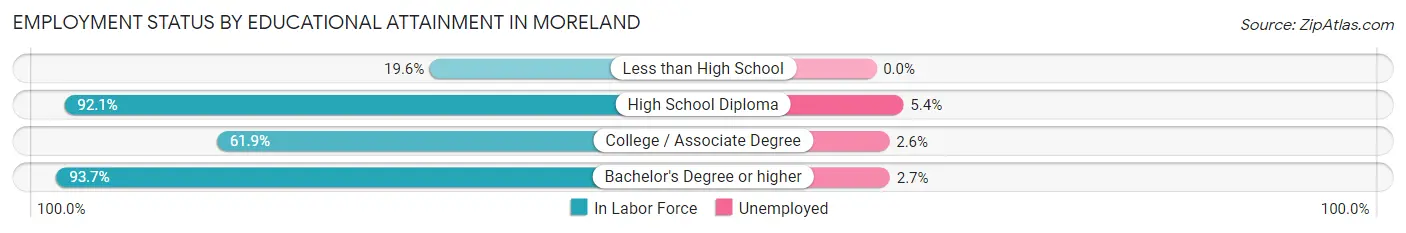
| Educational Attainment | In Labor Force | Unemployed |
| Less than High School | 11 (19.6%) | 0 (0.0%) |
| High School Diploma | 93 (92.1%) | 5 (5.4%) |
| College / Associate Degree | 39 (61.9%) | 2 (2.6%) |
| Bachelor's Degree or higher | 74 (93.7%) | 2 (2.7%) |
| Total | 217 (72.6%) | 11 (3.7%) |
Employment Occupations by Sex in Moreland
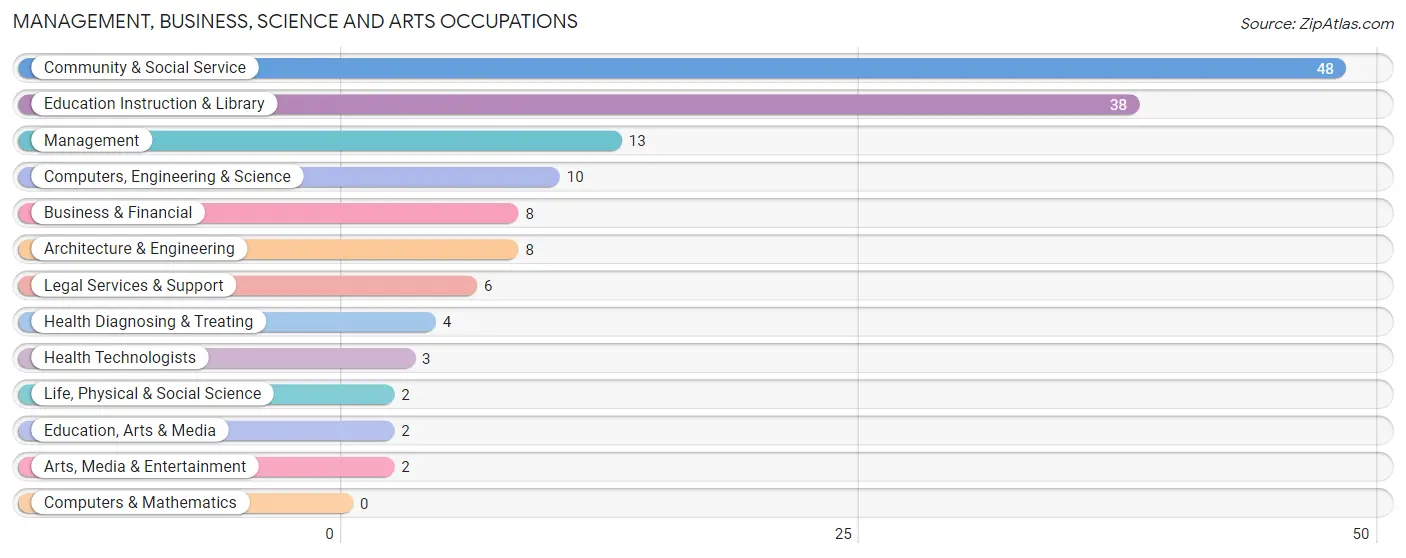
Management, Business, Science and Arts Occupations
The most common Management, Business, Science and Arts occupations in Moreland are Community & Social Service (48 | 19.1%), Education Instruction & Library (38 | 15.1%), Management (13 | 5.2%), Computers, Engineering & Science (10 | 4.0%), and Business & Financial (8 | 3.2%).
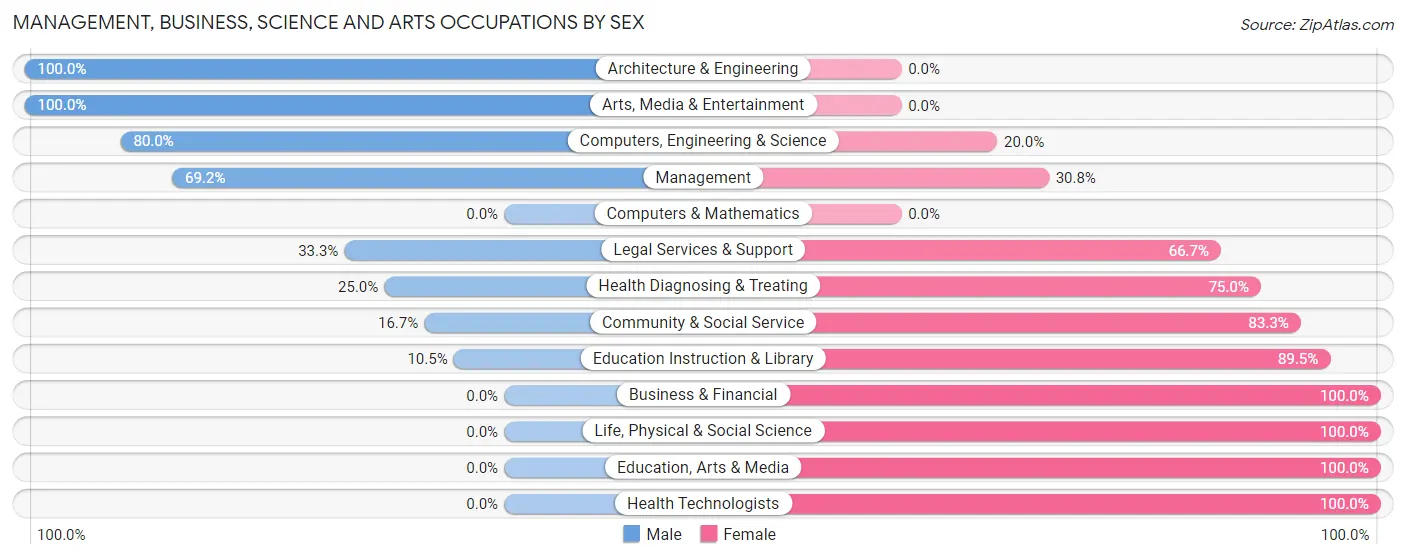
Management, Business, Science and Arts Occupations by Sex
Within the Management, Business, Science and Arts occupations in Moreland, the most male-oriented occupations are Architecture & Engineering (100.0%), Arts, Media & Entertainment (100.0%), and Computers, Engineering & Science (80.0%), while the most female-oriented occupations are Business & Financial (100.0%), Life, Physical & Social Science (100.0%), and Education, Arts & Media (100.0%).
| Occupation | Male | Female |
| Management | 9 (69.2%) | 4 (30.8%) |
| Business & Financial | 0 (0.0%) | 8 (100.0%) |
| Computers, Engineering & Science | 8 (80.0%) | 2 (20.0%) |
| Computers & Mathematics | 0 (0.0%) | 0 (0.0%) |
| Architecture & Engineering | 8 (100.0%) | 0 (0.0%) |
| Life, Physical & Social Science | 0 (0.0%) | 2 (100.0%) |
| Community & Social Service | 8 (16.7%) | 40 (83.3%) |
| Education, Arts & Media | 0 (0.0%) | 2 (100.0%) |
| Legal Services & Support | 2 (33.3%) | 4 (66.7%) |
| Education Instruction & Library | 4 (10.5%) | 34 (89.5%) |
| Arts, Media & Entertainment | 2 (100.0%) | 0 (0.0%) |
| Health Diagnosing & Treating | 1 (25.0%) | 3 (75.0%) |
| Health Technologists | 0 (0.0%) | 3 (100.0%) |
| Total (Category) | 26 (31.3%) | 57 (68.7%) |
| Total (Overall) | 136 (54.2%) | 115 (45.8%) |
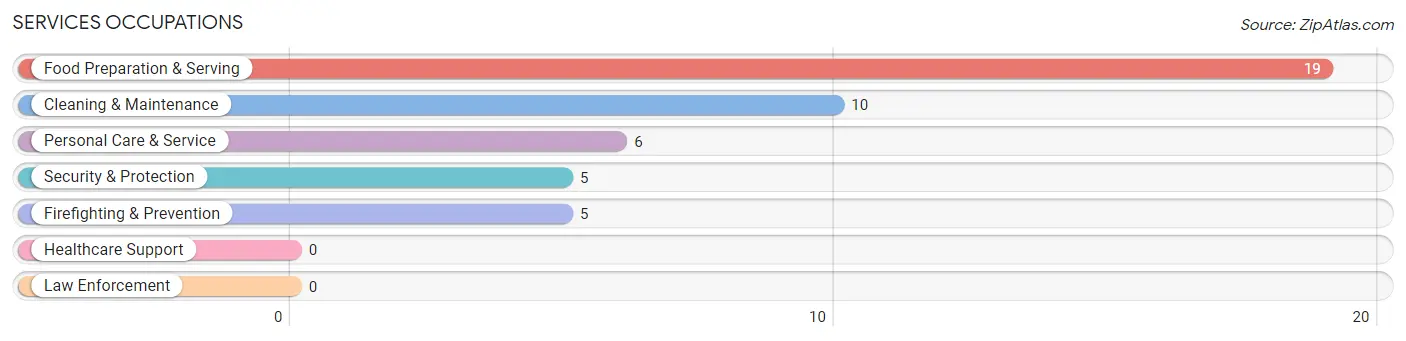
Services Occupations
The most common Services occupations in Moreland are Food Preparation & Serving (19 | 7.6%), Cleaning & Maintenance (10 | 4.0%), Personal Care & Service (6 | 2.4%), Security & Protection (5 | 2.0%), and Firefighting & Prevention (5 | 2.0%).
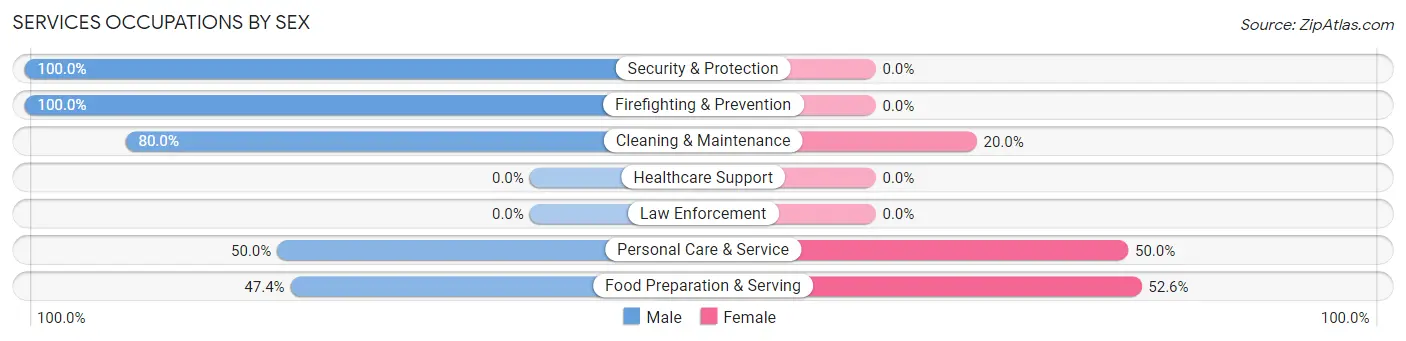
Services Occupations by Sex
Within the Services occupations in Moreland, the most male-oriented occupations are Security & Protection (100.0%), Firefighting & Prevention (100.0%), and Cleaning & Maintenance (80.0%), while the most female-oriented occupations are Food Preparation & Serving (52.6%), Personal Care & Service (50.0%), and Cleaning & Maintenance (20.0%).
| Occupation | Male | Female |
| Healthcare Support | 0 (0.0%) | 0 (0.0%) |
| Security & Protection | 5 (100.0%) | 0 (0.0%) |
| Firefighting & Prevention | 5 (100.0%) | 0 (0.0%) |
| Law Enforcement | 0 (0.0%) | 0 (0.0%) |
| Food Preparation & Serving | 9 (47.4%) | 10 (52.6%) |
| Cleaning & Maintenance | 8 (80.0%) | 2 (20.0%) |
| Personal Care & Service | 3 (50.0%) | 3 (50.0%) |
| Total (Category) | 25 (62.5%) | 15 (37.5%) |
| Total (Overall) | 136 (54.2%) | 115 (45.8%) |
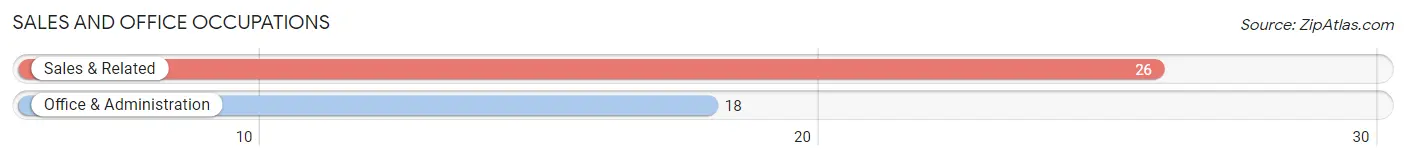
Sales and Office Occupations
The most common Sales and Office occupations in Moreland are Sales & Related (26 | 10.4%), and Office & Administration (18 | 7.2%).
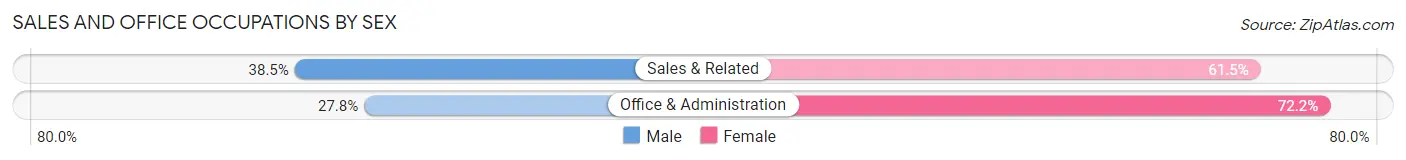
Sales and Office Occupations by Sex
| Occupation | Male | Female |
| Sales & Related | 10 (38.5%) | 16 (61.5%) |
| Office & Administration | 5 (27.8%) | 13 (72.2%) |
| Total (Category) | 15 (34.1%) | 29 (65.9%) |
| Total (Overall) | 136 (54.2%) | 115 (45.8%) |
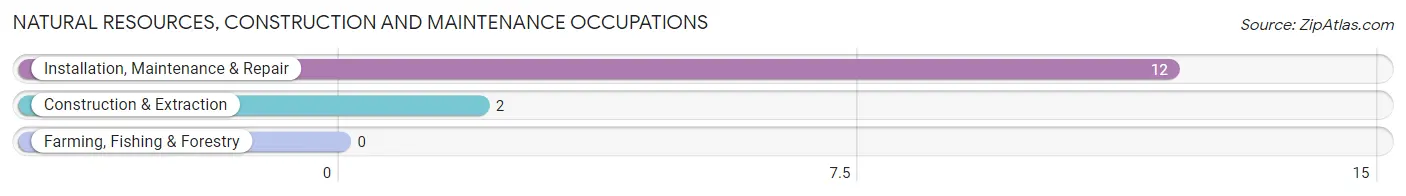
Natural Resources, Construction and Maintenance Occupations
The most common Natural Resources, Construction and Maintenance occupations in Moreland are Installation, Maintenance & Repair (12 | 4.8%), and Construction & Extraction (2 | 0.8%).
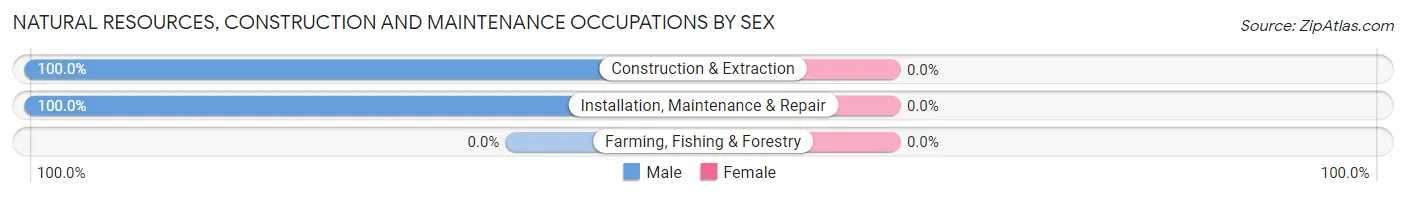
Natural Resources, Construction and Maintenance Occupations by Sex
| Occupation | Male | Female |
| Farming, Fishing & Forestry | 0 (0.0%) | 0 (0.0%) |
| Construction & Extraction | 2 (100.0%) | 0 (0.0%) |
| Installation, Maintenance & Repair | 12 (100.0%) | 0 (0.0%) |
| Total (Category) | 14 (100.0%) | 0 (0.0%) |
| Total (Overall) | 136 (54.2%) | 115 (45.8%) |
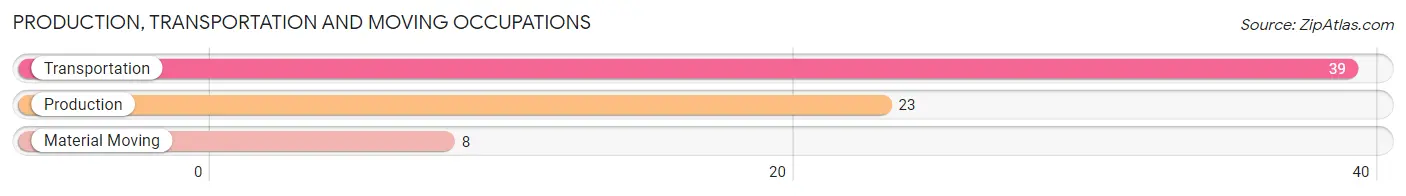
Production, Transportation and Moving Occupations
The most common Production, Transportation and Moving occupations in Moreland are Transportation (39 | 15.5%), Production (23 | 9.2%), and Material Moving (8 | 3.2%).
Production, Transportation and Moving Occupations by Sex
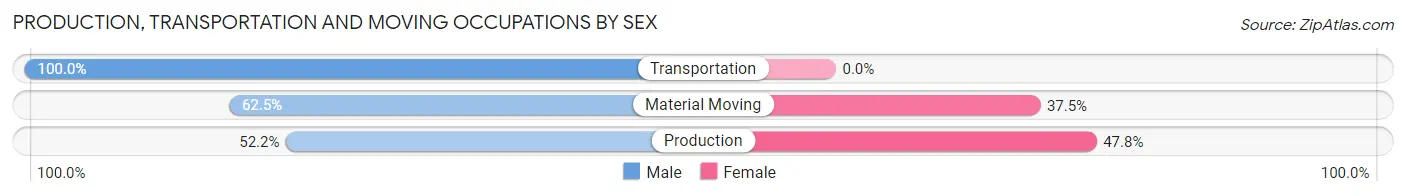
| Occupation | Male | Female |
| Production | 12 (52.2%) | 11 (47.8%) |
| Transportation | 39 (100.0%) | 0 (0.0%) |
| Material Moving | 5 (62.5%) | 3 (37.5%) |
| Total (Category) | 56 (80.0%) | 14 (20.0%) |
| Total (Overall) | 136 (54.2%) | 115 (45.8%) |
Employment Industries by Sex in Moreland
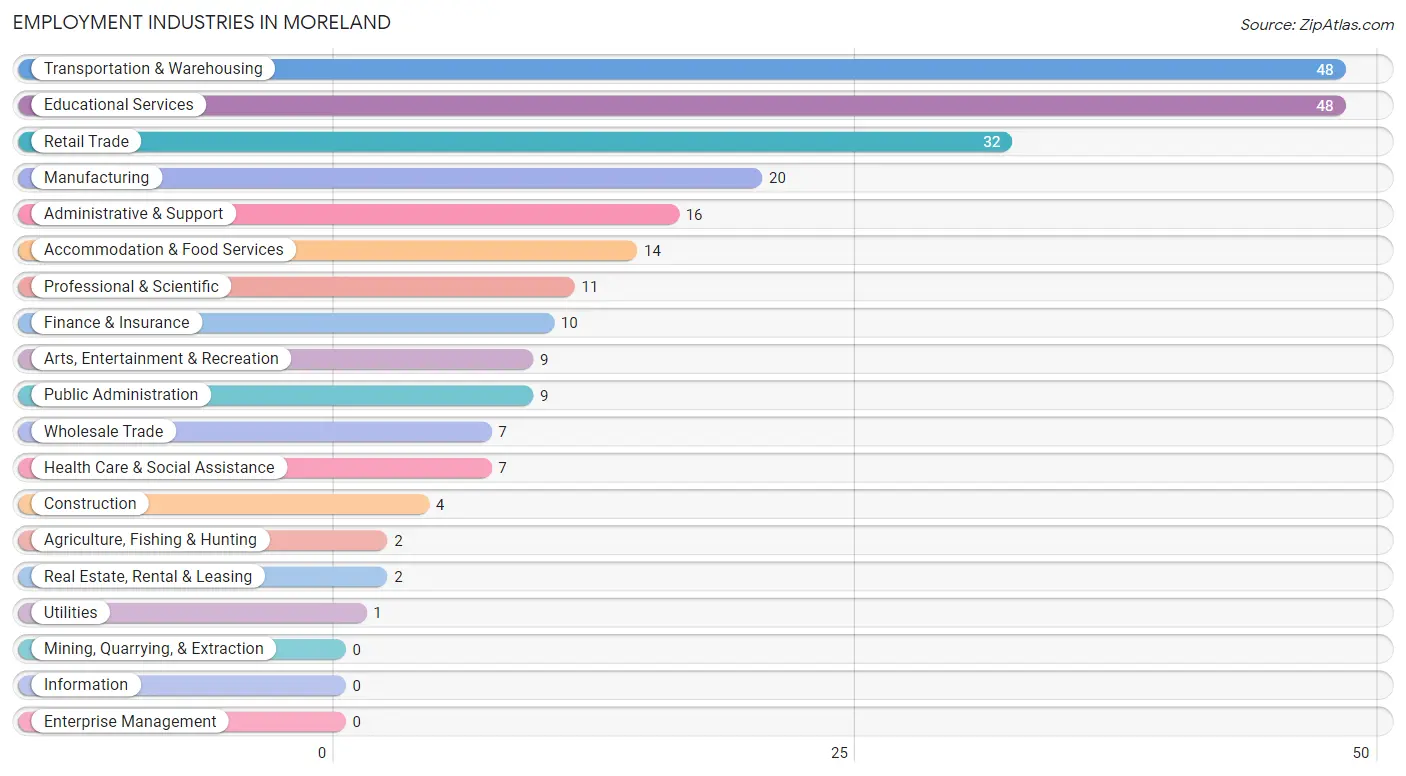
Employment Industries in Moreland
The major employment industries in Moreland include Transportation & Warehousing (48 | 19.1%), Educational Services (48 | 19.1%), Retail Trade (32 | 12.8%), Manufacturing (20 | 8.0%), and Administrative & Support (16 | 6.4%).
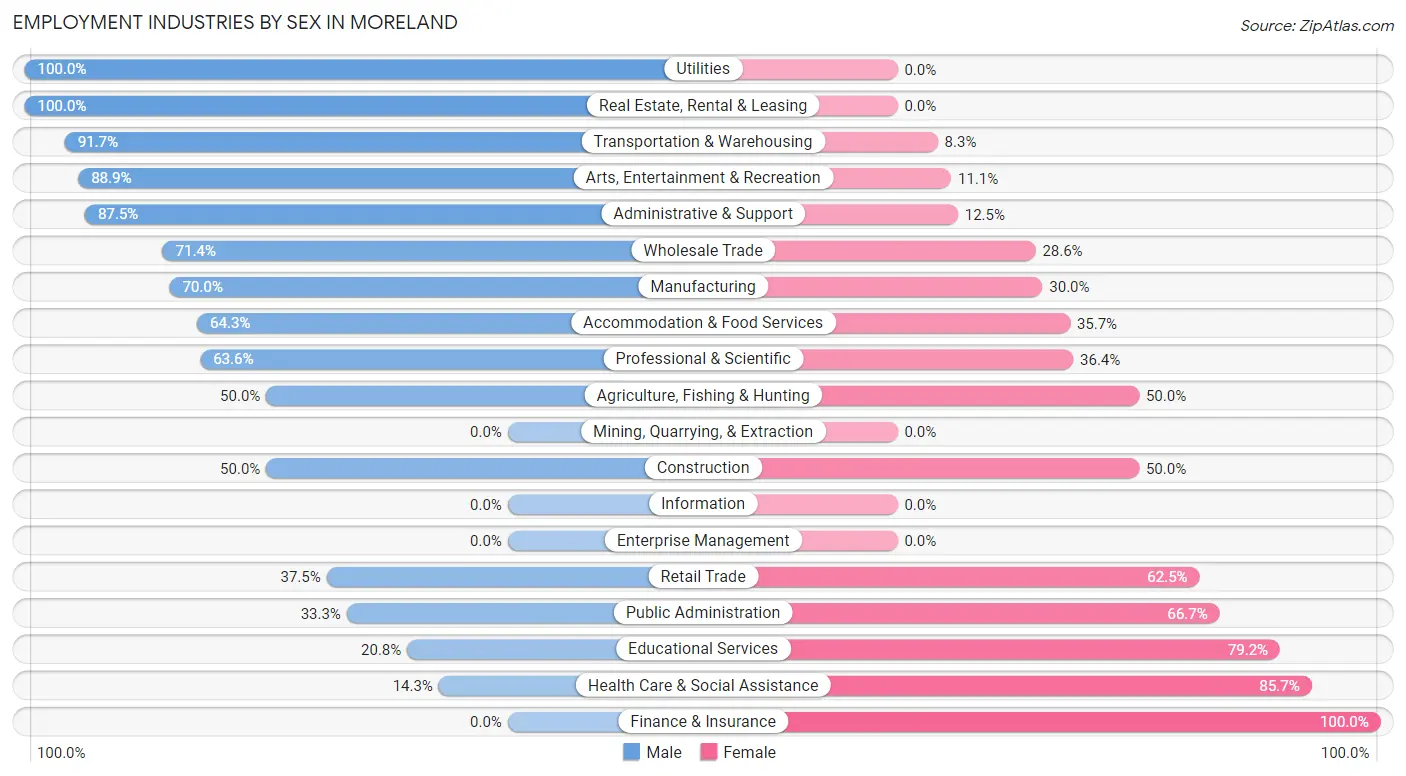
Employment Industries by Sex in Moreland
The Moreland industries that see more men than women are Utilities (100.0%), Real Estate, Rental & Leasing (100.0%), and Transportation & Warehousing (91.7%), whereas the industries that tend to have a higher number of women are Finance & Insurance (100.0%), Health Care & Social Assistance (85.7%), and Educational Services (79.2%).
| Industry | Male | Female |
| Agriculture, Fishing & Hunting | 1 (50.0%) | 1 (50.0%) |
| Mining, Quarrying, & Extraction | 0 (0.0%) | 0 (0.0%) |
| Construction | 2 (50.0%) | 2 (50.0%) |
| Manufacturing | 14 (70.0%) | 6 (30.0%) |
| Wholesale Trade | 5 (71.4%) | 2 (28.6%) |
| Retail Trade | 12 (37.5%) | 20 (62.5%) |
| Transportation & Warehousing | 44 (91.7%) | 4 (8.3%) |
| Utilities | 1 (100.0%) | 0 (0.0%) |
| Information | 0 (0.0%) | 0 (0.0%) |
| Finance & Insurance | 0 (0.0%) | 10 (100.0%) |
| Real Estate, Rental & Leasing | 2 (100.0%) | 0 (0.0%) |
| Professional & Scientific | 7 (63.6%) | 4 (36.4%) |
| Enterprise Management | 0 (0.0%) | 0 (0.0%) |
| Administrative & Support | 14 (87.5%) | 2 (12.5%) |
| Educational Services | 10 (20.8%) | 38 (79.2%) |
| Health Care & Social Assistance | 1 (14.3%) | 6 (85.7%) |
| Arts, Entertainment & Recreation | 8 (88.9%) | 1 (11.1%) |
| Accommodation & Food Services | 9 (64.3%) | 5 (35.7%) |
| Public Administration | 3 (33.3%) | 6 (66.7%) |
| Total | 136 (54.2%) | 115 (45.8%) |
Education in Moreland
School Enrollment in Moreland
The most common levels of schooling among the 72 students in Moreland are nursery / preschool (34 | 47.2%), middle school (14 | 19.4%), and high school (11 | 15.3%).
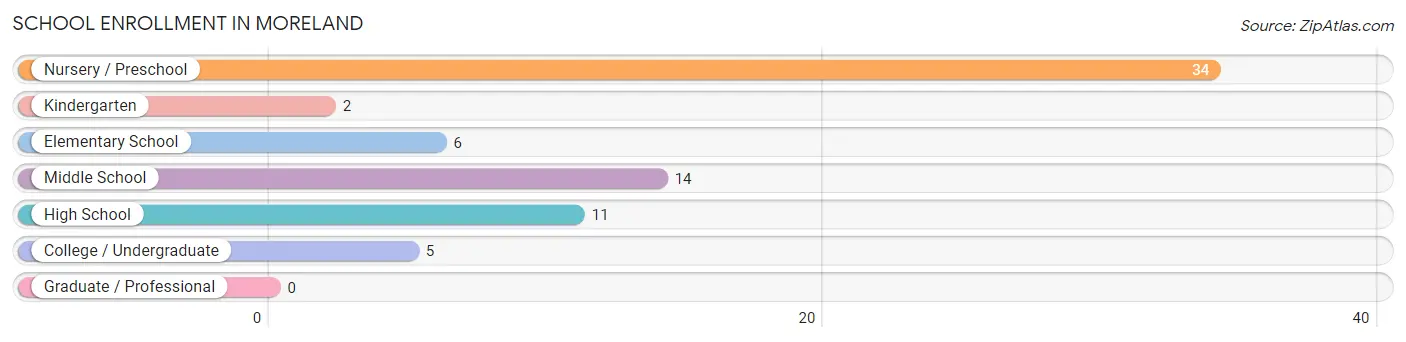
| School Level | # Students | % Students |
| Nursery / Preschool | 34 | 47.2% |
| Kindergarten | 2 | 2.8% |
| Elementary School | 6 | 8.3% |
| Middle School | 14 | 19.4% |
| High School | 11 | 15.3% |
| College / Undergraduate | 5 | 6.9% |
| Graduate / Professional | 0 | 0.0% |
| Total | 72 | 100.0% |
School Enrollment by Age by Funding Source in Moreland
Out of a total of 72 students who are enrolled in schools in Moreland, 4 (5.6%) attend a private institution, while the remaining 68 (94.4%) are enrolled in public schools. The age group of 15 to 17 year olds has the highest likelihood of being enrolled in private schools, with 2 (28.6% in the age bracket) enrolled. Conversely, the age group of 3 to 4 year olds has the lowest likelihood of being enrolled in a private school, with 2 (100.0% in the age bracket) attending a public institution.
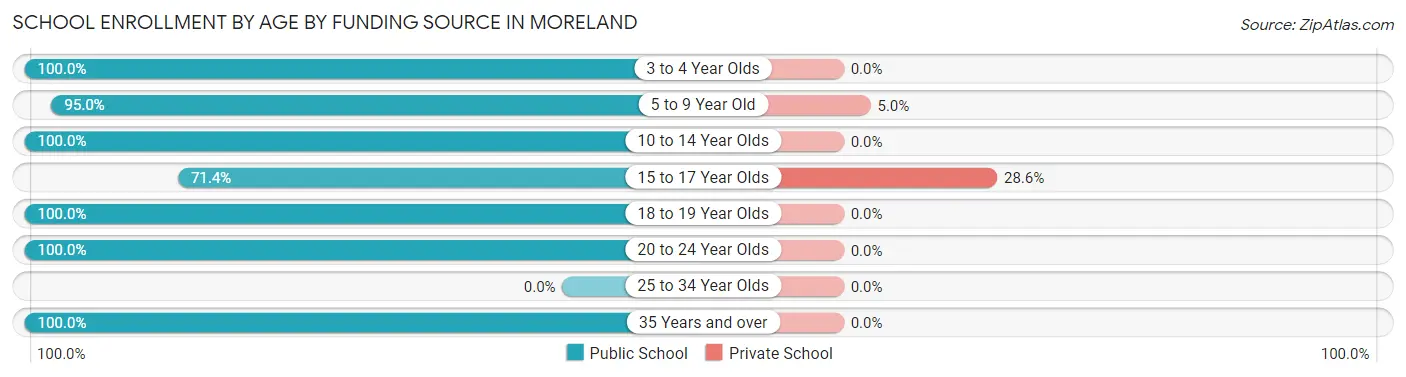
| Age Bracket | Public School | Private School |
| 3 to 4 Year Olds | 2 (100.0%) | 0 (0.0%) |
| 5 to 9 Year Old | 38 (95.0%) | 2 (5.0%) |
| 10 to 14 Year Olds | 14 (100.0%) | 0 (0.0%) |
| 15 to 17 Year Olds | 5 (71.4%) | 2 (28.6%) |
| 18 to 19 Year Olds | 5 (100.0%) | 0 (0.0%) |
| 20 to 24 Year Olds | 2 (100.0%) | 0 (0.0%) |
| 25 to 34 Year Olds | 0 (0.0%) | 0 (0.0%) |
| 35 Years and over | 2 (100.0%) | 0 (0.0%) |
| Total | 68 (94.4%) | 4 (5.6%) |
Educational Attainment by Field of Study in Moreland
Education (42 | 38.5%), bio, nature & agricultural (15 | 13.8%), business (13 | 11.9%), liberal arts & history (9 | 8.3%), and physical & health sciences (7 | 6.4%) are the most common fields of study among 109 individuals in Moreland who have obtained a bachelor's degree or higher.
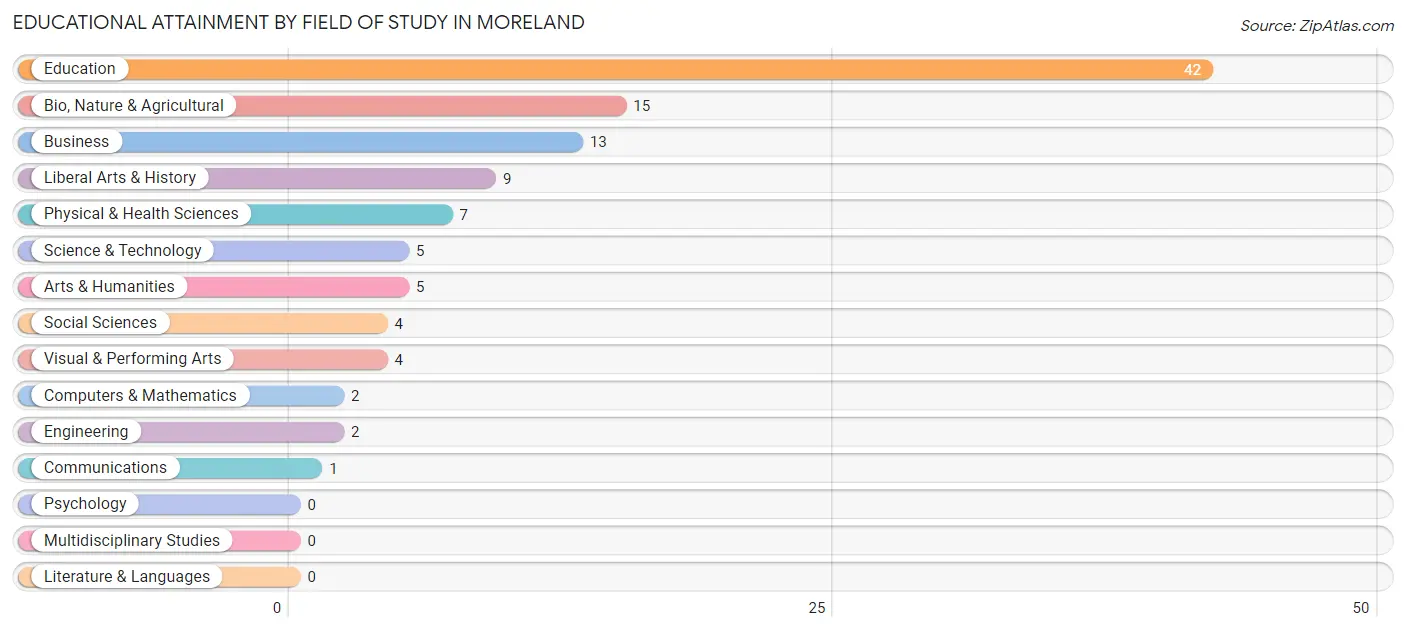
| Field of Study | # Graduates | % Graduates |
| Computers & Mathematics | 2 | 1.8% |
| Bio, Nature & Agricultural | 15 | 13.8% |
| Physical & Health Sciences | 7 | 6.4% |
| Psychology | 0 | 0.0% |
| Social Sciences | 4 | 3.7% |
| Engineering | 2 | 1.8% |
| Multidisciplinary Studies | 0 | 0.0% |
| Science & Technology | 5 | 4.6% |
| Business | 13 | 11.9% |
| Education | 42 | 38.5% |
| Literature & Languages | 0 | 0.0% |
| Liberal Arts & History | 9 | 8.3% |
| Visual & Performing Arts | 4 | 3.7% |
| Communications | 1 | 0.9% |
| Arts & Humanities | 5 | 4.6% |
| Total | 109 | 100.0% |
Transportation & Commute in Moreland
Vehicle Availability by Sex in Moreland
The most prevalent vehicle ownership categories in Moreland are males with 2 vehicles (71, accounting for 55.5%) and females with 2 vehicles (51, making up 62.3%).
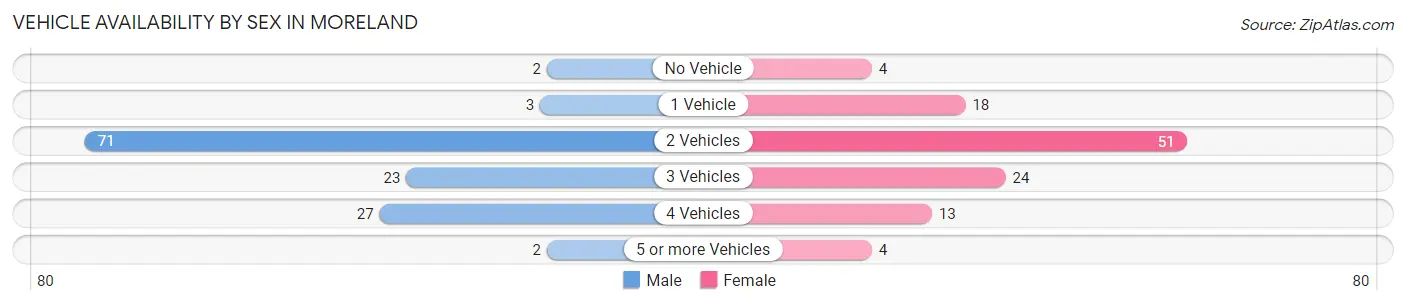
| Vehicles Available | Male | Female |
| No Vehicle | 2 (1.6%) | 4 (3.5%) |
| 1 Vehicle | 3 (2.3%) | 18 (15.8%) |
| 2 Vehicles | 71 (55.5%) | 51 (44.7%) |
| 3 Vehicles | 23 (18.0%) | 24 (21.0%) |
| 4 Vehicles | 27 (21.1%) | 13 (11.4%) |
| 5 or more Vehicles | 2 (1.6%) | 4 (3.5%) |
| Total | 128 (100.0%) | 114 (100.0%) |
Commute Time in Moreland
The most frequently occuring commute durations in Moreland are 15 to 19 minutes (65 commuters, 28.5%), 30 to 34 minutes (49 commuters, 21.5%), and 5 to 9 minutes (30 commuters, 13.2%).
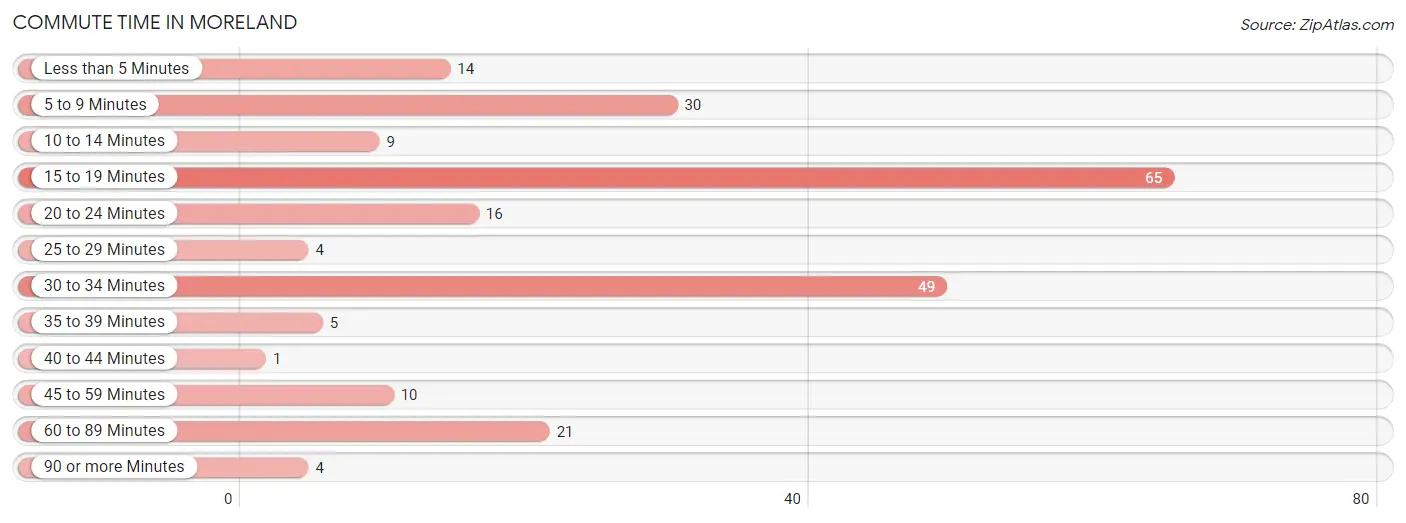
| Commute Time | # Commuters | % Commuters |
| Less than 5 Minutes | 14 | 6.1% |
| 5 to 9 Minutes | 30 | 13.2% |
| 10 to 14 Minutes | 9 | 4.0% |
| 15 to 19 Minutes | 65 | 28.5% |
| 20 to 24 Minutes | 16 | 7.0% |
| 25 to 29 Minutes | 4 | 1.8% |
| 30 to 34 Minutes | 49 | 21.5% |
| 35 to 39 Minutes | 5 | 2.2% |
| 40 to 44 Minutes | 1 | 0.4% |
| 45 to 59 Minutes | 10 | 4.4% |
| 60 to 89 Minutes | 21 | 9.2% |
| 90 or more Minutes | 4 | 1.8% |
Commute Time by Sex in Moreland
The most common commute times in Moreland are 30 to 34 minutes (38 commuters, 30.9%) for males and 15 to 19 minutes (29 commuters, 27.6%) for females.
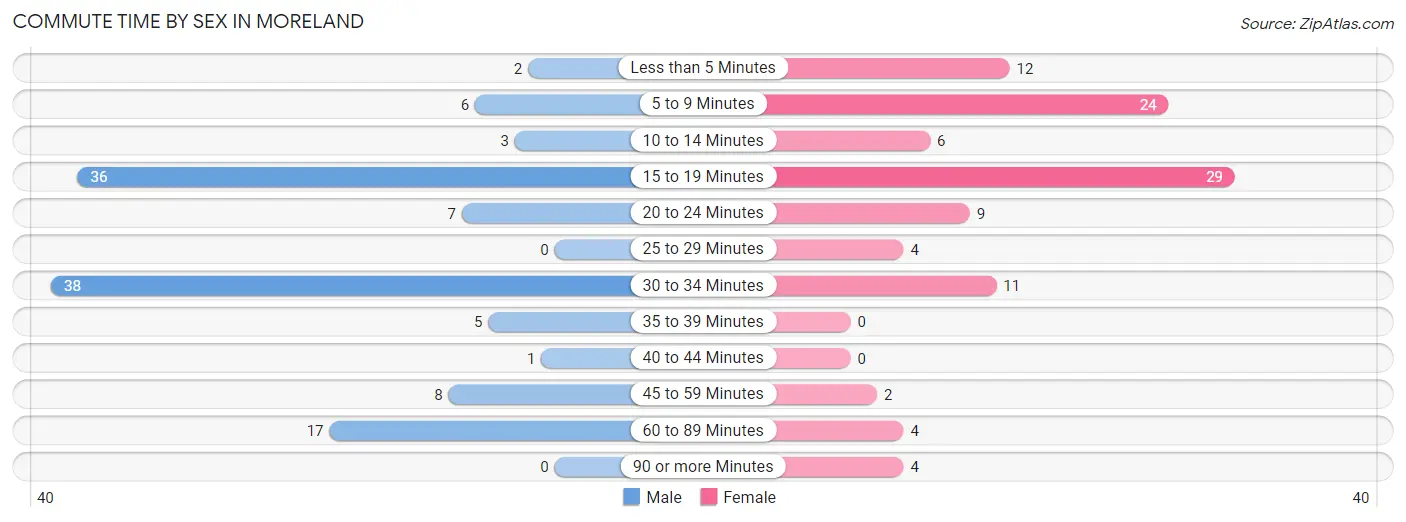
| Commute Time | Male | Female |
| Less than 5 Minutes | 2 (1.6%) | 12 (11.4%) |
| 5 to 9 Minutes | 6 (4.9%) | 24 (22.9%) |
| 10 to 14 Minutes | 3 (2.4%) | 6 (5.7%) |
| 15 to 19 Minutes | 36 (29.3%) | 29 (27.6%) |
| 20 to 24 Minutes | 7 (5.7%) | 9 (8.6%) |
| 25 to 29 Minutes | 0 (0.0%) | 4 (3.8%) |
| 30 to 34 Minutes | 38 (30.9%) | 11 (10.5%) |
| 35 to 39 Minutes | 5 (4.1%) | 0 (0.0%) |
| 40 to 44 Minutes | 1 (0.8%) | 0 (0.0%) |
| 45 to 59 Minutes | 8 (6.5%) | 2 (1.9%) |
| 60 to 89 Minutes | 17 (13.8%) | 4 (3.8%) |
| 90 or more Minutes | 0 (0.0%) | 4 (3.8%) |
Time of Departure to Work by Sex in Moreland
The most frequent times of departure to work in Moreland are 7:00 AM to 7:29 AM (40, 32.5%) for males and 7:00 AM to 7:29 AM (43, 40.9%) for females.
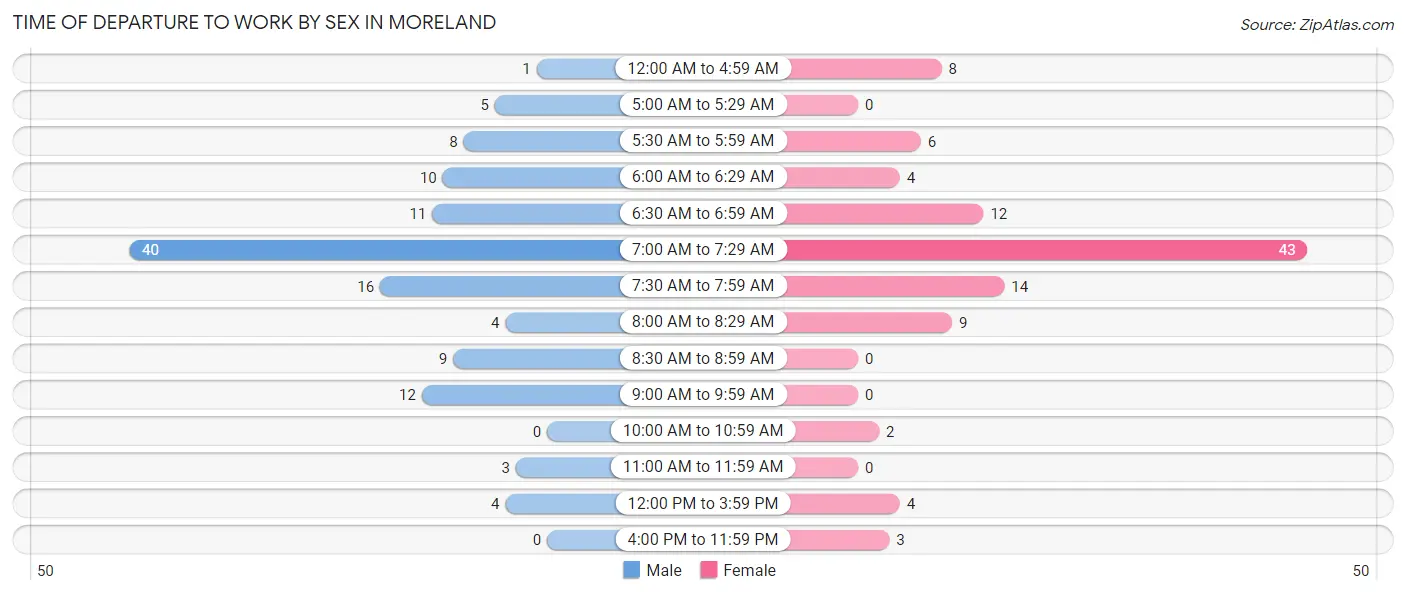
| Time of Departure | Male | Female |
| 12:00 AM to 4:59 AM | 1 (0.8%) | 8 (7.6%) |
| 5:00 AM to 5:29 AM | 5 (4.1%) | 0 (0.0%) |
| 5:30 AM to 5:59 AM | 8 (6.5%) | 6 (5.7%) |
| 6:00 AM to 6:29 AM | 10 (8.1%) | 4 (3.8%) |
| 6:30 AM to 6:59 AM | 11 (8.9%) | 12 (11.4%) |
| 7:00 AM to 7:29 AM | 40 (32.5%) | 43 (40.9%) |
| 7:30 AM to 7:59 AM | 16 (13.0%) | 14 (13.3%) |
| 8:00 AM to 8:29 AM | 4 (3.3%) | 9 (8.6%) |
| 8:30 AM to 8:59 AM | 9 (7.3%) | 0 (0.0%) |
| 9:00 AM to 9:59 AM | 12 (9.8%) | 0 (0.0%) |
| 10:00 AM to 10:59 AM | 0 (0.0%) | 2 (1.9%) |
| 11:00 AM to 11:59 AM | 3 (2.4%) | 0 (0.0%) |
| 12:00 PM to 3:59 PM | 4 (3.3%) | 4 (3.8%) |
| 4:00 PM to 11:59 PM | 0 (0.0%) | 3 (2.9%) |
| Total | 123 (100.0%) | 105 (100.0%) |
Housing Occupancy in Moreland
Occupancy by Ownership in Moreland
Of the total 209 dwellings in Moreland, owner-occupied units account for 175 (83.7%), while renter-occupied units make up 34 (16.3%).
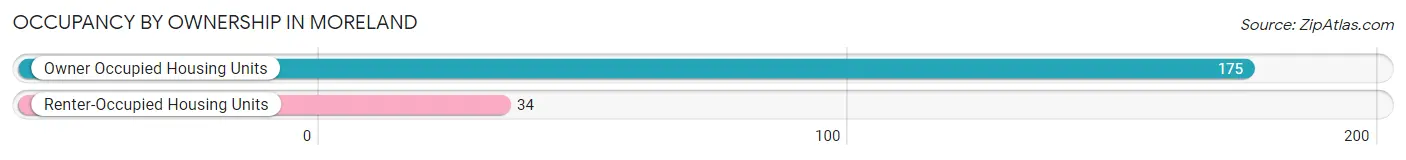
| Occupancy | # Housing Units | % Housing Units |
| Owner Occupied Housing Units | 175 | 83.7% |
| Renter-Occupied Housing Units | 34 | 16.3% |
| Total Occupied Housing Units | 209 | 100.0% |
Occupancy by Household Size in Moreland
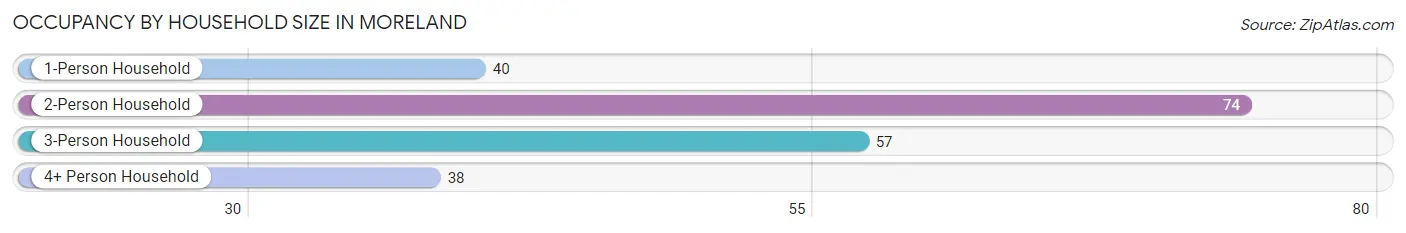
| Household Size | # Housing Units | % Housing Units |
| 1-Person Household | 40 | 19.1% |
| 2-Person Household | 74 | 35.4% |
| 3-Person Household | 57 | 27.3% |
| 4+ Person Household | 38 | 18.2% |
| Total Housing Units | 209 | 100.0% |
Occupancy by Ownership by Household Size in Moreland
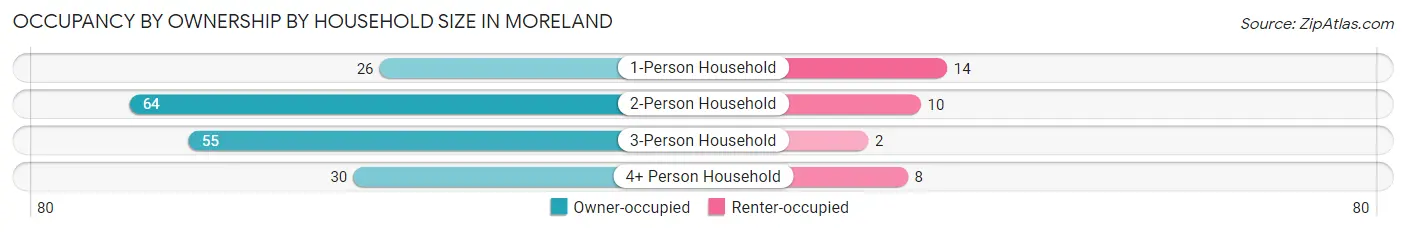
| Household Size | Owner-occupied | Renter-occupied |
| 1-Person Household | 26 (65.0%) | 14 (35.0%) |
| 2-Person Household | 64 (86.5%) | 10 (13.5%) |
| 3-Person Household | 55 (96.5%) | 2 (3.5%) |
| 4+ Person Household | 30 (78.9%) | 8 (21.0%) |
| Total Housing Units | 175 (83.7%) | 34 (16.3%) |
Occupancy by Educational Attainment in Moreland
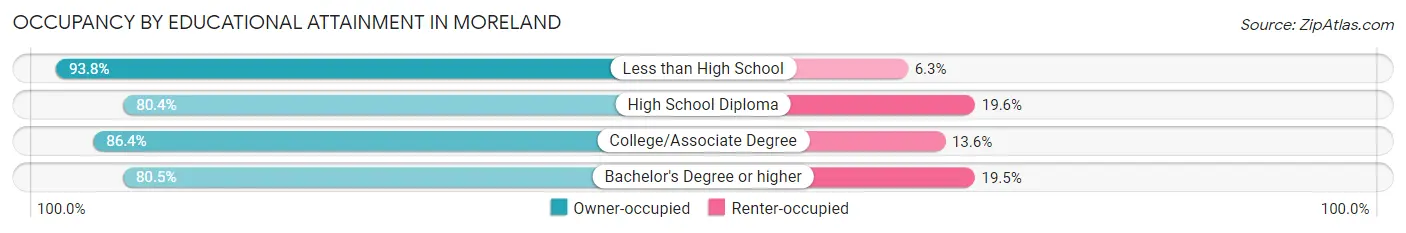
| Household Size | Owner-occupied | Renter-occupied |
| Less than High School | 30 (93.8%) | 2 (6.2%) |
| High School Diploma | 74 (80.4%) | 18 (19.6%) |
| College/Associate Degree | 38 (86.4%) | 6 (13.6%) |
| Bachelor's Degree or higher | 33 (80.5%) | 8 (19.5%) |
Occupancy by Age of Householder in Moreland
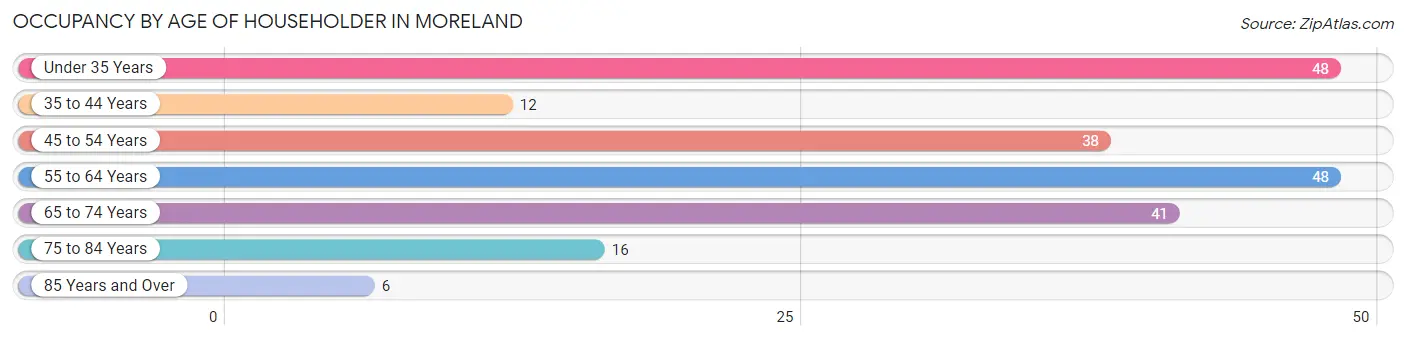
| Age Bracket | # Households | % Households |
| Under 35 Years | 48 | 23.0% |
| 35 to 44 Years | 12 | 5.7% |
| 45 to 54 Years | 38 | 18.2% |
| 55 to 64 Years | 48 | 23.0% |
| 65 to 74 Years | 41 | 19.6% |
| 75 to 84 Years | 16 | 7.7% |
| 85 Years and Over | 6 | 2.9% |
| Total | 209 | 100.0% |
Housing Finances in Moreland
Median Income by Occupancy in Moreland
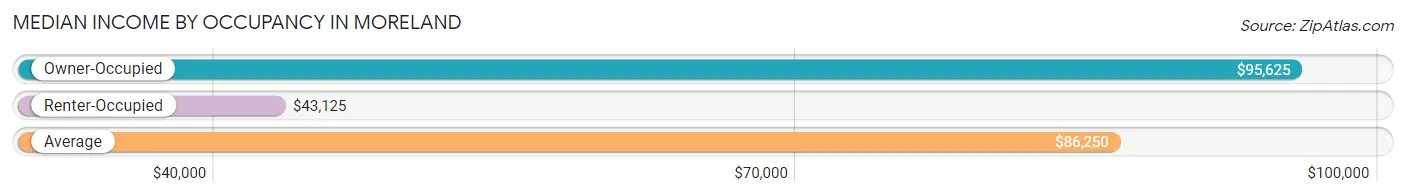
| Occupancy Type | # Households | Median Income |
| Owner-Occupied | 175 (83.7%) | $95,625 |
| Renter-Occupied | 34 (16.3%) | $43,125 |
| Average | 209 (100.0%) | $86,250 |
Occupancy by Householder Income Bracket in Moreland
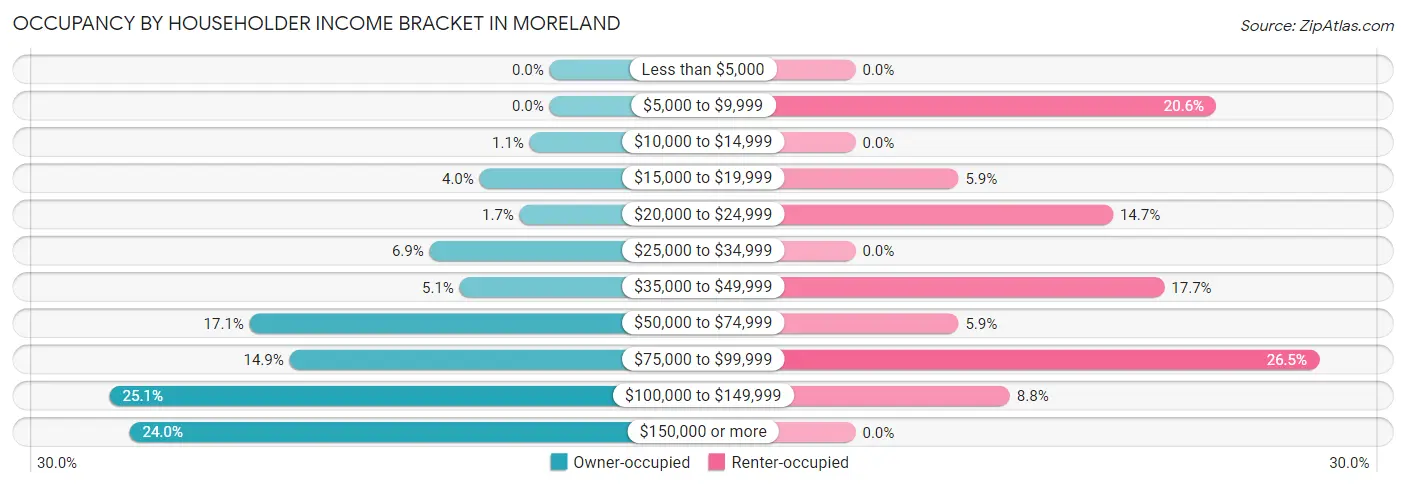
| Income Bracket | Owner-occupied | Renter-occupied |
| Less than $5,000 | 0 (0.0%) | 0 (0.0%) |
| $5,000 to $9,999 | 0 (0.0%) | 7 (20.6%) |
| $10,000 to $14,999 | 2 (1.1%) | 0 (0.0%) |
| $15,000 to $19,999 | 7 (4.0%) | 2 (5.9%) |
| $20,000 to $24,999 | 3 (1.7%) | 5 (14.7%) |
| $25,000 to $34,999 | 12 (6.9%) | 0 (0.0%) |
| $35,000 to $49,999 | 9 (5.1%) | 6 (17.6%) |
| $50,000 to $74,999 | 30 (17.1%) | 2 (5.9%) |
| $75,000 to $99,999 | 26 (14.9%) | 9 (26.5%) |
| $100,000 to $149,999 | 44 (25.1%) | 3 (8.8%) |
| $150,000 or more | 42 (24.0%) | 0 (0.0%) |
| Total | 175 (100.0%) | 34 (100.0%) |
Monthly Housing Cost Tiers in Moreland
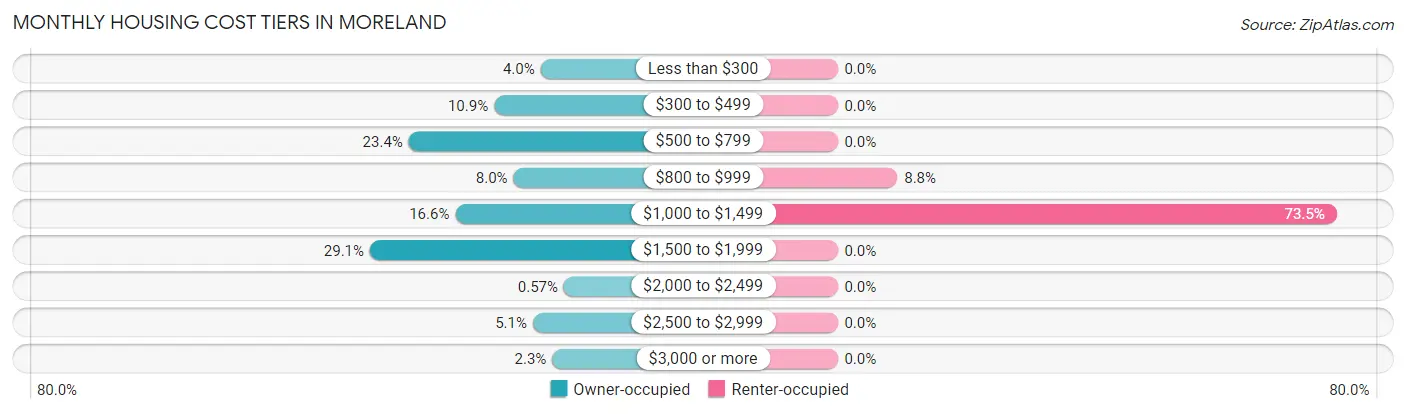
| Monthly Cost | Owner-occupied | Renter-occupied |
| Less than $300 | 7 (4.0%) | 0 (0.0%) |
| $300 to $499 | 19 (10.9%) | 0 (0.0%) |
| $500 to $799 | 41 (23.4%) | 0 (0.0%) |
| $800 to $999 | 14 (8.0%) | 3 (8.8%) |
| $1,000 to $1,499 | 29 (16.6%) | 25 (73.5%) |
| $1,500 to $1,999 | 51 (29.1%) | 0 (0.0%) |
| $2,000 to $2,499 | 1 (0.6%) | 0 (0.0%) |
| $2,500 to $2,999 | 9 (5.1%) | 0 (0.0%) |
| $3,000 or more | 4 (2.3%) | 0 (0.0%) |
| Total | 175 (100.0%) | 34 (100.0%) |
Physical Housing Characteristics in Moreland
Housing Structures in Moreland
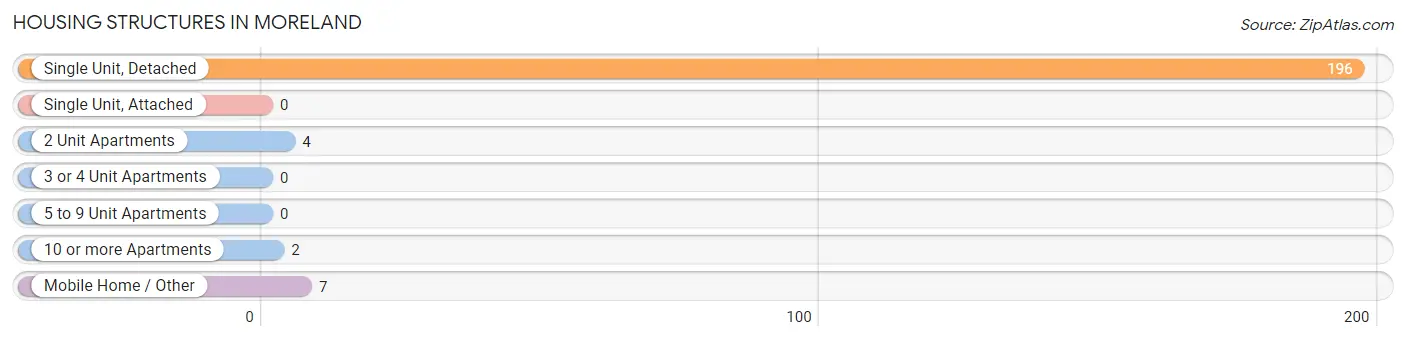
| Structure Type | # Housing Units | % Housing Units |
| Single Unit, Detached | 196 | 93.8% |
| Single Unit, Attached | 0 | 0.0% |
| 2 Unit Apartments | 4 | 1.9% |
| 3 or 4 Unit Apartments | 0 | 0.0% |
| 5 to 9 Unit Apartments | 0 | 0.0% |
| 10 or more Apartments | 2 | 1.0% |
| Mobile Home / Other | 7 | 3.4% |
| Total | 209 | 100.0% |
Housing Structures by Occupancy in Moreland
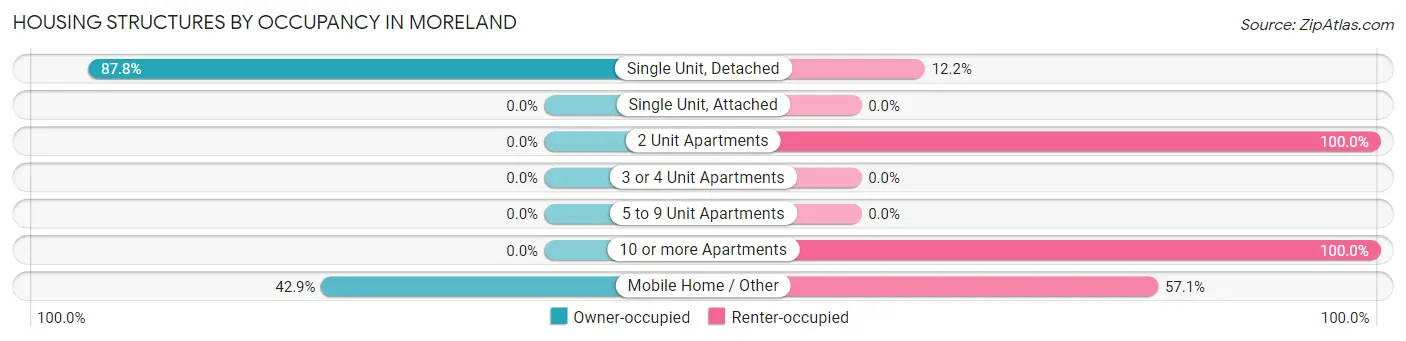
| Structure Type | Owner-occupied | Renter-occupied |
| Single Unit, Detached | 172 (87.8%) | 24 (12.2%) |
| Single Unit, Attached | 0 (0.0%) | 0 (0.0%) |
| 2 Unit Apartments | 0 (0.0%) | 4 (100.0%) |
| 3 or 4 Unit Apartments | 0 (0.0%) | 0 (0.0%) |
| 5 to 9 Unit Apartments | 0 (0.0%) | 0 (0.0%) |
| 10 or more Apartments | 0 (0.0%) | 2 (100.0%) |
| Mobile Home / Other | 3 (42.9%) | 4 (57.1%) |
| Total | 175 (83.7%) | 34 (16.3%) |
Housing Structures by Number of Rooms in Moreland
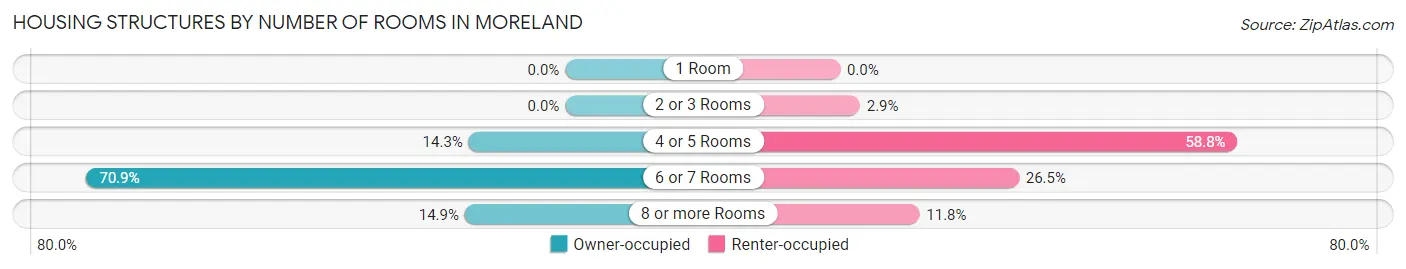
| Number of Rooms | Owner-occupied | Renter-occupied |
| 1 Room | 0 (0.0%) | 0 (0.0%) |
| 2 or 3 Rooms | 0 (0.0%) | 1 (2.9%) |
| 4 or 5 Rooms | 25 (14.3%) | 20 (58.8%) |
| 6 or 7 Rooms | 124 (70.9%) | 9 (26.5%) |
| 8 or more Rooms | 26 (14.9%) | 4 (11.8%) |
| Total | 175 (100.0%) | 34 (100.0%) |
Housing Structure by Heating Type in Moreland
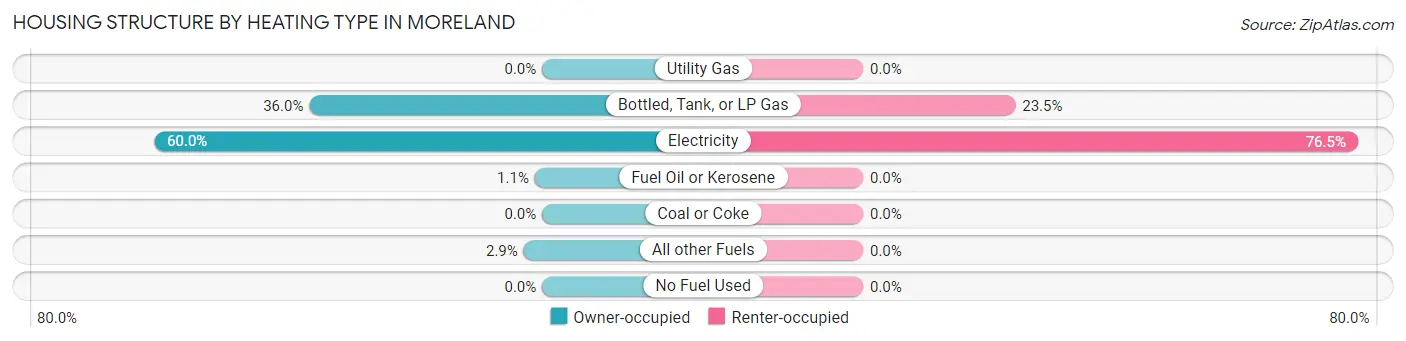
| Heating Type | Owner-occupied | Renter-occupied |
| Utility Gas | 0 (0.0%) | 0 (0.0%) |
| Bottled, Tank, or LP Gas | 63 (36.0%) | 8 (23.5%) |
| Electricity | 105 (60.0%) | 26 (76.5%) |
| Fuel Oil or Kerosene | 2 (1.1%) | 0 (0.0%) |
| Coal or Coke | 0 (0.0%) | 0 (0.0%) |
| All other Fuels | 5 (2.9%) | 0 (0.0%) |
| No Fuel Used | 0 (0.0%) | 0 (0.0%) |
| Total | 175 (100.0%) | 34 (100.0%) |
Household Vehicle Usage in Moreland
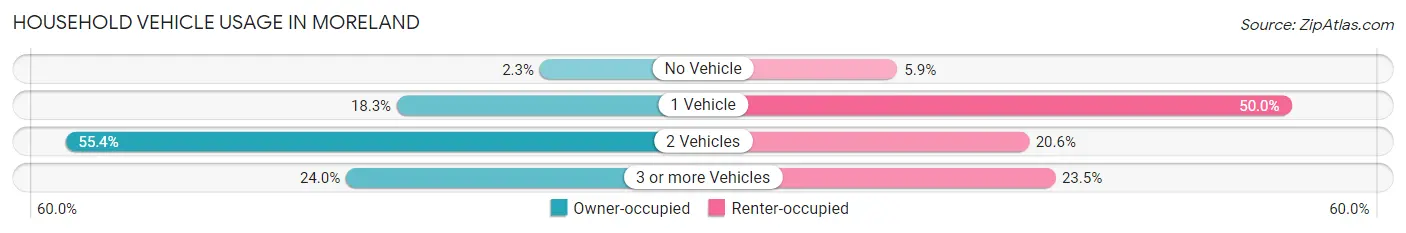
| Vehicles per Household | Owner-occupied | Renter-occupied |
| No Vehicle | 4 (2.3%) | 2 (5.9%) |
| 1 Vehicle | 32 (18.3%) | 17 (50.0%) |
| 2 Vehicles | 97 (55.4%) | 7 (20.6%) |
| 3 or more Vehicles | 42 (24.0%) | 8 (23.5%) |
| Total | 175 (100.0%) | 34 (100.0%) |
Real Estate & Mortgages in Moreland
Real Estate and Mortgage Overview in Moreland
| Characteristic | Without Mortgage | With Mortgage |
| Housing Units | 69 | 106 |
| Median Property Value | $241,100 | $270,700 |
| Median Household Income | $77,708 | $40 |
| Monthly Housing Costs | $660 | $4 |
| Real Estate Taxes | $1,222 | $2 |
Property Value by Mortgage Status in Moreland
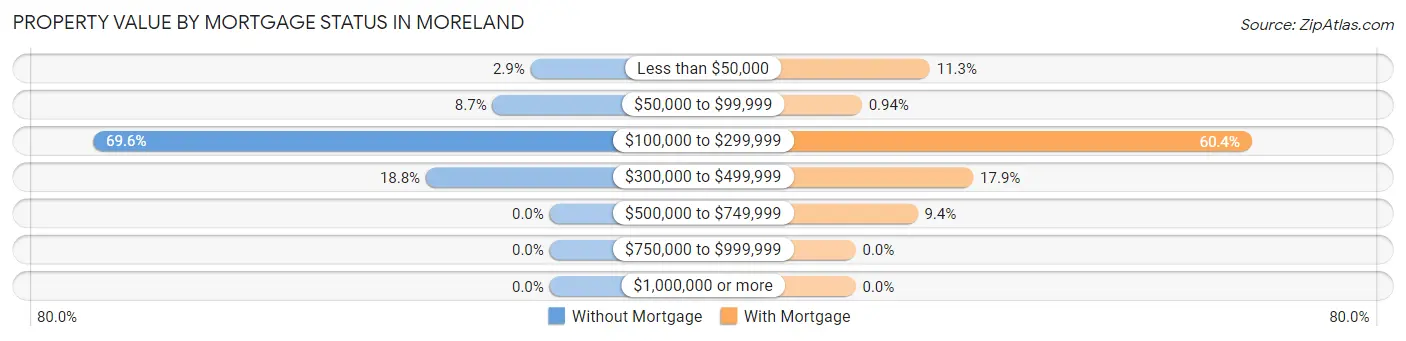
| Property Value | Without Mortgage | With Mortgage |
| Less than $50,000 | 2 (2.9%) | 12 (11.3%) |
| $50,000 to $99,999 | 6 (8.7%) | 1 (0.9%) |
| $100,000 to $299,999 | 48 (69.6%) | 64 (60.4%) |
| $300,000 to $499,999 | 13 (18.8%) | 19 (17.9%) |
| $500,000 to $749,999 | 0 (0.0%) | 10 (9.4%) |
| $750,000 to $999,999 | 0 (0.0%) | 0 (0.0%) |
| $1,000,000 or more | 0 (0.0%) | 0 (0.0%) |
| Total | 69 (100.0%) | 106 (100.0%) |
Household Income by Mortgage Status in Moreland
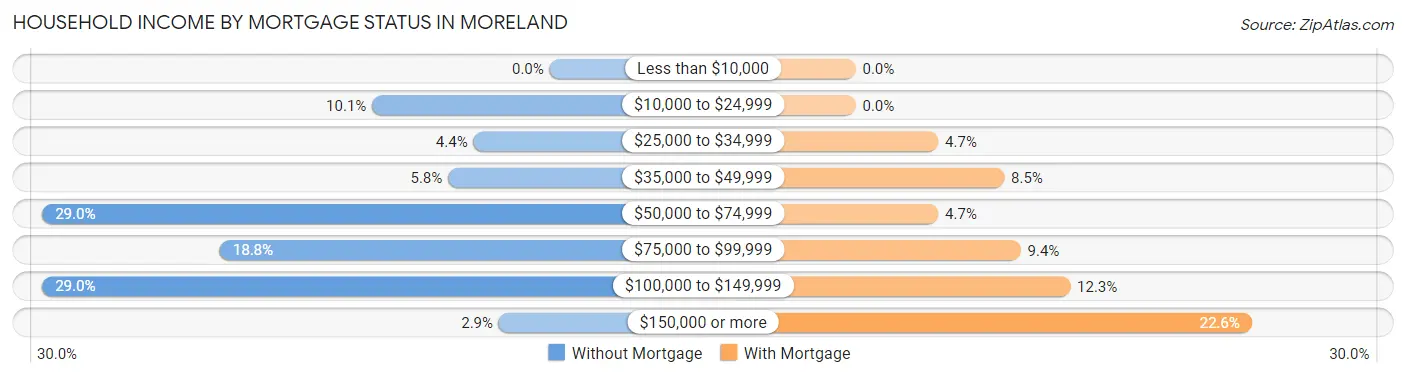
| Household Income | Without Mortgage | With Mortgage |
| Less than $10,000 | 0 (0.0%) | 0 (0.0%) |
| $10,000 to $24,999 | 7 (10.1%) | 0 (0.0%) |
| $25,000 to $34,999 | 3 (4.3%) | 5 (4.7%) |
| $35,000 to $49,999 | 4 (5.8%) | 9 (8.5%) |
| $50,000 to $74,999 | 20 (29.0%) | 5 (4.7%) |
| $75,000 to $99,999 | 13 (18.8%) | 10 (9.4%) |
| $100,000 to $149,999 | 20 (29.0%) | 13 (12.3%) |
| $150,000 or more | 2 (2.9%) | 24 (22.6%) |
| Total | 69 (100.0%) | 106 (100.0%) |
Property Value to Household Income Ratio in Moreland
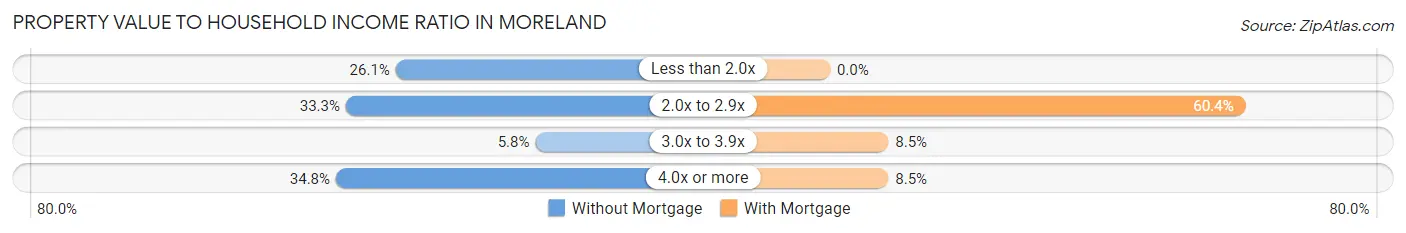
| Value-to-Income Ratio | Without Mortgage | With Mortgage |
| Less than 2.0x | 18 (26.1%) | 0 (0.0%) |
| 2.0x to 2.9x | 23 (33.3%) | 64 (60.4%) |
| 3.0x to 3.9x | 4 (5.8%) | 9 (8.5%) |
| 4.0x or more | 24 (34.8%) | 9 (8.5%) |
| Total | 69 (100.0%) | 106 (100.0%) |
Real Estate Taxes by Mortgage Status in Moreland
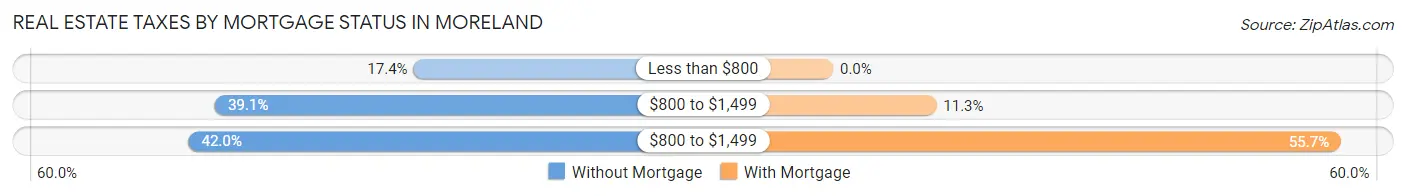
| Property Taxes | Without Mortgage | With Mortgage |
| Less than $800 | 12 (17.4%) | 0 (0.0%) |
| $800 to $1,499 | 27 (39.1%) | 12 (11.3%) |
| $800 to $1,499 | 29 (42.0%) | 59 (55.7%) |
| Total | 69 (100.0%) | 106 (100.0%) |
Health & Disability in Moreland
Health Insurance Coverage by Age in Moreland
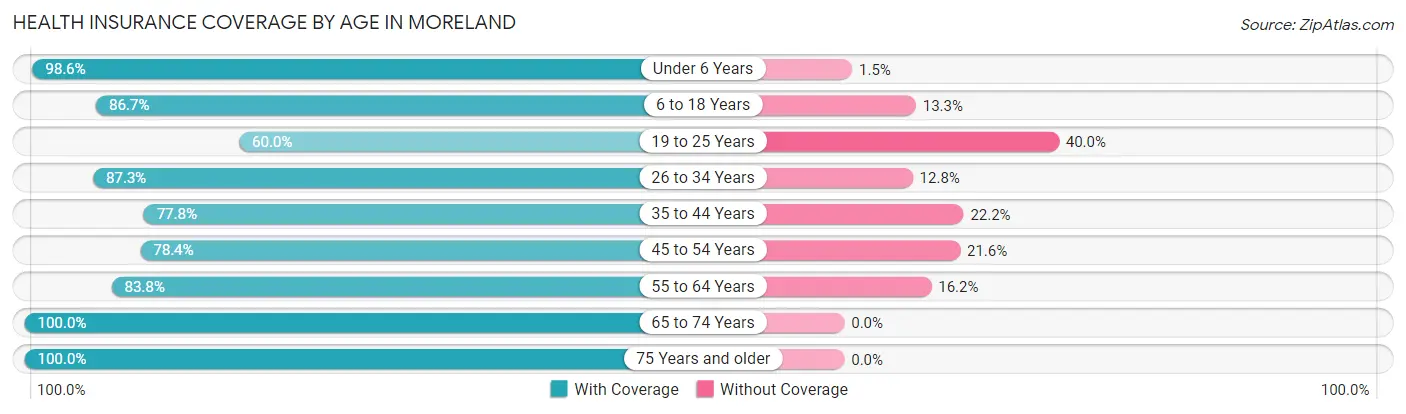
| Age Bracket | With Coverage | Without Coverage |
| Under 6 Years | 136 (98.6%) | 2 (1.5%) |
| 6 to 18 Years | 26 (86.7%) | 4 (13.3%) |
| 19 to 25 Years | 30 (60.0%) | 20 (40.0%) |
| 26 to 34 Years | 89 (87.3%) | 13 (12.8%) |
| 35 to 44 Years | 21 (77.8%) | 6 (22.2%) |
| 45 to 54 Years | 69 (78.4%) | 19 (21.6%) |
| 55 to 64 Years | 62 (83.8%) | 12 (16.2%) |
| 65 to 74 Years | 66 (100.0%) | 0 (0.0%) |
| 75 Years and older | 33 (100.0%) | 0 (0.0%) |
| Total | 532 (87.5%) | 76 (12.5%) |
Health Insurance Coverage by Citizenship Status in Moreland
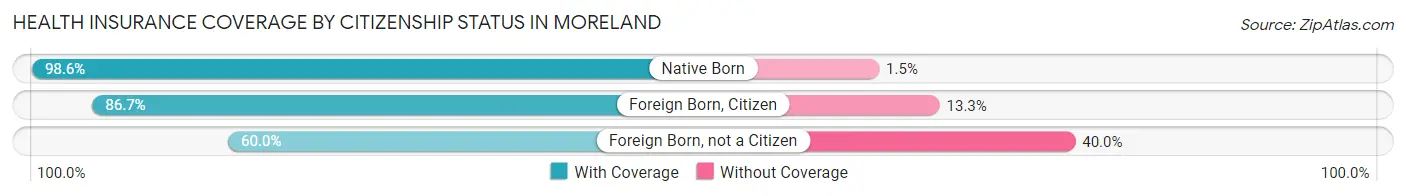
| Citizenship Status | With Coverage | Without Coverage |
| Native Born | 136 (98.6%) | 2 (1.5%) |
| Foreign Born, Citizen | 26 (86.7%) | 4 (13.3%) |
| Foreign Born, not a Citizen | 30 (60.0%) | 20 (40.0%) |
Health Insurance Coverage by Household Income in Moreland
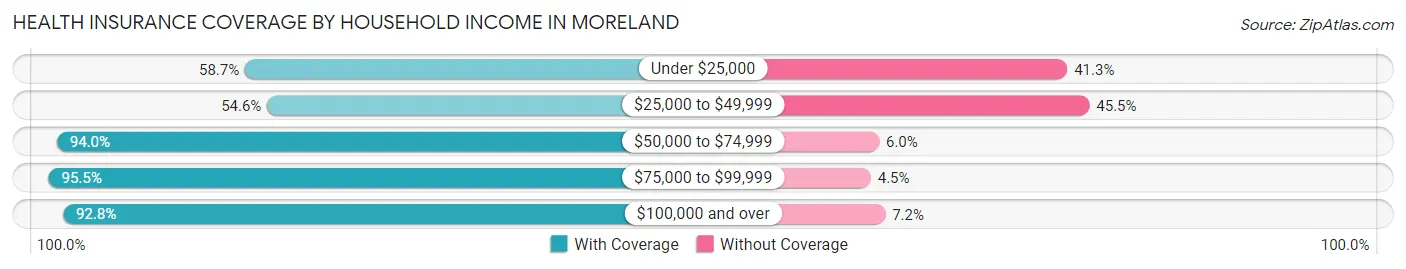
| Household Income | With Coverage | Without Coverage |
| Under $25,000 | 27 (58.7%) | 19 (41.3%) |
| $25,000 to $49,999 | 30 (54.5%) | 25 (45.5%) |
| $50,000 to $74,999 | 171 (94.0%) | 11 (6.0%) |
| $75,000 to $99,999 | 85 (95.5%) | 4 (4.5%) |
| $100,000 and over | 219 (92.8%) | 17 (7.2%) |
Public vs Private Health Insurance Coverage by Age in Moreland
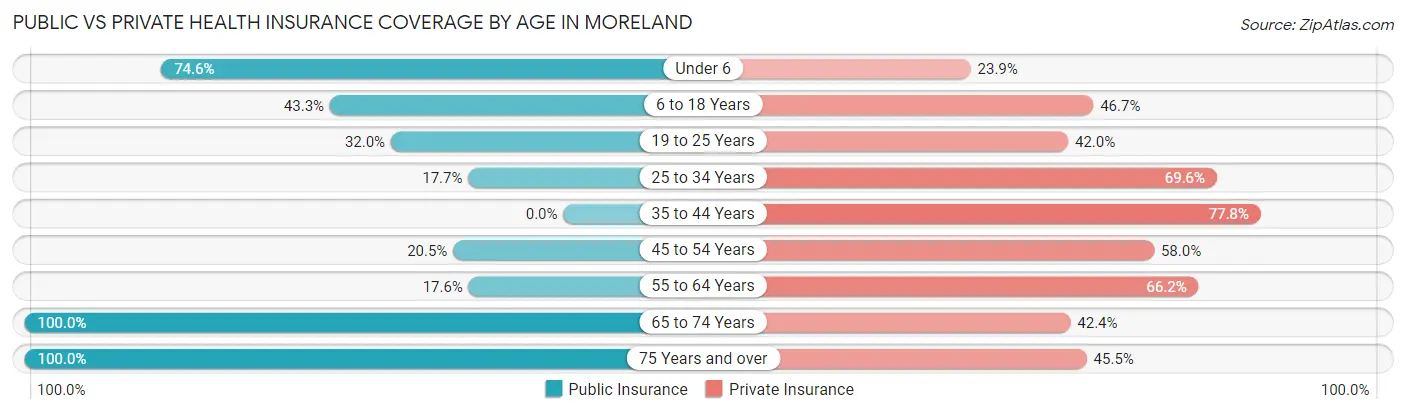
| Age Bracket | Public Insurance | Private Insurance |
| Under 6 | 103 (74.6%) | 33 (23.9%) |
| 6 to 18 Years | 13 (43.3%) | 14 (46.7%) |
| 19 to 25 Years | 16 (32.0%) | 21 (42.0%) |
| 25 to 34 Years | 18 (17.6%) | 71 (69.6%) |
| 35 to 44 Years | 0 (0.0%) | 21 (77.8%) |
| 45 to 54 Years | 18 (20.4%) | 51 (58.0%) |
| 55 to 64 Years | 13 (17.6%) | 49 (66.2%) |
| 65 to 74 Years | 66 (100.0%) | 28 (42.4%) |
| 75 Years and over | 33 (100.0%) | 15 (45.5%) |
| Total | 280 (46.1%) | 303 (49.8%) |
Disability Status by Sex by Age in Moreland
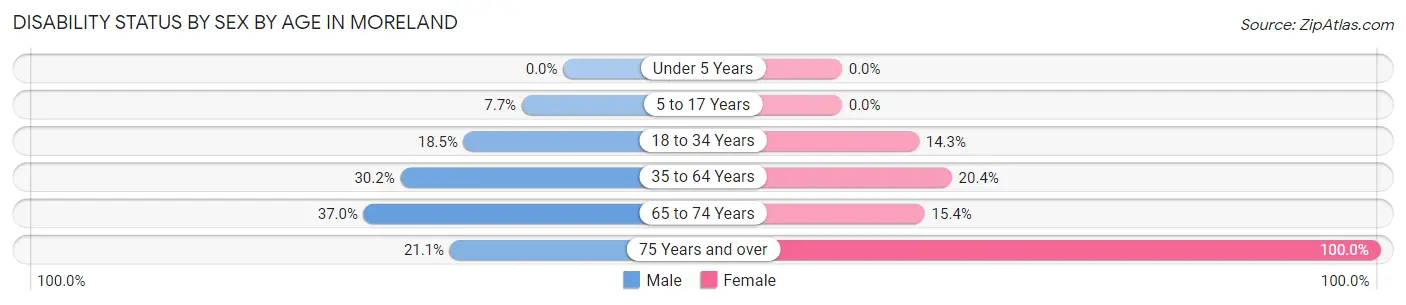
| Age Bracket | Male | Female |
| Under 5 Years | 0 (0.0%) | 0 (0.0%) |
| 5 to 17 Years | 3 (7.7%) | 0 (0.0%) |
| 18 to 34 Years | 17 (18.5%) | 9 (14.3%) |
| 35 to 64 Years | 26 (30.2%) | 21 (20.4%) |
| 65 to 74 Years | 10 (37.0%) | 6 (15.4%) |
| 75 Years and over | 4 (21.0%) | 14 (100.0%) |
Disability Class by Sex by Age in Moreland
Disability Class: Hearing Difficulty
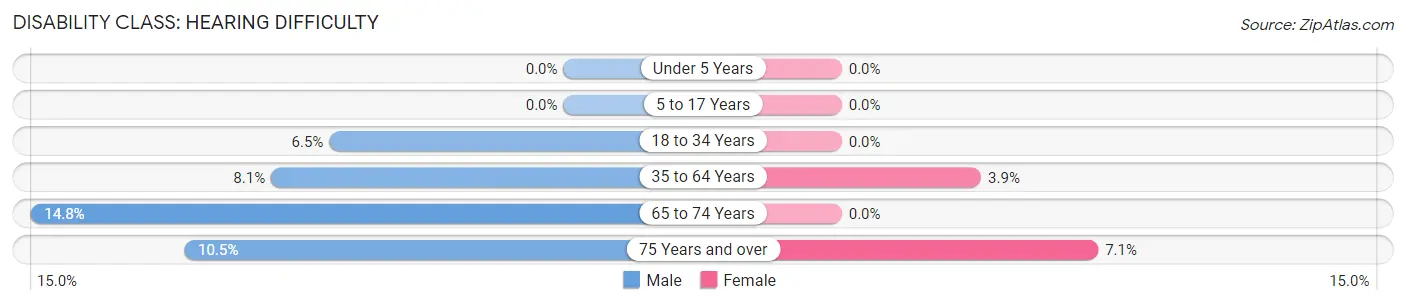
| Age Bracket | Male | Female |
| Under 5 Years | 0 (0.0%) | 0 (0.0%) |
| 5 to 17 Years | 0 (0.0%) | 0 (0.0%) |
| 18 to 34 Years | 6 (6.5%) | 0 (0.0%) |
| 35 to 64 Years | 7 (8.1%) | 4 (3.9%) |
| 65 to 74 Years | 4 (14.8%) | 0 (0.0%) |
| 75 Years and over | 2 (10.5%) | 1 (7.1%) |
Disability Class: Vision Difficulty
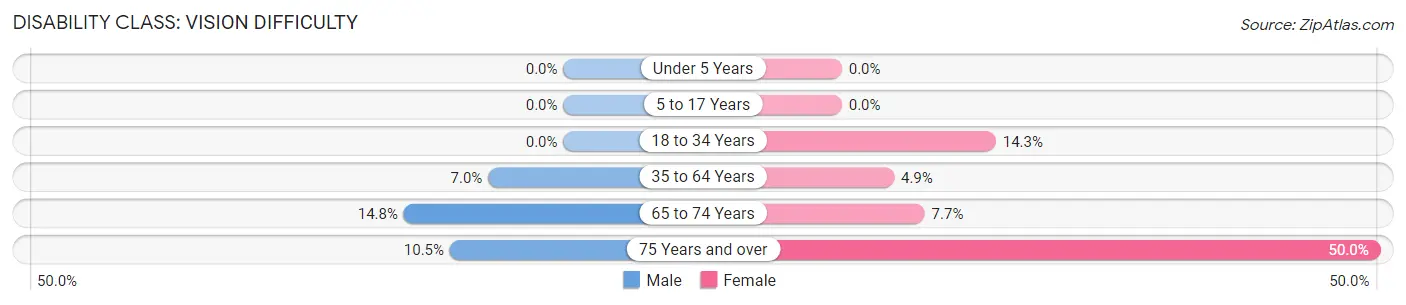
| Age Bracket | Male | Female |
| Under 5 Years | 0 (0.0%) | 0 (0.0%) |
| 5 to 17 Years | 0 (0.0%) | 0 (0.0%) |
| 18 to 34 Years | 0 (0.0%) | 9 (14.3%) |
| 35 to 64 Years | 6 (7.0%) | 5 (4.9%) |
| 65 to 74 Years | 4 (14.8%) | 3 (7.7%) |
| 75 Years and over | 2 (10.5%) | 7 (50.0%) |
Disability Class: Cognitive Difficulty
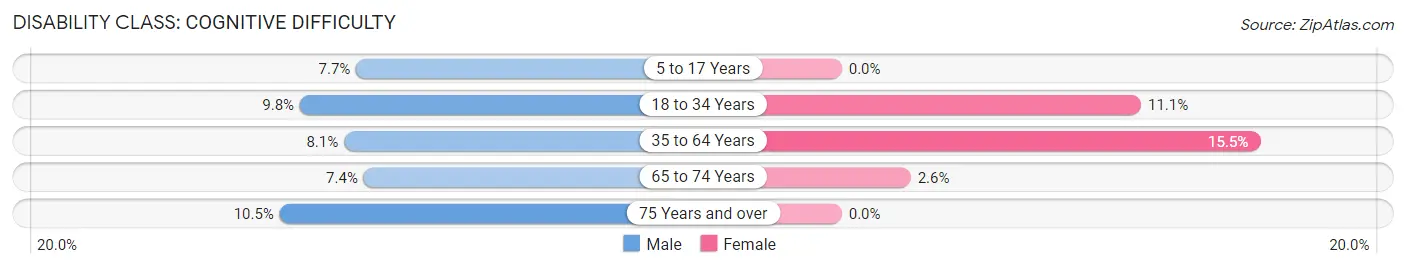
| Age Bracket | Male | Female |
| 5 to 17 Years | 3 (7.7%) | 0 (0.0%) |
| 18 to 34 Years | 9 (9.8%) | 7 (11.1%) |
| 35 to 64 Years | 7 (8.1%) | 16 (15.5%) |
| 65 to 74 Years | 2 (7.4%) | 1 (2.6%) |
| 75 Years and over | 2 (10.5%) | 0 (0.0%) |
Disability Class: Ambulatory Difficulty
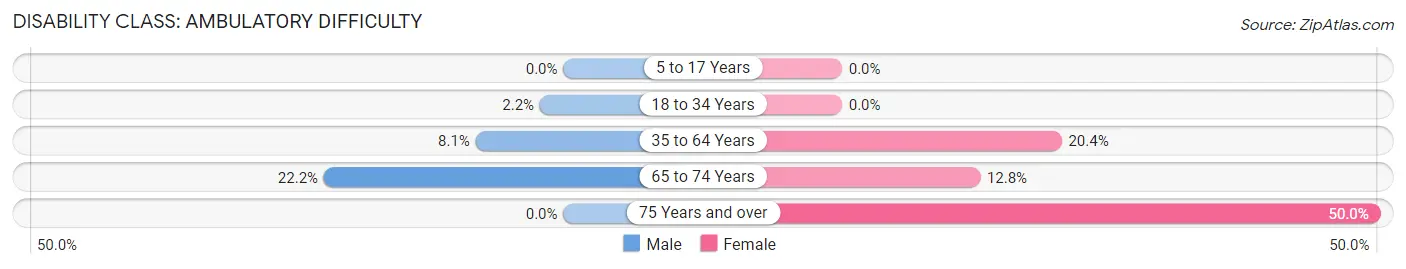
| Age Bracket | Male | Female |
| 5 to 17 Years | 0 (0.0%) | 0 (0.0%) |
| 18 to 34 Years | 2 (2.2%) | 0 (0.0%) |
| 35 to 64 Years | 7 (8.1%) | 21 (20.4%) |
| 65 to 74 Years | 6 (22.2%) | 5 (12.8%) |
| 75 Years and over | 0 (0.0%) | 7 (50.0%) |
Disability Class: Self-Care Difficulty
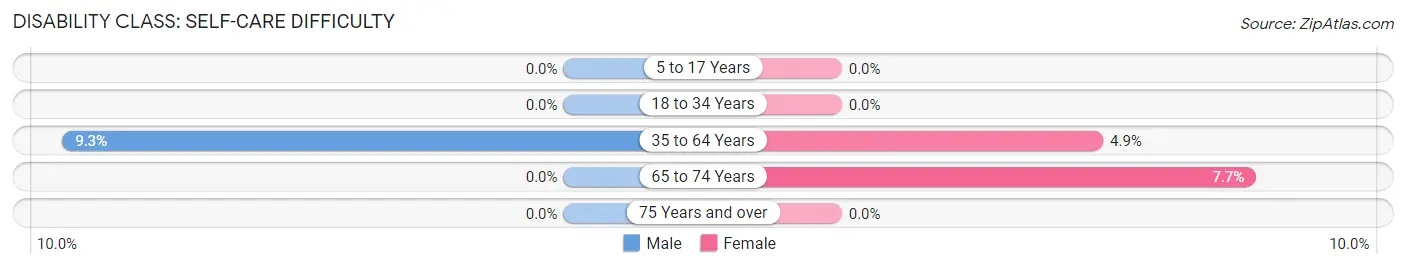
| Age Bracket | Male | Female |
| 5 to 17 Years | 0 (0.0%) | 0 (0.0%) |
| 18 to 34 Years | 0 (0.0%) | 0 (0.0%) |
| 35 to 64 Years | 8 (9.3%) | 5 (4.9%) |
| 65 to 74 Years | 0 (0.0%) | 3 (7.7%) |
| 75 Years and over | 0 (0.0%) | 0 (0.0%) |
Technology Access in Moreland
Computing Device Access in Moreland
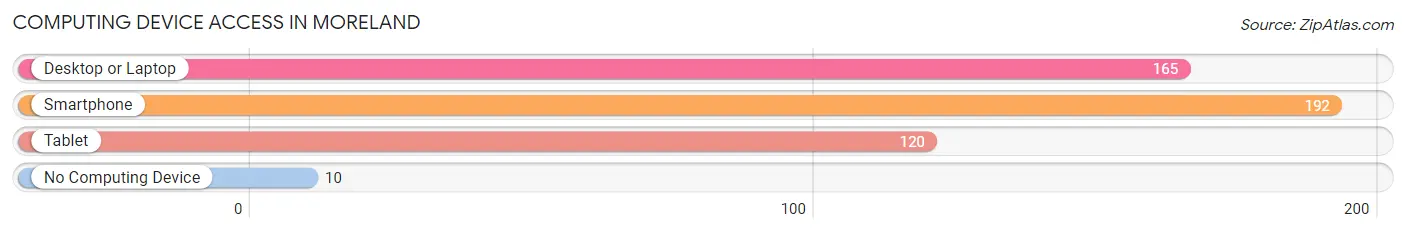
| Device Type | # Households | % Households |
| Desktop or Laptop | 165 | 78.9% |
| Smartphone | 192 | 91.9% |
| Tablet | 120 | 57.4% |
| No Computing Device | 10 | 4.8% |
| Total | 209 | 100.0% |
Internet Access in Moreland
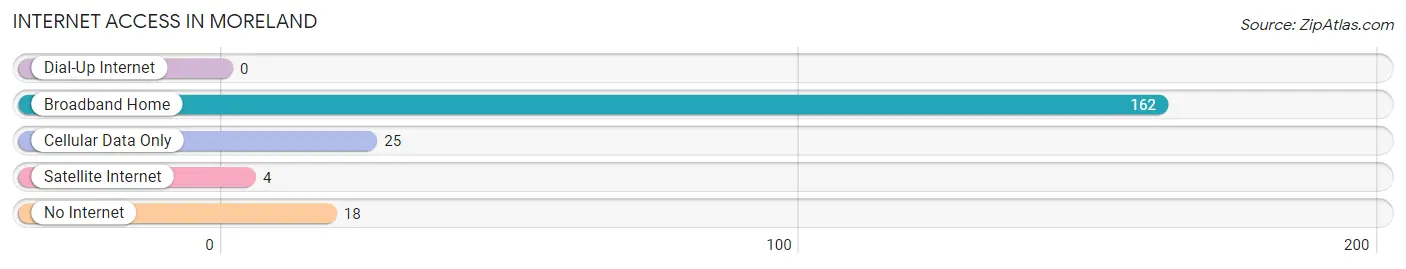
| Internet Type | # Households | % Households |
| Dial-Up Internet | 0 | 0.0% |
| Broadband Home | 162 | 77.5% |
| Cellular Data Only | 25 | 12.0% |
| Satellite Internet | 4 | 1.9% |
| No Internet | 18 | 8.6% |
| Total | 209 | 100.0% |
Moreland Summary
Moreland is a small town located in Coweta County, Georgia, United States. It is situated about 25 miles southwest of Atlanta and is part of the Atlanta metropolitan area. The population of Moreland was 1,845 at the 2010 census.
History
Moreland was founded in 1883 by the Moreland family, who had moved to the area from South Carolina. The town was named after the family and was originally known as Moreland Station. The town was incorporated in 1887 and was the first incorporated town in Coweta County.
The town grew rapidly in the late 19th and early 20th centuries, becoming a center for cotton production and other agricultural activities. The town also had a number of small businesses, including a general store, a blacksmith shop, and a grist mill.
In the early 20th century, Moreland began to decline as the railroad bypassed the town and the cotton industry moved elsewhere. The town was nearly abandoned by the 1950s, but was revitalized in the 1970s when the town was designated as a historic district.
Geography
Moreland is located in the foothills of the Appalachian Mountains in Coweta County, Georgia. The town is situated at an elevation of 845 feet (258 m) and is located about 25 miles (40 km) southwest of Atlanta.
The town is located on the banks of the Chattahoochee River and is surrounded by rolling hills and forests. The town is located in a humid subtropical climate zone and experiences hot, humid summers and mild winters.
Economy
Moreland’s economy is largely based on agriculture and tourism. The town is home to several farms that produce cotton, corn, soybeans, and other crops. The town is also home to several small businesses, including restaurants, antique stores, and gift shops.
The town is also a popular tourist destination, with visitors coming to explore the town’s historic buildings and to enjoy the natural beauty of the surrounding area.
Demographics
As of the 2010 census, the population of Moreland was 1,845. The racial makeup of the town was 79.2% White, 17.2% African American, 0.7% Native American, 0.3% Asian, 0.1% Pacific Islander, and 2.5% from other races. Hispanic or Latino of any race were 2.7% of the population.
The median household income in Moreland was $37,917, and the median family income was $45,625. The per capita income for the town was $19,945. About 15.2% of families and 18.2% of the population were below the poverty line, including 25.2% of those under age 18 and 11.2% of those age 65 or over.
Common Questions
What is the Total Population of Moreland?
Total Population of Moreland is 608.
What is the Total Male Population of Moreland?
Total Male Population of Moreland is 350.
What is the Total Female Population of Moreland?
Total Female Population of Moreland is 258.
What is the Ratio of Males per 100 Females in Moreland?
There are 135.66 Males per 100 Females in Moreland.
What is the Ratio of Females per 100 Males in Moreland?
There are 73.71 Females per 100 Males in Moreland.
What is the Median Population Age in Moreland?
Median Population Age in Moreland is 31.9 Years.
What is the Average Family Size in Moreland
Average Family Size in Moreland is 3.4 People.
What is the Average Household Size in Moreland
Average Household Size in Moreland is 2.9 People.
What is Per Capita Income in Moreland?
Per Capita income in Moreland is $37,290.
What is the Median Family Income in Moreland?
Median Family Income in Moreland is $113,958.
What is the Median Household income in Moreland?
Median Household Income in Moreland is $86,250.
What is Income or Wage Gap in Moreland?
Income or Wage Gap in Moreland is 13.5%.
Women in Moreland earn 86.5 cents for every dollar earned by a man.
What is Inequality or Gini Index in Moreland?
Inequality or Gini Index in Moreland is 0.41.
How Large is the Labor Force in Moreland?
There are 262 People in the Labor Forcein in Moreland.
What is the Percentage of People in the Labor Force in Moreland?
58.2% of People are in the Labor Force in Moreland.
What is the Unemployment Rate in Moreland?
Unemployment Rate in Moreland is 4.2%.