Leary, GA
Leary Map
Leary Overview
373
TOTAL POPULATION
163
MALE POPULATION
210
FEMALE POPULATION
77.62
MALES / 100 FEMALES
128.83
FEMALES / 100 MALES
64.6
MEDIAN AGE
2.5
AVG FAMILY SIZE
1.9
AVG HOUSEHOLD SIZE
$25,110
PER CAPITA INCOME
$46,250
AVG FAMILY INCOME
$35,385
AVG HOUSEHOLD INCOME
44.7%
WAGE / INCOME GAP [ % ]
55.3¢/ $1
WAGE / INCOME GAP [ $ ]
0.45
INEQUALITY / GINI INDEX
142
LABOR FORCE [ PEOPLE ]
42.3%
PERCENT IN LABOR FORCE
Leary Zip Codes
Leary Area Codes
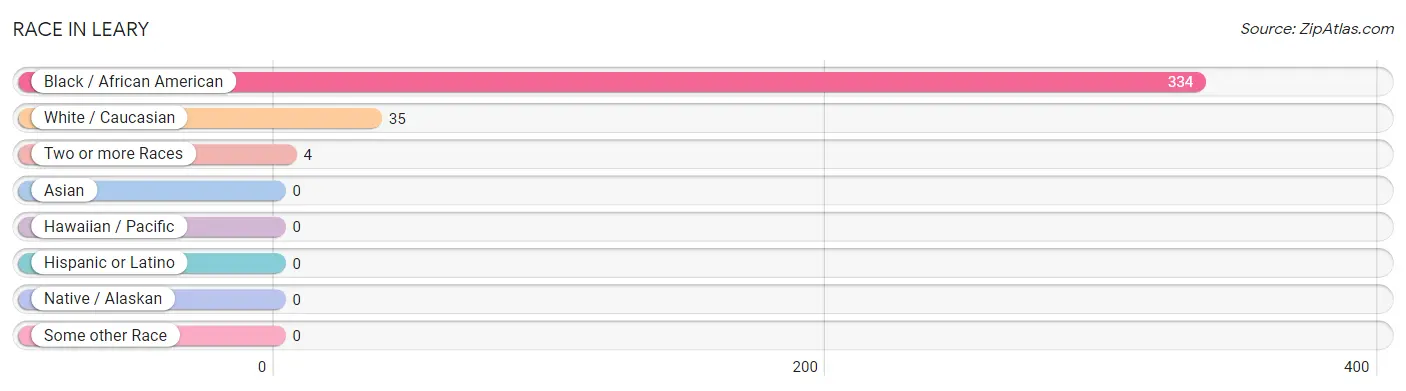
Race in Leary
The most populous races in Leary are Black / African American (334 | 89.5%), White / Caucasian (35 | 9.4%), and Two or more Races (4 | 1.1%).
| Race | # Population | % Population |
| Asian | 0 | 0.0% |
| Black / African American | 334 | 89.5% |
| Hawaiian / Pacific | 0 | 0.0% |
| Hispanic or Latino | 0 | 0.0% |
| Native / Alaskan | 0 | 0.0% |
| White / Caucasian | 35 | 9.4% |
| Two or more Races | 4 | 1.1% |
| Some other Race | 0 | 0.0% |
| Total | 373 | 100.0% |
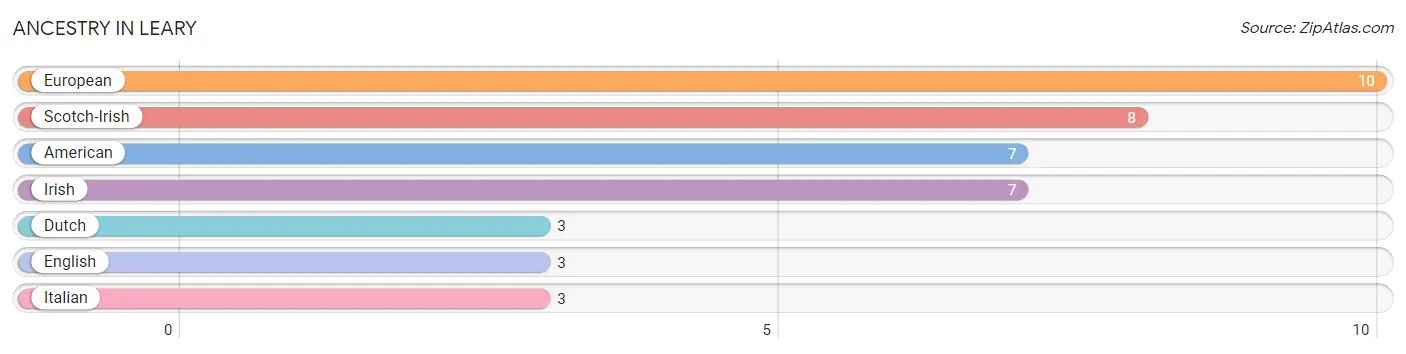
Ancestry in Leary
The most populous ancestries reported in Leary are European (10 | 2.7%), Scotch-Irish (8 | 2.1%), American (7 | 1.9%), Irish (7 | 1.9%), and Dutch (3 | 0.8%), together accounting for 9.4% of all Leary residents.
| Ancestry | # Population | % Population |
| American | 7 | 1.9% |
| Dutch | 3 | 0.8% |
| English | 3 | 0.8% |
| European | 10 | 2.7% |
| Irish | 7 | 1.9% |
| Italian | 3 | 0.8% |
| Scotch-Irish | 8 | 2.1% | View All 7 Rows |
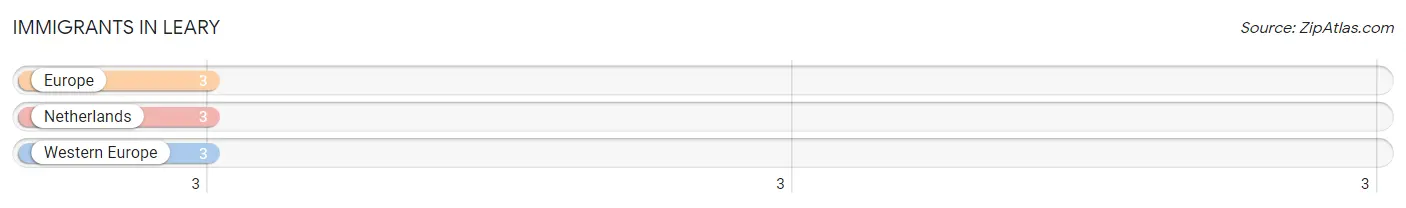
Immigrants in Leary
The most numerous immigrant groups reported in Leary came from Europe (3 | 0.8%), Netherlands (3 | 0.8%), and Western Europe (3 | 0.8%), together accounting for 2.4% of all Leary residents.
| Immigration Origin | # Population | % Population |
| Europe | 3 | 0.8% |
| Netherlands | 3 | 0.8% |
| Western Europe | 3 | 0.8% | View All 3 Rows |
Sex and Age in Leary
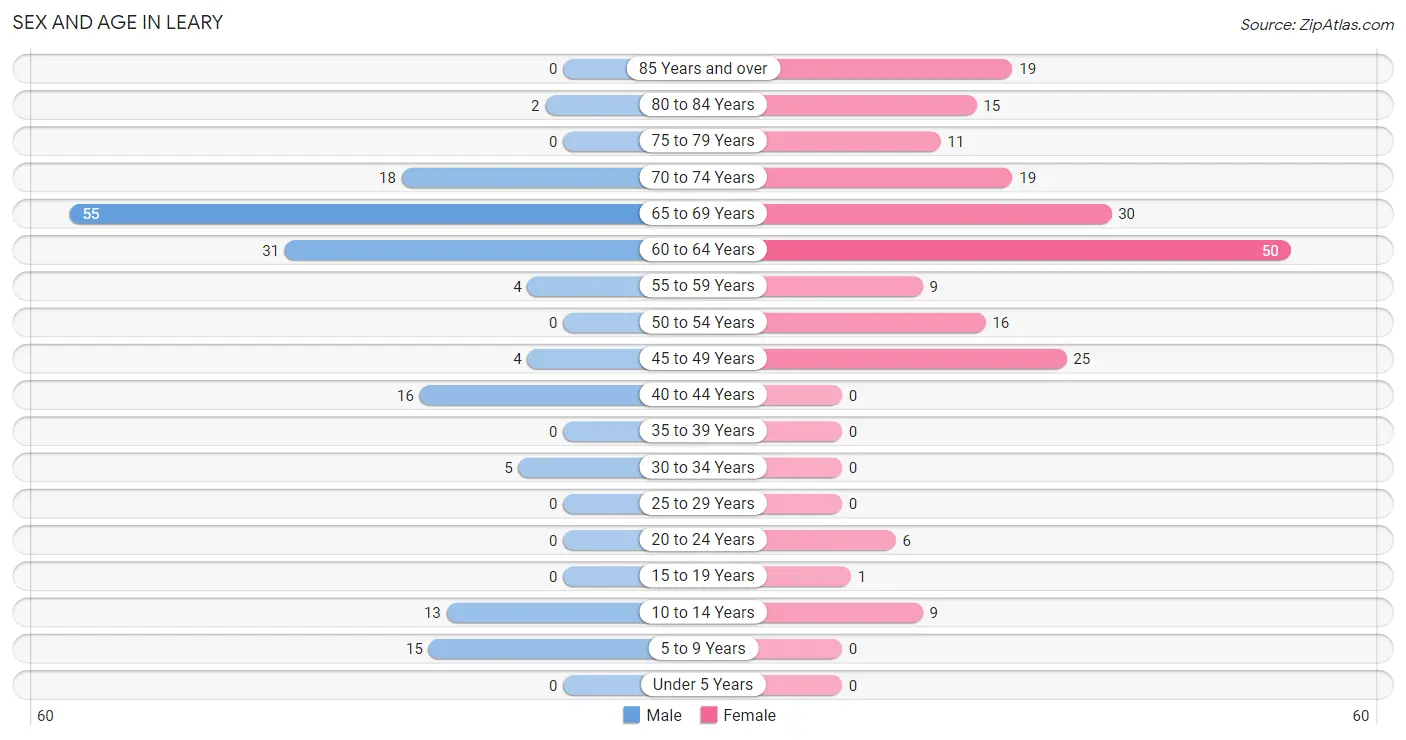
Sex and Age in Leary
The most populous age groups in Leary are 65 to 69 Years (55 | 33.7%) for men and 60 to 64 Years (50 | 23.8%) for women.
| Age Bracket | Male | Female |
| Under 5 Years | 0 (0.0%) | 0 (0.0%) |
| 5 to 9 Years | 15 (9.2%) | 0 (0.0%) |
| 10 to 14 Years | 13 (8.0%) | 9 (4.3%) |
| 15 to 19 Years | 0 (0.0%) | 1 (0.5%) |
| 20 to 24 Years | 0 (0.0%) | 6 (2.9%) |
| 25 to 29 Years | 0 (0.0%) | 0 (0.0%) |
| 30 to 34 Years | 5 (3.1%) | 0 (0.0%) |
| 35 to 39 Years | 0 (0.0%) | 0 (0.0%) |
| 40 to 44 Years | 16 (9.8%) | 0 (0.0%) |
| 45 to 49 Years | 4 (2.5%) | 25 (11.9%) |
| 50 to 54 Years | 0 (0.0%) | 16 (7.6%) |
| 55 to 59 Years | 4 (2.5%) | 9 (4.3%) |
| 60 to 64 Years | 31 (19.0%) | 50 (23.8%) |
| 65 to 69 Years | 55 (33.7%) | 30 (14.3%) |
| 70 to 74 Years | 18 (11.0%) | 19 (9.0%) |
| 75 to 79 Years | 0 (0.0%) | 11 (5.2%) |
| 80 to 84 Years | 2 (1.2%) | 15 (7.1%) |
| 85 Years and over | 0 (0.0%) | 19 (9.0%) |
| Total | 163 (100.0%) | 210 (100.0%) |
Families and Households in Leary
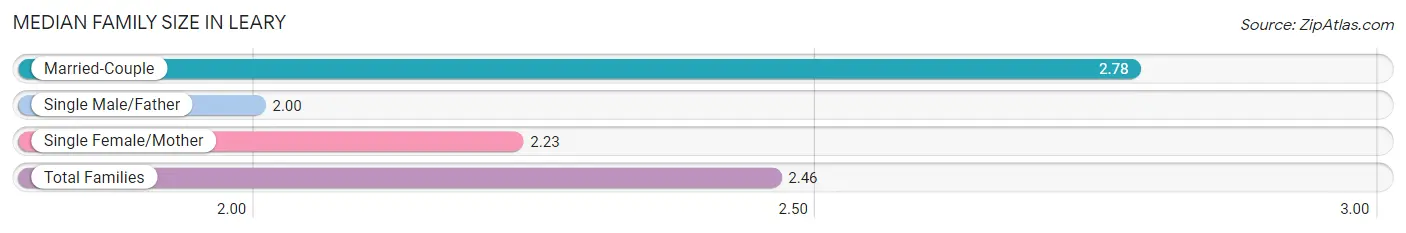
Median Family Size in Leary
The median family size in Leary is 2.46 persons per family, with married-couple families (50 | 43.5%) accounting for the largest median family size of 2.78 persons per family. On the other hand, single male/father families (3 | 2.6%) represent the smallest median family size with 2.00 persons per family.
| Family Type | # Families | Family Size |
| Married-Couple | 50 (43.5%) | 2.78 |
| Single Male/Father | 3 (2.6%) | 2.00 |
| Single Female/Mother | 62 (53.9%) | 2.23 |
| Total Families | 115 (100.0%) | 2.46 |
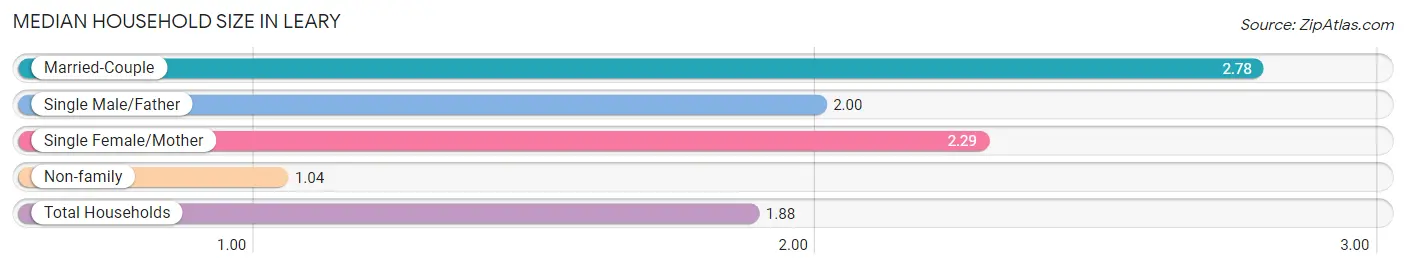
Median Household Size in Leary
The median household size in Leary is 1.88 persons per household, with married-couple households (50 | 25.3%) accounting for the largest median household size of 2.78 persons per household. non-family households (83 | 41.9%) represent the smallest median household size with 1.04 persons per household.
| Household Type | # Households | Household Size |
| Married-Couple | 50 (25.3%) | 2.78 |
| Single Male/Father | 3 (1.5%) | 2.00 |
| Single Female/Mother | 62 (31.3%) | 2.29 |
| Non-family | 83 (41.9%) | 1.04 |
| Total Households | 198 (100.0%) | 1.88 |
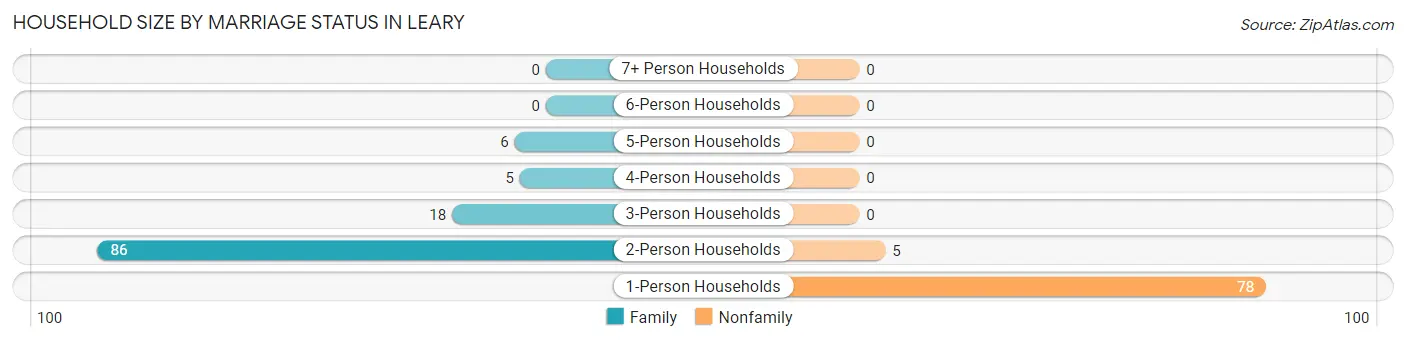
Household Size by Marriage Status in Leary
Out of a total of 198 households in Leary, 115 (58.1%) are family households, while 83 (41.9%) are nonfamily households. The most numerous type of family households are 2-person households, comprising 86, and the most common type of nonfamily households are 1-person households, comprising 78.
| Household Size | Family Households | Nonfamily Households |
| 1-Person Households | - | 78 (39.4%) |
| 2-Person Households | 86 (43.4%) | 5 (2.5%) |
| 3-Person Households | 18 (9.1%) | 0 (0.0%) |
| 4-Person Households | 5 (2.5%) | 0 (0.0%) |
| 5-Person Households | 6 (3.0%) | 0 (0.0%) |
| 6-Person Households | 0 (0.0%) | 0 (0.0%) |
| 7+ Person Households | 0 (0.0%) | 0 (0.0%) |
| Total | 115 (58.1%) | 83 (41.9%) |
Female Fertility in Leary
Fertility by Age in Leary
| Age Bracket | Women with Births | Births / 1,000 Women |
| 15 to 19 years | 0 (0.0%) | 0.0 |
| 20 to 34 years | 0 (0.0%) | 0.0 |
| 35 to 50 years | 0 (0.0%) | 0.0 |
| Total | 0 (0.0%) | 0.0 |
Fertility by Age by Marriage Status in Leary
| Age Bracket | Married | Unmarried |
| 15 to 19 years | 0 (0.0%) | 0 (0.0%) |
| 20 to 34 years | 0 (0.0%) | 0 (0.0%) |
| 35 to 50 years | 0 (0.0%) | 0 (0.0%) |
| Total | 0 (0.0%) | 0 (0.0%) |
Fertility by Education in Leary
| Educational Attainment | Women with Births | Births / 1,000 Women |
| Less than High School | 0 (0.0%) | 0.0 |
| High School Diploma | 0 (0.0%) | 0.0 |
| College or Associate's Degree | 0 (0.0%) | 0.0 |
| Bachelor's Degree | 0 (0.0%) | 0.0 |
| Graduate Degree | 0 (0.0%) | 0.0 |
| Total | 0 (0.0%) | 0.0 |
Fertility by Education by Marriage Status in Leary
| Educational Attainment | Married | Unmarried |
| Less than High School | 0 (0.0%) | 0 (0.0%) |
| High School Diploma | 0 (0.0%) | 0 (0.0%) |
| College or Associate's Degree | 0 (0.0%) | 0 (0.0%) |
| Bachelor's Degree | 0 (0.0%) | 0 (0.0%) |
| Graduate Degree | 0 (0.0%) | 0 (0.0%) |
| Total | 0 (0.0%) | 0 (0.0%) |
Income in Leary
Income Overview in Leary
Per Capita Income in Leary is $25,110, while median incomes of families and households are $46,250 and $35,385 respectively.
| Characteristic | Number | Measure |
| Per Capita Income | 373 | $25,110 |
| Median Family Income | 115 | $46,250 |
| Mean Family Income | 115 | $61,095 |
| Median Household Income | 198 | $35,385 |
| Mean Household Income | 198 | $46,582 |
| Income Deficit | 115 | $0 |
| Wage / Income Gap (%) | 373 | 44.71% |
| Wage / Income Gap ($) | 373 | 55.29¢ per $1 |
| Gini / Inequality Index | 373 | 0.45 |
Earnings by Sex in Leary
Average Earnings in Leary are $23,988, $23,654 for men and $42,778 for women, a difference of 44.7%.
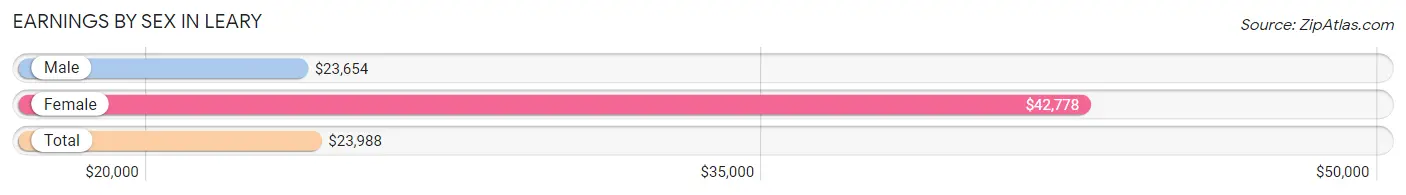
| Sex | Number | Average Earnings |
| Male | 64 (42.7%) | $23,654 |
| Female | 86 (57.3%) | $42,778 |
| Total | 150 (100.0%) | $23,988 |
Earnings by Sex by Income Bracket in Leary
The most common earnings brackets in Leary are $22,500 to $24,999 for men (39 | 60.9%) and $40,000 to $44,999 for women (18 | 20.9%).
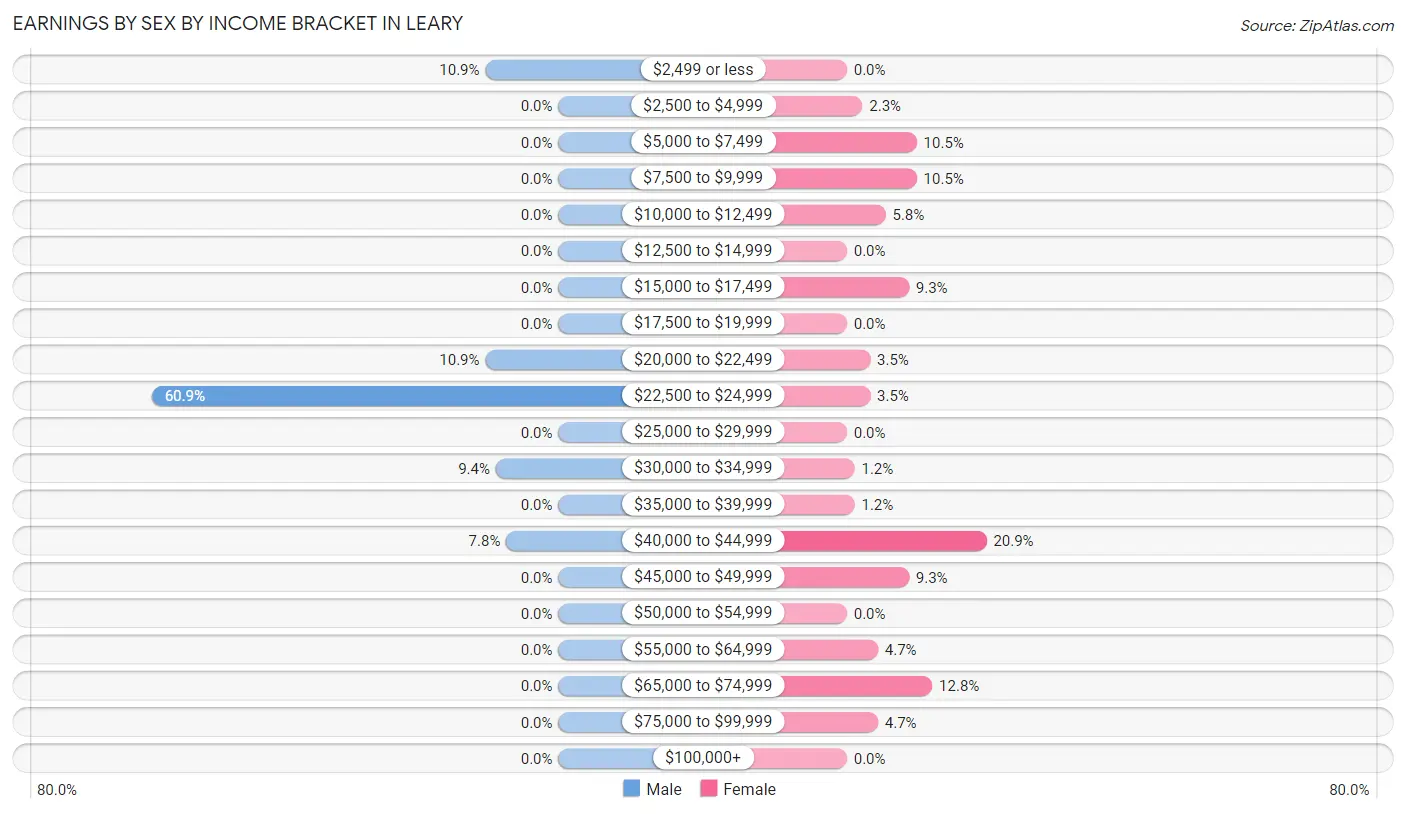
| Income | Male | Female |
| $2,499 or less | 7 (10.9%) | 0 (0.0%) |
| $2,500 to $4,999 | 0 (0.0%) | 2 (2.3%) |
| $5,000 to $7,499 | 0 (0.0%) | 9 (10.5%) |
| $7,500 to $9,999 | 0 (0.0%) | 9 (10.5%) |
| $10,000 to $12,499 | 0 (0.0%) | 5 (5.8%) |
| $12,500 to $14,999 | 0 (0.0%) | 0 (0.0%) |
| $15,000 to $17,499 | 0 (0.0%) | 8 (9.3%) |
| $17,500 to $19,999 | 0 (0.0%) | 0 (0.0%) |
| $20,000 to $22,499 | 7 (10.9%) | 3 (3.5%) |
| $22,500 to $24,999 | 39 (60.9%) | 3 (3.5%) |
| $25,000 to $29,999 | 0 (0.0%) | 0 (0.0%) |
| $30,000 to $34,999 | 6 (9.4%) | 1 (1.2%) |
| $35,000 to $39,999 | 0 (0.0%) | 1 (1.2%) |
| $40,000 to $44,999 | 5 (7.8%) | 18 (20.9%) |
| $45,000 to $49,999 | 0 (0.0%) | 8 (9.3%) |
| $50,000 to $54,999 | 0 (0.0%) | 0 (0.0%) |
| $55,000 to $64,999 | 0 (0.0%) | 4 (4.6%) |
| $65,000 to $74,999 | 0 (0.0%) | 11 (12.8%) |
| $75,000 to $99,999 | 0 (0.0%) | 4 (4.6%) |
| $100,000+ | 0 (0.0%) | 0 (0.0%) |
| Total | 64 (100.0%) | 86 (100.0%) |
Earnings by Sex by Educational Attainment in Leary
Average earnings in Leary are $23,654 for men and $42,778 for women, a difference of 44.7%. Men with an educational attainment of high school diploma enjoy the highest average annual earnings of $23,967, while those with high school diploma education earn the least with $23,967. Women with an educational attainment of college or associate's degree earn the most with the average annual earnings of $43,828, while those with high school diploma education have the smallest earnings of $9,063.
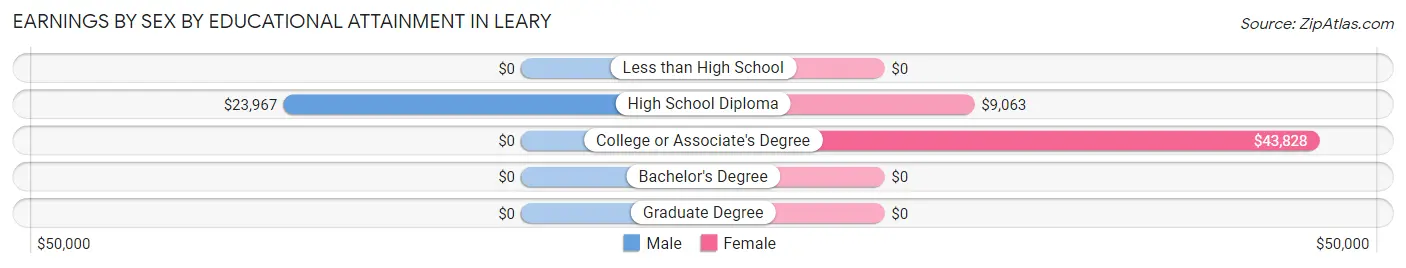
| Educational Attainment | Male Income | Female Income |
| Less than High School | - | - |
| High School Diploma | $23,967 | $9,063 |
| College or Associate's Degree | - | - |
| Bachelor's Degree | - | - |
| Graduate Degree | - | - |
| Total | $23,654 | $42,778 |
Family Income in Leary
Family Income Brackets in Leary
According to the Leary family income data, there are 31 families falling into the $75,000 to $99,999 income range, which is the most common income bracket and makes up 27.0% of all families. Conversely, the less than $10,000 income bracket is the least frequent group with only 2 families (1.7%) belonging to this category.
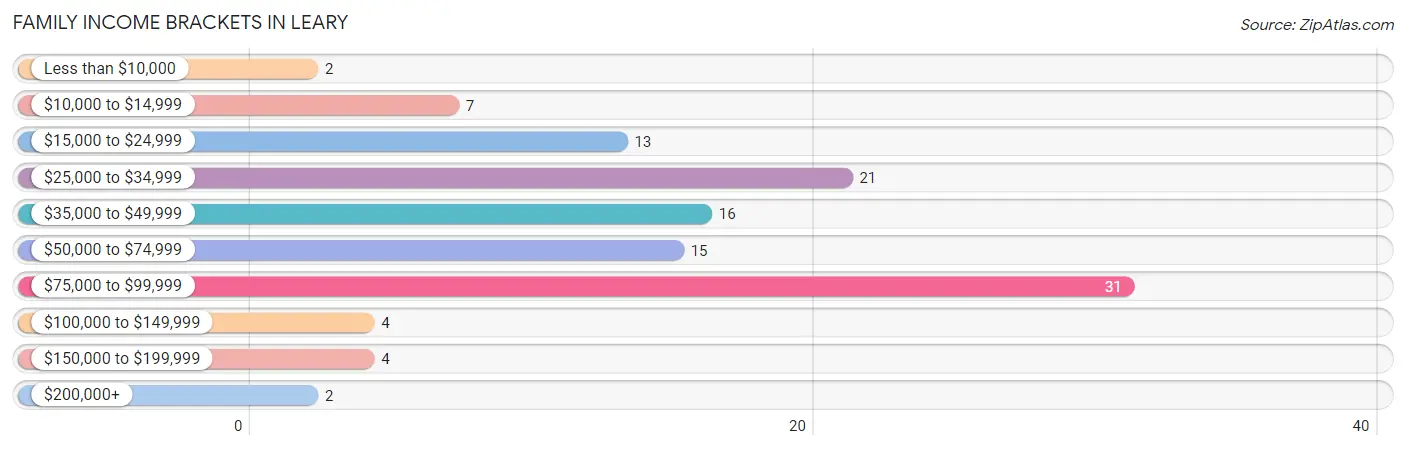
| Income Bracket | # Families | % Families |
| Less than $10,000 | 2 | 1.7% |
| $10,000 to $14,999 | 7 | 6.1% |
| $15,000 to $24,999 | 13 | 11.3% |
| $25,000 to $34,999 | 21 | 18.3% |
| $35,000 to $49,999 | 16 | 13.9% |
| $50,000 to $74,999 | 15 | 13.0% |
| $75,000 to $99,999 | 31 | 27.0% |
| $100,000 to $149,999 | 4 | 3.5% |
| $150,000 to $199,999 | 4 | 3.5% |
| $200,000+ | 2 | 1.7% |
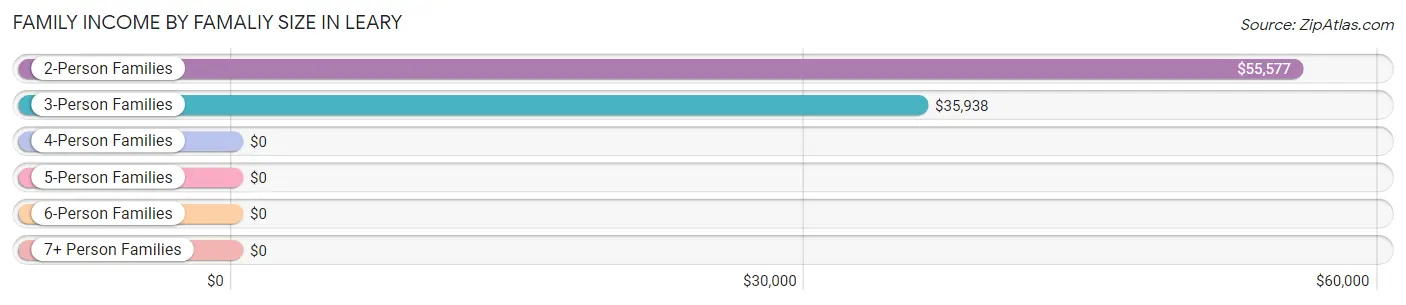
Family Income by Famaliy Size in Leary
2-person families (90 | 78.3%) account for the highest median family income in Leary with $55,577 per family, while 2-person families (90 | 78.3%) have the highest median income of $27,788 per family member.
| Income Bracket | # Families | Median Income |
| 2-Person Families | 90 (78.3%) | $55,577 |
| 3-Person Families | 14 (12.2%) | $35,938 |
| 4-Person Families | 5 (4.3%) | $0 |
| 5-Person Families | 6 (5.2%) | $0 |
| 6-Person Families | 0 (0.0%) | $0 |
| 7+ Person Families | 0 (0.0%) | $0 |
| Total | 115 (100.0%) | $46,250 |
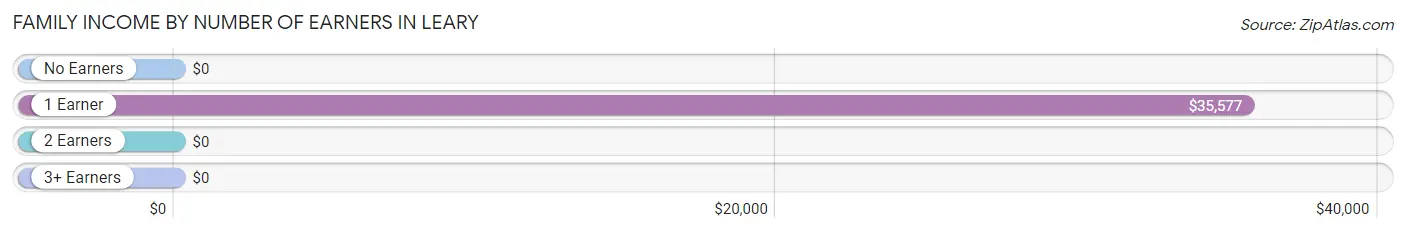
Family Income by Number of Earners in Leary
| Number of Earners | # Families | Median Income |
| No Earners | 28 (24.3%) | $0 |
| 1 Earner | 60 (52.2%) | $35,577 |
| 2 Earners | 27 (23.5%) | $0 |
| 3+ Earners | 0 (0.0%) | $0 |
| Total | 115 (100.0%) | $46,250 |
Household Income in Leary
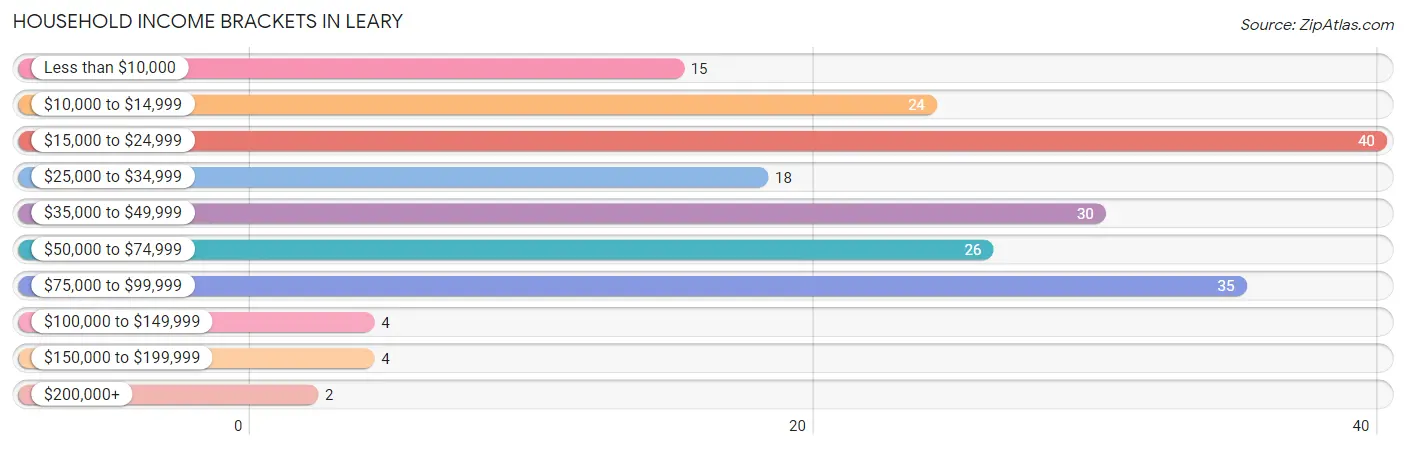
Household Income Brackets in Leary
With 40 households falling in the category, the $15,000 to $24,999 income range is the most frequent in Leary, accounting for 20.2% of all households. In contrast, only 2 households (1.0%) fall into the $200,000+ income bracket, making it the least populous group.
| Income Bracket | # Households | % Households |
| Less than $10,000 | 15 | 7.6% |
| $10,000 to $14,999 | 24 | 12.1% |
| $15,000 to $24,999 | 40 | 20.2% |
| $25,000 to $34,999 | 18 | 9.1% |
| $35,000 to $49,999 | 30 | 15.2% |
| $50,000 to $74,999 | 26 | 13.1% |
| $75,000 to $99,999 | 35 | 17.7% |
| $100,000 to $149,999 | 4 | 2.0% |
| $150,000 to $199,999 | 4 | 2.0% |
| $200,000+ | 2 | 1.0% |
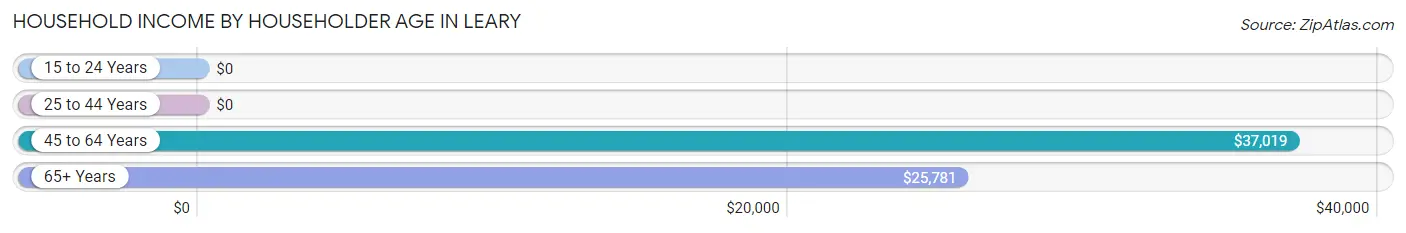
Household Income by Householder Age in Leary
The median household income in Leary is $35,385, with the highest median household income of $37,019 found in the 45 to 64 years age bracket for the primary householder. A total of 95 households (48.0%) fall into this category. Meanwhile, the 15 to 24 years age bracket for the primary householder has the lowest median household income of $0, with 6 households (3.0%) in this group.
| Income Bracket | # Households | Median Income |
| 15 to 24 Years | 6 (3.0%) | $0 |
| 25 to 44 Years | 0 (0.0%) | $0 |
| 45 to 64 Years | 95 (48.0%) | $37,019 |
| 65+ Years | 97 (49.0%) | $25,781 |
| Total | 198 (100.0%) | $35,385 |
Poverty in Leary
Income Below Poverty by Sex and Age in Leary
With 18.4% poverty level for males and 12.9% for females among the residents of Leary, 55 to 64 year old males and 18 to 24 year old females are the most vulnerable to poverty, with 15 males (42.9%) and 6 females (100.0%) in their respective age groups living below the poverty level.
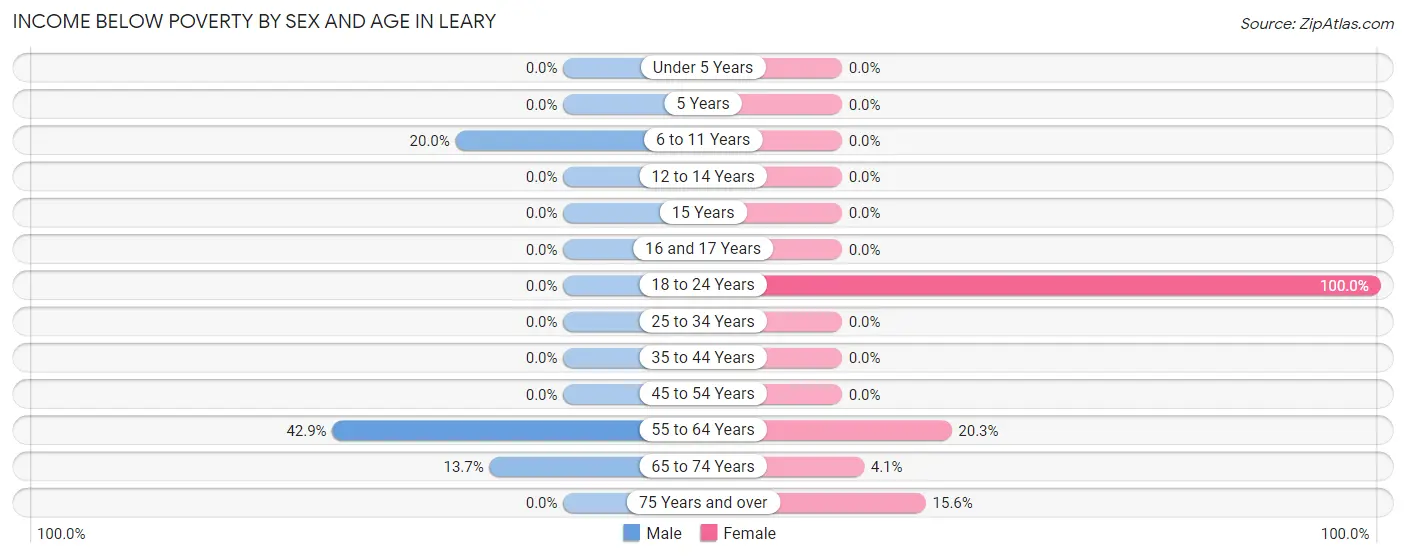
| Age Bracket | Male | Female |
| Under 5 Years | 0 (0.0%) | 0 (0.0%) |
| 5 Years | 0 (0.0%) | 0 (0.0%) |
| 6 to 11 Years | 5 (20.0%) | 0 (0.0%) |
| 12 to 14 Years | 0 (0.0%) | 0 (0.0%) |
| 15 Years | 0 (0.0%) | 0 (0.0%) |
| 16 and 17 Years | 0 (0.0%) | 0 (0.0%) |
| 18 to 24 Years | 0 (0.0%) | 6 (100.0%) |
| 25 to 34 Years | 0 (0.0%) | 0 (0.0%) |
| 35 to 44 Years | 0 (0.0%) | 0 (0.0%) |
| 45 to 54 Years | 0 (0.0%) | 0 (0.0%) |
| 55 to 64 Years | 15 (42.9%) | 12 (20.3%) |
| 65 to 74 Years | 10 (13.7%) | 2 (4.1%) |
| 75 Years and over | 0 (0.0%) | 7 (15.6%) |
| Total | 30 (18.4%) | 27 (12.9%) |
Income Above Poverty by Sex and Age in Leary
According to the poverty statistics in Leary, males aged 12 to 14 years and females aged 12 to 14 years are the age groups that are most secure financially, with 100.0% of males and 100.0% of females in these age groups living above the poverty line.
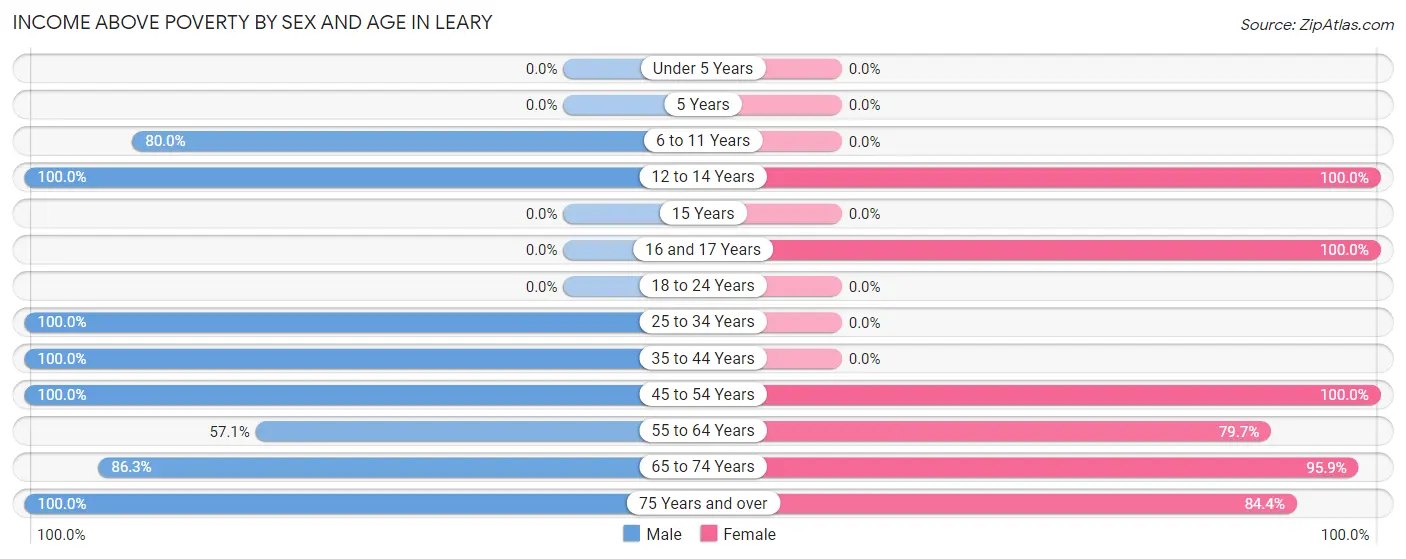
| Age Bracket | Male | Female |
| Under 5 Years | 0 (0.0%) | 0 (0.0%) |
| 5 Years | 0 (0.0%) | 0 (0.0%) |
| 6 to 11 Years | 20 (80.0%) | 0 (0.0%) |
| 12 to 14 Years | 3 (100.0%) | 9 (100.0%) |
| 15 Years | 0 (0.0%) | 0 (0.0%) |
| 16 and 17 Years | 0 (0.0%) | 1 (100.0%) |
| 18 to 24 Years | 0 (0.0%) | 0 (0.0%) |
| 25 to 34 Years | 5 (100.0%) | 0 (0.0%) |
| 35 to 44 Years | 16 (100.0%) | 0 (0.0%) |
| 45 to 54 Years | 4 (100.0%) | 41 (100.0%) |
| 55 to 64 Years | 20 (57.1%) | 47 (79.7%) |
| 65 to 74 Years | 63 (86.3%) | 47 (95.9%) |
| 75 Years and over | 2 (100.0%) | 38 (84.4%) |
| Total | 133 (81.6%) | 183 (87.1%) |
Income Below Poverty Among Married-Couple Families in Leary
The poverty statistics for married-couple families in Leary show that 4.0% or 2 of the total 50 families live below the poverty line. Families with no children have the highest poverty rate of 6.1%, comprising of 2 families. On the other hand, families with 1 or 2 children have the lowest poverty rate of 0.0%, which includes 0 families.
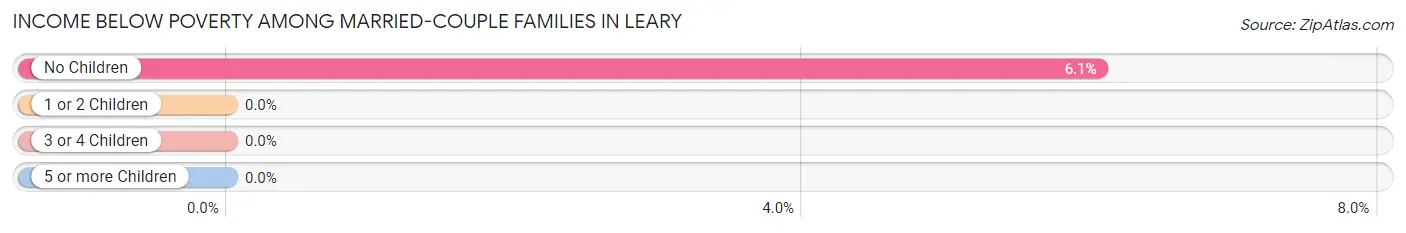
| Children | Above Poverty | Below Poverty |
| No Children | 31 (93.9%) | 2 (6.1%) |
| 1 or 2 Children | 15 (100.0%) | 0 (0.0%) |
| 3 or 4 Children | 2 (100.0%) | 0 (0.0%) |
| 5 or more Children | 0 (0.0%) | 0 (0.0%) |
| Total | 48 (96.0%) | 2 (4.0%) |
Income Below Poverty Among Single-Parent Households in Leary
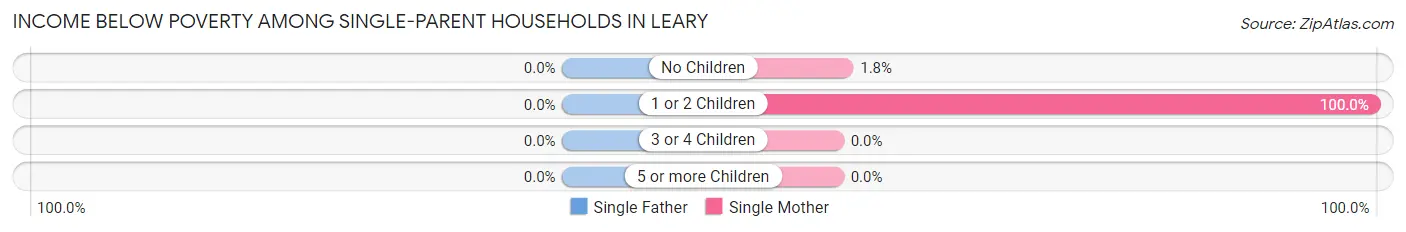
| Children | Single Father | Single Mother |
| No Children | 0 (0.0%) | 1 (1.8%) |
| 1 or 2 Children | 0 (0.0%) | 6 (100.0%) |
| 3 or 4 Children | 0 (0.0%) | 0 (0.0%) |
| 5 or more Children | 0 (0.0%) | 0 (0.0%) |
| Total | 0 (0.0%) | 7 (11.3%) |
Income Below Poverty Among Married-Couple vs Single-Parent Households in Leary
The poverty data for Leary shows that 2 of the married-couple family households (4.0%) and 7 of the single-parent households (10.8%) are living below the poverty level. Within the married-couple family households, those with no children have the highest poverty rate, with 2 households (6.1%) falling below the poverty line. Among the single-parent households, those with 1 or 2 children have the highest poverty rate, with 6 household (100.0%) living below poverty.
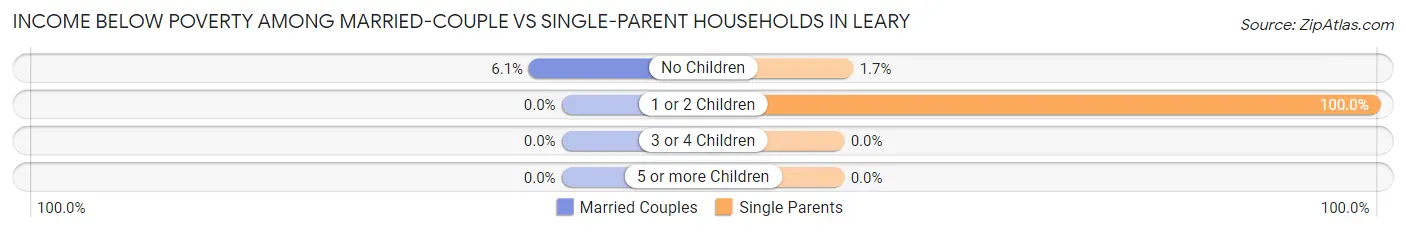
| Children | Married-Couple Families | Single-Parent Households |
| No Children | 2 (6.1%) | 1 (1.7%) |
| 1 or 2 Children | 0 (0.0%) | 6 (100.0%) |
| 3 or 4 Children | 0 (0.0%) | 0 (0.0%) |
| 5 or more Children | 0 (0.0%) | 0 (0.0%) |
| Total | 2 (4.0%) | 7 (10.8%) |
Employment Characteristics in Leary
Employment by Class of Employer in Leary
Among the 142 employed individuals in Leary, private company employees (108 | 76.1%), local government employees (15 | 10.6%), and self-employed (not incorporated) (9 | 6.3%) make up the most common classes of employment.
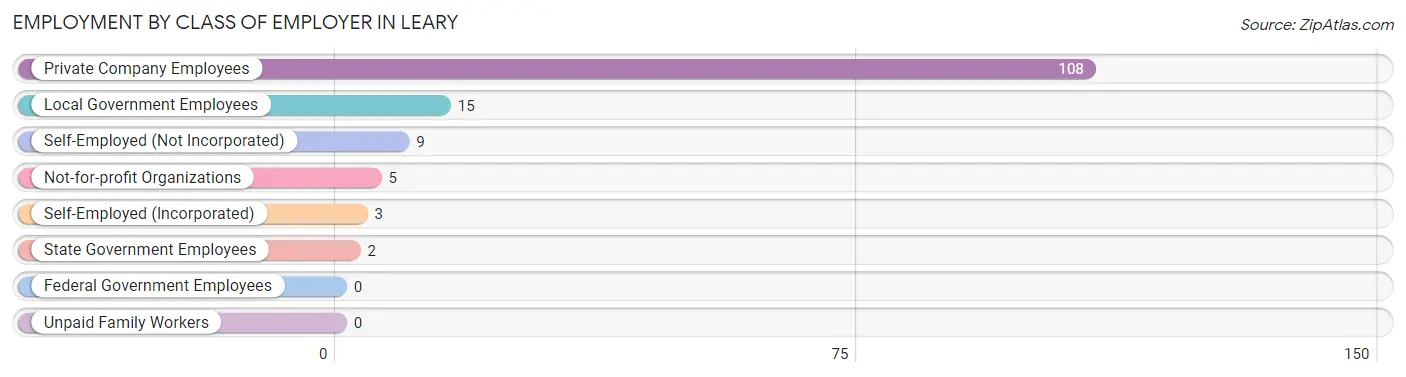
| Employer Class | # Employees | % Employees |
| Private Company Employees | 108 | 76.1% |
| Self-Employed (Incorporated) | 3 | 2.1% |
| Self-Employed (Not Incorporated) | 9 | 6.3% |
| Not-for-profit Organizations | 5 | 3.5% |
| Local Government Employees | 15 | 10.6% |
| State Government Employees | 2 | 1.4% |
| Federal Government Employees | 0 | 0.0% |
| Unpaid Family Workers | 0 | 0.0% |
| Total | 142 | 100.0% |
Employment Status by Age in Leary
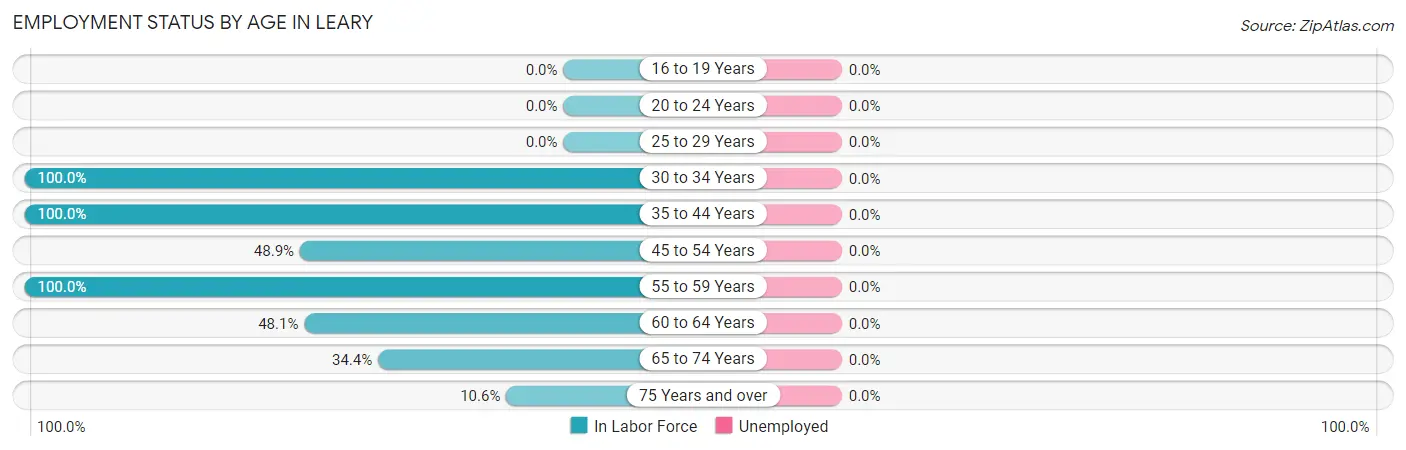
| Age Bracket | In Labor Force | Unemployed |
| 16 to 19 Years | 0 (0.0%) | 0 (0.0%) |
| 20 to 24 Years | 0 (0.0%) | 0 (0.0%) |
| 25 to 29 Years | 0 (0.0%) | 0 (0.0%) |
| 30 to 34 Years | 5 (100.0%) | 0 (0.0%) |
| 35 to 44 Years | 16 (100.0%) | 0 (0.0%) |
| 45 to 54 Years | 22 (48.9%) | 0 (0.0%) |
| 55 to 59 Years | 13 (100.0%) | 0 (0.0%) |
| 60 to 64 Years | 39 (48.1%) | 0 (0.0%) |
| 65 to 74 Years | 42 (34.4%) | 0 (0.0%) |
| 75 Years and over | 5 (10.6%) | 0 (0.0%) |
| Total | 142 (42.3%) | 0 (0.0%) |
Employment Status by Educational Attainment in Leary
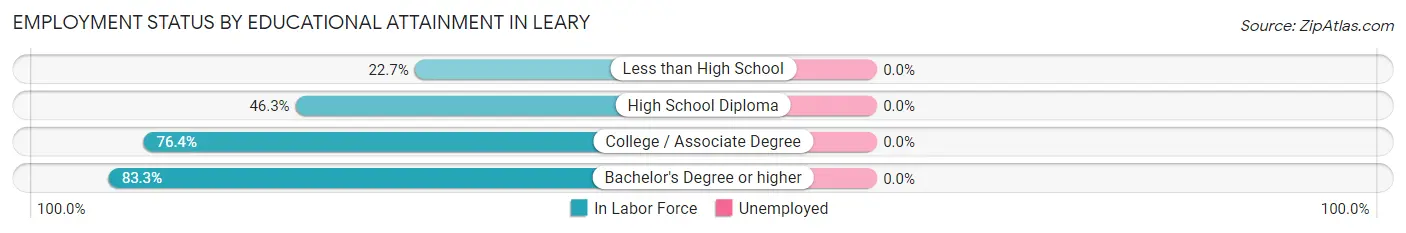
| Educational Attainment | In Labor Force | Unemployed |
| Less than High School | 5 (22.7%) | 0 (0.0%) |
| High School Diploma | 25 (46.3%) | 0 (0.0%) |
| College / Associate Degree | 55 (76.4%) | 0 (0.0%) |
| Bachelor's Degree or higher | 10 (83.3%) | 0 (0.0%) |
| Total | 95 (59.4%) | 0 (0.0%) |
Employment Occupations by Sex in Leary
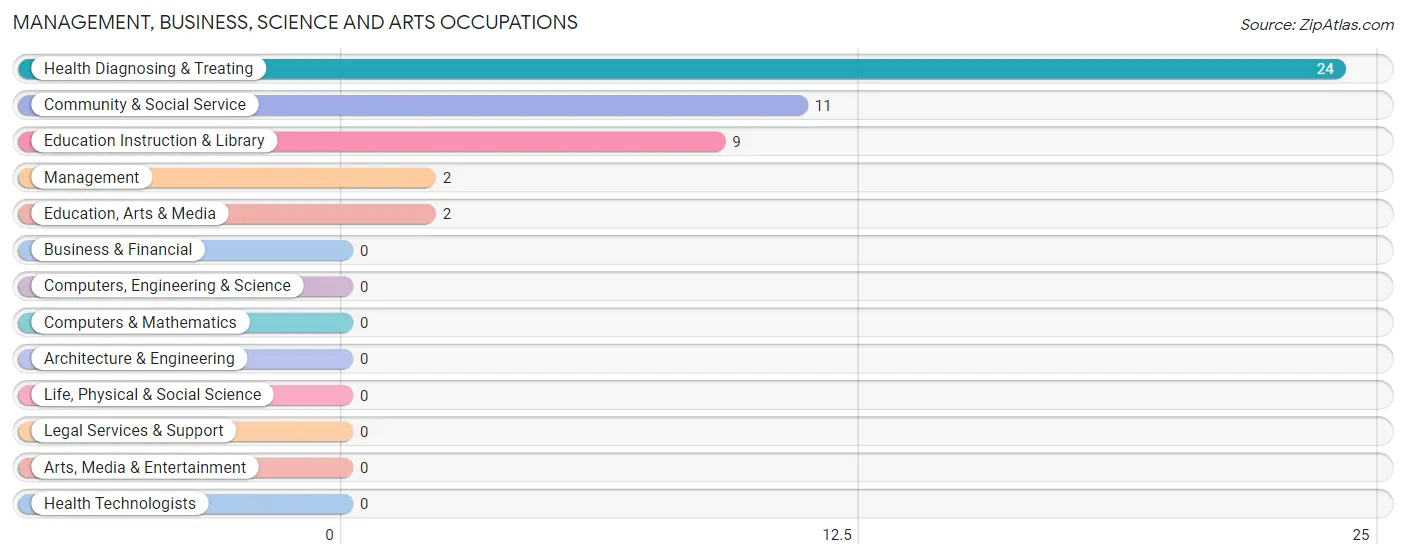
Management, Business, Science and Arts Occupations
The most common Management, Business, Science and Arts occupations in Leary are Health Diagnosing & Treating (24 | 16.9%), Community & Social Service (11 | 7.7%), Education Instruction & Library (9 | 6.3%), Management (2 | 1.4%), and Education, Arts & Media (2 | 1.4%).
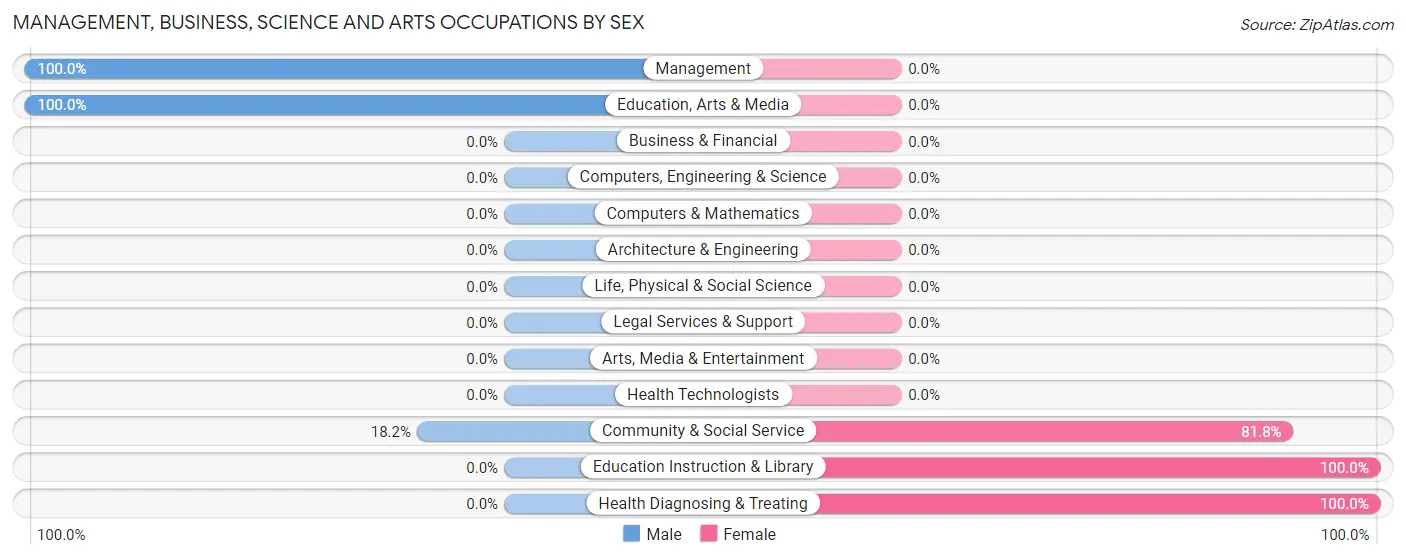
Management, Business, Science and Arts Occupations by Sex
Within the Management, Business, Science and Arts occupations in Leary, the most male-oriented occupations are Management (100.0%), Education, Arts & Media (100.0%), and Community & Social Service (18.2%), while the most female-oriented occupations are Education Instruction & Library (100.0%), Health Diagnosing & Treating (100.0%), and Community & Social Service (81.8%).
| Occupation | Male | Female |
| Management | 2 (100.0%) | 0 (0.0%) |
| Business & Financial | 0 (0.0%) | 0 (0.0%) |
| Computers, Engineering & Science | 0 (0.0%) | 0 (0.0%) |
| Computers & Mathematics | 0 (0.0%) | 0 (0.0%) |
| Architecture & Engineering | 0 (0.0%) | 0 (0.0%) |
| Life, Physical & Social Science | 0 (0.0%) | 0 (0.0%) |
| Community & Social Service | 2 (18.2%) | 9 (81.8%) |
| Education, Arts & Media | 2 (100.0%) | 0 (0.0%) |
| Legal Services & Support | 0 (0.0%) | 0 (0.0%) |
| Education Instruction & Library | 0 (0.0%) | 9 (100.0%) |
| Arts, Media & Entertainment | 0 (0.0%) | 0 (0.0%) |
| Health Diagnosing & Treating | 0 (0.0%) | 24 (100.0%) |
| Health Technologists | 0 (0.0%) | 0 (0.0%) |
| Total (Category) | 4 (10.8%) | 33 (89.2%) |
| Total (Overall) | 64 (45.1%) | 78 (54.9%) |
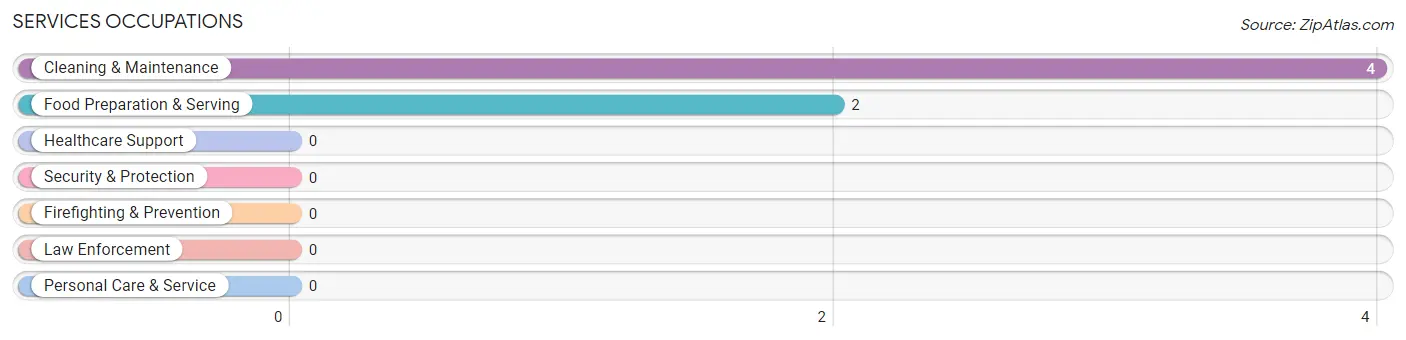
Services Occupations
The most common Services occupations in Leary are Cleaning & Maintenance (4 | 2.8%), and Food Preparation & Serving (2 | 1.4%).
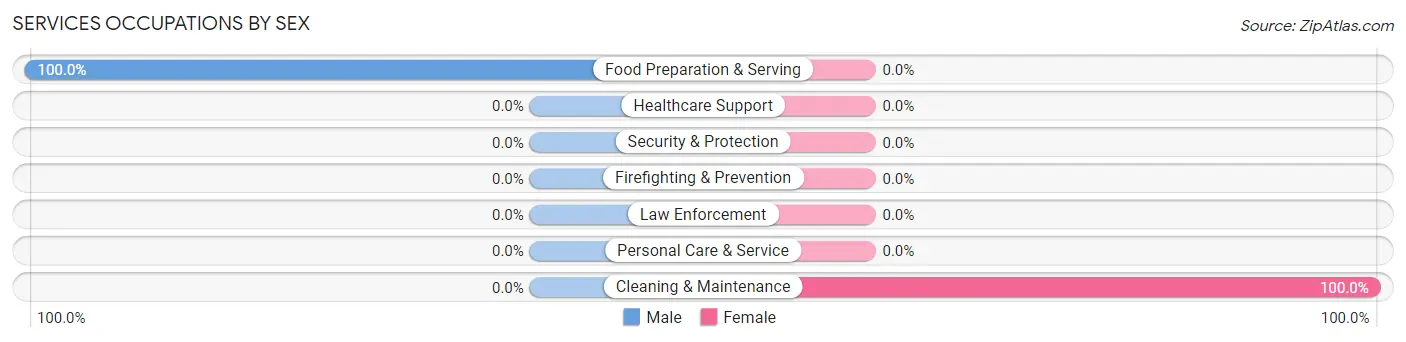
Services Occupations by Sex
| Occupation | Male | Female |
| Healthcare Support | 0 (0.0%) | 0 (0.0%) |
| Security & Protection | 0 (0.0%) | 0 (0.0%) |
| Firefighting & Prevention | 0 (0.0%) | 0 (0.0%) |
| Law Enforcement | 0 (0.0%) | 0 (0.0%) |
| Food Preparation & Serving | 2 (100.0%) | 0 (0.0%) |
| Cleaning & Maintenance | 0 (0.0%) | 4 (100.0%) |
| Personal Care & Service | 0 (0.0%) | 0 (0.0%) |
| Total (Category) | 2 (33.3%) | 4 (66.7%) |
| Total (Overall) | 64 (45.1%) | 78 (54.9%) |
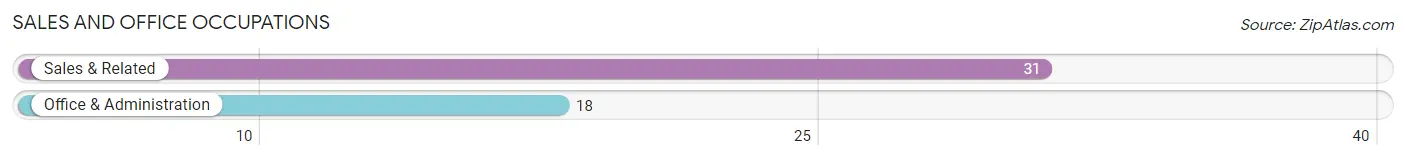
Sales and Office Occupations
The most common Sales and Office occupations in Leary are Sales & Related (31 | 21.8%), and Office & Administration (18 | 12.7%).
Sales and Office Occupations by Sex
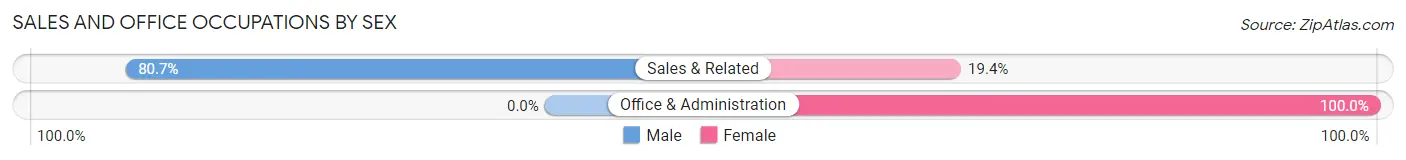
| Occupation | Male | Female |
| Sales & Related | 25 (80.6%) | 6 (19.4%) |
| Office & Administration | 0 (0.0%) | 18 (100.0%) |
| Total (Category) | 25 (51.0%) | 24 (49.0%) |
| Total (Overall) | 64 (45.1%) | 78 (54.9%) |
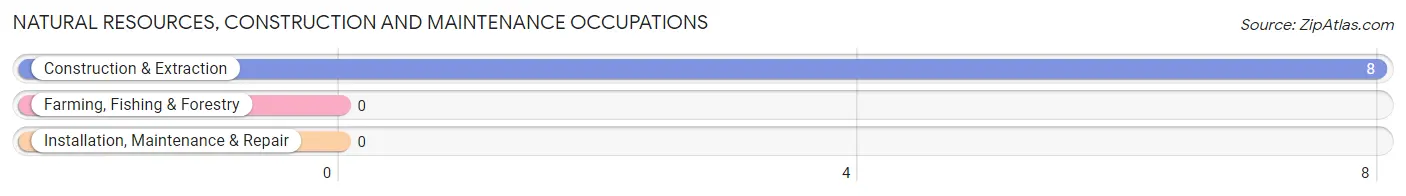
Natural Resources, Construction and Maintenance Occupations
The most common Natural Resources, Construction and Maintenance occupations in Leary are , and Construction & Extraction (8 | 5.6%).
Natural Resources, Construction and Maintenance Occupations by Sex
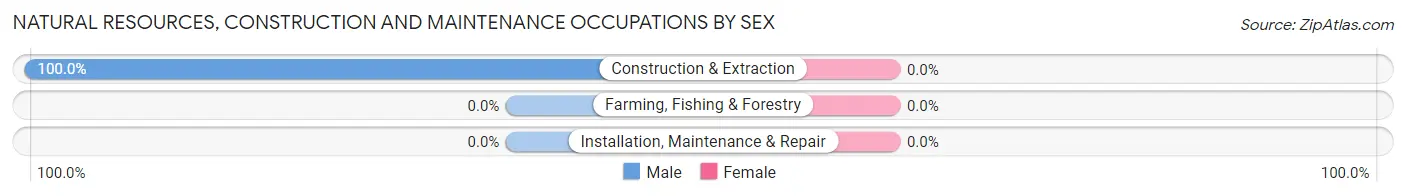
| Occupation | Male | Female |
| Farming, Fishing & Forestry | 0 (0.0%) | 0 (0.0%) |
| Construction & Extraction | 8 (100.0%) | 0 (0.0%) |
| Installation, Maintenance & Repair | 0 (0.0%) | 0 (0.0%) |
| Total (Category) | 8 (100.0%) | 0 (0.0%) |
| Total (Overall) | 64 (45.1%) | 78 (54.9%) |
Production, Transportation and Moving Occupations
The most common Production, Transportation and Moving occupations in Leary are Transportation (23 | 16.2%), and Production (19 | 13.4%).
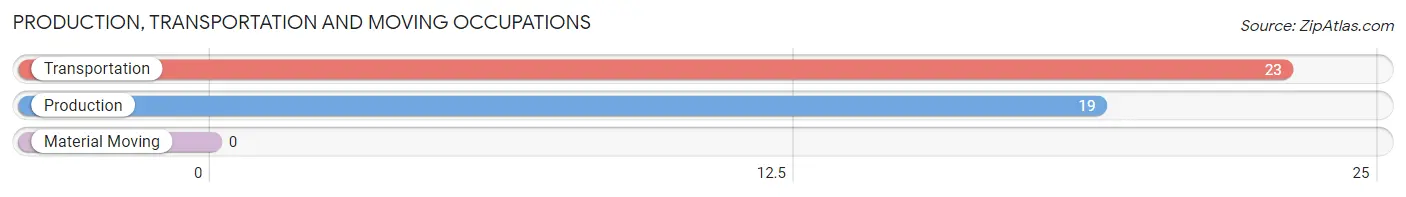
Production, Transportation and Moving Occupations by Sex
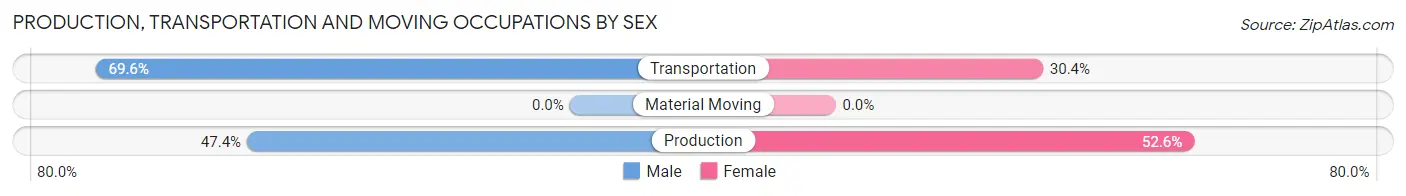
| Occupation | Male | Female |
| Production | 9 (47.4%) | 10 (52.6%) |
| Transportation | 16 (69.6%) | 7 (30.4%) |
| Material Moving | 0 (0.0%) | 0 (0.0%) |
| Total (Category) | 25 (59.5%) | 17 (40.5%) |
| Total (Overall) | 64 (45.1%) | 78 (54.9%) |
Employment Industries by Sex in Leary
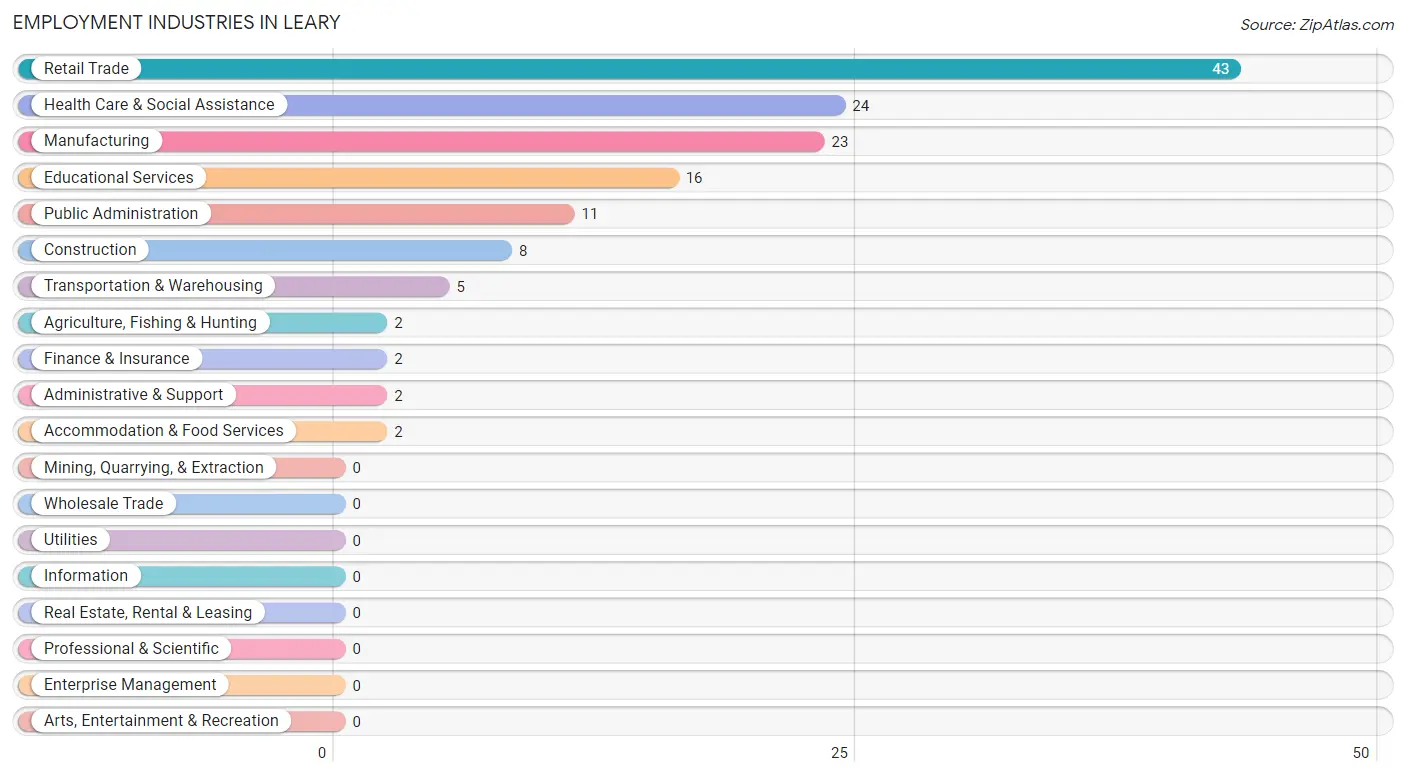
Employment Industries in Leary
The major employment industries in Leary include Retail Trade (43 | 30.3%), Health Care & Social Assistance (24 | 16.9%), Manufacturing (23 | 16.2%), Educational Services (16 | 11.3%), and Public Administration (11 | 7.7%).
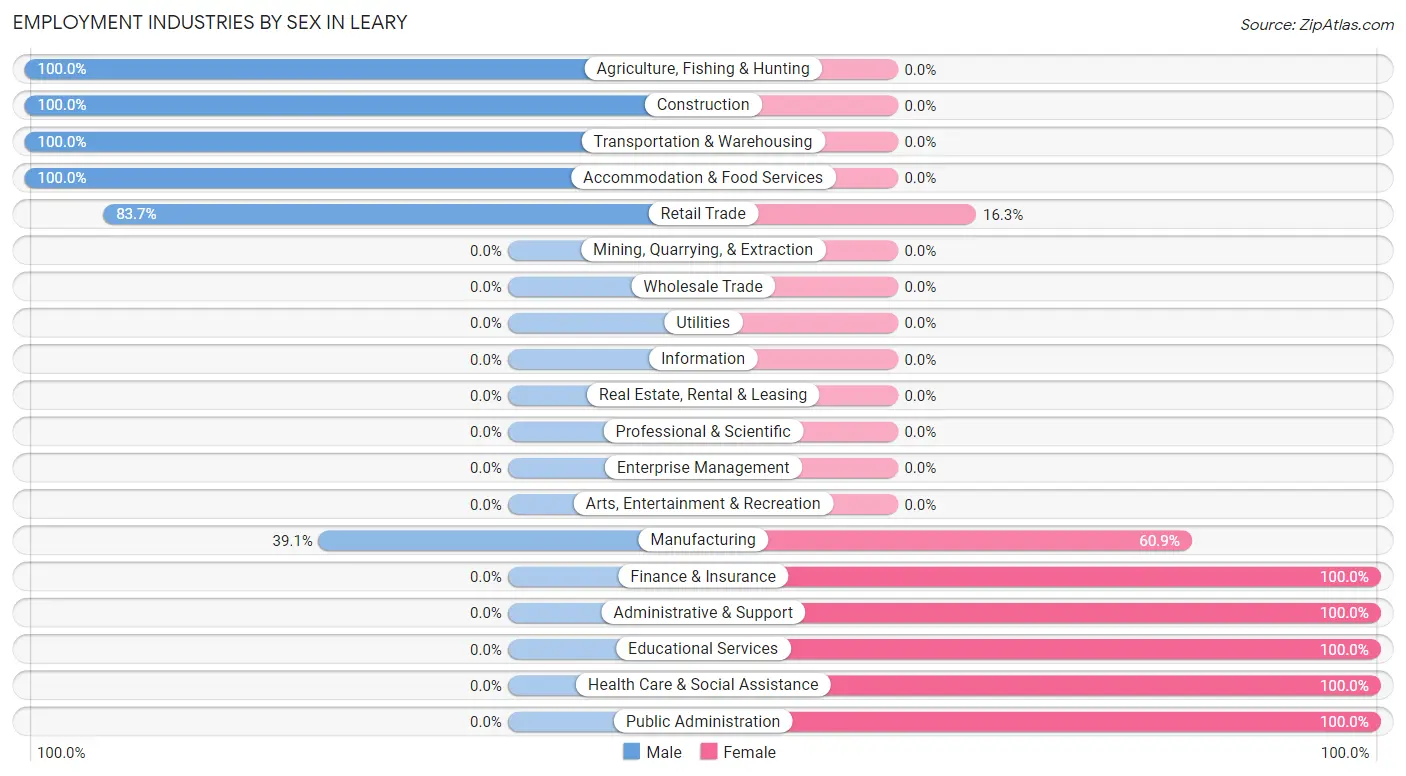
Employment Industries by Sex in Leary
The Leary industries that see more men than women are Agriculture, Fishing & Hunting (100.0%), Construction (100.0%), and Transportation & Warehousing (100.0%), whereas the industries that tend to have a higher number of women are Finance & Insurance (100.0%), Administrative & Support (100.0%), and Educational Services (100.0%).
| Industry | Male | Female |
| Agriculture, Fishing & Hunting | 2 (100.0%) | 0 (0.0%) |
| Mining, Quarrying, & Extraction | 0 (0.0%) | 0 (0.0%) |
| Construction | 8 (100.0%) | 0 (0.0%) |
| Manufacturing | 9 (39.1%) | 14 (60.9%) |
| Wholesale Trade | 0 (0.0%) | 0 (0.0%) |
| Retail Trade | 36 (83.7%) | 7 (16.3%) |
| Transportation & Warehousing | 5 (100.0%) | 0 (0.0%) |
| Utilities | 0 (0.0%) | 0 (0.0%) |
| Information | 0 (0.0%) | 0 (0.0%) |
| Finance & Insurance | 0 (0.0%) | 2 (100.0%) |
| Real Estate, Rental & Leasing | 0 (0.0%) | 0 (0.0%) |
| Professional & Scientific | 0 (0.0%) | 0 (0.0%) |
| Enterprise Management | 0 (0.0%) | 0 (0.0%) |
| Administrative & Support | 0 (0.0%) | 2 (100.0%) |
| Educational Services | 0 (0.0%) | 16 (100.0%) |
| Health Care & Social Assistance | 0 (0.0%) | 24 (100.0%) |
| Arts, Entertainment & Recreation | 0 (0.0%) | 0 (0.0%) |
| Accommodation & Food Services | 2 (100.0%) | 0 (0.0%) |
| Public Administration | 0 (0.0%) | 11 (100.0%) |
| Total | 64 (45.1%) | 78 (54.9%) |
Education in Leary
School Enrollment in Leary
The most common levels of schooling among the 44 students in Leary are middle school (19 | 43.2%), elementary school (9 | 20.4%), and kindergarten (6 | 13.6%).
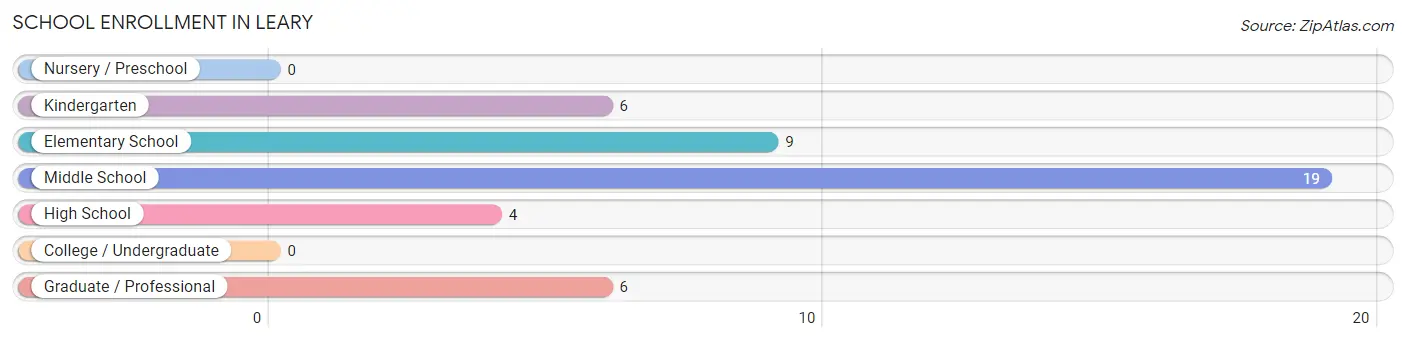
| School Level | # Students | % Students |
| Nursery / Preschool | 0 | 0.0% |
| Kindergarten | 6 | 13.6% |
| Elementary School | 9 | 20.4% |
| Middle School | 19 | 43.2% |
| High School | 4 | 9.1% |
| College / Undergraduate | 0 | 0.0% |
| Graduate / Professional | 6 | 13.6% |
| Total | 44 | 100.0% |
School Enrollment by Age by Funding Source in Leary
Out of a total of 44 students who are enrolled in schools in Leary, 12 (27.3%) attend a private institution, while the remaining 32 (72.7%) are enrolled in public schools. The age group of 15 to 17 year olds has the highest likelihood of being enrolled in private schools, with 1 (100.0% in the age bracket) enrolled. Conversely, the age group of 5 to 9 year old has the lowest likelihood of being enrolled in a private school, with 15 (100.0% in the age bracket) attending a public institution.
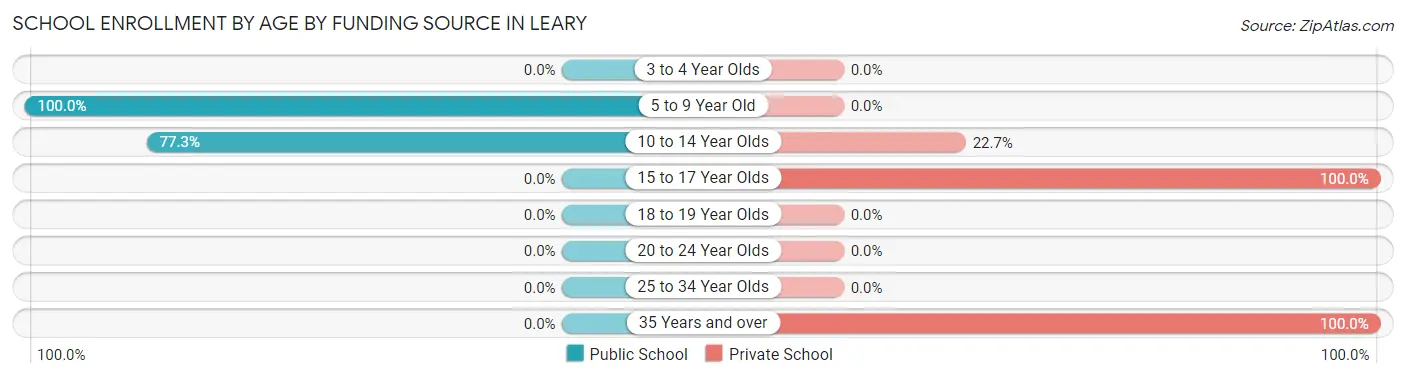
| Age Bracket | Public School | Private School |
| 3 to 4 Year Olds | 0 (0.0%) | 0 (0.0%) |
| 5 to 9 Year Old | 15 (100.0%) | 0 (0.0%) |
| 10 to 14 Year Olds | 17 (77.3%) | 5 (22.7%) |
| 15 to 17 Year Olds | 0 (0.0%) | 1 (100.0%) |
| 18 to 19 Year Olds | 0 (0.0%) | 0 (0.0%) |
| 20 to 24 Year Olds | 0 (0.0%) | 0 (0.0%) |
| 25 to 34 Year Olds | 0 (0.0%) | 0 (0.0%) |
| 35 Years and over | 0 (0.0%) | 6 (100.0%) |
| Total | 32 (72.7%) | 12 (27.3%) |
Educational Attainment by Field of Study in Leary
Science & technology (12 | 38.7%), literature & languages (6 | 19.4%), computers & mathematics (3 | 9.7%), bio, nature & agricultural (2 | 6.5%), and psychology (2 | 6.5%) are the most common fields of study among 31 individuals in Leary who have obtained a bachelor's degree or higher.
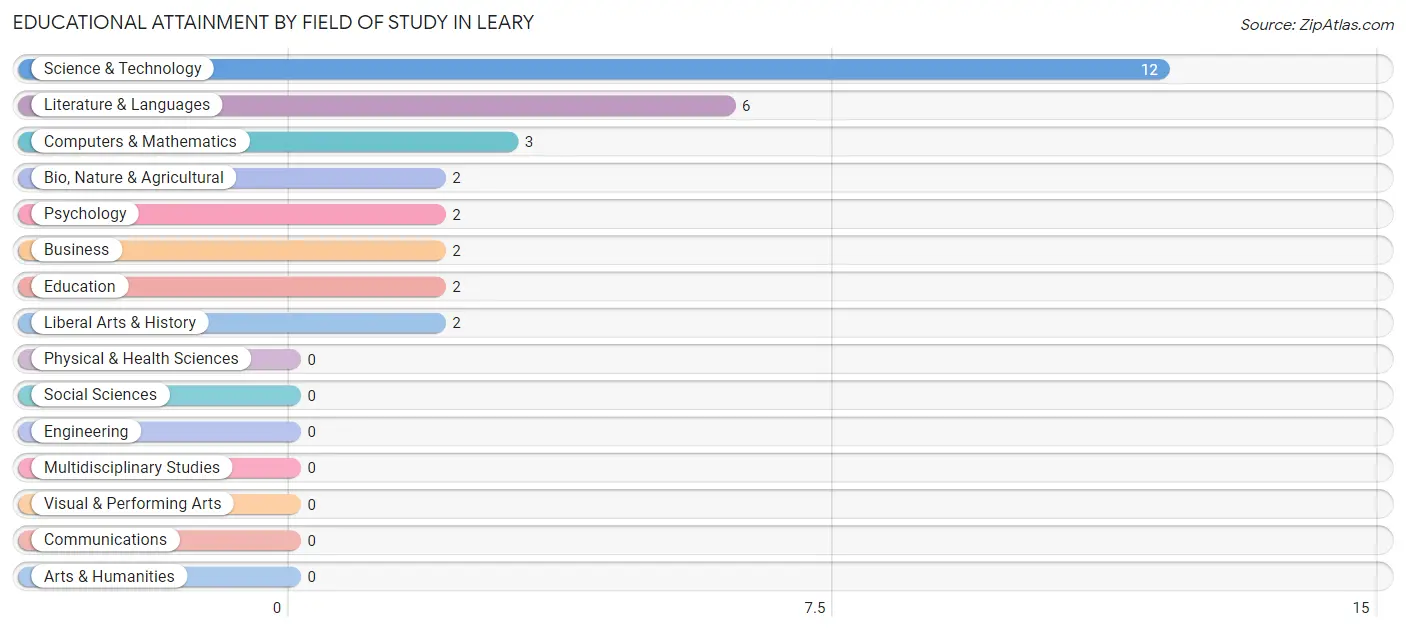
| Field of Study | # Graduates | % Graduates |
| Computers & Mathematics | 3 | 9.7% |
| Bio, Nature & Agricultural | 2 | 6.5% |
| Physical & Health Sciences | 0 | 0.0% |
| Psychology | 2 | 6.5% |
| Social Sciences | 0 | 0.0% |
| Engineering | 0 | 0.0% |
| Multidisciplinary Studies | 0 | 0.0% |
| Science & Technology | 12 | 38.7% |
| Business | 2 | 6.5% |
| Education | 2 | 6.5% |
| Literature & Languages | 6 | 19.4% |
| Liberal Arts & History | 2 | 6.5% |
| Visual & Performing Arts | 0 | 0.0% |
| Communications | 0 | 0.0% |
| Arts & Humanities | 0 | 0.0% |
| Total | 31 | 100.0% |
Transportation & Commute in Leary
Vehicle Availability by Sex in Leary
The most prevalent vehicle ownership categories in Leary are males with 4 vehicles (22, accounting for 34.4%) and females with 4 vehicles (16, making up 28.2%).
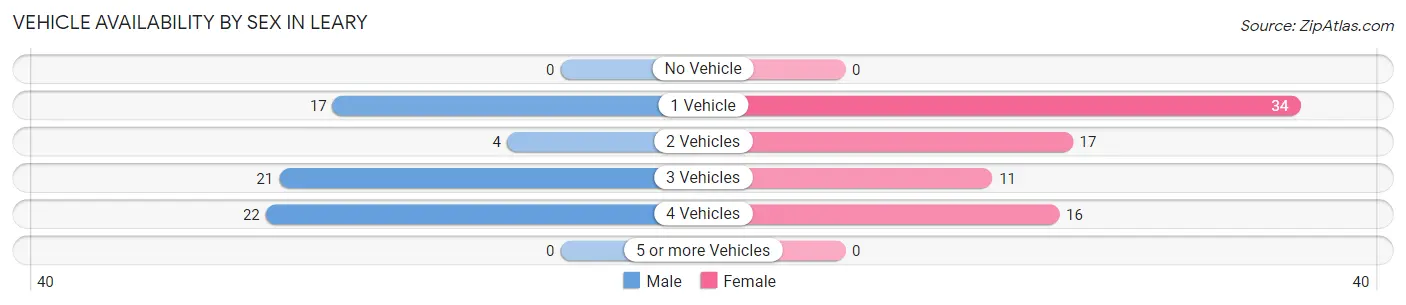
| Vehicles Available | Male | Female |
| No Vehicle | 0 (0.0%) | 0 (0.0%) |
| 1 Vehicle | 17 (26.6%) | 34 (43.6%) |
| 2 Vehicles | 4 (6.2%) | 17 (21.8%) |
| 3 Vehicles | 21 (32.8%) | 11 (14.1%) |
| 4 Vehicles | 22 (34.4%) | 16 (20.5%) |
| 5 or more Vehicles | 0 (0.0%) | 0 (0.0%) |
| Total | 64 (100.0%) | 78 (100.0%) |
Commute Time in Leary
The most frequently occuring commute durations in Leary are 35 to 39 minutes (29 commuters, 21.8%), less than 5 minutes (27 commuters, 20.3%), and 5 to 9 minutes (26 commuters, 19.6%).
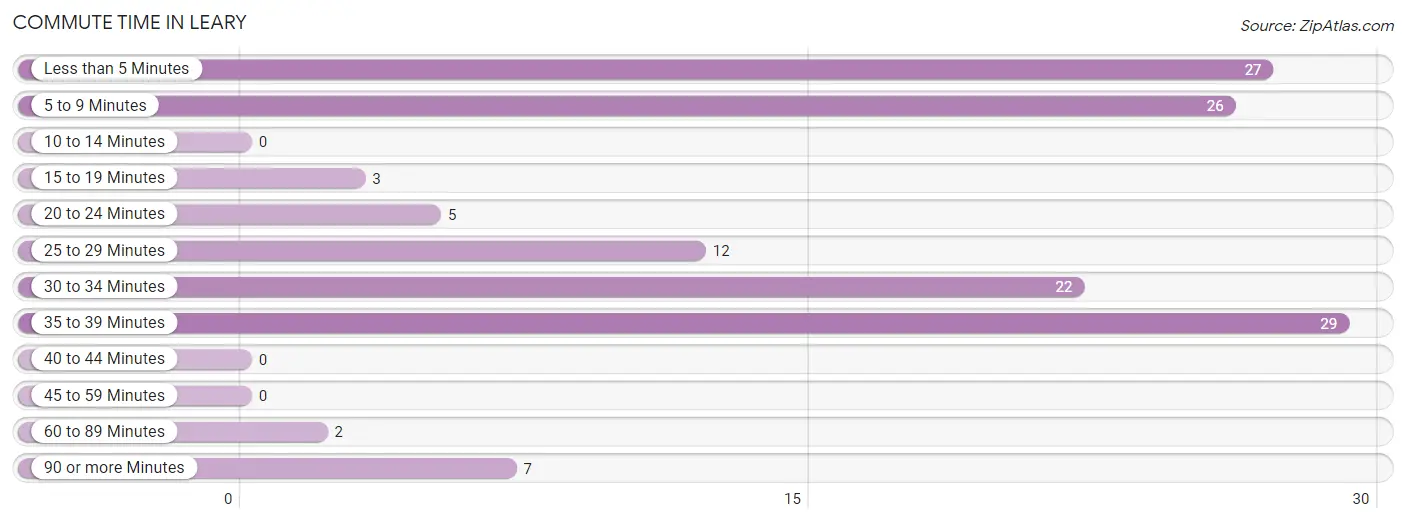
| Commute Time | # Commuters | % Commuters |
| Less than 5 Minutes | 27 | 20.3% |
| 5 to 9 Minutes | 26 | 19.6% |
| 10 to 14 Minutes | 0 | 0.0% |
| 15 to 19 Minutes | 3 | 2.3% |
| 20 to 24 Minutes | 5 | 3.8% |
| 25 to 29 Minutes | 12 | 9.0% |
| 30 to 34 Minutes | 22 | 16.5% |
| 35 to 39 Minutes | 29 | 21.8% |
| 40 to 44 Minutes | 0 | 0.0% |
| 45 to 59 Minutes | 0 | 0.0% |
| 60 to 89 Minutes | 2 | 1.5% |
| 90 or more Minutes | 7 | 5.3% |
Commute Time by Sex in Leary
The most common commute times in Leary are 5 to 9 minutes (24 commuters, 40.7%) for males and 35 to 39 minutes (24 commuters, 32.4%) for females.
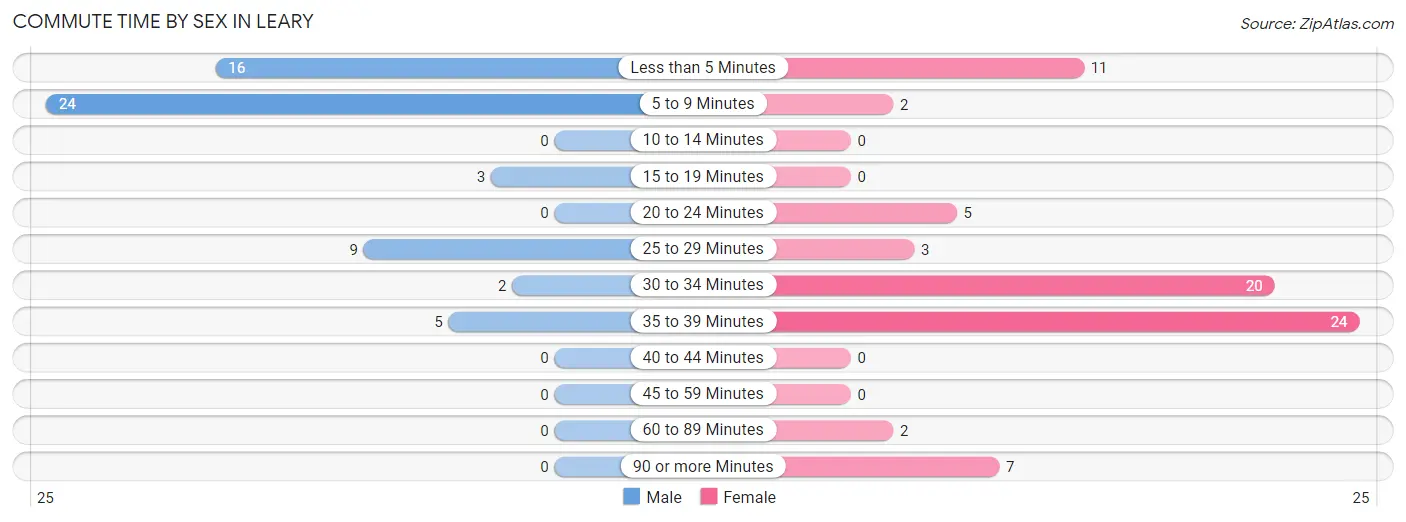
| Commute Time | Male | Female |
| Less than 5 Minutes | 16 (27.1%) | 11 (14.9%) |
| 5 to 9 Minutes | 24 (40.7%) | 2 (2.7%) |
| 10 to 14 Minutes | 0 (0.0%) | 0 (0.0%) |
| 15 to 19 Minutes | 3 (5.1%) | 0 (0.0%) |
| 20 to 24 Minutes | 0 (0.0%) | 5 (6.8%) |
| 25 to 29 Minutes | 9 (15.2%) | 3 (4.1%) |
| 30 to 34 Minutes | 2 (3.4%) | 20 (27.0%) |
| 35 to 39 Minutes | 5 (8.5%) | 24 (32.4%) |
| 40 to 44 Minutes | 0 (0.0%) | 0 (0.0%) |
| 45 to 59 Minutes | 0 (0.0%) | 0 (0.0%) |
| 60 to 89 Minutes | 0 (0.0%) | 2 (2.7%) |
| 90 or more Minutes | 0 (0.0%) | 7 (9.5%) |
Time of Departure to Work by Sex in Leary
The most frequent times of departure to work in Leary are 7:30 AM to 7:59 AM (20, 33.9%) for males and 6:00 AM to 6:29 AM (17, 23.0%) for females.
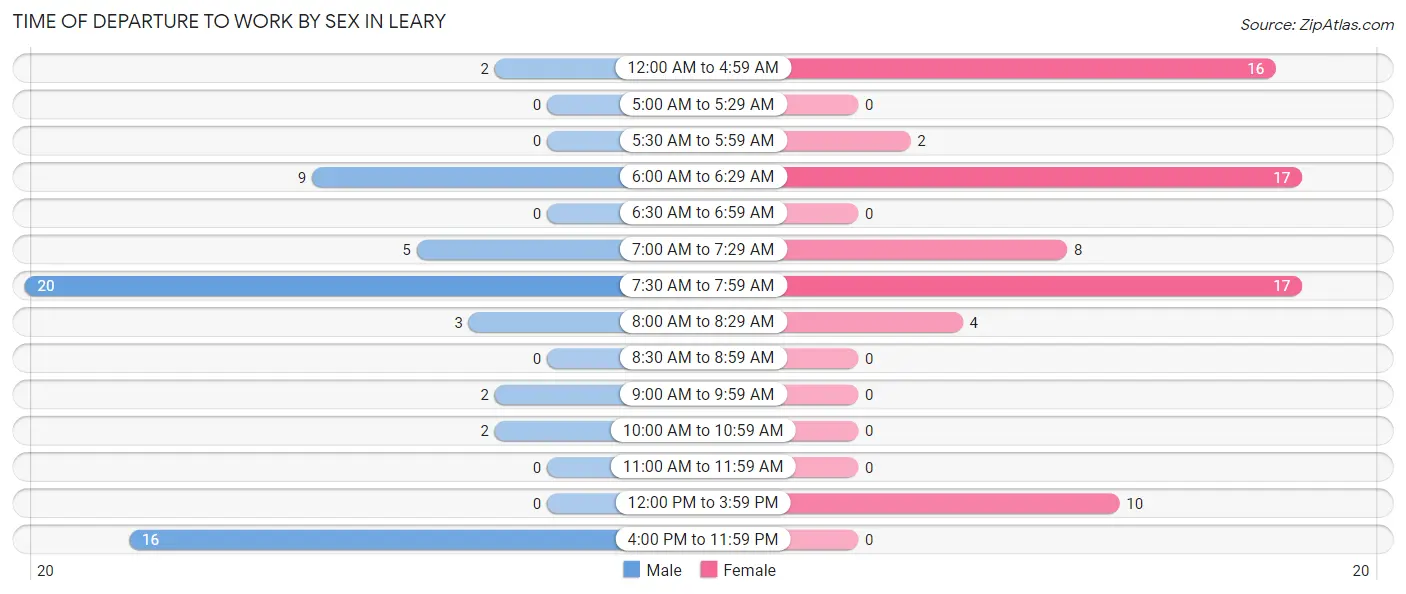
| Time of Departure | Male | Female |
| 12:00 AM to 4:59 AM | 2 (3.4%) | 16 (21.6%) |
| 5:00 AM to 5:29 AM | 0 (0.0%) | 0 (0.0%) |
| 5:30 AM to 5:59 AM | 0 (0.0%) | 2 (2.7%) |
| 6:00 AM to 6:29 AM | 9 (15.2%) | 17 (23.0%) |
| 6:30 AM to 6:59 AM | 0 (0.0%) | 0 (0.0%) |
| 7:00 AM to 7:29 AM | 5 (8.5%) | 8 (10.8%) |
| 7:30 AM to 7:59 AM | 20 (33.9%) | 17 (23.0%) |
| 8:00 AM to 8:29 AM | 3 (5.1%) | 4 (5.4%) |
| 8:30 AM to 8:59 AM | 0 (0.0%) | 0 (0.0%) |
| 9:00 AM to 9:59 AM | 2 (3.4%) | 0 (0.0%) |
| 10:00 AM to 10:59 AM | 2 (3.4%) | 0 (0.0%) |
| 11:00 AM to 11:59 AM | 0 (0.0%) | 0 (0.0%) |
| 12:00 PM to 3:59 PM | 0 (0.0%) | 10 (13.5%) |
| 4:00 PM to 11:59 PM | 16 (27.1%) | 0 (0.0%) |
| Total | 59 (100.0%) | 74 (100.0%) |
Housing Occupancy in Leary
Occupancy by Ownership in Leary
Of the total 198 dwellings in Leary, owner-occupied units account for 146 (73.7%), while renter-occupied units make up 52 (26.3%).
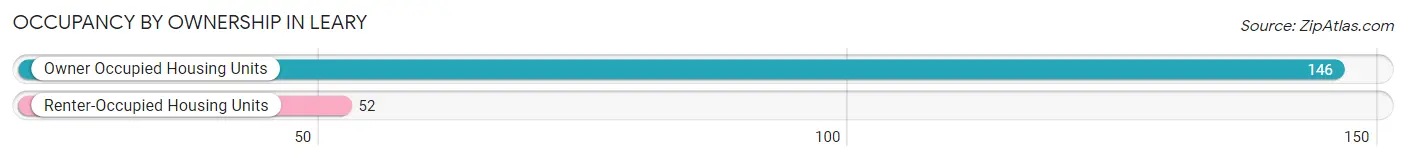
| Occupancy | # Housing Units | % Housing Units |
| Owner Occupied Housing Units | 146 | 73.7% |
| Renter-Occupied Housing Units | 52 | 26.3% |
| Total Occupied Housing Units | 198 | 100.0% |
Occupancy by Household Size in Leary
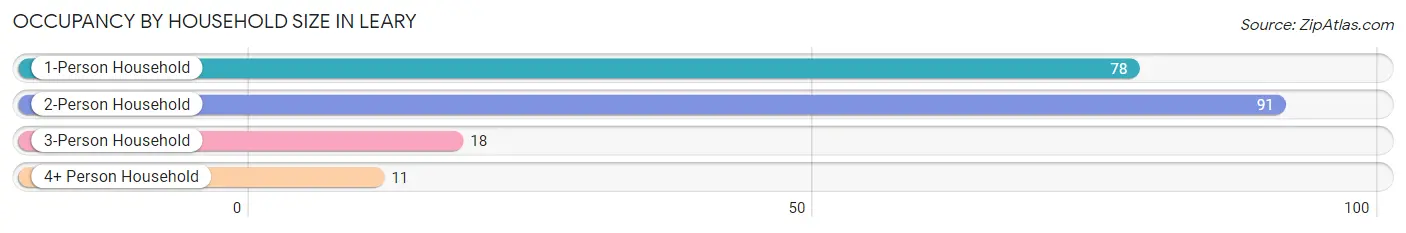
| Household Size | # Housing Units | % Housing Units |
| 1-Person Household | 78 | 39.4% |
| 2-Person Household | 91 | 46.0% |
| 3-Person Household | 18 | 9.1% |
| 4+ Person Household | 11 | 5.6% |
| Total Housing Units | 198 | 100.0% |
Occupancy by Ownership by Household Size in Leary
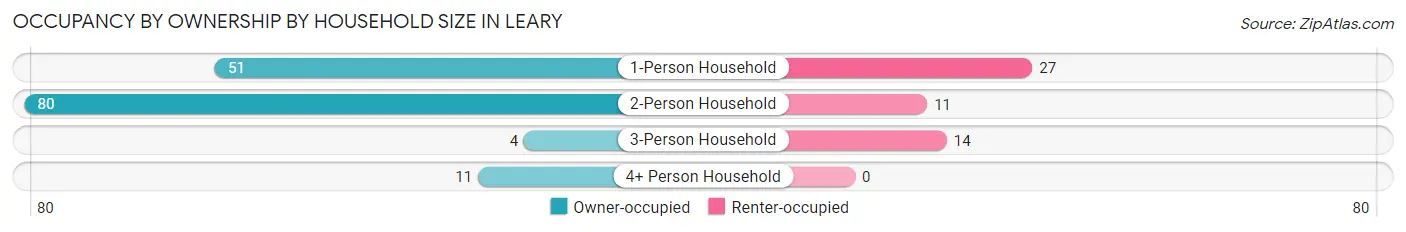
| Household Size | Owner-occupied | Renter-occupied |
| 1-Person Household | 51 (65.4%) | 27 (34.6%) |
| 2-Person Household | 80 (87.9%) | 11 (12.1%) |
| 3-Person Household | 4 (22.2%) | 14 (77.8%) |
| 4+ Person Household | 11 (100.0%) | 0 (0.0%) |
| Total Housing Units | 146 (73.7%) | 52 (26.3%) |
Occupancy by Educational Attainment in Leary
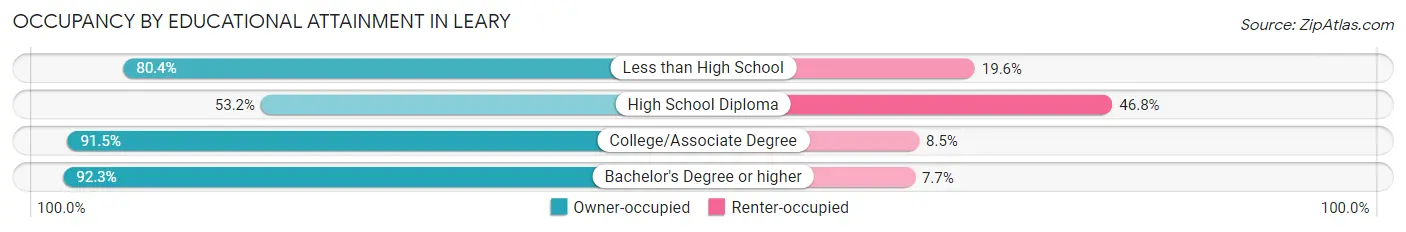
| Household Size | Owner-occupied | Renter-occupied |
| Less than High School | 37 (80.4%) | 9 (19.6%) |
| High School Diploma | 42 (53.2%) | 37 (46.8%) |
| College/Associate Degree | 43 (91.5%) | 4 (8.5%) |
| Bachelor's Degree or higher | 24 (92.3%) | 2 (7.7%) |
Occupancy by Age of Householder in Leary
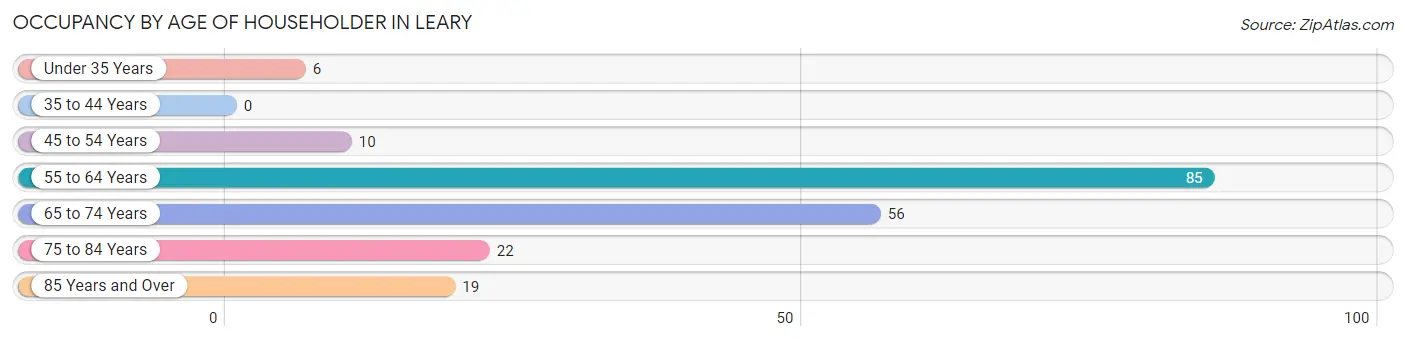
| Age Bracket | # Households | % Households |
| Under 35 Years | 6 | 3.0% |
| 35 to 44 Years | 0 | 0.0% |
| 45 to 54 Years | 10 | 5.1% |
| 55 to 64 Years | 85 | 42.9% |
| 65 to 74 Years | 56 | 28.3% |
| 75 to 84 Years | 22 | 11.1% |
| 85 Years and Over | 19 | 9.6% |
| Total | 198 | 100.0% |
Housing Finances in Leary
Median Income by Occupancy in Leary
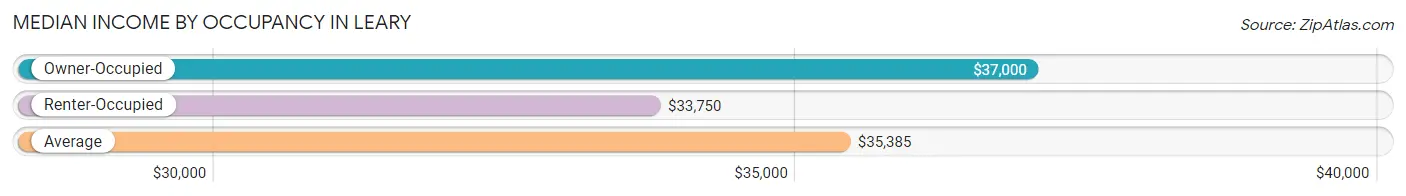
| Occupancy Type | # Households | Median Income |
| Owner-Occupied | 146 (73.7%) | $37,000 |
| Renter-Occupied | 52 (26.3%) | $33,750 |
| Average | 198 (100.0%) | $35,385 |
Occupancy by Householder Income Bracket in Leary
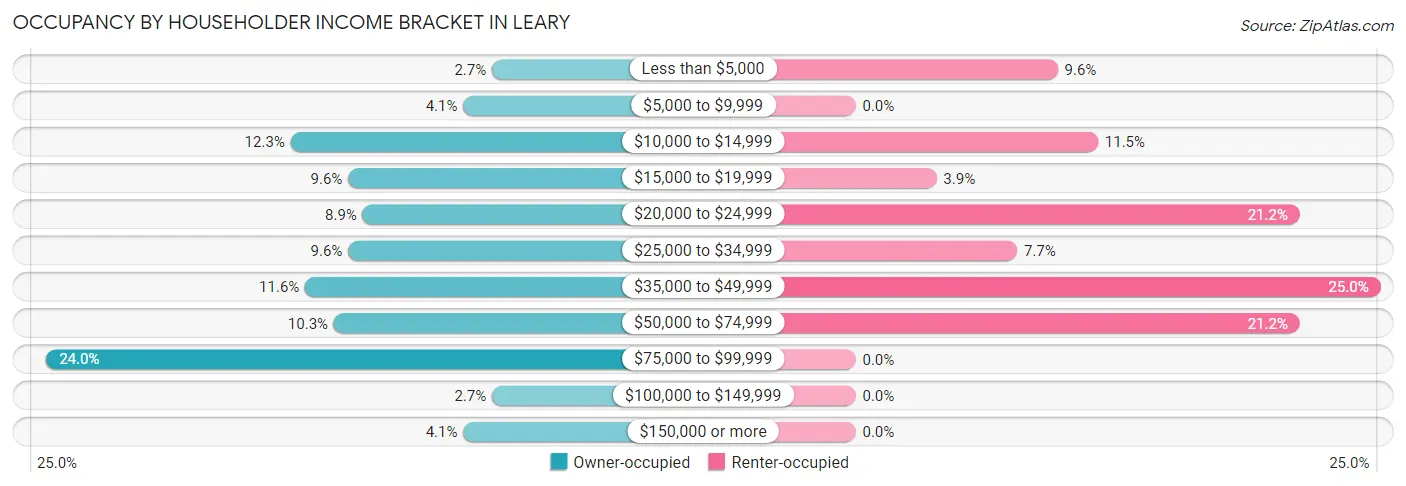
| Income Bracket | Owner-occupied | Renter-occupied |
| Less than $5,000 | 4 (2.7%) | 5 (9.6%) |
| $5,000 to $9,999 | 6 (4.1%) | 0 (0.0%) |
| $10,000 to $14,999 | 18 (12.3%) | 6 (11.5%) |
| $15,000 to $19,999 | 14 (9.6%) | 2 (3.8%) |
| $20,000 to $24,999 | 13 (8.9%) | 11 (21.1%) |
| $25,000 to $34,999 | 14 (9.6%) | 4 (7.7%) |
| $35,000 to $49,999 | 17 (11.6%) | 13 (25.0%) |
| $50,000 to $74,999 | 15 (10.3%) | 11 (21.1%) |
| $75,000 to $99,999 | 35 (24.0%) | 0 (0.0%) |
| $100,000 to $149,999 | 4 (2.7%) | 0 (0.0%) |
| $150,000 or more | 6 (4.1%) | 0 (0.0%) |
| Total | 146 (100.0%) | 52 (100.0%) |
Monthly Housing Cost Tiers in Leary
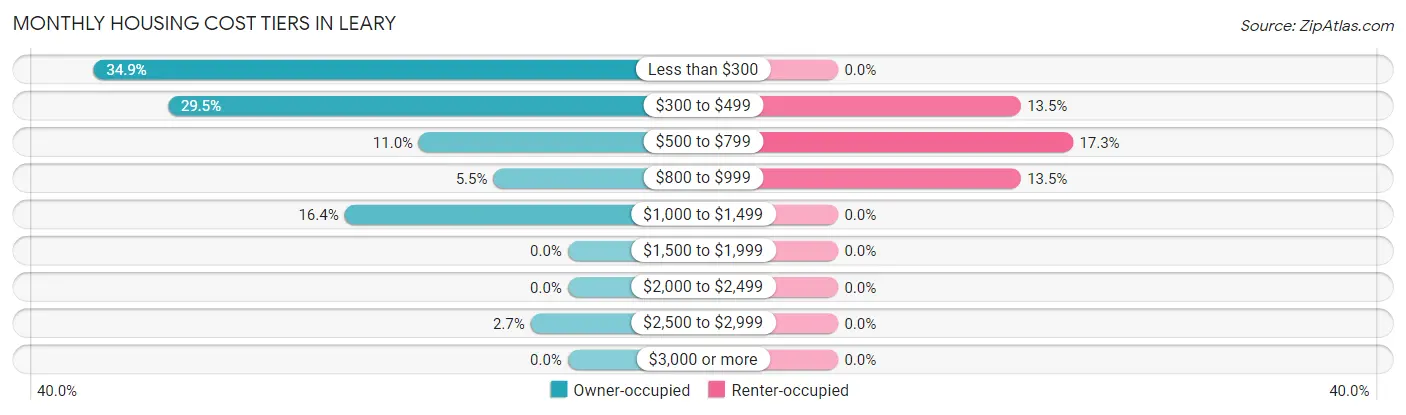
| Monthly Cost | Owner-occupied | Renter-occupied |
| Less than $300 | 51 (34.9%) | 0 (0.0%) |
| $300 to $499 | 43 (29.4%) | 7 (13.5%) |
| $500 to $799 | 16 (11.0%) | 9 (17.3%) |
| $800 to $999 | 8 (5.5%) | 7 (13.5%) |
| $1,000 to $1,499 | 24 (16.4%) | 0 (0.0%) |
| $1,500 to $1,999 | 0 (0.0%) | 0 (0.0%) |
| $2,000 to $2,499 | 0 (0.0%) | 0 (0.0%) |
| $2,500 to $2,999 | 4 (2.7%) | 0 (0.0%) |
| $3,000 or more | 0 (0.0%) | 0 (0.0%) |
| Total | 146 (100.0%) | 52 (100.0%) |
Physical Housing Characteristics in Leary
Housing Structures in Leary
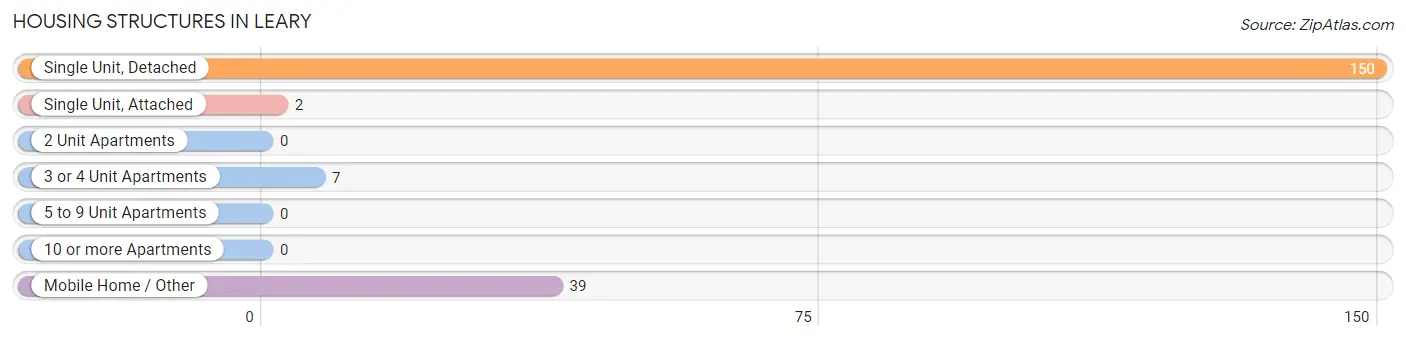
| Structure Type | # Housing Units | % Housing Units |
| Single Unit, Detached | 150 | 75.8% |
| Single Unit, Attached | 2 | 1.0% |
| 2 Unit Apartments | 0 | 0.0% |
| 3 or 4 Unit Apartments | 7 | 3.5% |
| 5 to 9 Unit Apartments | 0 | 0.0% |
| 10 or more Apartments | 0 | 0.0% |
| Mobile Home / Other | 39 | 19.7% |
| Total | 198 | 100.0% |
Housing Structures by Occupancy in Leary
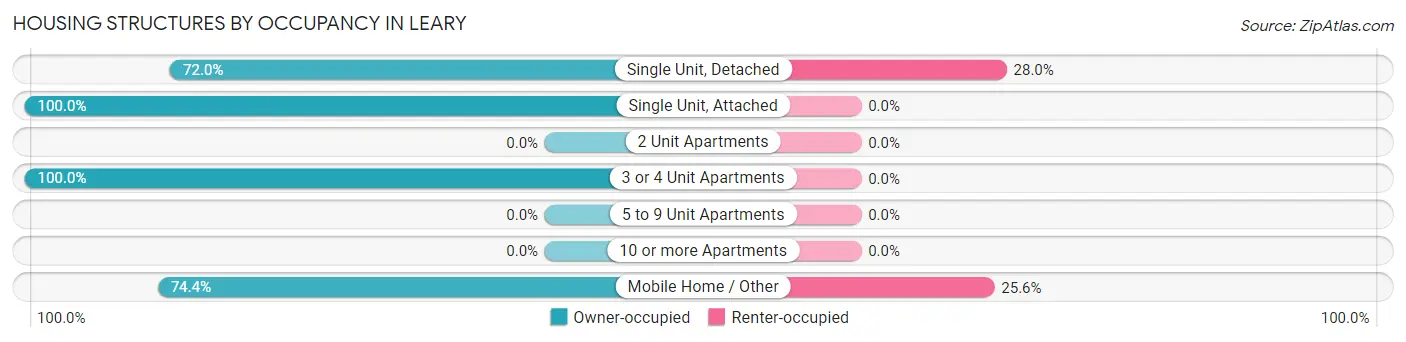
| Structure Type | Owner-occupied | Renter-occupied |
| Single Unit, Detached | 108 (72.0%) | 42 (28.0%) |
| Single Unit, Attached | 2 (100.0%) | 0 (0.0%) |
| 2 Unit Apartments | 0 (0.0%) | 0 (0.0%) |
| 3 or 4 Unit Apartments | 7 (100.0%) | 0 (0.0%) |
| 5 to 9 Unit Apartments | 0 (0.0%) | 0 (0.0%) |
| 10 or more Apartments | 0 (0.0%) | 0 (0.0%) |
| Mobile Home / Other | 29 (74.4%) | 10 (25.6%) |
| Total | 146 (73.7%) | 52 (26.3%) |
Housing Structures by Number of Rooms in Leary
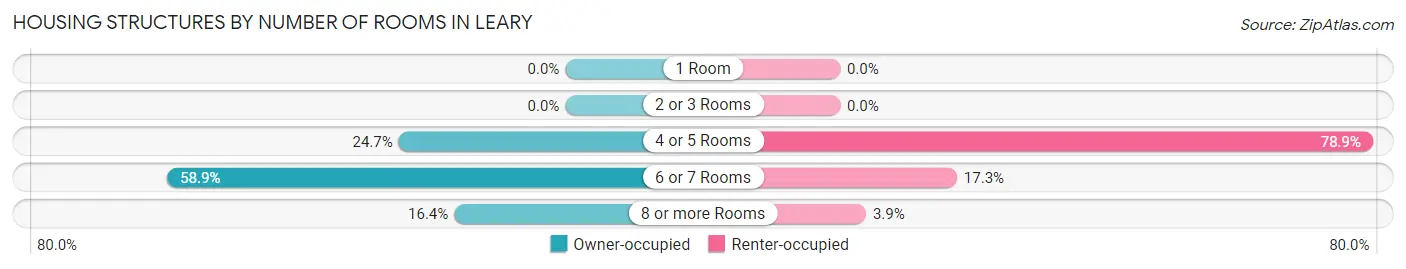
| Number of Rooms | Owner-occupied | Renter-occupied |
| 1 Room | 0 (0.0%) | 0 (0.0%) |
| 2 or 3 Rooms | 0 (0.0%) | 0 (0.0%) |
| 4 or 5 Rooms | 36 (24.7%) | 41 (78.8%) |
| 6 or 7 Rooms | 86 (58.9%) | 9 (17.3%) |
| 8 or more Rooms | 24 (16.4%) | 2 (3.8%) |
| Total | 146 (100.0%) | 52 (100.0%) |
Housing Structure by Heating Type in Leary
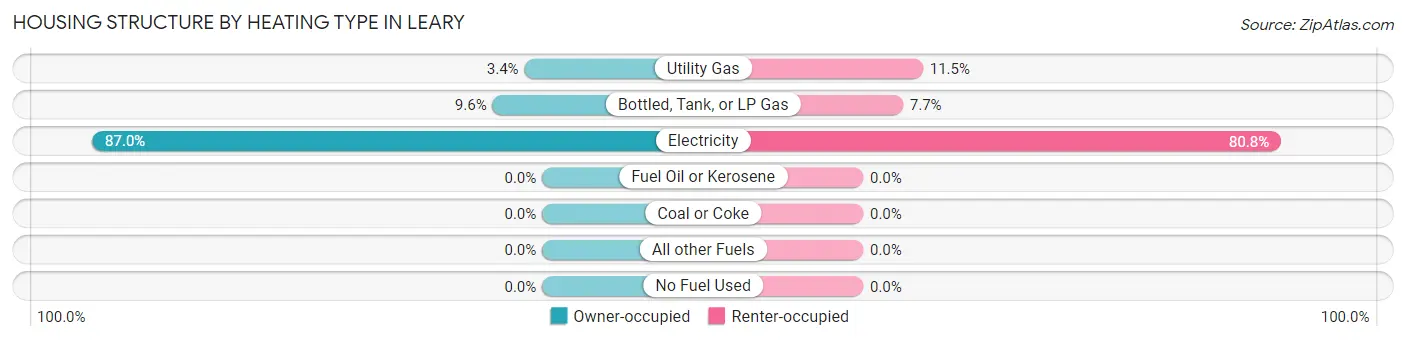
| Heating Type | Owner-occupied | Renter-occupied |
| Utility Gas | 5 (3.4%) | 6 (11.5%) |
| Bottled, Tank, or LP Gas | 14 (9.6%) | 4 (7.7%) |
| Electricity | 127 (87.0%) | 42 (80.8%) |
| Fuel Oil or Kerosene | 0 (0.0%) | 0 (0.0%) |
| Coal or Coke | 0 (0.0%) | 0 (0.0%) |
| All other Fuels | 0 (0.0%) | 0 (0.0%) |
| No Fuel Used | 0 (0.0%) | 0 (0.0%) |
| Total | 146 (100.0%) | 52 (100.0%) |
Household Vehicle Usage in Leary
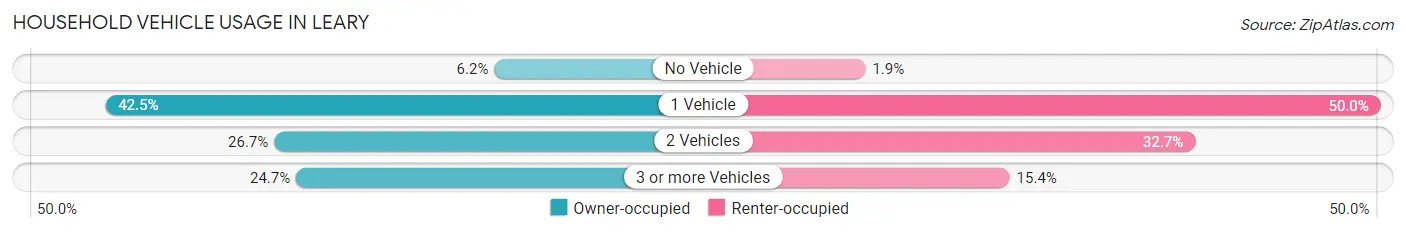
| Vehicles per Household | Owner-occupied | Renter-occupied |
| No Vehicle | 9 (6.2%) | 1 (1.9%) |
| 1 Vehicle | 62 (42.5%) | 26 (50.0%) |
| 2 Vehicles | 39 (26.7%) | 17 (32.7%) |
| 3 or more Vehicles | 36 (24.7%) | 8 (15.4%) |
| Total | 146 (100.0%) | 52 (100.0%) |
Real Estate & Mortgages in Leary
Real Estate and Mortgage Overview in Leary
| Characteristic | Without Mortgage | With Mortgage |
| Housing Units | 112 | 34 |
| Median Property Value | $46,200 | $113,200 |
| Median Household Income | $25,577 | $0 |
| Monthly Housing Costs | $314 | $0 |
| Real Estate Taxes | $631 | $1 |
Property Value by Mortgage Status in Leary
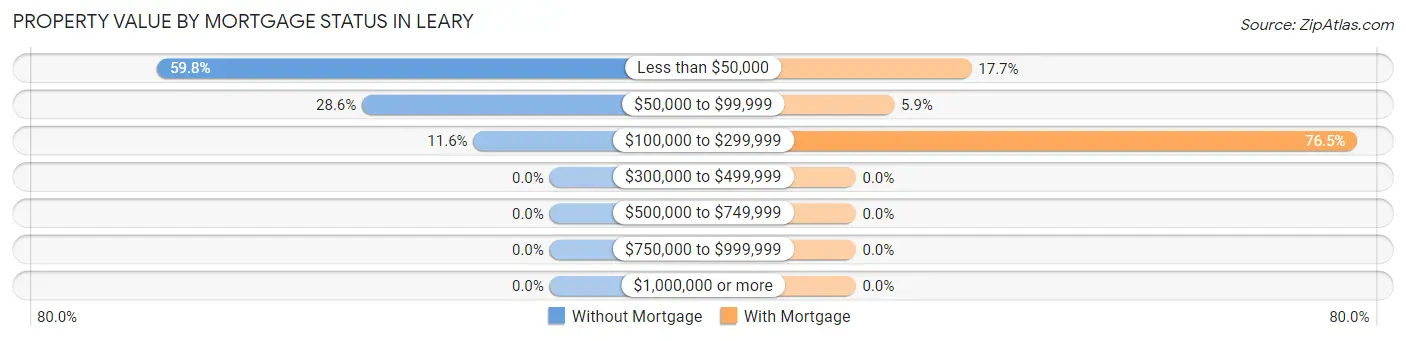
| Property Value | Without Mortgage | With Mortgage |
| Less than $50,000 | 67 (59.8%) | 6 (17.6%) |
| $50,000 to $99,999 | 32 (28.6%) | 2 (5.9%) |
| $100,000 to $299,999 | 13 (11.6%) | 26 (76.5%) |
| $300,000 to $499,999 | 0 (0.0%) | 0 (0.0%) |
| $500,000 to $749,999 | 0 (0.0%) | 0 (0.0%) |
| $750,000 to $999,999 | 0 (0.0%) | 0 (0.0%) |
| $1,000,000 or more | 0 (0.0%) | 0 (0.0%) |
| Total | 112 (100.0%) | 34 (100.0%) |
Household Income by Mortgage Status in Leary
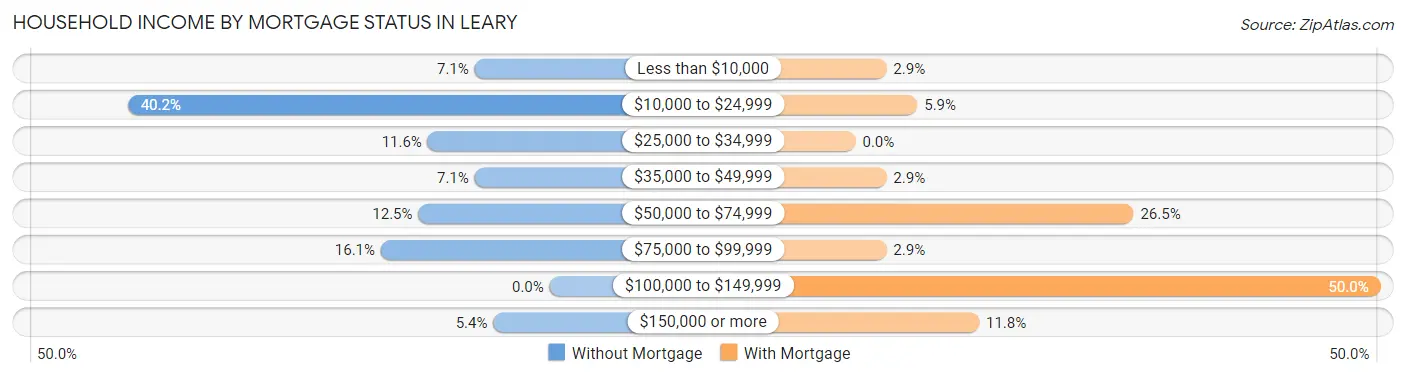
| Household Income | Without Mortgage | With Mortgage |
| Less than $10,000 | 8 (7.1%) | 1 (2.9%) |
| $10,000 to $24,999 | 45 (40.2%) | 2 (5.9%) |
| $25,000 to $34,999 | 13 (11.6%) | 0 (0.0%) |
| $35,000 to $49,999 | 8 (7.1%) | 1 (2.9%) |
| $50,000 to $74,999 | 14 (12.5%) | 9 (26.5%) |
| $75,000 to $99,999 | 18 (16.1%) | 1 (2.9%) |
| $100,000 to $149,999 | 0 (0.0%) | 17 (50.0%) |
| $150,000 or more | 6 (5.4%) | 4 (11.8%) |
| Total | 112 (100.0%) | 34 (100.0%) |
Property Value to Household Income Ratio in Leary
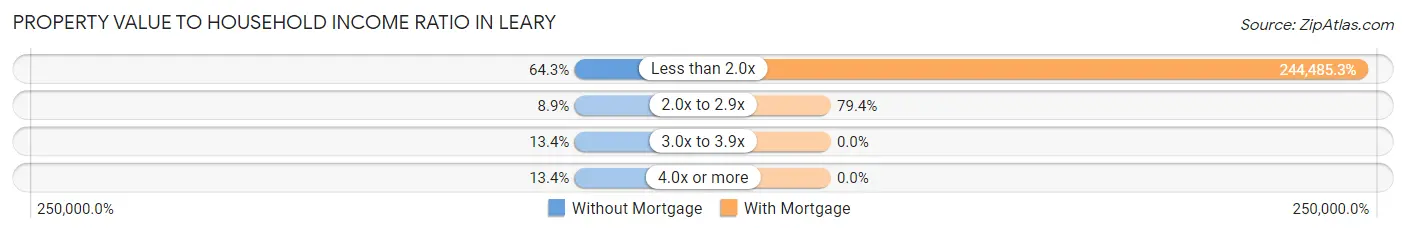
| Value-to-Income Ratio | Without Mortgage | With Mortgage |
| Less than 2.0x | 72 (64.3%) | 83,125 (244,485.3%) |
| 2.0x to 2.9x | 10 (8.9%) | 27 (79.4%) |
| 3.0x to 3.9x | 15 (13.4%) | 0 (0.0%) |
| 4.0x or more | 15 (13.4%) | 0 (0.0%) |
| Total | 112 (100.0%) | 34 (100.0%) |
Real Estate Taxes by Mortgage Status in Leary
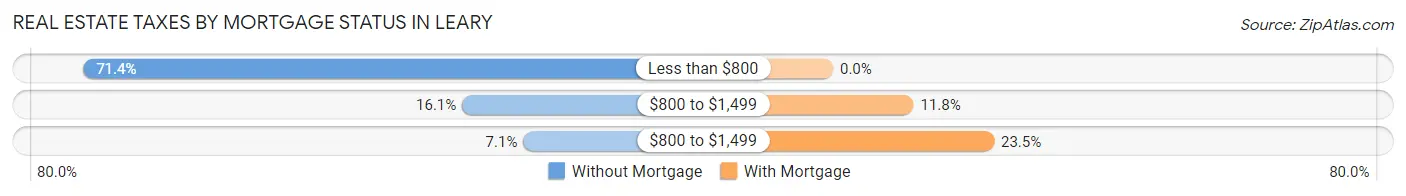
| Property Taxes | Without Mortgage | With Mortgage |
| Less than $800 | 80 (71.4%) | 0 (0.0%) |
| $800 to $1,499 | 18 (16.1%) | 4 (11.8%) |
| $800 to $1,499 | 8 (7.1%) | 8 (23.5%) |
| Total | 112 (100.0%) | 34 (100.0%) |
Health & Disability in Leary
Health Insurance Coverage by Age in Leary
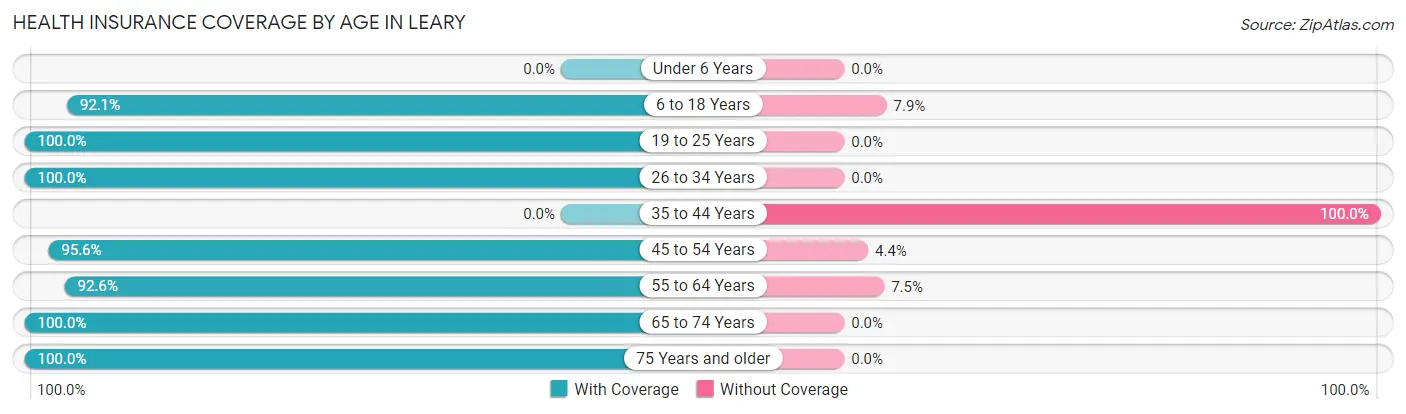
| Age Bracket | With Coverage | Without Coverage |
| Under 6 Years | 0 (0.0%) | 0 (0.0%) |
| 6 to 18 Years | 35 (92.1%) | 3 (7.9%) |
| 19 to 25 Years | 6 (100.0%) | 0 (0.0%) |
| 26 to 34 Years | 5 (100.0%) | 0 (0.0%) |
| 35 to 44 Years | 0 (0.0%) | 16 (100.0%) |
| 45 to 54 Years | 43 (95.6%) | 2 (4.4%) |
| 55 to 64 Years | 87 (92.5%) | 7 (7.4%) |
| 65 to 74 Years | 122 (100.0%) | 0 (0.0%) |
| 75 Years and older | 47 (100.0%) | 0 (0.0%) |
| Total | 345 (92.5%) | 28 (7.5%) |
Health Insurance Coverage by Citizenship Status in Leary
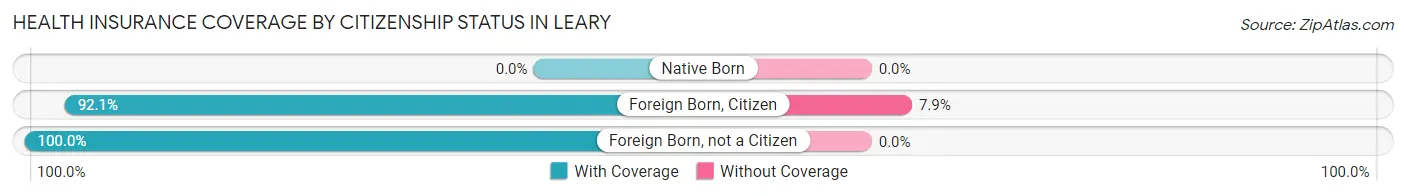
| Citizenship Status | With Coverage | Without Coverage |
| Native Born | 0 (0.0%) | 0 (0.0%) |
| Foreign Born, Citizen | 35 (92.1%) | 3 (7.9%) |
| Foreign Born, not a Citizen | 6 (100.0%) | 0 (0.0%) |
Health Insurance Coverage by Household Income in Leary
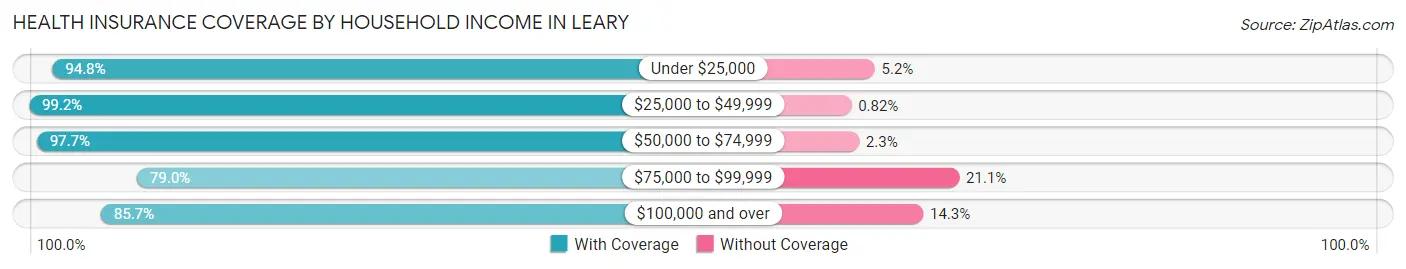
| Household Income | With Coverage | Without Coverage |
| Under $25,000 | 91 (94.8%) | 5 (5.2%) |
| $25,000 to $49,999 | 121 (99.2%) | 1 (0.8%) |
| $50,000 to $74,999 | 43 (97.7%) | 1 (2.3%) |
| $75,000 to $99,999 | 60 (78.9%) | 16 (21.0%) |
| $100,000 and over | 30 (85.7%) | 5 (14.3%) |
Public vs Private Health Insurance Coverage by Age in Leary
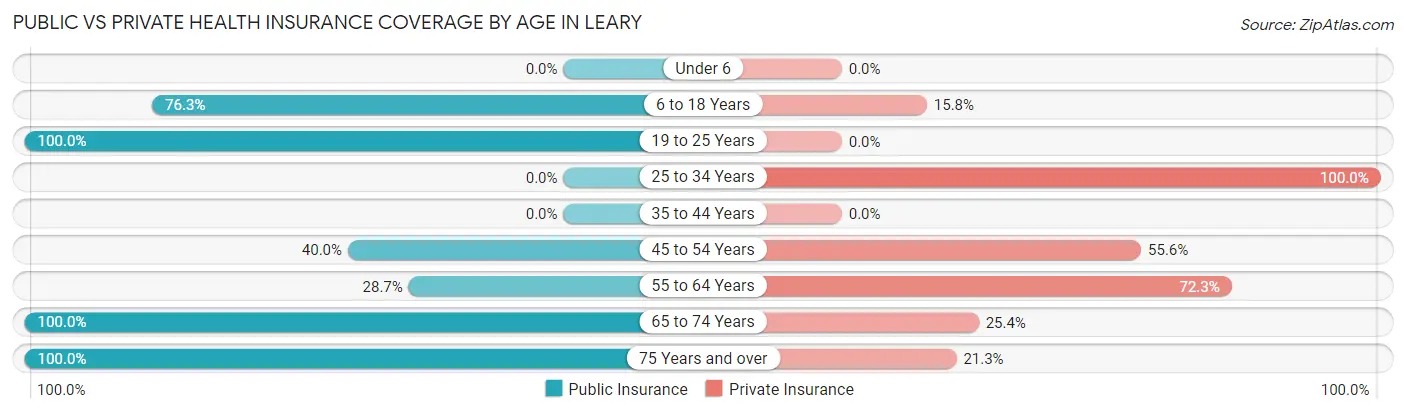
| Age Bracket | Public Insurance | Private Insurance |
| Under 6 | 0 (0.0%) | 0 (0.0%) |
| 6 to 18 Years | 29 (76.3%) | 6 (15.8%) |
| 19 to 25 Years | 6 (100.0%) | 0 (0.0%) |
| 25 to 34 Years | 0 (0.0%) | 5 (100.0%) |
| 35 to 44 Years | 0 (0.0%) | 0 (0.0%) |
| 45 to 54 Years | 18 (40.0%) | 25 (55.6%) |
| 55 to 64 Years | 27 (28.7%) | 68 (72.3%) |
| 65 to 74 Years | 122 (100.0%) | 31 (25.4%) |
| 75 Years and over | 47 (100.0%) | 10 (21.3%) |
| Total | 249 (66.8%) | 145 (38.9%) |
Disability Status by Sex by Age in Leary
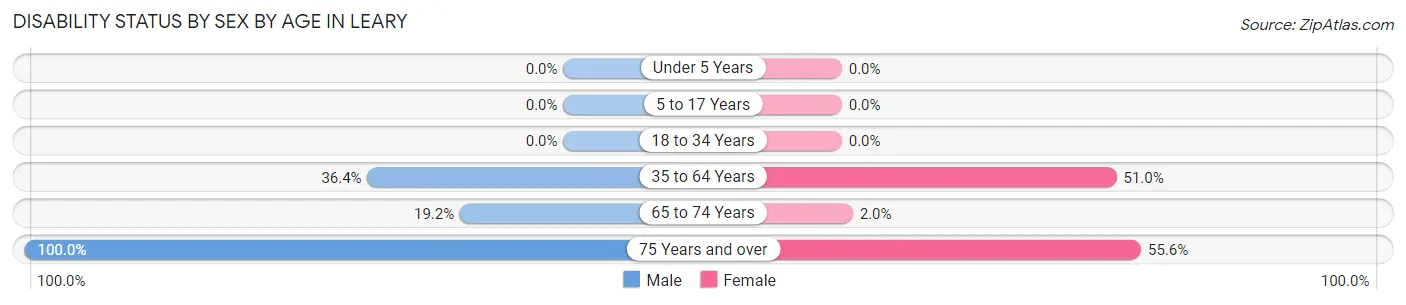
| Age Bracket | Male | Female |
| Under 5 Years | 0 (0.0%) | 0 (0.0%) |
| 5 to 17 Years | 0 (0.0%) | 0 (0.0%) |
| 18 to 34 Years | 0 (0.0%) | 0 (0.0%) |
| 35 to 64 Years | 20 (36.4%) | 51 (51.0%) |
| 65 to 74 Years | 14 (19.2%) | 1 (2.0%) |
| 75 Years and over | 2 (100.0%) | 25 (55.6%) |
Disability Class by Sex by Age in Leary
Disability Class: Hearing Difficulty
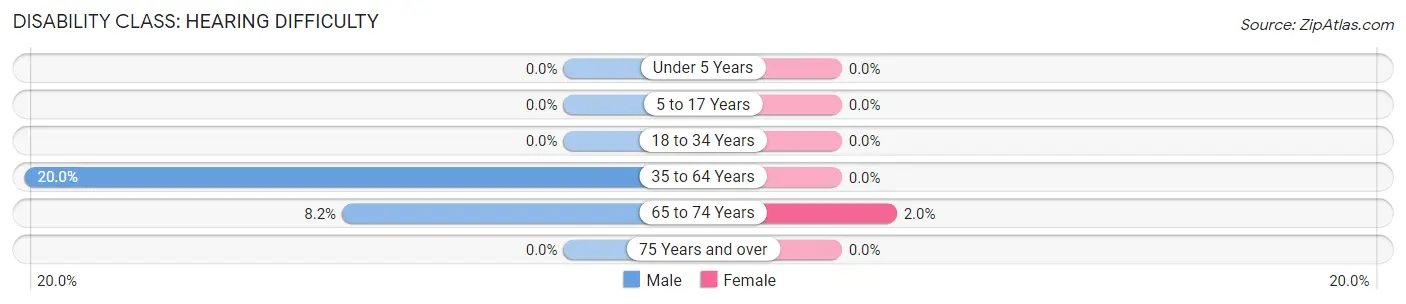
| Age Bracket | Male | Female |
| Under 5 Years | 0 (0.0%) | 0 (0.0%) |
| 5 to 17 Years | 0 (0.0%) | 0 (0.0%) |
| 18 to 34 Years | 0 (0.0%) | 0 (0.0%) |
| 35 to 64 Years | 11 (20.0%) | 0 (0.0%) |
| 65 to 74 Years | 6 (8.2%) | 1 (2.0%) |
| 75 Years and over | 0 (0.0%) | 0 (0.0%) |
Disability Class: Vision Difficulty
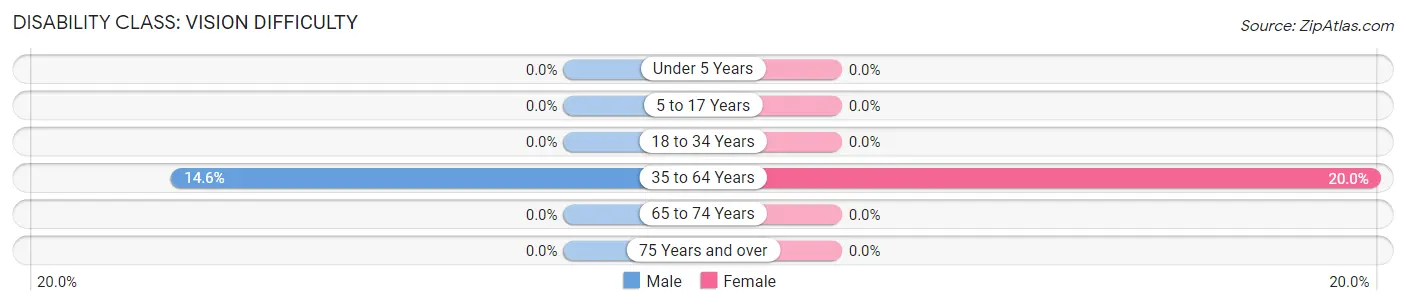
| Age Bracket | Male | Female |
| Under 5 Years | 0 (0.0%) | 0 (0.0%) |
| 5 to 17 Years | 0 (0.0%) | 0 (0.0%) |
| 18 to 34 Years | 0 (0.0%) | 0 (0.0%) |
| 35 to 64 Years | 8 (14.5%) | 20 (20.0%) |
| 65 to 74 Years | 0 (0.0%) | 0 (0.0%) |
| 75 Years and over | 0 (0.0%) | 0 (0.0%) |
Disability Class: Cognitive Difficulty
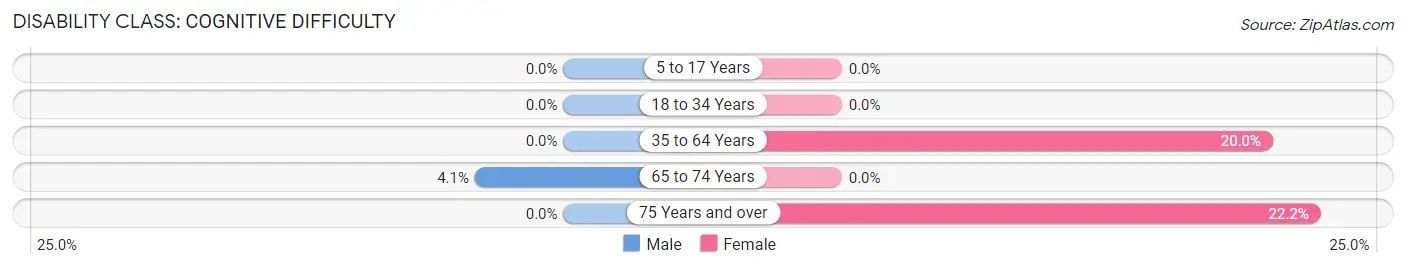
| Age Bracket | Male | Female |
| 5 to 17 Years | 0 (0.0%) | 0 (0.0%) |
| 18 to 34 Years | 0 (0.0%) | 0 (0.0%) |
| 35 to 64 Years | 0 (0.0%) | 20 (20.0%) |
| 65 to 74 Years | 3 (4.1%) | 0 (0.0%) |
| 75 Years and over | 0 (0.0%) | 10 (22.2%) |
Disability Class: Ambulatory Difficulty
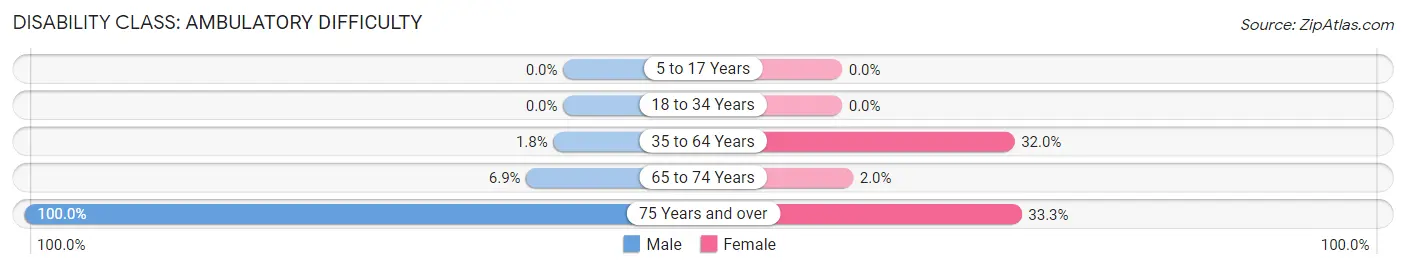
| Age Bracket | Male | Female |
| 5 to 17 Years | 0 (0.0%) | 0 (0.0%) |
| 18 to 34 Years | 0 (0.0%) | 0 (0.0%) |
| 35 to 64 Years | 1 (1.8%) | 32 (32.0%) |
| 65 to 74 Years | 5 (6.9%) | 1 (2.0%) |
| 75 Years and over | 2 (100.0%) | 15 (33.3%) |
Disability Class: Self-Care Difficulty
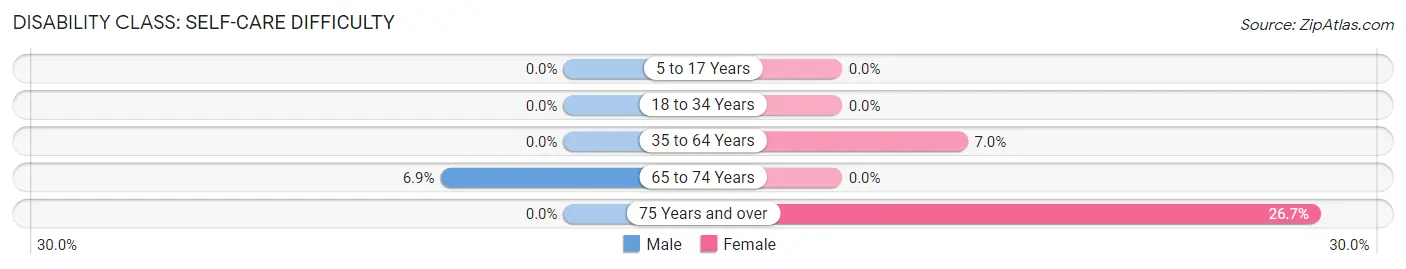
| Age Bracket | Male | Female |
| 5 to 17 Years | 0 (0.0%) | 0 (0.0%) |
| 18 to 34 Years | 0 (0.0%) | 0 (0.0%) |
| 35 to 64 Years | 0 (0.0%) | 7 (7.0%) |
| 65 to 74 Years | 5 (6.9%) | 0 (0.0%) |
| 75 Years and over | 0 (0.0%) | 12 (26.7%) |
Technology Access in Leary
Computing Device Access in Leary
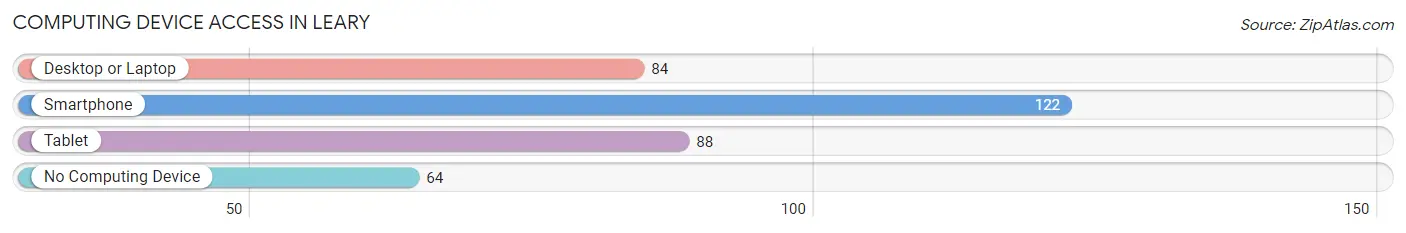
| Device Type | # Households | % Households |
| Desktop or Laptop | 84 | 42.4% |
| Smartphone | 122 | 61.6% |
| Tablet | 88 | 44.4% |
| No Computing Device | 64 | 32.3% |
| Total | 198 | 100.0% |
Internet Access in Leary
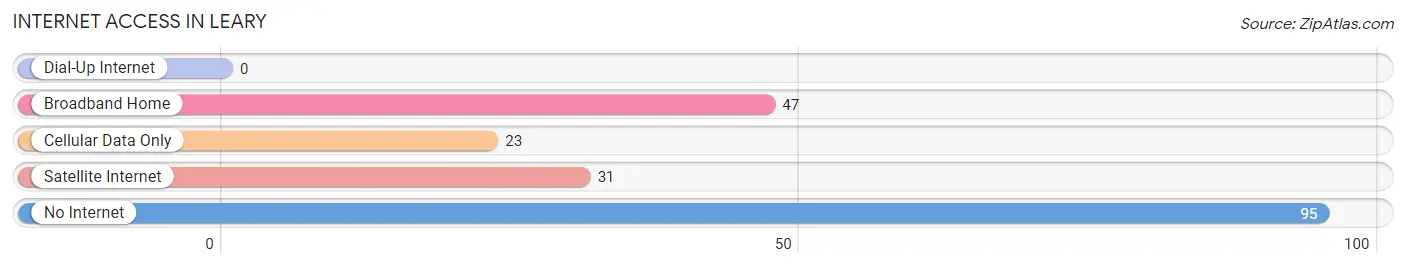
| Internet Type | # Households | % Households |
| Dial-Up Internet | 0 | 0.0% |
| Broadband Home | 47 | 23.7% |
| Cellular Data Only | 23 | 11.6% |
| Satellite Internet | 31 | 15.7% |
| No Internet | 95 | 48.0% |
| Total | 198 | 100.0% |
Leary Summary
Geography
O'Leary is a small town located in Prince Edward Island, Canada. It is situated in the western part of the province, near the town of Summerside. The town is located on the O'Leary River, which flows into the Northumberland Strait. The town is surrounded by rolling hills and farmland, and is known for its picturesque views.
History
O'Leary was founded in 1873 by Irish immigrants, who named the town after their hometown of O'Leary, Ireland. The town was originally a farming community, and the main industry was dairy farming. In the early 1900s, the town began to grow and develop, and by the 1950s, it had become a thriving community.
In the late 1960s, the town was chosen as the site of a new provincial government office building, which was completed in 1971. This building was the first of its kind in the province, and it helped to spur economic growth in the area.
Economy
Today, O'Leary is a small but vibrant community. The main industries in the town are agriculture, tourism, and government services. Agriculture is still the main industry in the area, and the town is home to several dairy farms. Tourism is also an important part of the local economy, as the town is a popular destination for visitors from all over the world.
The provincial government office building is still in operation, and it provides a number of services to the local community. The town also has a number of small businesses, including restaurants, shops, and other services.
Demographics
As of the 2016 census, the population of O'Leary was 1,845. The town has a diverse population, with people from a variety of backgrounds and cultures. The majority of the population is of Irish descent, and the town has a strong Irish culture.
The town has a median age of 44.7 years, and the median household income is $50,845. The unemployment rate is 6.2%, which is slightly higher than the provincial average.
Conclusion
O'Leary is a small but vibrant town located in Prince Edward Island, Canada. The town has a long history, and it is still a thriving community today. The main industries in the area are agriculture, tourism, and government services. The town has a diverse population, with people from a variety of backgrounds and cultures. O'Leary is a great place to live and work, and it is a popular destination for visitors from all over the world.
Common Questions
What is the Total Population of Leary?
Total Population of Leary is 373.
What is the Total Male Population of Leary?
Total Male Population of Leary is 163.
What is the Total Female Population of Leary?
Total Female Population of Leary is 210.
What is the Ratio of Males per 100 Females in Leary?
There are 77.62 Males per 100 Females in Leary.
What is the Ratio of Females per 100 Males in Leary?
There are 128.83 Females per 100 Males in Leary.
What is the Median Population Age in Leary?
Median Population Age in Leary is 64.6 Years.
What is the Average Family Size in Leary
Average Family Size in Leary is 2.5 People.
What is the Average Household Size in Leary
Average Household Size in Leary is 1.9 People.
What is Per Capita Income in Leary?
Per Capita income in Leary is $25,110.
What is the Median Family Income in Leary?
Median Family Income in Leary is $46,250.
What is the Median Household income in Leary?
Median Household Income in Leary is $35,385.
What is Income or Wage Gap in Leary?
Income or Wage Gap in Leary is 44.7%.
Women in Leary earn 55.3 cents for every dollar earned by a man.
What is Inequality or Gini Index in Leary?
Inequality or Gini Index in Leary is 0.45.
How Large is the Labor Force in Leary?
There are 142 People in the Labor Forcein in Leary.
What is the Percentage of People in the Labor Force in Leary?
42.3% of People are in the Labor Force in Leary.