Lakeland, GA
Lakeland Map
Lakeland Overview
2,928
TOTAL POPULATION
1,724
MALE POPULATION
1,204
FEMALE POPULATION
143.19
MALES / 100 FEMALES
69.84
FEMALES / 100 MALES
39.6
MEDIAN AGE
3.2
AVG FAMILY SIZE
2.6
AVG HOUSEHOLD SIZE
$13,543
PER CAPITA INCOME
$24,138
AVG FAMILY INCOME
$28,920
AVG HOUSEHOLD INCOME
35.8%
WAGE / INCOME GAP [ % ]
64.2¢/ $1
WAGE / INCOME GAP [ $ ]
$17,568
FAMILY INCOME DEFICIT
0.46
INEQUALITY / GINI INDEX
907
LABOR FORCE [ PEOPLE ]
37.5%
PERCENT IN LABOR FORCE
0.1%
UNEMPLOYMENT RATE
Lakeland Zip Codes
Lakeland Area Codes
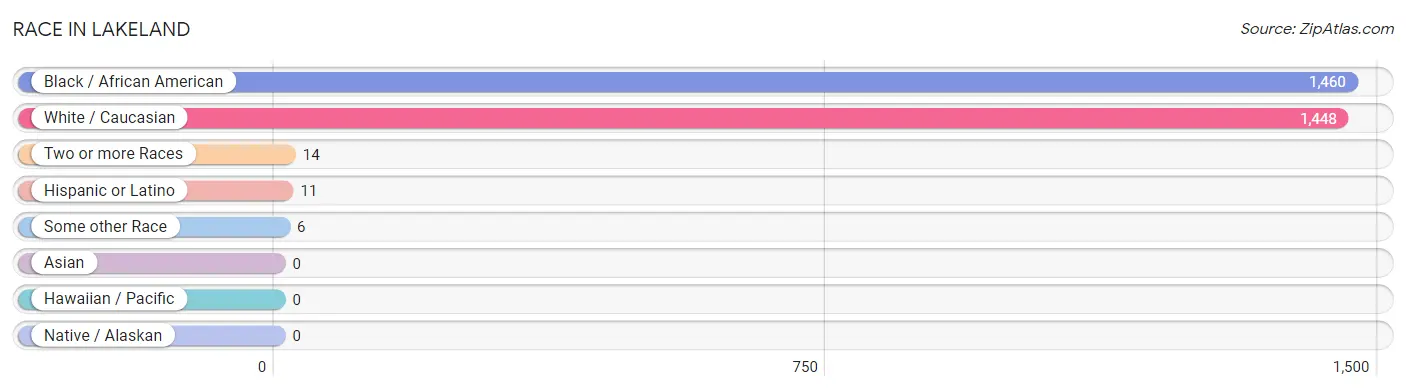
Race in Lakeland
The most populous races in Lakeland are Black / African American (1,460 | 49.9%), White / Caucasian (1,448 | 49.4%), and Two or more Races (14 | 0.5%).
| Race | # Population | % Population |
| Asian | 0 | 0.0% |
| Black / African American | 1,460 | 49.9% |
| Hawaiian / Pacific | 0 | 0.0% |
| Hispanic or Latino | 11 | 0.4% |
| Native / Alaskan | 0 | 0.0% |
| White / Caucasian | 1,448 | 49.4% |
| Two or more Races | 14 | 0.5% |
| Some other Race | 6 | 0.2% |
| Total | 2,928 | 100.0% |
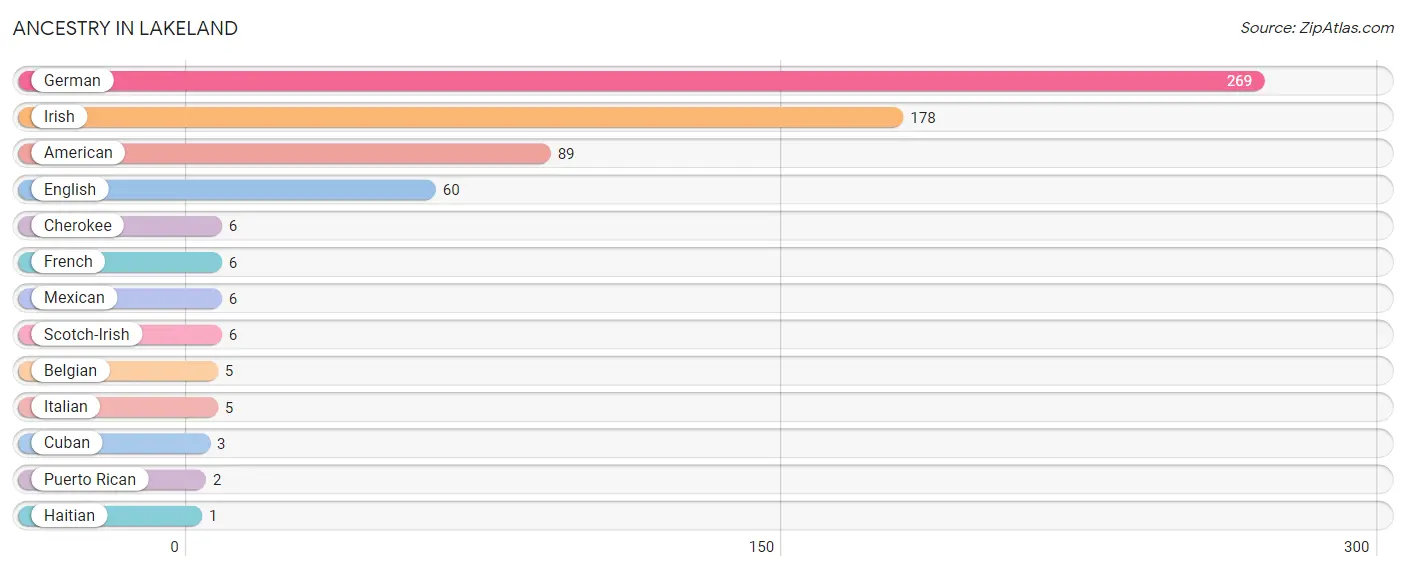
Ancestry in Lakeland
The most populous ancestries reported in Lakeland are German (269 | 9.2%), Irish (178 | 6.1%), American (89 | 3.0%), English (60 | 2.1%), and Cherokee (6 | 0.2%), together accounting for 20.6% of all Lakeland residents.
| Ancestry | # Population | % Population |
| American | 89 | 3.0% |
| Belgian | 5 | 0.2% |
| Cherokee | 6 | 0.2% |
| Cuban | 3 | 0.1% |
| English | 60 | 2.1% |
| French | 6 | 0.2% |
| German | 269 | 9.2% |
| Haitian | 1 | 0.0% |
| Irish | 178 | 6.1% |
| Italian | 5 | 0.2% |
| Mexican | 6 | 0.2% |
| Puerto Rican | 2 | 0.1% |
| Scotch-Irish | 6 | 0.2% | View All 13 Rows |
Immigrants in Lakeland

| Immigration Origin | # Population | % Population | View All 0 Rows |
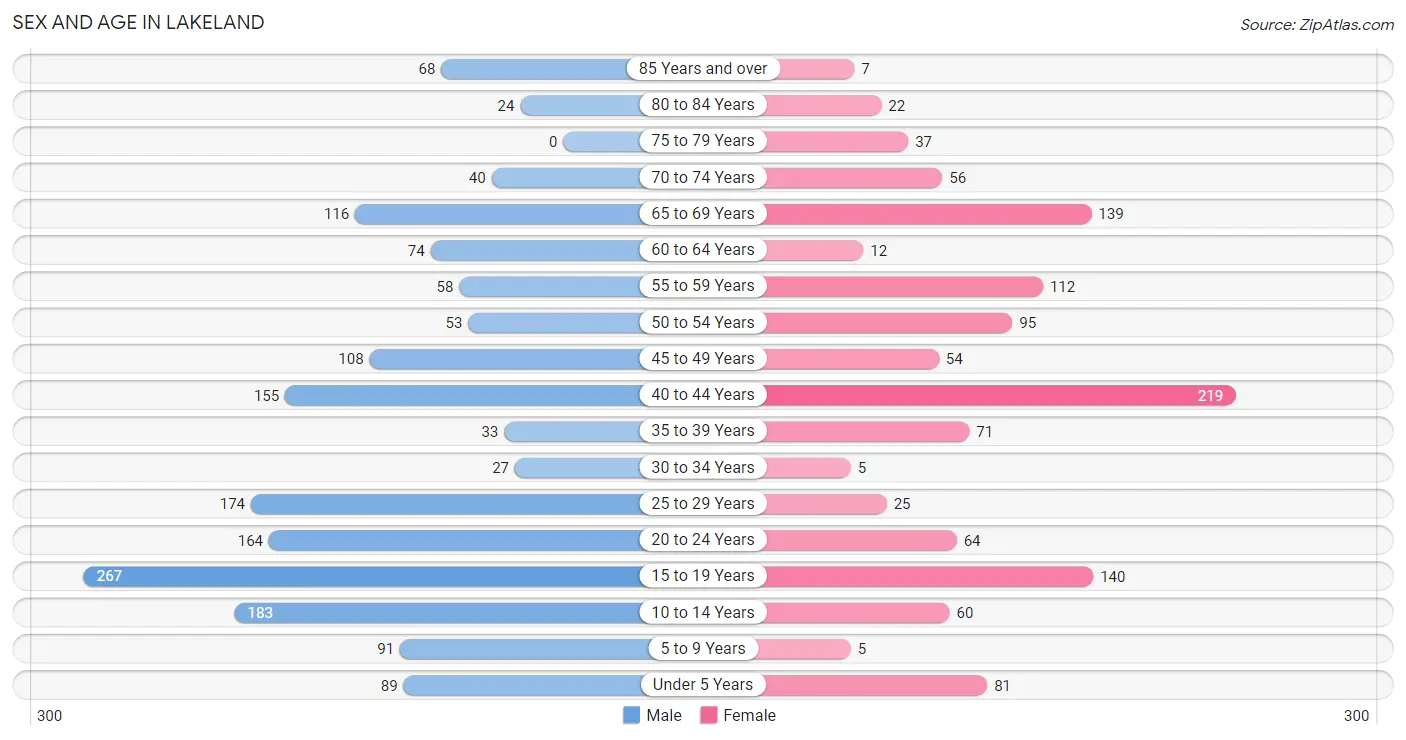
Sex and Age in Lakeland
Sex and Age in Lakeland
The most populous age groups in Lakeland are 15 to 19 Years (267 | 15.5%) for men and 40 to 44 Years (219 | 18.2%) for women.
| Age Bracket | Male | Female |
| Under 5 Years | 89 (5.2%) | 81 (6.7%) |
| 5 to 9 Years | 91 (5.3%) | 5 (0.4%) |
| 10 to 14 Years | 183 (10.6%) | 60 (5.0%) |
| 15 to 19 Years | 267 (15.5%) | 140 (11.6%) |
| 20 to 24 Years | 164 (9.5%) | 64 (5.3%) |
| 25 to 29 Years | 174 (10.1%) | 25 (2.1%) |
| 30 to 34 Years | 27 (1.6%) | 5 (0.4%) |
| 35 to 39 Years | 33 (1.9%) | 71 (5.9%) |
| 40 to 44 Years | 155 (9.0%) | 219 (18.2%) |
| 45 to 49 Years | 108 (6.3%) | 54 (4.5%) |
| 50 to 54 Years | 53 (3.1%) | 95 (7.9%) |
| 55 to 59 Years | 58 (3.4%) | 112 (9.3%) |
| 60 to 64 Years | 74 (4.3%) | 12 (1.0%) |
| 65 to 69 Years | 116 (6.7%) | 139 (11.5%) |
| 70 to 74 Years | 40 (2.3%) | 56 (4.6%) |
| 75 to 79 Years | 0 (0.0%) | 37 (3.1%) |
| 80 to 84 Years | 24 (1.4%) | 22 (1.8%) |
| 85 Years and over | 68 (3.9%) | 7 (0.6%) |
| Total | 1,724 (100.0%) | 1,204 (100.0%) |
Families and Households in Lakeland
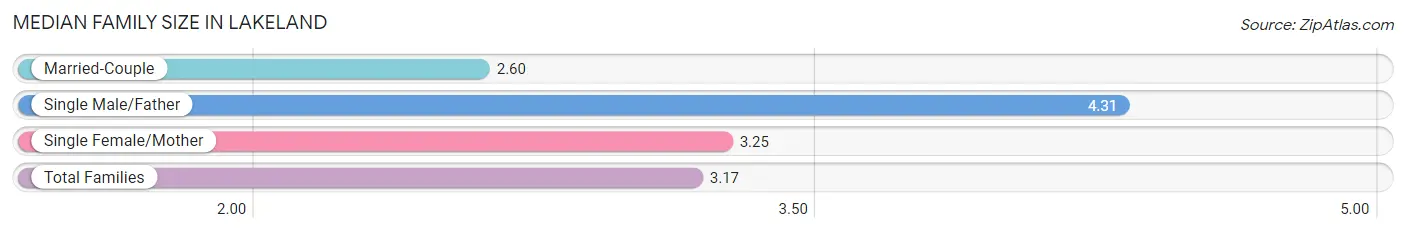
Median Family Size in Lakeland
The median family size in Lakeland is 3.17 persons per family, with single male/father families (107 | 15.5%) accounting for the largest median family size of 4.31 persons per family. On the other hand, married-couple families (266 | 38.6%) represent the smallest median family size with 2.60 persons per family.
| Family Type | # Families | Family Size |
| Married-Couple | 266 (38.6%) | 2.60 |
| Single Male/Father | 107 (15.5%) | 4.31 |
| Single Female/Mother | 316 (45.9%) | 3.25 |
| Total Families | 689 (100.0%) | 3.17 |
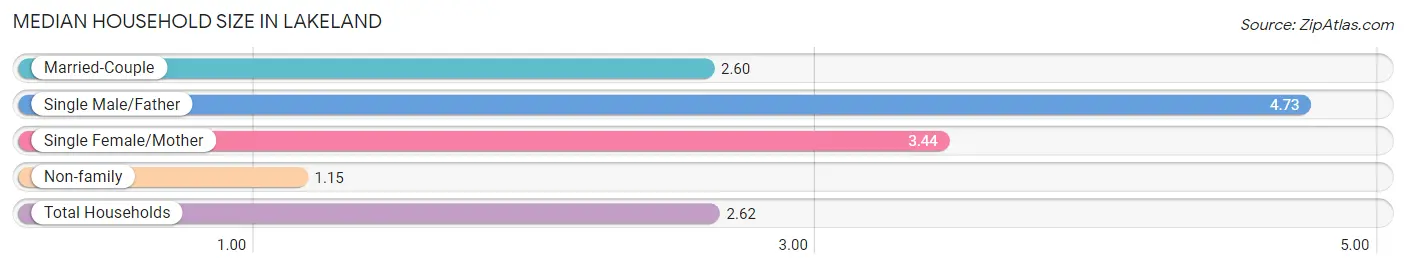
Median Household Size in Lakeland
The median household size in Lakeland is 2.62 persons per household, with single male/father households (107 | 10.5%) accounting for the largest median household size of 4.73 persons per household. non-family households (328 | 32.3%) represent the smallest median household size with 1.15 persons per household.
| Household Type | # Households | Household Size |
| Married-Couple | 266 (26.2%) | 2.60 |
| Single Male/Father | 107 (10.5%) | 4.73 |
| Single Female/Mother | 316 (31.1%) | 3.44 |
| Non-family | 328 (32.3%) | 1.15 |
| Total Households | 1,017 (100.0%) | 2.62 |
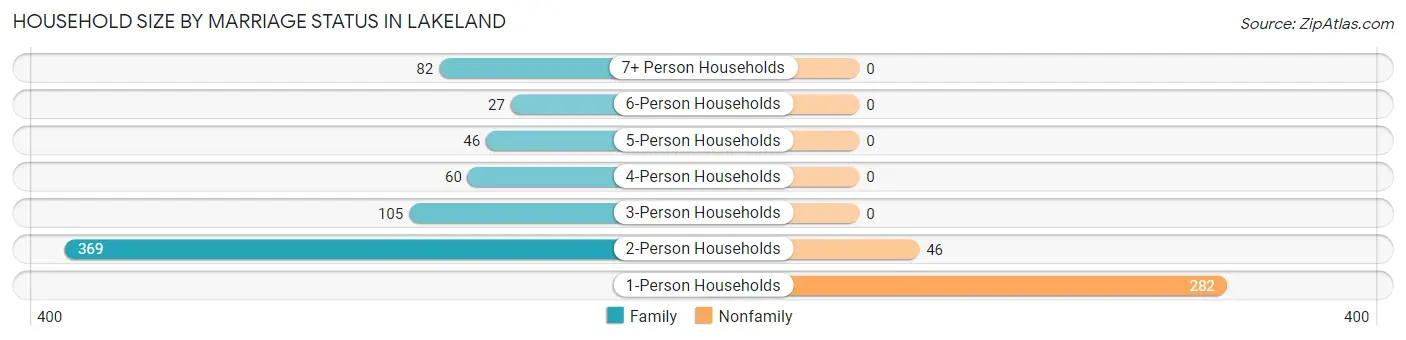
Household Size by Marriage Status in Lakeland
Out of a total of 1,017 households in Lakeland, 689 (67.7%) are family households, while 328 (32.3%) are nonfamily households. The most numerous type of family households are 2-person households, comprising 369, and the most common type of nonfamily households are 1-person households, comprising 282.
| Household Size | Family Households | Nonfamily Households |
| 1-Person Households | - | 282 (27.7%) |
| 2-Person Households | 369 (36.3%) | 46 (4.5%) |
| 3-Person Households | 105 (10.3%) | 0 (0.0%) |
| 4-Person Households | 60 (5.9%) | 0 (0.0%) |
| 5-Person Households | 46 (4.5%) | 0 (0.0%) |
| 6-Person Households | 27 (2.6%) | 0 (0.0%) |
| 7+ Person Households | 82 (8.1%) | 0 (0.0%) |
| Total | 689 (67.7%) | 328 (32.3%) |
Female Fertility in Lakeland
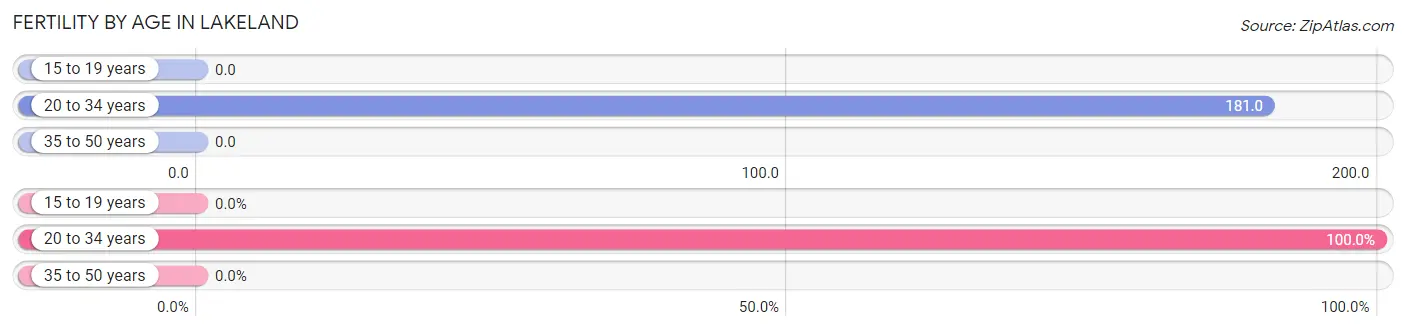
Fertility by Age in Lakeland
Average fertility rate in Lakeland is 28.0 births per 1,000 women. Women in the age bracket of 20 to 34 years have the highest fertility rate with 181.0 births per 1,000 women. Women in the age bracket of 20 to 34 years acount for 100.0% of all women with births.
| Age Bracket | Women with Births | Births / 1,000 Women |
| 15 to 19 years | 0 (0.0%) | 0.0 |
| 20 to 34 years | 17 (100.0%) | 181.0 |
| 35 to 50 years | 0 (0.0%) | 0.0 |
| Total | 17 (100.0%) | 28.0 |
Fertility by Age by Marriage Status in Lakeland
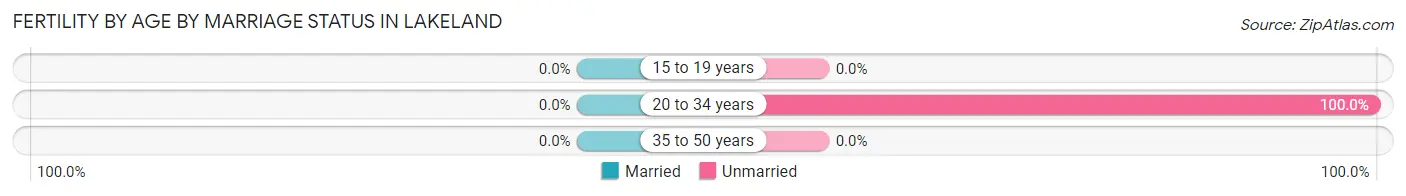
| Age Bracket | Married | Unmarried |
| 15 to 19 years | 0 (0.0%) | 0 (0.0%) |
| 20 to 34 years | 0 (0.0%) | 17 (100.0%) |
| 35 to 50 years | 0 (0.0%) | 0 (0.0%) |
| Total | 0 (0.0%) | 17 (100.0%) |
Fertility by Education in Lakeland
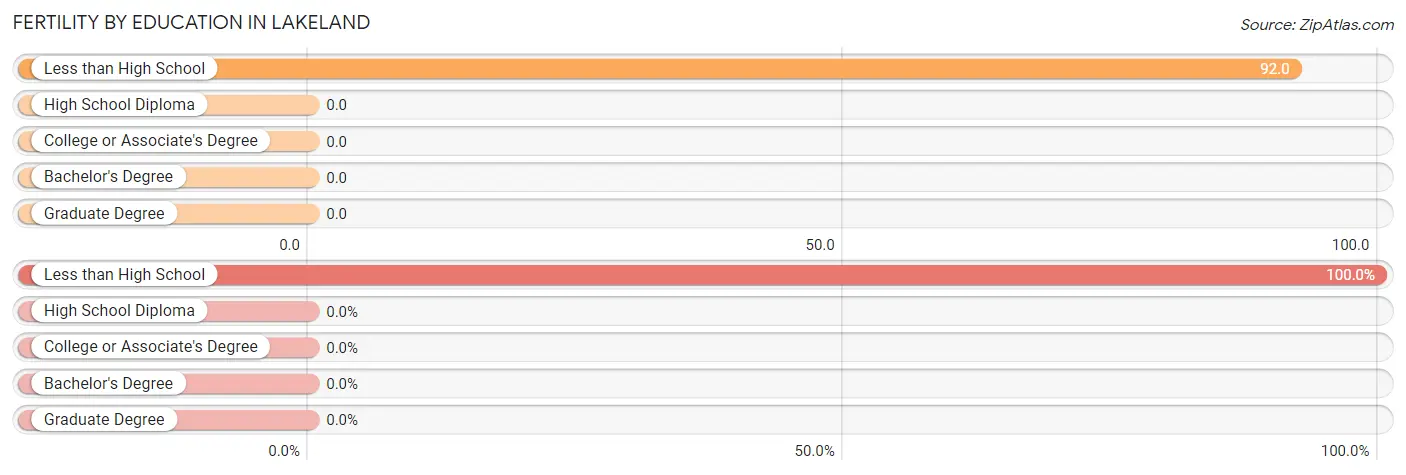
| Educational Attainment | Women with Births | Births / 1,000 Women |
| Less than High School | 17 (100.0%) | 92.0 |
| High School Diploma | 0 (0.0%) | 0.0 |
| College or Associate's Degree | 0 (0.0%) | 0.0 |
| Bachelor's Degree | 0 (0.0%) | 0.0 |
| Graduate Degree | 0 (0.0%) | 0.0 |
| Total | 17 (100.0%) | 28.0 |
Fertility by Education by Marriage Status in Lakeland
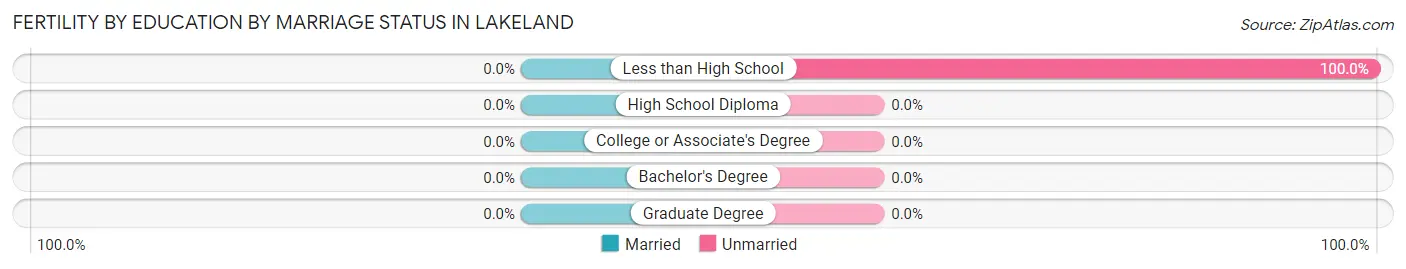
| Educational Attainment | Married | Unmarried |
| Less than High School | 0 (0.0%) | 17 (100.0%) |
| High School Diploma | 0 (0.0%) | 0 (0.0%) |
| College or Associate's Degree | 0 (0.0%) | 0 (0.0%) |
| Bachelor's Degree | 0 (0.0%) | 0 (0.0%) |
| Graduate Degree | 0 (0.0%) | 0 (0.0%) |
| Total | 0 (0.0%) | 17 (100.0%) |
Income in Lakeland
Income Overview in Lakeland
Per Capita Income in Lakeland is $13,543, while median incomes of families and households are $24,138 and $28,920 respectively.
| Characteristic | Number | Measure |
| Per Capita Income | 2,928 | $13,543 |
| Median Family Income | 689 | $24,138 |
| Mean Family Income | 689 | $36,955 |
| Median Household Income | 1,017 | $28,920 |
| Mean Household Income | 1,017 | $36,856 |
| Income Deficit | 689 | $17,568 |
| Wage / Income Gap (%) | 2,928 | 35.81% |
| Wage / Income Gap ($) | 2,928 | 64.19¢ per $1 |
| Gini / Inequality Index | 2,928 | 0.46 |
Earnings by Sex in Lakeland
Average Earnings in Lakeland are $21,865, $28,566 for men and $18,337 for women, a difference of 35.8%.
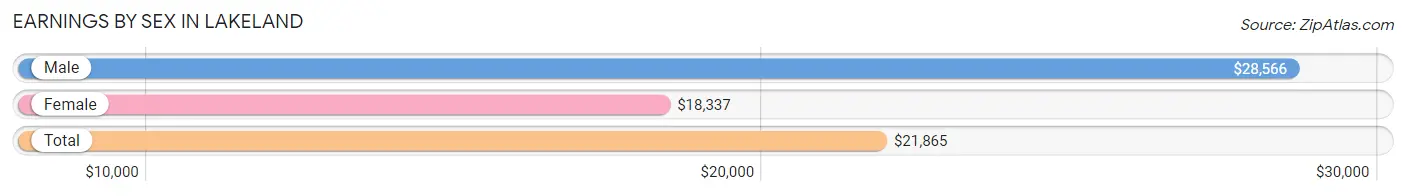
| Sex | Number | Average Earnings |
| Male | 505 (50.9%) | $28,566 |
| Female | 487 (49.1%) | $18,337 |
| Total | 992 (100.0%) | $21,865 |
Earnings by Sex by Income Bracket in Lakeland
The most common earnings brackets in Lakeland are $25,000 to $29,999 for men (187 | 37.0%) and $17,500 to $19,999 for women (127 | 26.1%).
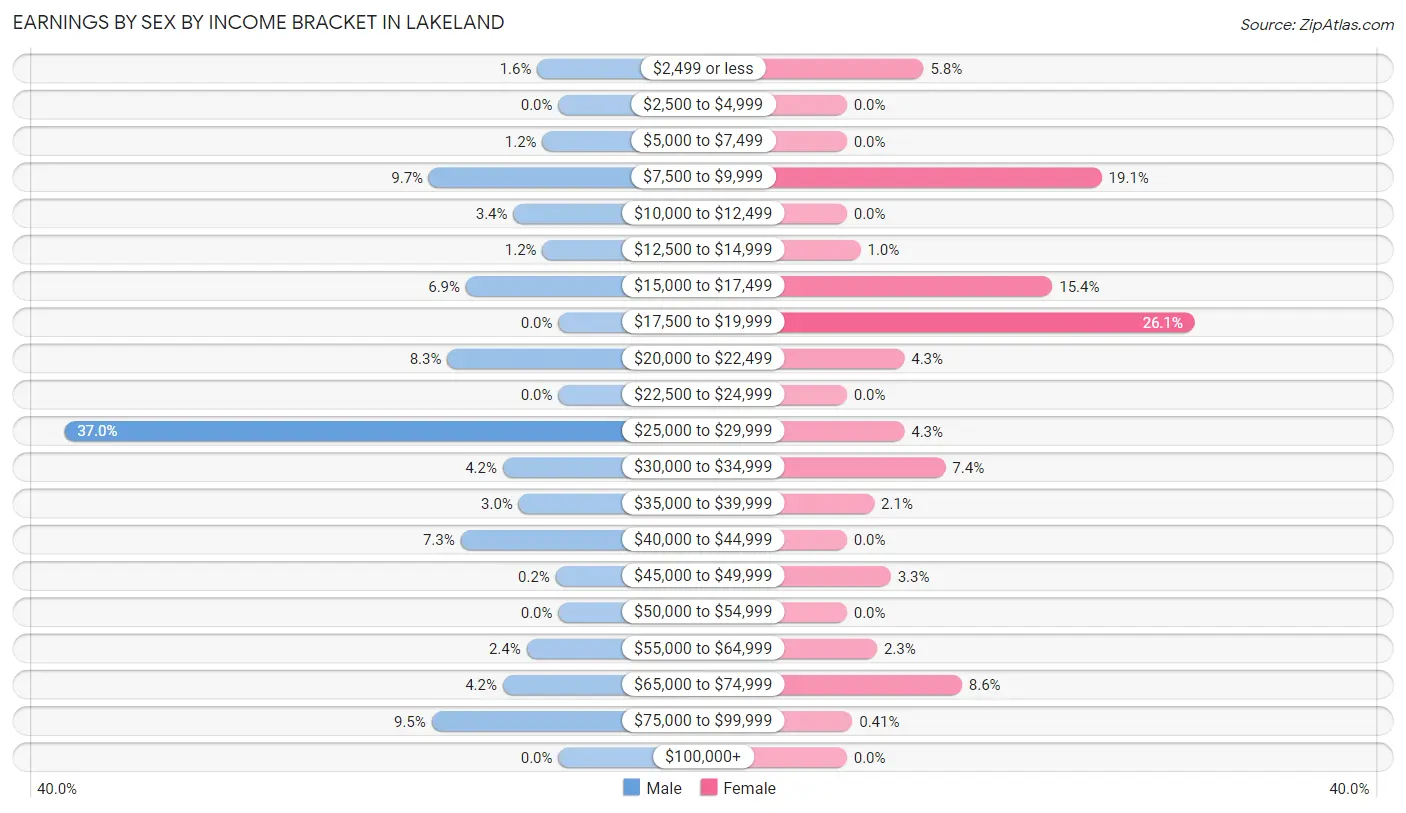
| Income | Male | Female |
| $2,499 or less | 8 (1.6%) | 28 (5.8%) |
| $2,500 to $4,999 | 0 (0.0%) | 0 (0.0%) |
| $5,000 to $7,499 | 6 (1.2%) | 0 (0.0%) |
| $7,500 to $9,999 | 49 (9.7%) | 93 (19.1%) |
| $10,000 to $12,499 | 17 (3.4%) | 0 (0.0%) |
| $12,500 to $14,999 | 6 (1.2%) | 5 (1.0%) |
| $15,000 to $17,499 | 35 (6.9%) | 75 (15.4%) |
| $17,500 to $19,999 | 0 (0.0%) | 127 (26.1%) |
| $20,000 to $22,499 | 42 (8.3%) | 21 (4.3%) |
| $22,500 to $24,999 | 0 (0.0%) | 0 (0.0%) |
| $25,000 to $29,999 | 187 (37.0%) | 21 (4.3%) |
| $30,000 to $34,999 | 21 (4.2%) | 36 (7.4%) |
| $35,000 to $39,999 | 15 (3.0%) | 10 (2.1%) |
| $40,000 to $44,999 | 37 (7.3%) | 0 (0.0%) |
| $45,000 to $49,999 | 1 (0.2%) | 16 (3.3%) |
| $50,000 to $54,999 | 0 (0.0%) | 0 (0.0%) |
| $55,000 to $64,999 | 12 (2.4%) | 11 (2.3%) |
| $65,000 to $74,999 | 21 (4.2%) | 42 (8.6%) |
| $75,000 to $99,999 | 48 (9.5%) | 2 (0.4%) |
| $100,000+ | 0 (0.0%) | 0 (0.0%) |
| Total | 505 (100.0%) | 487 (100.0%) |
Earnings by Sex by Educational Attainment in Lakeland
Average earnings in Lakeland are $28,265 for men and $18,967 for women, a difference of 32.9%. Men with an educational attainment of college or associate's degree enjoy the highest average annual earnings of $28,518, while those with less than high school education earn the least with $26,518. Women with an educational attainment of high school diploma earn the most with the average annual earnings of $17,065, while those with high school diploma education have the smallest earnings of $17,065.
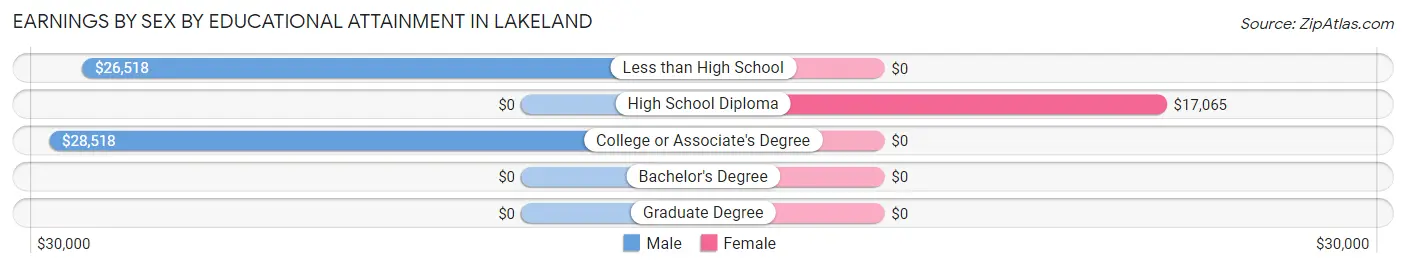
| Educational Attainment | Male Income | Female Income |
| Less than High School | $26,518 | $0 |
| High School Diploma | - | - |
| College or Associate's Degree | $28,518 | $0 |
| Bachelor's Degree | - | - |
| Graduate Degree | - | - |
| Total | $28,265 | $18,967 |
Family Income in Lakeland
Family Income Brackets in Lakeland
According to the Lakeland family income data, there are 214 families falling into the $15,000 to $24,999 income range, which is the most common income bracket and makes up 31.1% of all families.
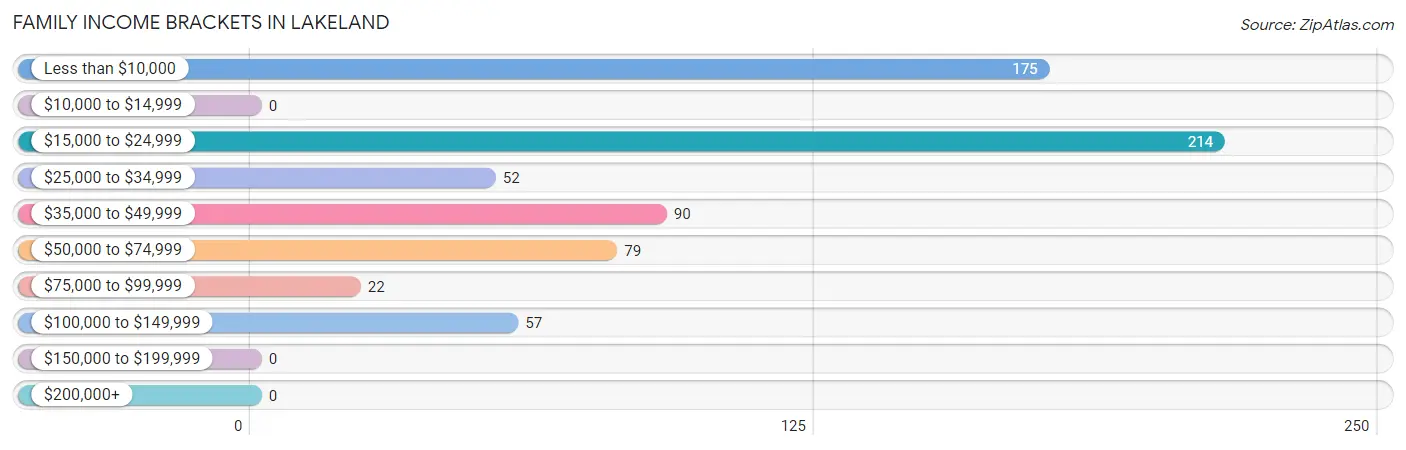
| Income Bracket | # Families | % Families |
| Less than $10,000 | 175 | 25.4% |
| $10,000 to $14,999 | 0 | 0.0% |
| $15,000 to $24,999 | 214 | 31.1% |
| $25,000 to $34,999 | 52 | 7.5% |
| $35,000 to $49,999 | 90 | 13.1% |
| $50,000 to $74,999 | 79 | 11.5% |
| $75,000 to $99,999 | 22 | 3.2% |
| $100,000 to $149,999 | 57 | 8.3% |
| $150,000 to $199,999 | 0 | 0.0% |
| $200,000+ | 0 | 0.0% |
Family Income by Famaliy Size in Lakeland
2-person families (427 | 62.0%) account for the highest median family income in Lakeland with $24,816 per family, while 2-person families (427 | 62.0%) have the highest median income of $12,408 per family member.
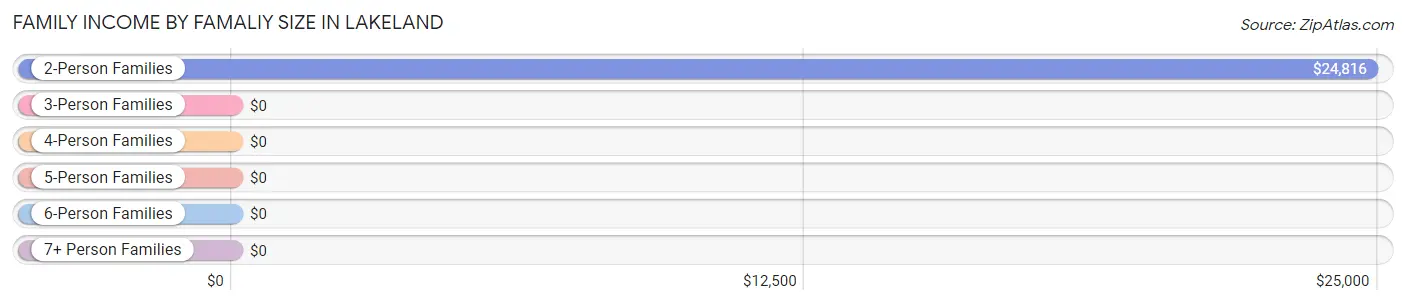
| Income Bracket | # Families | Median Income |
| 2-Person Families | 427 (62.0%) | $24,816 |
| 3-Person Families | 74 (10.7%) | $0 |
| 4-Person Families | 54 (7.8%) | $0 |
| 5-Person Families | 25 (3.6%) | $0 |
| 6-Person Families | 27 (3.9%) | $0 |
| 7+ Person Families | 82 (11.9%) | $0 |
| Total | 689 (100.0%) | $24,138 |
Family Income by Number of Earners in Lakeland
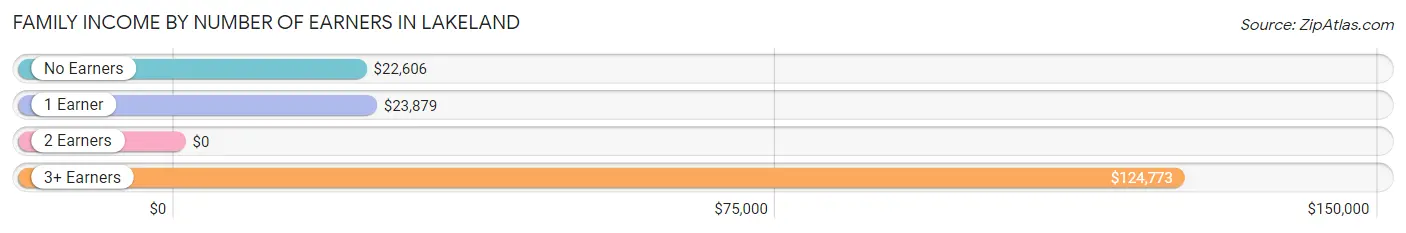
| Number of Earners | # Families | Median Income |
| No Earners | 268 (38.9%) | $22,606 |
| 1 Earner | 322 (46.7%) | $23,879 |
| 2 Earners | 51 (7.4%) | $0 |
| 3+ Earners | 48 (7.0%) | $124,773 |
| Total | 689 (100.0%) | $24,138 |
Household Income in Lakeland
Household Income Brackets in Lakeland
With 218 households falling in the category, the less than $10,000 income range is the most frequent in Lakeland, accounting for 21.4% of all households.
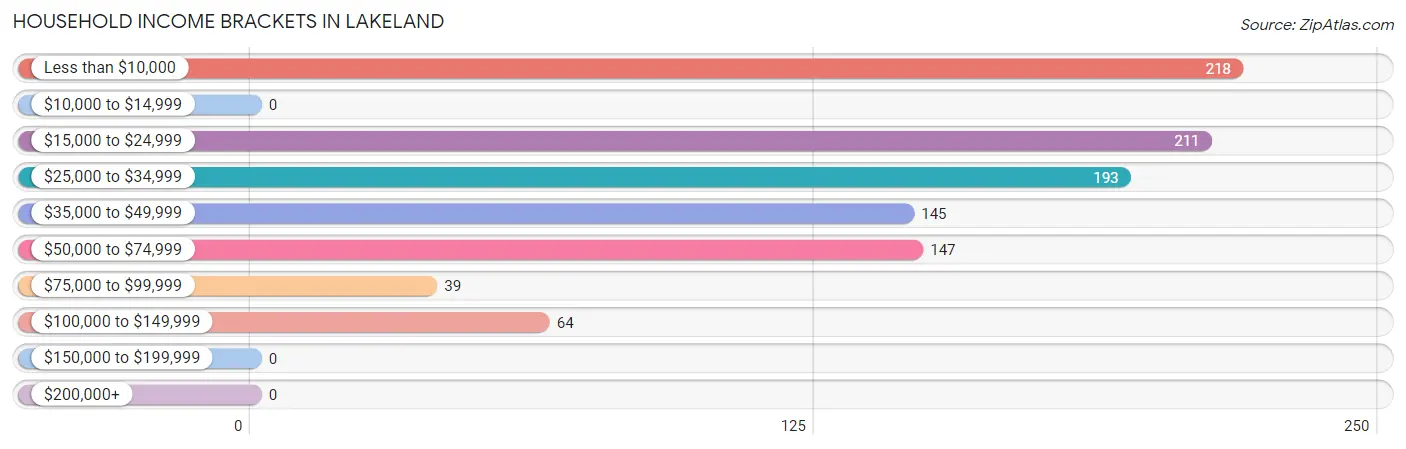
| Income Bracket | # Households | % Households |
| Less than $10,000 | 218 | 21.4% |
| $10,000 to $14,999 | 0 | 0.0% |
| $15,000 to $24,999 | 211 | 20.7% |
| $25,000 to $34,999 | 193 | 19.0% |
| $35,000 to $49,999 | 145 | 14.3% |
| $50,000 to $74,999 | 147 | 14.5% |
| $75,000 to $99,999 | 39 | 3.8% |
| $100,000 to $149,999 | 64 | 6.3% |
| $150,000 to $199,999 | 0 | 0.0% |
| $200,000+ | 0 | 0.0% |
Household Income by Householder Age in Lakeland
The median household income in Lakeland is $28,920, with the highest median household income of $39,960 found in the 45 to 64 years age bracket for the primary householder. A total of 336 households (33.0%) fall into this category. Meanwhile, the 15 to 24 years age bracket for the primary householder has the lowest median household income of $0, with 41 households (4.0%) in this group.
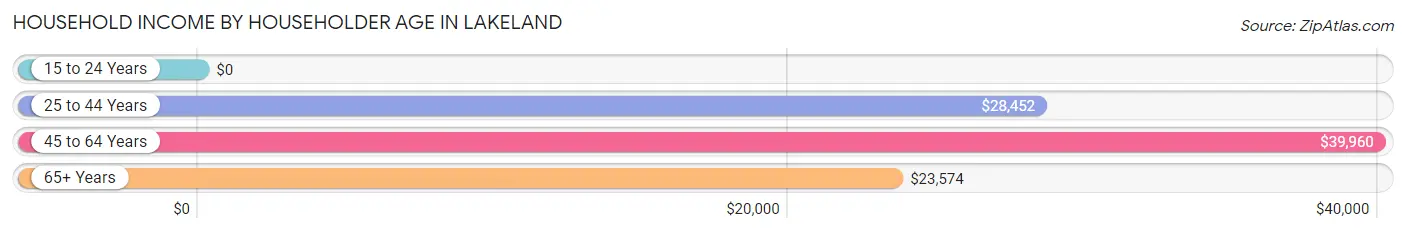
| Income Bracket | # Households | Median Income |
| 15 to 24 Years | 41 (4.0%) | $0 |
| 25 to 44 Years | 327 (32.2%) | $28,452 |
| 45 to 64 Years | 336 (33.0%) | $39,960 |
| 65+ Years | 313 (30.8%) | $23,574 |
| Total | 1,017 (100.0%) | $28,920 |
Poverty in Lakeland
Income Below Poverty by Sex and Age in Lakeland
With 46.3% poverty level for males and 45.9% for females among the residents of Lakeland, under 5 year old males and 6 to 11 year old females are the most vulnerable to poverty, with 89 males (100.0%) and 12 females (100.0%) in their respective age groups living below the poverty level.
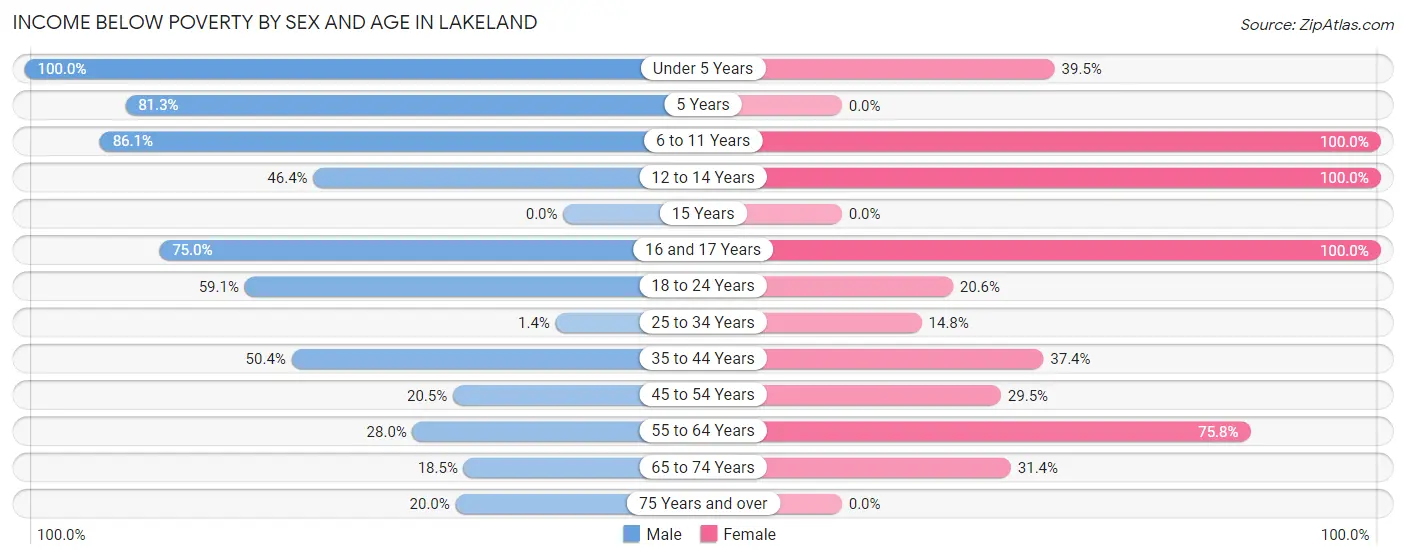
| Age Bracket | Male | Female |
| Under 5 Years | 89 (100.0%) | 32 (39.5%) |
| 5 Years | 74 (81.3%) | 0 (0.0%) |
| 6 to 11 Years | 74 (86.1%) | 12 (100.0%) |
| 12 to 14 Years | 45 (46.4%) | 53 (100.0%) |
| 15 Years | 0 (0.0%) | 0 (0.0%) |
| 16 and 17 Years | 45 (75.0%) | 107 (100.0%) |
| 18 to 24 Years | 207 (59.1%) | 20 (20.6%) |
| 25 to 34 Years | 2 (1.4%) | 4 (14.8%) |
| 35 to 44 Years | 59 (50.4%) | 107 (37.4%) |
| 45 to 54 Years | 26 (20.5%) | 44 (29.5%) |
| 55 to 64 Years | 33 (28.0%) | 94 (75.8%) |
| 65 to 74 Years | 27 (18.5%) | 59 (31.4%) |
| 75 Years and over | 17 (20.0%) | 0 (0.0%) |
| Total | 698 (46.3%) | 532 (45.9%) |
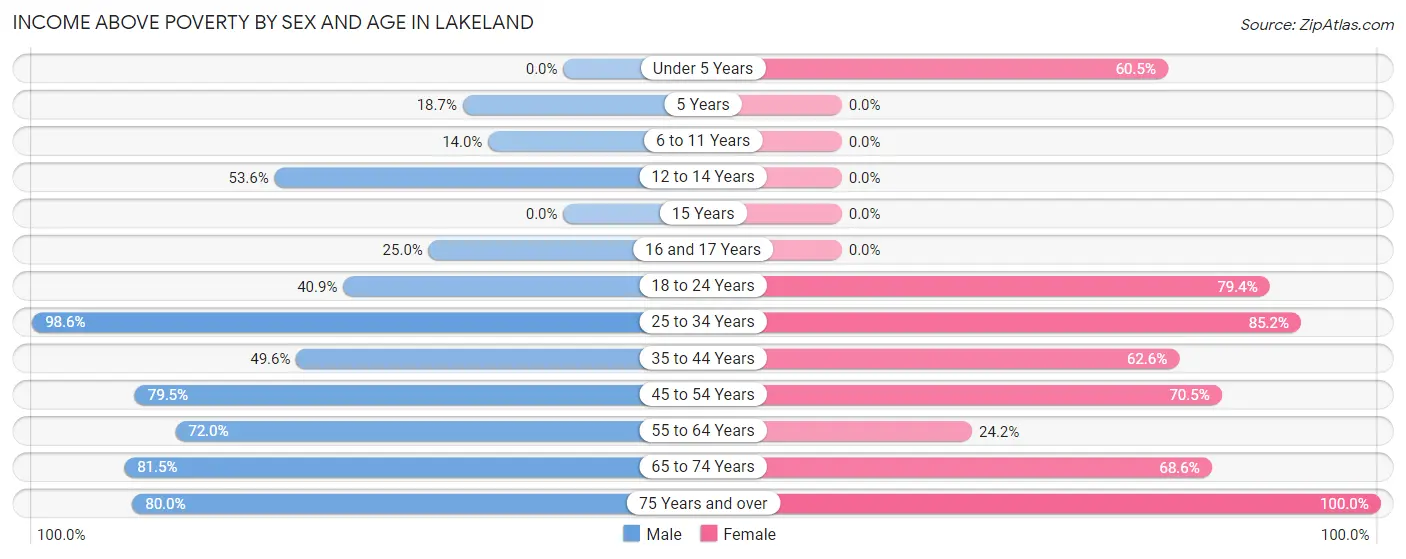
Income Above Poverty by Sex and Age in Lakeland
According to the poverty statistics in Lakeland, males aged 25 to 34 years and females aged 75 years and over are the age groups that are most secure financially, with 98.6% of males and 100.0% of females in these age groups living above the poverty line.
| Age Bracket | Male | Female |
| Under 5 Years | 0 (0.0%) | 49 (60.5%) |
| 5 Years | 17 (18.7%) | 0 (0.0%) |
| 6 to 11 Years | 12 (14.0%) | 0 (0.0%) |
| 12 to 14 Years | 52 (53.6%) | 0 (0.0%) |
| 15 Years | 0 (0.0%) | 0 (0.0%) |
| 16 and 17 Years | 15 (25.0%) | 0 (0.0%) |
| 18 to 24 Years | 143 (40.9%) | 77 (79.4%) |
| 25 to 34 Years | 139 (98.6%) | 23 (85.2%) |
| 35 to 44 Years | 58 (49.6%) | 179 (62.6%) |
| 45 to 54 Years | 101 (79.5%) | 105 (70.5%) |
| 55 to 64 Years | 85 (72.0%) | 30 (24.2%) |
| 65 to 74 Years | 119 (81.5%) | 129 (68.6%) |
| 75 Years and over | 68 (80.0%) | 35 (100.0%) |
| Total | 809 (53.7%) | 627 (54.1%) |
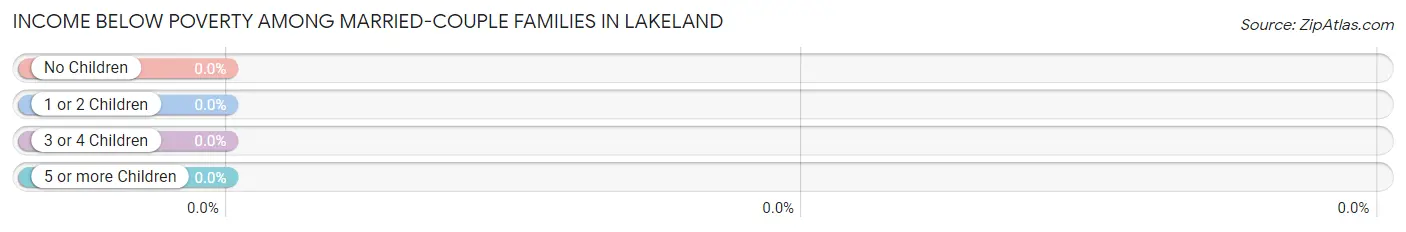
Income Below Poverty Among Married-Couple Families in Lakeland
| Children | Above Poverty | Below Poverty |
| No Children | 208 (100.0%) | 0 (0.0%) |
| 1 or 2 Children | 58 (100.0%) | 0 (0.0%) |
| 3 or 4 Children | 0 (0.0%) | 0 (0.0%) |
| 5 or more Children | 0 (0.0%) | 0 (0.0%) |
| Total | 266 (100.0%) | 0 (0.0%) |
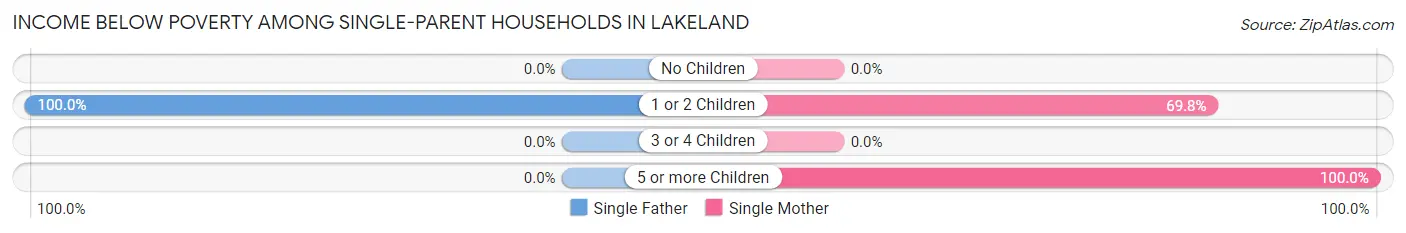
Income Below Poverty Among Single-Parent Households in Lakeland
According to the poverty data in Lakeland, 66.4% or 71 single-father households and 68.3% or 216 single-mother households are living below the poverty line. Among single-father households, those with 1 or 2 children have the highest poverty rate, with 71 households (100.0%) experiencing poverty. Likewise, among single-mother households, those with 5 or more children have the highest poverty rate, with 82 households (100.0%) falling below the poverty line.
| Children | Single Father | Single Mother |
| No Children | 0 (0.0%) | 0 (0.0%) |
| 1 or 2 Children | 71 (100.0%) | 134 (69.8%) |
| 3 or 4 Children | 0 (0.0%) | 0 (0.0%) |
| 5 or more Children | 0 (0.0%) | 82 (100.0%) |
| Total | 71 (66.4%) | 216 (68.3%) |
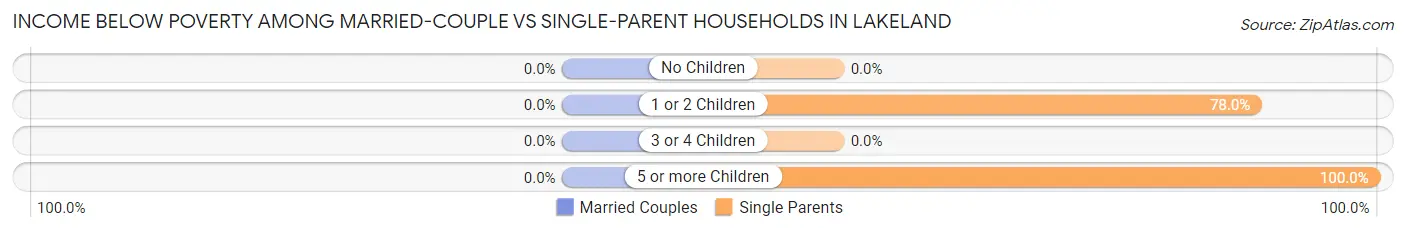
Income Below Poverty Among Married-Couple vs Single-Parent Households in Lakeland
| Children | Married-Couple Families | Single-Parent Households |
| No Children | 0 (0.0%) | 0 (0.0%) |
| 1 or 2 Children | 0 (0.0%) | 205 (77.9%) |
| 3 or 4 Children | 0 (0.0%) | 0 (0.0%) |
| 5 or more Children | 0 (0.0%) | 82 (100.0%) |
| Total | 0 (0.0%) | 287 (67.8%) |
Employment Characteristics in Lakeland
Employment by Class of Employer in Lakeland
Among the 901 employed individuals in Lakeland, private company employees (696 | 77.2%), state government employees (122 | 13.5%), and self-employed (not incorporated) (39 | 4.3%) make up the most common classes of employment.
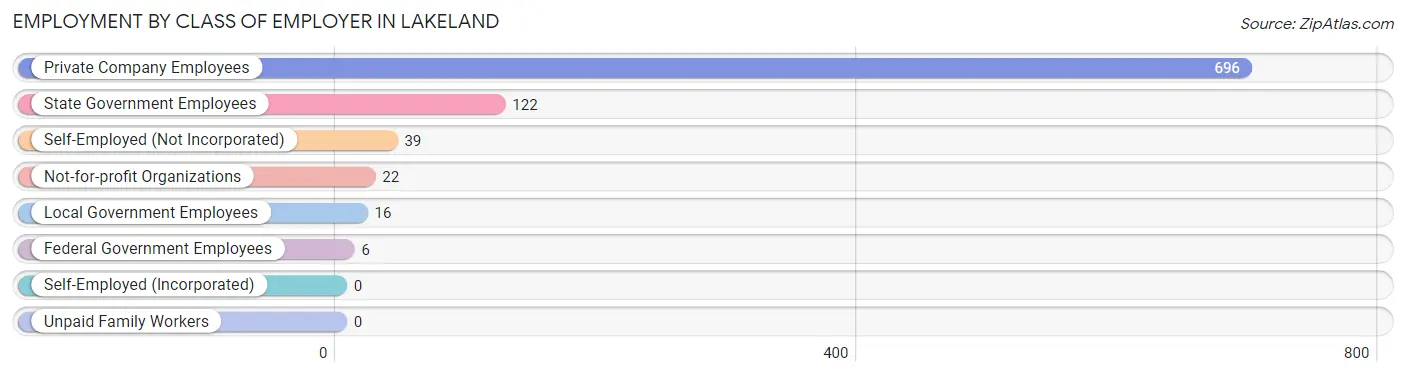
| Employer Class | # Employees | % Employees |
| Private Company Employees | 696 | 77.2% |
| Self-Employed (Incorporated) | 0 | 0.0% |
| Self-Employed (Not Incorporated) | 39 | 4.3% |
| Not-for-profit Organizations | 22 | 2.4% |
| Local Government Employees | 16 | 1.8% |
| State Government Employees | 122 | 13.5% |
| Federal Government Employees | 6 | 0.7% |
| Unpaid Family Workers | 0 | 0.0% |
| Total | 901 | 100.0% |
Employment Status by Age in Lakeland
According to the labor force statistics for Lakeland, out of the total population over 16 years of age (2,419), 37.5% or 907 individuals are in the labor force, with 0.1% or 1 of them unemployed. The age group with the highest labor force participation rate is 60 to 64 years, with 96.5% or 83 individuals in the labor force. Within the labor force, the 45 to 54 years age range has the highest percentage of unemployed individuals, with 0.5% or 1 of them being unemployed.
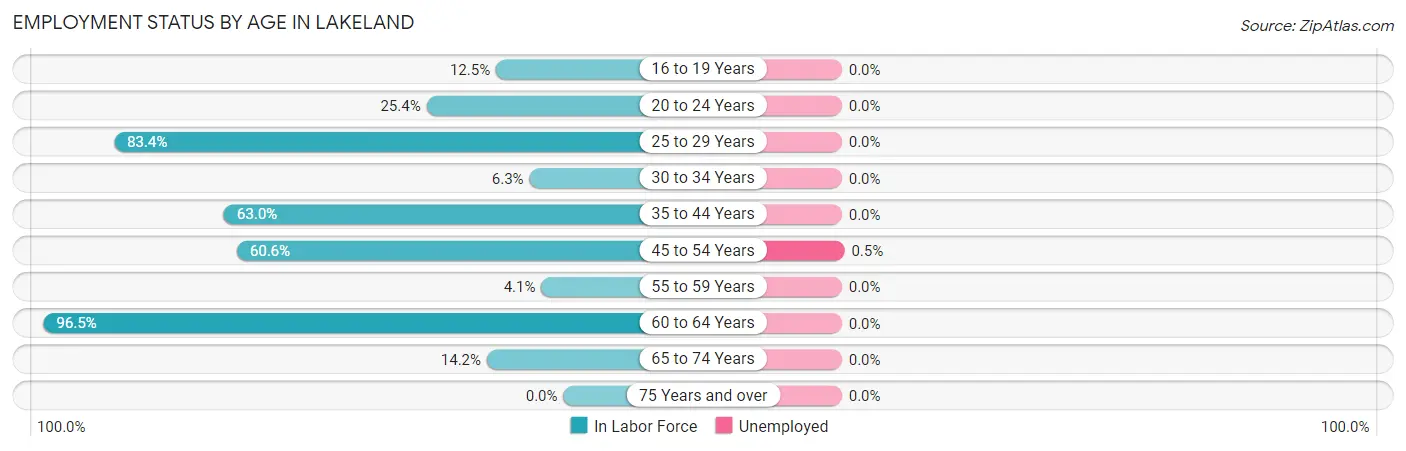
| Age Bracket | In Labor Force | Unemployed |
| 16 to 19 Years | 51 (12.5%) | 0 (0.0%) |
| 20 to 24 Years | 58 (25.4%) | 0 (0.0%) |
| 25 to 29 Years | 166 (83.4%) | 0 (0.0%) |
| 30 to 34 Years | 2 (6.3%) | 0 (0.0%) |
| 35 to 44 Years | 301 (63.0%) | 0 (0.0%) |
| 45 to 54 Years | 188 (60.6%) | 1 (0.5%) |
| 55 to 59 Years | 7 (4.1%) | 0 (0.0%) |
| 60 to 64 Years | 83 (96.5%) | 0 (0.0%) |
| 65 to 74 Years | 50 (14.2%) | 0 (0.0%) |
| 75 Years and over | 0 (0.0%) | 0 (0.0%) |
| Total | 907 (37.5%) | 1 (0.1%) |
Employment Status by Educational Attainment in Lakeland
According to labor force statistics for Lakeland, 58.6% of individuals (747) out of the total population between 25 and 64 years of age (1,275) are in the labor force, with 0.1% or 1 of them being unemployed. The group with the highest labor force participation rate are those with the educational attainment of college / associate degree, with 90.7% or 294 individuals in the labor force. Within the labor force, individuals with college / associate degree education have the highest percentage of unemployment, with 0.3% or 1 of them being unemployed.
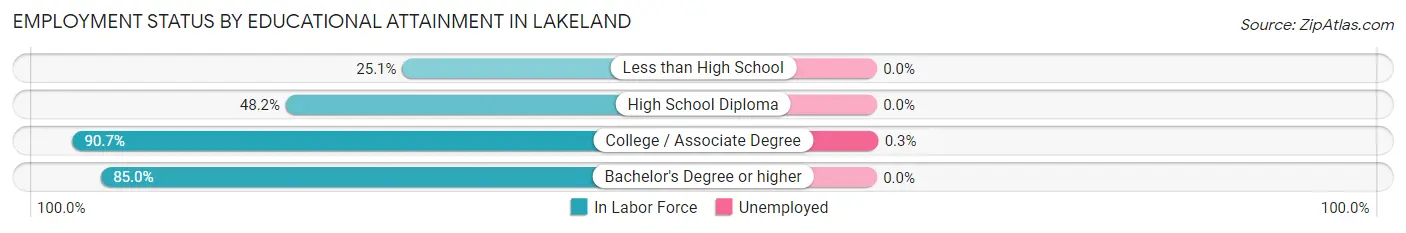
| Educational Attainment | In Labor Force | Unemployed |
| Less than High School | 54 (25.1%) | 0 (0.0%) |
| High School Diploma | 297 (48.2%) | 0 (0.0%) |
| College / Associate Degree | 294 (90.7%) | 1 (0.3%) |
| Bachelor's Degree or higher | 102 (85.0%) | 0 (0.0%) |
| Total | 747 (58.6%) | 1 (0.1%) |
Employment Occupations by Sex in Lakeland
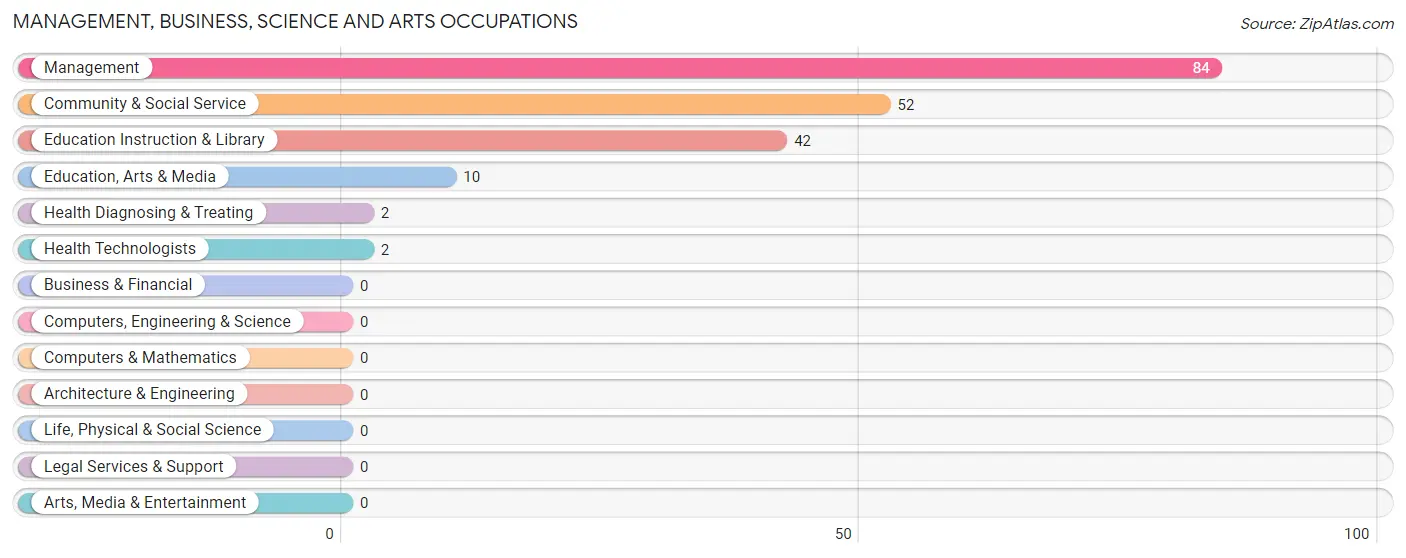
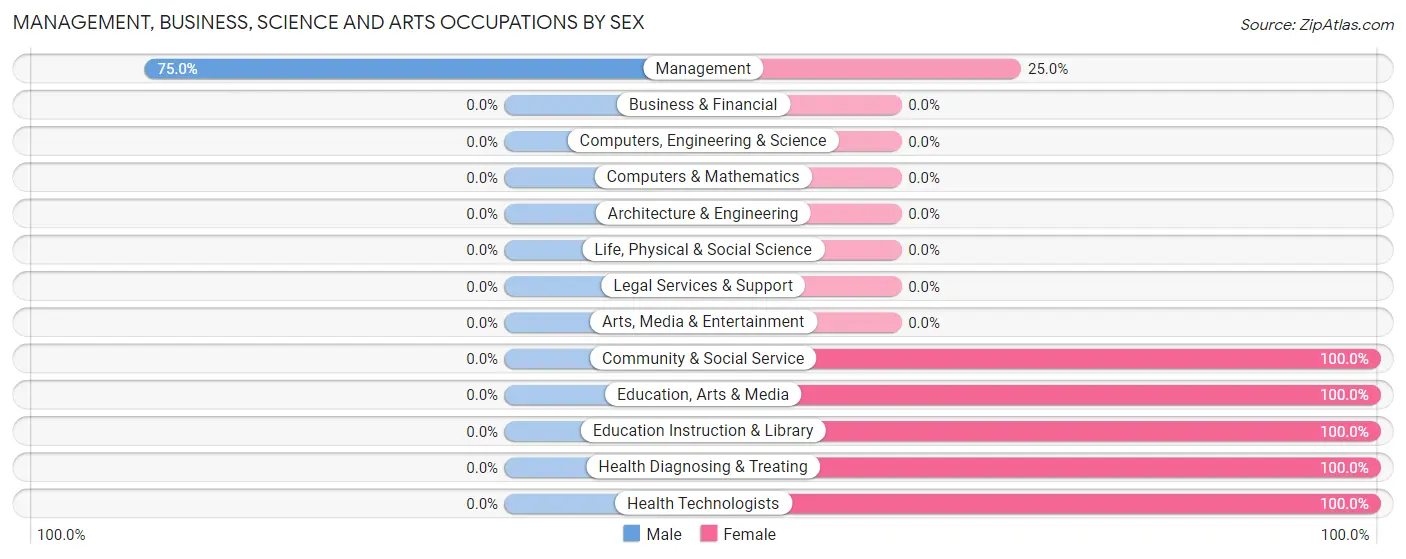
Management, Business, Science and Arts Occupations
The most common Management, Business, Science and Arts occupations in Lakeland are Management (84 | 9.3%), Community & Social Service (52 | 5.8%), Education Instruction & Library (42 | 4.6%), Education, Arts & Media (10 | 1.1%), and Health Diagnosing & Treating (2 | 0.2%).
Management, Business, Science and Arts Occupations by Sex
| Occupation | Male | Female |
| Management | 63 (75.0%) | 21 (25.0%) |
| Business & Financial | 0 (0.0%) | 0 (0.0%) |
| Computers, Engineering & Science | 0 (0.0%) | 0 (0.0%) |
| Computers & Mathematics | 0 (0.0%) | 0 (0.0%) |
| Architecture & Engineering | 0 (0.0%) | 0 (0.0%) |
| Life, Physical & Social Science | 0 (0.0%) | 0 (0.0%) |
| Community & Social Service | 0 (0.0%) | 52 (100.0%) |
| Education, Arts & Media | 0 (0.0%) | 10 (100.0%) |
| Legal Services & Support | 0 (0.0%) | 0 (0.0%) |
| Education Instruction & Library | 0 (0.0%) | 42 (100.0%) |
| Arts, Media & Entertainment | 0 (0.0%) | 0 (0.0%) |
| Health Diagnosing & Treating | 0 (0.0%) | 2 (100.0%) |
| Health Technologists | 0 (0.0%) | 2 (100.0%) |
| Total (Category) | 63 (45.7%) | 75 (54.3%) |
| Total (Overall) | 446 (49.3%) | 459 (50.7%) |
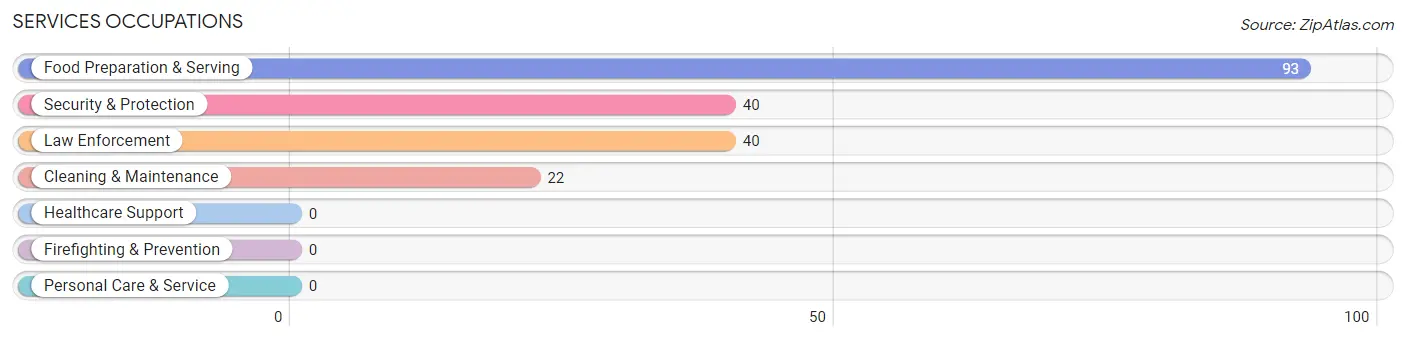
Services Occupations
The most common Services occupations in Lakeland are Food Preparation & Serving (93 | 10.3%), Security & Protection (40 | 4.4%), Law Enforcement (40 | 4.4%), and Cleaning & Maintenance (22 | 2.4%).
Services Occupations by Sex
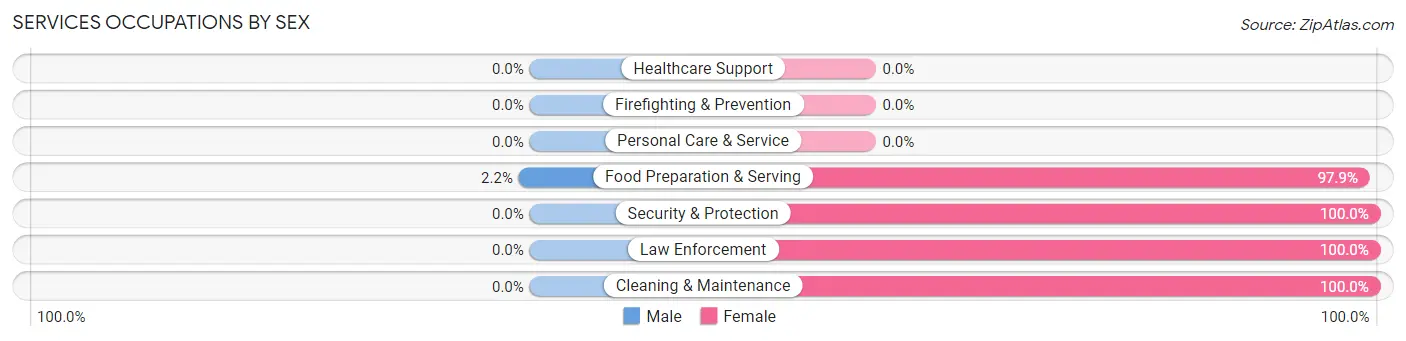
| Occupation | Male | Female |
| Healthcare Support | 0 (0.0%) | 0 (0.0%) |
| Security & Protection | 0 (0.0%) | 40 (100.0%) |
| Firefighting & Prevention | 0 (0.0%) | 0 (0.0%) |
| Law Enforcement | 0 (0.0%) | 40 (100.0%) |
| Food Preparation & Serving | 2 (2.1%) | 91 (97.9%) |
| Cleaning & Maintenance | 0 (0.0%) | 22 (100.0%) |
| Personal Care & Service | 0 (0.0%) | 0 (0.0%) |
| Total (Category) | 2 (1.3%) | 153 (98.7%) |
| Total (Overall) | 446 (49.3%) | 459 (50.7%) |
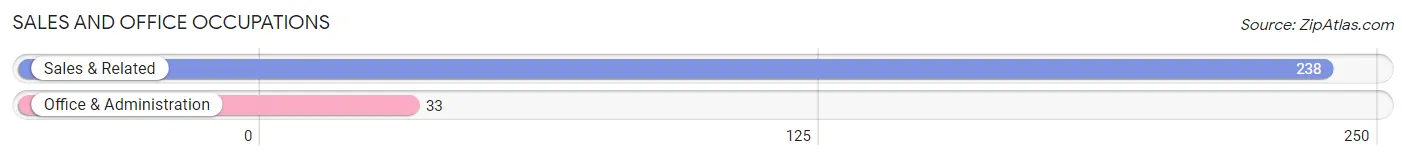
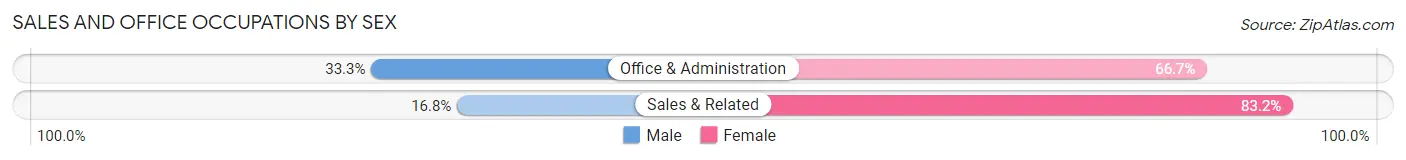
Sales and Office Occupations
The most common Sales and Office occupations in Lakeland are Sales & Related (238 | 26.3%), and Office & Administration (33 | 3.6%).
Sales and Office Occupations by Sex
| Occupation | Male | Female |
| Sales & Related | 40 (16.8%) | 198 (83.2%) |
| Office & Administration | 11 (33.3%) | 22 (66.7%) |
| Total (Category) | 51 (18.8%) | 220 (81.2%) |
| Total (Overall) | 446 (49.3%) | 459 (50.7%) |
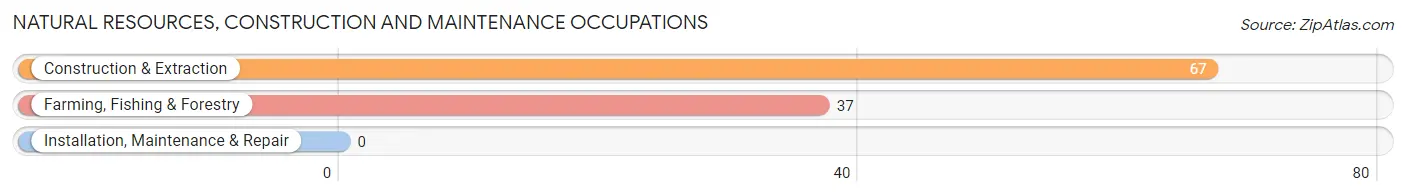
Natural Resources, Construction and Maintenance Occupations
The most common Natural Resources, Construction and Maintenance occupations in Lakeland are Construction & Extraction (67 | 7.4%), and Farming, Fishing & Forestry (37 | 4.1%).
Natural Resources, Construction and Maintenance Occupations by Sex
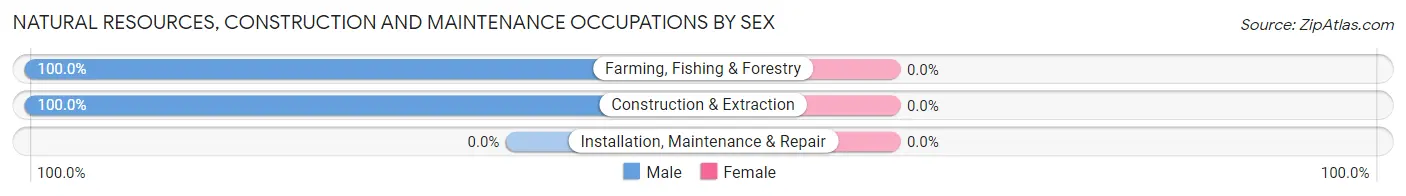
| Occupation | Male | Female |
| Farming, Fishing & Forestry | 37 (100.0%) | 0 (0.0%) |
| Construction & Extraction | 67 (100.0%) | 0 (0.0%) |
| Installation, Maintenance & Repair | 0 (0.0%) | 0 (0.0%) |
| Total (Category) | 104 (100.0%) | 0 (0.0%) |
| Total (Overall) | 446 (49.3%) | 459 (50.7%) |
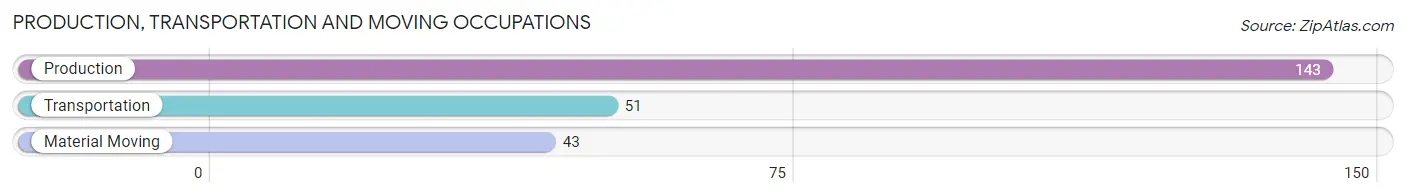
Production, Transportation and Moving Occupations
The most common Production, Transportation and Moving occupations in Lakeland are Production (143 | 15.8%), Transportation (51 | 5.6%), and Material Moving (43 | 4.8%).
Production, Transportation and Moving Occupations by Sex
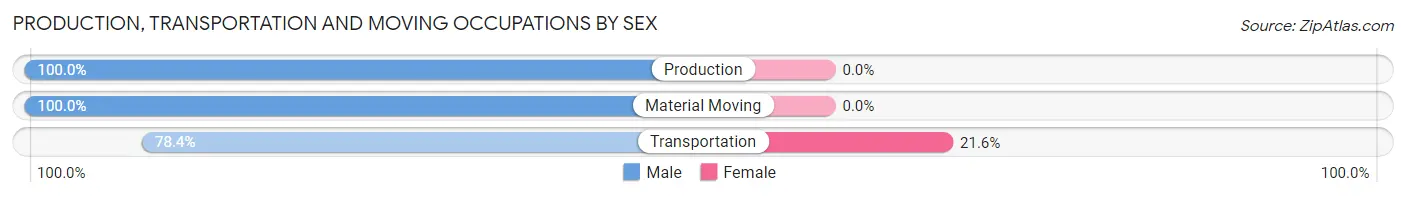
| Occupation | Male | Female |
| Production | 143 (100.0%) | 0 (0.0%) |
| Transportation | 40 (78.4%) | 11 (21.6%) |
| Material Moving | 43 (100.0%) | 0 (0.0%) |
| Total (Category) | 226 (95.4%) | 11 (4.6%) |
| Total (Overall) | 446 (49.3%) | 459 (50.7%) |
Employment Industries by Sex in Lakeland
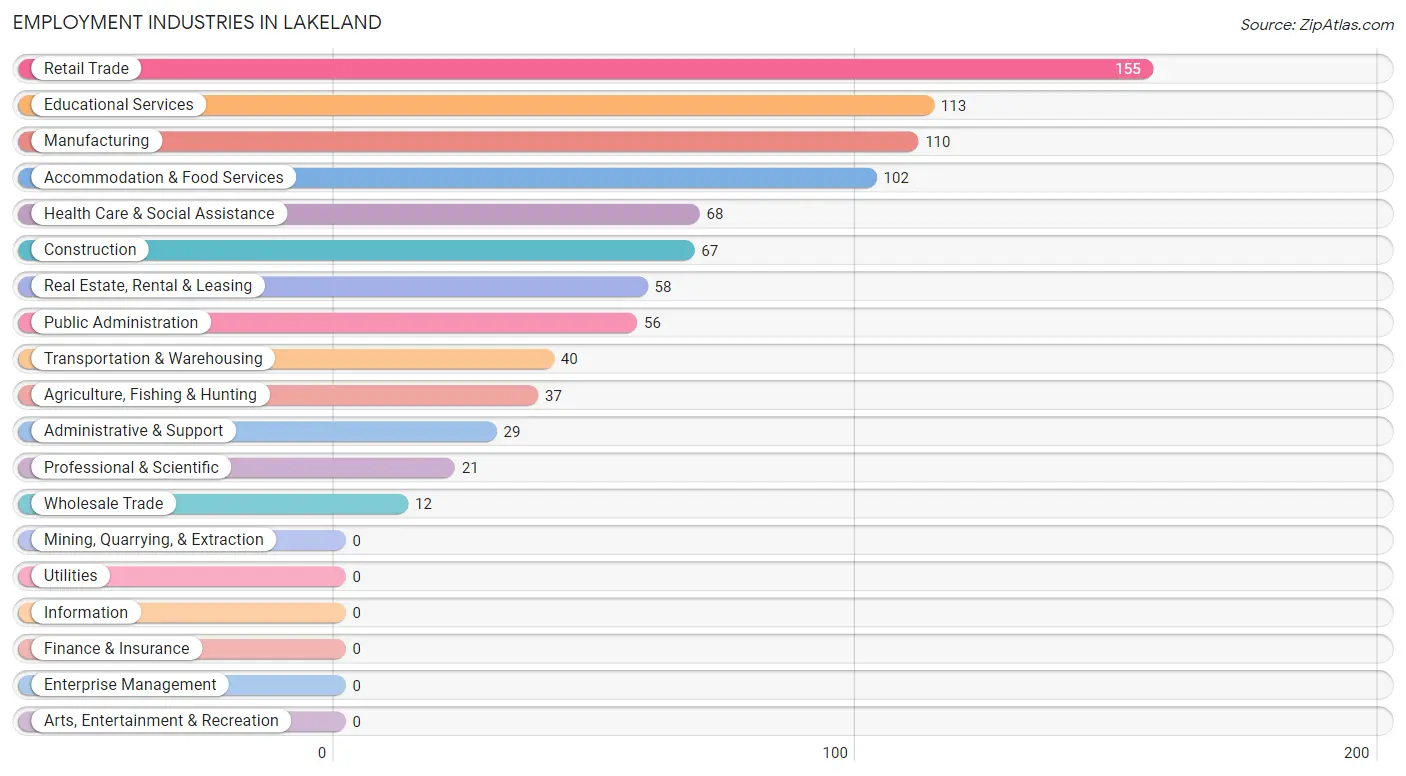
Employment Industries in Lakeland
The major employment industries in Lakeland include Retail Trade (155 | 17.1%), Educational Services (113 | 12.5%), Manufacturing (110 | 12.1%), Accommodation & Food Services (102 | 11.3%), and Health Care & Social Assistance (68 | 7.5%).
Employment Industries by Sex in Lakeland
The Lakeland industries that see more men than women are Agriculture, Fishing & Hunting (100.0%), Construction (100.0%), and Manufacturing (100.0%), whereas the industries that tend to have a higher number of women are Professional & Scientific (100.0%), Educational Services (100.0%), and Accommodation & Food Services (100.0%).
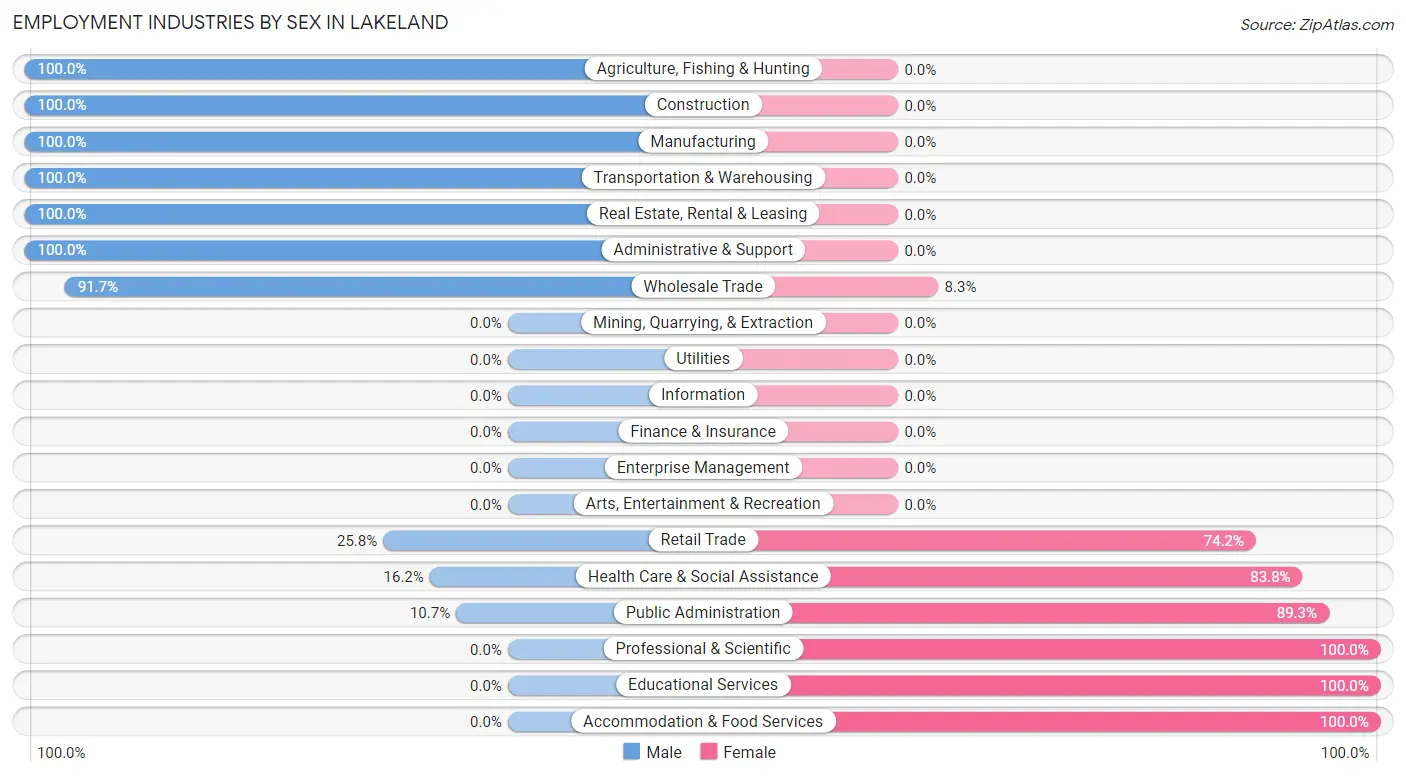
| Industry | Male | Female |
| Agriculture, Fishing & Hunting | 37 (100.0%) | 0 (0.0%) |
| Mining, Quarrying, & Extraction | 0 (0.0%) | 0 (0.0%) |
| Construction | 67 (100.0%) | 0 (0.0%) |
| Manufacturing | 110 (100.0%) | 0 (0.0%) |
| Wholesale Trade | 11 (91.7%) | 1 (8.3%) |
| Retail Trade | 40 (25.8%) | 115 (74.2%) |
| Transportation & Warehousing | 40 (100.0%) | 0 (0.0%) |
| Utilities | 0 (0.0%) | 0 (0.0%) |
| Information | 0 (0.0%) | 0 (0.0%) |
| Finance & Insurance | 0 (0.0%) | 0 (0.0%) |
| Real Estate, Rental & Leasing | 58 (100.0%) | 0 (0.0%) |
| Professional & Scientific | 0 (0.0%) | 21 (100.0%) |
| Enterprise Management | 0 (0.0%) | 0 (0.0%) |
| Administrative & Support | 29 (100.0%) | 0 (0.0%) |
| Educational Services | 0 (0.0%) | 113 (100.0%) |
| Health Care & Social Assistance | 11 (16.2%) | 57 (83.8%) |
| Arts, Entertainment & Recreation | 0 (0.0%) | 0 (0.0%) |
| Accommodation & Food Services | 0 (0.0%) | 102 (100.0%) |
| Public Administration | 6 (10.7%) | 50 (89.3%) |
| Total | 446 (49.3%) | 459 (50.7%) |
Education in Lakeland
School Enrollment in Lakeland
The most common levels of schooling among the 810 students in Lakeland are high school (312 | 38.5%), middle school (227 | 28.0%), and college / undergraduate (136 | 16.8%).
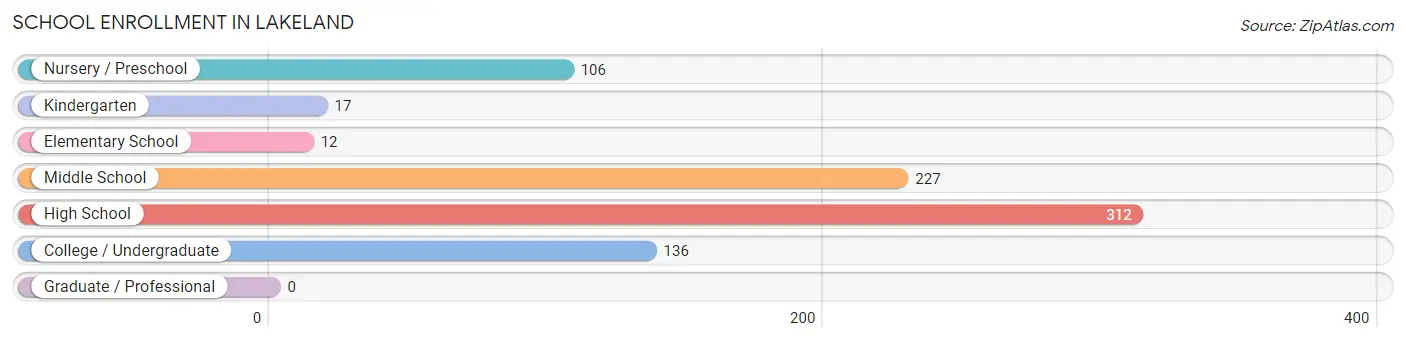
| School Level | # Students | % Students |
| Nursery / Preschool | 106 | 13.1% |
| Kindergarten | 17 | 2.1% |
| Elementary School | 12 | 1.5% |
| Middle School | 227 | 28.0% |
| High School | 312 | 38.5% |
| College / Undergraduate | 136 | 16.8% |
| Graduate / Professional | 0 | 0.0% |
| Total | 810 | 100.0% |
School Enrollment by Age by Funding Source in Lakeland
Out of a total of 810 students who are enrolled in schools in Lakeland, 17 (2.1%) attend a private institution, while the remaining 793 (97.9%) are enrolled in public schools. The age group of 15 to 17 year olds has the highest likelihood of being enrolled in private schools, with 15 (12.3% in the age bracket) enrolled. Conversely, the age group of 3 to 4 year olds has the lowest likelihood of being enrolled in a private school, with 32 (100.0% in the age bracket) attending a public institution.
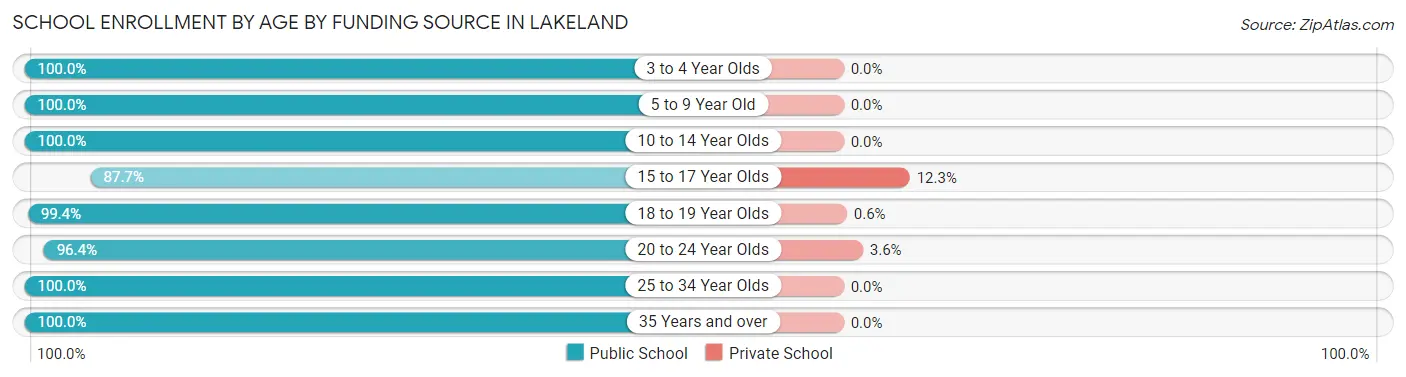
| Age Bracket | Public School | Private School |
| 3 to 4 Year Olds | 32 (100.0%) | 0 (0.0%) |
| 5 to 9 Year Old | 96 (100.0%) | 0 (0.0%) |
| 10 to 14 Year Olds | 243 (100.0%) | 0 (0.0%) |
| 15 to 17 Year Olds | 107 (87.7%) | 15 (12.3%) |
| 18 to 19 Year Olds | 165 (99.4%) | 1 (0.6%) |
| 20 to 24 Year Olds | 27 (96.4%) | 1 (3.6%) |
| 25 to 34 Year Olds | 109 (100.0%) | 0 (0.0%) |
| 35 Years and over | 14 (100.0%) | 0 (0.0%) |
| Total | 793 (97.9%) | 17 (2.1%) |
Educational Attainment by Field of Study in Lakeland
Business (140 | 71.8%), education (28 | 14.4%), psychology (10 | 5.1%), engineering (7 | 3.6%), and arts & humanities (7 | 3.6%) are the most common fields of study among 195 individuals in Lakeland who have obtained a bachelor's degree or higher.
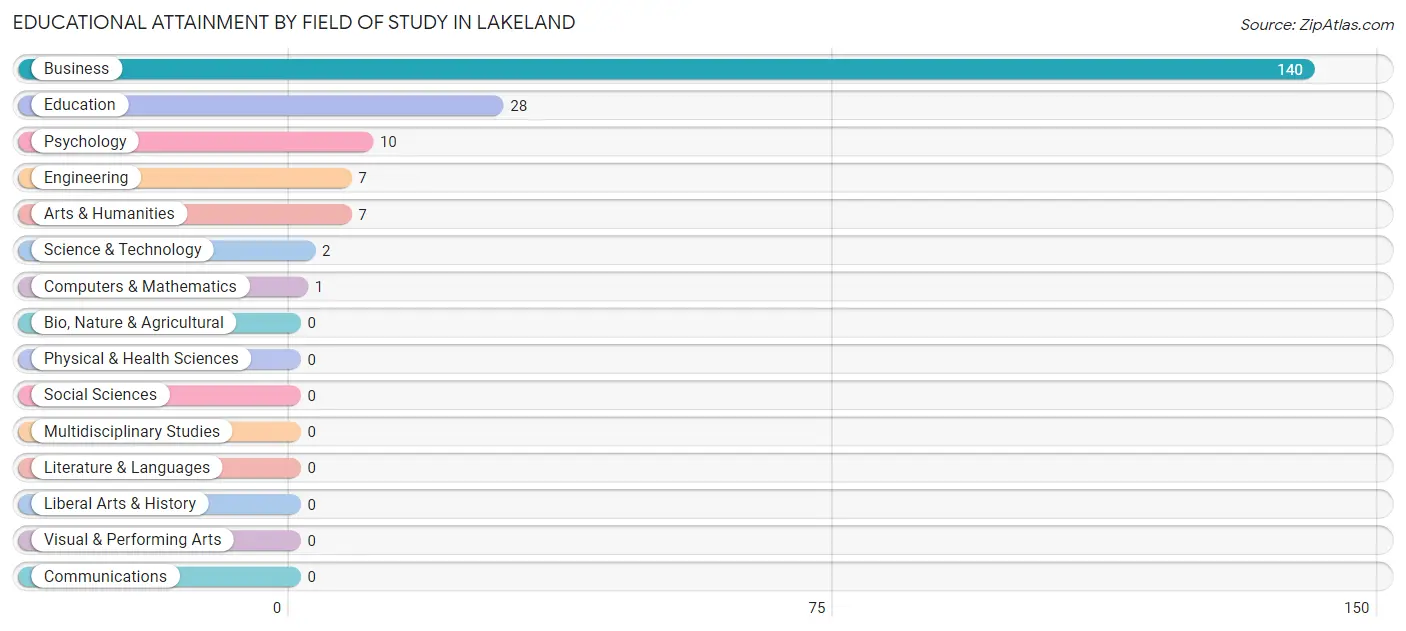
| Field of Study | # Graduates | % Graduates |
| Computers & Mathematics | 1 | 0.5% |
| Bio, Nature & Agricultural | 0 | 0.0% |
| Physical & Health Sciences | 0 | 0.0% |
| Psychology | 10 | 5.1% |
| Social Sciences | 0 | 0.0% |
| Engineering | 7 | 3.6% |
| Multidisciplinary Studies | 0 | 0.0% |
| Science & Technology | 2 | 1.0% |
| Business | 140 | 71.8% |
| Education | 28 | 14.4% |
| Literature & Languages | 0 | 0.0% |
| Liberal Arts & History | 0 | 0.0% |
| Visual & Performing Arts | 0 | 0.0% |
| Communications | 0 | 0.0% |
| Arts & Humanities | 7 | 3.6% |
| Total | 195 | 100.0% |
Transportation & Commute in Lakeland
Vehicle Availability by Sex in Lakeland
The most prevalent vehicle ownership categories in Lakeland are males with 2 vehicles (149, accounting for 33.6%) and females with 2 vehicles (215, making up 32.8%).
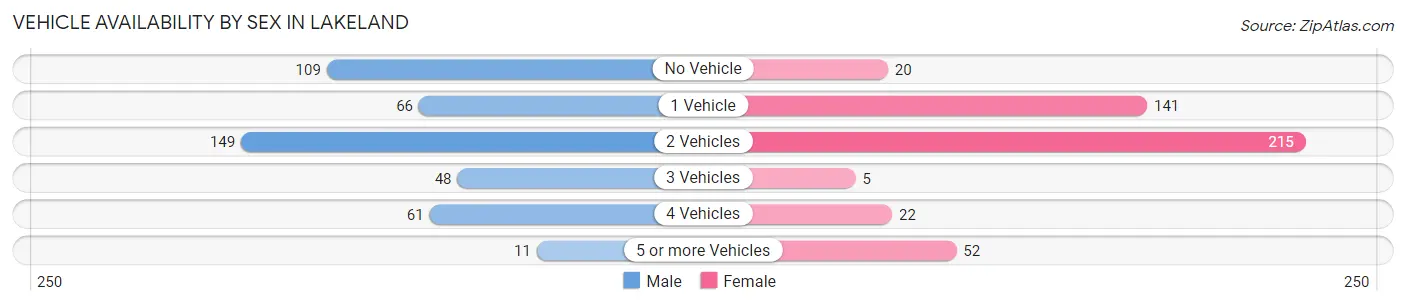
| Vehicles Available | Male | Female |
| No Vehicle | 109 (24.5%) | 20 (4.4%) |
| 1 Vehicle | 66 (14.9%) | 141 (31.0%) |
| 2 Vehicles | 149 (33.6%) | 215 (47.2%) |
| 3 Vehicles | 48 (10.8%) | 5 (1.1%) |
| 4 Vehicles | 61 (13.7%) | 22 (4.8%) |
| 5 or more Vehicles | 11 (2.5%) | 52 (11.4%) |
| Total | 444 (100.0%) | 455 (100.0%) |
Commute Time in Lakeland
The most frequently occuring commute durations in Lakeland are 5 to 9 minutes (389 commuters, 48.5%), 30 to 34 minutes (264 commuters, 32.9%), and 10 to 14 minutes (58 commuters, 7.2%).
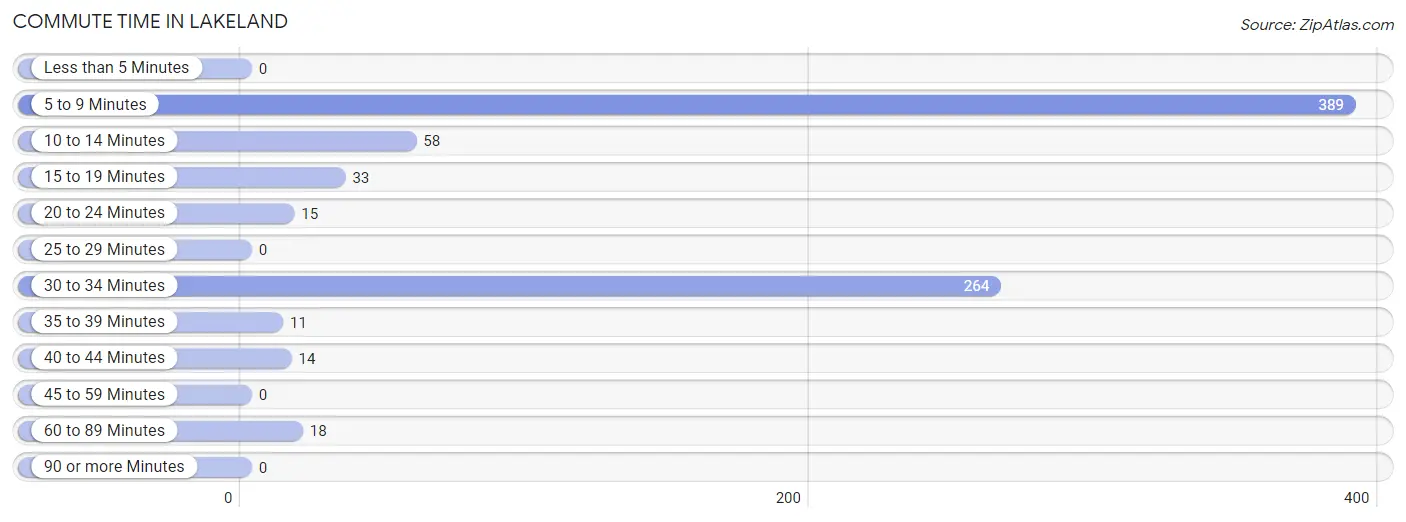
| Commute Time | # Commuters | % Commuters |
| Less than 5 Minutes | 0 | 0.0% |
| 5 to 9 Minutes | 389 | 48.5% |
| 10 to 14 Minutes | 58 | 7.2% |
| 15 to 19 Minutes | 33 | 4.1% |
| 20 to 24 Minutes | 15 | 1.9% |
| 25 to 29 Minutes | 0 | 0.0% |
| 30 to 34 Minutes | 264 | 32.9% |
| 35 to 39 Minutes | 11 | 1.4% |
| 40 to 44 Minutes | 14 | 1.8% |
| 45 to 59 Minutes | 0 | 0.0% |
| 60 to 89 Minutes | 18 | 2.2% |
| 90 or more Minutes | 0 | 0.0% |
Commute Time by Sex in Lakeland
The most common commute times in Lakeland are 5 to 9 minutes (160 commuters, 46.1%) for males and 5 to 9 minutes (229 commuters, 50.3%) for females.
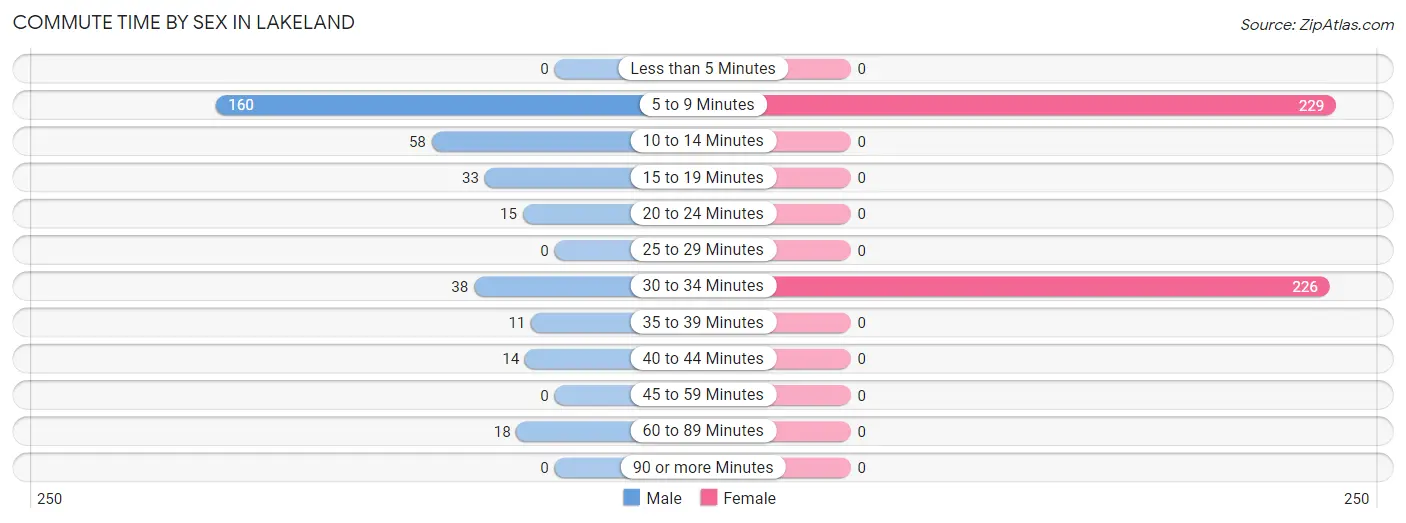
| Commute Time | Male | Female |
| Less than 5 Minutes | 0 (0.0%) | 0 (0.0%) |
| 5 to 9 Minutes | 160 (46.1%) | 229 (50.3%) |
| 10 to 14 Minutes | 58 (16.7%) | 0 (0.0%) |
| 15 to 19 Minutes | 33 (9.5%) | 0 (0.0%) |
| 20 to 24 Minutes | 15 (4.3%) | 0 (0.0%) |
| 25 to 29 Minutes | 0 (0.0%) | 0 (0.0%) |
| 30 to 34 Minutes | 38 (11.0%) | 226 (49.7%) |
| 35 to 39 Minutes | 11 (3.2%) | 0 (0.0%) |
| 40 to 44 Minutes | 14 (4.0%) | 0 (0.0%) |
| 45 to 59 Minutes | 0 (0.0%) | 0 (0.0%) |
| 60 to 89 Minutes | 18 (5.2%) | 0 (0.0%) |
| 90 or more Minutes | 0 (0.0%) | 0 (0.0%) |
Time of Departure to Work by Sex in Lakeland
The most frequent times of departure to work in Lakeland are 8:00 AM to 8:29 AM (164, 47.3%) for males and 7:00 AM to 7:29 AM (108, 23.7%) for females.
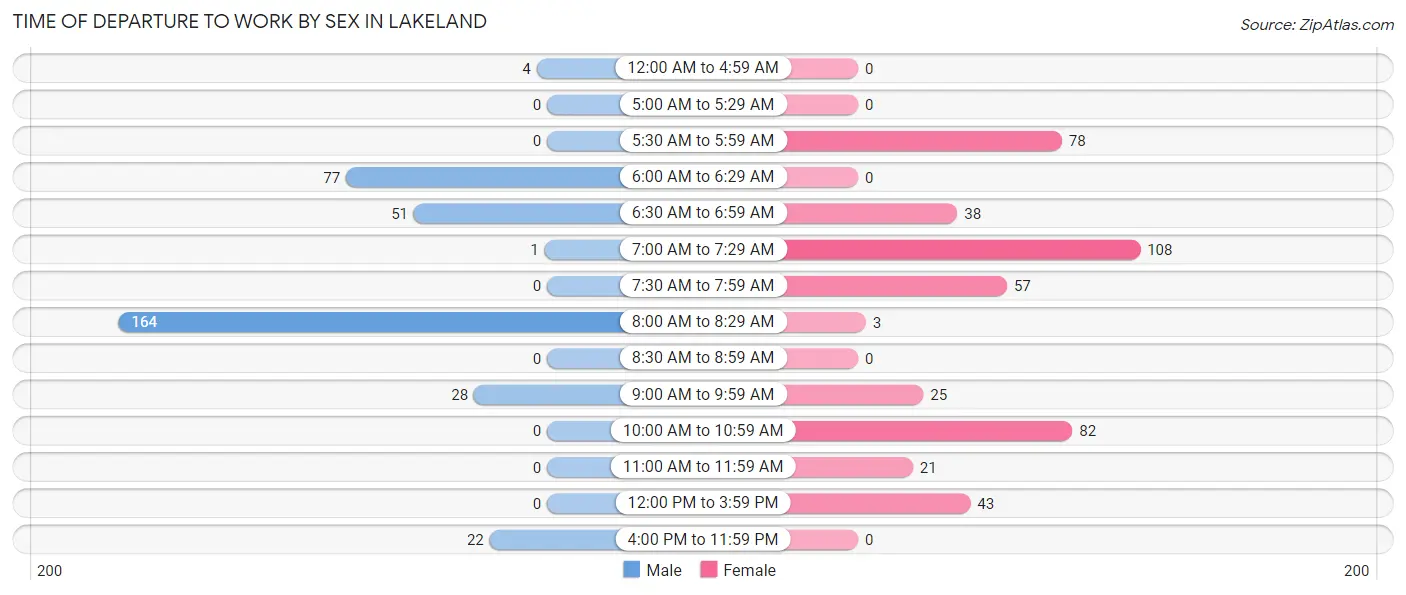
| Time of Departure | Male | Female |
| 12:00 AM to 4:59 AM | 4 (1.1%) | 0 (0.0%) |
| 5:00 AM to 5:29 AM | 0 (0.0%) | 0 (0.0%) |
| 5:30 AM to 5:59 AM | 0 (0.0%) | 78 (17.1%) |
| 6:00 AM to 6:29 AM | 77 (22.2%) | 0 (0.0%) |
| 6:30 AM to 6:59 AM | 51 (14.7%) | 38 (8.4%) |
| 7:00 AM to 7:29 AM | 1 (0.3%) | 108 (23.7%) |
| 7:30 AM to 7:59 AM | 0 (0.0%) | 57 (12.5%) |
| 8:00 AM to 8:29 AM | 164 (47.3%) | 3 (0.7%) |
| 8:30 AM to 8:59 AM | 0 (0.0%) | 0 (0.0%) |
| 9:00 AM to 9:59 AM | 28 (8.1%) | 25 (5.5%) |
| 10:00 AM to 10:59 AM | 0 (0.0%) | 82 (18.0%) |
| 11:00 AM to 11:59 AM | 0 (0.0%) | 21 (4.6%) |
| 12:00 PM to 3:59 PM | 0 (0.0%) | 43 (9.5%) |
| 4:00 PM to 11:59 PM | 22 (6.3%) | 0 (0.0%) |
| Total | 347 (100.0%) | 455 (100.0%) |
Housing Occupancy in Lakeland
Occupancy by Ownership in Lakeland
Of the total 1,017 dwellings in Lakeland, owner-occupied units account for 413 (40.6%), while renter-occupied units make up 604 (59.4%).
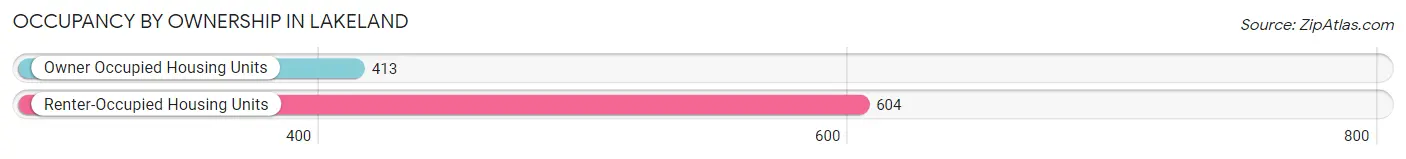
| Occupancy | # Housing Units | % Housing Units |
| Owner Occupied Housing Units | 413 | 40.6% |
| Renter-Occupied Housing Units | 604 | 59.4% |
| Total Occupied Housing Units | 1,017 | 100.0% |
Occupancy by Household Size in Lakeland
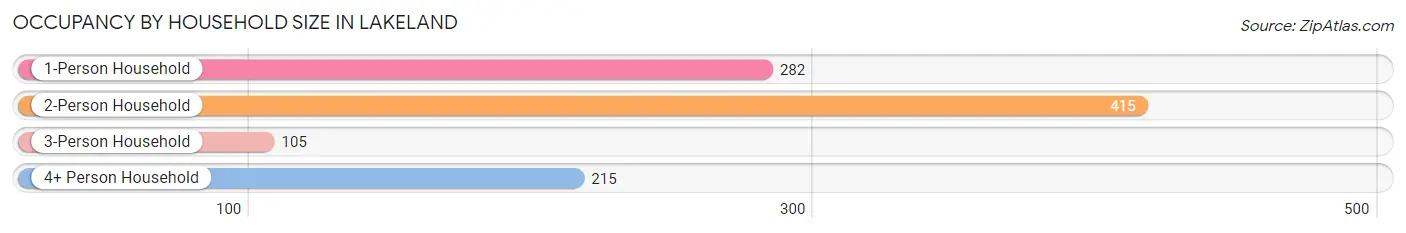
| Household Size | # Housing Units | % Housing Units |
| 1-Person Household | 282 | 27.7% |
| 2-Person Household | 415 | 40.8% |
| 3-Person Household | 105 | 10.3% |
| 4+ Person Household | 215 | 21.1% |
| Total Housing Units | 1,017 | 100.0% |
Occupancy by Ownership by Household Size in Lakeland
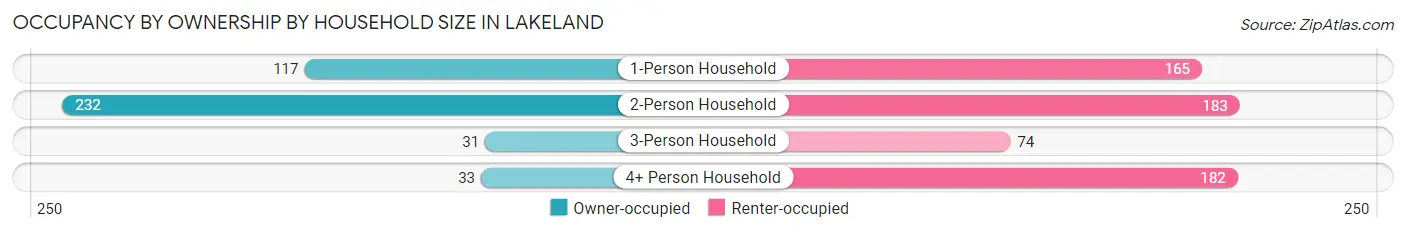
| Household Size | Owner-occupied | Renter-occupied |
| 1-Person Household | 117 (41.5%) | 165 (58.5%) |
| 2-Person Household | 232 (55.9%) | 183 (44.1%) |
| 3-Person Household | 31 (29.5%) | 74 (70.5%) |
| 4+ Person Household | 33 (15.3%) | 182 (84.7%) |
| Total Housing Units | 413 (40.6%) | 604 (59.4%) |
Occupancy by Educational Attainment in Lakeland
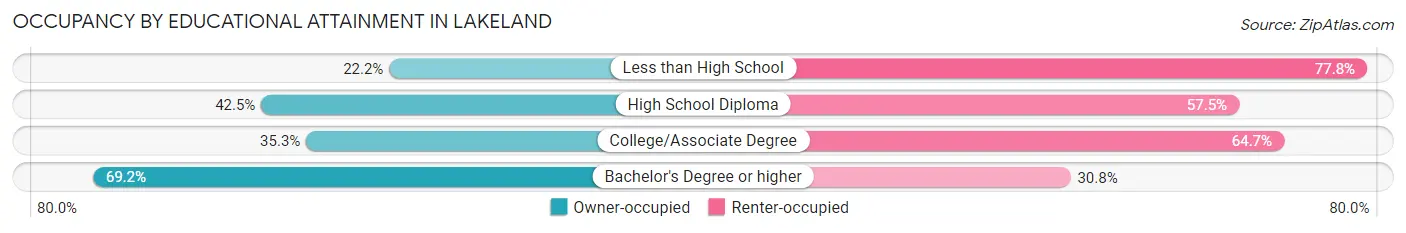
| Household Size | Owner-occupied | Renter-occupied |
| Less than High School | 45 (22.2%) | 158 (77.8%) |
| High School Diploma | 158 (42.5%) | 214 (57.5%) |
| College/Associate Degree | 100 (35.3%) | 183 (64.7%) |
| Bachelor's Degree or higher | 110 (69.2%) | 49 (30.8%) |
Occupancy by Age of Householder in Lakeland
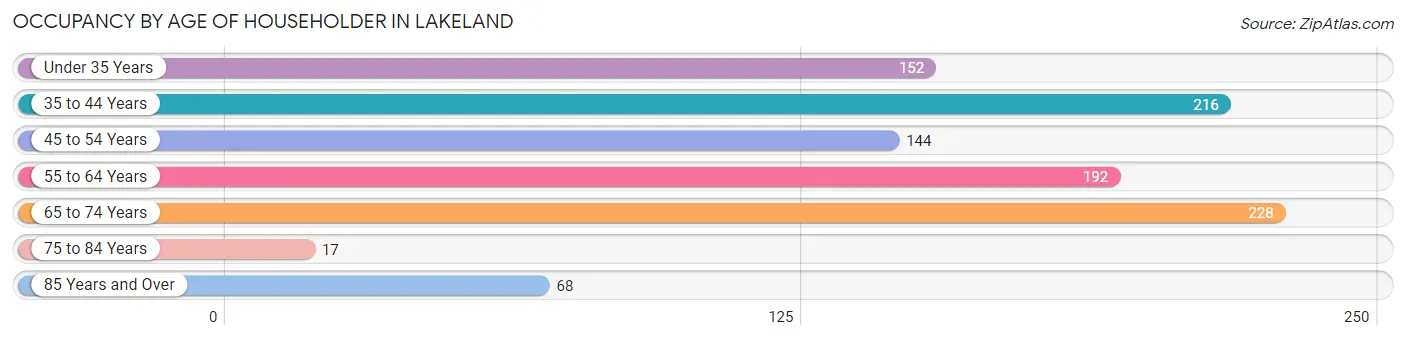
| Age Bracket | # Households | % Households |
| Under 35 Years | 152 | 14.9% |
| 35 to 44 Years | 216 | 21.2% |
| 45 to 54 Years | 144 | 14.2% |
| 55 to 64 Years | 192 | 18.9% |
| 65 to 74 Years | 228 | 22.4% |
| 75 to 84 Years | 17 | 1.7% |
| 85 Years and Over | 68 | 6.7% |
| Total | 1,017 | 100.0% |
Housing Finances in Lakeland
Median Income by Occupancy in Lakeland
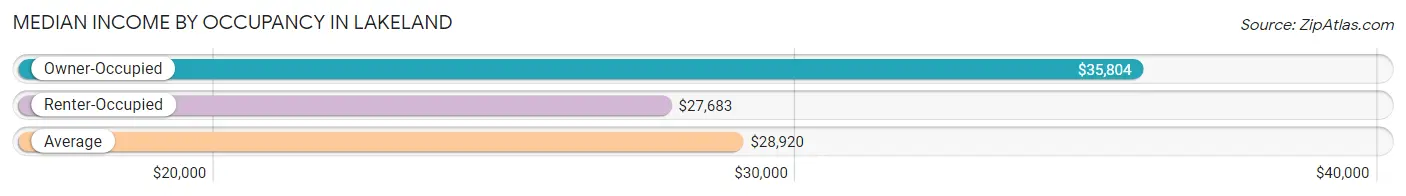
| Occupancy Type | # Households | Median Income |
| Owner-Occupied | 413 (40.6%) | $35,804 |
| Renter-Occupied | 604 (59.4%) | $27,683 |
| Average | 1,017 (100.0%) | $28,920 |
Occupancy by Householder Income Bracket in Lakeland
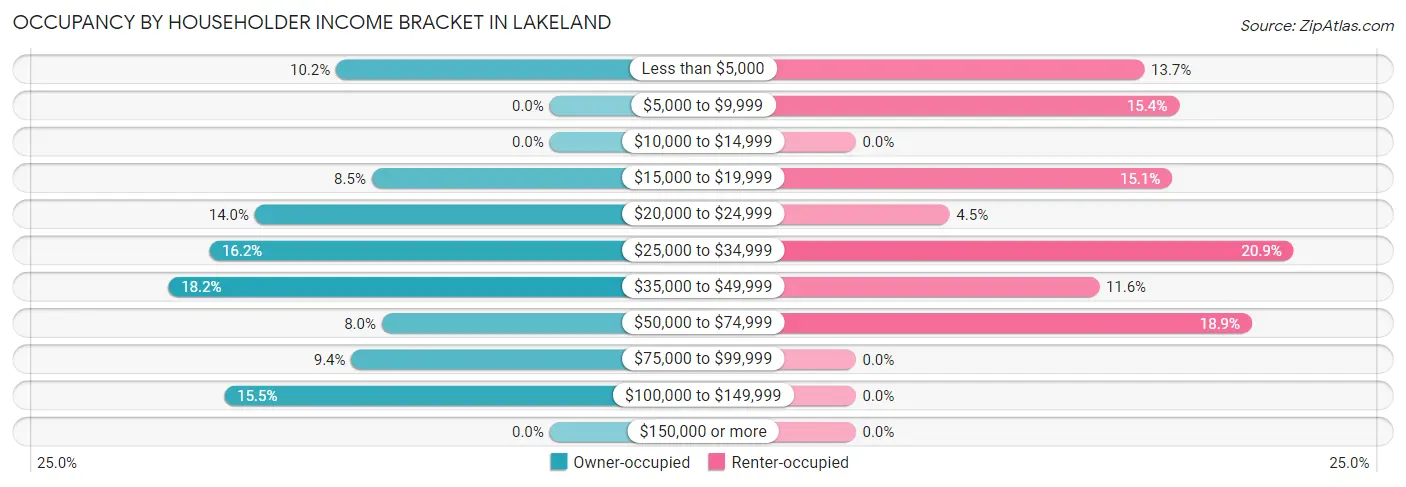
| Income Bracket | Owner-occupied | Renter-occupied |
| Less than $5,000 | 42 (10.2%) | 83 (13.7%) |
| $5,000 to $9,999 | 0 (0.0%) | 93 (15.4%) |
| $10,000 to $14,999 | 0 (0.0%) | 0 (0.0%) |
| $15,000 to $19,999 | 35 (8.5%) | 91 (15.1%) |
| $20,000 to $24,999 | 58 (14.0%) | 27 (4.5%) |
| $25,000 to $34,999 | 67 (16.2%) | 126 (20.9%) |
| $35,000 to $49,999 | 75 (18.2%) | 70 (11.6%) |
| $50,000 to $74,999 | 33 (8.0%) | 114 (18.9%) |
| $75,000 to $99,999 | 39 (9.4%) | 0 (0.0%) |
| $100,000 to $149,999 | 64 (15.5%) | 0 (0.0%) |
| $150,000 or more | 0 (0.0%) | 0 (0.0%) |
| Total | 413 (100.0%) | 604 (100.0%) |
Monthly Housing Cost Tiers in Lakeland
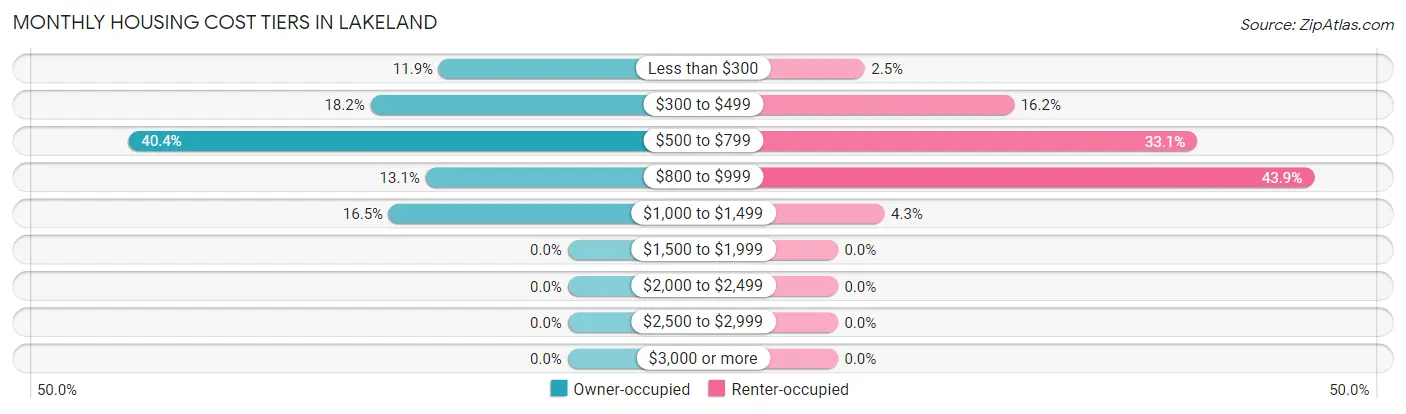
| Monthly Cost | Owner-occupied | Renter-occupied |
| Less than $300 | 49 (11.9%) | 15 (2.5%) |
| $300 to $499 | 75 (18.2%) | 98 (16.2%) |
| $500 to $799 | 167 (40.4%) | 200 (33.1%) |
| $800 to $999 | 54 (13.1%) | 265 (43.9%) |
| $1,000 to $1,499 | 68 (16.5%) | 26 (4.3%) |
| $1,500 to $1,999 | 0 (0.0%) | 0 (0.0%) |
| $2,000 to $2,499 | 0 (0.0%) | 0 (0.0%) |
| $2,500 to $2,999 | 0 (0.0%) | 0 (0.0%) |
| $3,000 or more | 0 (0.0%) | 0 (0.0%) |
| Total | 413 (100.0%) | 604 (100.0%) |
Physical Housing Characteristics in Lakeland
Housing Structures in Lakeland
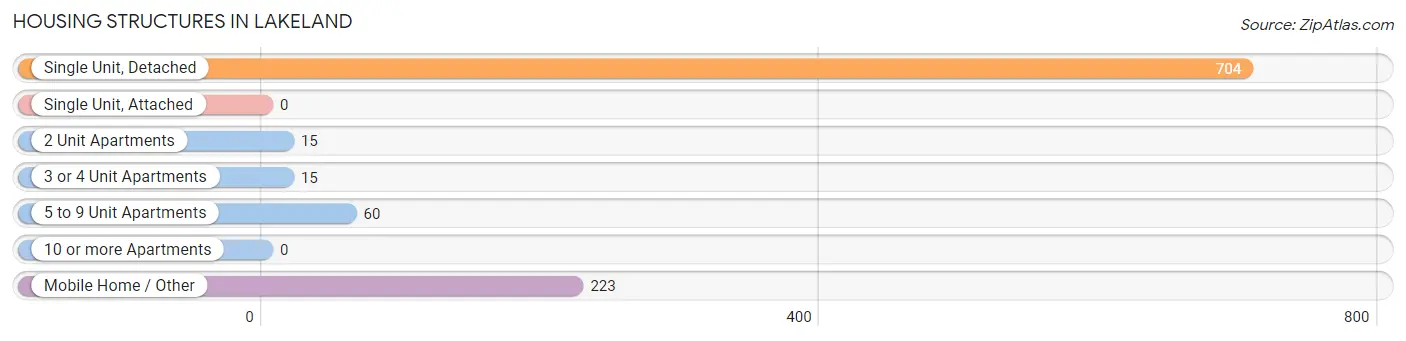
| Structure Type | # Housing Units | % Housing Units |
| Single Unit, Detached | 704 | 69.2% |
| Single Unit, Attached | 0 | 0.0% |
| 2 Unit Apartments | 15 | 1.5% |
| 3 or 4 Unit Apartments | 15 | 1.5% |
| 5 to 9 Unit Apartments | 60 | 5.9% |
| 10 or more Apartments | 0 | 0.0% |
| Mobile Home / Other | 223 | 21.9% |
| Total | 1,017 | 100.0% |
Housing Structures by Occupancy in Lakeland
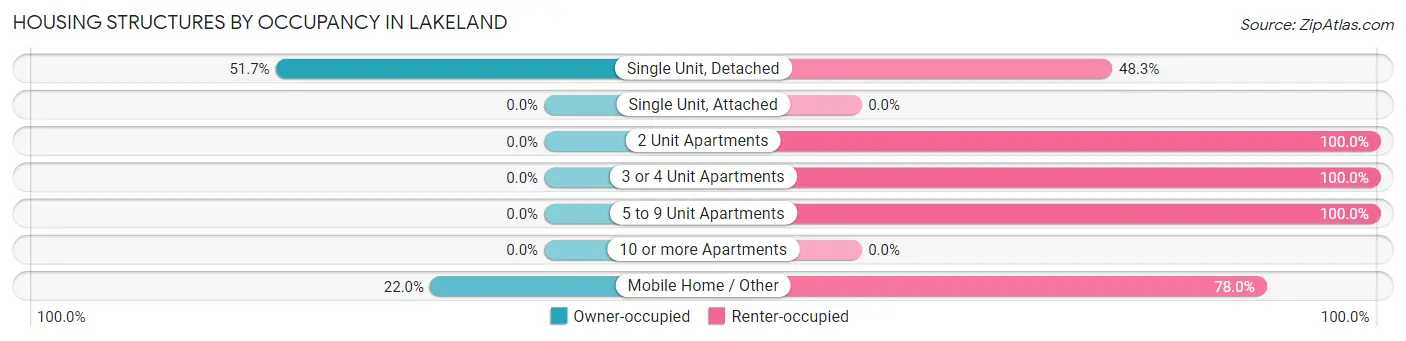
| Structure Type | Owner-occupied | Renter-occupied |
| Single Unit, Detached | 364 (51.7%) | 340 (48.3%) |
| Single Unit, Attached | 0 (0.0%) | 0 (0.0%) |
| 2 Unit Apartments | 0 (0.0%) | 15 (100.0%) |
| 3 or 4 Unit Apartments | 0 (0.0%) | 15 (100.0%) |
| 5 to 9 Unit Apartments | 0 (0.0%) | 60 (100.0%) |
| 10 or more Apartments | 0 (0.0%) | 0 (0.0%) |
| Mobile Home / Other | 49 (22.0%) | 174 (78.0%) |
| Total | 413 (40.6%) | 604 (59.4%) |
Housing Structures by Number of Rooms in Lakeland
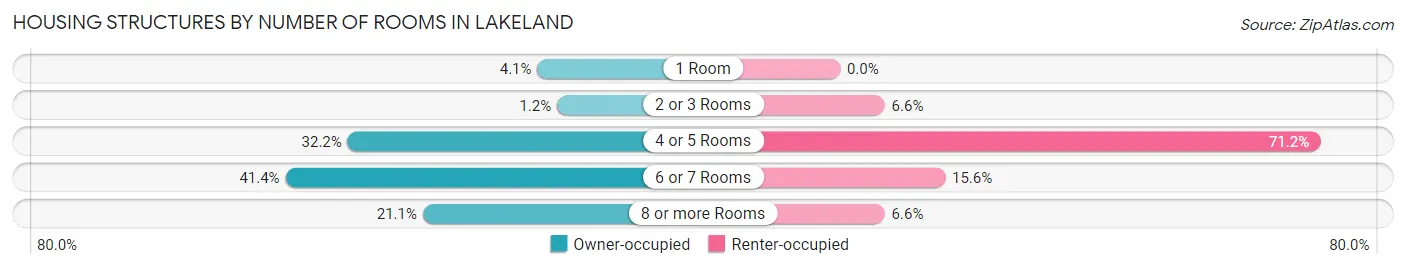
| Number of Rooms | Owner-occupied | Renter-occupied |
| 1 Room | 17 (4.1%) | 0 (0.0%) |
| 2 or 3 Rooms | 5 (1.2%) | 40 (6.6%) |
| 4 or 5 Rooms | 133 (32.2%) | 430 (71.2%) |
| 6 or 7 Rooms | 171 (41.4%) | 94 (15.6%) |
| 8 or more Rooms | 87 (21.1%) | 40 (6.6%) |
| Total | 413 (100.0%) | 604 (100.0%) |
Housing Structure by Heating Type in Lakeland
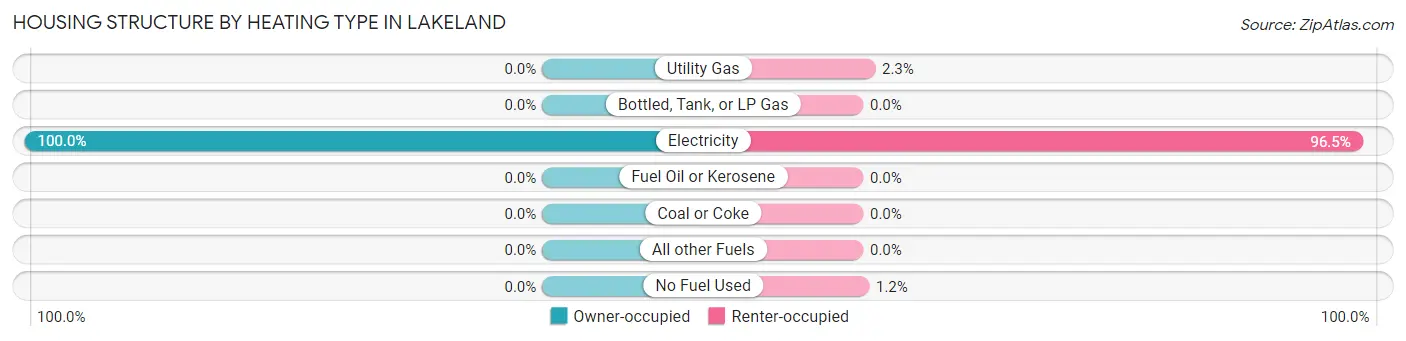
| Heating Type | Owner-occupied | Renter-occupied |
| Utility Gas | 0 (0.0%) | 14 (2.3%) |
| Bottled, Tank, or LP Gas | 0 (0.0%) | 0 (0.0%) |
| Electricity | 413 (100.0%) | 583 (96.5%) |
| Fuel Oil or Kerosene | 0 (0.0%) | 0 (0.0%) |
| Coal or Coke | 0 (0.0%) | 0 (0.0%) |
| All other Fuels | 0 (0.0%) | 0 (0.0%) |
| No Fuel Used | 0 (0.0%) | 7 (1.2%) |
| Total | 413 (100.0%) | 604 (100.0%) |
Household Vehicle Usage in Lakeland
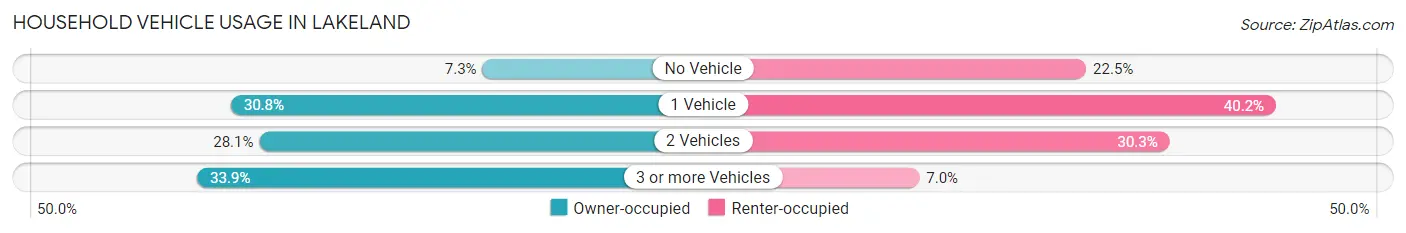
| Vehicles per Household | Owner-occupied | Renter-occupied |
| No Vehicle | 30 (7.3%) | 136 (22.5%) |
| 1 Vehicle | 127 (30.7%) | 243 (40.2%) |
| 2 Vehicles | 116 (28.1%) | 183 (30.3%) |
| 3 or more Vehicles | 140 (33.9%) | 42 (7.0%) |
| Total | 413 (100.0%) | 604 (100.0%) |
Real Estate & Mortgages in Lakeland
Real Estate and Mortgage Overview in Lakeland
| Characteristic | Without Mortgage | With Mortgage |
| Housing Units | 273 | 140 |
| Median Property Value | $144,400 | $0 |
| Median Household Income | $38,281 | $0 |
| Monthly Housing Costs | $531 | $0 |
| Real Estate Taxes | $1,596 | $0 |
Property Value by Mortgage Status in Lakeland
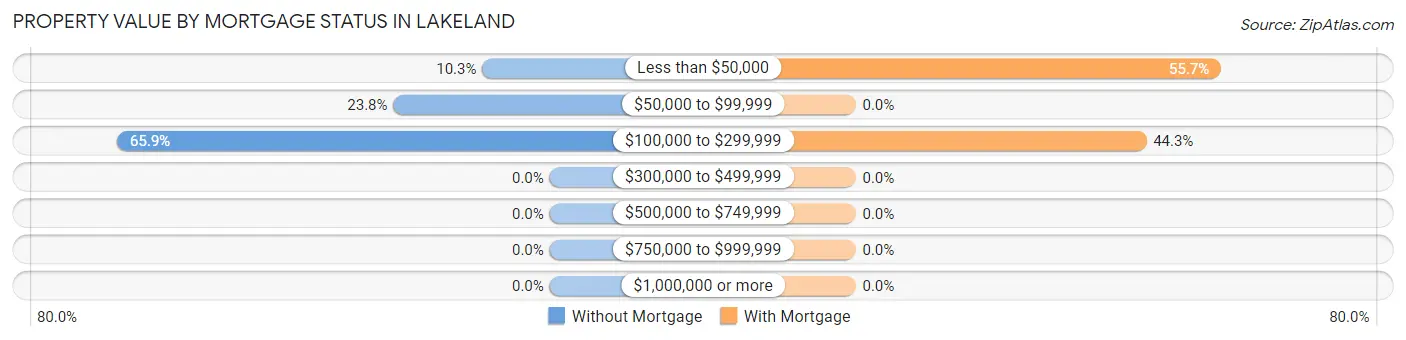
| Property Value | Without Mortgage | With Mortgage |
| Less than $50,000 | 28 (10.3%) | 78 (55.7%) |
| $50,000 to $99,999 | 65 (23.8%) | 0 (0.0%) |
| $100,000 to $299,999 | 180 (65.9%) | 62 (44.3%) |
| $300,000 to $499,999 | 0 (0.0%) | 0 (0.0%) |
| $500,000 to $749,999 | 0 (0.0%) | 0 (0.0%) |
| $750,000 to $999,999 | 0 (0.0%) | 0 (0.0%) |
| $1,000,000 or more | 0 (0.0%) | 0 (0.0%) |
| Total | 273 (100.0%) | 140 (100.0%) |
Household Income by Mortgage Status in Lakeland
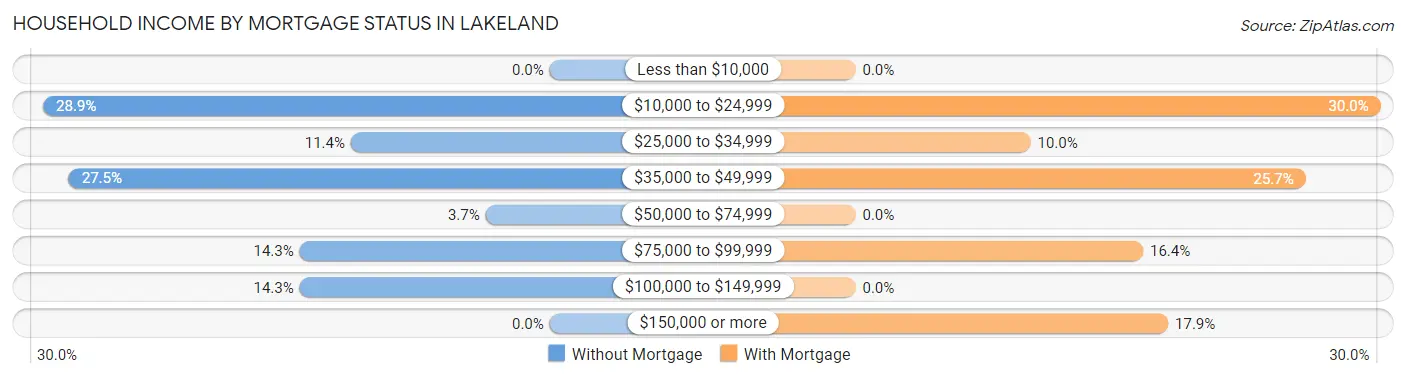
| Household Income | Without Mortgage | With Mortgage |
| Less than $10,000 | 0 (0.0%) | 0 (0.0%) |
| $10,000 to $24,999 | 79 (28.9%) | 42 (30.0%) |
| $25,000 to $34,999 | 31 (11.4%) | 14 (10.0%) |
| $35,000 to $49,999 | 75 (27.5%) | 36 (25.7%) |
| $50,000 to $74,999 | 10 (3.7%) | 0 (0.0%) |
| $75,000 to $99,999 | 39 (14.3%) | 23 (16.4%) |
| $100,000 to $149,999 | 39 (14.3%) | 0 (0.0%) |
| $150,000 or more | 0 (0.0%) | 25 (17.9%) |
| Total | 273 (100.0%) | 140 (100.0%) |
Property Value to Household Income Ratio in Lakeland
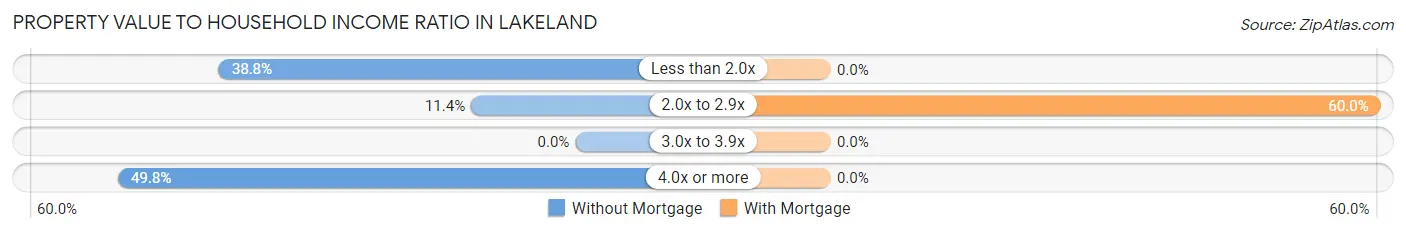
| Value-to-Income Ratio | Without Mortgage | With Mortgage |
| Less than 2.0x | 106 (38.8%) | 0 (0.0%) |
| 2.0x to 2.9x | 31 (11.4%) | 84 (60.0%) |
| 3.0x to 3.9x | 0 (0.0%) | 0 (0.0%) |
| 4.0x or more | 136 (49.8%) | 0 (0.0%) |
| Total | 273 (100.0%) | 140 (100.0%) |
Real Estate Taxes by Mortgage Status in Lakeland
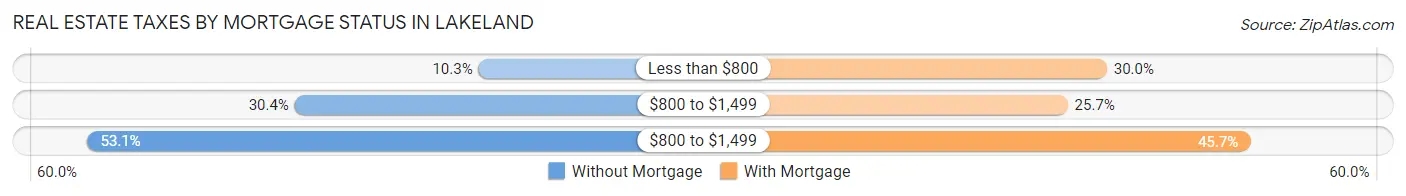
| Property Taxes | Without Mortgage | With Mortgage |
| Less than $800 | 28 (10.3%) | 42 (30.0%) |
| $800 to $1,499 | 83 (30.4%) | 36 (25.7%) |
| $800 to $1,499 | 145 (53.1%) | 64 (45.7%) |
| Total | 273 (100.0%) | 140 (100.0%) |
Health & Disability in Lakeland
Health Insurance Coverage by Age in Lakeland
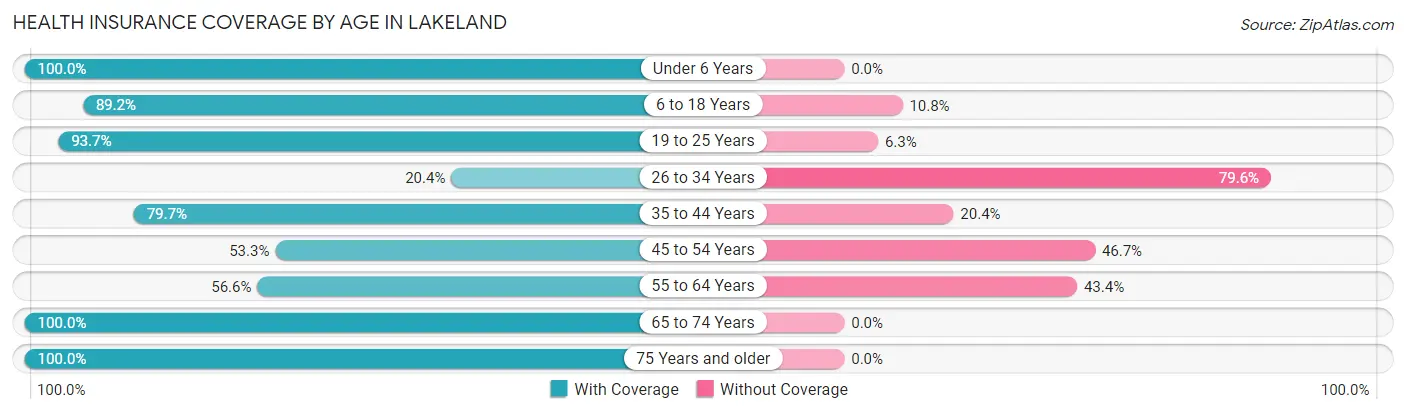
| Age Bracket | With Coverage | Without Coverage |
| Under 6 Years | 261 (100.0%) | 0 (0.0%) |
| 6 to 18 Years | 370 (89.2%) | 45 (10.8%) |
| 19 to 25 Years | 448 (93.7%) | 30 (6.3%) |
| 26 to 34 Years | 28 (20.4%) | 109 (79.6%) |
| 35 to 44 Years | 321 (79.6%) | 82 (20.3%) |
| 45 to 54 Years | 147 (53.3%) | 129 (46.7%) |
| 55 to 64 Years | 137 (56.6%) | 105 (43.4%) |
| 65 to 74 Years | 334 (100.0%) | 0 (0.0%) |
| 75 Years and older | 120 (100.0%) | 0 (0.0%) |
| Total | 2,166 (81.2%) | 500 (18.8%) |
Health Insurance Coverage by Citizenship Status in Lakeland
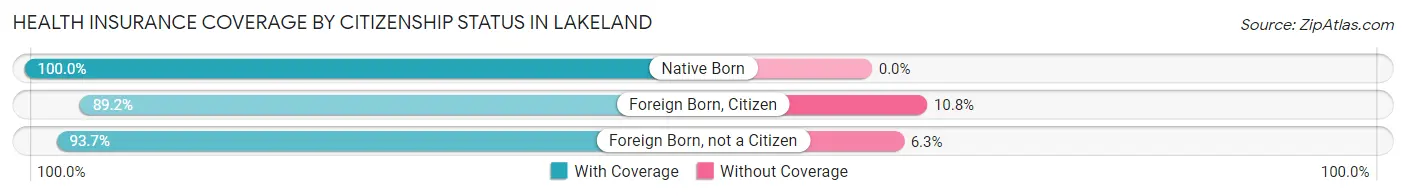
| Citizenship Status | With Coverage | Without Coverage |
| Native Born | 261 (100.0%) | 0 (0.0%) |
| Foreign Born, Citizen | 370 (89.2%) | 45 (10.8%) |
| Foreign Born, not a Citizen | 448 (93.7%) | 30 (6.3%) |
Health Insurance Coverage by Household Income in Lakeland
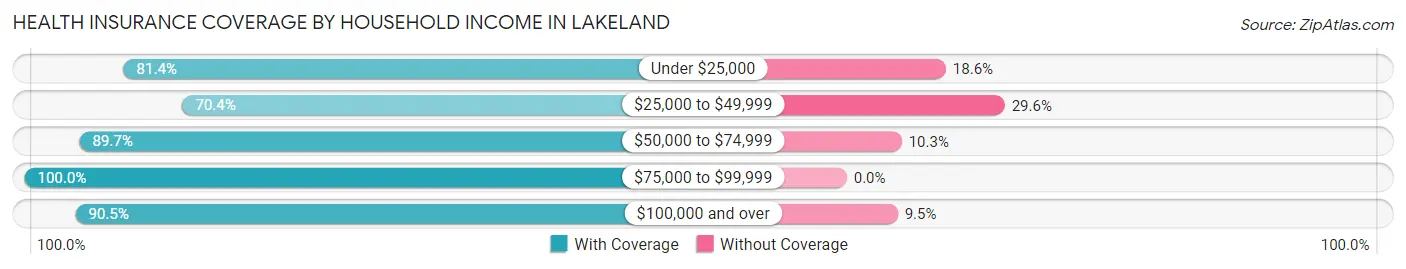
| Household Income | With Coverage | Without Coverage |
| Under $25,000 | 1,026 (81.4%) | 234 (18.6%) |
| $25,000 to $49,999 | 476 (70.4%) | 200 (29.6%) |
| $50,000 to $74,999 | 366 (89.7%) | 42 (10.3%) |
| $75,000 to $99,999 | 76 (100.0%) | 0 (0.0%) |
| $100,000 and over | 218 (90.5%) | 23 (9.5%) |
Public vs Private Health Insurance Coverage by Age in Lakeland
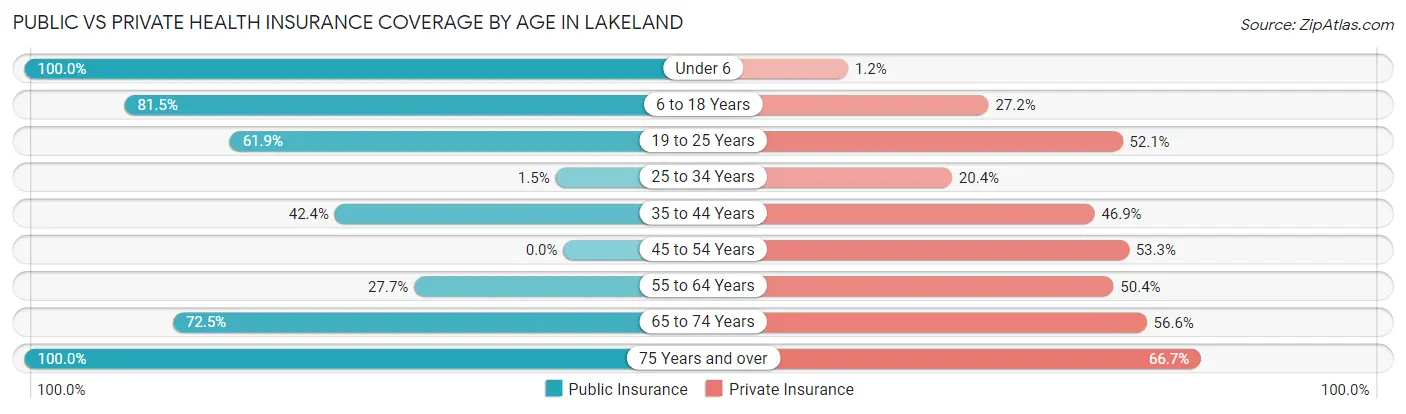
| Age Bracket | Public Insurance | Private Insurance |
| Under 6 | 261 (100.0%) | 3 (1.1%) |
| 6 to 18 Years | 338 (81.5%) | 113 (27.2%) |
| 19 to 25 Years | 296 (61.9%) | 249 (52.1%) |
| 25 to 34 Years | 2 (1.5%) | 28 (20.4%) |
| 35 to 44 Years | 171 (42.4%) | 189 (46.9%) |
| 45 to 54 Years | 0 (0.0%) | 147 (53.3%) |
| 55 to 64 Years | 67 (27.7%) | 122 (50.4%) |
| 65 to 74 Years | 242 (72.5%) | 189 (56.6%) |
| 75 Years and over | 120 (100.0%) | 80 (66.7%) |
| Total | 1,497 (56.1%) | 1,120 (42.0%) |
Disability Status by Sex by Age in Lakeland
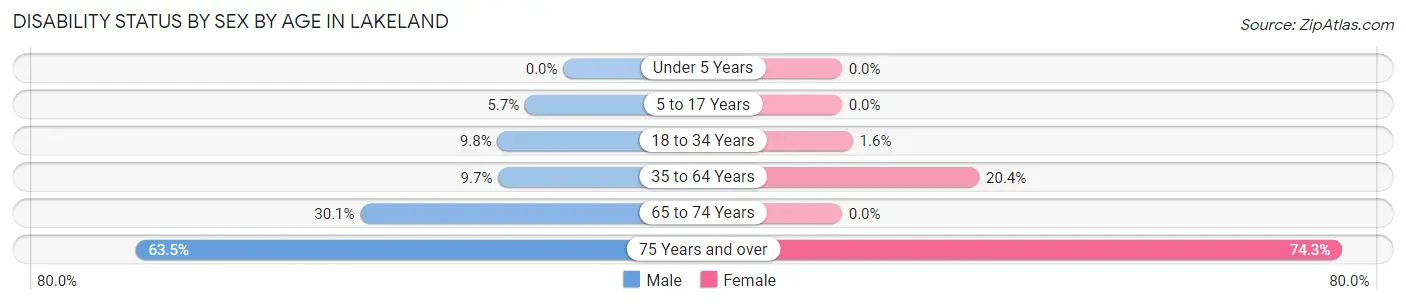
| Age Bracket | Male | Female |
| Under 5 Years | 0 (0.0%) | 0 (0.0%) |
| 5 to 17 Years | 19 (5.7%) | 0 (0.0%) |
| 18 to 34 Years | 48 (9.8%) | 2 (1.6%) |
| 35 to 64 Years | 35 (9.7%) | 114 (20.4%) |
| 65 to 74 Years | 44 (30.1%) | 0 (0.0%) |
| 75 Years and over | 54 (63.5%) | 26 (74.3%) |
Disability Class by Sex by Age in Lakeland
Disability Class: Hearing Difficulty
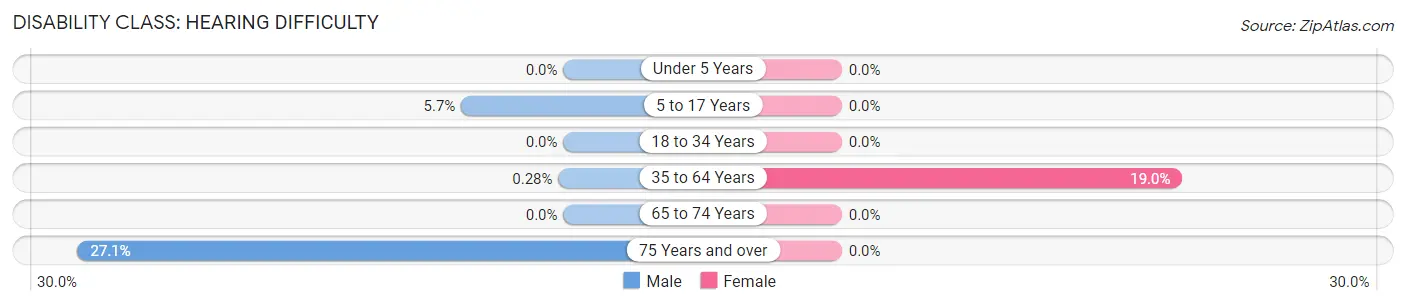
| Age Bracket | Male | Female |
| Under 5 Years | 0 (0.0%) | 0 (0.0%) |
| 5 to 17 Years | 19 (5.7%) | 0 (0.0%) |
| 18 to 34 Years | 0 (0.0%) | 0 (0.0%) |
| 35 to 64 Years | 1 (0.3%) | 106 (19.0%) |
| 65 to 74 Years | 0 (0.0%) | 0 (0.0%) |
| 75 Years and over | 23 (27.1%) | 0 (0.0%) |
Disability Class: Vision Difficulty
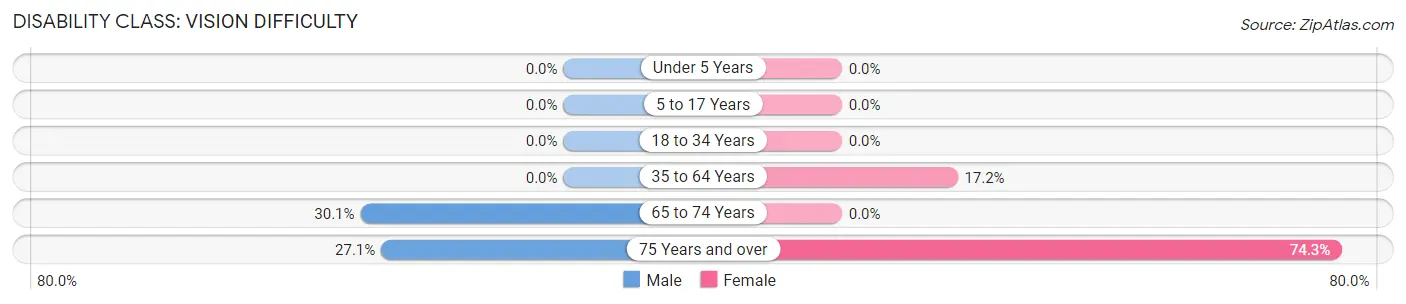
| Age Bracket | Male | Female |
| Under 5 Years | 0 (0.0%) | 0 (0.0%) |
| 5 to 17 Years | 0 (0.0%) | 0 (0.0%) |
| 18 to 34 Years | 0 (0.0%) | 0 (0.0%) |
| 35 to 64 Years | 0 (0.0%) | 96 (17.2%) |
| 65 to 74 Years | 44 (30.1%) | 0 (0.0%) |
| 75 Years and over | 23 (27.1%) | 26 (74.3%) |
Disability Class: Cognitive Difficulty
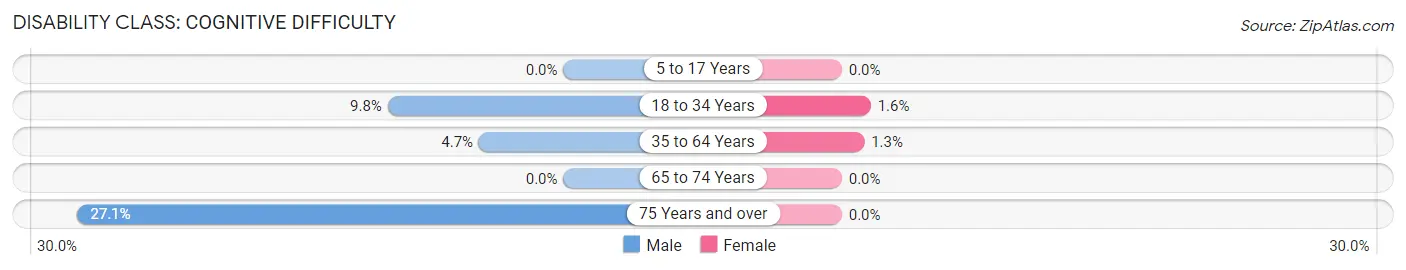
| Age Bracket | Male | Female |
| 5 to 17 Years | 0 (0.0%) | 0 (0.0%) |
| 18 to 34 Years | 48 (9.8%) | 2 (1.6%) |
| 35 to 64 Years | 17 (4.7%) | 7 (1.3%) |
| 65 to 74 Years | 0 (0.0%) | 0 (0.0%) |
| 75 Years and over | 23 (27.1%) | 0 (0.0%) |
Disability Class: Ambulatory Difficulty
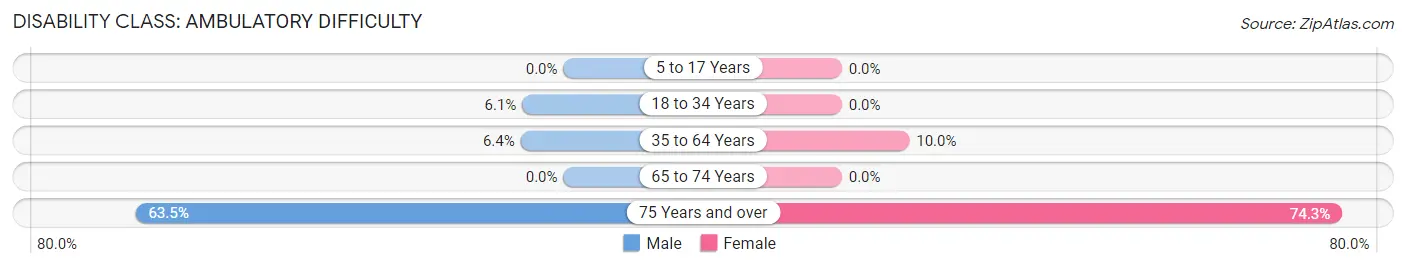
| Age Bracket | Male | Female |
| 5 to 17 Years | 0 (0.0%) | 0 (0.0%) |
| 18 to 34 Years | 30 (6.1%) | 0 (0.0%) |
| 35 to 64 Years | 23 (6.4%) | 56 (10.0%) |
| 65 to 74 Years | 0 (0.0%) | 0 (0.0%) |
| 75 Years and over | 54 (63.5%) | 26 (74.3%) |
Disability Class: Self-Care Difficulty
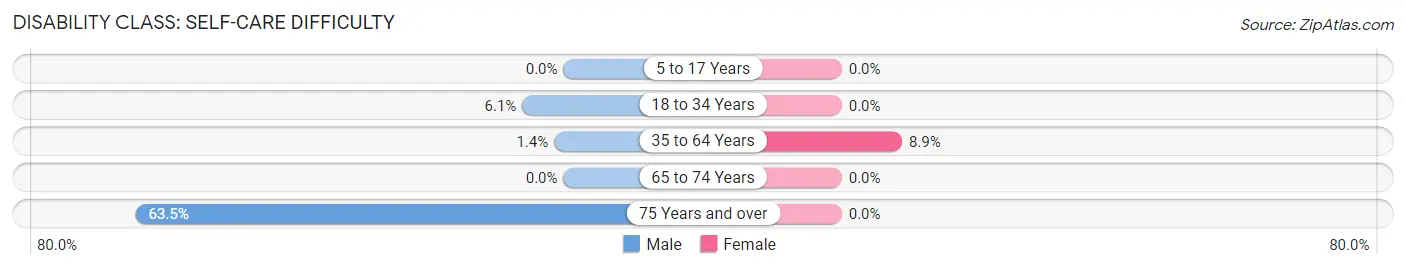
| Age Bracket | Male | Female |
| 5 to 17 Years | 0 (0.0%) | 0 (0.0%) |
| 18 to 34 Years | 30 (6.1%) | 0 (0.0%) |
| 35 to 64 Years | 5 (1.4%) | 50 (8.9%) |
| 65 to 74 Years | 0 (0.0%) | 0 (0.0%) |
| 75 Years and over | 54 (63.5%) | 0 (0.0%) |
Technology Access in Lakeland
Computing Device Access in Lakeland
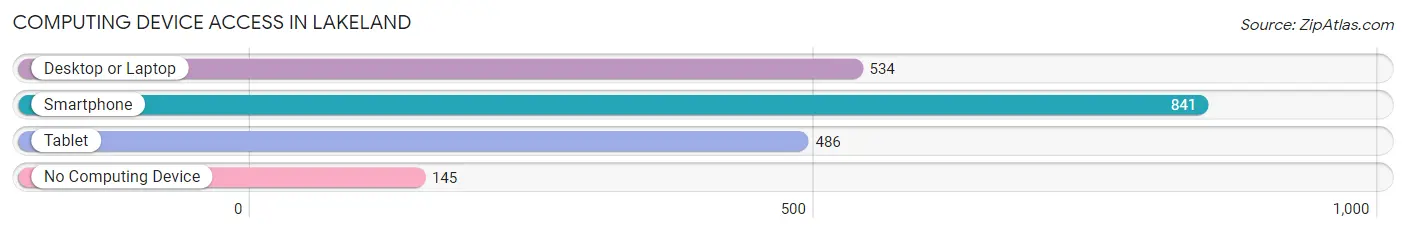
| Device Type | # Households | % Households |
| Desktop or Laptop | 534 | 52.5% |
| Smartphone | 841 | 82.7% |
| Tablet | 486 | 47.8% |
| No Computing Device | 145 | 14.3% |
| Total | 1,017 | 100.0% |
Internet Access in Lakeland
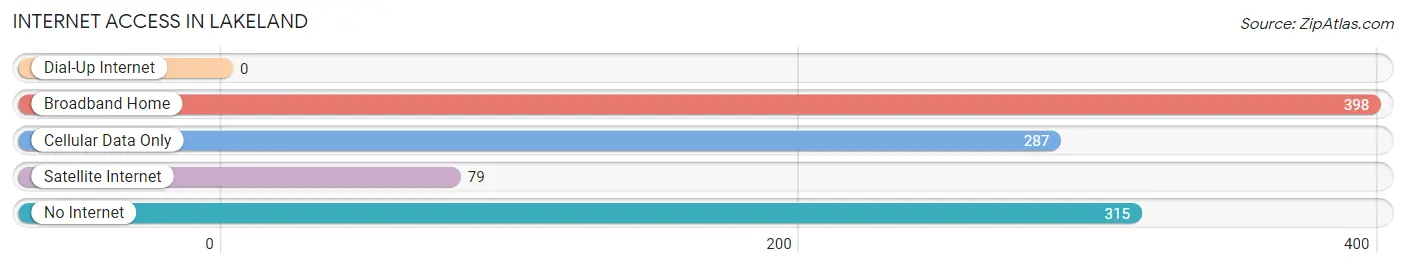
| Internet Type | # Households | % Households |
| Dial-Up Internet | 0 | 0.0% |
| Broadband Home | 398 | 39.1% |
| Cellular Data Only | 287 | 28.2% |
| Satellite Internet | 79 | 7.8% |
| No Internet | 315 | 31.0% |
| Total | 1,017 | 100.0% |
Lakeland Summary
Lakeland, Georgia is a small city located in Lanier County, Georgia. It is situated in the southeastern corner of the state, approximately 30 miles from the state capital of Atlanta. The city has a population of approximately 2,500 people and covers an area of 1.7 square miles.
History
The area that is now Lakeland was first settled in the early 1800s by settlers from the Carolinas. The town was originally known as “Lanier” after the Lanier family who owned much of the land in the area. The town was officially incorporated in 1883 and was renamed Lakeland in 1887.
The city was a major center for the production of cotton and other agricultural products. The town was also home to several sawmills and other industries. The city was also a major stop on the Seaboard Air Line Railroad.
In the early 1900s, Lakeland experienced a period of growth and prosperity. The city was home to several banks, stores, and other businesses. The city also had a thriving entertainment scene, with several theaters, restaurants, and other attractions.
In the mid-1900s, the city began to decline as the economy shifted away from agriculture and industry. The city’s population began to decline as well, and by the 1970s, the city was in a state of decline.
In the late 1990s, the city began to experience a period of revitalization. The city was able to attract new businesses and industries, and the population began to grow again. The city has continued to experience growth and revitalization in the 21st century.
Geography
Lakeland is located in the southeastern corner of Georgia, approximately 30 miles from the state capital of Atlanta. The city is situated in Lanier County, which is part of the Valdosta Metropolitan Statistical Area.
The city is located in a rural area, with much of the surrounding area being used for agricultural purposes. The city is situated on the banks of the Alapaha River, which flows through the city. The city is also located near several lakes, including Lake Lanier, Lake Blackshear, and Lake Seminole.
Economy
The economy of Lakeland is largely based on agriculture and industry. The city is home to several agricultural businesses, including farms, nurseries, and greenhouses. The city is also home to several manufacturing and industrial businesses, including a paper mill and a plastics factory.
The city is also home to several retail businesses, including several restaurants, stores, and other businesses. The city is also home to several medical facilities, including a hospital and several clinics.
Demographics
As of the 2010 census, the population of Lakeland was 2,500. The racial makeup of the city was 79.2% White, 17.2% African American, 0.4% Native American, 0.8% Asian, 0.1% Pacific Islander, and 2.3% from other races. Hispanic or Latino of any race were 2.3% of the population.
The median household income in Lakeland was $35,000, and the median family income was $41,000. The per capita income in the city was $17,000. Approximately 18.2% of the population was below the poverty line.
Common Questions
What is the Total Population of Lakeland?
Total Population of Lakeland is 2,928.
What is the Total Male Population of Lakeland?
Total Male Population of Lakeland is 1,724.
What is the Total Female Population of Lakeland?
Total Female Population of Lakeland is 1,204.
What is the Ratio of Males per 100 Females in Lakeland?
There are 143.19 Males per 100 Females in Lakeland.
What is the Ratio of Females per 100 Males in Lakeland?
There are 69.84 Females per 100 Males in Lakeland.
What is the Median Population Age in Lakeland?
Median Population Age in Lakeland is 39.6 Years.
What is the Average Family Size in Lakeland
Average Family Size in Lakeland is 3.2 People.
What is the Average Household Size in Lakeland
Average Household Size in Lakeland is 2.6 People.
What is Per Capita Income in Lakeland?
Per Capita income in Lakeland is $13,543.
What is the Median Family Income in Lakeland?
Median Family Income in Lakeland is $24,138.
What is the Median Household income in Lakeland?
Median Household Income in Lakeland is $28,920.
What is Income or Wage Gap in Lakeland?
Income or Wage Gap in Lakeland is 35.8%.
Women in Lakeland earn 64.2 cents for every dollar earned by a man.
What is Family Income Deficit in Lakeland?
Family Income Deficit in Lakeland is $17,568.
Families that are below poverty line in Lakeland earn $17,568 less on average than the poverty threshold level.
What is Inequality or Gini Index in Lakeland?
Inequality or Gini Index in Lakeland is 0.46.
How Large is the Labor Force in Lakeland?
There are 907 People in the Labor Forcein in Lakeland.
What is the Percentage of People in the Labor Force in Lakeland?
37.5% of People are in the Labor Force in Lakeland.
What is the Unemployment Rate in Lakeland?
Unemployment Rate in Lakeland is 0.1%.