Hoboken, GA
Hoboken Map
Hoboken Overview
858
TOTAL POPULATION
452
MALE POPULATION
406
FEMALE POPULATION
111.33
MALES / 100 FEMALES
89.82
FEMALES / 100 MALES
38.7
MEDIAN AGE
3.7
AVG FAMILY SIZE
3.0
AVG HOUSEHOLD SIZE
$26,926
PER CAPITA INCOME
$83,958
AVG FAMILY INCOME
$71,154
AVG HOUSEHOLD INCOME
28.7%
WAGE / INCOME GAP [ % ]
71.3¢/ $1
WAGE / INCOME GAP [ $ ]
0.45
INEQUALITY / GINI INDEX
470
LABOR FORCE [ PEOPLE ]
67.0%
PERCENT IN LABOR FORCE
0.6%
UNEMPLOYMENT RATE
Hoboken Zip Codes
Hoboken Area Codes
Race in Hoboken
The most populous races in Hoboken are White / Caucasian (823 | 95.9%), and Black / African American (35 | 4.1%).
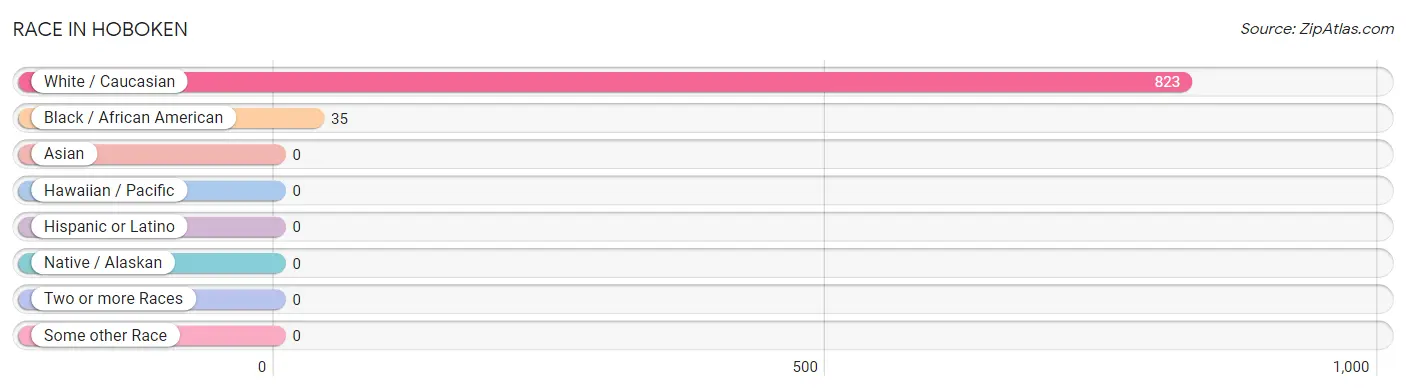
| Race | # Population | % Population |
| Asian | 0 | 0.0% |
| Black / African American | 35 | 4.1% |
| Hawaiian / Pacific | 0 | 0.0% |
| Hispanic or Latino | 0 | 0.0% |
| Native / Alaskan | 0 | 0.0% |
| White / Caucasian | 823 | 95.9% |
| Two or more Races | 0 | 0.0% |
| Some other Race | 0 | 0.0% |
| Total | 858 | 100.0% |
Ancestry in Hoboken
The most populous ancestries reported in Hoboken are English (61 | 7.1%), American (50 | 5.8%), German (31 | 3.6%), Irish (23 | 2.7%), and European (11 | 1.3%), together accounting for 20.5% of all Hoboken residents.
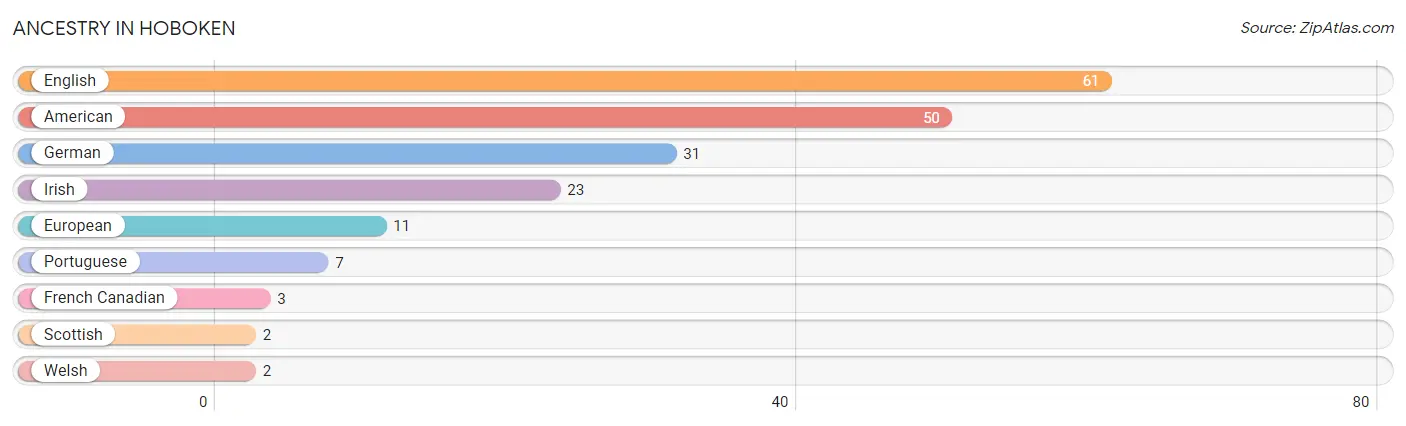
| Ancestry | # Population | % Population |
| American | 50 | 5.8% |
| English | 61 | 7.1% |
| European | 11 | 1.3% |
| French Canadian | 3 | 0.4% |
| German | 31 | 3.6% |
| Irish | 23 | 2.7% |
| Portuguese | 7 | 0.8% |
| Scottish | 2 | 0.2% |
| Welsh | 2 | 0.2% | View All 9 Rows |
Immigrants in Hoboken

| Immigration Origin | # Population | % Population | View All 0 Rows |
Sex and Age in Hoboken
Sex and Age in Hoboken
The most populous age groups in Hoboken are 20 to 24 Years (94 | 20.8%) for men and 45 to 49 Years (72 | 17.7%) for women.
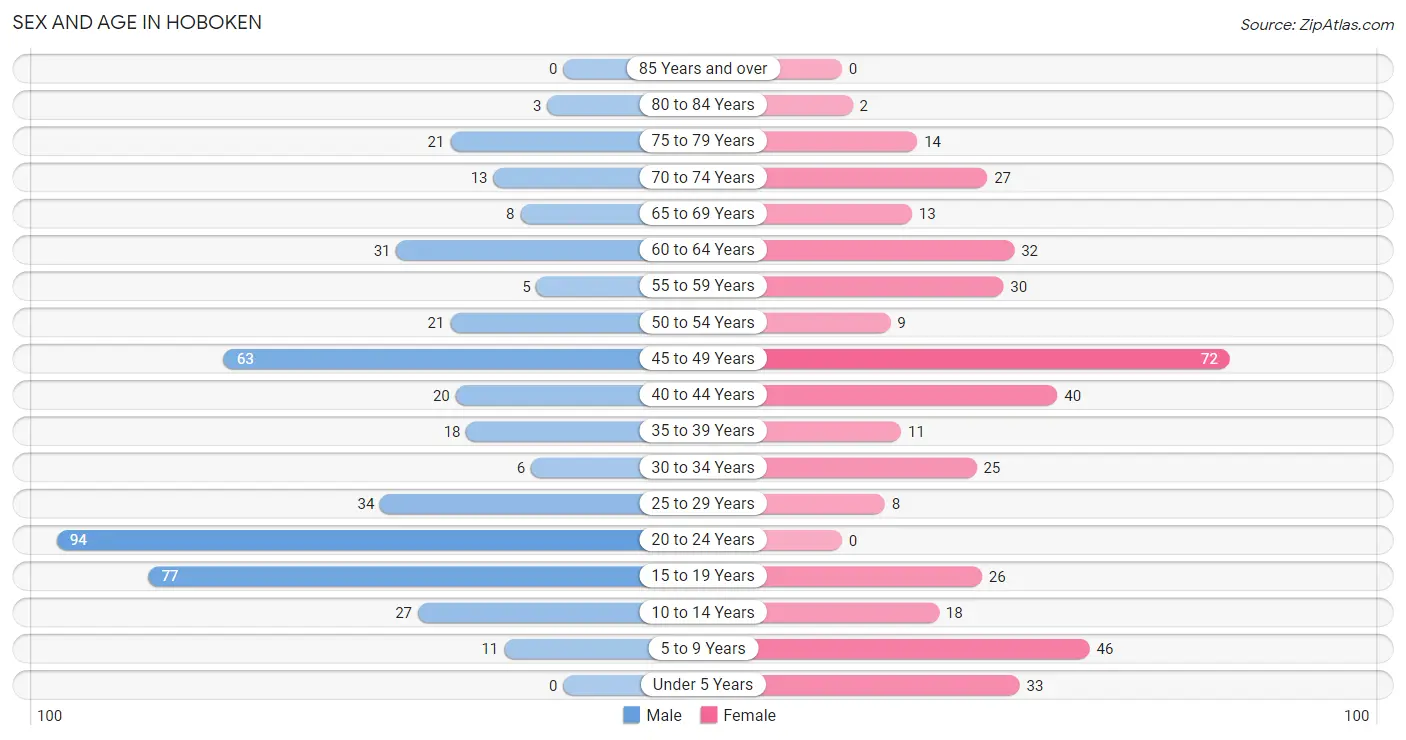
| Age Bracket | Male | Female |
| Under 5 Years | 0 (0.0%) | 33 (8.1%) |
| 5 to 9 Years | 11 (2.4%) | 46 (11.3%) |
| 10 to 14 Years | 27 (6.0%) | 18 (4.4%) |
| 15 to 19 Years | 77 (17.0%) | 26 (6.4%) |
| 20 to 24 Years | 94 (20.8%) | 0 (0.0%) |
| 25 to 29 Years | 34 (7.5%) | 8 (2.0%) |
| 30 to 34 Years | 6 (1.3%) | 25 (6.2%) |
| 35 to 39 Years | 18 (4.0%) | 11 (2.7%) |
| 40 to 44 Years | 20 (4.4%) | 40 (9.9%) |
| 45 to 49 Years | 63 (13.9%) | 72 (17.7%) |
| 50 to 54 Years | 21 (4.6%) | 9 (2.2%) |
| 55 to 59 Years | 5 (1.1%) | 30 (7.4%) |
| 60 to 64 Years | 31 (6.9%) | 32 (7.9%) |
| 65 to 69 Years | 8 (1.8%) | 13 (3.2%) |
| 70 to 74 Years | 13 (2.9%) | 27 (6.7%) |
| 75 to 79 Years | 21 (4.6%) | 14 (3.5%) |
| 80 to 84 Years | 3 (0.7%) | 2 (0.5%) |
| 85 Years and over | 0 (0.0%) | 0 (0.0%) |
| Total | 452 (100.0%) | 406 (100.0%) |
Families and Households in Hoboken
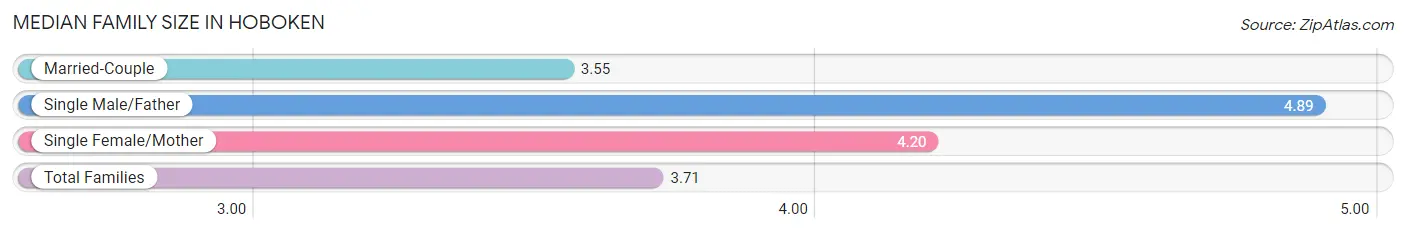
Median Family Size in Hoboken
The median family size in Hoboken is 3.71 persons per family, with single male/father families (18 | 9.0%) accounting for the largest median family size of 4.89 persons per family. On the other hand, married-couple families (173 | 86.1%) represent the smallest median family size with 3.55 persons per family.
| Family Type | # Families | Family Size |
| Married-Couple | 173 (86.1%) | 3.55 |
| Single Male/Father | 18 (9.0%) | 4.89 |
| Single Female/Mother | 10 (5.0%) | 4.20 |
| Total Families | 201 (100.0%) | 3.71 |
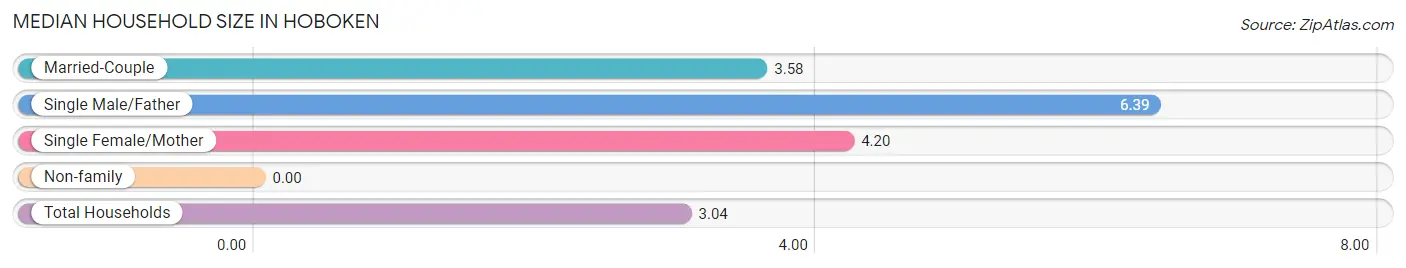
Median Household Size in Hoboken
| Household Type | # Households | Household Size |
| Married-Couple | 173 (61.4%) | 3.58 |
| Single Male/Father | 18 (6.4%) | 6.39 |
| Single Female/Mother | 10 (3.5%) | 4.20 |
| Non-family | 81 (28.7%) | - |
| Total Households | 282 (100.0%) | 3.04 |
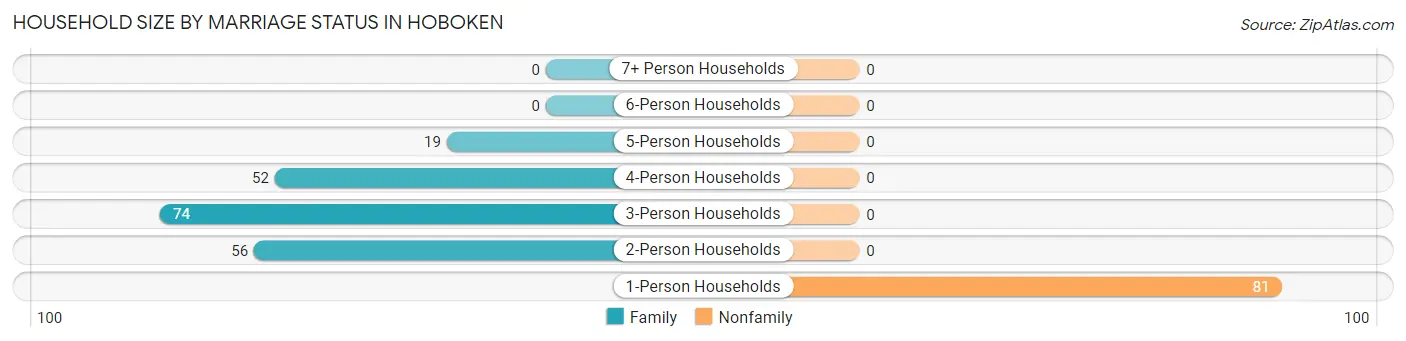
Household Size by Marriage Status in Hoboken
Out of a total of 282 households in Hoboken, 201 (71.3%) are family households, while 81 (28.7%) are nonfamily households. The most numerous type of family households are 3-person households, comprising 74, and the most common type of nonfamily households are 1-person households, comprising 81.
| Household Size | Family Households | Nonfamily Households |
| 1-Person Households | - | 81 (28.7%) |
| 2-Person Households | 56 (19.9%) | 0 (0.0%) |
| 3-Person Households | 74 (26.2%) | 0 (0.0%) |
| 4-Person Households | 52 (18.4%) | 0 (0.0%) |
| 5-Person Households | 19 (6.7%) | 0 (0.0%) |
| 6-Person Households | 0 (0.0%) | 0 (0.0%) |
| 7+ Person Households | 0 (0.0%) | 0 (0.0%) |
| Total | 201 (71.3%) | 81 (28.7%) |
Female Fertility in Hoboken
Fertility by Age in Hoboken
| Age Bracket | Women with Births | Births / 1,000 Women |
| 15 to 19 years | 0 (0.0%) | 0.0 |
| 20 to 34 years | 0 (0.0%) | 0.0 |
| 35 to 50 years | 0 (0.0%) | 0.0 |
| Total | 0 (0.0%) | 0.0 |
Fertility by Age by Marriage Status in Hoboken
| Age Bracket | Married | Unmarried |
| 15 to 19 years | 0 (0.0%) | 0 (0.0%) |
| 20 to 34 years | 0 (0.0%) | 0 (0.0%) |
| 35 to 50 years | 0 (0.0%) | 0 (0.0%) |
| Total | 0 (0.0%) | 0 (0.0%) |
Fertility by Education in Hoboken
| Educational Attainment | Women with Births | Births / 1,000 Women |
| Less than High School | 0 (0.0%) | 0.0 |
| High School Diploma | 0 (0.0%) | 0.0 |
| College or Associate's Degree | 0 (0.0%) | 0.0 |
| Bachelor's Degree | 0 (0.0%) | 0.0 |
| Graduate Degree | 0 (0.0%) | 0.0 |
| Total | 0 (0.0%) | 0.0 |
Fertility by Education by Marriage Status in Hoboken
| Educational Attainment | Married | Unmarried |
| Less than High School | 0 (0.0%) | 0 (0.0%) |
| High School Diploma | 0 (0.0%) | 0 (0.0%) |
| College or Associate's Degree | 0 (0.0%) | 0 (0.0%) |
| Bachelor's Degree | 0 (0.0%) | 0 (0.0%) |
| Graduate Degree | 0 (0.0%) | 0 (0.0%) |
| Total | 0 (0.0%) | 0 (0.0%) |
Income in Hoboken
Income Overview in Hoboken
Per Capita Income in Hoboken is $26,926, while median incomes of families and households are $83,958 and $71,154 respectively.
| Characteristic | Number | Measure |
| Per Capita Income | 858 | $26,926 |
| Median Family Income | 201 | $83,958 |
| Mean Family Income | 201 | $103,125 |
| Median Household Income | 282 | $71,154 |
| Mean Household Income | 282 | $79,439 |
| Income Deficit | 201 | $0 |
| Wage / Income Gap (%) | 858 | 28.68% |
| Wage / Income Gap ($) | 858 | 71.32¢ per $1 |
| Gini / Inequality Index | 858 | 0.45 |
Earnings by Sex in Hoboken
Average Earnings in Hoboken are $36,135, $45,707 for men and $32,596 for women, a difference of 28.7%.
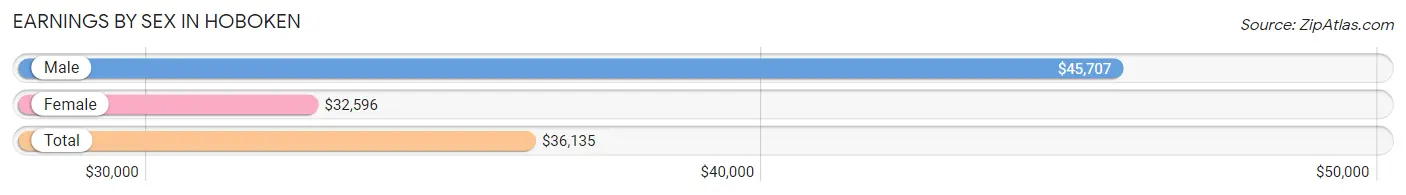
| Sex | Number | Average Earnings |
| Male | 298 (62.7%) | $45,707 |
| Female | 177 (37.3%) | $32,596 |
| Total | 475 (100.0%) | $36,135 |
Earnings by Sex by Income Bracket in Hoboken
The most common earnings brackets in Hoboken are $45,000 to $49,999 for men (78 | 26.2%) and $35,000 to $39,999 for women (53 | 29.9%).
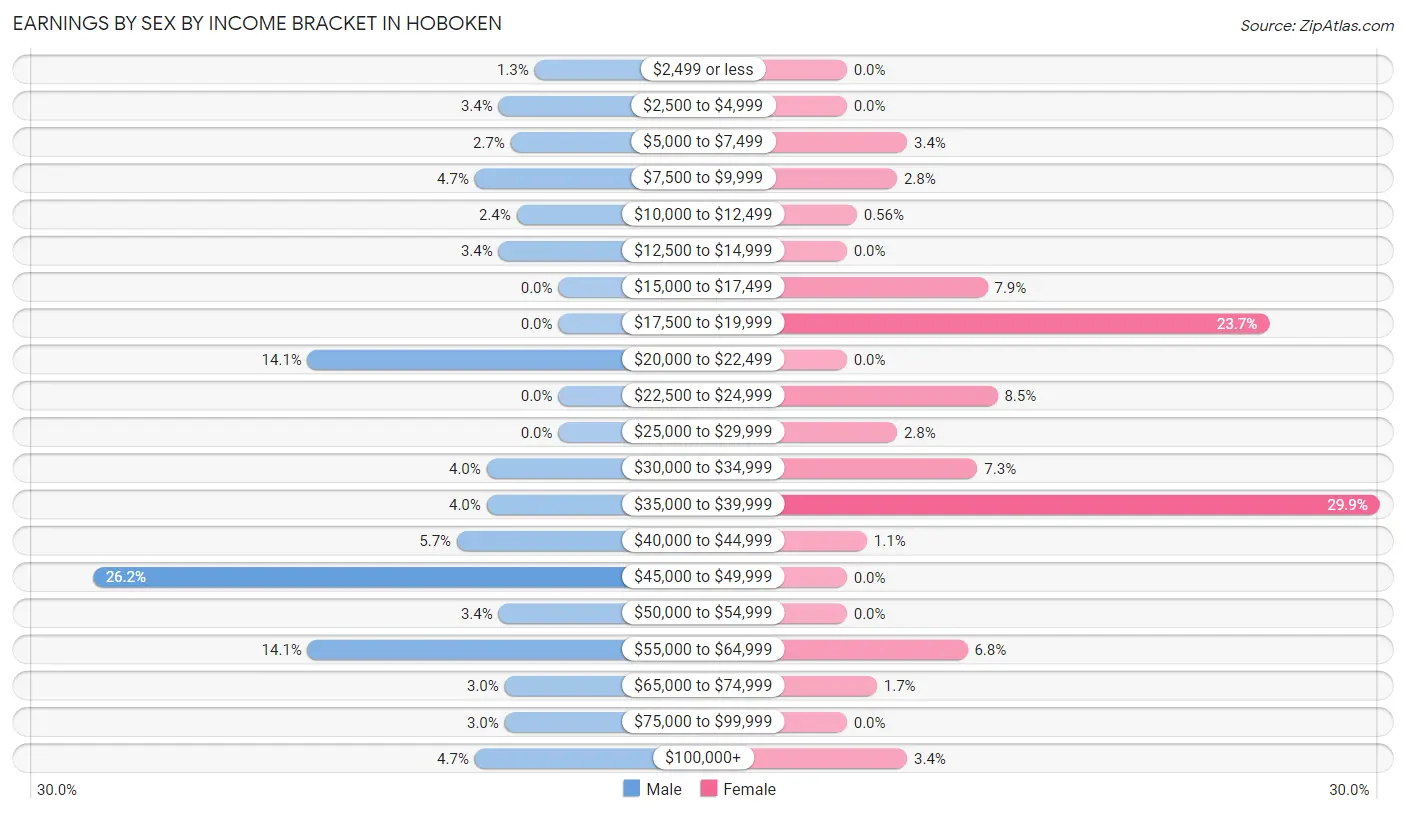
| Income | Male | Female |
| $2,499 or less | 4 (1.3%) | 0 (0.0%) |
| $2,500 to $4,999 | 10 (3.4%) | 0 (0.0%) |
| $5,000 to $7,499 | 8 (2.7%) | 6 (3.4%) |
| $7,500 to $9,999 | 14 (4.7%) | 5 (2.8%) |
| $10,000 to $12,499 | 7 (2.4%) | 1 (0.6%) |
| $12,500 to $14,999 | 10 (3.4%) | 0 (0.0%) |
| $15,000 to $17,499 | 0 (0.0%) | 14 (7.9%) |
| $17,500 to $19,999 | 0 (0.0%) | 42 (23.7%) |
| $20,000 to $22,499 | 42 (14.1%) | 0 (0.0%) |
| $22,500 to $24,999 | 0 (0.0%) | 15 (8.5%) |
| $25,000 to $29,999 | 0 (0.0%) | 5 (2.8%) |
| $30,000 to $34,999 | 12 (4.0%) | 13 (7.3%) |
| $35,000 to $39,999 | 12 (4.0%) | 53 (29.9%) |
| $40,000 to $44,999 | 17 (5.7%) | 2 (1.1%) |
| $45,000 to $49,999 | 78 (26.2%) | 0 (0.0%) |
| $50,000 to $54,999 | 10 (3.4%) | 0 (0.0%) |
| $55,000 to $64,999 | 42 (14.1%) | 12 (6.8%) |
| $65,000 to $74,999 | 9 (3.0%) | 3 (1.7%) |
| $75,000 to $99,999 | 9 (3.0%) | 0 (0.0%) |
| $100,000+ | 14 (4.7%) | 6 (3.4%) |
| Total | 298 (100.0%) | 177 (100.0%) |
Earnings by Sex by Educational Attainment in Hoboken
Average earnings in Hoboken are $49,336 for men and $33,462 for women, a difference of 32.2%. Men with an educational attainment of less than high school enjoy the highest average annual earnings of $83,542, while those with high school diploma education earn the least with $47,083. Women with an educational attainment of college or associate's degree earn the most with the average annual earnings of $35,677, while those with high school diploma education have the smallest earnings of $18,869.
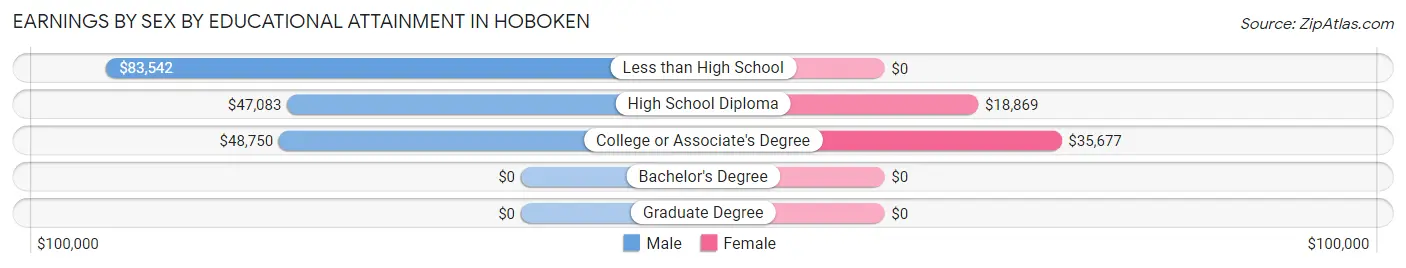
| Educational Attainment | Male Income | Female Income |
| Less than High School | $83,542 | $0 |
| High School Diploma | $47,083 | $18,869 |
| College or Associate's Degree | $48,750 | $35,677 |
| Bachelor's Degree | - | - |
| Graduate Degree | - | - |
| Total | $49,336 | $33,462 |
Family Income in Hoboken
Family Income Brackets in Hoboken
According to the Hoboken family income data, there are 55 families falling into the $100,000 to $149,999 income range, which is the most common income bracket and makes up 27.4% of all families.
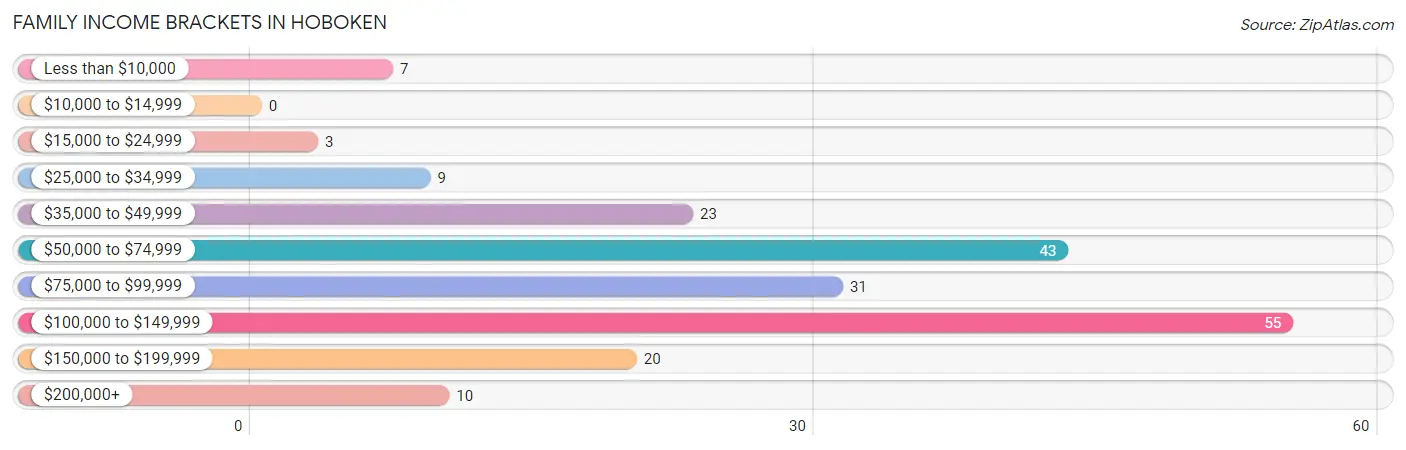
| Income Bracket | # Families | % Families |
| Less than $10,000 | 7 | 3.5% |
| $10,000 to $14,999 | 0 | 0.0% |
| $15,000 to $24,999 | 3 | 1.5% |
| $25,000 to $34,999 | 9 | 4.5% |
| $35,000 to $49,999 | 23 | 11.4% |
| $50,000 to $74,999 | 43 | 21.4% |
| $75,000 to $99,999 | 31 | 15.4% |
| $100,000 to $149,999 | 55 | 27.4% |
| $150,000 to $199,999 | 20 | 10.0% |
| $200,000+ | 10 | 5.0% |
Family Income by Famaliy Size in Hoboken
2-person families (56 | 27.9%) account for the highest median family income in Hoboken with $53,333 per family, while 2-person families (56 | 27.9%) have the highest median income of $26,666 per family member.
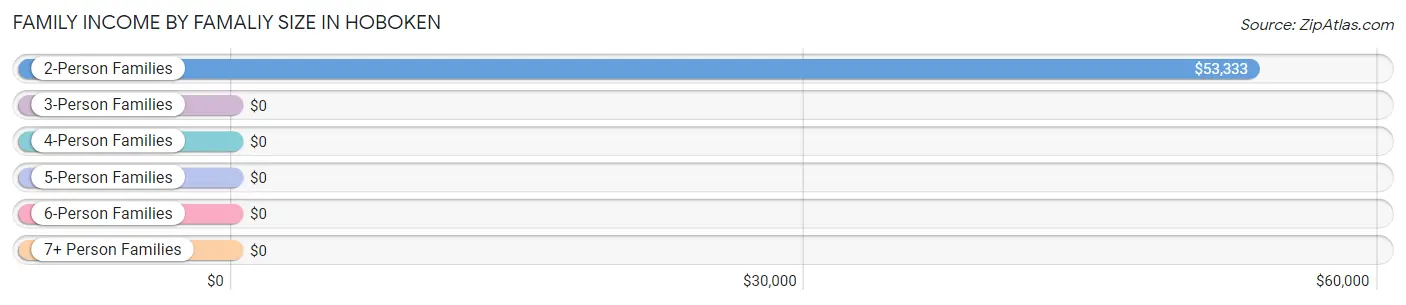
| Income Bracket | # Families | Median Income |
| 2-Person Families | 56 (27.9%) | $53,333 |
| 3-Person Families | 94 (46.8%) | $0 |
| 4-Person Families | 32 (15.9%) | $0 |
| 5-Person Families | 19 (9.5%) | $0 |
| 6-Person Families | 0 (0.0%) | $0 |
| 7+ Person Families | 0 (0.0%) | $0 |
| Total | 201 (100.0%) | $83,958 |
Family Income by Number of Earners in Hoboken
The median family income in Hoboken is $83,958, with families comprising 3+ earners (74) having the highest median family income of $149,063, while families with no earners (25) have the lowest median family income of $48,125, accounting for 36.8% and 12.4% of families, respectively.
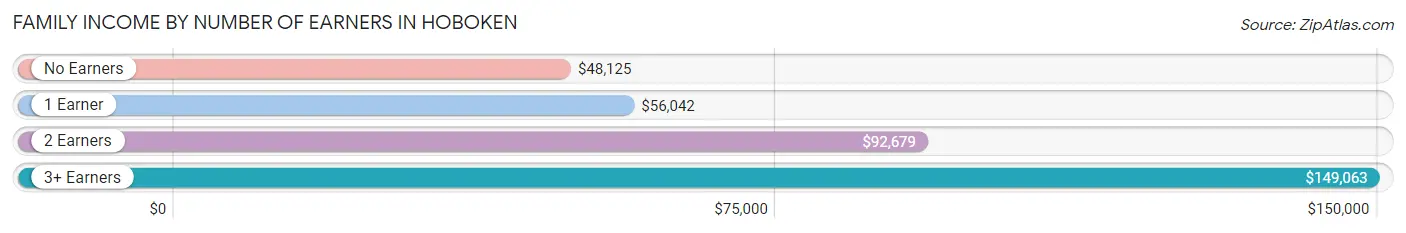
| Number of Earners | # Families | Median Income |
| No Earners | 25 (12.4%) | $48,125 |
| 1 Earner | 61 (30.3%) | $56,042 |
| 2 Earners | 41 (20.4%) | $92,679 |
| 3+ Earners | 74 (36.8%) | $149,063 |
| Total | 201 (100.0%) | $83,958 |
Household Income in Hoboken
Household Income Brackets in Hoboken
With 55 households falling in the category, the $100,000 to $149,999 income range is the most frequent in Hoboken, accounting for 19.5% of all households. In contrast, only 10 households (3.5%) fall into the $200,000+ income bracket, making it the least populous group.
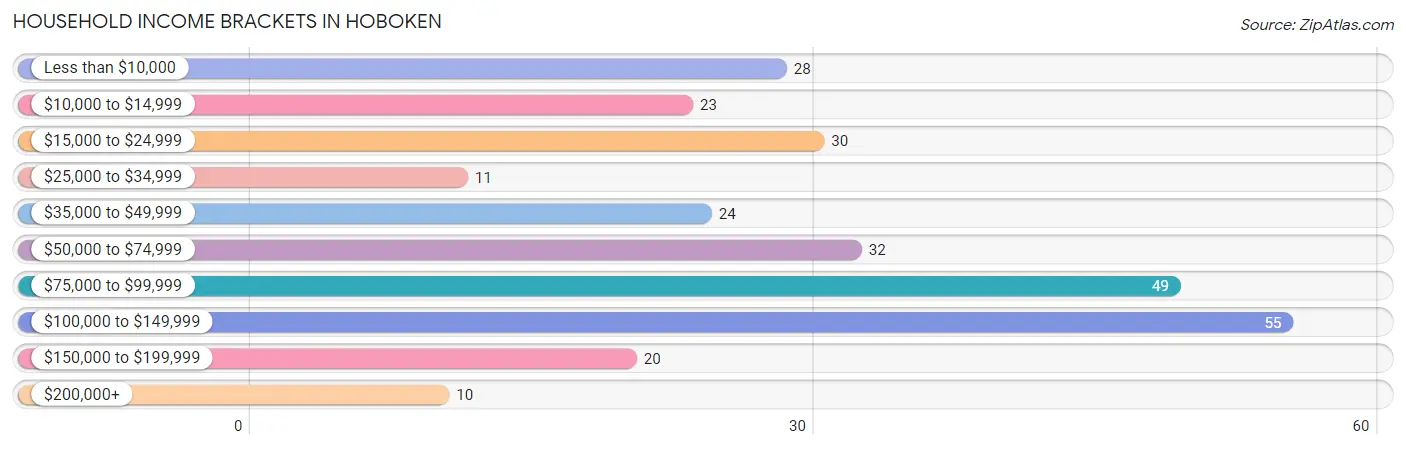
| Income Bracket | # Households | % Households |
| Less than $10,000 | 28 | 9.9% |
| $10,000 to $14,999 | 23 | 8.2% |
| $15,000 to $24,999 | 30 | 10.6% |
| $25,000 to $34,999 | 11 | 3.9% |
| $35,000 to $49,999 | 24 | 8.5% |
| $50,000 to $74,999 | 32 | 11.3% |
| $75,000 to $99,999 | 49 | 17.4% |
| $100,000 to $149,999 | 55 | 19.5% |
| $150,000 to $199,999 | 20 | 7.1% |
| $200,000+ | 10 | 3.5% |
Household Income by Householder Age in Hoboken
The median household income in Hoboken is $71,154, with the highest median household income of $76,806 found in the 25 to 44 years age bracket for the primary householder. A total of 40 households (14.2%) fall into this category.
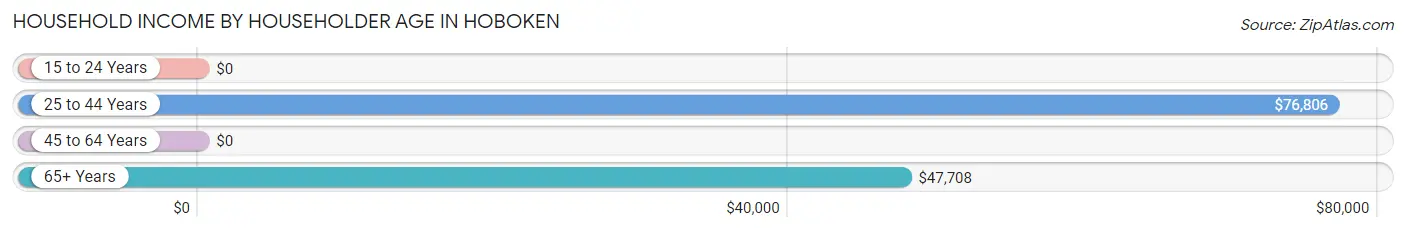
| Income Bracket | # Households | Median Income |
| 15 to 24 Years | 0 (0.0%) | $0 |
| 25 to 44 Years | 40 (14.2%) | $76,806 |
| 45 to 64 Years | 172 (61.0%) | $0 |
| 65+ Years | 70 (24.8%) | $47,708 |
| Total | 282 (100.0%) | $71,154 |
Poverty in Hoboken
Income Below Poverty by Sex and Age in Hoboken
With 9.5% poverty level for males and 8.9% for females among the residents of Hoboken, 16 and 17 year old males and 18 to 24 year old females are the most vulnerable to poverty, with 3 males (100.0%) and 5 females (62.5%) in their respective age groups living below the poverty level.
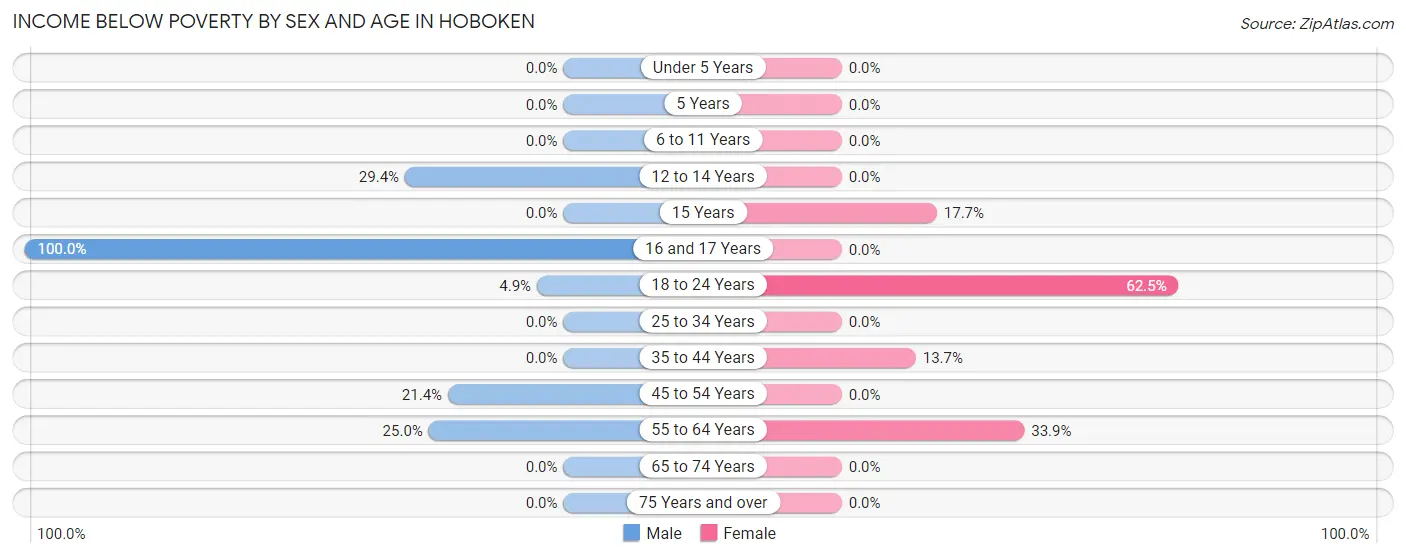
| Age Bracket | Male | Female |
| Under 5 Years | 0 (0.0%) | 0 (0.0%) |
| 5 Years | 0 (0.0%) | 0 (0.0%) |
| 6 to 11 Years | 0 (0.0%) | 0 (0.0%) |
| 12 to 14 Years | 5 (29.4%) | 0 (0.0%) |
| 15 Years | 0 (0.0%) | 3 (17.6%) |
| 16 and 17 Years | 3 (100.0%) | 0 (0.0%) |
| 18 to 24 Years | 8 (4.9%) | 5 (62.5%) |
| 25 to 34 Years | 0 (0.0%) | 0 (0.0%) |
| 35 to 44 Years | 0 (0.0%) | 7 (13.7%) |
| 45 to 54 Years | 18 (21.4%) | 0 (0.0%) |
| 55 to 64 Years | 9 (25.0%) | 21 (33.9%) |
| 65 to 74 Years | 0 (0.0%) | 0 (0.0%) |
| 75 Years and over | 0 (0.0%) | 0 (0.0%) |
| Total | 43 (9.5%) | 36 (8.9%) |
Income Above Poverty by Sex and Age in Hoboken
According to the poverty statistics in Hoboken, males aged 5 years and females aged under 5 years are the age groups that are most secure financially, with 100.0% of males and 100.0% of females in these age groups living above the poverty line.
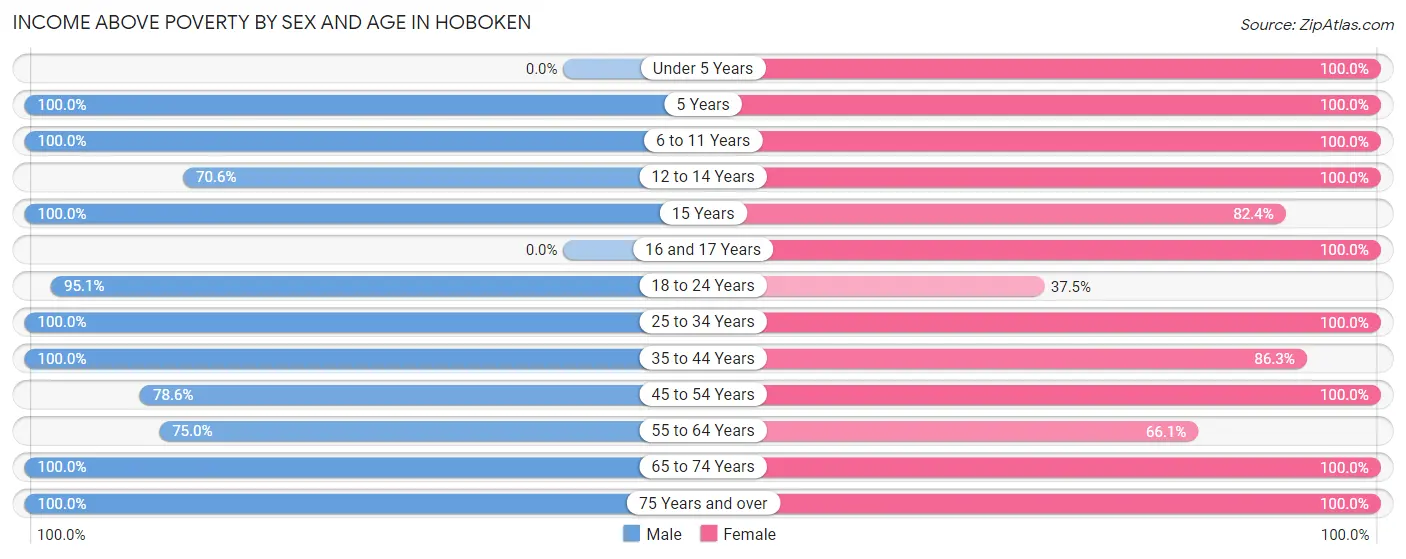
| Age Bracket | Male | Female |
| Under 5 Years | 0 (0.0%) | 33 (100.0%) |
| 5 Years | 5 (100.0%) | 9 (100.0%) |
| 6 to 11 Years | 16 (100.0%) | 37 (100.0%) |
| 12 to 14 Years | 12 (70.6%) | 18 (100.0%) |
| 15 Years | 5 (100.0%) | 14 (82.4%) |
| 16 and 17 Years | 0 (0.0%) | 1 (100.0%) |
| 18 to 24 Years | 155 (95.1%) | 3 (37.5%) |
| 25 to 34 Years | 40 (100.0%) | 33 (100.0%) |
| 35 to 44 Years | 38 (100.0%) | 44 (86.3%) |
| 45 to 54 Years | 66 (78.6%) | 81 (100.0%) |
| 55 to 64 Years | 27 (75.0%) | 41 (66.1%) |
| 65 to 74 Years | 21 (100.0%) | 40 (100.0%) |
| 75 Years and over | 24 (100.0%) | 16 (100.0%) |
| Total | 409 (90.5%) | 370 (91.1%) |
Income Below Poverty Among Married-Couple Families in Hoboken
The poverty statistics for married-couple families in Hoboken show that 1.7% or 3 of the total 173 families live below the poverty line. Families with 1 or 2 children have the highest poverty rate of 7.7%, comprising of 3 families. On the other hand, families with no children have the lowest poverty rate of 0.0%, which includes 0 families.
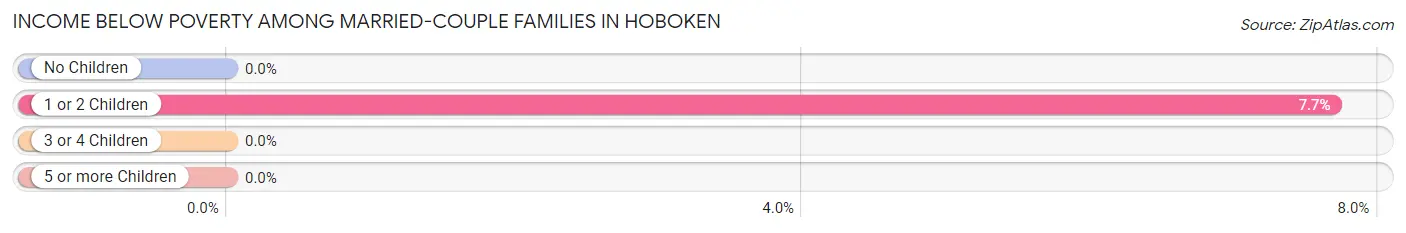
| Children | Above Poverty | Below Poverty |
| No Children | 128 (100.0%) | 0 (0.0%) |
| 1 or 2 Children | 36 (92.3%) | 3 (7.7%) |
| 3 or 4 Children | 6 (100.0%) | 0 (0.0%) |
| 5 or more Children | 0 (0.0%) | 0 (0.0%) |
| Total | 170 (98.3%) | 3 (1.7%) |
Income Below Poverty Among Single-Parent Households in Hoboken
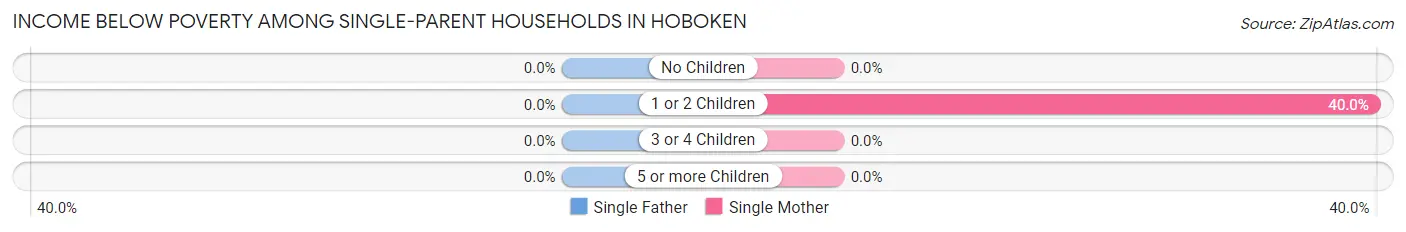
| Children | Single Father | Single Mother |
| No Children | 0 (0.0%) | 0 (0.0%) |
| 1 or 2 Children | 0 (0.0%) | 4 (40.0%) |
| 3 or 4 Children | 0 (0.0%) | 0 (0.0%) |
| 5 or more Children | 0 (0.0%) | 0 (0.0%) |
| Total | 0 (0.0%) | 4 (40.0%) |
Income Below Poverty Among Married-Couple vs Single-Parent Households in Hoboken
The poverty data for Hoboken shows that 3 of the married-couple family households (1.7%) and 4 of the single-parent households (14.3%) are living below the poverty level. Within the married-couple family households, those with 1 or 2 children have the highest poverty rate, with 3 households (7.7%) falling below the poverty line. Among the single-parent households, those with 1 or 2 children have the highest poverty rate, with 4 household (14.3%) living below poverty.
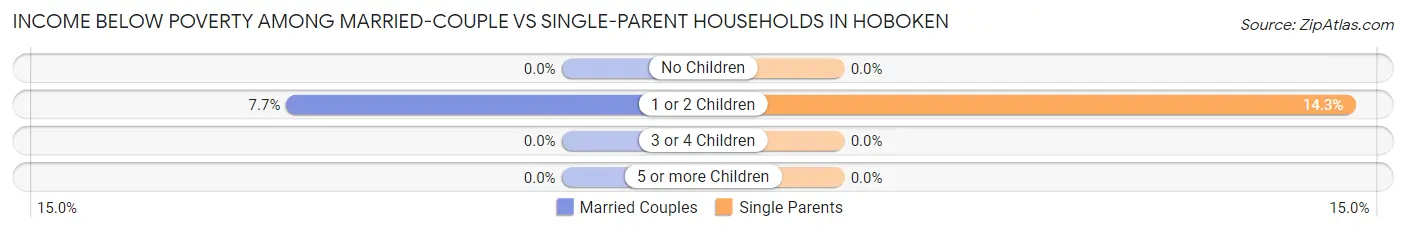
| Children | Married-Couple Families | Single-Parent Households |
| No Children | 0 (0.0%) | 0 (0.0%) |
| 1 or 2 Children | 3 (7.7%) | 4 (14.3%) |
| 3 or 4 Children | 0 (0.0%) | 0 (0.0%) |
| 5 or more Children | 0 (0.0%) | 0 (0.0%) |
| Total | 3 (1.7%) | 4 (14.3%) |
Employment Characteristics in Hoboken
Employment by Class of Employer in Hoboken
Among the 454 employed individuals in Hoboken, private company employees (322 | 70.9%), self-employed (not incorporated) (57 | 12.6%), and local government employees (55 | 12.1%) make up the most common classes of employment.
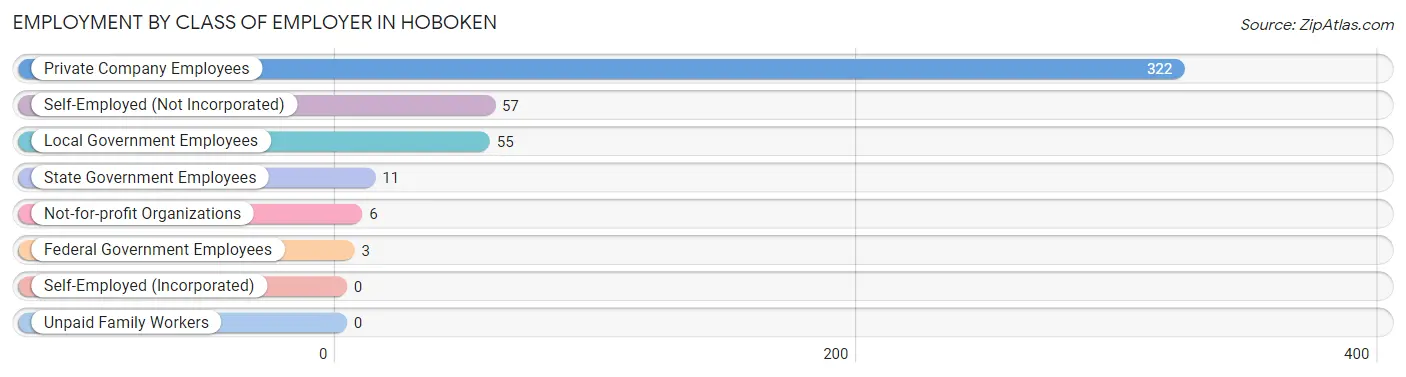
| Employer Class | # Employees | % Employees |
| Private Company Employees | 322 | 70.9% |
| Self-Employed (Incorporated) | 0 | 0.0% |
| Self-Employed (Not Incorporated) | 57 | 12.6% |
| Not-for-profit Organizations | 6 | 1.3% |
| Local Government Employees | 55 | 12.1% |
| State Government Employees | 11 | 2.4% |
| Federal Government Employees | 3 | 0.7% |
| Unpaid Family Workers | 0 | 0.0% |
| Total | 454 | 100.0% |
Employment Status by Age in Hoboken
According to the labor force statistics for Hoboken, out of the total population over 16 years of age (701), 67.0% or 470 individuals are in the labor force, with 0.6% or 3 of them unemployed. The age group with the highest labor force participation rate is 20 to 24 years, with 100.0% or 94 individuals in the labor force. Within the labor force, the 45 to 54 years age range has the highest percentage of unemployed individuals, with 2.2% or 3 of them being unemployed.
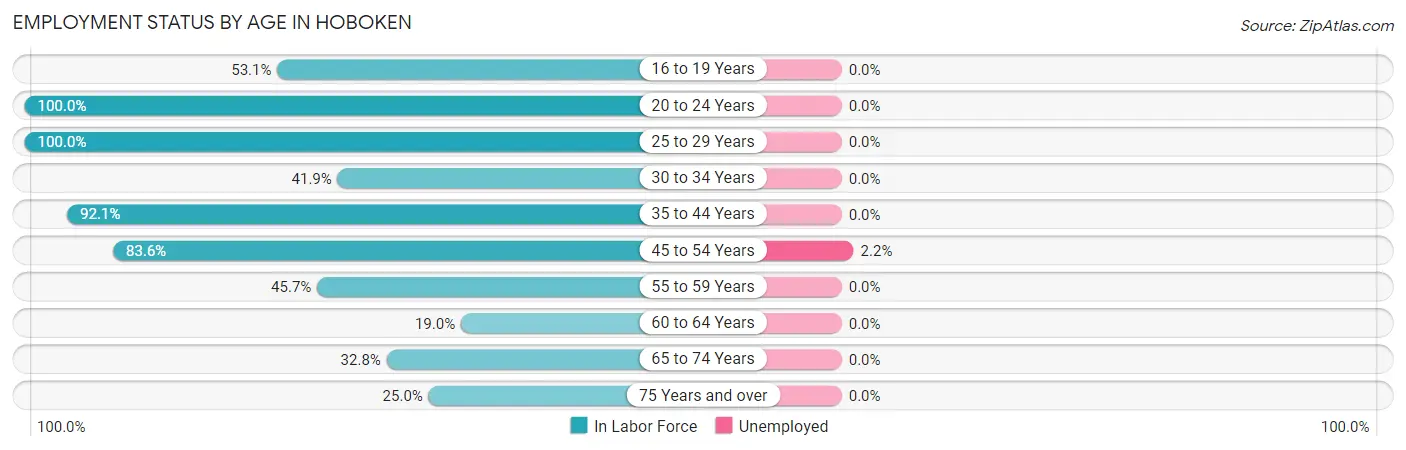
| Age Bracket | In Labor Force | Unemployed |
| 16 to 19 Years | 43 (53.1%) | 0 (0.0%) |
| 20 to 24 Years | 94 (100.0%) | 0 (0.0%) |
| 25 to 29 Years | 42 (100.0%) | 0 (0.0%) |
| 30 to 34 Years | 13 (41.9%) | 0 (0.0%) |
| 35 to 44 Years | 82 (92.1%) | 0 (0.0%) |
| 45 to 54 Years | 138 (83.6%) | 3 (2.2%) |
| 55 to 59 Years | 16 (45.7%) | 0 (0.0%) |
| 60 to 64 Years | 12 (19.0%) | 0 (0.0%) |
| 65 to 74 Years | 20 (32.8%) | 0 (0.0%) |
| 75 Years and over | 10 (25.0%) | 0 (0.0%) |
| Total | 470 (67.0%) | 3 (0.6%) |
Employment Status by Educational Attainment in Hoboken
According to labor force statistics for Hoboken, 71.3% of individuals (303) out of the total population between 25 and 64 years of age (425) are in the labor force, with 1.0% or 3 of them being unemployed. The group with the highest labor force participation rate are those with the educational attainment of bachelor's degree or higher, with 100.0% or 21 individuals in the labor force. Within the labor force, individuals with bachelor's degree or higher education have the highest percentage of unemployment, with 14.3% or 3 of them being unemployed.
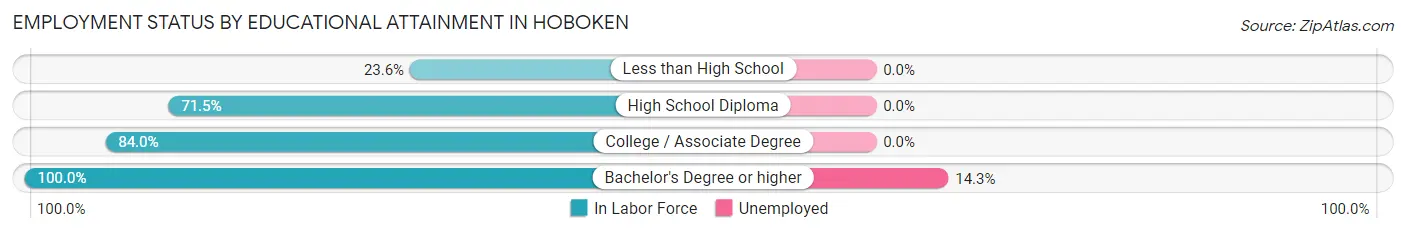
| Educational Attainment | In Labor Force | Unemployed |
| Less than High School | 13 (23.6%) | 0 (0.0%) |
| High School Diploma | 138 (71.5%) | 0 (0.0%) |
| College / Associate Degree | 131 (84.0%) | 0 (0.0%) |
| Bachelor's Degree or higher | 21 (100.0%) | 3 (14.3%) |
| Total | 303 (71.3%) | 4 (1.0%) |
Employment Occupations by Sex in Hoboken
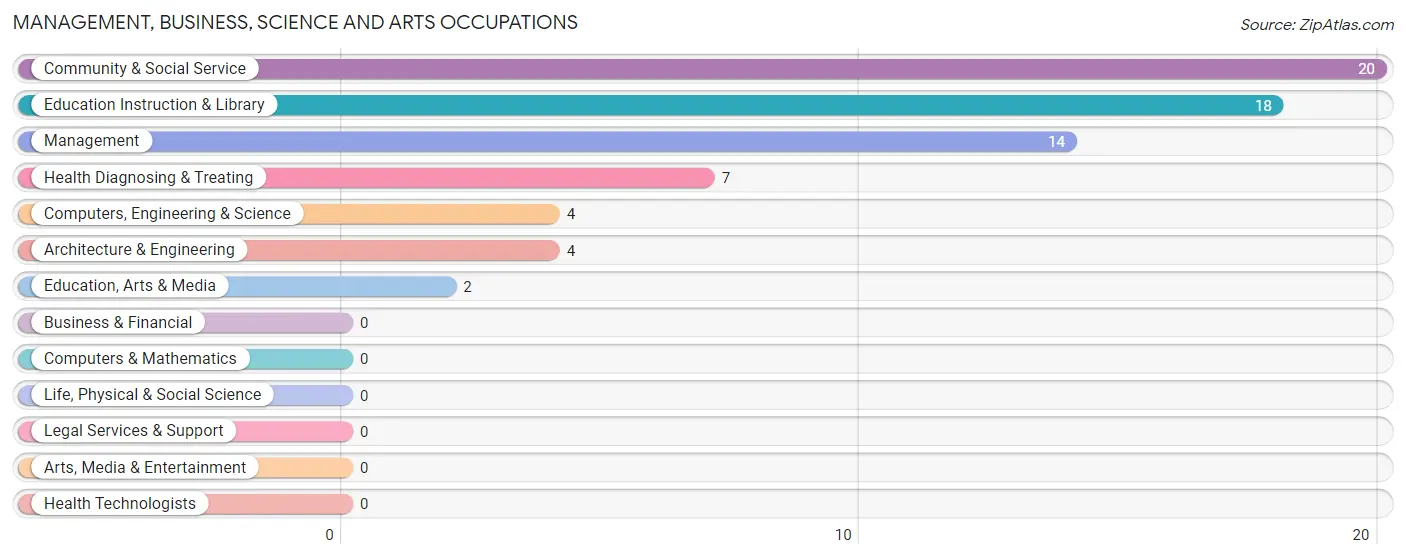
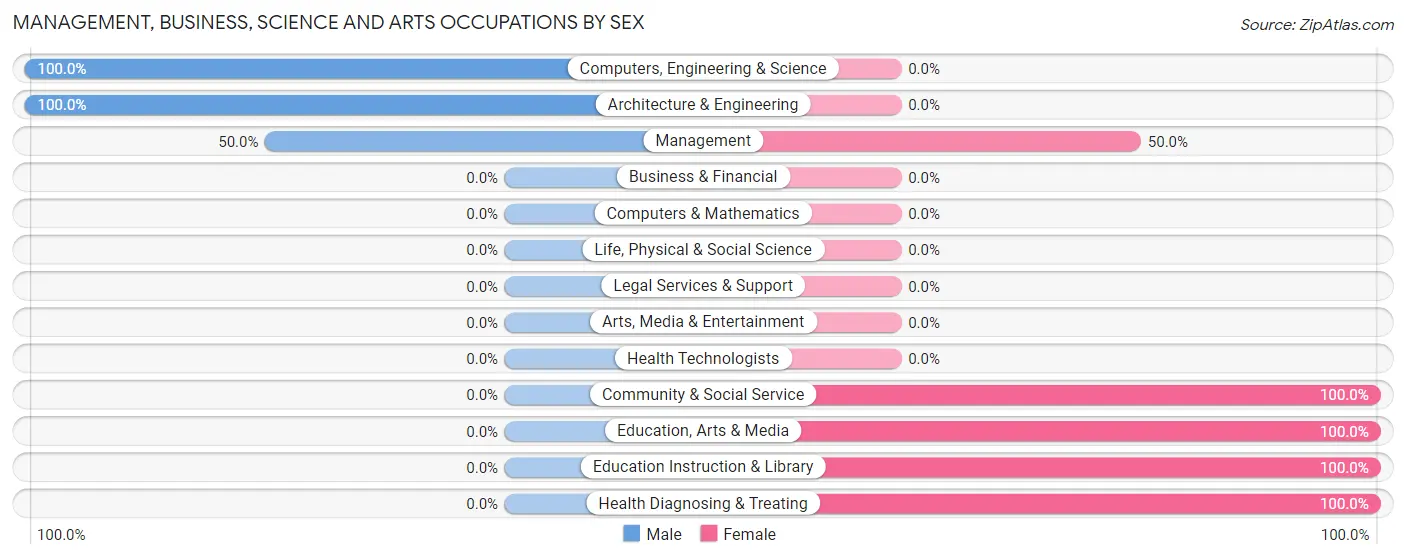
Management, Business, Science and Arts Occupations
The most common Management, Business, Science and Arts occupations in Hoboken are Community & Social Service (20 | 4.3%), Education Instruction & Library (18 | 3.8%), Management (14 | 3.0%), Health Diagnosing & Treating (7 | 1.5%), and Computers, Engineering & Science (4 | 0.9%).
Management, Business, Science and Arts Occupations by Sex
Within the Management, Business, Science and Arts occupations in Hoboken, the most male-oriented occupations are Computers, Engineering & Science (100.0%), Architecture & Engineering (100.0%), and Management (50.0%), while the most female-oriented occupations are Community & Social Service (100.0%), Education, Arts & Media (100.0%), and Education Instruction & Library (100.0%).
| Occupation | Male | Female |
| Management | 7 (50.0%) | 7 (50.0%) |
| Business & Financial | 0 (0.0%) | 0 (0.0%) |
| Computers, Engineering & Science | 4 (100.0%) | 0 (0.0%) |
| Computers & Mathematics | 0 (0.0%) | 0 (0.0%) |
| Architecture & Engineering | 4 (100.0%) | 0 (0.0%) |
| Life, Physical & Social Science | 0 (0.0%) | 0 (0.0%) |
| Community & Social Service | 0 (0.0%) | 20 (100.0%) |
| Education, Arts & Media | 0 (0.0%) | 2 (100.0%) |
| Legal Services & Support | 0 (0.0%) | 0 (0.0%) |
| Education Instruction & Library | 0 (0.0%) | 18 (100.0%) |
| Arts, Media & Entertainment | 0 (0.0%) | 0 (0.0%) |
| Health Diagnosing & Treating | 0 (0.0%) | 7 (100.0%) |
| Health Technologists | 0 (0.0%) | 0 (0.0%) |
| Total (Category) | 11 (24.4%) | 34 (75.6%) |
| Total (Overall) | 290 (62.1%) | 177 (37.9%) |
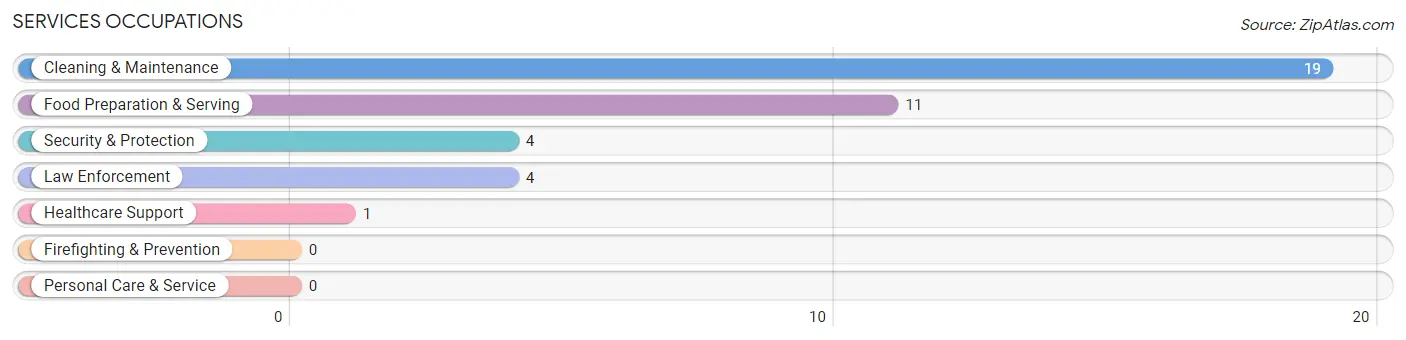
Services Occupations
The most common Services occupations in Hoboken are Cleaning & Maintenance (19 | 4.1%), Food Preparation & Serving (11 | 2.4%), Security & Protection (4 | 0.9%), Law Enforcement (4 | 0.9%), and Healthcare Support (1 | 0.2%).
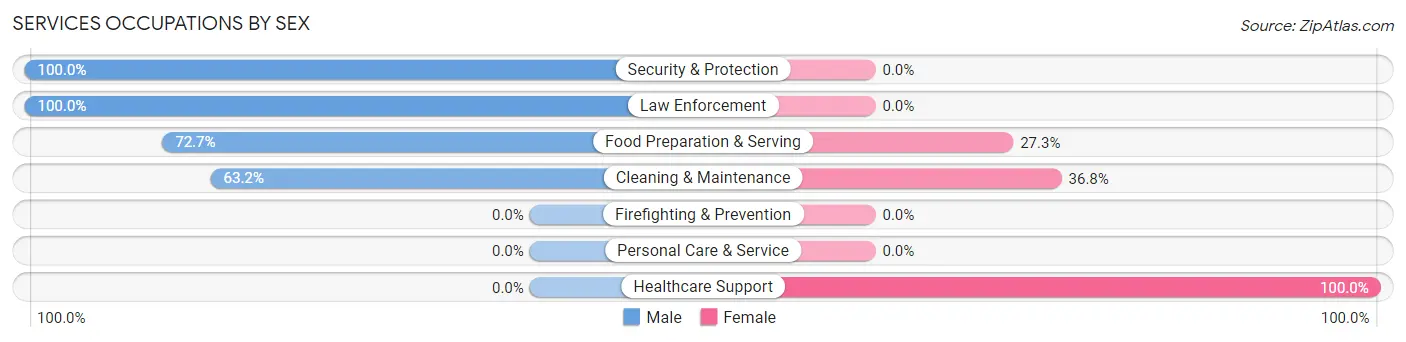
Services Occupations by Sex
Within the Services occupations in Hoboken, the most male-oriented occupations are Security & Protection (100.0%), Law Enforcement (100.0%), and Food Preparation & Serving (72.7%), while the most female-oriented occupations are Healthcare Support (100.0%), Cleaning & Maintenance (36.8%), and Food Preparation & Serving (27.3%).
| Occupation | Male | Female |
| Healthcare Support | 0 (0.0%) | 1 (100.0%) |
| Security & Protection | 4 (100.0%) | 0 (0.0%) |
| Firefighting & Prevention | 0 (0.0%) | 0 (0.0%) |
| Law Enforcement | 4 (100.0%) | 0 (0.0%) |
| Food Preparation & Serving | 8 (72.7%) | 3 (27.3%) |
| Cleaning & Maintenance | 12 (63.2%) | 7 (36.8%) |
| Personal Care & Service | 0 (0.0%) | 0 (0.0%) |
| Total (Category) | 24 (68.6%) | 11 (31.4%) |
| Total (Overall) | 290 (62.1%) | 177 (37.9%) |
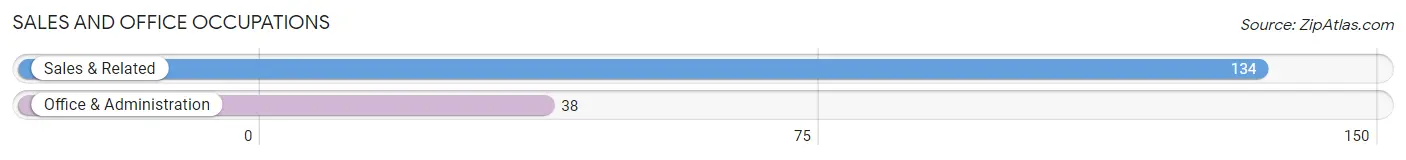
Sales and Office Occupations
The most common Sales and Office occupations in Hoboken are Sales & Related (134 | 28.7%), and Office & Administration (38 | 8.1%).
Sales and Office Occupations by Sex
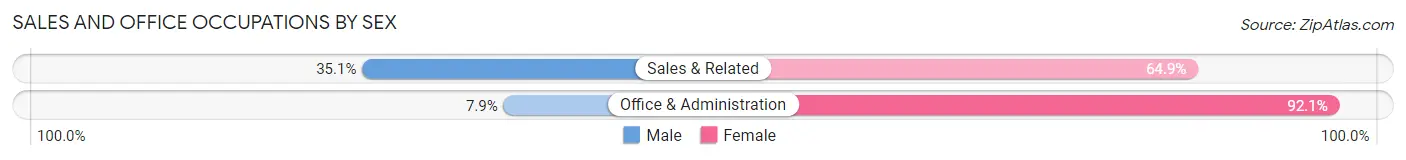
| Occupation | Male | Female |
| Sales & Related | 47 (35.1%) | 87 (64.9%) |
| Office & Administration | 3 (7.9%) | 35 (92.1%) |
| Total (Category) | 50 (29.1%) | 122 (70.9%) |
| Total (Overall) | 290 (62.1%) | 177 (37.9%) |
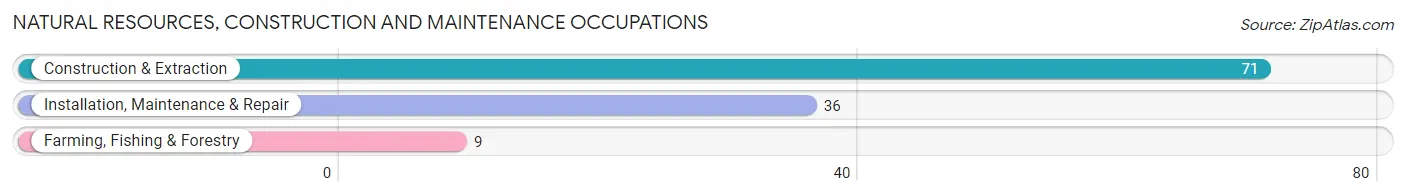
Natural Resources, Construction and Maintenance Occupations
The most common Natural Resources, Construction and Maintenance occupations in Hoboken are Construction & Extraction (71 | 15.2%), Installation, Maintenance & Repair (36 | 7.7%), and Farming, Fishing & Forestry (9 | 1.9%).
Natural Resources, Construction and Maintenance Occupations by Sex
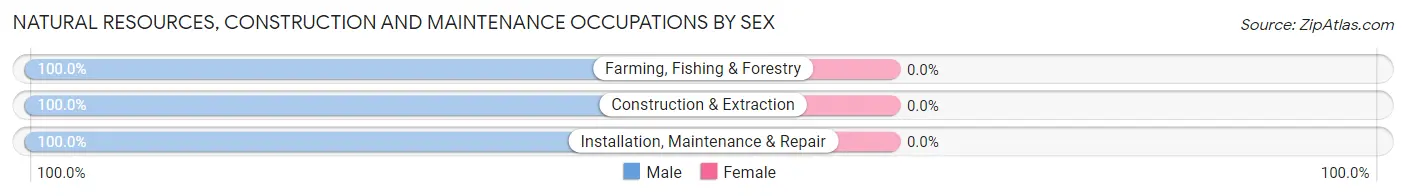
| Occupation | Male | Female |
| Farming, Fishing & Forestry | 9 (100.0%) | 0 (0.0%) |
| Construction & Extraction | 71 (100.0%) | 0 (0.0%) |
| Installation, Maintenance & Repair | 36 (100.0%) | 0 (0.0%) |
| Total (Category) | 116 (100.0%) | 0 (0.0%) |
| Total (Overall) | 290 (62.1%) | 177 (37.9%) |
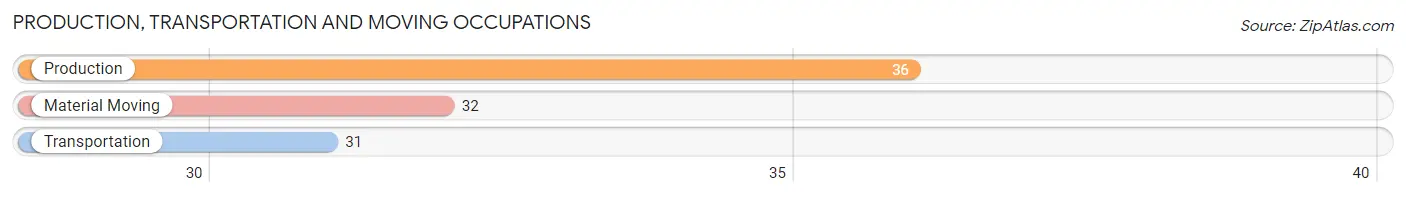
Production, Transportation and Moving Occupations
The most common Production, Transportation and Moving occupations in Hoboken are Production (36 | 7.7%), Material Moving (32 | 6.9%), and Transportation (31 | 6.6%).
Production, Transportation and Moving Occupations by Sex
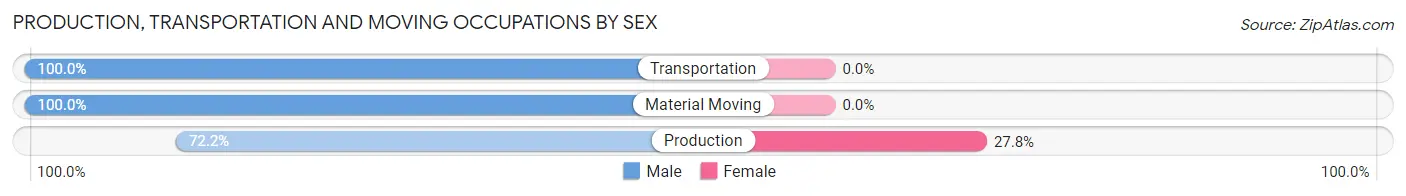
| Occupation | Male | Female |
| Production | 26 (72.2%) | 10 (27.8%) |
| Transportation | 31 (100.0%) | 0 (0.0%) |
| Material Moving | 32 (100.0%) | 0 (0.0%) |
| Total (Category) | 89 (89.9%) | 10 (10.1%) |
| Total (Overall) | 290 (62.1%) | 177 (37.9%) |
Employment Industries by Sex in Hoboken
Employment Industries in Hoboken
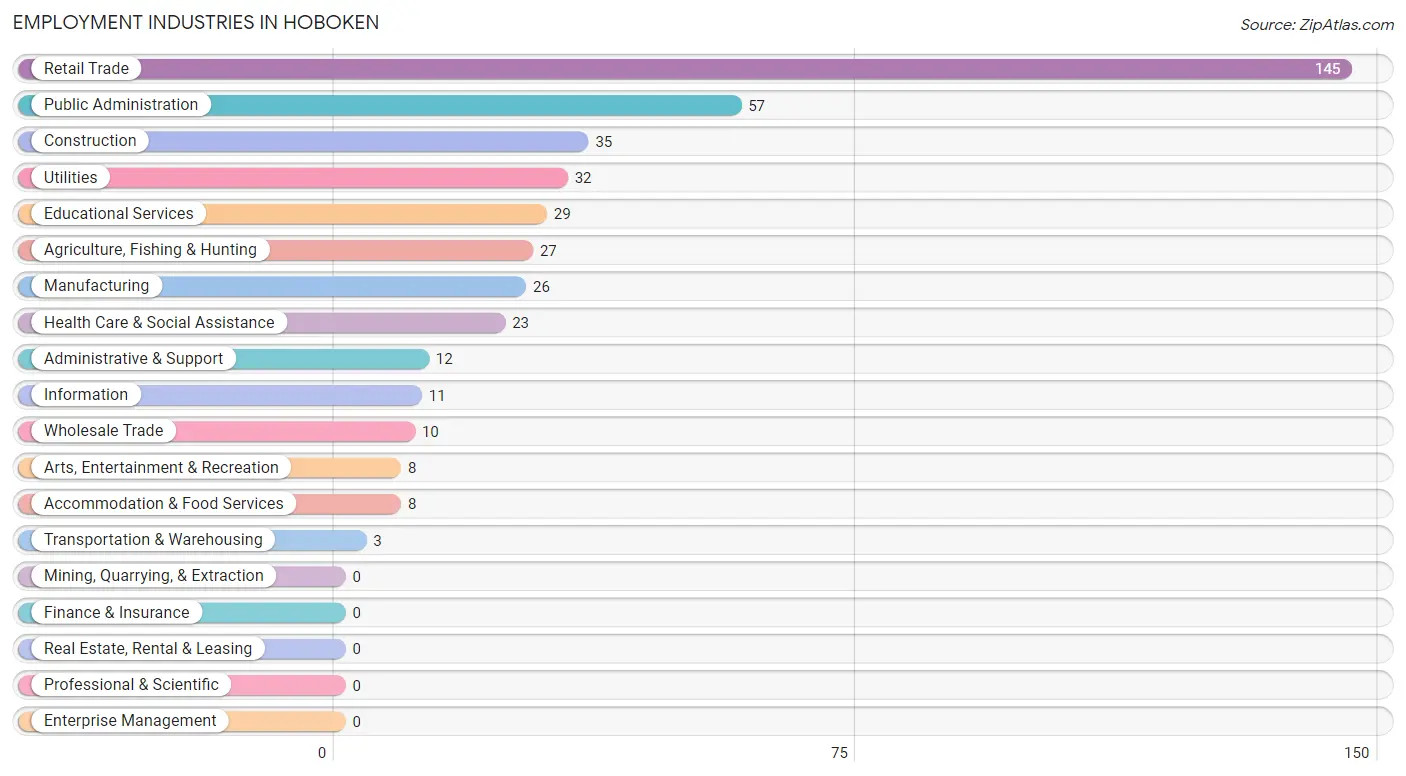
The major employment industries in Hoboken include Retail Trade (145 | 31.0%), Public Administration (57 | 12.2%), Construction (35 | 7.5%), Utilities (32 | 6.9%), and Educational Services (29 | 6.2%).
Employment Industries by Sex in Hoboken
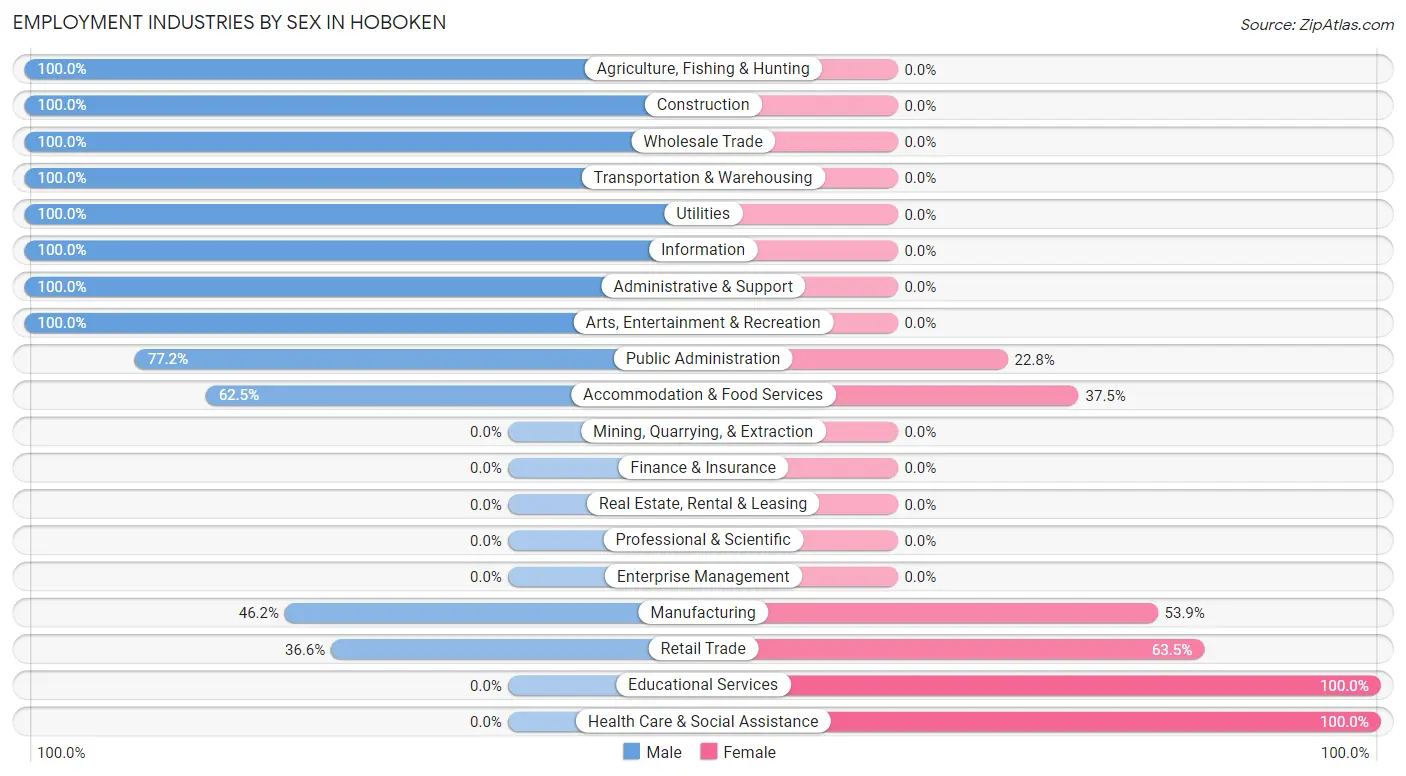
The Hoboken industries that see more men than women are Agriculture, Fishing & Hunting (100.0%), Construction (100.0%), and Wholesale Trade (100.0%), whereas the industries that tend to have a higher number of women are Educational Services (100.0%), Health Care & Social Assistance (100.0%), and Retail Trade (63.4%).
| Industry | Male | Female |
| Agriculture, Fishing & Hunting | 27 (100.0%) | 0 (0.0%) |
| Mining, Quarrying, & Extraction | 0 (0.0%) | 0 (0.0%) |
| Construction | 35 (100.0%) | 0 (0.0%) |
| Manufacturing | 12 (46.2%) | 14 (53.8%) |
| Wholesale Trade | 10 (100.0%) | 0 (0.0%) |
| Retail Trade | 53 (36.5%) | 92 (63.4%) |
| Transportation & Warehousing | 3 (100.0%) | 0 (0.0%) |
| Utilities | 32 (100.0%) | 0 (0.0%) |
| Information | 11 (100.0%) | 0 (0.0%) |
| Finance & Insurance | 0 (0.0%) | 0 (0.0%) |
| Real Estate, Rental & Leasing | 0 (0.0%) | 0 (0.0%) |
| Professional & Scientific | 0 (0.0%) | 0 (0.0%) |
| Enterprise Management | 0 (0.0%) | 0 (0.0%) |
| Administrative & Support | 12 (100.0%) | 0 (0.0%) |
| Educational Services | 0 (0.0%) | 29 (100.0%) |
| Health Care & Social Assistance | 0 (0.0%) | 23 (100.0%) |
| Arts, Entertainment & Recreation | 8 (100.0%) | 0 (0.0%) |
| Accommodation & Food Services | 5 (62.5%) | 3 (37.5%) |
| Public Administration | 44 (77.2%) | 13 (22.8%) |
| Total | 290 (62.1%) | 177 (37.9%) |
Education in Hoboken
School Enrollment in Hoboken
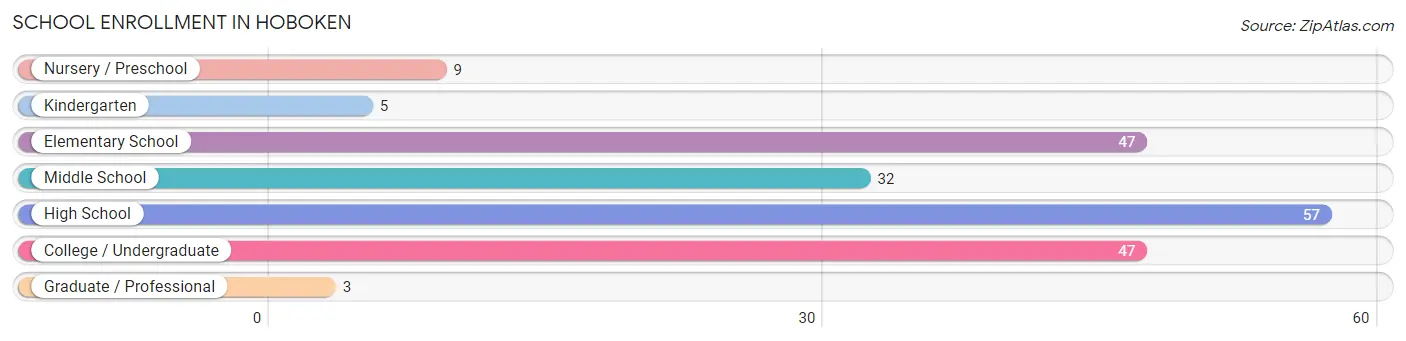
The most common levels of schooling among the 200 students in Hoboken are high school (57 | 28.5%), elementary school (47 | 23.5%), and college / undergraduate (47 | 23.5%).
| School Level | # Students | % Students |
| Nursery / Preschool | 9 | 4.5% |
| Kindergarten | 5 | 2.5% |
| Elementary School | 47 | 23.5% |
| Middle School | 32 | 16.0% |
| High School | 57 | 28.5% |
| College / Undergraduate | 47 | 23.5% |
| Graduate / Professional | 3 | 1.5% |
| Total | 200 | 100.0% |
School Enrollment by Age by Funding Source in Hoboken
Out of a total of 200 students who are enrolled in schools in Hoboken, 13 (6.5%) attend a private institution, while the remaining 187 (93.5%) are enrolled in public schools. The age group of 10 to 14 year olds has the highest likelihood of being enrolled in private schools, with 5 (13.9% in the age bracket) enrolled. Conversely, the age group of 5 to 9 year old has the lowest likelihood of being enrolled in a private school, with 57 (100.0% in the age bracket) attending a public institution.
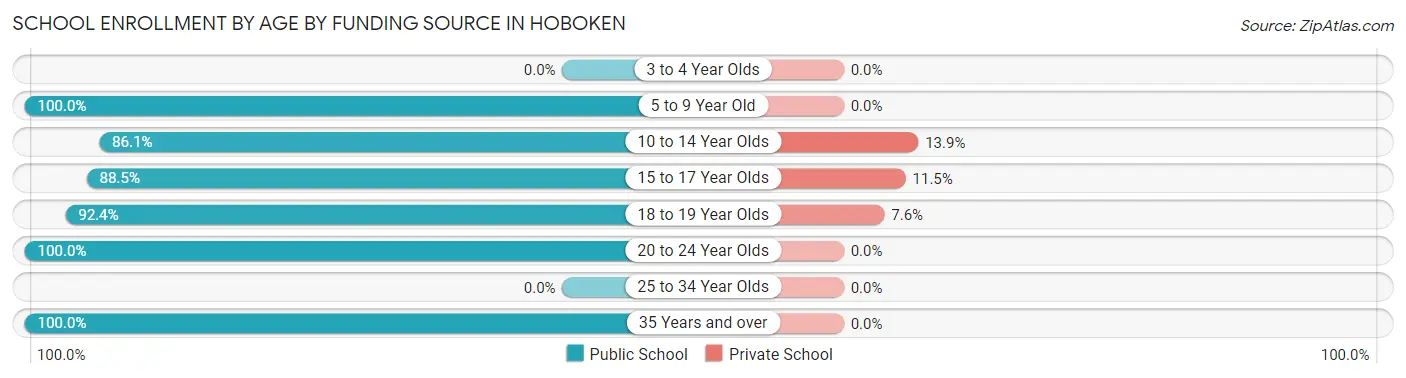
| Age Bracket | Public School | Private School |
| 3 to 4 Year Olds | 0 (0.0%) | 0 (0.0%) |
| 5 to 9 Year Old | 57 (100.0%) | 0 (0.0%) |
| 10 to 14 Year Olds | 31 (86.1%) | 5 (13.9%) |
| 15 to 17 Year Olds | 23 (88.5%) | 3 (11.5%) |
| 18 to 19 Year Olds | 61 (92.4%) | 5 (7.6%) |
| 20 to 24 Year Olds | 10 (100.0%) | 0 (0.0%) |
| 25 to 34 Year Olds | 0 (0.0%) | 0 (0.0%) |
| 35 Years and over | 5 (100.0%) | 0 (0.0%) |
| Total | 187 (93.5%) | 13 (6.5%) |
Educational Attainment by Field of Study in Hoboken
Education (10 | 43.5%), business (7 | 30.4%), science & technology (4 | 17.4%), and literature & languages (2 | 8.7%) are the most common fields of study among 23 individuals in Hoboken who have obtained a bachelor's degree or higher.
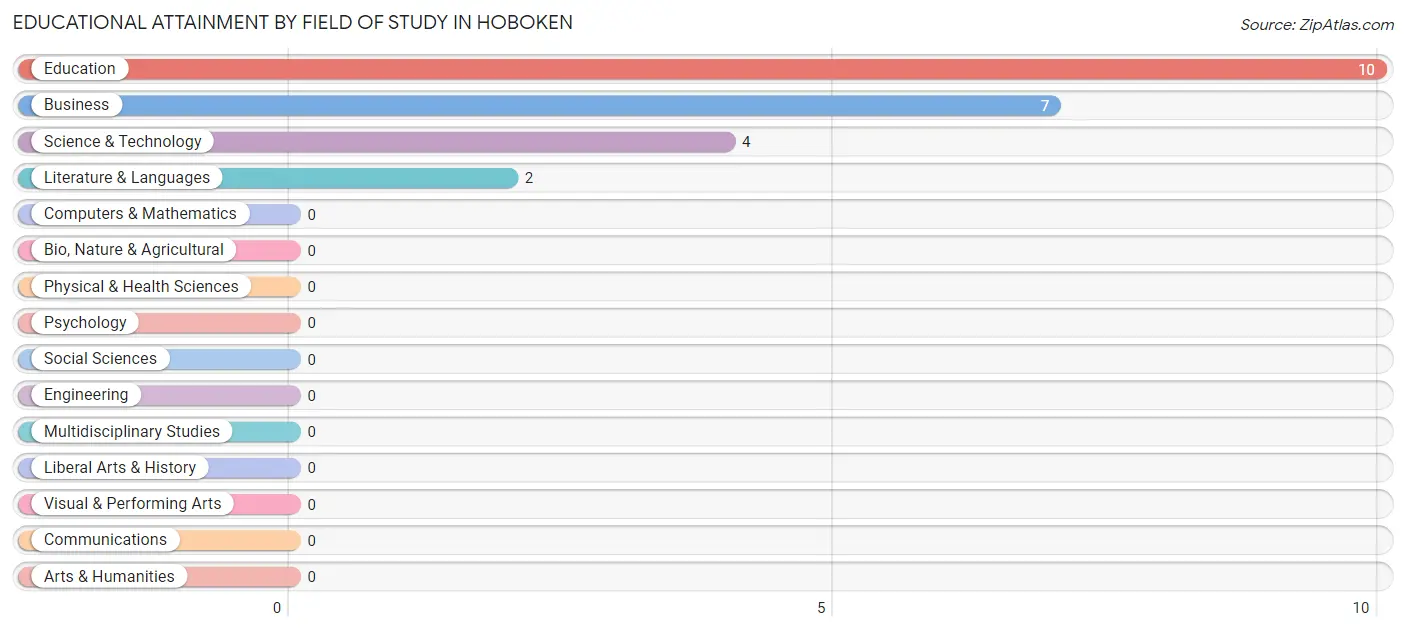
| Field of Study | # Graduates | % Graduates |
| Computers & Mathematics | 0 | 0.0% |
| Bio, Nature & Agricultural | 0 | 0.0% |
| Physical & Health Sciences | 0 | 0.0% |
| Psychology | 0 | 0.0% |
| Social Sciences | 0 | 0.0% |
| Engineering | 0 | 0.0% |
| Multidisciplinary Studies | 0 | 0.0% |
| Science & Technology | 4 | 17.4% |
| Business | 7 | 30.4% |
| Education | 10 | 43.5% |
| Literature & Languages | 2 | 8.7% |
| Liberal Arts & History | 0 | 0.0% |
| Visual & Performing Arts | 0 | 0.0% |
| Communications | 0 | 0.0% |
| Arts & Humanities | 0 | 0.0% |
| Total | 23 | 100.0% |
Transportation & Commute in Hoboken
Vehicle Availability by Sex in Hoboken
The most prevalent vehicle ownership categories in Hoboken are males with 5 or more vehicles (101, accounting for 34.8%) and females with 5 or more vehicles (7, making up 61.6%).
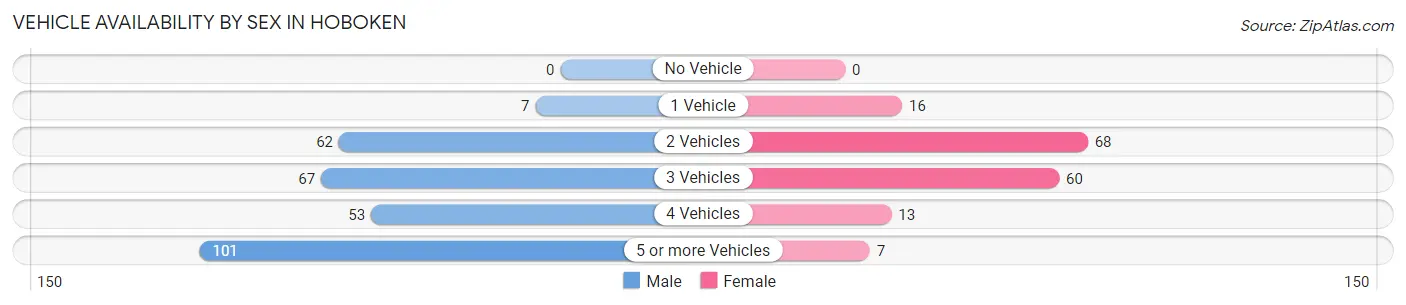
| Vehicles Available | Male | Female |
| No Vehicle | 0 (0.0%) | 0 (0.0%) |
| 1 Vehicle | 7 (2.4%) | 16 (9.8%) |
| 2 Vehicles | 62 (21.4%) | 68 (41.5%) |
| 3 Vehicles | 67 (23.1%) | 60 (36.6%) |
| 4 Vehicles | 53 (18.3%) | 13 (7.9%) |
| 5 or more Vehicles | 101 (34.8%) | 7 (4.3%) |
| Total | 290 (100.0%) | 164 (100.0%) |
Commute Time in Hoboken
The most frequently occuring commute durations in Hoboken are 15 to 19 minutes (145 commuters, 34.2%), less than 5 minutes (109 commuters, 25.7%), and 20 to 24 minutes (62 commuters, 14.6%).
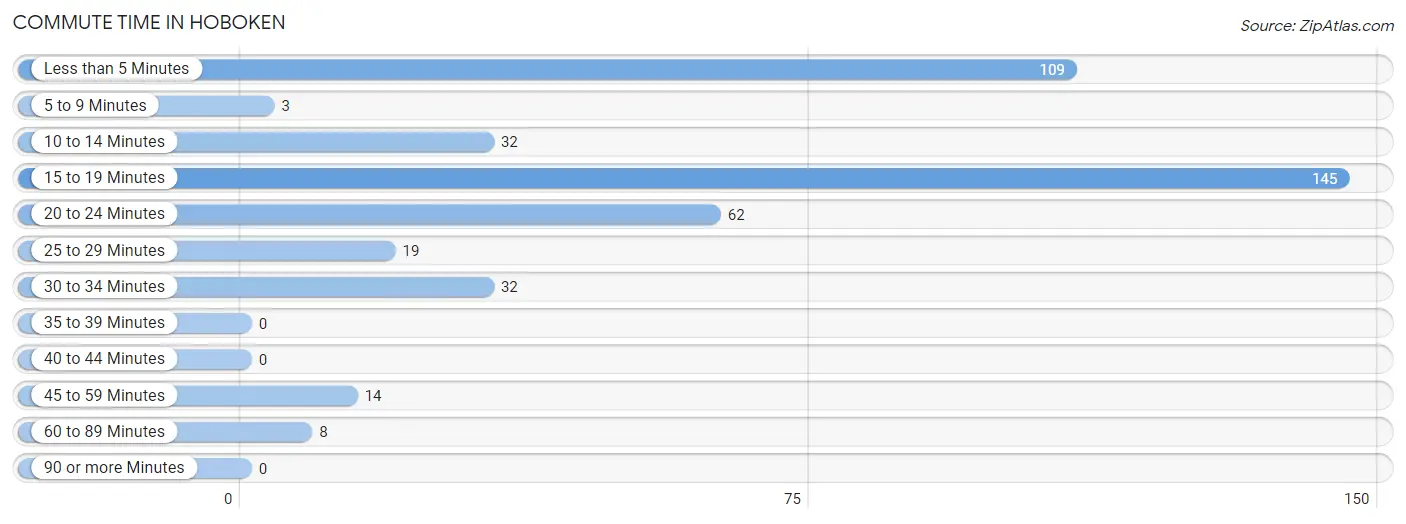
| Commute Time | # Commuters | % Commuters |
| Less than 5 Minutes | 109 | 25.7% |
| 5 to 9 Minutes | 3 | 0.7% |
| 10 to 14 Minutes | 32 | 7.5% |
| 15 to 19 Minutes | 145 | 34.2% |
| 20 to 24 Minutes | 62 | 14.6% |
| 25 to 29 Minutes | 19 | 4.5% |
| 30 to 34 Minutes | 32 | 7.5% |
| 35 to 39 Minutes | 0 | 0.0% |
| 40 to 44 Minutes | 0 | 0.0% |
| 45 to 59 Minutes | 14 | 3.3% |
| 60 to 89 Minutes | 8 | 1.9% |
| 90 or more Minutes | 0 | 0.0% |
Commute Time by Sex in Hoboken
The most common commute times in Hoboken are less than 5 minutes (90 commuters, 31.4%) for males and 15 to 19 minutes (80 commuters, 58.4%) for females.
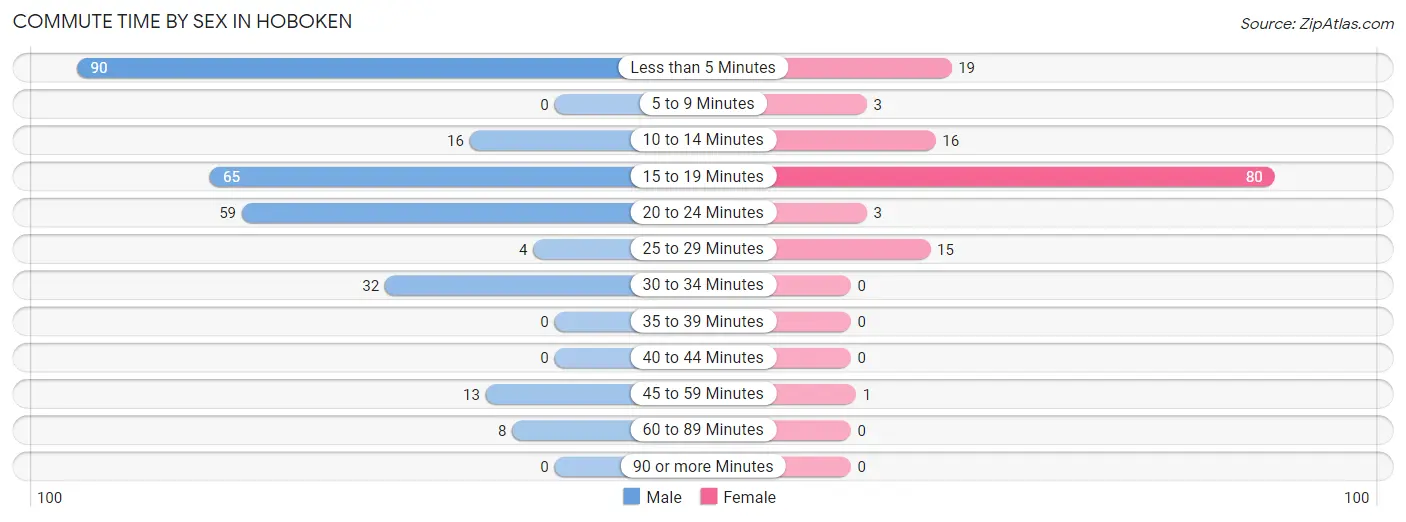
| Commute Time | Male | Female |
| Less than 5 Minutes | 90 (31.4%) | 19 (13.9%) |
| 5 to 9 Minutes | 0 (0.0%) | 3 (2.2%) |
| 10 to 14 Minutes | 16 (5.6%) | 16 (11.7%) |
| 15 to 19 Minutes | 65 (22.7%) | 80 (58.4%) |
| 20 to 24 Minutes | 59 (20.6%) | 3 (2.2%) |
| 25 to 29 Minutes | 4 (1.4%) | 15 (11.0%) |
| 30 to 34 Minutes | 32 (11.2%) | 0 (0.0%) |
| 35 to 39 Minutes | 0 (0.0%) | 0 (0.0%) |
| 40 to 44 Minutes | 0 (0.0%) | 0 (0.0%) |
| 45 to 59 Minutes | 13 (4.5%) | 1 (0.7%) |
| 60 to 89 Minutes | 8 (2.8%) | 0 (0.0%) |
| 90 or more Minutes | 0 (0.0%) | 0 (0.0%) |
Time of Departure to Work by Sex in Hoboken
The most frequent times of departure to work in Hoboken are 7:30 AM to 7:59 AM (115, 40.1%) for males and 6:00 AM to 6:29 AM (65, 47.4%) for females.
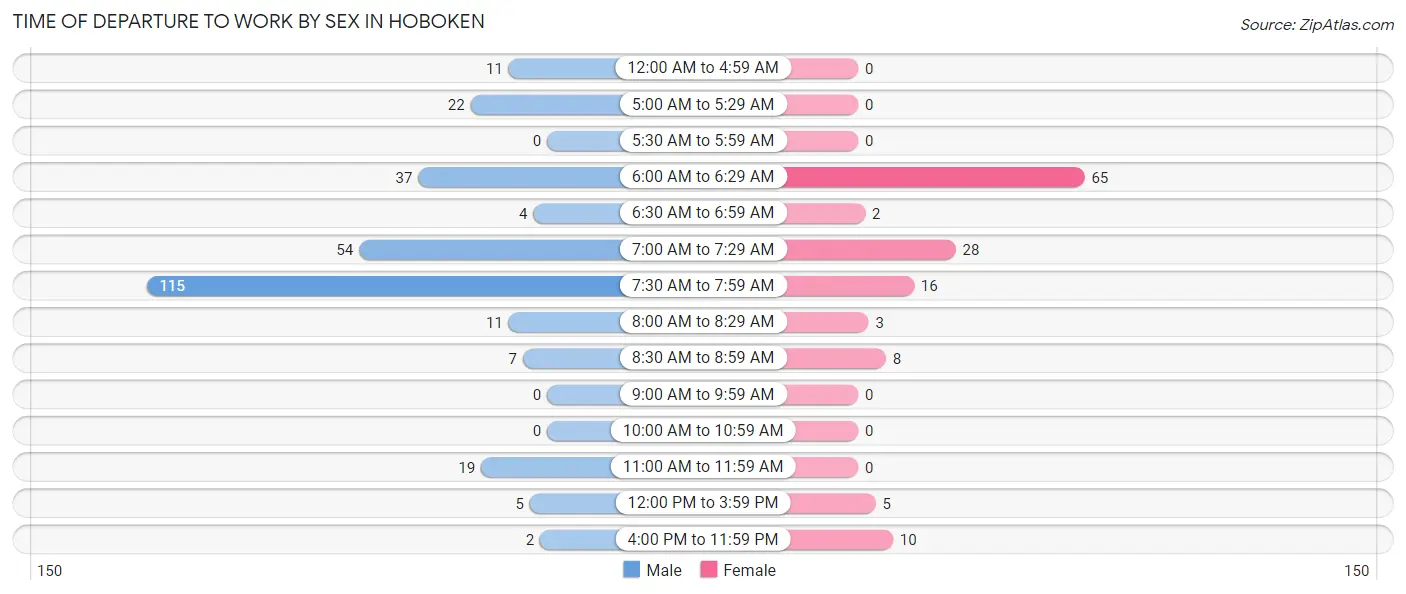
| Time of Departure | Male | Female |
| 12:00 AM to 4:59 AM | 11 (3.8%) | 0 (0.0%) |
| 5:00 AM to 5:29 AM | 22 (7.7%) | 0 (0.0%) |
| 5:30 AM to 5:59 AM | 0 (0.0%) | 0 (0.0%) |
| 6:00 AM to 6:29 AM | 37 (12.9%) | 65 (47.4%) |
| 6:30 AM to 6:59 AM | 4 (1.4%) | 2 (1.5%) |
| 7:00 AM to 7:29 AM | 54 (18.8%) | 28 (20.4%) |
| 7:30 AM to 7:59 AM | 115 (40.1%) | 16 (11.7%) |
| 8:00 AM to 8:29 AM | 11 (3.8%) | 3 (2.2%) |
| 8:30 AM to 8:59 AM | 7 (2.4%) | 8 (5.8%) |
| 9:00 AM to 9:59 AM | 0 (0.0%) | 0 (0.0%) |
| 10:00 AM to 10:59 AM | 0 (0.0%) | 0 (0.0%) |
| 11:00 AM to 11:59 AM | 19 (6.6%) | 0 (0.0%) |
| 12:00 PM to 3:59 PM | 5 (1.7%) | 5 (3.6%) |
| 4:00 PM to 11:59 PM | 2 (0.7%) | 10 (7.3%) |
| Total | 287 (100.0%) | 137 (100.0%) |
Housing Occupancy in Hoboken
Occupancy by Ownership in Hoboken
Of the total 282 dwellings in Hoboken, owner-occupied units account for 224 (79.4%), while renter-occupied units make up 58 (20.6%).
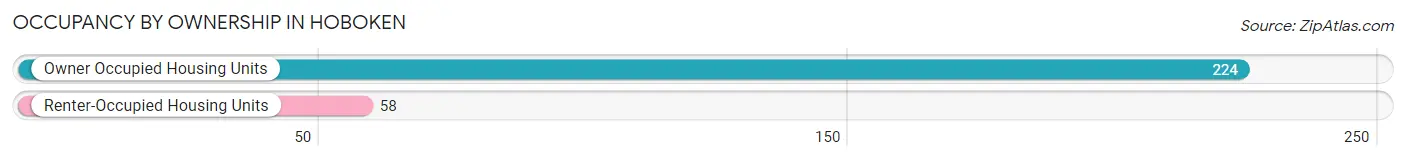
| Occupancy | # Housing Units | % Housing Units |
| Owner Occupied Housing Units | 224 | 79.4% |
| Renter-Occupied Housing Units | 58 | 20.6% |
| Total Occupied Housing Units | 282 | 100.0% |
Occupancy by Household Size in Hoboken
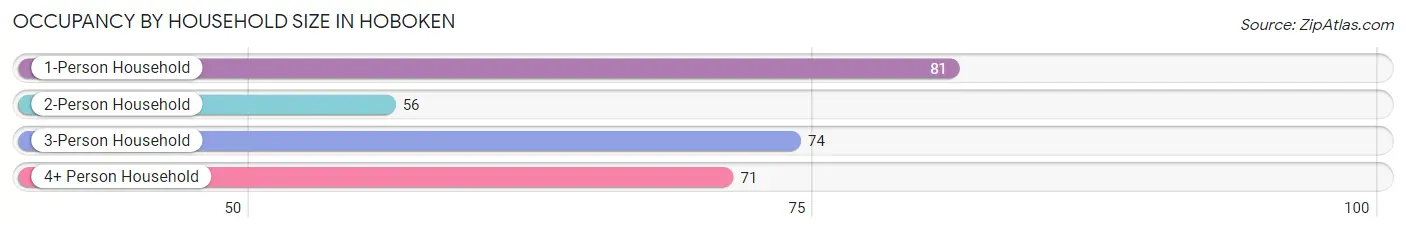
| Household Size | # Housing Units | % Housing Units |
| 1-Person Household | 81 | 28.7% |
| 2-Person Household | 56 | 19.9% |
| 3-Person Household | 74 | 26.2% |
| 4+ Person Household | 71 | 25.2% |
| Total Housing Units | 282 | 100.0% |
Occupancy by Ownership by Household Size in Hoboken
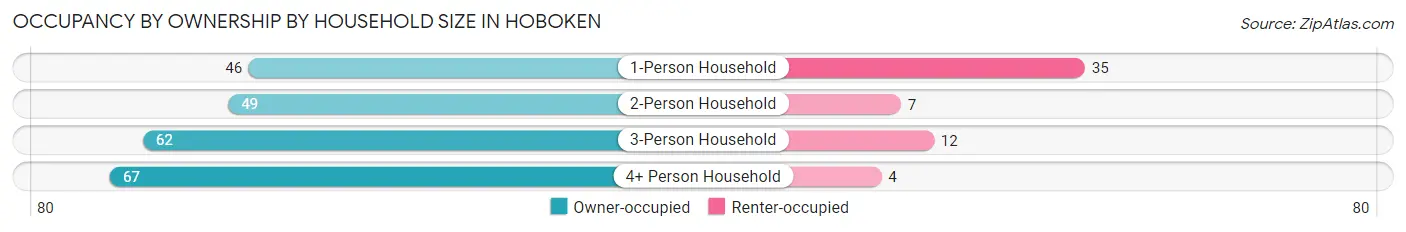
| Household Size | Owner-occupied | Renter-occupied |
| 1-Person Household | 46 (56.8%) | 35 (43.2%) |
| 2-Person Household | 49 (87.5%) | 7 (12.5%) |
| 3-Person Household | 62 (83.8%) | 12 (16.2%) |
| 4+ Person Household | 67 (94.4%) | 4 (5.6%) |
| Total Housing Units | 224 (79.4%) | 58 (20.6%) |
Occupancy by Educational Attainment in Hoboken
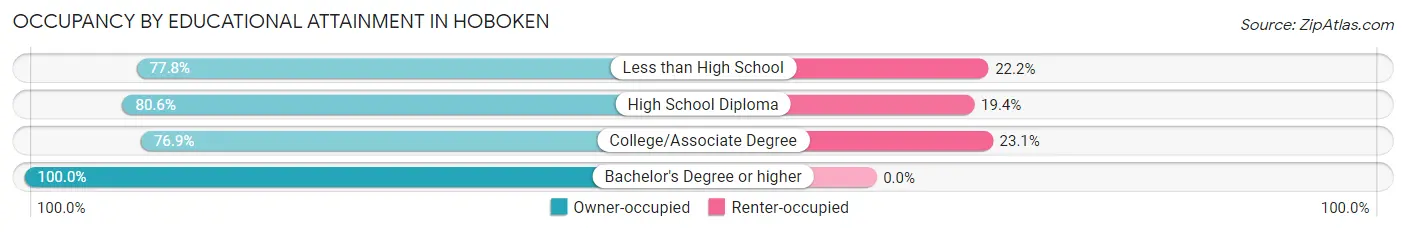
| Household Size | Owner-occupied | Renter-occupied |
| Less than High School | 28 (77.8%) | 8 (22.2%) |
| High School Diploma | 83 (80.6%) | 20 (19.4%) |
| College/Associate Degree | 100 (76.9%) | 30 (23.1%) |
| Bachelor's Degree or higher | 13 (100.0%) | 0 (0.0%) |
Occupancy by Age of Householder in Hoboken
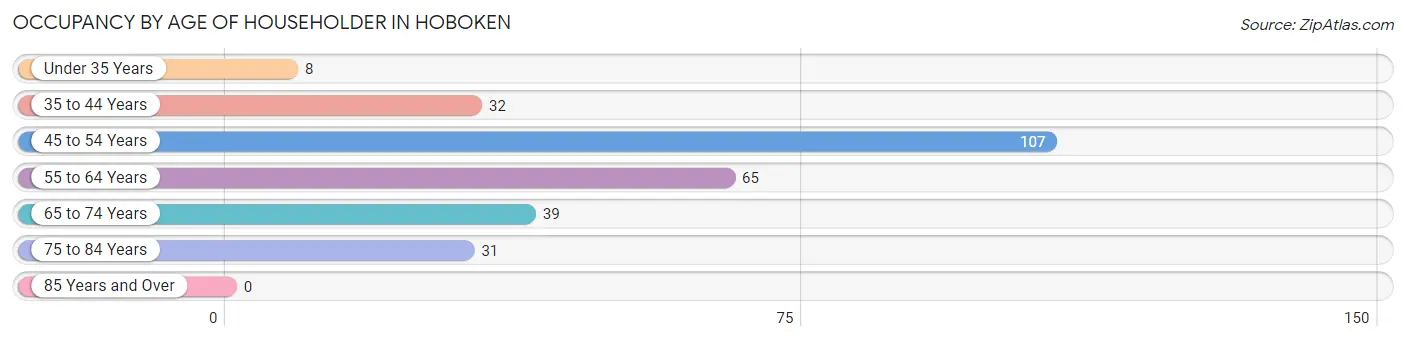
| Age Bracket | # Households | % Households |
| Under 35 Years | 8 | 2.8% |
| 35 to 44 Years | 32 | 11.4% |
| 45 to 54 Years | 107 | 37.9% |
| 55 to 64 Years | 65 | 23.1% |
| 65 to 74 Years | 39 | 13.8% |
| 75 to 84 Years | 31 | 11.0% |
| 85 Years and Over | 0 | 0.0% |
| Total | 282 | 100.0% |
Housing Finances in Hoboken
Median Income by Occupancy in Hoboken
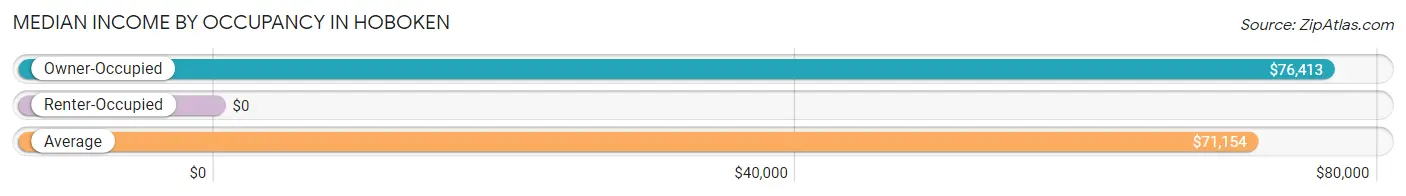
| Occupancy Type | # Households | Median Income |
| Owner-Occupied | 224 (79.4%) | $76,413 |
| Renter-Occupied | 58 (20.6%) | $0 |
| Average | 282 (100.0%) | $71,154 |
Occupancy by Householder Income Bracket in Hoboken
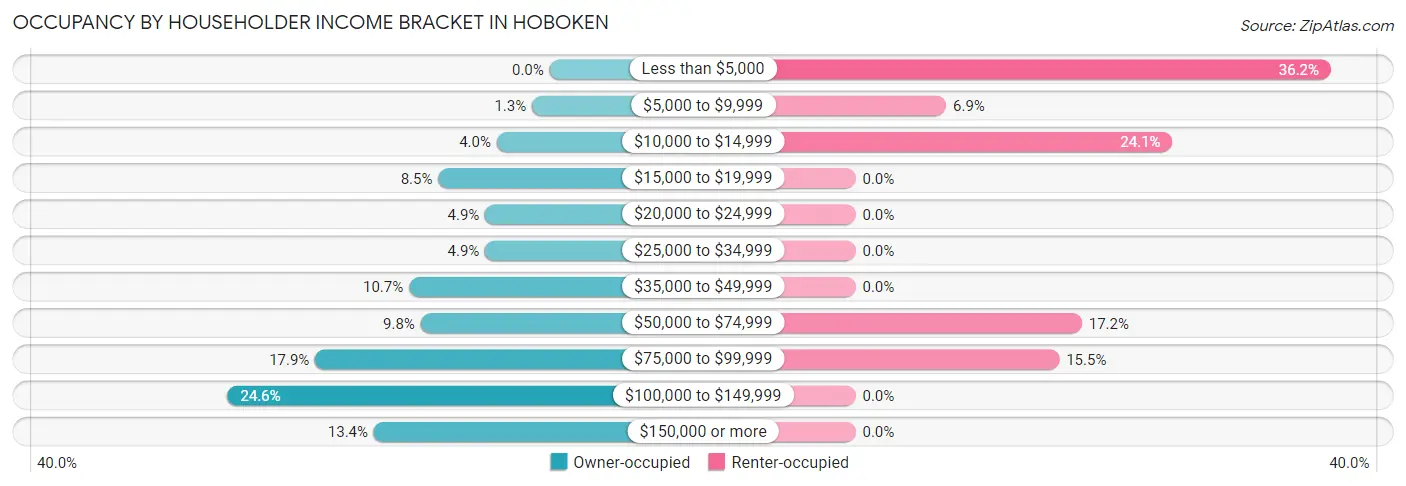
| Income Bracket | Owner-occupied | Renter-occupied |
| Less than $5,000 | 0 (0.0%) | 21 (36.2%) |
| $5,000 to $9,999 | 3 (1.3%) | 4 (6.9%) |
| $10,000 to $14,999 | 9 (4.0%) | 14 (24.1%) |
| $15,000 to $19,999 | 19 (8.5%) | 0 (0.0%) |
| $20,000 to $24,999 | 11 (4.9%) | 0 (0.0%) |
| $25,000 to $34,999 | 11 (4.9%) | 0 (0.0%) |
| $35,000 to $49,999 | 24 (10.7%) | 0 (0.0%) |
| $50,000 to $74,999 | 22 (9.8%) | 10 (17.2%) |
| $75,000 to $99,999 | 40 (17.9%) | 9 (15.5%) |
| $100,000 to $149,999 | 55 (24.5%) | 0 (0.0%) |
| $150,000 or more | 30 (13.4%) | 0 (0.0%) |
| Total | 224 (100.0%) | 58 (100.0%) |
Monthly Housing Cost Tiers in Hoboken
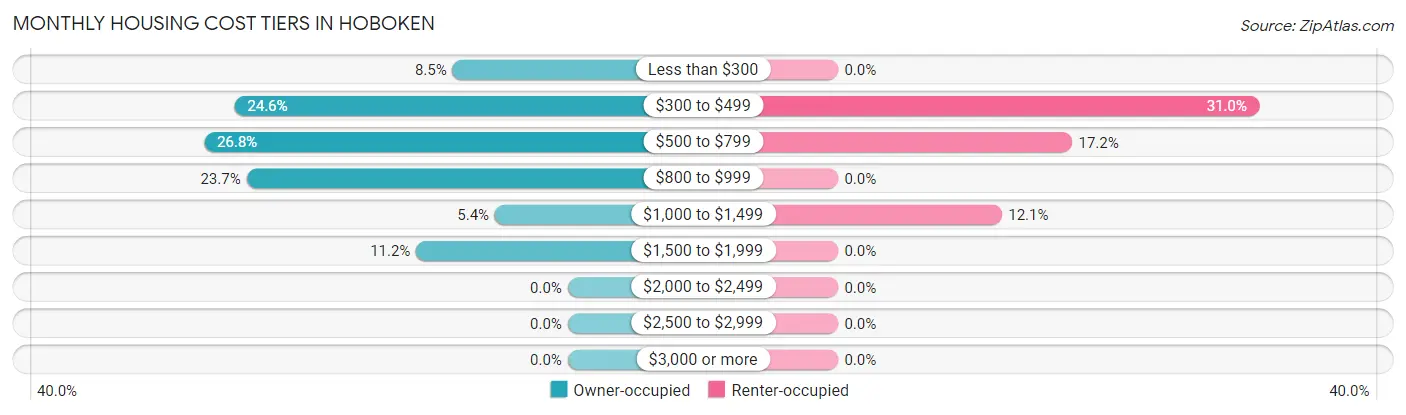
| Monthly Cost | Owner-occupied | Renter-occupied |
| Less than $300 | 19 (8.5%) | 0 (0.0%) |
| $300 to $499 | 55 (24.5%) | 18 (31.0%) |
| $500 to $799 | 60 (26.8%) | 10 (17.2%) |
| $800 to $999 | 53 (23.7%) | 0 (0.0%) |
| $1,000 to $1,499 | 12 (5.4%) | 7 (12.1%) |
| $1,500 to $1,999 | 25 (11.2%) | 0 (0.0%) |
| $2,000 to $2,499 | 0 (0.0%) | 0 (0.0%) |
| $2,500 to $2,999 | 0 (0.0%) | 0 (0.0%) |
| $3,000 or more | 0 (0.0%) | 0 (0.0%) |
| Total | 224 (100.0%) | 58 (100.0%) |
Physical Housing Characteristics in Hoboken
Housing Structures in Hoboken
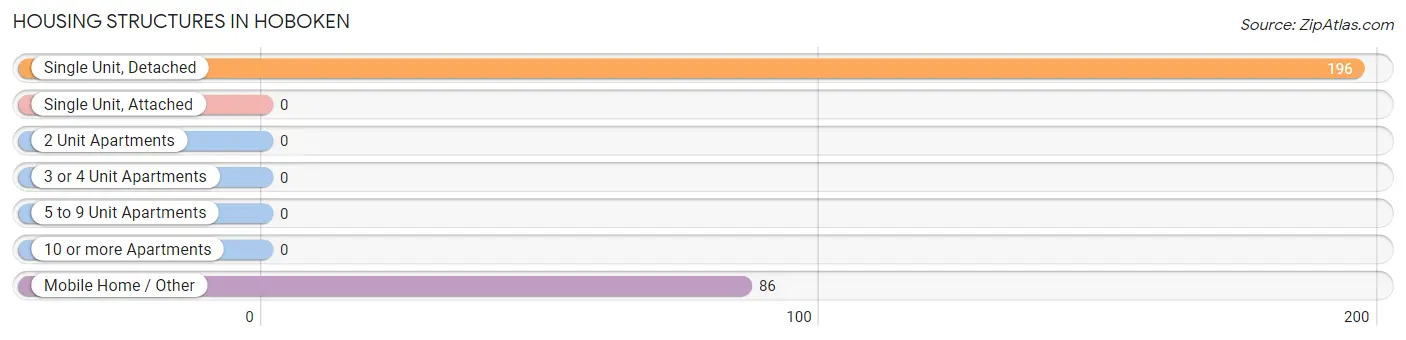
| Structure Type | # Housing Units | % Housing Units |
| Single Unit, Detached | 196 | 69.5% |
| Single Unit, Attached | 0 | 0.0% |
| 2 Unit Apartments | 0 | 0.0% |
| 3 or 4 Unit Apartments | 0 | 0.0% |
| 5 to 9 Unit Apartments | 0 | 0.0% |
| 10 or more Apartments | 0 | 0.0% |
| Mobile Home / Other | 86 | 30.5% |
| Total | 282 | 100.0% |
Housing Structures by Occupancy in Hoboken
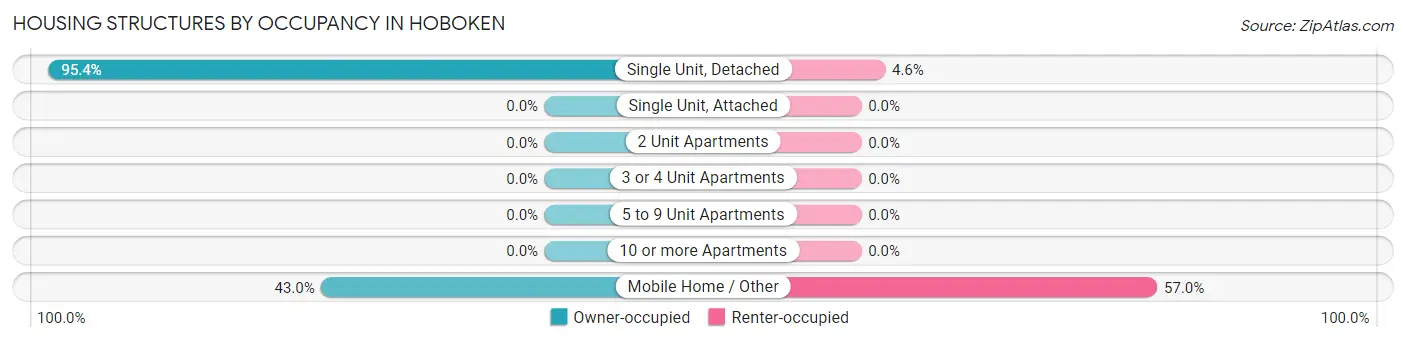
| Structure Type | Owner-occupied | Renter-occupied |
| Single Unit, Detached | 187 (95.4%) | 9 (4.6%) |
| Single Unit, Attached | 0 (0.0%) | 0 (0.0%) |
| 2 Unit Apartments | 0 (0.0%) | 0 (0.0%) |
| 3 or 4 Unit Apartments | 0 (0.0%) | 0 (0.0%) |
| 5 to 9 Unit Apartments | 0 (0.0%) | 0 (0.0%) |
| 10 or more Apartments | 0 (0.0%) | 0 (0.0%) |
| Mobile Home / Other | 37 (43.0%) | 49 (57.0%) |
| Total | 224 (79.4%) | 58 (20.6%) |
Housing Structures by Number of Rooms in Hoboken
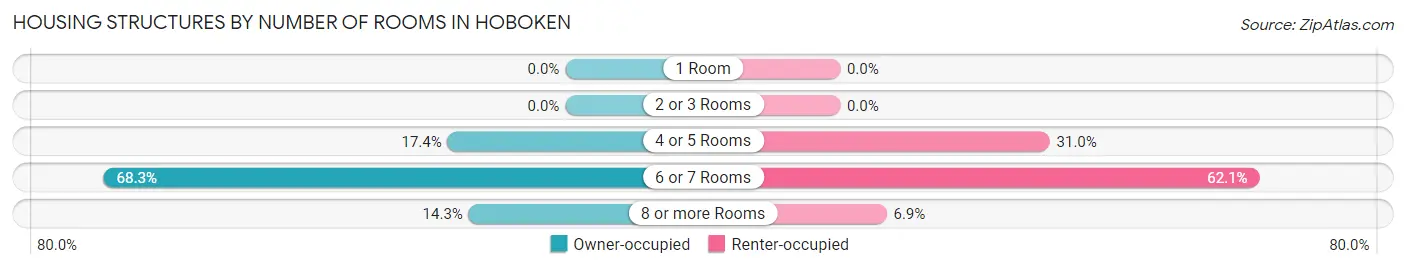
| Number of Rooms | Owner-occupied | Renter-occupied |
| 1 Room | 0 (0.0%) | 0 (0.0%) |
| 2 or 3 Rooms | 0 (0.0%) | 0 (0.0%) |
| 4 or 5 Rooms | 39 (17.4%) | 18 (31.0%) |
| 6 or 7 Rooms | 153 (68.3%) | 36 (62.1%) |
| 8 or more Rooms | 32 (14.3%) | 4 (6.9%) |
| Total | 224 (100.0%) | 58 (100.0%) |
Housing Structure by Heating Type in Hoboken
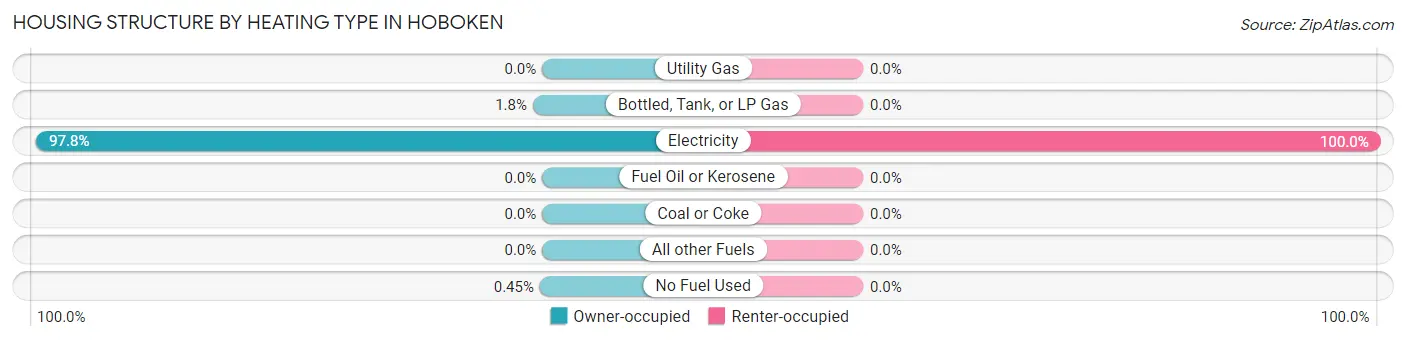
| Heating Type | Owner-occupied | Renter-occupied |
| Utility Gas | 0 (0.0%) | 0 (0.0%) |
| Bottled, Tank, or LP Gas | 4 (1.8%) | 0 (0.0%) |
| Electricity | 219 (97.8%) | 58 (100.0%) |
| Fuel Oil or Kerosene | 0 (0.0%) | 0 (0.0%) |
| Coal or Coke | 0 (0.0%) | 0 (0.0%) |
| All other Fuels | 0 (0.0%) | 0 (0.0%) |
| No Fuel Used | 1 (0.4%) | 0 (0.0%) |
| Total | 224 (100.0%) | 58 (100.0%) |
Household Vehicle Usage in Hoboken
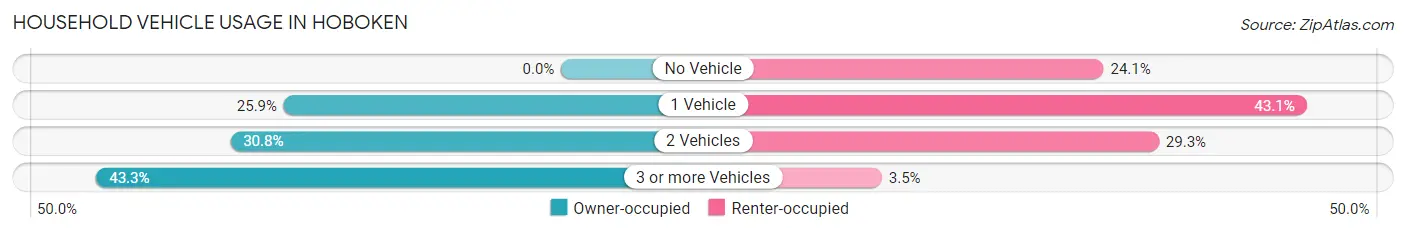
| Vehicles per Household | Owner-occupied | Renter-occupied |
| No Vehicle | 0 (0.0%) | 14 (24.1%) |
| 1 Vehicle | 58 (25.9%) | 25 (43.1%) |
| 2 Vehicles | 69 (30.8%) | 17 (29.3%) |
| 3 or more Vehicles | 97 (43.3%) | 2 (3.5%) |
| Total | 224 (100.0%) | 58 (100.0%) |
Real Estate & Mortgages in Hoboken
Real Estate and Mortgage Overview in Hoboken
| Characteristic | Without Mortgage | With Mortgage |
| Housing Units | 131 | 93 |
| Median Property Value | $137,500 | $138,700 |
| Median Household Income | $67,679 | $11 |
| Monthly Housing Costs | $458 | $0 |
| Real Estate Taxes | $956 | $0 |
Property Value by Mortgage Status in Hoboken
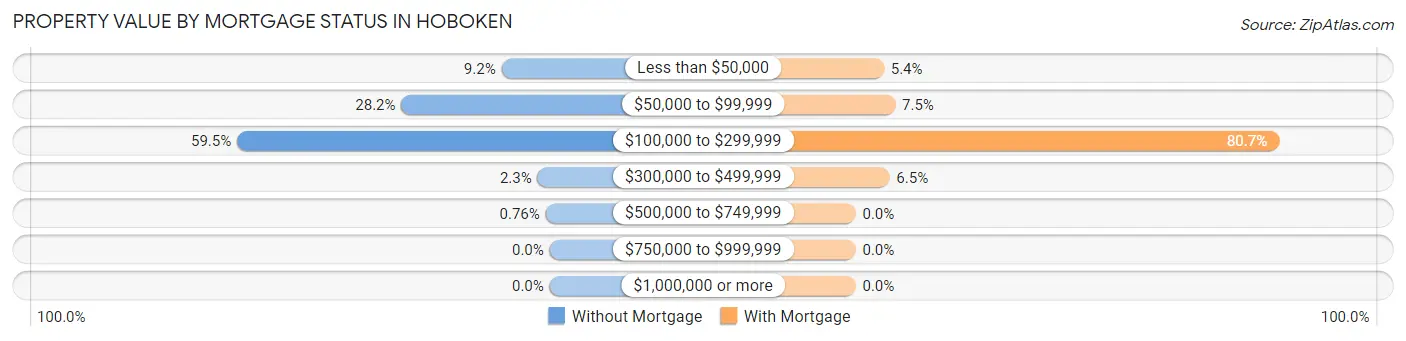
| Property Value | Without Mortgage | With Mortgage |
| Less than $50,000 | 12 (9.2%) | 5 (5.4%) |
| $50,000 to $99,999 | 37 (28.2%) | 7 (7.5%) |
| $100,000 to $299,999 | 78 (59.5%) | 75 (80.6%) |
| $300,000 to $499,999 | 3 (2.3%) | 6 (6.5%) |
| $500,000 to $749,999 | 1 (0.8%) | 0 (0.0%) |
| $750,000 to $999,999 | 0 (0.0%) | 0 (0.0%) |
| $1,000,000 or more | 0 (0.0%) | 0 (0.0%) |
| Total | 131 (100.0%) | 93 (100.0%) |
Household Income by Mortgage Status in Hoboken
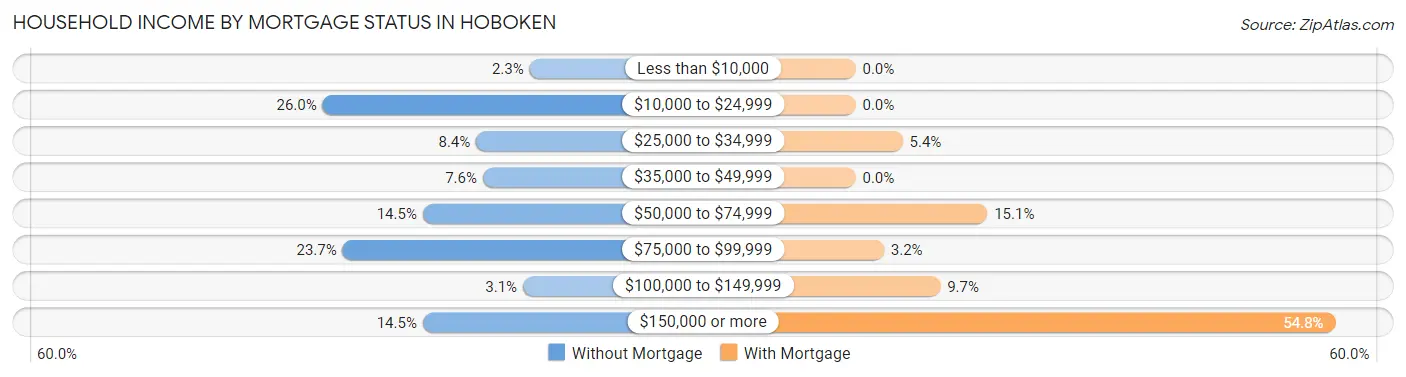
| Household Income | Without Mortgage | With Mortgage |
| Less than $10,000 | 3 (2.3%) | 0 (0.0%) |
| $10,000 to $24,999 | 34 (26.0%) | 0 (0.0%) |
| $25,000 to $34,999 | 11 (8.4%) | 5 (5.4%) |
| $35,000 to $49,999 | 10 (7.6%) | 0 (0.0%) |
| $50,000 to $74,999 | 19 (14.5%) | 14 (15.0%) |
| $75,000 to $99,999 | 31 (23.7%) | 3 (3.2%) |
| $100,000 to $149,999 | 4 (3.0%) | 9 (9.7%) |
| $150,000 or more | 19 (14.5%) | 51 (54.8%) |
| Total | 131 (100.0%) | 93 (100.0%) |
Property Value to Household Income Ratio in Hoboken
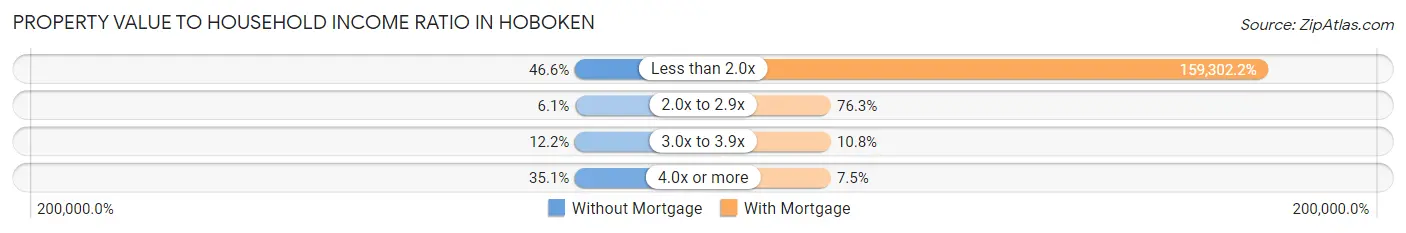
| Value-to-Income Ratio | Without Mortgage | With Mortgage |
| Less than 2.0x | 61 (46.6%) | 148,151 (159,302.2%) |
| 2.0x to 2.9x | 8 (6.1%) | 71 (76.3%) |
| 3.0x to 3.9x | 16 (12.2%) | 10 (10.7%) |
| 4.0x or more | 46 (35.1%) | 7 (7.5%) |
| Total | 131 (100.0%) | 93 (100.0%) |
Real Estate Taxes by Mortgage Status in Hoboken
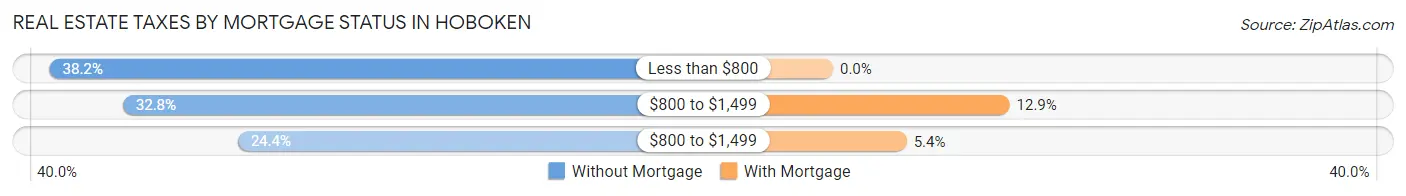
| Property Taxes | Without Mortgage | With Mortgage |
| Less than $800 | 50 (38.2%) | 0 (0.0%) |
| $800 to $1,499 | 43 (32.8%) | 12 (12.9%) |
| $800 to $1,499 | 32 (24.4%) | 5 (5.4%) |
| Total | 131 (100.0%) | 93 (100.0%) |
Health & Disability in Hoboken
Health Insurance Coverage by Age in Hoboken
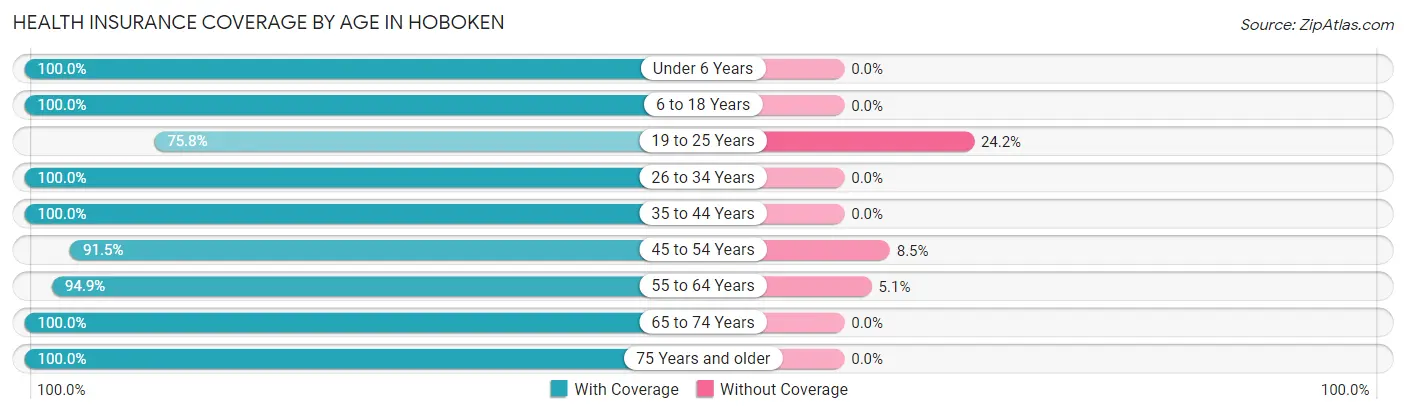
| Age Bracket | With Coverage | Without Coverage |
| Under 6 Years | 47 (100.0%) | 0 (0.0%) |
| 6 to 18 Years | 132 (100.0%) | 0 (0.0%) |
| 19 to 25 Years | 116 (75.8%) | 37 (24.2%) |
| 26 to 34 Years | 73 (100.0%) | 0 (0.0%) |
| 35 to 44 Years | 89 (100.0%) | 0 (0.0%) |
| 45 to 54 Years | 151 (91.5%) | 14 (8.5%) |
| 55 to 64 Years | 93 (94.9%) | 5 (5.1%) |
| 65 to 74 Years | 61 (100.0%) | 0 (0.0%) |
| 75 Years and older | 40 (100.0%) | 0 (0.0%) |
| Total | 802 (93.5%) | 56 (6.5%) |
Health Insurance Coverage by Citizenship Status in Hoboken
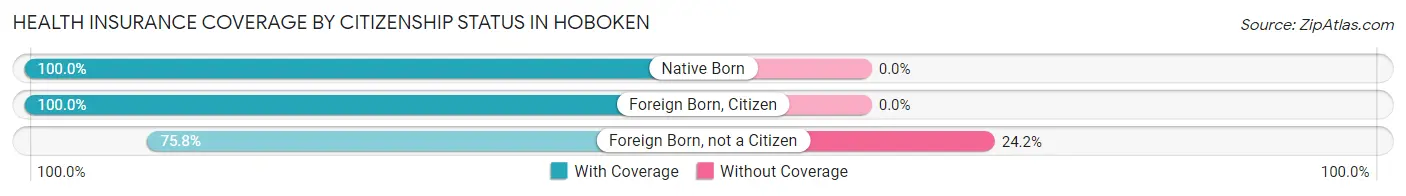
| Citizenship Status | With Coverage | Without Coverage |
| Native Born | 47 (100.0%) | 0 (0.0%) |
| Foreign Born, Citizen | 132 (100.0%) | 0 (0.0%) |
| Foreign Born, not a Citizen | 116 (75.8%) | 37 (24.2%) |
Health Insurance Coverage by Household Income in Hoboken
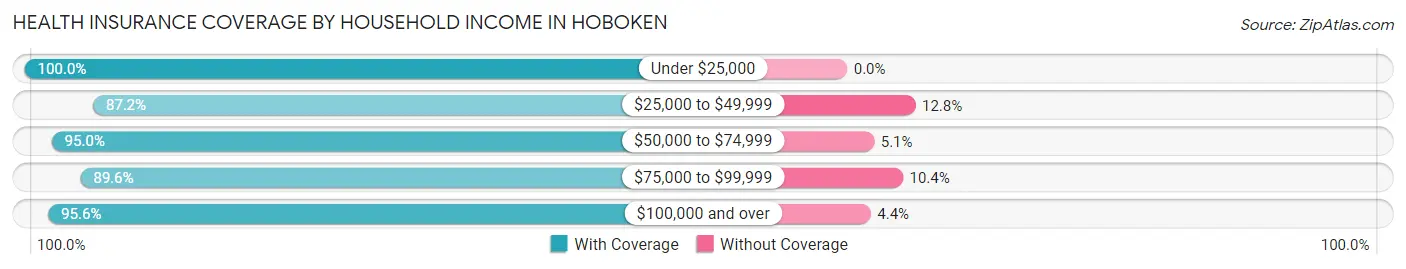
| Household Income | With Coverage | Without Coverage |
| Under $25,000 | 107 (100.0%) | 0 (0.0%) |
| $25,000 to $49,999 | 75 (87.2%) | 11 (12.8%) |
| $50,000 to $74,999 | 94 (95.0%) | 5 (5.1%) |
| $75,000 to $99,999 | 223 (89.6%) | 26 (10.4%) |
| $100,000 and over | 303 (95.6%) | 14 (4.4%) |
Public vs Private Health Insurance Coverage by Age in Hoboken
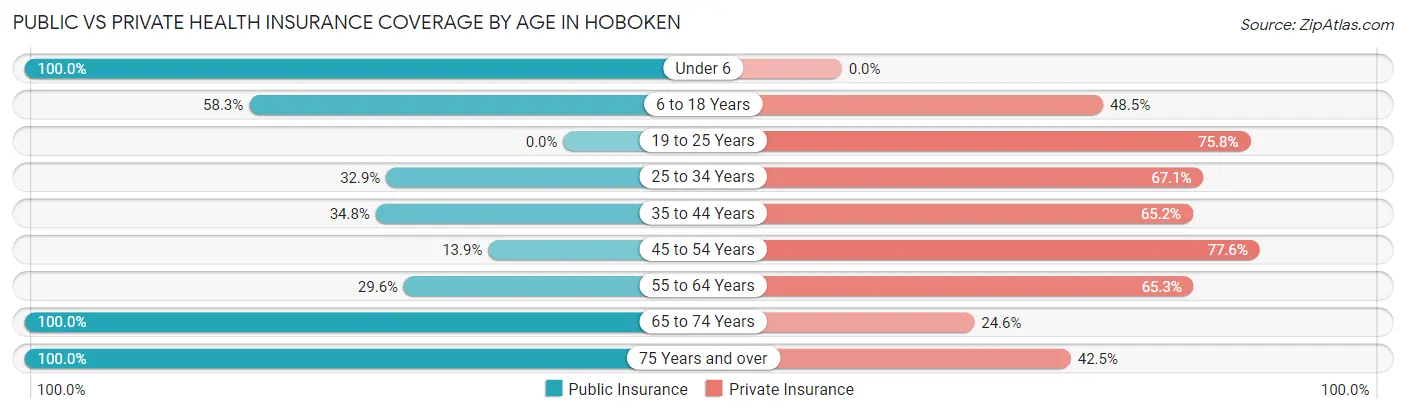
| Age Bracket | Public Insurance | Private Insurance |
| Under 6 | 47 (100.0%) | 0 (0.0%) |
| 6 to 18 Years | 77 (58.3%) | 64 (48.5%) |
| 19 to 25 Years | 0 (0.0%) | 116 (75.8%) |
| 25 to 34 Years | 24 (32.9%) | 49 (67.1%) |
| 35 to 44 Years | 31 (34.8%) | 58 (65.2%) |
| 45 to 54 Years | 23 (13.9%) | 128 (77.6%) |
| 55 to 64 Years | 29 (29.6%) | 64 (65.3%) |
| 65 to 74 Years | 61 (100.0%) | 15 (24.6%) |
| 75 Years and over | 40 (100.0%) | 17 (42.5%) |
| Total | 332 (38.7%) | 511 (59.6%) |
Disability Status by Sex by Age in Hoboken
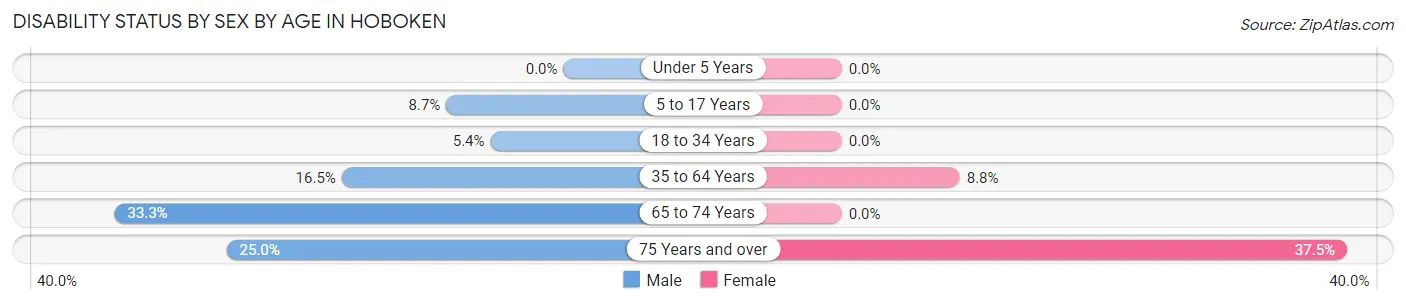
| Age Bracket | Male | Female |
| Under 5 Years | 0 (0.0%) | 0 (0.0%) |
| 5 to 17 Years | 4 (8.7%) | 0 (0.0%) |
| 18 to 34 Years | 11 (5.4%) | 0 (0.0%) |
| 35 to 64 Years | 26 (16.5%) | 17 (8.8%) |
| 65 to 74 Years | 7 (33.3%) | 0 (0.0%) |
| 75 Years and over | 6 (25.0%) | 6 (37.5%) |
Disability Class by Sex by Age in Hoboken
Disability Class: Hearing Difficulty
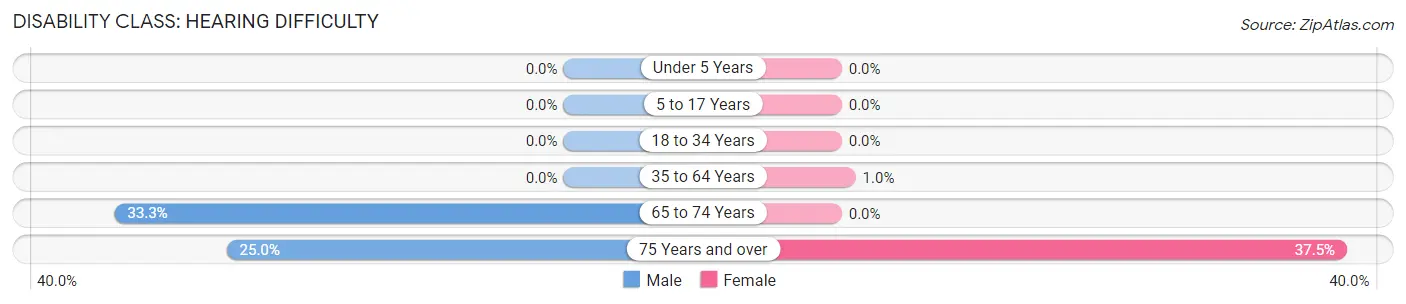
| Age Bracket | Male | Female |
| Under 5 Years | 0 (0.0%) | 0 (0.0%) |
| 5 to 17 Years | 0 (0.0%) | 0 (0.0%) |
| 18 to 34 Years | 0 (0.0%) | 0 (0.0%) |
| 35 to 64 Years | 0 (0.0%) | 2 (1.0%) |
| 65 to 74 Years | 7 (33.3%) | 0 (0.0%) |
| 75 Years and over | 6 (25.0%) | 6 (37.5%) |
Disability Class: Vision Difficulty
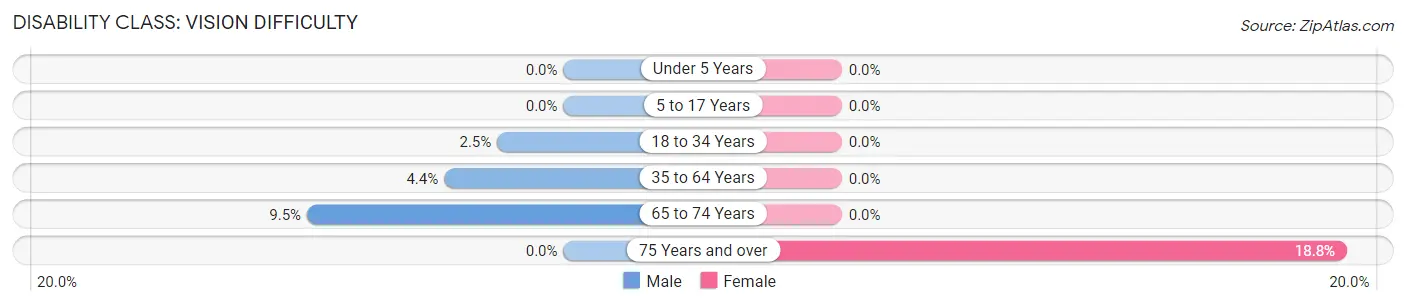
| Age Bracket | Male | Female |
| Under 5 Years | 0 (0.0%) | 0 (0.0%) |
| 5 to 17 Years | 0 (0.0%) | 0 (0.0%) |
| 18 to 34 Years | 5 (2.5%) | 0 (0.0%) |
| 35 to 64 Years | 7 (4.4%) | 0 (0.0%) |
| 65 to 74 Years | 2 (9.5%) | 0 (0.0%) |
| 75 Years and over | 0 (0.0%) | 3 (18.8%) |
Disability Class: Cognitive Difficulty
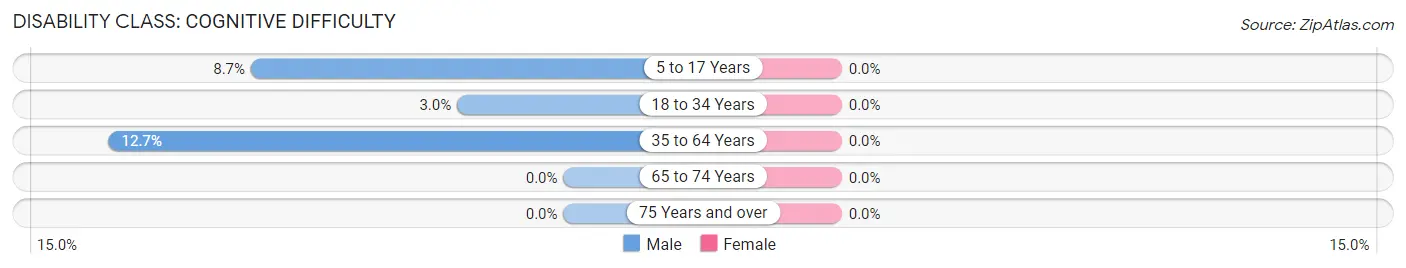
| Age Bracket | Male | Female |
| 5 to 17 Years | 4 (8.7%) | 0 (0.0%) |
| 18 to 34 Years | 6 (3.0%) | 0 (0.0%) |
| 35 to 64 Years | 20 (12.7%) | 0 (0.0%) |
| 65 to 74 Years | 0 (0.0%) | 0 (0.0%) |
| 75 Years and over | 0 (0.0%) | 0 (0.0%) |
Disability Class: Ambulatory Difficulty
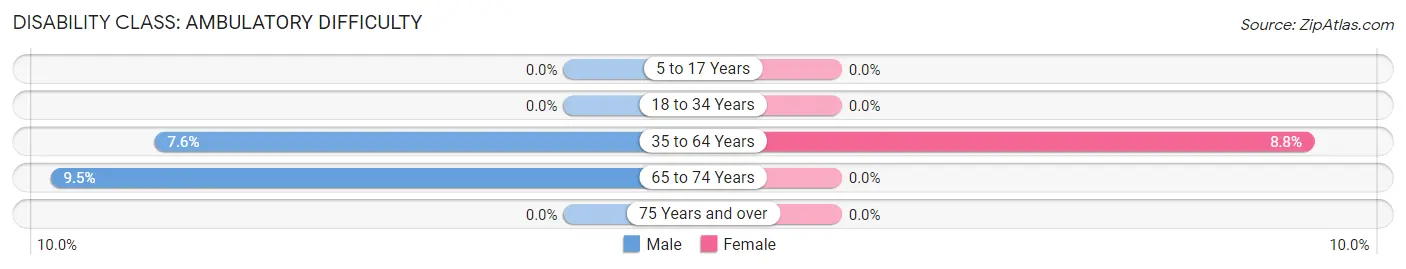
| Age Bracket | Male | Female |
| 5 to 17 Years | 0 (0.0%) | 0 (0.0%) |
| 18 to 34 Years | 0 (0.0%) | 0 (0.0%) |
| 35 to 64 Years | 12 (7.6%) | 17 (8.8%) |
| 65 to 74 Years | 2 (9.5%) | 0 (0.0%) |
| 75 Years and over | 0 (0.0%) | 0 (0.0%) |
Disability Class: Self-Care Difficulty
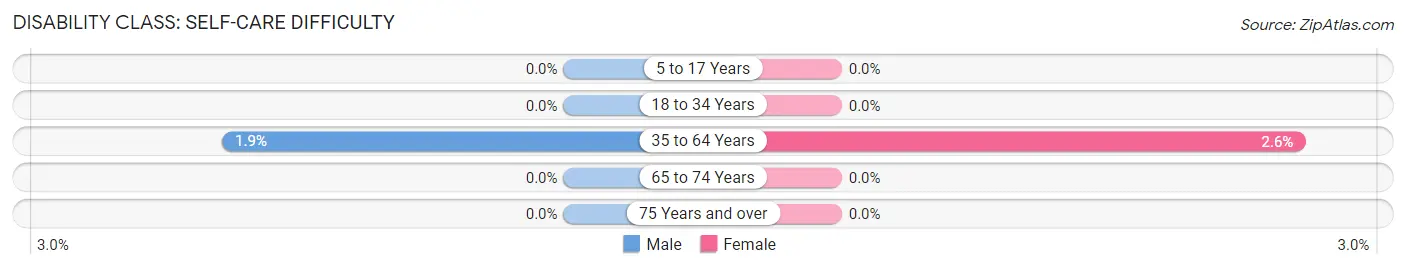
| Age Bracket | Male | Female |
| 5 to 17 Years | 0 (0.0%) | 0 (0.0%) |
| 18 to 34 Years | 0 (0.0%) | 0 (0.0%) |
| 35 to 64 Years | 3 (1.9%) | 5 (2.6%) |
| 65 to 74 Years | 0 (0.0%) | 0 (0.0%) |
| 75 Years and over | 0 (0.0%) | 0 (0.0%) |
Technology Access in Hoboken
Computing Device Access in Hoboken
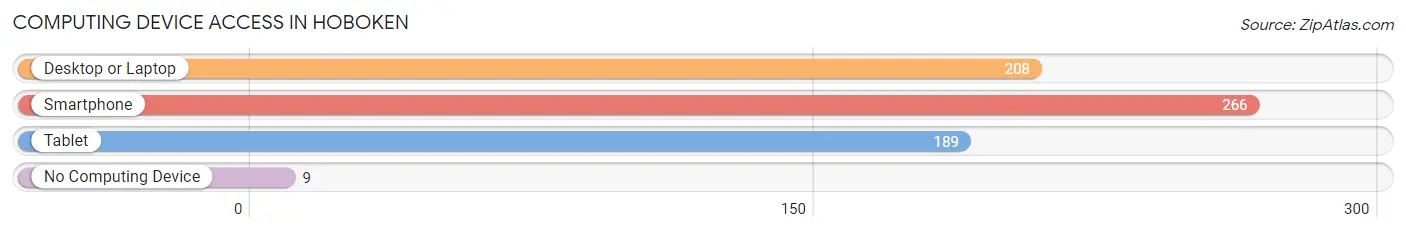
| Device Type | # Households | % Households |
| Desktop or Laptop | 208 | 73.8% |
| Smartphone | 266 | 94.3% |
| Tablet | 189 | 67.0% |
| No Computing Device | 9 | 3.2% |
| Total | 282 | 100.0% |
Internet Access in Hoboken
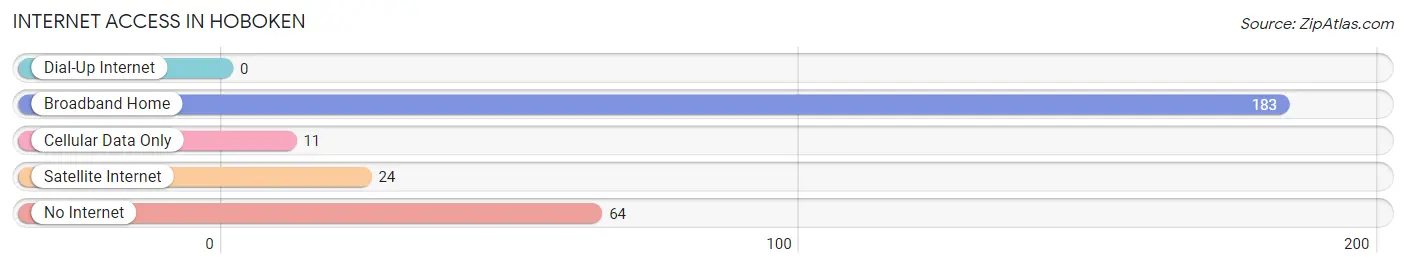
| Internet Type | # Households | % Households |
| Dial-Up Internet | 0 | 0.0% |
| Broadband Home | 183 | 64.9% |
| Cellular Data Only | 11 | 3.9% |
| Satellite Internet | 24 | 8.5% |
| No Internet | 64 | 22.7% |
| Total | 282 | 100.0% |
Hoboken Summary
Hoboken, Georgia is a small city located in Liberty County, Georgia, United States. It is situated on the banks of the Altamaha River, approximately 30 miles south of Savannah. The city has a population of 1,845 as of the 2010 census, making it the smallest incorporated city in the state.
History
Hoboken was founded in 1818 by a group of settlers from the nearby town of Midway. The town was named after the city of Hoboken, New Jersey, which was the hometown of one of the settlers. The town was incorporated in 1836 and was the county seat of Liberty County until 1876, when it was moved to Hinesville.
Hoboken was a major port city during the 19th century, and was a major center for the production of naval stores, such as turpentine and rosin. The town was also home to several sawmills and gristmills, as well as a cotton gin.
During the Civil War, Hoboken was the site of a major battle between Union and Confederate forces in 1864. The Union forces were victorious, and the town was occupied by Union troops for the remainder of the war.
Geography
Hoboken is located in Liberty County, Georgia, approximately 30 miles south of Savannah. The city is situated on the banks of the Altamaha River, and is surrounded by a number of small towns and villages. The city has a total area of 1.2 square miles, all of which is land.
Economy
Hoboken’s economy is largely based on agriculture and tourism. The city is home to several farms, which produce a variety of crops, including corn, soybeans, cotton, and peanuts. The city is also home to several tourist attractions, including the Liberty County Historical Museum, the Liberty County Courthouse, and the Liberty County Jail.
Demographics
As of the 2010 census, Hoboken had a population of 1,845. The racial makeup of the city was 65.2% White, 28.2% African American, 0.2% Native American, 0.2% Asian, 0.1% Pacific Islander, 4.7% from other races, and 1.0% from two or more races. Hispanic or Latino of any race were 8.2% of the population.
The median income for a household in the city was $30,938, and the median income for a family was $37,500. The per capita income for the city was $15,945. About 18.2% of families and 22.2% of the population were below the poverty line, including 28.3% of those under age 18 and 16.7% of those age 65 or over.
Common Questions
What is the Total Population of Hoboken?
Total Population of Hoboken is 858.
What is the Total Male Population of Hoboken?
Total Male Population of Hoboken is 452.
What is the Total Female Population of Hoboken?
Total Female Population of Hoboken is 406.
What is the Ratio of Males per 100 Females in Hoboken?
There are 111.33 Males per 100 Females in Hoboken.
What is the Ratio of Females per 100 Males in Hoboken?
There are 89.82 Females per 100 Males in Hoboken.
What is the Median Population Age in Hoboken?
Median Population Age in Hoboken is 38.7 Years.
What is the Average Family Size in Hoboken
Average Family Size in Hoboken is 3.7 People.
What is the Average Household Size in Hoboken
Average Household Size in Hoboken is 3.0 People.
What is Per Capita Income in Hoboken?
Per Capita income in Hoboken is $26,926.
What is the Median Family Income in Hoboken?
Median Family Income in Hoboken is $83,958.
What is the Median Household income in Hoboken?
Median Household Income in Hoboken is $71,154.
What is Income or Wage Gap in Hoboken?
Income or Wage Gap in Hoboken is 28.7%.
Women in Hoboken earn 71.3 cents for every dollar earned by a man.
What is Inequality or Gini Index in Hoboken?
Inequality or Gini Index in Hoboken is 0.45.
How Large is the Labor Force in Hoboken?
There are 470 People in the Labor Forcein in Hoboken.
What is the Percentage of People in the Labor Force in Hoboken?
67.0% of People are in the Labor Force in Hoboken.
What is the Unemployment Rate in Hoboken?
Unemployment Rate in Hoboken is 0.6%.