Hiltonia, GA
Hiltonia Map
Hiltonia Overview
456
TOTAL POPULATION
274
MALE POPULATION
182
FEMALE POPULATION
150.55
MALES / 100 FEMALES
66.42
FEMALES / 100 MALES
45.3
MEDIAN AGE
7.0
AVG FAMILY SIZE
4.5
AVG HOUSEHOLD SIZE
$15,838
PER CAPITA INCOME
$37,368
AVG FAMILY INCOME
$40,750
AVG HOUSEHOLD INCOME
0.33
INEQUALITY / GINI INDEX
138
LABOR FORCE [ PEOPLE ]
35.8%
PERCENT IN LABOR FORCE
23.2%
UNEMPLOYMENT RATE
Hiltonia Area Codes
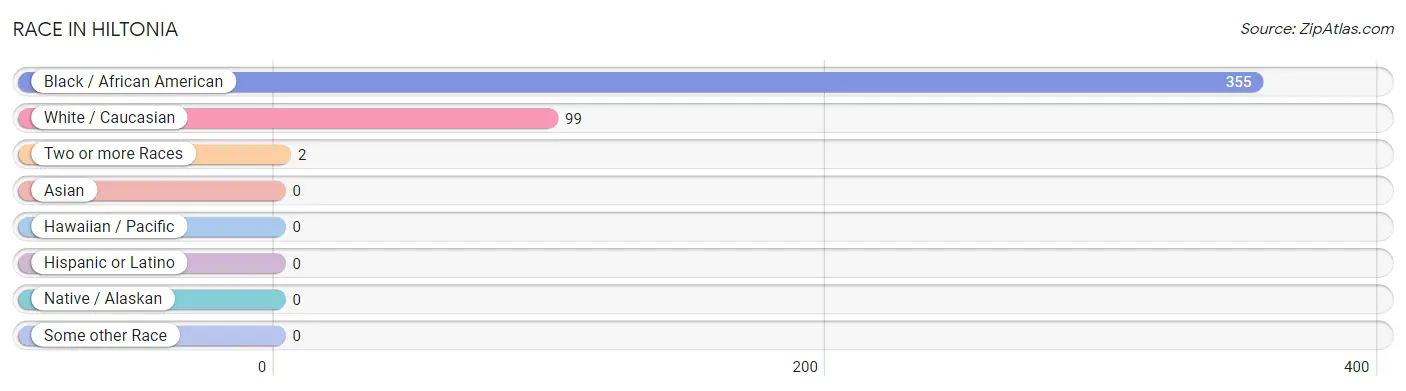
Race in Hiltonia
The most populous races in Hiltonia are Black / African American (355 | 77.8%), White / Caucasian (99 | 21.7%), and Two or more Races (2 | 0.4%).
| Race | # Population | % Population |
| Asian | 0 | 0.0% |
| Black / African American | 355 | 77.8% |
| Hawaiian / Pacific | 0 | 0.0% |
| Hispanic or Latino | 0 | 0.0% |
| Native / Alaskan | 0 | 0.0% |
| White / Caucasian | 99 | 21.7% |
| Two or more Races | 2 | 0.4% |
| Some other Race | 0 | 0.0% |
| Total | 456 | 100.0% |
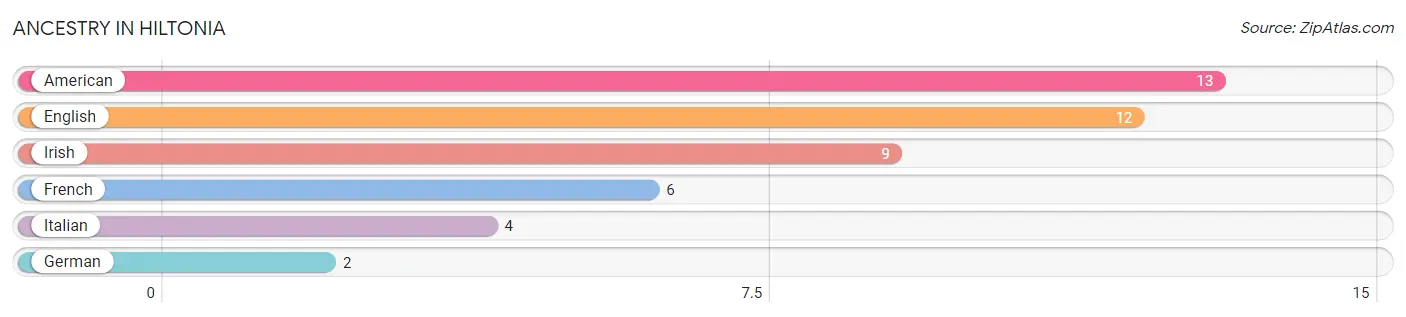
Ancestry in Hiltonia
The most populous ancestries reported in Hiltonia are American (13 | 2.9%), English (12 | 2.6%), Irish (9 | 2.0%), French (6 | 1.3%), and Italian (4 | 0.9%), together accounting for 9.7% of all Hiltonia residents.
| Ancestry | # Population | % Population |
| American | 13 | 2.9% |
| English | 12 | 2.6% |
| French | 6 | 1.3% |
| German | 2 | 0.4% |
| Irish | 9 | 2.0% |
| Italian | 4 | 0.9% | View All 6 Rows |
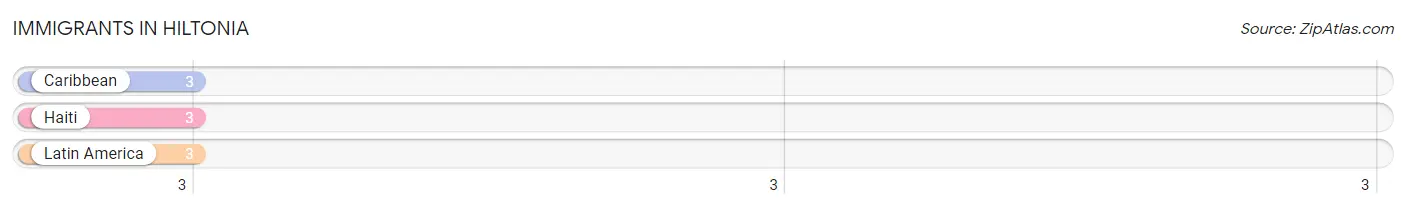
Immigrants in Hiltonia
The most numerous immigrant groups reported in Hiltonia came from Caribbean (3 | 0.7%), Haiti (3 | 0.7%), and Latin America (3 | 0.7%), together accounting for 2.0% of all Hiltonia residents.
| Immigration Origin | # Population | % Population |
| Caribbean | 3 | 0.7% |
| Haiti | 3 | 0.7% |
| Latin America | 3 | 0.7% | View All 3 Rows |
Sex and Age in Hiltonia
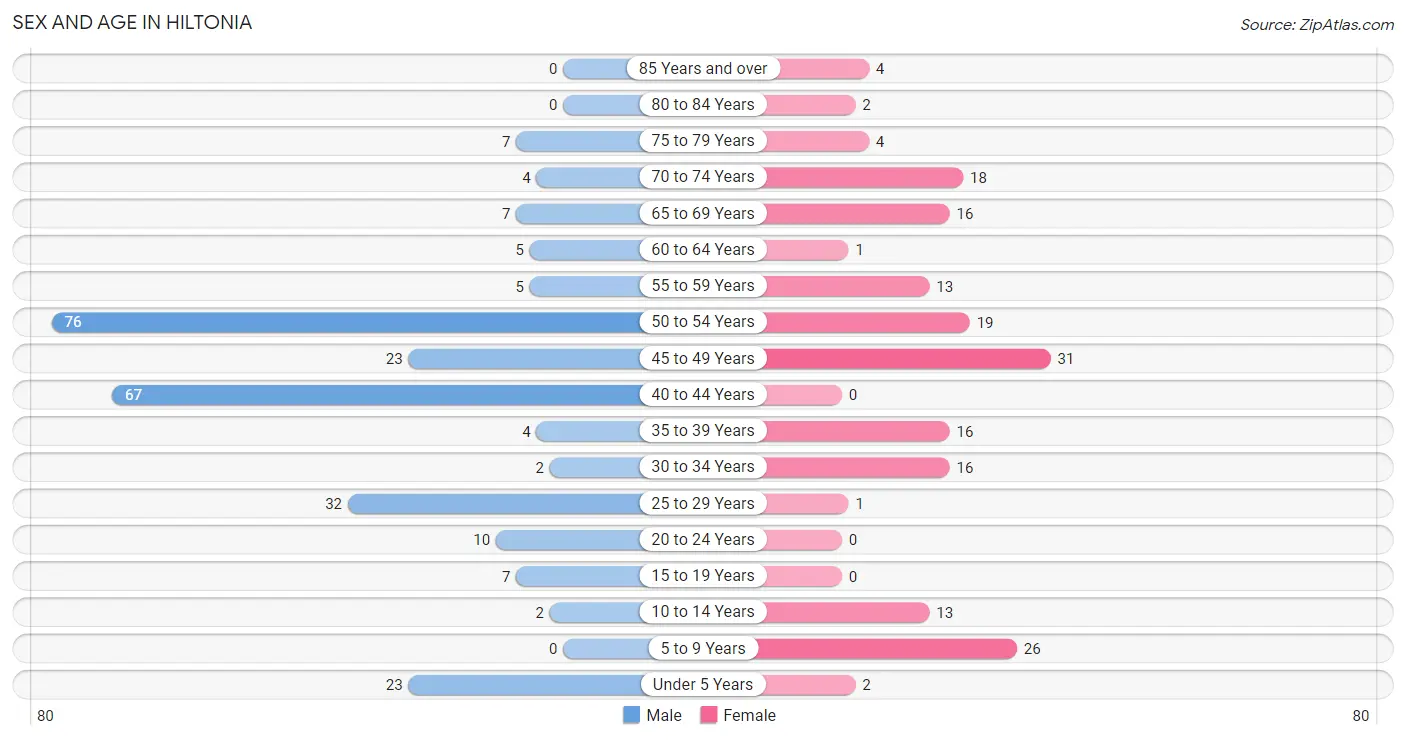
Sex and Age in Hiltonia
The most populous age groups in Hiltonia are 50 to 54 Years (76 | 27.7%) for men and 45 to 49 Years (31 | 17.0%) for women.
| Age Bracket | Male | Female |
| Under 5 Years | 23 (8.4%) | 2 (1.1%) |
| 5 to 9 Years | 0 (0.0%) | 26 (14.3%) |
| 10 to 14 Years | 2 (0.7%) | 13 (7.1%) |
| 15 to 19 Years | 7 (2.5%) | 0 (0.0%) |
| 20 to 24 Years | 10 (3.6%) | 0 (0.0%) |
| 25 to 29 Years | 32 (11.7%) | 1 (0.5%) |
| 30 to 34 Years | 2 (0.7%) | 16 (8.8%) |
| 35 to 39 Years | 4 (1.5%) | 16 (8.8%) |
| 40 to 44 Years | 67 (24.4%) | 0 (0.0%) |
| 45 to 49 Years | 23 (8.4%) | 31 (17.0%) |
| 50 to 54 Years | 76 (27.7%) | 19 (10.4%) |
| 55 to 59 Years | 5 (1.8%) | 13 (7.1%) |
| 60 to 64 Years | 5 (1.8%) | 1 (0.5%) |
| 65 to 69 Years | 7 (2.5%) | 16 (8.8%) |
| 70 to 74 Years | 4 (1.5%) | 18 (9.9%) |
| 75 to 79 Years | 7 (2.5%) | 4 (2.2%) |
| 80 to 84 Years | 0 (0.0%) | 2 (1.1%) |
| 85 Years and over | 0 (0.0%) | 4 (2.2%) |
| Total | 274 (100.0%) | 182 (100.0%) |
Families and Households in Hiltonia
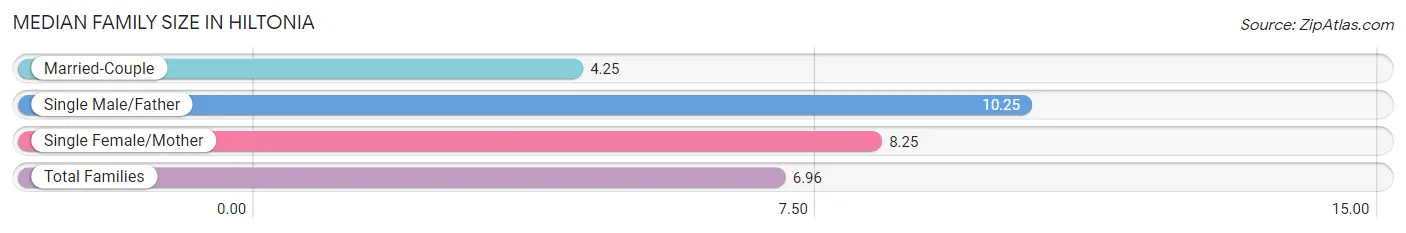
Median Family Size in Hiltonia
The median family size in Hiltonia is 6.96 persons per family, with single male/father families (4 | 7.1%) accounting for the largest median family size of 10.25 persons per family. On the other hand, married-couple families (20 | 35.7%) represent the smallest median family size with 4.25 persons per family.
| Family Type | # Families | Family Size |
| Married-Couple | 20 (35.7%) | 4.25 |
| Single Male/Father | 4 (7.1%) | 10.25 |
| Single Female/Mother | 32 (57.1%) | 8.25 |
| Total Families | 56 (100.0%) | 6.96 |
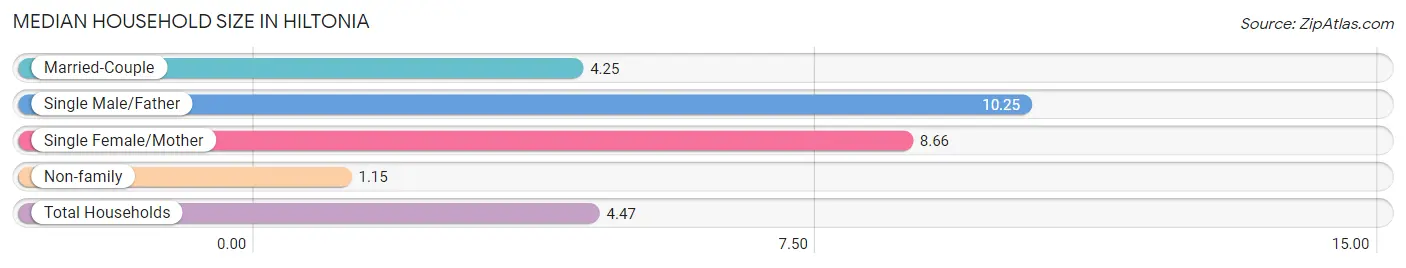
Median Household Size in Hiltonia
The median household size in Hiltonia is 4.47 persons per household, with single male/father households (4 | 3.9%) accounting for the largest median household size of 10.25 persons per household. non-family households (46 | 45.1%) represent the smallest median household size with 1.15 persons per household.
| Household Type | # Households | Household Size |
| Married-Couple | 20 (19.6%) | 4.25 |
| Single Male/Father | 4 (3.9%) | 10.25 |
| Single Female/Mother | 32 (31.4%) | 8.66 |
| Non-family | 46 (45.1%) | 1.15 |
| Total Households | 102 (100.0%) | 4.47 |
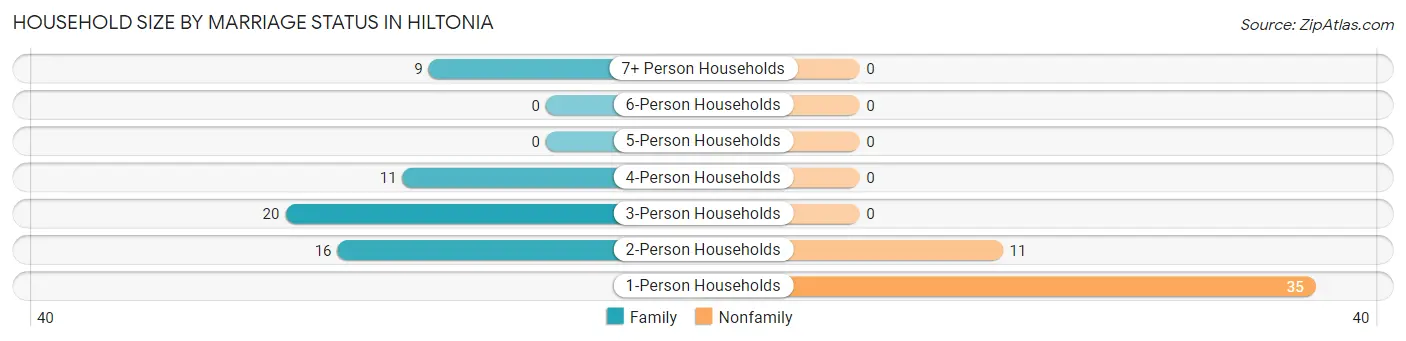
Household Size by Marriage Status in Hiltonia
Out of a total of 102 households in Hiltonia, 56 (54.9%) are family households, while 46 (45.1%) are nonfamily households. The most numerous type of family households are 3-person households, comprising 20, and the most common type of nonfamily households are 1-person households, comprising 35.
| Household Size | Family Households | Nonfamily Households |
| 1-Person Households | - | 35 (34.3%) |
| 2-Person Households | 16 (15.7%) | 11 (10.8%) |
| 3-Person Households | 20 (19.6%) | 0 (0.0%) |
| 4-Person Households | 11 (10.8%) | 0 (0.0%) |
| 5-Person Households | 0 (0.0%) | 0 (0.0%) |
| 6-Person Households | 0 (0.0%) | 0 (0.0%) |
| 7+ Person Households | 9 (8.8%) | 0 (0.0%) |
| Total | 56 (54.9%) | 46 (45.1%) |
Female Fertility in Hiltonia
Fertility by Age in Hiltonia
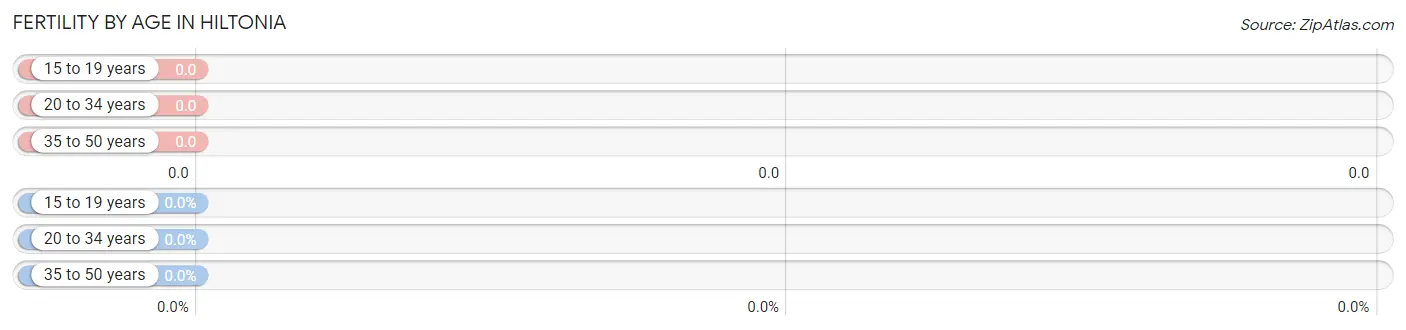
| Age Bracket | Women with Births | Births / 1,000 Women |
| 15 to 19 years | 0 (0.0%) | 0.0 |
| 20 to 34 years | 0 (0.0%) | 0.0 |
| 35 to 50 years | 0 (0.0%) | 0.0 |
| Total | 0 (0.0%) | 0.0 |
Fertility by Age by Marriage Status in Hiltonia
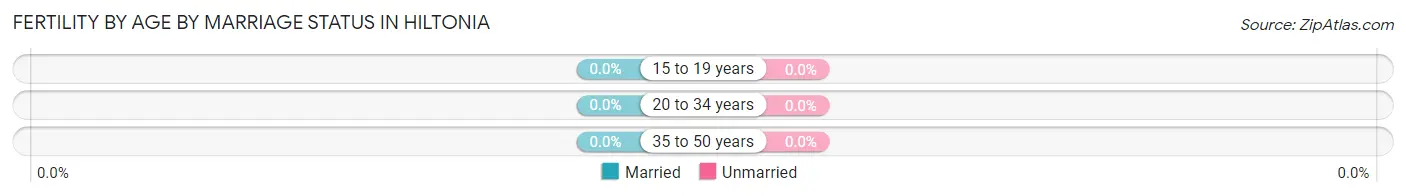
| Age Bracket | Married | Unmarried |
| 15 to 19 years | 0 (0.0%) | 0 (0.0%) |
| 20 to 34 years | 0 (0.0%) | 0 (0.0%) |
| 35 to 50 years | 0 (0.0%) | 0 (0.0%) |
| Total | 0 (0.0%) | 0 (0.0%) |
Fertility by Education in Hiltonia
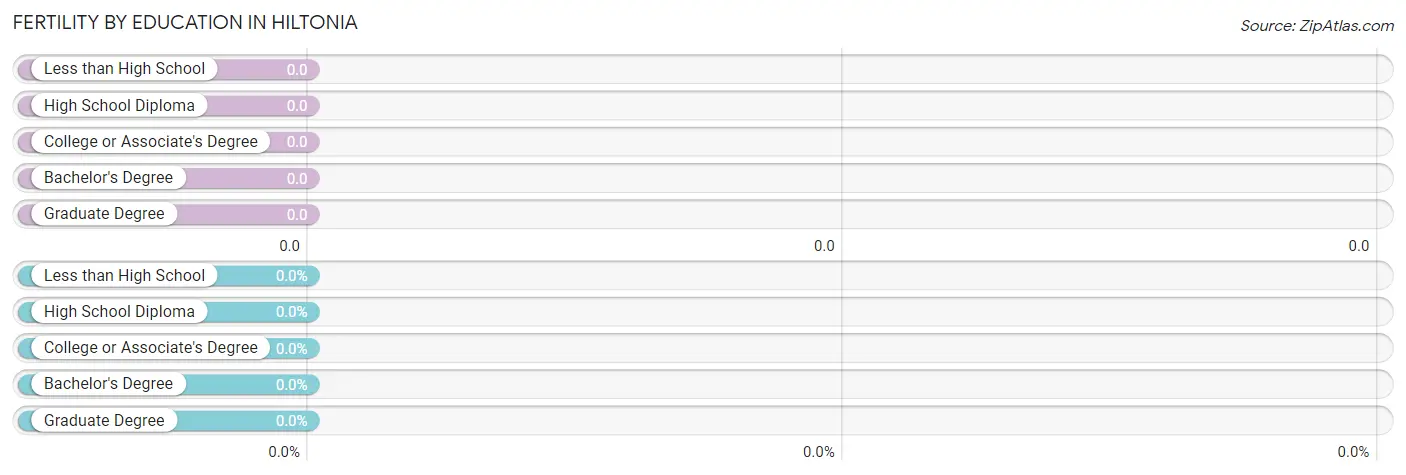
| Educational Attainment | Women with Births | Births / 1,000 Women |
| Less than High School | 0 (0.0%) | 0.0 |
| High School Diploma | 0 (0.0%) | 0.0 |
| College or Associate's Degree | 0 (0.0%) | 0.0 |
| Bachelor's Degree | 0 (0.0%) | 0.0 |
| Graduate Degree | 0 (0.0%) | 0.0 |
| Total | 0 (0.0%) | 0.0 |
Fertility by Education by Marriage Status in Hiltonia
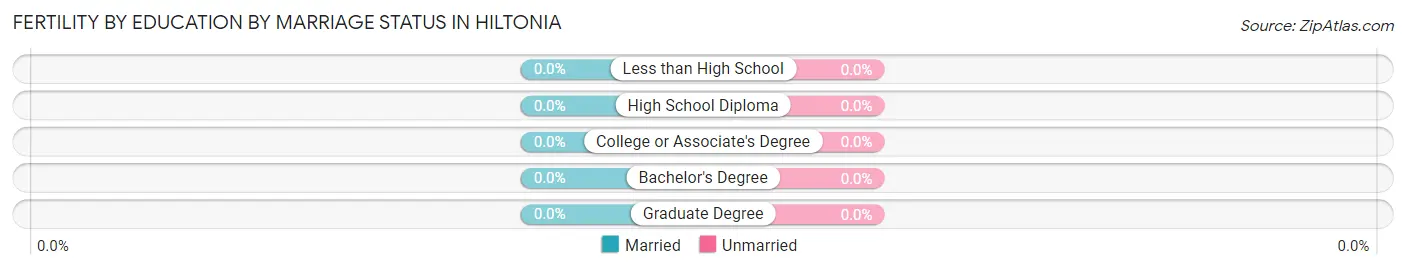
| Educational Attainment | Married | Unmarried |
| Less than High School | 0 (0.0%) | 0 (0.0%) |
| High School Diploma | 0 (0.0%) | 0 (0.0%) |
| College or Associate's Degree | 0 (0.0%) | 0 (0.0%) |
| Bachelor's Degree | 0 (0.0%) | 0 (0.0%) |
| Graduate Degree | 0 (0.0%) | 0 (0.0%) |
| Total | 0 (0.0%) | 0 (0.0%) |
Income in Hiltonia
Income Overview in Hiltonia
Per Capita Income in Hiltonia is $15,838, while median incomes of families and households are $37,368 and $40,750 respectively.
| Characteristic | Number | Measure |
| Per Capita Income | 456 | $15,838 |
| Median Family Income | 56 | $37,368 |
| Mean Family Income | 56 | $54,182 |
| Median Household Income | 102 | $40,750 |
| Mean Household Income | 102 | $48,033 |
| Income Deficit | 56 | $0 |
| Wage / Income Gap (%) | 456 | 0.00% |
| Wage / Income Gap ($) | 456 | 100.00¢ per $1 |
| Gini / Inequality Index | 456 | 0.33 |
Earnings by Sex in Hiltonia
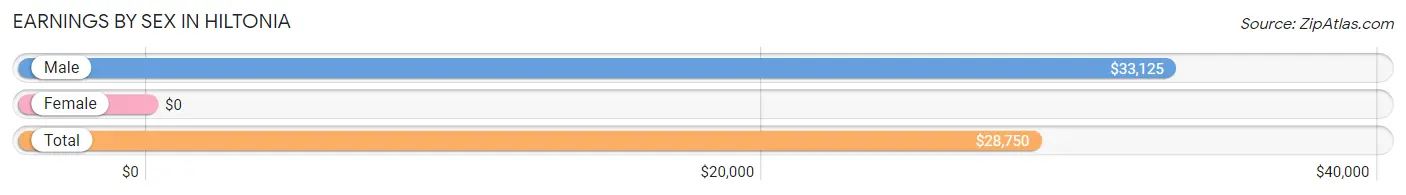
| Sex | Number | Average Earnings |
| Male | 77 (48.4%) | $33,125 |
| Female | 82 (51.6%) | $0 |
| Total | 159 (100.0%) | $28,750 |
Earnings by Sex by Income Bracket in Hiltonia
The most common earnings brackets in Hiltonia are $35,000 to $39,999 for men (20 | 26.0%) and $35,000 to $39,999 for women (27 | 32.9%).
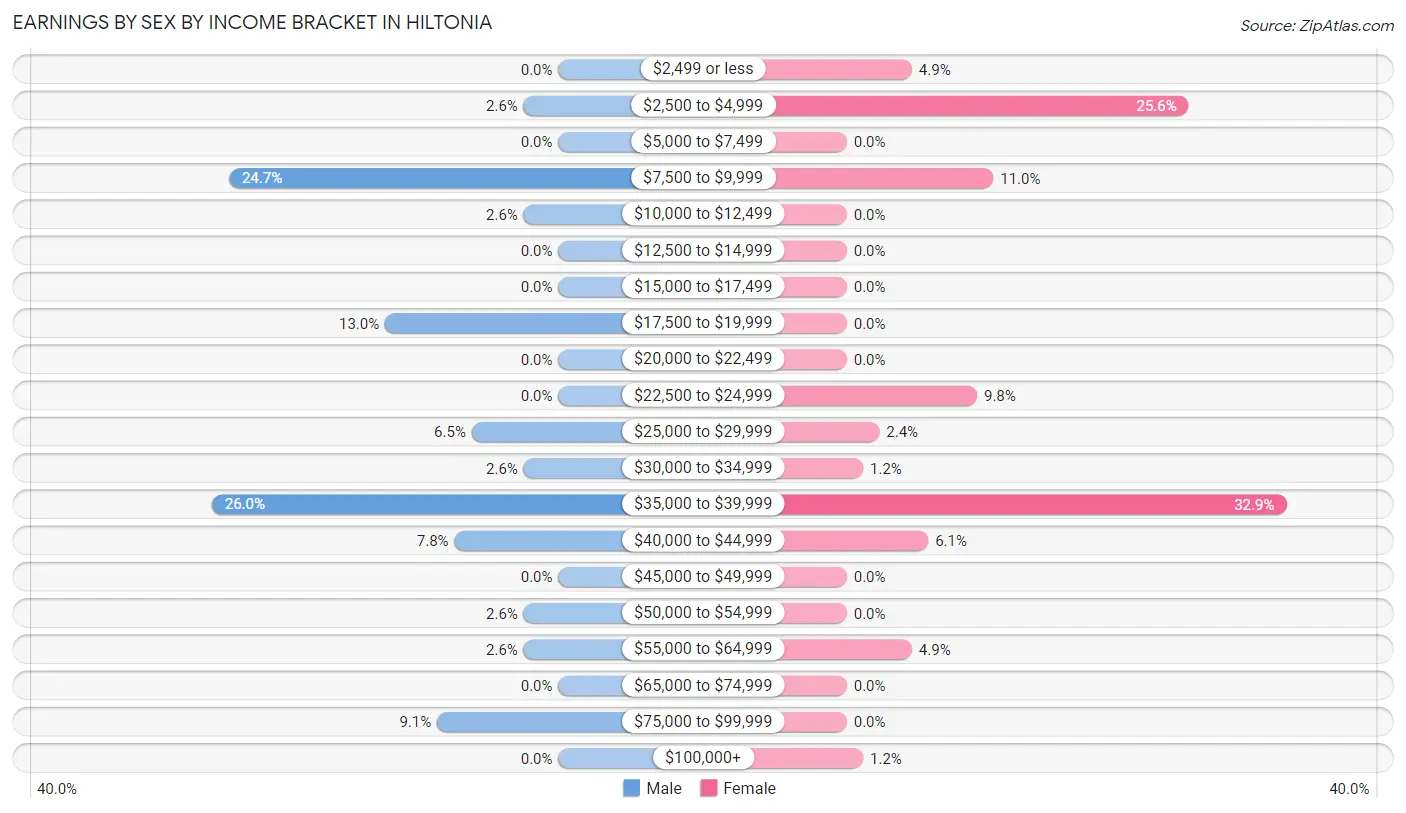
| Income | Male | Female |
| $2,499 or less | 0 (0.0%) | 4 (4.9%) |
| $2,500 to $4,999 | 2 (2.6%) | 21 (25.6%) |
| $5,000 to $7,499 | 0 (0.0%) | 0 (0.0%) |
| $7,500 to $9,999 | 19 (24.7%) | 9 (11.0%) |
| $10,000 to $12,499 | 2 (2.6%) | 0 (0.0%) |
| $12,500 to $14,999 | 0 (0.0%) | 0 (0.0%) |
| $15,000 to $17,499 | 0 (0.0%) | 0 (0.0%) |
| $17,500 to $19,999 | 10 (13.0%) | 0 (0.0%) |
| $20,000 to $22,499 | 0 (0.0%) | 0 (0.0%) |
| $22,500 to $24,999 | 0 (0.0%) | 8 (9.8%) |
| $25,000 to $29,999 | 5 (6.5%) | 2 (2.4%) |
| $30,000 to $34,999 | 2 (2.6%) | 1 (1.2%) |
| $35,000 to $39,999 | 20 (26.0%) | 27 (32.9%) |
| $40,000 to $44,999 | 6 (7.8%) | 5 (6.1%) |
| $45,000 to $49,999 | 0 (0.0%) | 0 (0.0%) |
| $50,000 to $54,999 | 2 (2.6%) | 0 (0.0%) |
| $55,000 to $64,999 | 2 (2.6%) | 4 (4.9%) |
| $65,000 to $74,999 | 0 (0.0%) | 0 (0.0%) |
| $75,000 to $99,999 | 7 (9.1%) | 0 (0.0%) |
| $100,000+ | 0 (0.0%) | 1 (1.2%) |
| Total | 77 (100.0%) | 82 (100.0%) |
Earnings by Sex by Educational Attainment in Hiltonia
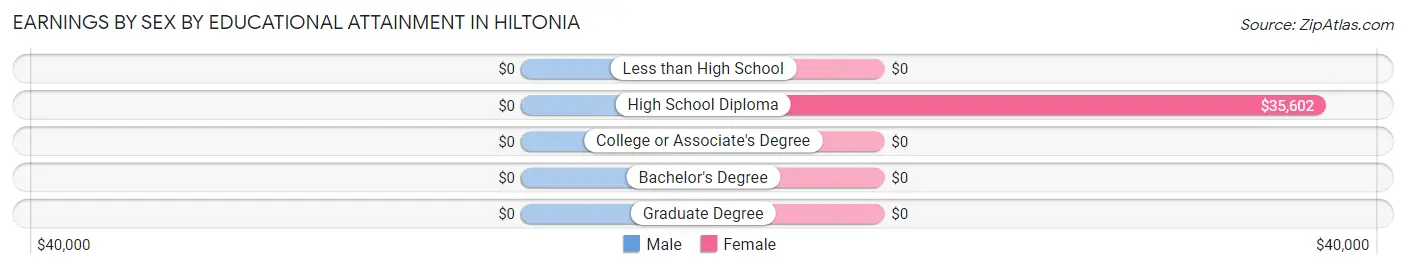
| Educational Attainment | Male Income | Female Income |
| Less than High School | - | - |
| High School Diploma | - | - |
| College or Associate's Degree | - | - |
| Bachelor's Degree | - | - |
| Graduate Degree | - | - |
| Total | $34,375 | $0 |
Family Income in Hiltonia
Family Income Brackets in Hiltonia
According to the Hiltonia family income data, there are 24 families falling into the $35,000 to $49,999 income range, which is the most common income bracket and makes up 42.9% of all families.
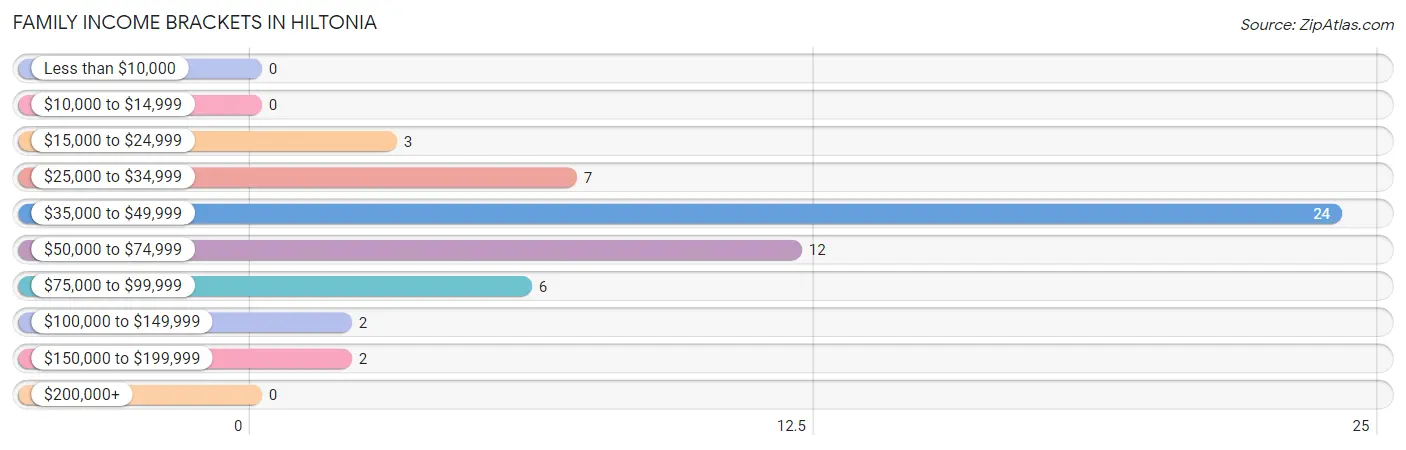
| Income Bracket | # Families | % Families |
| Less than $10,000 | 0 | 0.0% |
| $10,000 to $14,999 | 0 | 0.0% |
| $15,000 to $24,999 | 3 | 5.4% |
| $25,000 to $34,999 | 7 | 12.5% |
| $35,000 to $49,999 | 24 | 42.9% |
| $50,000 to $74,999 | 12 | 21.4% |
| $75,000 to $99,999 | 6 | 10.7% |
| $100,000 to $149,999 | 2 | 3.6% |
| $150,000 to $199,999 | 2 | 3.6% |
| $200,000+ | 0 | 0.0% |
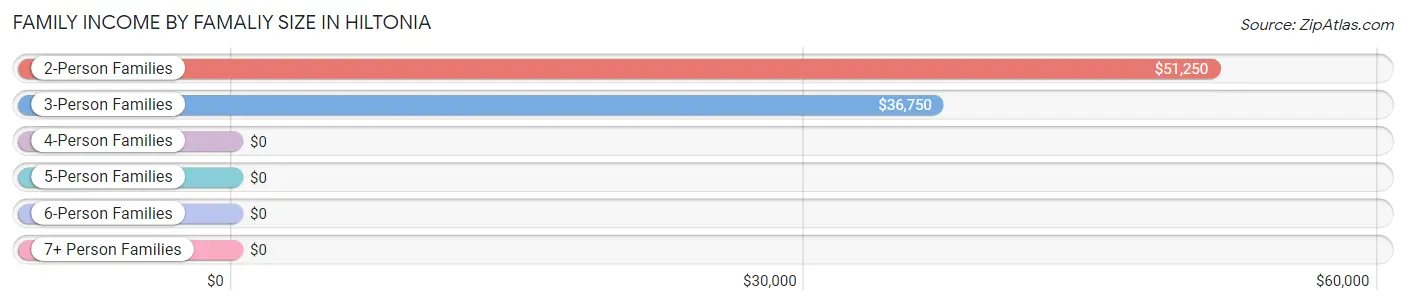
Family Income by Famaliy Size in Hiltonia
2-person families (16 | 28.6%) account for the highest median family income in Hiltonia with $51,250 per family, while 2-person families (16 | 28.6%) have the highest median income of $25,625 per family member.
| Income Bracket | # Families | Median Income |
| 2-Person Families | 16 (28.6%) | $51,250 |
| 3-Person Families | 20 (35.7%) | $36,750 |
| 4-Person Families | 11 (19.6%) | $0 |
| 5-Person Families | 0 (0.0%) | $0 |
| 6-Person Families | 9 (16.1%) | $0 |
| 7+ Person Families | 0 (0.0%) | $0 |
| Total | 56 (100.0%) | $37,368 |
Family Income by Number of Earners in Hiltonia
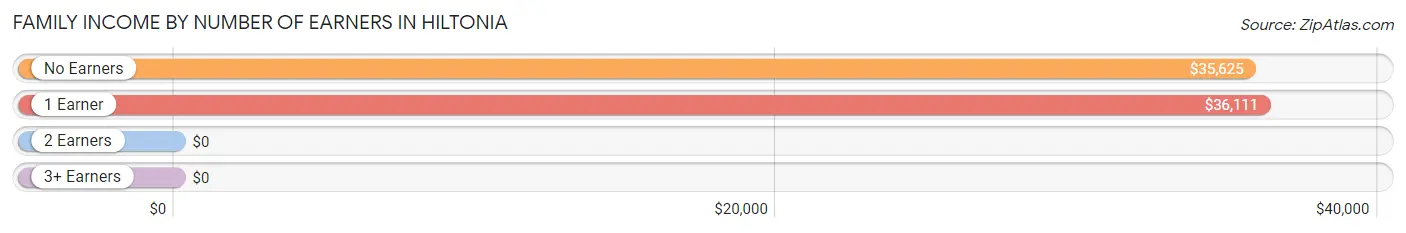
| Number of Earners | # Families | Median Income |
| No Earners | 15 (26.8%) | $35,625 |
| 1 Earner | 18 (32.1%) | $36,111 |
| 2 Earners | 21 (37.5%) | $0 |
| 3+ Earners | 2 (3.6%) | $0 |
| Total | 56 (100.0%) | $37,368 |
Household Income in Hiltonia
Household Income Brackets in Hiltonia
With 42 households falling in the category, the $35,000 to $49,999 income range is the most frequent in Hiltonia, accounting for 41.2% of all households.
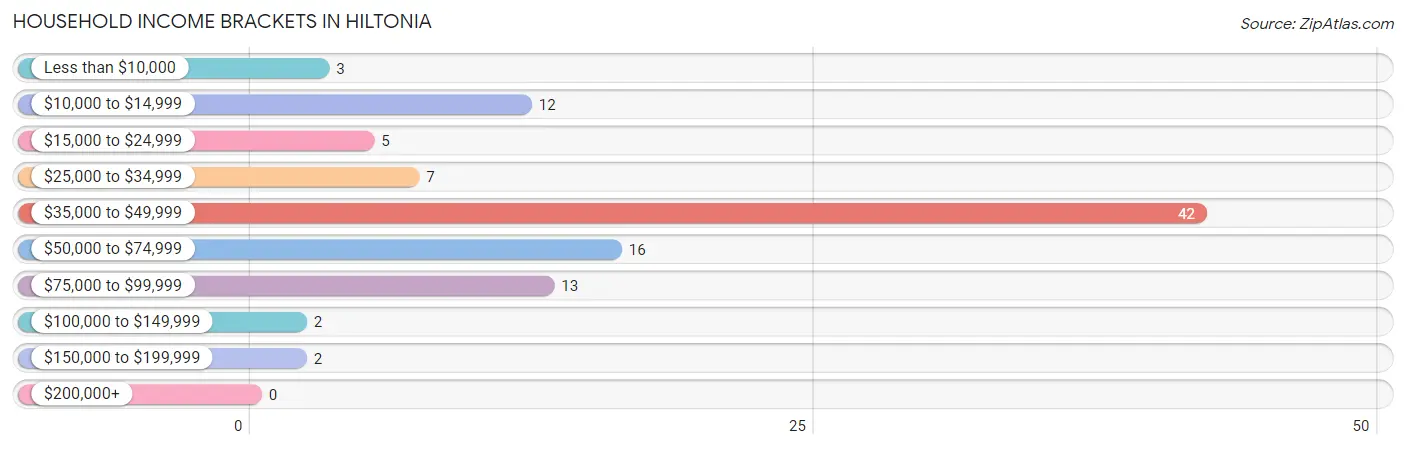
| Income Bracket | # Households | % Households |
| Less than $10,000 | 3 | 2.9% |
| $10,000 to $14,999 | 12 | 11.8% |
| $15,000 to $24,999 | 5 | 4.9% |
| $25,000 to $34,999 | 7 | 6.9% |
| $35,000 to $49,999 | 42 | 41.2% |
| $50,000 to $74,999 | 16 | 15.7% |
| $75,000 to $99,999 | 13 | 12.7% |
| $100,000 to $149,999 | 2 | 2.0% |
| $150,000 to $199,999 | 2 | 2.0% |
| $200,000+ | 0 | 0.0% |
Household Income by Householder Age in Hiltonia
The median household income in Hiltonia is $40,750, with the highest median household income of $96,000 found in the 25 to 44 years age bracket for the primary householder. A total of 14 households (13.7%) fall into this category.
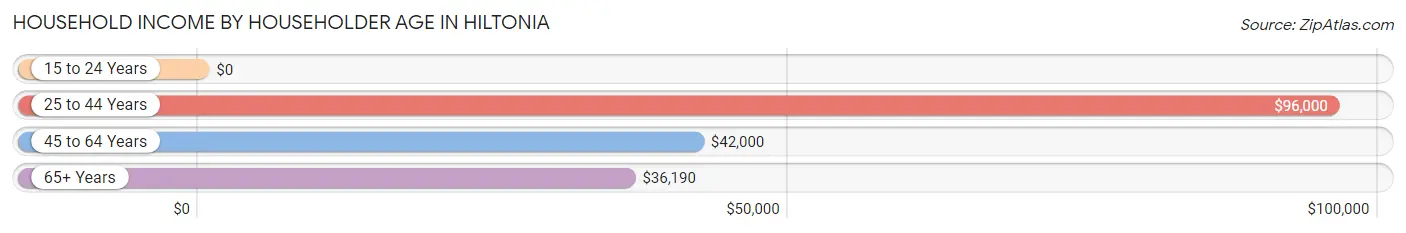
| Income Bracket | # Households | Median Income |
| 15 to 24 Years | 0 (0.0%) | $0 |
| 25 to 44 Years | 14 (13.7%) | $96,000 |
| 45 to 64 Years | 42 (41.2%) | $42,000 |
| 65+ Years | 46 (45.1%) | $36,190 |
| Total | 102 (100.0%) | $40,750 |
Poverty in Hiltonia
Income Below Poverty by Sex and Age in Hiltonia
With 17.9% poverty level for males and 40.1% for females among the residents of Hiltonia, under 5 year old males and 6 to 11 year old females are the most vulnerable to poverty, with 23 males (100.0%) and 39 females (100.0%) in their respective age groups living below the poverty level.
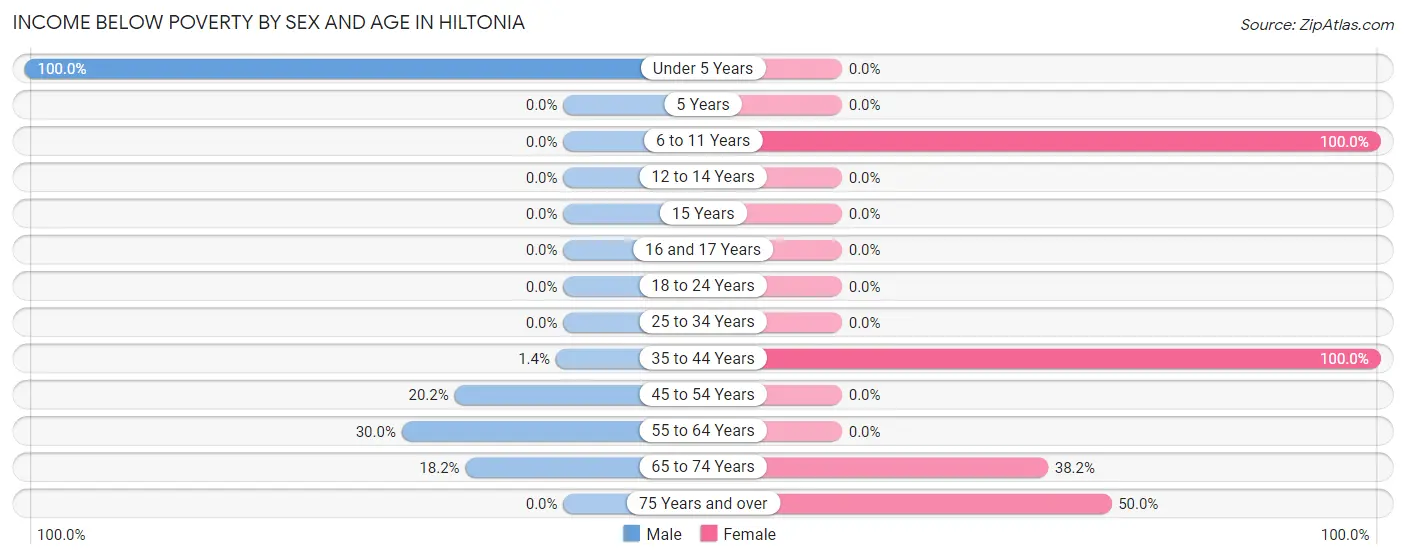
| Age Bracket | Male | Female |
| Under 5 Years | 23 (100.0%) | 0 (0.0%) |
| 5 Years | 0 (0.0%) | 0 (0.0%) |
| 6 to 11 Years | 0 (0.0%) | 39 (100.0%) |
| 12 to 14 Years | 0 (0.0%) | 0 (0.0%) |
| 15 Years | 0 (0.0%) | 0 (0.0%) |
| 16 and 17 Years | 0 (0.0%) | 0 (0.0%) |
| 18 to 24 Years | 0 (0.0%) | 0 (0.0%) |
| 25 to 34 Years | 0 (0.0%) | 0 (0.0%) |
| 35 to 44 Years | 1 (1.4%) | 16 (100.0%) |
| 45 to 54 Years | 20 (20.2%) | 0 (0.0%) |
| 55 to 64 Years | 3 (30.0%) | 0 (0.0%) |
| 65 to 74 Years | 2 (18.2%) | 13 (38.2%) |
| 75 Years and over | 0 (0.0%) | 5 (50.0%) |
| Total | 49 (17.9%) | 73 (40.1%) |
Income Above Poverty by Sex and Age in Hiltonia
According to the poverty statistics in Hiltonia, males aged 6 to 11 years and females aged under 5 years are the age groups that are most secure financially, with 100.0% of males and 100.0% of females in these age groups living above the poverty line.
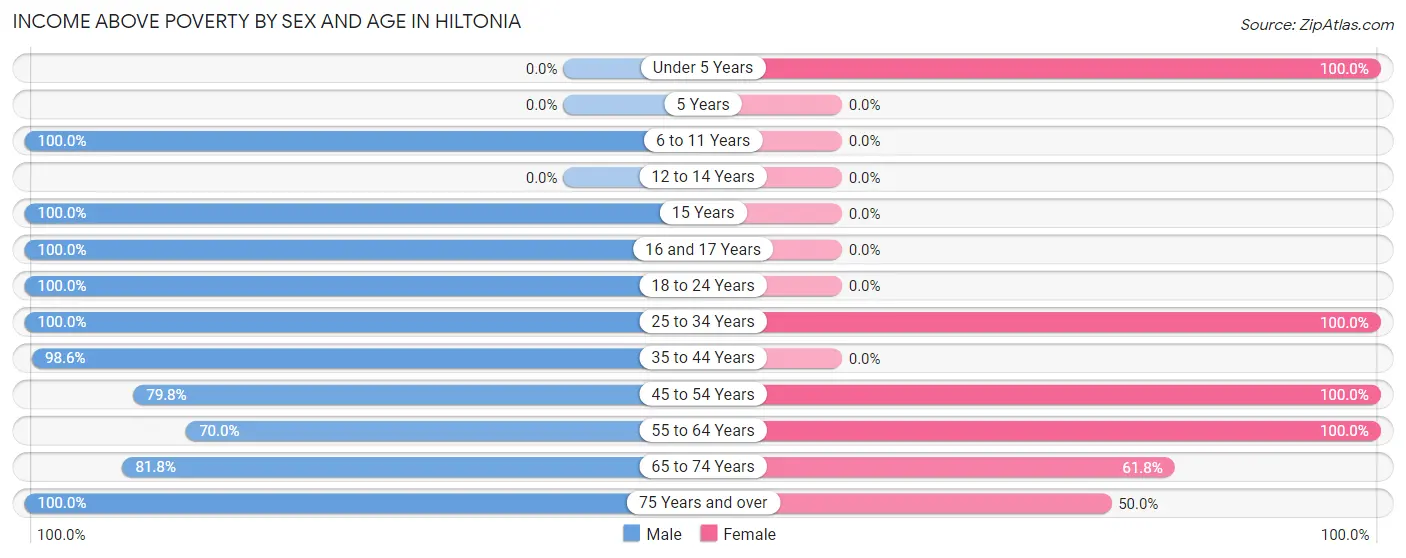
| Age Bracket | Male | Female |
| Under 5 Years | 0 (0.0%) | 2 (100.0%) |
| 5 Years | 0 (0.0%) | 0 (0.0%) |
| 6 to 11 Years | 2 (100.0%) | 0 (0.0%) |
| 12 to 14 Years | 0 (0.0%) | 0 (0.0%) |
| 15 Years | 5 (100.0%) | 0 (0.0%) |
| 16 and 17 Years | 2 (100.0%) | 0 (0.0%) |
| 18 to 24 Years | 10 (100.0%) | 0 (0.0%) |
| 25 to 34 Years | 34 (100.0%) | 17 (100.0%) |
| 35 to 44 Years | 70 (98.6%) | 0 (0.0%) |
| 45 to 54 Years | 79 (79.8%) | 50 (100.0%) |
| 55 to 64 Years | 7 (70.0%) | 14 (100.0%) |
| 65 to 74 Years | 9 (81.8%) | 21 (61.8%) |
| 75 Years and over | 7 (100.0%) | 5 (50.0%) |
| Total | 225 (82.1%) | 109 (59.9%) |
Income Below Poverty Among Married-Couple Families in Hiltonia
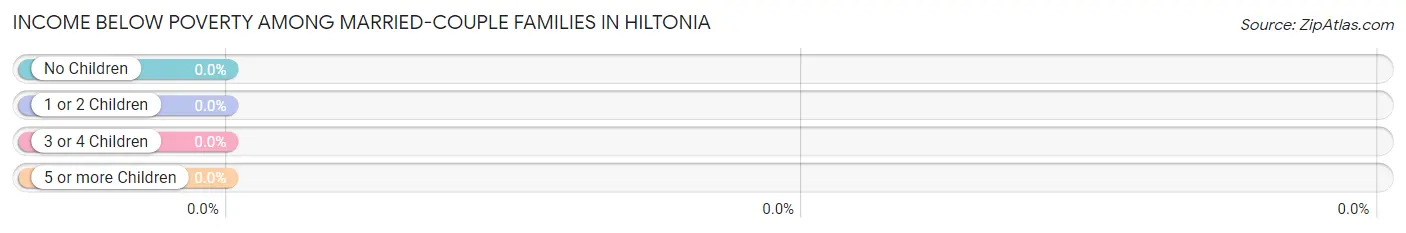
| Children | Above Poverty | Below Poverty |
| No Children | 13 (100.0%) | 0 (0.0%) |
| 1 or 2 Children | 7 (100.0%) | 0 (0.0%) |
| 3 or 4 Children | 0 (0.0%) | 0 (0.0%) |
| 5 or more Children | 0 (0.0%) | 0 (0.0%) |
| Total | 20 (100.0%) | 0 (0.0%) |
Income Below Poverty Among Single-Parent Households in Hiltonia
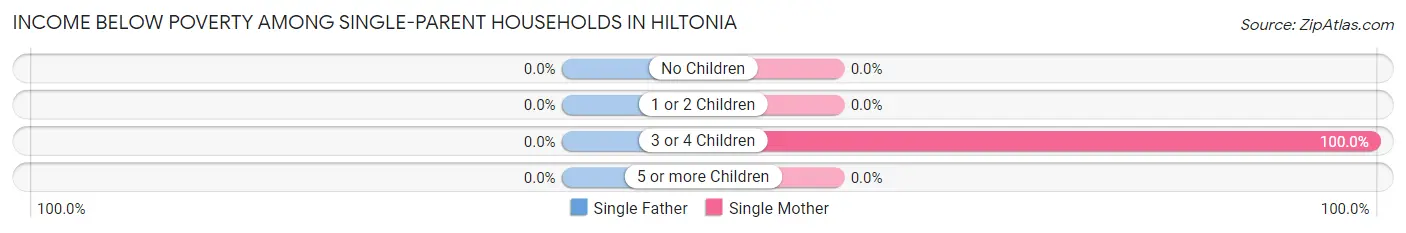
| Children | Single Father | Single Mother |
| No Children | 0 (0.0%) | 0 (0.0%) |
| 1 or 2 Children | 0 (0.0%) | 0 (0.0%) |
| 3 or 4 Children | 0 (0.0%) | 9 (100.0%) |
| 5 or more Children | 0 (0.0%) | 0 (0.0%) |
| Total | 0 (0.0%) | 9 (28.1%) |
Income Below Poverty Among Married-Couple vs Single-Parent Households in Hiltonia
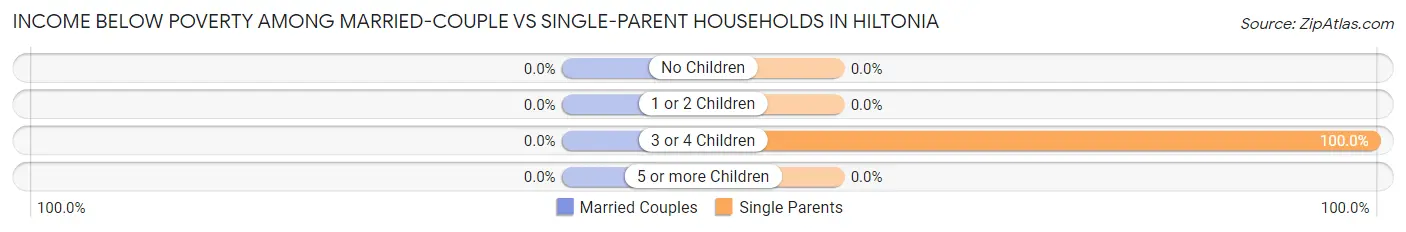
| Children | Married-Couple Families | Single-Parent Households |
| No Children | 0 (0.0%) | 0 (0.0%) |
| 1 or 2 Children | 0 (0.0%) | 0 (0.0%) |
| 3 or 4 Children | 0 (0.0%) | 9 (100.0%) |
| 5 or more Children | 0 (0.0%) | 0 (0.0%) |
| Total | 0 (0.0%) | 9 (25.0%) |
Employment Characteristics in Hiltonia
Employment by Class of Employer in Hiltonia
Among the 106 employed individuals in Hiltonia, private company employees (76 | 71.7%), local government employees (15 | 14.1%), and federal government employees (9 | 8.5%) make up the most common classes of employment.
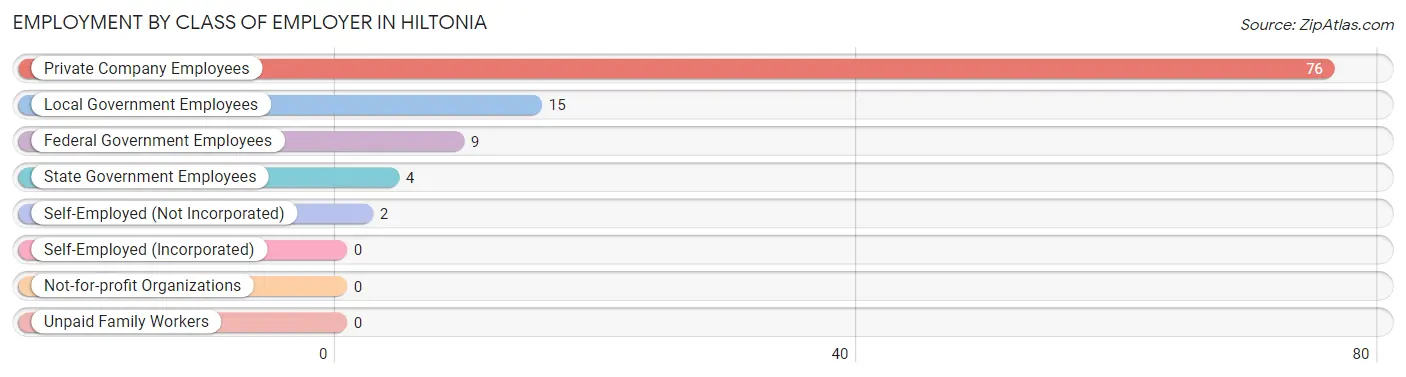
| Employer Class | # Employees | % Employees |
| Private Company Employees | 76 | 71.7% |
| Self-Employed (Incorporated) | 0 | 0.0% |
| Self-Employed (Not Incorporated) | 2 | 1.9% |
| Not-for-profit Organizations | 0 | 0.0% |
| Local Government Employees | 15 | 14.1% |
| State Government Employees | 4 | 3.8% |
| Federal Government Employees | 9 | 8.5% |
| Unpaid Family Workers | 0 | 0.0% |
| Total | 106 | 100.0% |
Employment Status by Age in Hiltonia
According to the labor force statistics for Hiltonia, out of the total population over 16 years of age (385), 35.8% or 138 individuals are in the labor force, with 23.2% or 32 of them unemployed. The age group with the highest labor force participation rate is 16 to 19 years, with 100.0% or 2 individuals in the labor force. Within the labor force, the 45 to 54 years age range has the highest percentage of unemployed individuals, with 42.6% or 23 of them being unemployed.
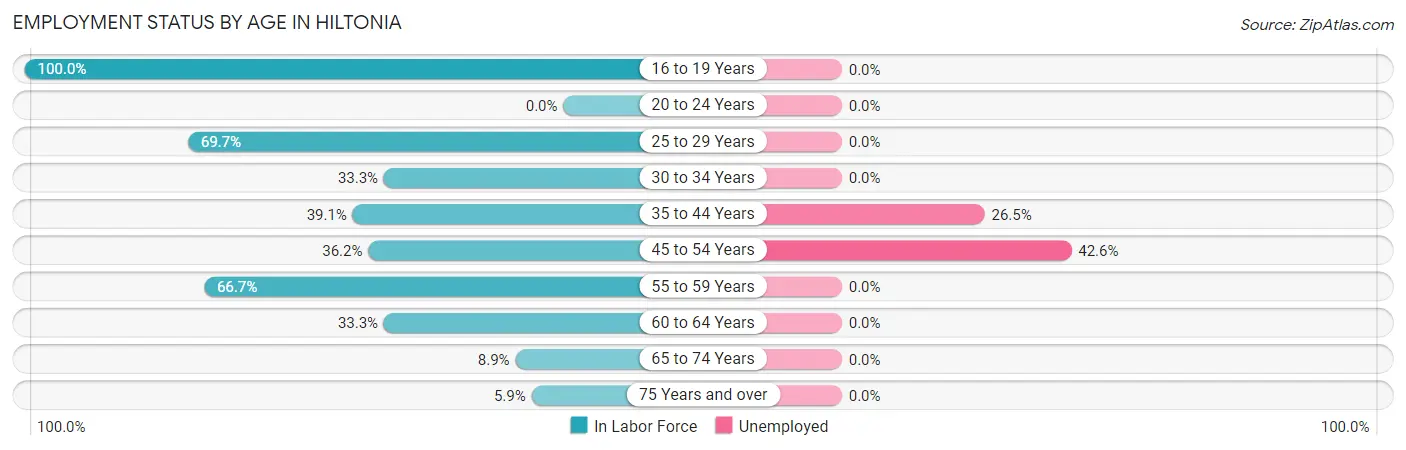
| Age Bracket | In Labor Force | Unemployed |
| 16 to 19 Years | 2 (100.0%) | 0 (0.0%) |
| 20 to 24 Years | 0 (0.0%) | 0 (0.0%) |
| 25 to 29 Years | 23 (69.7%) | 0 (0.0%) |
| 30 to 34 Years | 6 (33.3%) | 0 (0.0%) |
| 35 to 44 Years | 34 (39.1%) | 9 (26.5%) |
| 45 to 54 Years | 54 (36.2%) | 23 (42.6%) |
| 55 to 59 Years | 12 (66.7%) | 0 (0.0%) |
| 60 to 64 Years | 2 (33.3%) | 0 (0.0%) |
| 65 to 74 Years | 4 (8.9%) | 0 (0.0%) |
| 75 Years and over | 1 (5.9%) | 0 (0.0%) |
| Total | 138 (35.8%) | 32 (23.2%) |
Employment Status by Educational Attainment in Hiltonia
According to labor force statistics for Hiltonia, 42.1% of individuals (131) out of the total population between 25 and 64 years of age (311) are in the labor force, with 24.4% or 32 of them being unemployed. The group with the highest labor force participation rate are those with the educational attainment of bachelor's degree or higher, with 74.4% or 32 individuals in the labor force. Within the labor force, individuals with bachelor's degree or higher education have the highest percentage of unemployment, with 65.6% or 21 of them being unemployed.
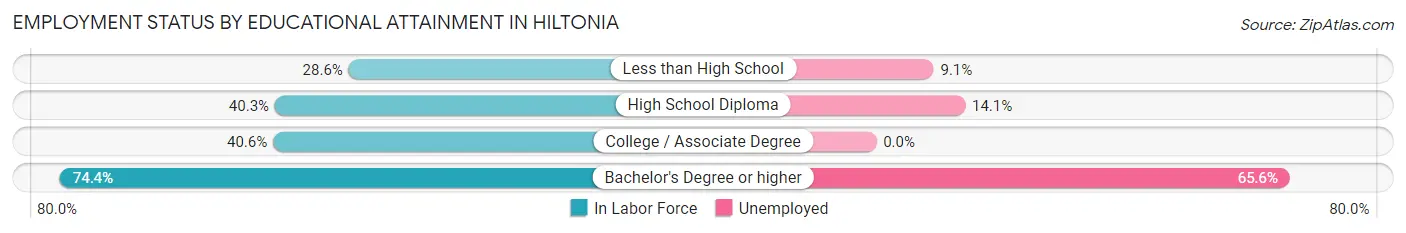
| Educational Attainment | In Labor Force | Unemployed |
| Less than High School | 22 (28.6%) | 7 (9.1%) |
| High School Diploma | 64 (40.3%) | 22 (14.1%) |
| College / Associate Degree | 13 (40.6%) | 0 (0.0%) |
| Bachelor's Degree or higher | 32 (74.4%) | 28 (65.6%) |
| Total | 131 (42.1%) | 76 (24.4%) |
Employment Occupations by Sex in Hiltonia
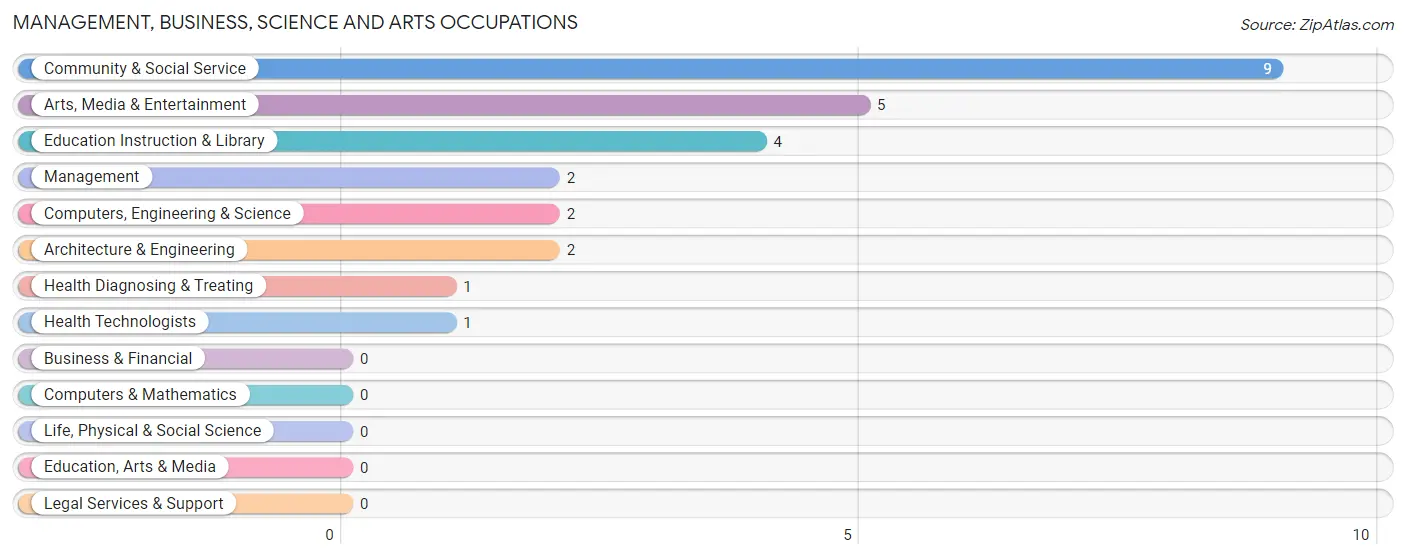
Management, Business, Science and Arts Occupations
The most common Management, Business, Science and Arts occupations in Hiltonia are Community & Social Service (9 | 8.5%), Arts, Media & Entertainment (5 | 4.7%), Education Instruction & Library (4 | 3.8%), Management (2 | 1.9%), and Computers, Engineering & Science (2 | 1.9%).
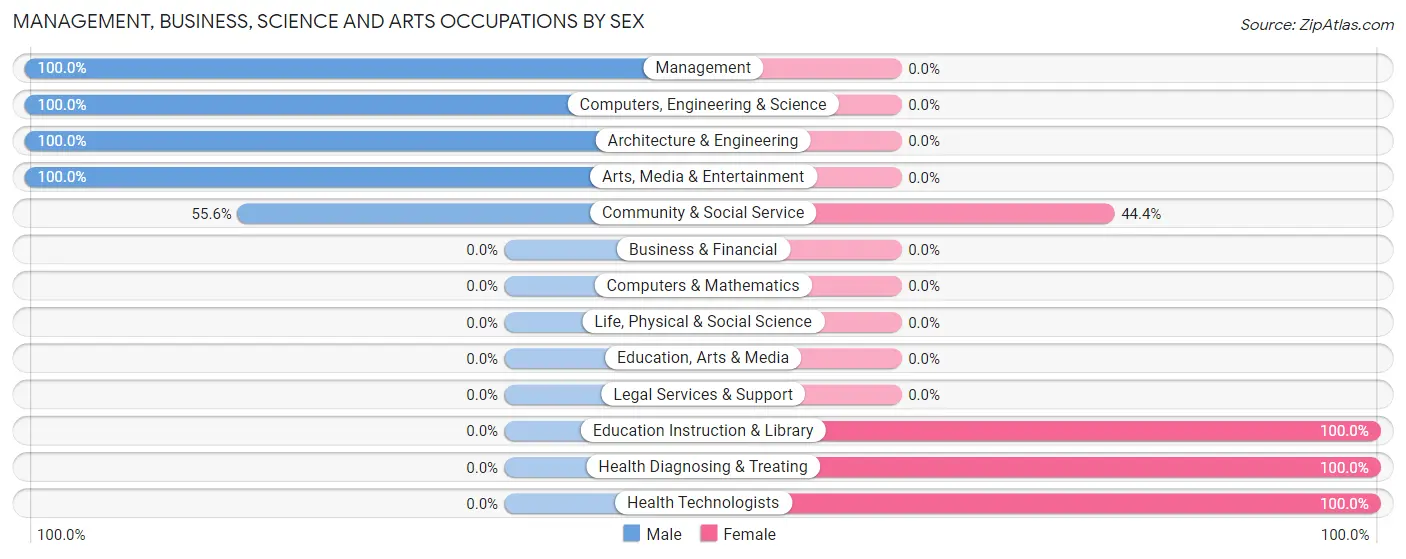
Management, Business, Science and Arts Occupations by Sex
Within the Management, Business, Science and Arts occupations in Hiltonia, the most male-oriented occupations are Management (100.0%), Computers, Engineering & Science (100.0%), and Architecture & Engineering (100.0%), while the most female-oriented occupations are Education Instruction & Library (100.0%), Health Diagnosing & Treating (100.0%), and Health Technologists (100.0%).
| Occupation | Male | Female |
| Management | 2 (100.0%) | 0 (0.0%) |
| Business & Financial | 0 (0.0%) | 0 (0.0%) |
| Computers, Engineering & Science | 2 (100.0%) | 0 (0.0%) |
| Computers & Mathematics | 0 (0.0%) | 0 (0.0%) |
| Architecture & Engineering | 2 (100.0%) | 0 (0.0%) |
| Life, Physical & Social Science | 0 (0.0%) | 0 (0.0%) |
| Community & Social Service | 5 (55.6%) | 4 (44.4%) |
| Education, Arts & Media | 0 (0.0%) | 0 (0.0%) |
| Legal Services & Support | 0 (0.0%) | 0 (0.0%) |
| Education Instruction & Library | 0 (0.0%) | 4 (100.0%) |
| Arts, Media & Entertainment | 5 (100.0%) | 0 (0.0%) |
| Health Diagnosing & Treating | 0 (0.0%) | 1 (100.0%) |
| Health Technologists | 0 (0.0%) | 1 (100.0%) |
| Total (Category) | 9 (64.3%) | 5 (35.7%) |
| Total (Overall) | 48 (45.3%) | 58 (54.7%) |
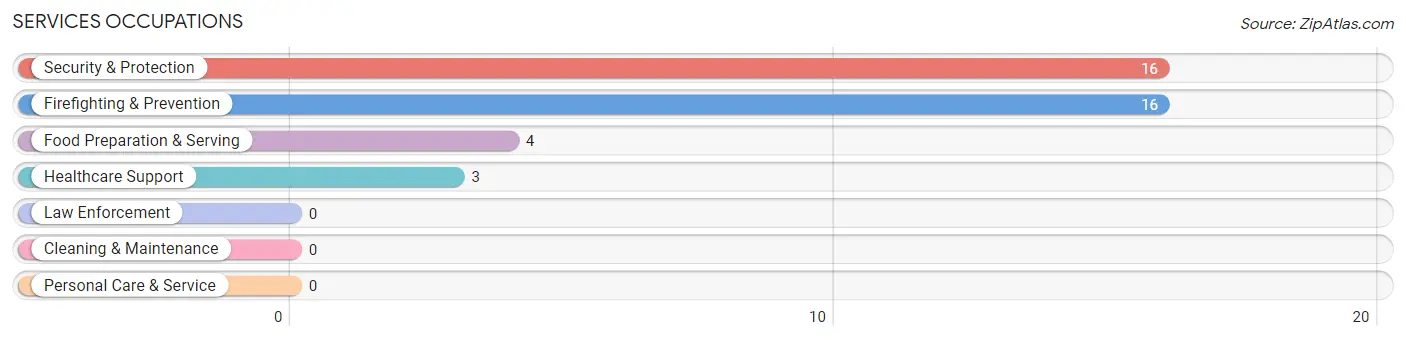
Services Occupations
The most common Services occupations in Hiltonia are Security & Protection (16 | 15.1%), Firefighting & Prevention (16 | 15.1%), Food Preparation & Serving (4 | 3.8%), and Healthcare Support (3 | 2.8%).
Services Occupations by Sex
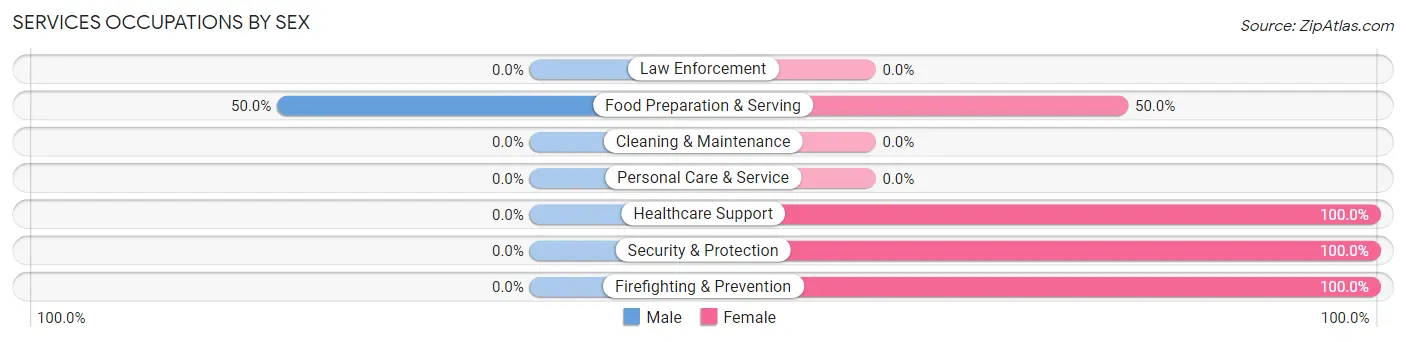
| Occupation | Male | Female |
| Healthcare Support | 0 (0.0%) | 3 (100.0%) |
| Security & Protection | 0 (0.0%) | 16 (100.0%) |
| Firefighting & Prevention | 0 (0.0%) | 16 (100.0%) |
| Law Enforcement | 0 (0.0%) | 0 (0.0%) |
| Food Preparation & Serving | 2 (50.0%) | 2 (50.0%) |
| Cleaning & Maintenance | 0 (0.0%) | 0 (0.0%) |
| Personal Care & Service | 0 (0.0%) | 0 (0.0%) |
| Total (Category) | 2 (8.7%) | 21 (91.3%) |
| Total (Overall) | 48 (45.3%) | 58 (54.7%) |
Sales and Office Occupations
The most common Sales and Office occupations in Hiltonia are Office & Administration (41 | 38.7%), and Sales & Related (2 | 1.9%).
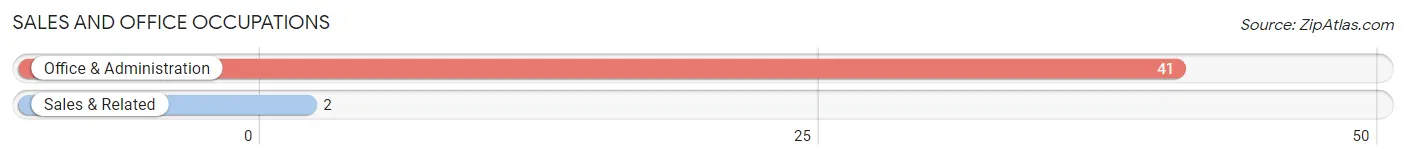
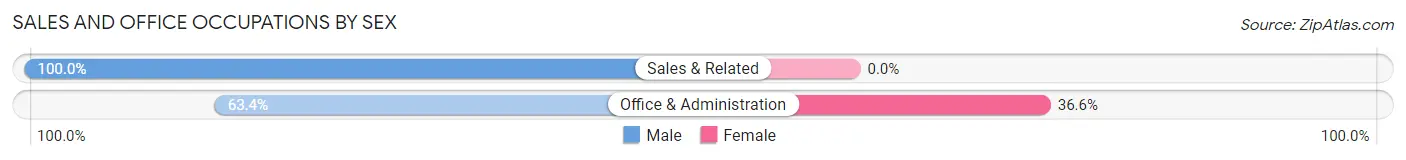
Sales and Office Occupations by Sex
| Occupation | Male | Female |
| Sales & Related | 2 (100.0%) | 0 (0.0%) |
| Office & Administration | 26 (63.4%) | 15 (36.6%) |
| Total (Category) | 28 (65.1%) | 15 (34.9%) |
| Total (Overall) | 48 (45.3%) | 58 (54.7%) |
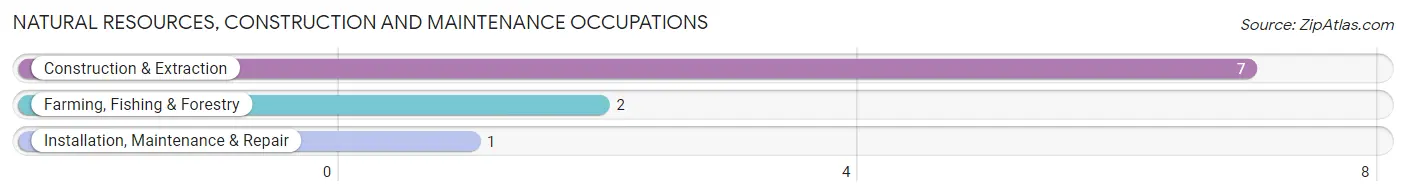
Natural Resources, Construction and Maintenance Occupations
The most common Natural Resources, Construction and Maintenance occupations in Hiltonia are Construction & Extraction (7 | 6.6%), Farming, Fishing & Forestry (2 | 1.9%), and Installation, Maintenance & Repair (1 | 0.9%).
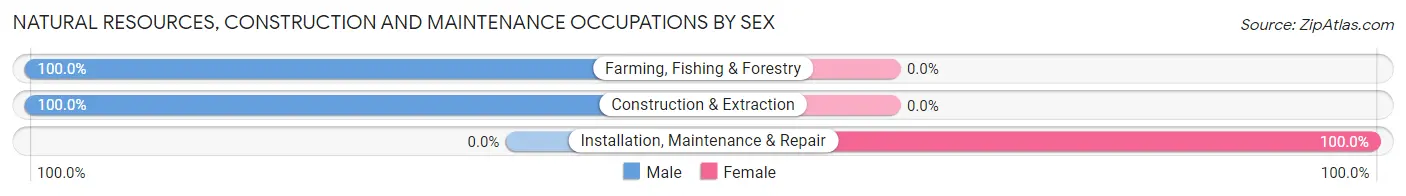
Natural Resources, Construction and Maintenance Occupations by Sex
| Occupation | Male | Female |
| Farming, Fishing & Forestry | 2 (100.0%) | 0 (0.0%) |
| Construction & Extraction | 7 (100.0%) | 0 (0.0%) |
| Installation, Maintenance & Repair | 0 (0.0%) | 1 (100.0%) |
| Total (Category) | 9 (90.0%) | 1 (10.0%) |
| Total (Overall) | 48 (45.3%) | 58 (54.7%) |
Production, Transportation and Moving Occupations
The most common Production, Transportation and Moving occupations in Hiltonia are Material Moving (11 | 10.4%), and Production (5 | 4.7%).
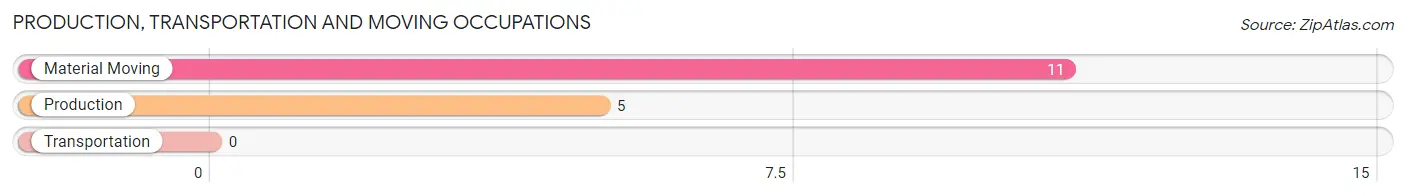
Production, Transportation and Moving Occupations by Sex
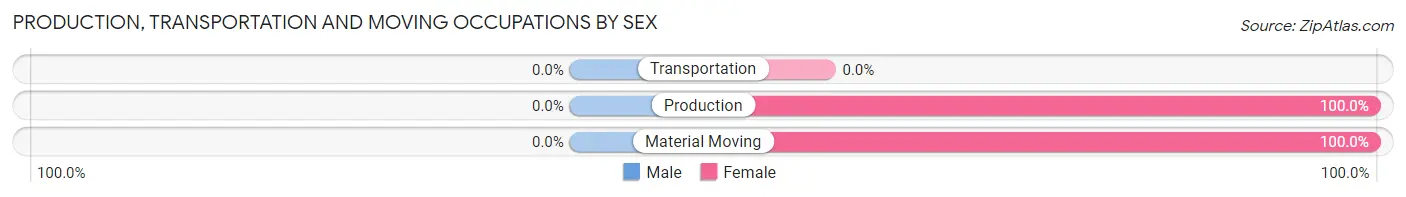
| Occupation | Male | Female |
| Production | 0 (0.0%) | 5 (100.0%) |
| Transportation | 0 (0.0%) | 0 (0.0%) |
| Material Moving | 0 (0.0%) | 11 (100.0%) |
| Total (Category) | 0 (0.0%) | 16 (100.0%) |
| Total (Overall) | 48 (45.3%) | 58 (54.7%) |
Employment Industries by Sex in Hiltonia
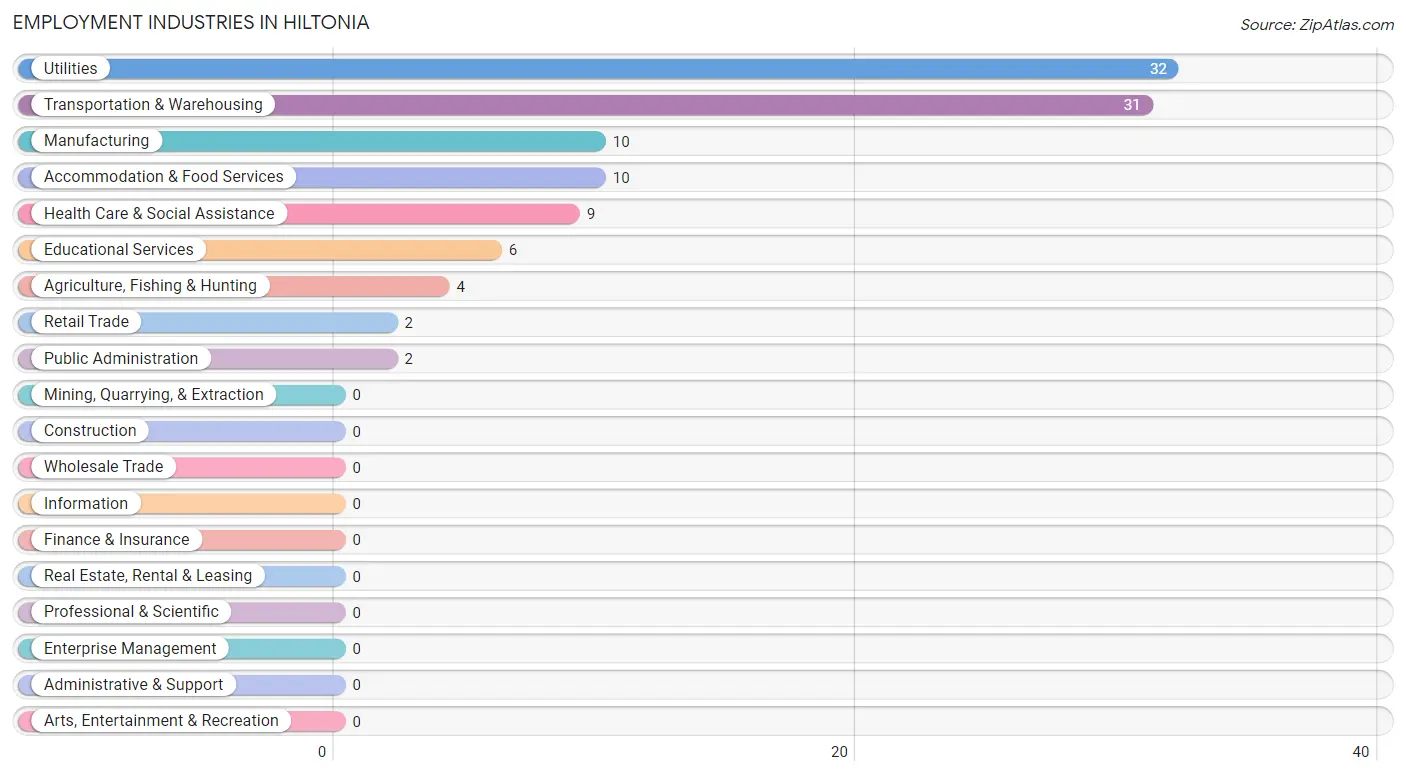
Employment Industries in Hiltonia
The major employment industries in Hiltonia include Utilities (32 | 30.2%), Transportation & Warehousing (31 | 29.2%), Manufacturing (10 | 9.4%), Accommodation & Food Services (10 | 9.4%), and Health Care & Social Assistance (9 | 8.5%).
Employment Industries by Sex in Hiltonia
The Hiltonia industries that see more men than women are Agriculture, Fishing & Hunting (100.0%), Retail Trade (100.0%), and Transportation & Warehousing (83.9%), whereas the industries that tend to have a higher number of women are Educational Services (100.0%), Public Administration (100.0%), and Utilities (84.4%).

| Industry | Male | Female |
| Agriculture, Fishing & Hunting | 4 (100.0%) | 0 (0.0%) |
| Mining, Quarrying, & Extraction | 0 (0.0%) | 0 (0.0%) |
| Construction | 0 (0.0%) | 0 (0.0%) |
| Manufacturing | 4 (40.0%) | 6 (60.0%) |
| Wholesale Trade | 0 (0.0%) | 0 (0.0%) |
| Retail Trade | 2 (100.0%) | 0 (0.0%) |
| Transportation & Warehousing | 26 (83.9%) | 5 (16.1%) |
| Utilities | 5 (15.6%) | 27 (84.4%) |
| Information | 0 (0.0%) | 0 (0.0%) |
| Finance & Insurance | 0 (0.0%) | 0 (0.0%) |
| Real Estate, Rental & Leasing | 0 (0.0%) | 0 (0.0%) |
| Professional & Scientific | 0 (0.0%) | 0 (0.0%) |
| Enterprise Management | 0 (0.0%) | 0 (0.0%) |
| Administrative & Support | 0 (0.0%) | 0 (0.0%) |
| Educational Services | 0 (0.0%) | 6 (100.0%) |
| Health Care & Social Assistance | 5 (55.6%) | 4 (44.4%) |
| Arts, Entertainment & Recreation | 0 (0.0%) | 0 (0.0%) |
| Accommodation & Food Services | 2 (20.0%) | 8 (80.0%) |
| Public Administration | 0 (0.0%) | 2 (100.0%) |
| Total | 48 (45.3%) | 58 (54.7%) |
Education in Hiltonia
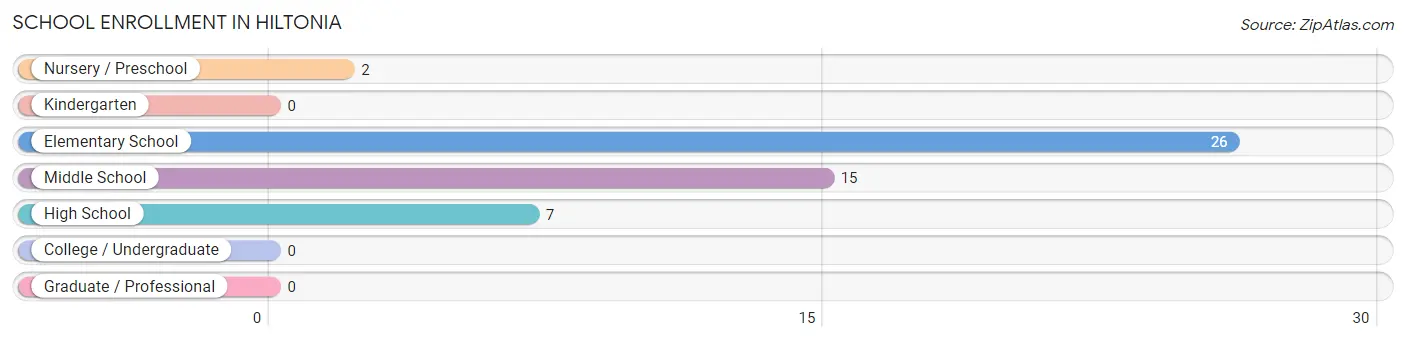
School Enrollment in Hiltonia
The most common levels of schooling among the 50 students in Hiltonia are elementary school (26 | 52.0%), middle school (15 | 30.0%), and high school (7 | 14.0%).
| School Level | # Students | % Students |
| Nursery / Preschool | 2 | 4.0% |
| Kindergarten | 0 | 0.0% |
| Elementary School | 26 | 52.0% |
| Middle School | 15 | 30.0% |
| High School | 7 | 14.0% |
| College / Undergraduate | 0 | 0.0% |
| Graduate / Professional | 0 | 0.0% |
| Total | 50 | 100.0% |
School Enrollment by Age by Funding Source in Hiltonia
Out of a total of 50 students who are enrolled in schools in Hiltonia, 2 (4.0%) attend a private institution, while the remaining 48 (96.0%) are enrolled in public schools. The age group of 3 to 4 year olds has the highest likelihood of being enrolled in private schools, with 2 (100.0% in the age bracket) enrolled. Conversely, the age group of 5 to 9 year old has the lowest likelihood of being enrolled in a private school, with 26 (100.0% in the age bracket) attending a public institution.
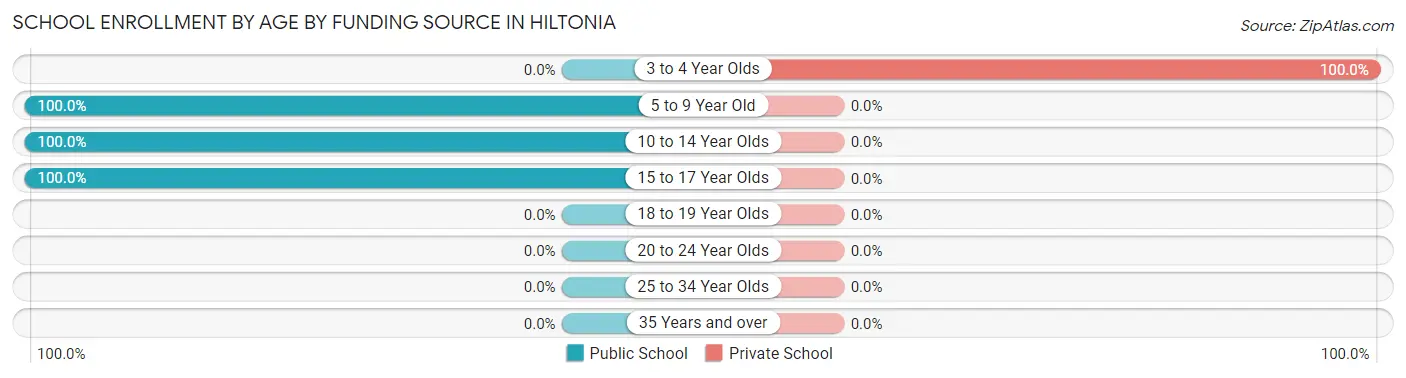
| Age Bracket | Public School | Private School |
| 3 to 4 Year Olds | 0 (0.0%) | 2 (100.0%) |
| 5 to 9 Year Old | 26 (100.0%) | 0 (0.0%) |
| 10 to 14 Year Olds | 15 (100.0%) | 0 (0.0%) |
| 15 to 17 Year Olds | 7 (100.0%) | 0 (0.0%) |
| 18 to 19 Year Olds | 0 (0.0%) | 0 (0.0%) |
| 20 to 24 Year Olds | 0 (0.0%) | 0 (0.0%) |
| 25 to 34 Year Olds | 0 (0.0%) | 0 (0.0%) |
| 35 Years and over | 0 (0.0%) | 0 (0.0%) |
| Total | 48 (96.0%) | 2 (4.0%) |
Educational Attainment by Field of Study in Hiltonia
Education (33 | 67.3%), liberal arts & history (10 | 20.4%), engineering (2 | 4.1%), science & technology (2 | 4.1%), and literature & languages (2 | 4.1%) are the most common fields of study among 49 individuals in Hiltonia who have obtained a bachelor's degree or higher.
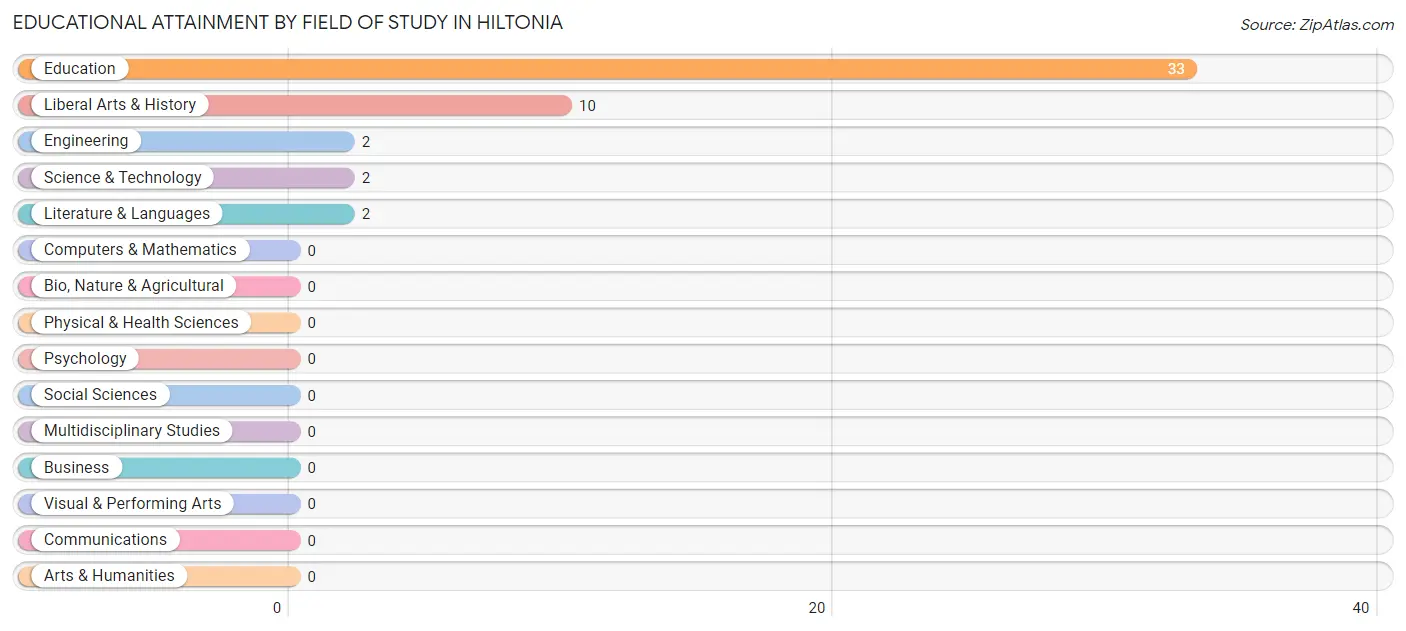
| Field of Study | # Graduates | % Graduates |
| Computers & Mathematics | 0 | 0.0% |
| Bio, Nature & Agricultural | 0 | 0.0% |
| Physical & Health Sciences | 0 | 0.0% |
| Psychology | 0 | 0.0% |
| Social Sciences | 0 | 0.0% |
| Engineering | 2 | 4.1% |
| Multidisciplinary Studies | 0 | 0.0% |
| Science & Technology | 2 | 4.1% |
| Business | 0 | 0.0% |
| Education | 33 | 67.3% |
| Literature & Languages | 2 | 4.1% |
| Liberal Arts & History | 10 | 20.4% |
| Visual & Performing Arts | 0 | 0.0% |
| Communications | 0 | 0.0% |
| Arts & Humanities | 0 | 0.0% |
| Total | 49 | 100.0% |
Transportation & Commute in Hiltonia
Vehicle Availability by Sex in Hiltonia
The most prevalent vehicle ownership categories in Hiltonia are males with 3 vehicles (24, accounting for 50.0%) and females with 3 vehicles (13, making up 41.4%).
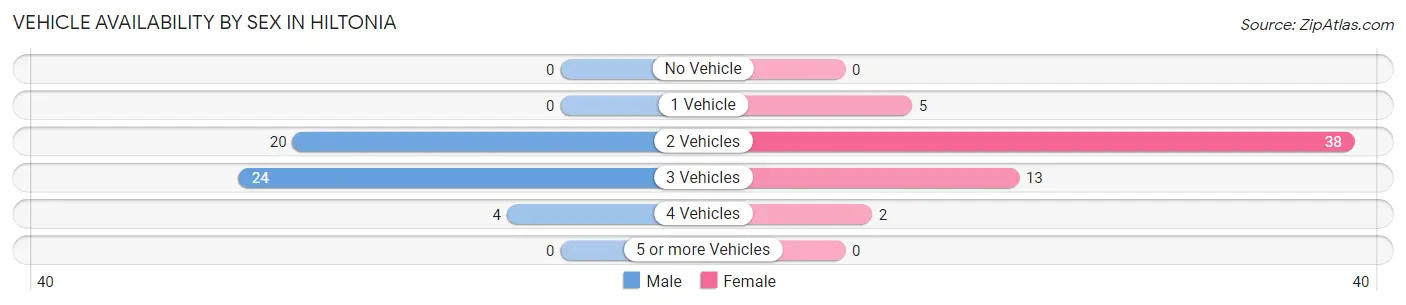
| Vehicles Available | Male | Female |
| No Vehicle | 0 (0.0%) | 0 (0.0%) |
| 1 Vehicle | 0 (0.0%) | 5 (8.6%) |
| 2 Vehicles | 20 (41.7%) | 38 (65.5%) |
| 3 Vehicles | 24 (50.0%) | 13 (22.4%) |
| 4 Vehicles | 4 (8.3%) | 2 (3.5%) |
| 5 or more Vehicles | 0 (0.0%) | 0 (0.0%) |
| Total | 48 (100.0%) | 58 (100.0%) |
Commute Time in Hiltonia
The most frequently occuring commute durations in Hiltonia are 20 to 24 minutes (19 commuters, 22.1%), 15 to 19 minutes (18 commuters, 20.9%), and 10 to 14 minutes (16 commuters, 18.6%).
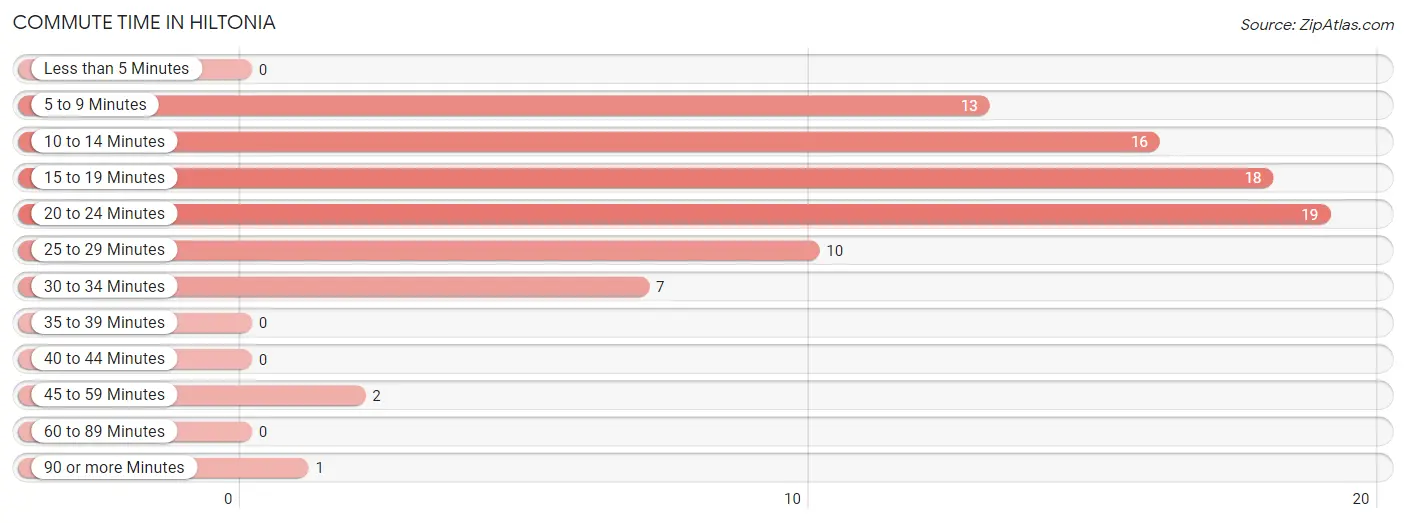
| Commute Time | # Commuters | % Commuters |
| Less than 5 Minutes | 0 | 0.0% |
| 5 to 9 Minutes | 13 | 15.1% |
| 10 to 14 Minutes | 16 | 18.6% |
| 15 to 19 Minutes | 18 | 20.9% |
| 20 to 24 Minutes | 19 | 22.1% |
| 25 to 29 Minutes | 10 | 11.6% |
| 30 to 34 Minutes | 7 | 8.1% |
| 35 to 39 Minutes | 0 | 0.0% |
| 40 to 44 Minutes | 0 | 0.0% |
| 45 to 59 Minutes | 2 | 2.3% |
| 60 to 89 Minutes | 0 | 0.0% |
| 90 or more Minutes | 1 | 1.2% |
Commute Time by Sex in Hiltonia
The most common commute times in Hiltonia are 15 to 19 minutes (12 commuters, 42.9%) for males and 20 to 24 minutes (19 commuters, 32.8%) for females.
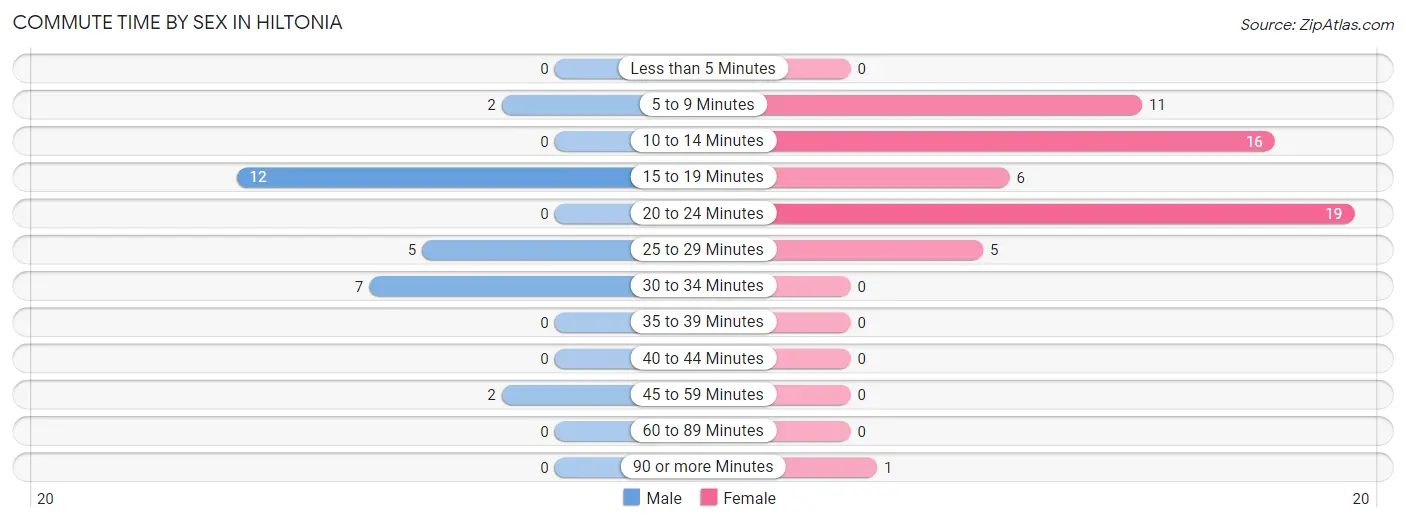
| Commute Time | Male | Female |
| Less than 5 Minutes | 0 (0.0%) | 0 (0.0%) |
| 5 to 9 Minutes | 2 (7.1%) | 11 (19.0%) |
| 10 to 14 Minutes | 0 (0.0%) | 16 (27.6%) |
| 15 to 19 Minutes | 12 (42.9%) | 6 (10.3%) |
| 20 to 24 Minutes | 0 (0.0%) | 19 (32.8%) |
| 25 to 29 Minutes | 5 (17.9%) | 5 (8.6%) |
| 30 to 34 Minutes | 7 (25.0%) | 0 (0.0%) |
| 35 to 39 Minutes | 0 (0.0%) | 0 (0.0%) |
| 40 to 44 Minutes | 0 (0.0%) | 0 (0.0%) |
| 45 to 59 Minutes | 2 (7.1%) | 0 (0.0%) |
| 60 to 89 Minutes | 0 (0.0%) | 0 (0.0%) |
| 90 or more Minutes | 0 (0.0%) | 1 (1.7%) |
Time of Departure to Work by Sex in Hiltonia
The most frequent times of departure to work in Hiltonia are 7:00 AM to 7:29 AM (9, 32.1%) for males and 12:00 AM to 4:59 AM (18, 31.0%) for females.
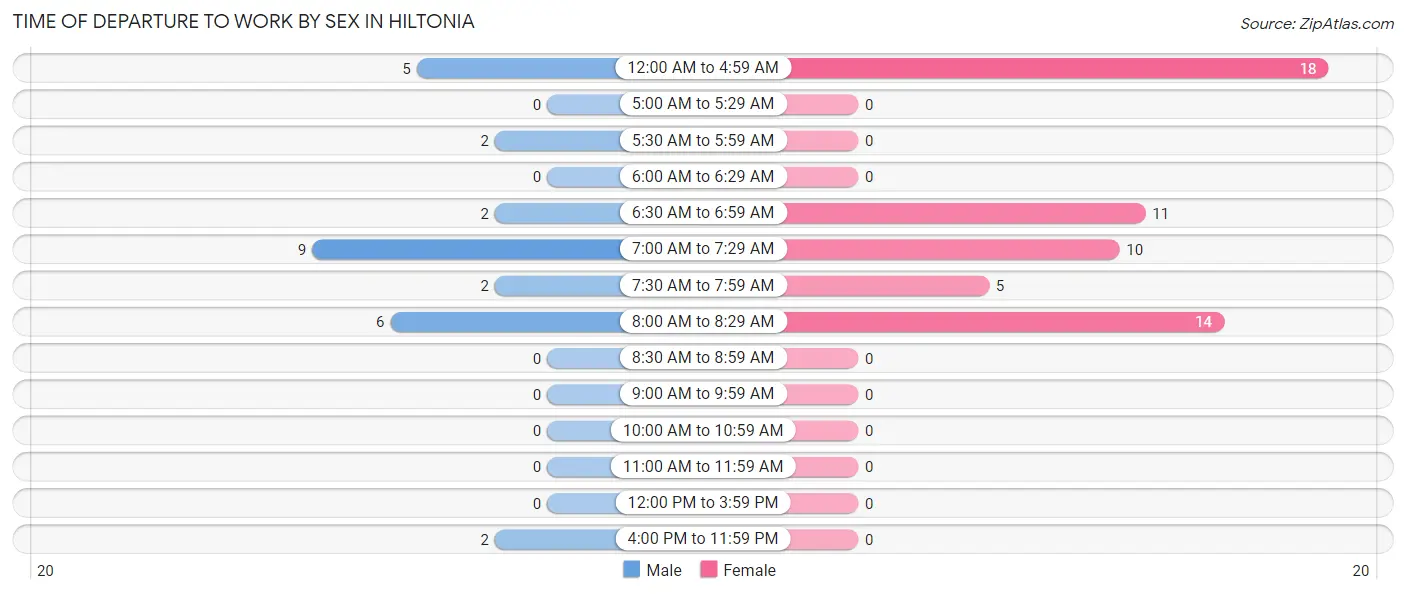
| Time of Departure | Male | Female |
| 12:00 AM to 4:59 AM | 5 (17.9%) | 18 (31.0%) |
| 5:00 AM to 5:29 AM | 0 (0.0%) | 0 (0.0%) |
| 5:30 AM to 5:59 AM | 2 (7.1%) | 0 (0.0%) |
| 6:00 AM to 6:29 AM | 0 (0.0%) | 0 (0.0%) |
| 6:30 AM to 6:59 AM | 2 (7.1%) | 11 (19.0%) |
| 7:00 AM to 7:29 AM | 9 (32.1%) | 10 (17.2%) |
| 7:30 AM to 7:59 AM | 2 (7.1%) | 5 (8.6%) |
| 8:00 AM to 8:29 AM | 6 (21.4%) | 14 (24.1%) |
| 8:30 AM to 8:59 AM | 0 (0.0%) | 0 (0.0%) |
| 9:00 AM to 9:59 AM | 0 (0.0%) | 0 (0.0%) |
| 10:00 AM to 10:59 AM | 0 (0.0%) | 0 (0.0%) |
| 11:00 AM to 11:59 AM | 0 (0.0%) | 0 (0.0%) |
| 12:00 PM to 3:59 PM | 0 (0.0%) | 0 (0.0%) |
| 4:00 PM to 11:59 PM | 2 (7.1%) | 0 (0.0%) |
| Total | 28 (100.0%) | 58 (100.0%) |
Housing Occupancy in Hiltonia
Occupancy by Ownership in Hiltonia
Of the total 102 dwellings in Hiltonia, owner-occupied units account for 73 (71.6%), while renter-occupied units make up 29 (28.4%).
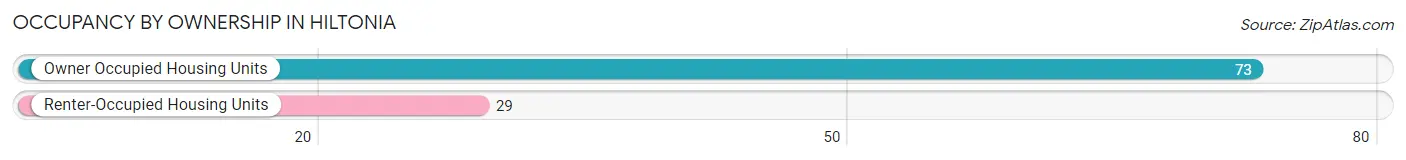
| Occupancy | # Housing Units | % Housing Units |
| Owner Occupied Housing Units | 73 | 71.6% |
| Renter-Occupied Housing Units | 29 | 28.4% |
| Total Occupied Housing Units | 102 | 100.0% |
Occupancy by Household Size in Hiltonia
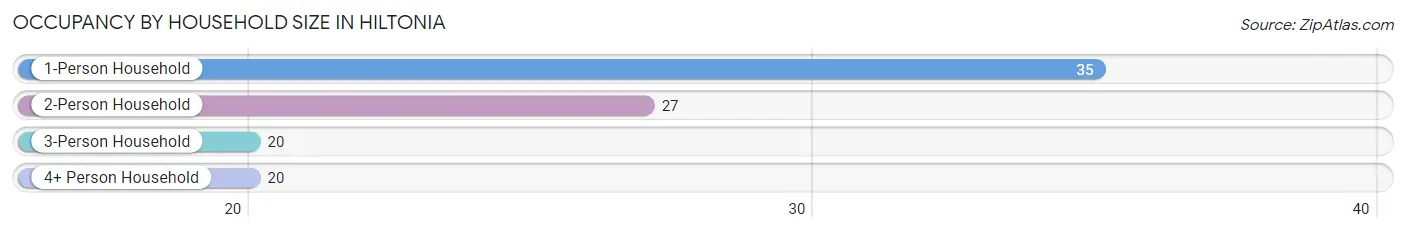
| Household Size | # Housing Units | % Housing Units |
| 1-Person Household | 35 | 34.3% |
| 2-Person Household | 27 | 26.5% |
| 3-Person Household | 20 | 19.6% |
| 4+ Person Household | 20 | 19.6% |
| Total Housing Units | 102 | 100.0% |
Occupancy by Ownership by Household Size in Hiltonia

| Household Size | Owner-occupied | Renter-occupied |
| 1-Person Household | 21 (60.0%) | 14 (40.0%) |
| 2-Person Household | 20 (74.1%) | 7 (25.9%) |
| 3-Person Household | 18 (90.0%) | 2 (10.0%) |
| 4+ Person Household | 14 (70.0%) | 6 (30.0%) |
| Total Housing Units | 73 (71.6%) | 29 (28.4%) |
Occupancy by Educational Attainment in Hiltonia
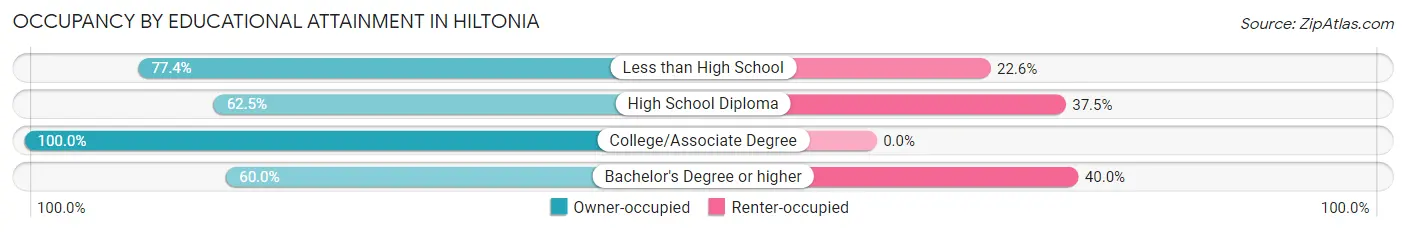
| Household Size | Owner-occupied | Renter-occupied |
| Less than High School | 24 (77.4%) | 7 (22.6%) |
| High School Diploma | 30 (62.5%) | 18 (37.5%) |
| College/Associate Degree | 13 (100.0%) | 0 (0.0%) |
| Bachelor's Degree or higher | 6 (60.0%) | 4 (40.0%) |
Occupancy by Age of Householder in Hiltonia
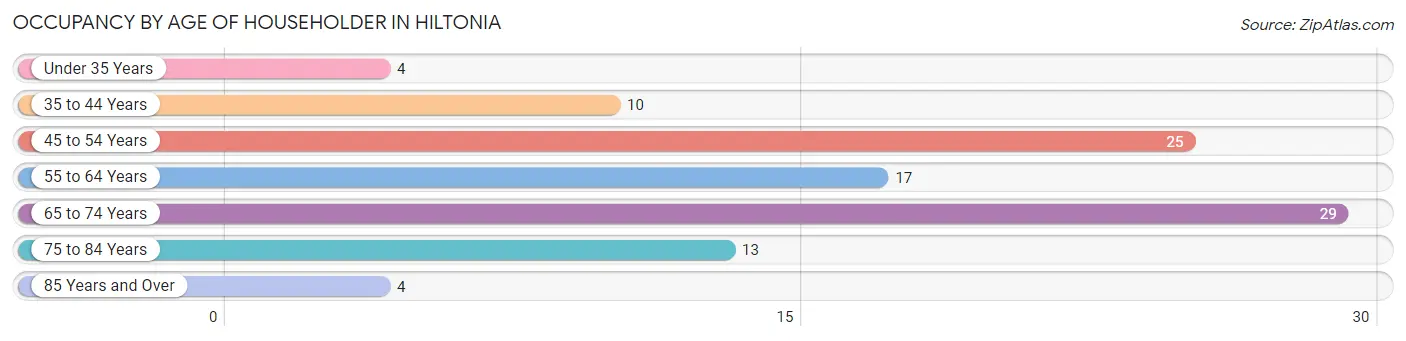
| Age Bracket | # Households | % Households |
| Under 35 Years | 4 | 3.9% |
| 35 to 44 Years | 10 | 9.8% |
| 45 to 54 Years | 25 | 24.5% |
| 55 to 64 Years | 17 | 16.7% |
| 65 to 74 Years | 29 | 28.4% |
| 75 to 84 Years | 13 | 12.8% |
| 85 Years and Over | 4 | 3.9% |
| Total | 102 | 100.0% |
Housing Finances in Hiltonia
Median Income by Occupancy in Hiltonia
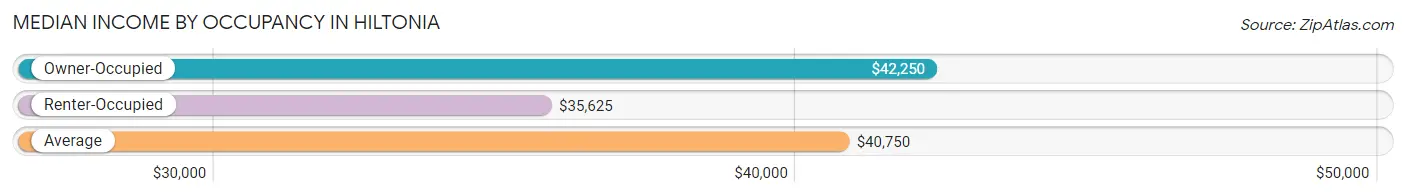
| Occupancy Type | # Households | Median Income |
| Owner-Occupied | 73 (71.6%) | $42,250 |
| Renter-Occupied | 29 (28.4%) | $35,625 |
| Average | 102 (100.0%) | $40,750 |
Occupancy by Householder Income Bracket in Hiltonia
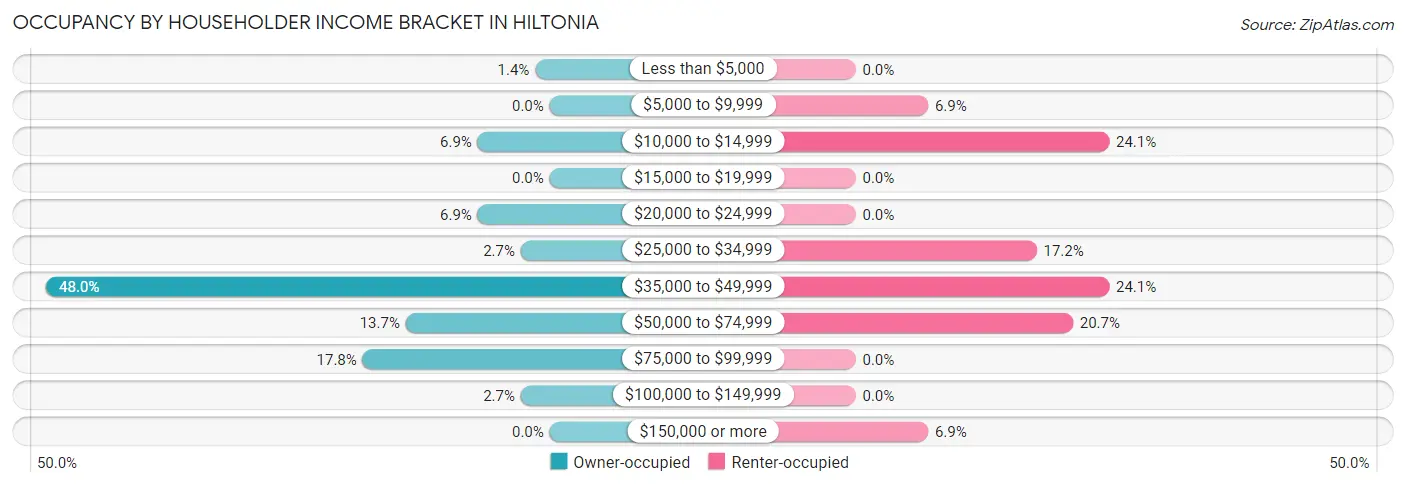
| Income Bracket | Owner-occupied | Renter-occupied |
| Less than $5,000 | 1 (1.4%) | 0 (0.0%) |
| $5,000 to $9,999 | 0 (0.0%) | 2 (6.9%) |
| $10,000 to $14,999 | 5 (6.9%) | 7 (24.1%) |
| $15,000 to $19,999 | 0 (0.0%) | 0 (0.0%) |
| $20,000 to $24,999 | 5 (6.9%) | 0 (0.0%) |
| $25,000 to $34,999 | 2 (2.7%) | 5 (17.2%) |
| $35,000 to $49,999 | 35 (47.9%) | 7 (24.1%) |
| $50,000 to $74,999 | 10 (13.7%) | 6 (20.7%) |
| $75,000 to $99,999 | 13 (17.8%) | 0 (0.0%) |
| $100,000 to $149,999 | 2 (2.7%) | 0 (0.0%) |
| $150,000 or more | 0 (0.0%) | 2 (6.9%) |
| Total | 73 (100.0%) | 29 (100.0%) |
Monthly Housing Cost Tiers in Hiltonia
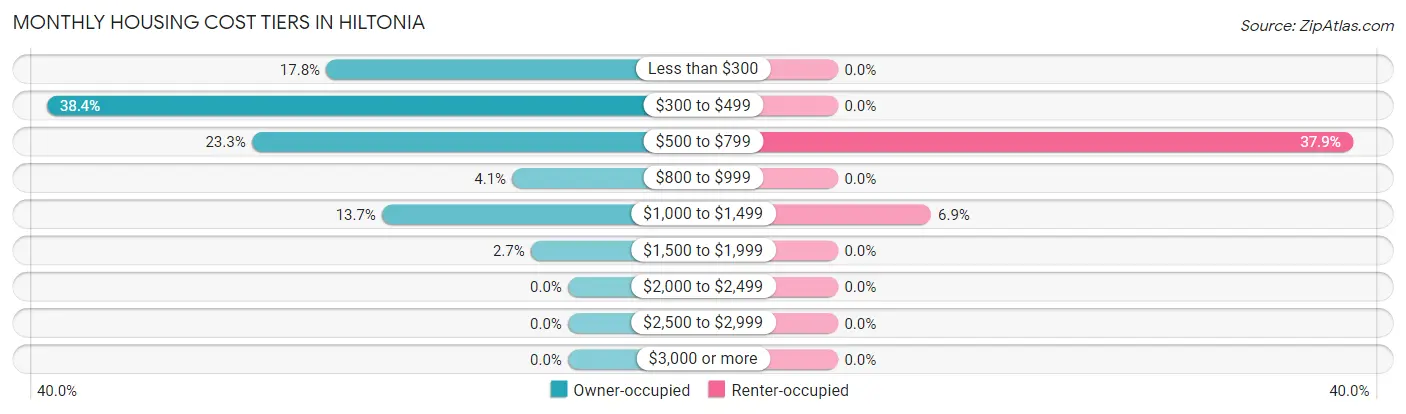
| Monthly Cost | Owner-occupied | Renter-occupied |
| Less than $300 | 13 (17.8%) | 0 (0.0%) |
| $300 to $499 | 28 (38.4%) | 0 (0.0%) |
| $500 to $799 | 17 (23.3%) | 11 (37.9%) |
| $800 to $999 | 3 (4.1%) | 0 (0.0%) |
| $1,000 to $1,499 | 10 (13.7%) | 2 (6.9%) |
| $1,500 to $1,999 | 2 (2.7%) | 0 (0.0%) |
| $2,000 to $2,499 | 0 (0.0%) | 0 (0.0%) |
| $2,500 to $2,999 | 0 (0.0%) | 0 (0.0%) |
| $3,000 or more | 0 (0.0%) | 0 (0.0%) |
| Total | 73 (100.0%) | 29 (100.0%) |
Physical Housing Characteristics in Hiltonia
Housing Structures in Hiltonia
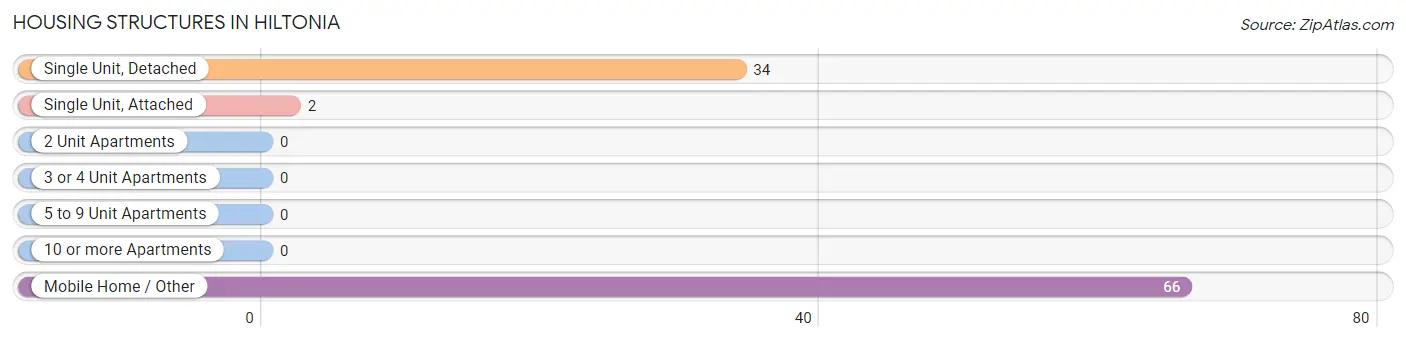
| Structure Type | # Housing Units | % Housing Units |
| Single Unit, Detached | 34 | 33.3% |
| Single Unit, Attached | 2 | 2.0% |
| 2 Unit Apartments | 0 | 0.0% |
| 3 or 4 Unit Apartments | 0 | 0.0% |
| 5 to 9 Unit Apartments | 0 | 0.0% |
| 10 or more Apartments | 0 | 0.0% |
| Mobile Home / Other | 66 | 64.7% |
| Total | 102 | 100.0% |
Housing Structures by Occupancy in Hiltonia
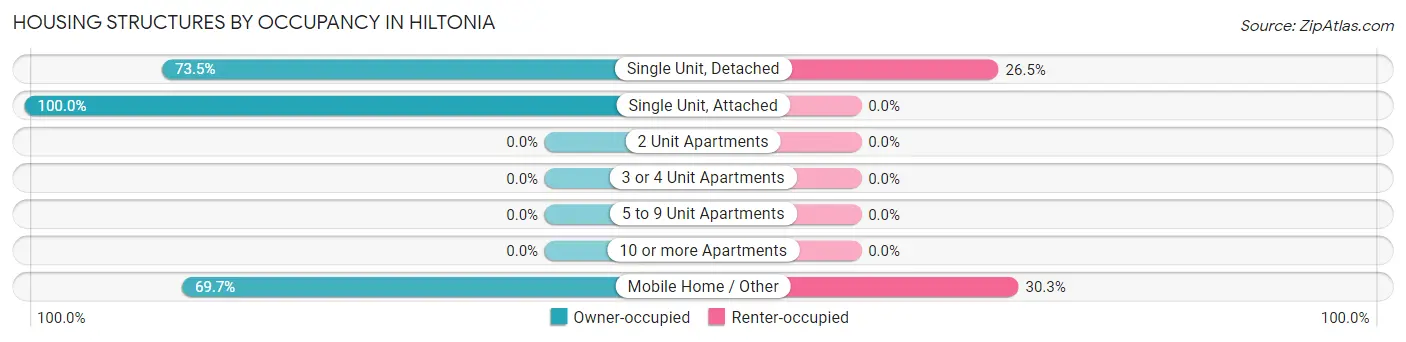
| Structure Type | Owner-occupied | Renter-occupied |
| Single Unit, Detached | 25 (73.5%) | 9 (26.5%) |
| Single Unit, Attached | 2 (100.0%) | 0 (0.0%) |
| 2 Unit Apartments | 0 (0.0%) | 0 (0.0%) |
| 3 or 4 Unit Apartments | 0 (0.0%) | 0 (0.0%) |
| 5 to 9 Unit Apartments | 0 (0.0%) | 0 (0.0%) |
| 10 or more Apartments | 0 (0.0%) | 0 (0.0%) |
| Mobile Home / Other | 46 (69.7%) | 20 (30.3%) |
| Total | 73 (71.6%) | 29 (28.4%) |
Housing Structures by Number of Rooms in Hiltonia
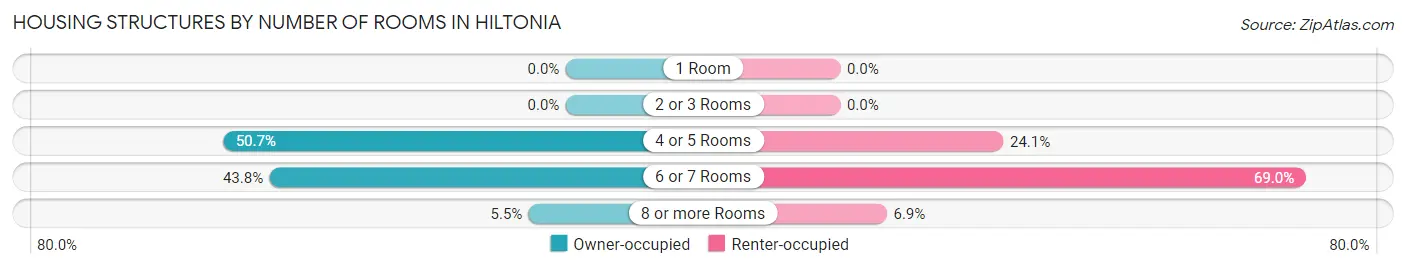
| Number of Rooms | Owner-occupied | Renter-occupied |
| 1 Room | 0 (0.0%) | 0 (0.0%) |
| 2 or 3 Rooms | 0 (0.0%) | 0 (0.0%) |
| 4 or 5 Rooms | 37 (50.7%) | 7 (24.1%) |
| 6 or 7 Rooms | 32 (43.8%) | 20 (69.0%) |
| 8 or more Rooms | 4 (5.5%) | 2 (6.9%) |
| Total | 73 (100.0%) | 29 (100.0%) |
Housing Structure by Heating Type in Hiltonia
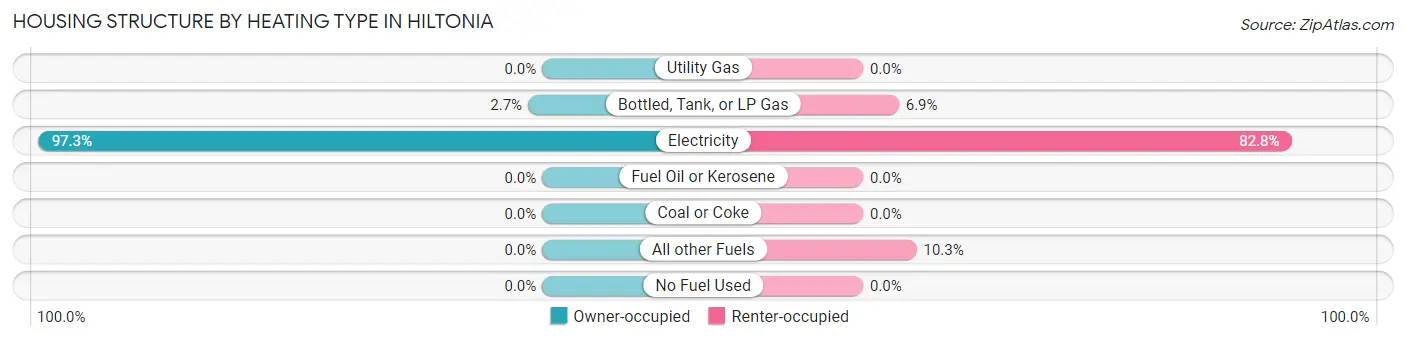
| Heating Type | Owner-occupied | Renter-occupied |
| Utility Gas | 0 (0.0%) | 0 (0.0%) |
| Bottled, Tank, or LP Gas | 2 (2.7%) | 2 (6.9%) |
| Electricity | 71 (97.3%) | 24 (82.8%) |
| Fuel Oil or Kerosene | 0 (0.0%) | 0 (0.0%) |
| Coal or Coke | 0 (0.0%) | 0 (0.0%) |
| All other Fuels | 0 (0.0%) | 3 (10.3%) |
| No Fuel Used | 0 (0.0%) | 0 (0.0%) |
| Total | 73 (100.0%) | 29 (100.0%) |
Household Vehicle Usage in Hiltonia
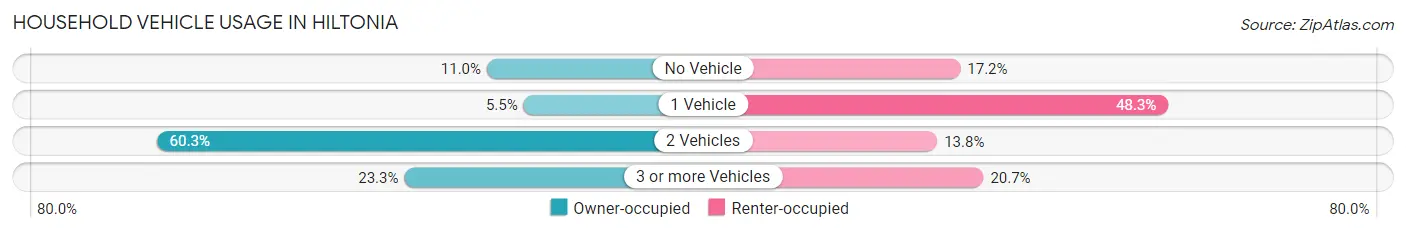
| Vehicles per Household | Owner-occupied | Renter-occupied |
| No Vehicle | 8 (11.0%) | 5 (17.2%) |
| 1 Vehicle | 4 (5.5%) | 14 (48.3%) |
| 2 Vehicles | 44 (60.3%) | 4 (13.8%) |
| 3 or more Vehicles | 17 (23.3%) | 6 (20.7%) |
| Total | 73 (100.0%) | 29 (100.0%) |
Real Estate & Mortgages in Hiltonia
Real Estate and Mortgage Overview in Hiltonia
| Characteristic | Without Mortgage | With Mortgage |
| Housing Units | 66 | 7 |
| Median Property Value | $53,100 | $0 |
| Median Household Income | $40,500 | $0 |
| Monthly Housing Costs | $470 | $0 |
| Real Estate Taxes | $525 | $0 |
Property Value by Mortgage Status in Hiltonia
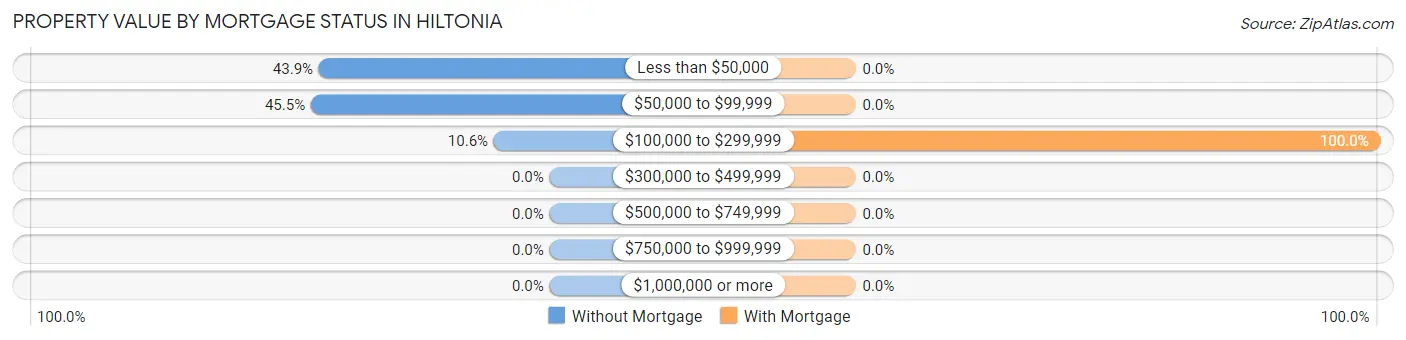
| Property Value | Without Mortgage | With Mortgage |
| Less than $50,000 | 29 (43.9%) | 0 (0.0%) |
| $50,000 to $99,999 | 30 (45.5%) | 0 (0.0%) |
| $100,000 to $299,999 | 7 (10.6%) | 7 (100.0%) |
| $300,000 to $499,999 | 0 (0.0%) | 0 (0.0%) |
| $500,000 to $749,999 | 0 (0.0%) | 0 (0.0%) |
| $750,000 to $999,999 | 0 (0.0%) | 0 (0.0%) |
| $1,000,000 or more | 0 (0.0%) | 0 (0.0%) |
| Total | 66 (100.0%) | 7 (100.0%) |
Household Income by Mortgage Status in Hiltonia
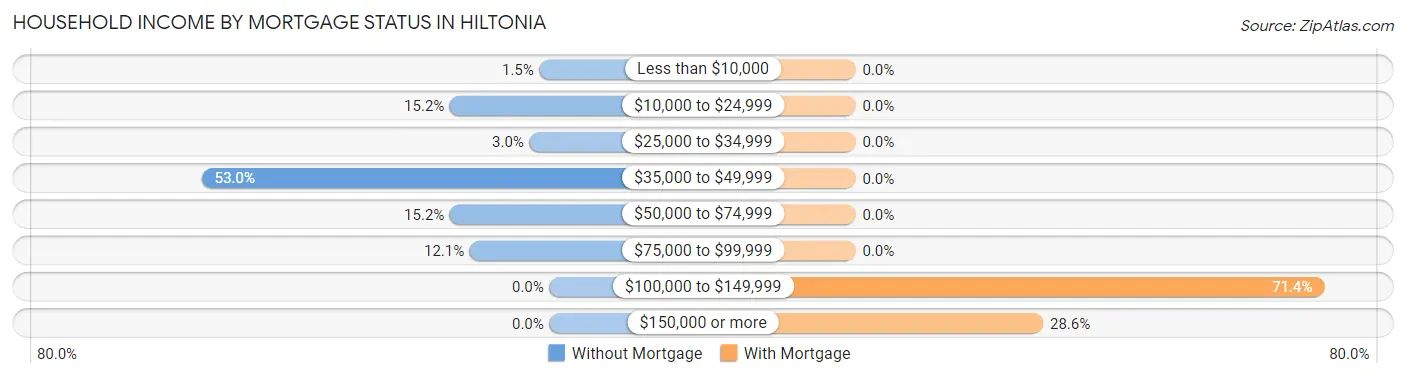
| Household Income | Without Mortgage | With Mortgage |
| Less than $10,000 | 1 (1.5%) | 0 (0.0%) |
| $10,000 to $24,999 | 10 (15.1%) | 0 (0.0%) |
| $25,000 to $34,999 | 2 (3.0%) | 0 (0.0%) |
| $35,000 to $49,999 | 35 (53.0%) | 0 (0.0%) |
| $50,000 to $74,999 | 10 (15.1%) | 0 (0.0%) |
| $75,000 to $99,999 | 8 (12.1%) | 0 (0.0%) |
| $100,000 to $149,999 | 0 (0.0%) | 5 (71.4%) |
| $150,000 or more | 0 (0.0%) | 2 (28.6%) |
| Total | 66 (100.0%) | 7 (100.0%) |
Property Value to Household Income Ratio in Hiltonia
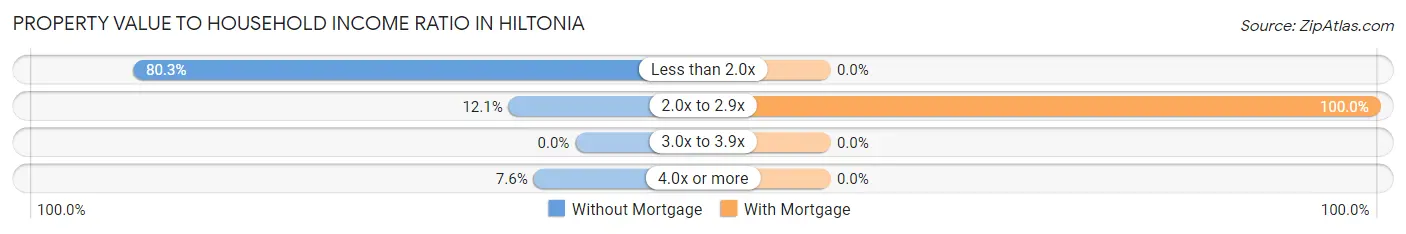
| Value-to-Income Ratio | Without Mortgage | With Mortgage |
| Less than 2.0x | 53 (80.3%) | 0 (0.0%) |
| 2.0x to 2.9x | 8 (12.1%) | 7 (100.0%) |
| 3.0x to 3.9x | 0 (0.0%) | 0 (0.0%) |
| 4.0x or more | 5 (7.6%) | 0 (0.0%) |
| Total | 66 (100.0%) | 7 (100.0%) |
Real Estate Taxes by Mortgage Status in Hiltonia
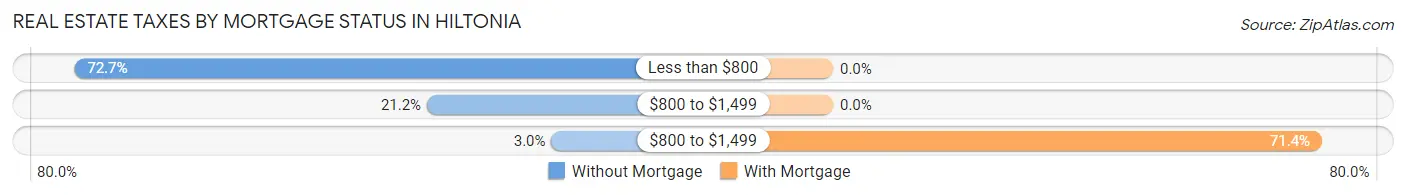
| Property Taxes | Without Mortgage | With Mortgage |
| Less than $800 | 48 (72.7%) | 0 (0.0%) |
| $800 to $1,499 | 14 (21.2%) | 0 (0.0%) |
| $800 to $1,499 | 2 (3.0%) | 5 (71.4%) |
| Total | 66 (100.0%) | 7 (100.0%) |
Health & Disability in Hiltonia
Health Insurance Coverage by Age in Hiltonia
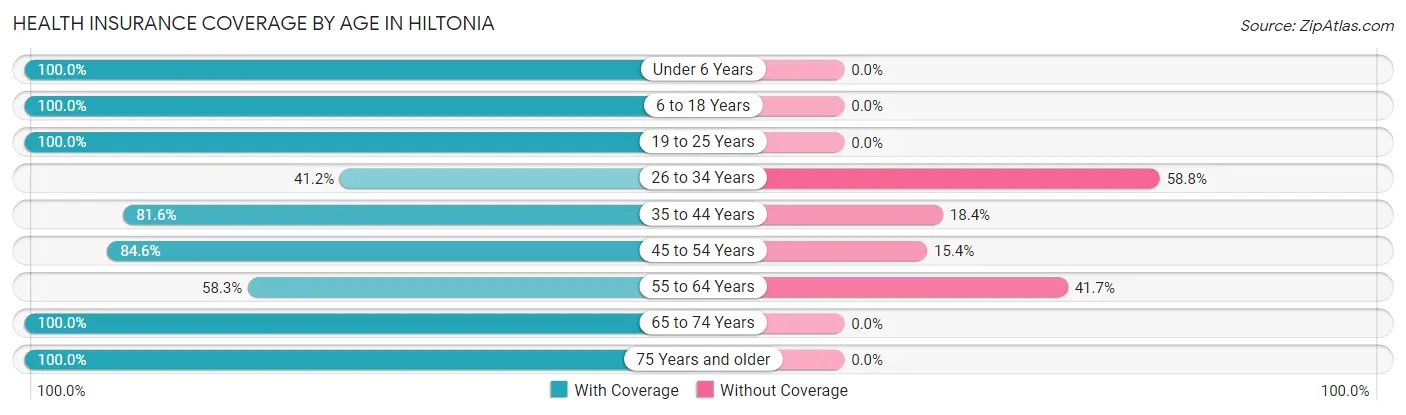
| Age Bracket | With Coverage | Without Coverage |
| Under 6 Years | 25 (100.0%) | 0 (0.0%) |
| 6 to 18 Years | 48 (100.0%) | 0 (0.0%) |
| 19 to 25 Years | 10 (100.0%) | 0 (0.0%) |
| 26 to 34 Years | 21 (41.2%) | 30 (58.8%) |
| 35 to 44 Years | 71 (81.6%) | 16 (18.4%) |
| 45 to 54 Years | 126 (84.6%) | 23 (15.4%) |
| 55 to 64 Years | 14 (58.3%) | 10 (41.7%) |
| 65 to 74 Years | 45 (100.0%) | 0 (0.0%) |
| 75 Years and older | 17 (100.0%) | 0 (0.0%) |
| Total | 377 (82.7%) | 79 (17.3%) |
Health Insurance Coverage by Citizenship Status in Hiltonia
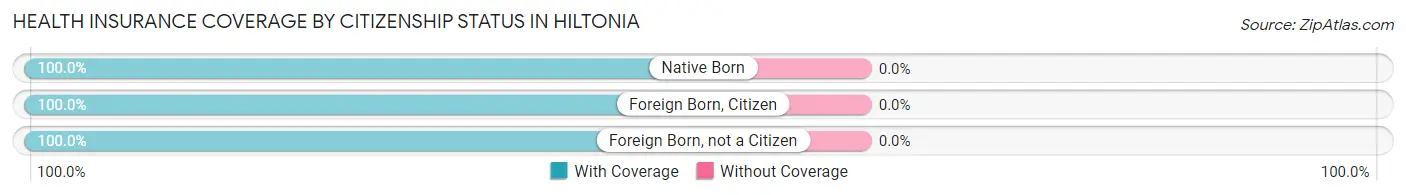
| Citizenship Status | With Coverage | Without Coverage |
| Native Born | 25 (100.0%) | 0 (0.0%) |
| Foreign Born, Citizen | 48 (100.0%) | 0 (0.0%) |
| Foreign Born, not a Citizen | 10 (100.0%) | 0 (0.0%) |
Health Insurance Coverage by Household Income in Hiltonia
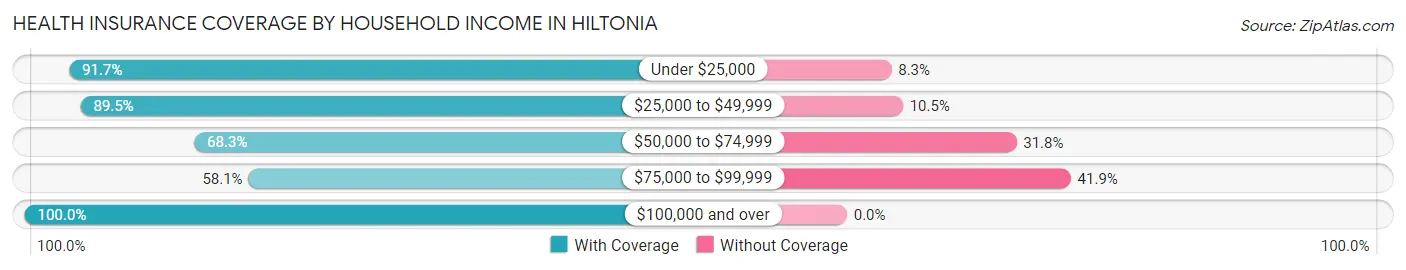
| Household Income | With Coverage | Without Coverage |
| Under $25,000 | 22 (91.7%) | 2 (8.3%) |
| $25,000 to $49,999 | 265 (89.5%) | 31 (10.5%) |
| $50,000 to $74,999 | 43 (68.2%) | 20 (31.8%) |
| $75,000 to $99,999 | 36 (58.1%) | 26 (41.9%) |
| $100,000 and over | 11 (100.0%) | 0 (0.0%) |
Public vs Private Health Insurance Coverage by Age in Hiltonia
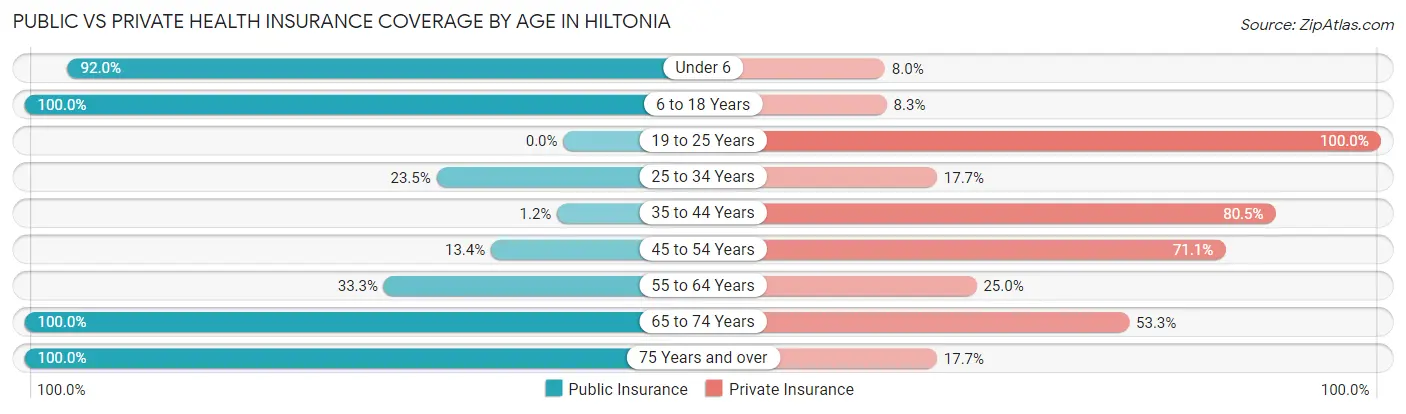
| Age Bracket | Public Insurance | Private Insurance |
| Under 6 | 23 (92.0%) | 2 (8.0%) |
| 6 to 18 Years | 48 (100.0%) | 4 (8.3%) |
| 19 to 25 Years | 0 (0.0%) | 10 (100.0%) |
| 25 to 34 Years | 12 (23.5%) | 9 (17.6%) |
| 35 to 44 Years | 1 (1.1%) | 70 (80.5%) |
| 45 to 54 Years | 20 (13.4%) | 106 (71.1%) |
| 55 to 64 Years | 8 (33.3%) | 6 (25.0%) |
| 65 to 74 Years | 45 (100.0%) | 24 (53.3%) |
| 75 Years and over | 17 (100.0%) | 3 (17.6%) |
| Total | 174 (38.2%) | 234 (51.3%) |
Disability Status by Sex by Age in Hiltonia
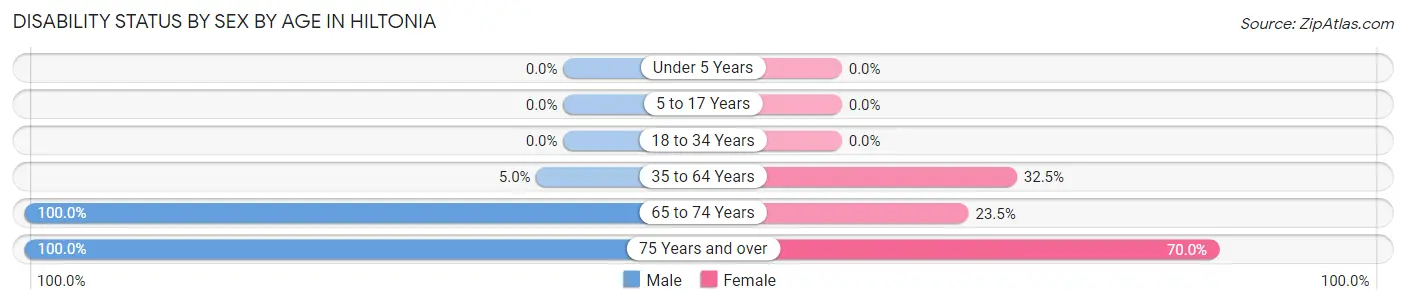
| Age Bracket | Male | Female |
| Under 5 Years | 0 (0.0%) | 0 (0.0%) |
| 5 to 17 Years | 0 (0.0%) | 0 (0.0%) |
| 18 to 34 Years | 0 (0.0%) | 0 (0.0%) |
| 35 to 64 Years | 9 (5.0%) | 26 (32.5%) |
| 65 to 74 Years | 11 (100.0%) | 8 (23.5%) |
| 75 Years and over | 7 (100.0%) | 7 (70.0%) |
Disability Class by Sex by Age in Hiltonia
Disability Class: Hearing Difficulty
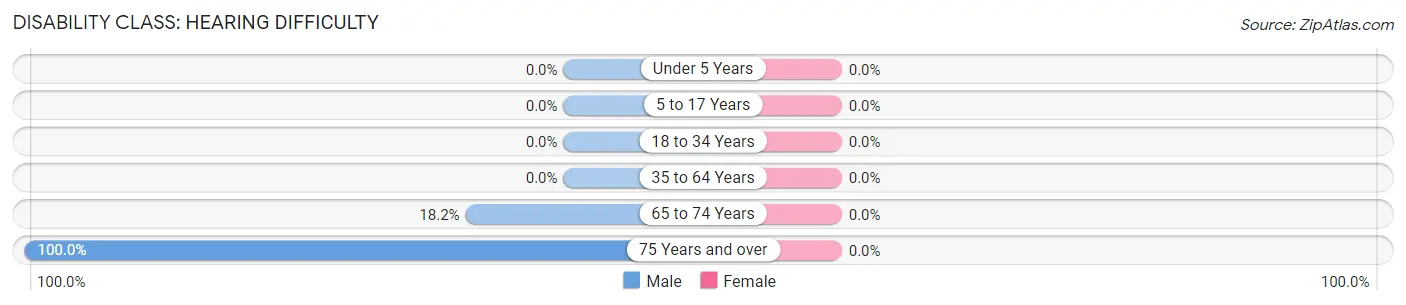
| Age Bracket | Male | Female |
| Under 5 Years | 0 (0.0%) | 0 (0.0%) |
| 5 to 17 Years | 0 (0.0%) | 0 (0.0%) |
| 18 to 34 Years | 0 (0.0%) | 0 (0.0%) |
| 35 to 64 Years | 0 (0.0%) | 0 (0.0%) |
| 65 to 74 Years | 2 (18.2%) | 0 (0.0%) |
| 75 Years and over | 7 (100.0%) | 0 (0.0%) |
Disability Class: Vision Difficulty
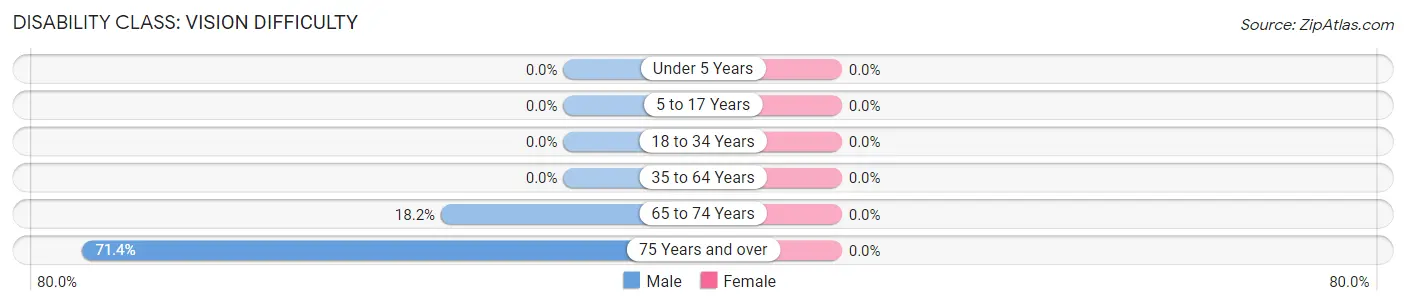
| Age Bracket | Male | Female |
| Under 5 Years | 0 (0.0%) | 0 (0.0%) |
| 5 to 17 Years | 0 (0.0%) | 0 (0.0%) |
| 18 to 34 Years | 0 (0.0%) | 0 (0.0%) |
| 35 to 64 Years | 0 (0.0%) | 0 (0.0%) |
| 65 to 74 Years | 2 (18.2%) | 0 (0.0%) |
| 75 Years and over | 5 (71.4%) | 0 (0.0%) |
Disability Class: Cognitive Difficulty
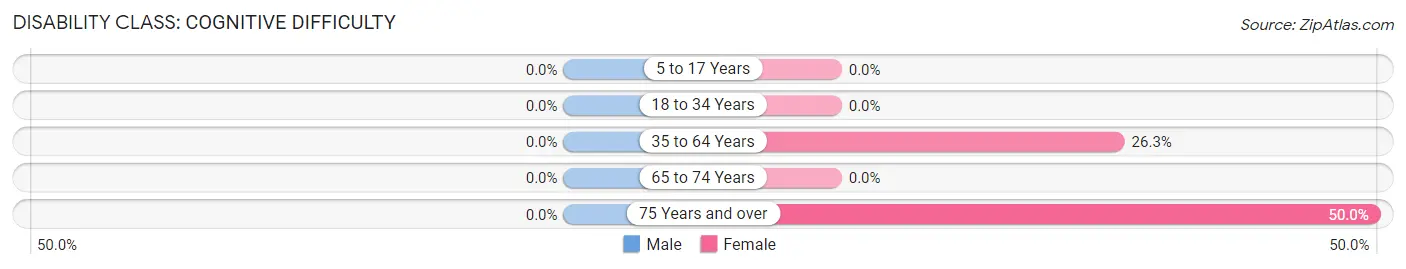
| Age Bracket | Male | Female |
| 5 to 17 Years | 0 (0.0%) | 0 (0.0%) |
| 18 to 34 Years | 0 (0.0%) | 0 (0.0%) |
| 35 to 64 Years | 0 (0.0%) | 21 (26.3%) |
| 65 to 74 Years | 0 (0.0%) | 0 (0.0%) |
| 75 Years and over | 0 (0.0%) | 5 (50.0%) |
Disability Class: Ambulatory Difficulty
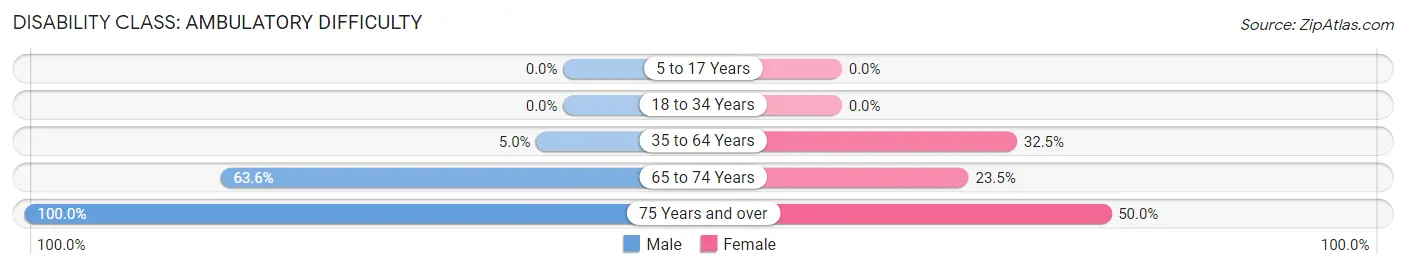
| Age Bracket | Male | Female |
| 5 to 17 Years | 0 (0.0%) | 0 (0.0%) |
| 18 to 34 Years | 0 (0.0%) | 0 (0.0%) |
| 35 to 64 Years | 9 (5.0%) | 26 (32.5%) |
| 65 to 74 Years | 7 (63.6%) | 8 (23.5%) |
| 75 Years and over | 7 (100.0%) | 5 (50.0%) |
Disability Class: Self-Care Difficulty
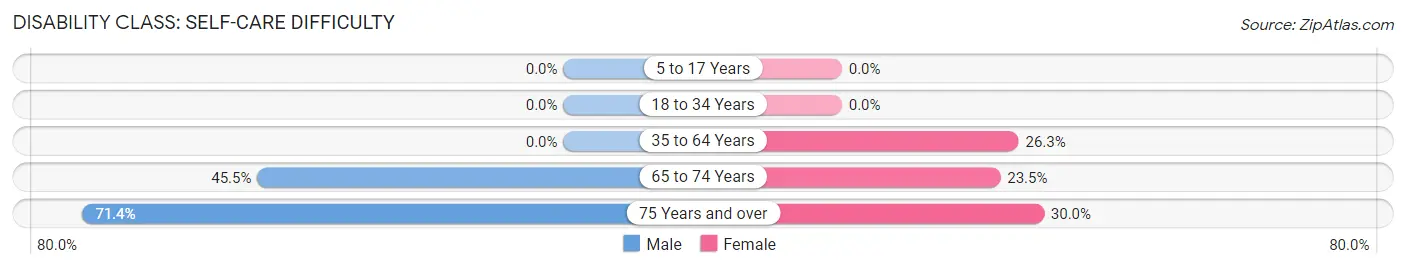
| Age Bracket | Male | Female |
| 5 to 17 Years | 0 (0.0%) | 0 (0.0%) |
| 18 to 34 Years | 0 (0.0%) | 0 (0.0%) |
| 35 to 64 Years | 0 (0.0%) | 21 (26.3%) |
| 65 to 74 Years | 5 (45.5%) | 8 (23.5%) |
| 75 Years and over | 5 (71.4%) | 3 (30.0%) |
Technology Access in Hiltonia
Computing Device Access in Hiltonia
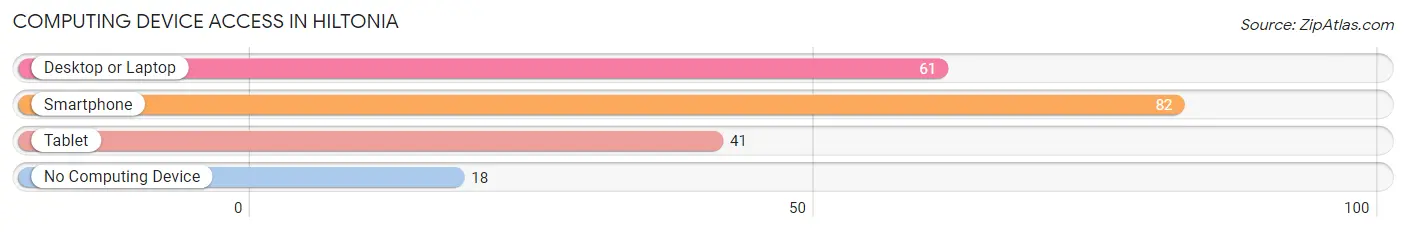
| Device Type | # Households | % Households |
| Desktop or Laptop | 61 | 59.8% |
| Smartphone | 82 | 80.4% |
| Tablet | 41 | 40.2% |
| No Computing Device | 18 | 17.6% |
| Total | 102 | 100.0% |
Internet Access in Hiltonia
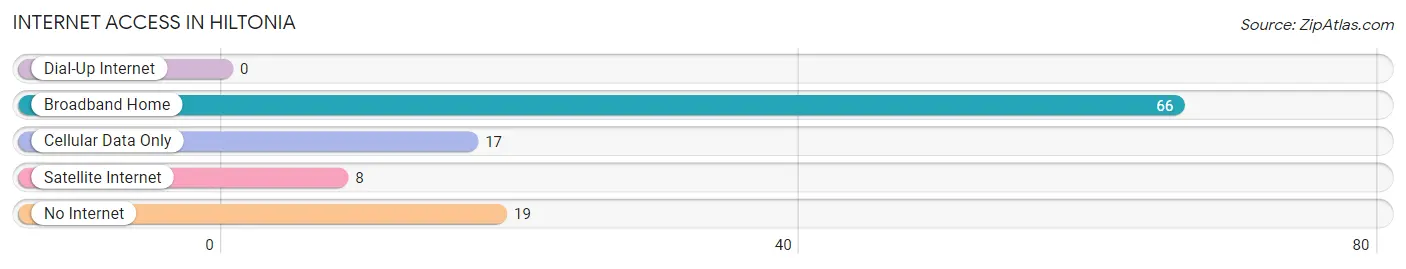
| Internet Type | # Households | % Households |
| Dial-Up Internet | 0 | 0.0% |
| Broadband Home | 66 | 64.7% |
| Cellular Data Only | 17 | 16.7% |
| Satellite Internet | 8 | 7.8% |
| No Internet | 19 | 18.6% |
| Total | 102 | 100.0% |
Hiltonia Summary
Hiltonia is a small city located in the state of Georgia, United States. It is situated in the southeastern part of the state, about 30 miles south of Atlanta. The city has a population of approximately 8,000 people and is part of the Atlanta metropolitan area.
History
Hiltonia was founded in 1872 by a group of settlers from the nearby town of Decatur. The settlers named the town after their leader, William Hilton, who was a prominent local businessman. The town was originally a farming community, but it soon developed into a small industrial center. The town was incorporated in 1887 and was named the county seat of DeKalb County.
In the early 1900s, the town experienced a period of growth and development. The population increased from 1,000 in 1900 to over 5,000 by 1920. During this time, the town was home to several factories, including a cotton mill, a brickyard, and a sawmill.
In the 1950s, the town experienced a period of decline as many of the factories closed and the population decreased. However, in the late 1970s, the town began to experience a resurgence as new businesses moved into the area. Today, Hiltonia is a thriving community with a population of over 8,000 people.
Geography
Hiltonia is located in the southeastern part of Georgia, about 30 miles south of Atlanta. The city is situated in the foothills of the Appalachian Mountains and is surrounded by rolling hills and forests. The city is located on the banks of the Chattahoochee River, which provides a scenic backdrop for the city.
The climate in Hiltonia is mild and humid, with hot summers and mild winters. The average temperature in the summer is around 80 degrees Fahrenheit, while the average temperature in the winter is around 50 degrees Fahrenheit.
Economy
Hiltonia’s economy is largely based on the service industry. The city is home to several restaurants, retail stores, and other businesses. The city is also home to several manufacturing companies, including a paper mill and a furniture factory.
The city is also home to several educational institutions, including a community college and a technical college. The city is also home to several parks and recreational facilities, including a golf course and a swimming pool.
Demographics
As of the 2010 census, the population of Hiltonia was 8,000 people. The racial makeup of the city was 79.3% White, 15.2% African American, 0.7% Native American, 0.7% Asian, and 4.1% from other races. The median household income was $37,000, and the median age was 37.
Hiltonia is a diverse city with a variety of cultures and backgrounds. The city is home to a large Hispanic population, as well as a growing Asian population. The city is also home to a large number of immigrants from other countries, including Mexico, India, and China.
Conclusion
Hiltonia is a small city located in the southeastern part of Georgia. The city has a population of 8,000 people and is part of the Atlanta metropolitan area. The city was founded in 1872 and was originally a farming community. Today, the city is a thriving community with a diverse population and a strong economy.
Common Questions
What is the Total Population of Hiltonia?
Total Population of Hiltonia is 456.
What is the Total Male Population of Hiltonia?
Total Male Population of Hiltonia is 274.
What is the Total Female Population of Hiltonia?
Total Female Population of Hiltonia is 182.
What is the Ratio of Males per 100 Females in Hiltonia?
There are 150.55 Males per 100 Females in Hiltonia.
What is the Ratio of Females per 100 Males in Hiltonia?
There are 66.42 Females per 100 Males in Hiltonia.
What is the Median Population Age in Hiltonia?
Median Population Age in Hiltonia is 45.3 Years.
What is the Average Family Size in Hiltonia
Average Family Size in Hiltonia is 7.0 People.
What is the Average Household Size in Hiltonia
Average Household Size in Hiltonia is 4.5 People.
What is Per Capita Income in Hiltonia?
Per Capita income in Hiltonia is $15,838.
What is the Median Family Income in Hiltonia?
Median Family Income in Hiltonia is $37,368.
What is the Median Household income in Hiltonia?
Median Household Income in Hiltonia is $40,750.
What is Inequality or Gini Index in Hiltonia?
Inequality or Gini Index in Hiltonia is 0.33.
How Large is the Labor Force in Hiltonia?
There are 138 People in the Labor Forcein in Hiltonia.
What is the Percentage of People in the Labor Force in Hiltonia?
35.8% of People are in the Labor Force in Hiltonia.
What is the Unemployment Rate in Hiltonia?
Unemployment Rate in Hiltonia is 23.2%.