Guyton, GA
Guyton Map
Guyton Overview
2,405
TOTAL POPULATION
957
MALE POPULATION
1,448
FEMALE POPULATION
66.09
MALES / 100 FEMALES
151.31
FEMALES / 100 MALES
30.4
MEDIAN AGE
4.1
AVG FAMILY SIZE
3.5
AVG HOUSEHOLD SIZE
$25,405
PER CAPITA INCOME
$90,197
AVG FAMILY INCOME
$75,625
AVG HOUSEHOLD INCOME
27.7%
WAGE / INCOME GAP [ % ]
72.3¢/ $1
WAGE / INCOME GAP [ $ ]
0.42
INEQUALITY / GINI INDEX
1,157
LABOR FORCE [ PEOPLE ]
67.8%
PERCENT IN LABOR FORCE
16.3%
UNEMPLOYMENT RATE
Guyton Zip Codes
Guyton Area Codes
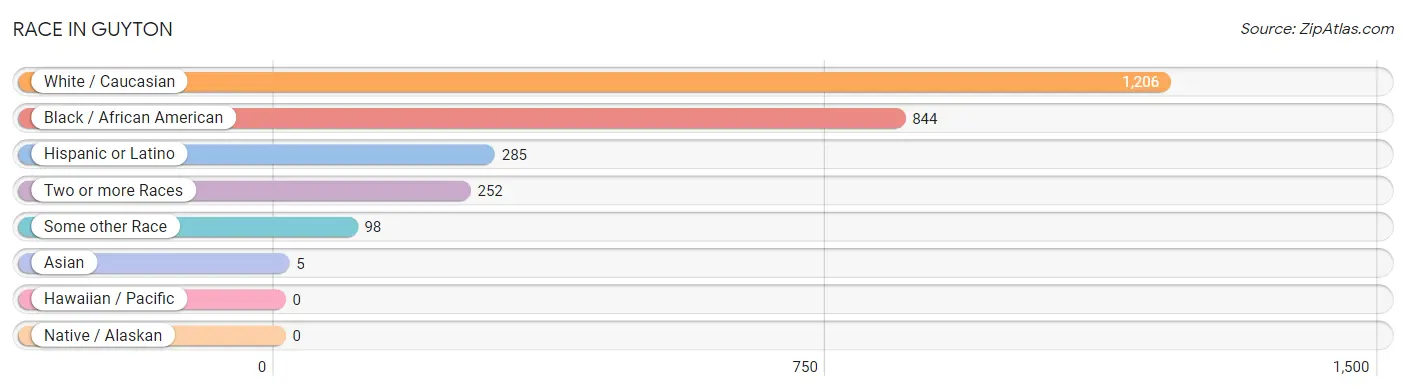
Race in Guyton
The most populous races in Guyton are White / Caucasian (1,206 | 50.1%), Black / African American (844 | 35.1%), and Hispanic or Latino (285 | 11.8%).
| Race | # Population | % Population |
| Asian | 5 | 0.2% |
| Black / African American | 844 | 35.1% |
| Hawaiian / Pacific | 0 | 0.0% |
| Hispanic or Latino | 285 | 11.8% |
| Native / Alaskan | 0 | 0.0% |
| White / Caucasian | 1,206 | 50.1% |
| Two or more Races | 252 | 10.5% |
| Some other Race | 98 | 4.1% |
| Total | 2,405 | 100.0% |
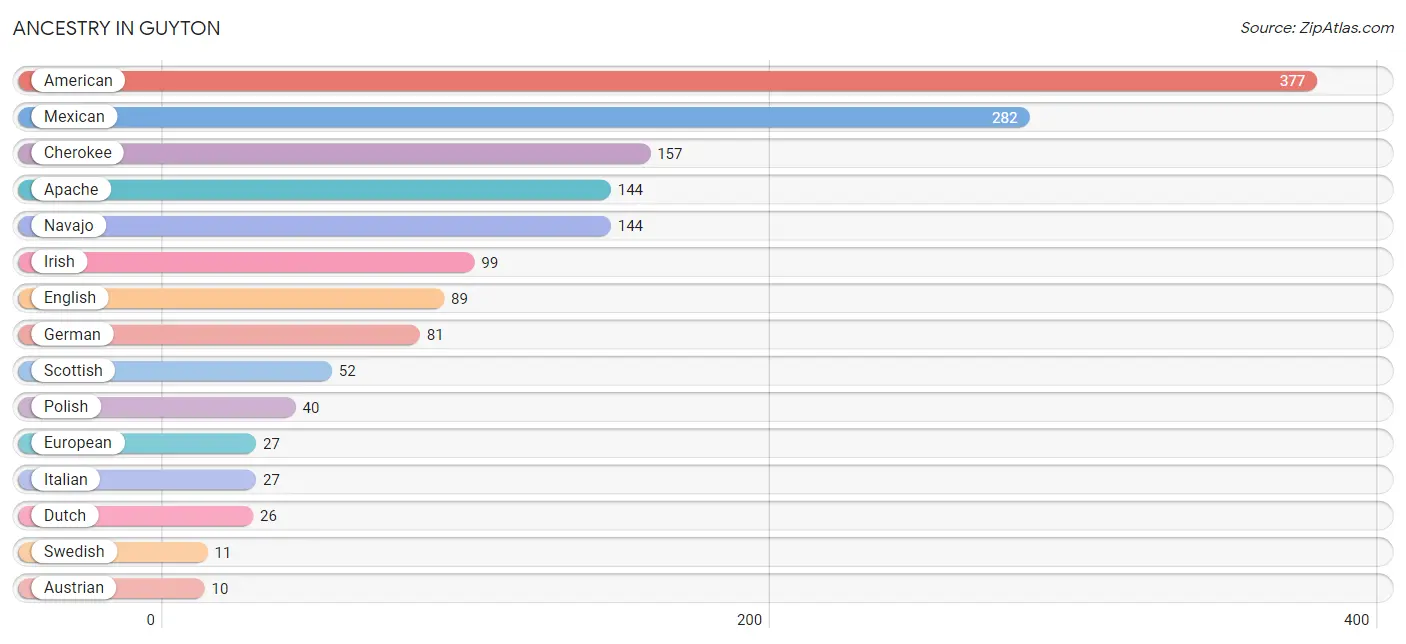
Ancestry in Guyton
The most populous ancestries reported in Guyton are American (377 | 15.7%), Mexican (282 | 11.7%), Cherokee (157 | 6.5%), Apache (144 | 6.0%), and Navajo (144 | 6.0%), together accounting for 45.9% of all Guyton residents.
| Ancestry | # Population | % Population |
| American | 377 | 15.7% |
| Apache | 144 | 6.0% |
| Austrian | 10 | 0.4% |
| British | 9 | 0.4% |
| Cherokee | 157 | 6.5% |
| Creek | 6 | 0.3% |
| Dutch | 26 | 1.1% |
| English | 89 | 3.7% |
| European | 27 | 1.1% |
| French | 4 | 0.2% |
| German | 81 | 3.4% |
| Indian (Asian) | 5 | 0.2% |
| Irish | 99 | 4.1% |
| Italian | 27 | 1.1% |
| Korean | 4 | 0.2% |
| Mexican | 282 | 11.7% |
| Navajo | 144 | 6.0% |
| Norwegian | 6 | 0.3% |
| Polish | 40 | 1.7% |
| Puerto Rican | 3 | 0.1% |
| Romanian | 3 | 0.1% |
| Scandinavian | 7 | 0.3% |
| Scotch-Irish | 3 | 0.1% |
| Scottish | 52 | 2.2% |
| Slovak | 2 | 0.1% |
| South African | 6 | 0.3% |
| Subsaharan African | 6 | 0.3% |
| Swedish | 11 | 0.5% |
| Welsh | 4 | 0.2% | View All 29 Rows |
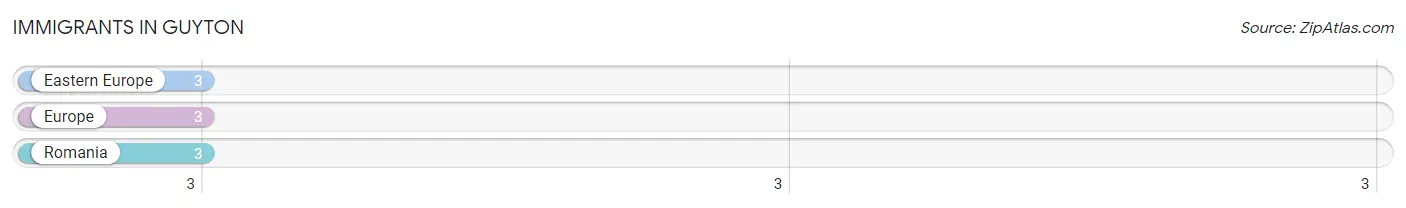
Immigrants in Guyton
The most numerous immigrant groups reported in Guyton came from Eastern Europe (3 | 0.1%), Europe (3 | 0.1%), and Romania (3 | 0.1%), together accounting for 0.4% of all Guyton residents.
| Immigration Origin | # Population | % Population |
| Eastern Europe | 3 | 0.1% |
| Europe | 3 | 0.1% |
| Romania | 3 | 0.1% | View All 3 Rows |
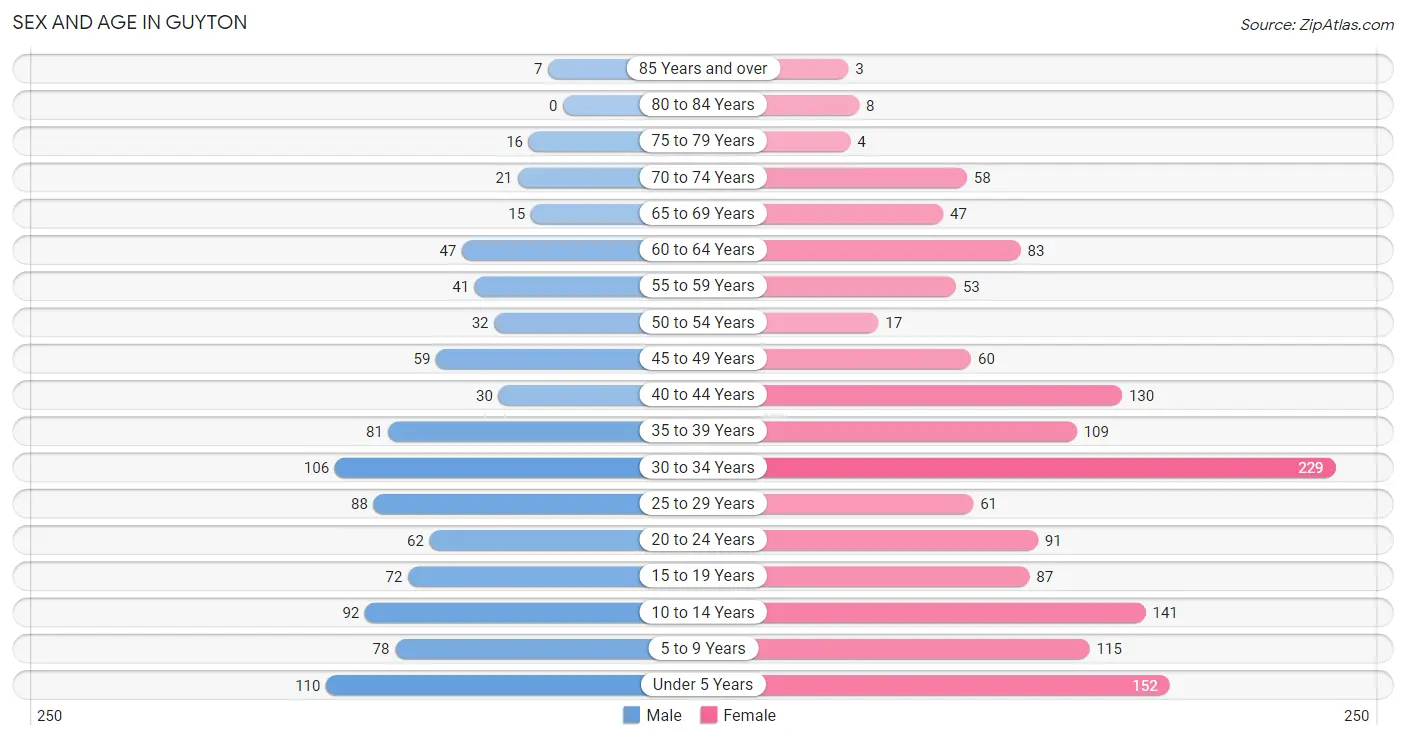
Sex and Age in Guyton
Sex and Age in Guyton
The most populous age groups in Guyton are Under 5 Years (110 | 11.5%) for men and 30 to 34 Years (229 | 15.8%) for women.
| Age Bracket | Male | Female |
| Under 5 Years | 110 (11.5%) | 152 (10.5%) |
| 5 to 9 Years | 78 (8.2%) | 115 (7.9%) |
| 10 to 14 Years | 92 (9.6%) | 141 (9.7%) |
| 15 to 19 Years | 72 (7.5%) | 87 (6.0%) |
| 20 to 24 Years | 62 (6.5%) | 91 (6.3%) |
| 25 to 29 Years | 88 (9.2%) | 61 (4.2%) |
| 30 to 34 Years | 106 (11.1%) | 229 (15.8%) |
| 35 to 39 Years | 81 (8.5%) | 109 (7.5%) |
| 40 to 44 Years | 30 (3.1%) | 130 (9.0%) |
| 45 to 49 Years | 59 (6.2%) | 60 (4.1%) |
| 50 to 54 Years | 32 (3.3%) | 17 (1.2%) |
| 55 to 59 Years | 41 (4.3%) | 53 (3.7%) |
| 60 to 64 Years | 47 (4.9%) | 83 (5.7%) |
| 65 to 69 Years | 15 (1.6%) | 47 (3.3%) |
| 70 to 74 Years | 21 (2.2%) | 58 (4.0%) |
| 75 to 79 Years | 16 (1.7%) | 4 (0.3%) |
| 80 to 84 Years | 0 (0.0%) | 8 (0.5%) |
| 85 Years and over | 7 (0.7%) | 3 (0.2%) |
| Total | 957 (100.0%) | 1,448 (100.0%) |
Families and Households in Guyton
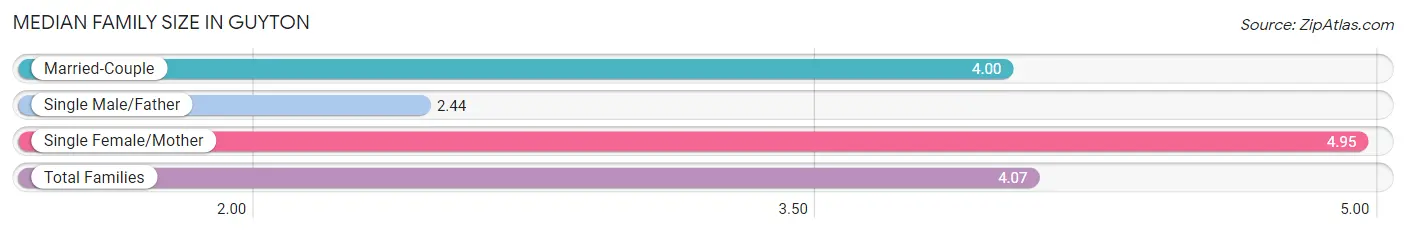
Median Family Size in Guyton
The median family size in Guyton is 4.07 persons per family, with single female/mother families (84 | 15.6%) accounting for the largest median family size of 4.95 persons per family. On the other hand, single male/father families (27 | 5.0%) represent the smallest median family size with 2.44 persons per family.
| Family Type | # Families | Family Size |
| Married-Couple | 426 (79.3%) | 4.00 |
| Single Male/Father | 27 (5.0%) | 2.44 |
| Single Female/Mother | 84 (15.6%) | 4.95 |
| Total Families | 537 (100.0%) | 4.07 |
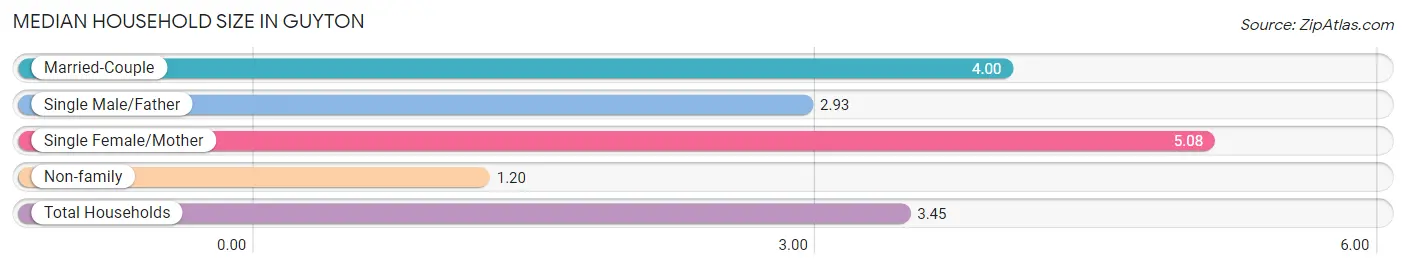
Median Household Size in Guyton
The median household size in Guyton is 3.45 persons per household, with single female/mother households (84 | 12.0%) accounting for the largest median household size of 5.08 persons per household. non-family households (161 | 23.1%) represent the smallest median household size with 1.20 persons per household.
| Household Type | # Households | Household Size |
| Married-Couple | 426 (61.0%) | 4.00 |
| Single Male/Father | 27 (3.9%) | 2.93 |
| Single Female/Mother | 84 (12.0%) | 5.08 |
| Non-family | 161 (23.1%) | 1.20 |
| Total Households | 698 (100.0%) | 3.45 |
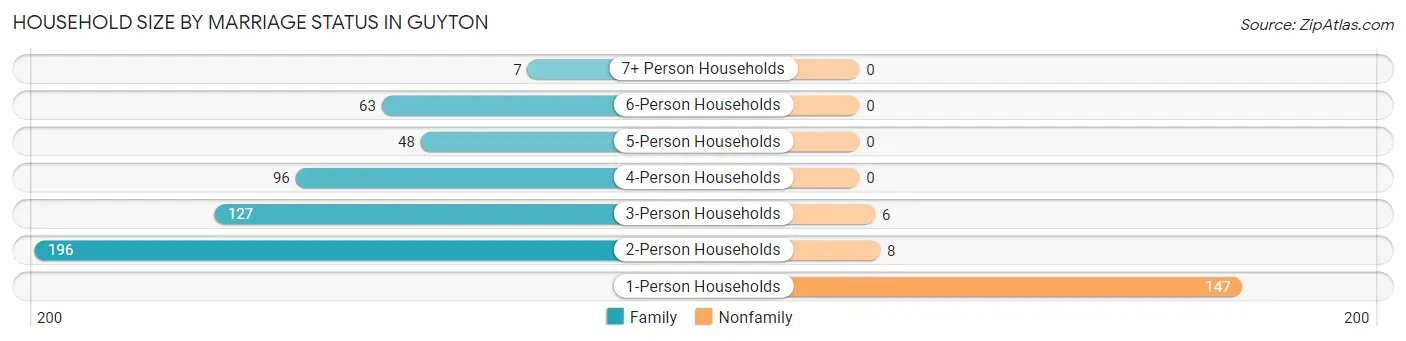
Household Size by Marriage Status in Guyton
Out of a total of 698 households in Guyton, 537 (76.9%) are family households, while 161 (23.1%) are nonfamily households. The most numerous type of family households are 2-person households, comprising 196, and the most common type of nonfamily households are 1-person households, comprising 147.
| Household Size | Family Households | Nonfamily Households |
| 1-Person Households | - | 147 (21.1%) |
| 2-Person Households | 196 (28.1%) | 8 (1.1%) |
| 3-Person Households | 127 (18.2%) | 6 (0.9%) |
| 4-Person Households | 96 (13.8%) | 0 (0.0%) |
| 5-Person Households | 48 (6.9%) | 0 (0.0%) |
| 6-Person Households | 63 (9.0%) | 0 (0.0%) |
| 7+ Person Households | 7 (1.0%) | 0 (0.0%) |
| Total | 537 (76.9%) | 161 (23.1%) |
Female Fertility in Guyton
Fertility by Age in Guyton
Average fertility rate in Guyton is 112.0 births per 1,000 women. Women in the age bracket of 35 to 50 years have the highest fertility rate with 211.0 births per 1,000 women. Women in the age bracket of 35 to 50 years acount for 74.7% of all women with births.
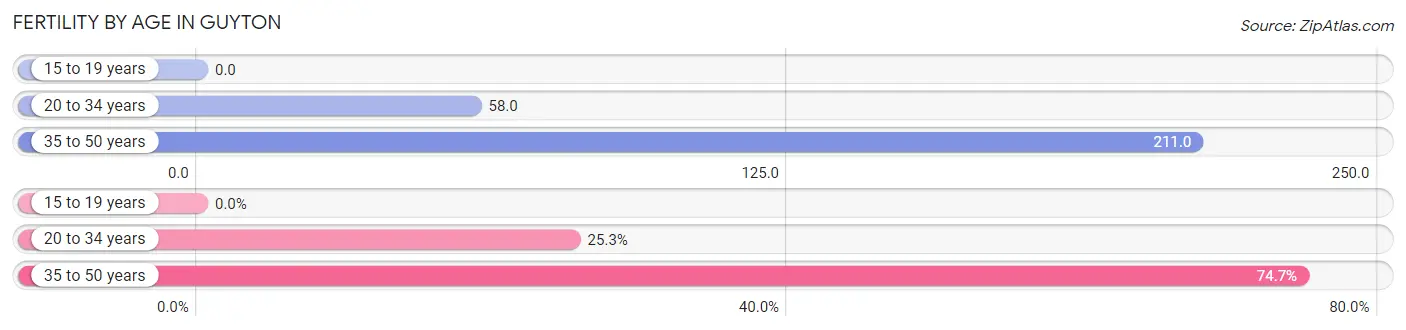
| Age Bracket | Women with Births | Births / 1,000 Women |
| 15 to 19 years | 0 (0.0%) | 0.0 |
| 20 to 34 years | 22 (25.3%) | 58.0 |
| 35 to 50 years | 65 (74.7%) | 211.0 |
| Total | 87 (100.0%) | 112.0 |
Fertility by Age by Marriage Status in Guyton
72.4% of women with births (87) in Guyton are married. The highest percentage of unmarried women with births falls into 20 to 34 years age bracket with 50.0% of them unmarried at the time of birth, while the lowest percentage of unmarried women with births belong to 35 to 50 years age bracket with 20.0% of them unmarried.
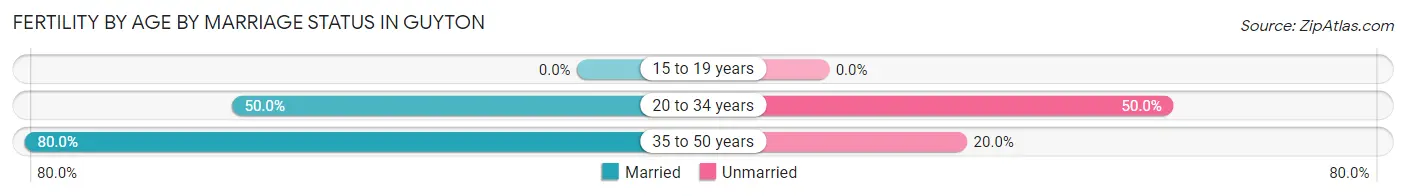
| Age Bracket | Married | Unmarried |
| 15 to 19 years | 0 (0.0%) | 0 (0.0%) |
| 20 to 34 years | 11 (50.0%) | 11 (50.0%) |
| 35 to 50 years | 52 (80.0%) | 13 (20.0%) |
| Total | 63 (72.4%) | 24 (27.6%) |
Fertility by Education in Guyton
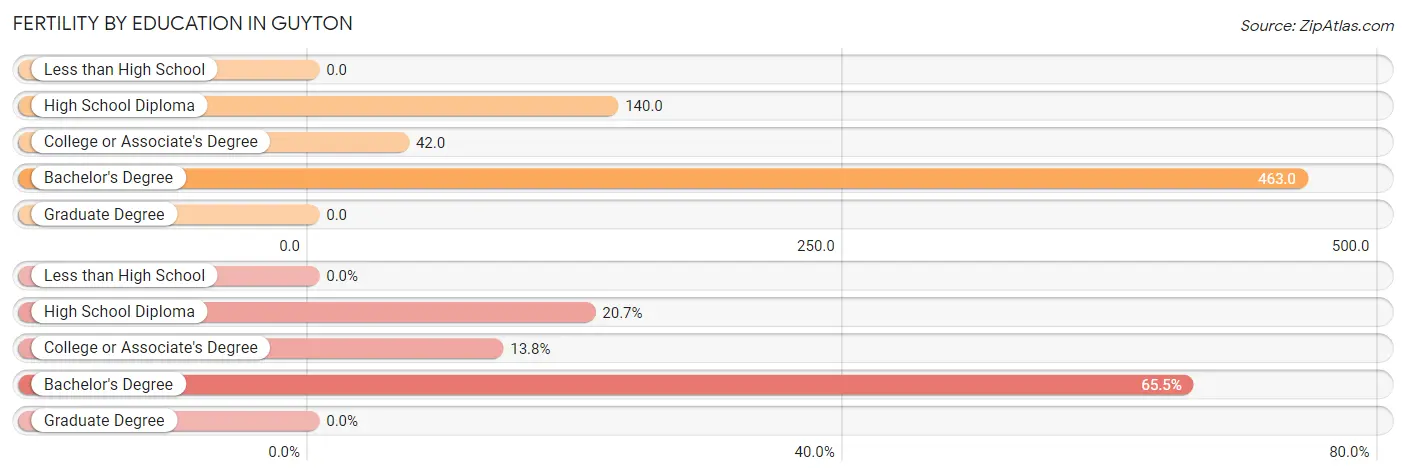
| Educational Attainment | Women with Births | Births / 1,000 Women |
| Less than High School | 0 (0.0%) | 0.0 |
| High School Diploma | 18 (20.7%) | 140.0 |
| College or Associate's Degree | 12 (13.8%) | 42.0 |
| Bachelor's Degree | 57 (65.5%) | 463.0 |
| Graduate Degree | 0 (0.0%) | 0.0 |
| Total | 87 (100.0%) | 112.0 |
Fertility by Education by Marriage Status in Guyton
27.6% of women with births in Guyton are unmarried. Women with the educational attainment of bachelor's degree are most likely to be married with 98.3% of them married at childbirth, while women with the educational attainment of high school diploma are least likely to be married with 100.0% of them unmarried at childbirth.
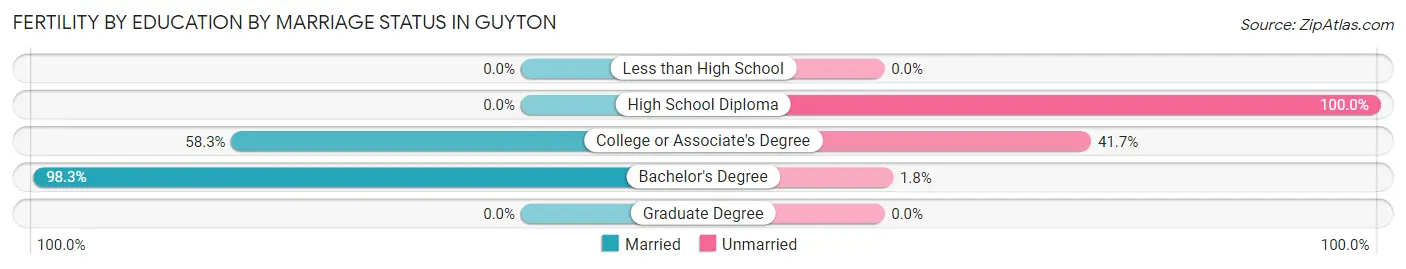
| Educational Attainment | Married | Unmarried |
| Less than High School | 0 (0.0%) | 0 (0.0%) |
| High School Diploma | 0 (0.0%) | 18 (100.0%) |
| College or Associate's Degree | 7 (58.3%) | 5 (41.7%) |
| Bachelor's Degree | 56 (98.3%) | 1 (1.8%) |
| Graduate Degree | 0 (0.0%) | 0 (0.0%) |
| Total | 63 (72.4%) | 24 (27.6%) |
Income in Guyton
Income Overview in Guyton
Per Capita Income in Guyton is $25,405, while median incomes of families and households are $90,197 and $75,625 respectively.
| Characteristic | Number | Measure |
| Per Capita Income | 2,405 | $25,405 |
| Median Family Income | 537 | $90,197 |
| Mean Family Income | 537 | $97,736 |
| Median Household Income | 698 | $75,625 |
| Mean Household Income | 698 | $83,214 |
| Income Deficit | 537 | $0 |
| Wage / Income Gap (%) | 2,405 | 27.66% |
| Wage / Income Gap ($) | 2,405 | 72.34¢ per $1 |
| Gini / Inequality Index | 2,405 | 0.42 |
Earnings by Sex in Guyton
Average Earnings in Guyton are $46,475, $56,156 for men and $40,625 for women, a difference of 27.7%.
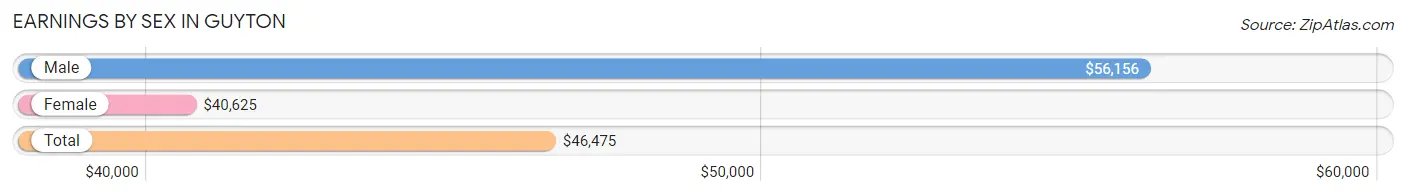
| Sex | Number | Average Earnings |
| Male | 505 (49.7%) | $56,156 |
| Female | 512 (50.3%) | $40,625 |
| Total | 1,017 (100.0%) | $46,475 |
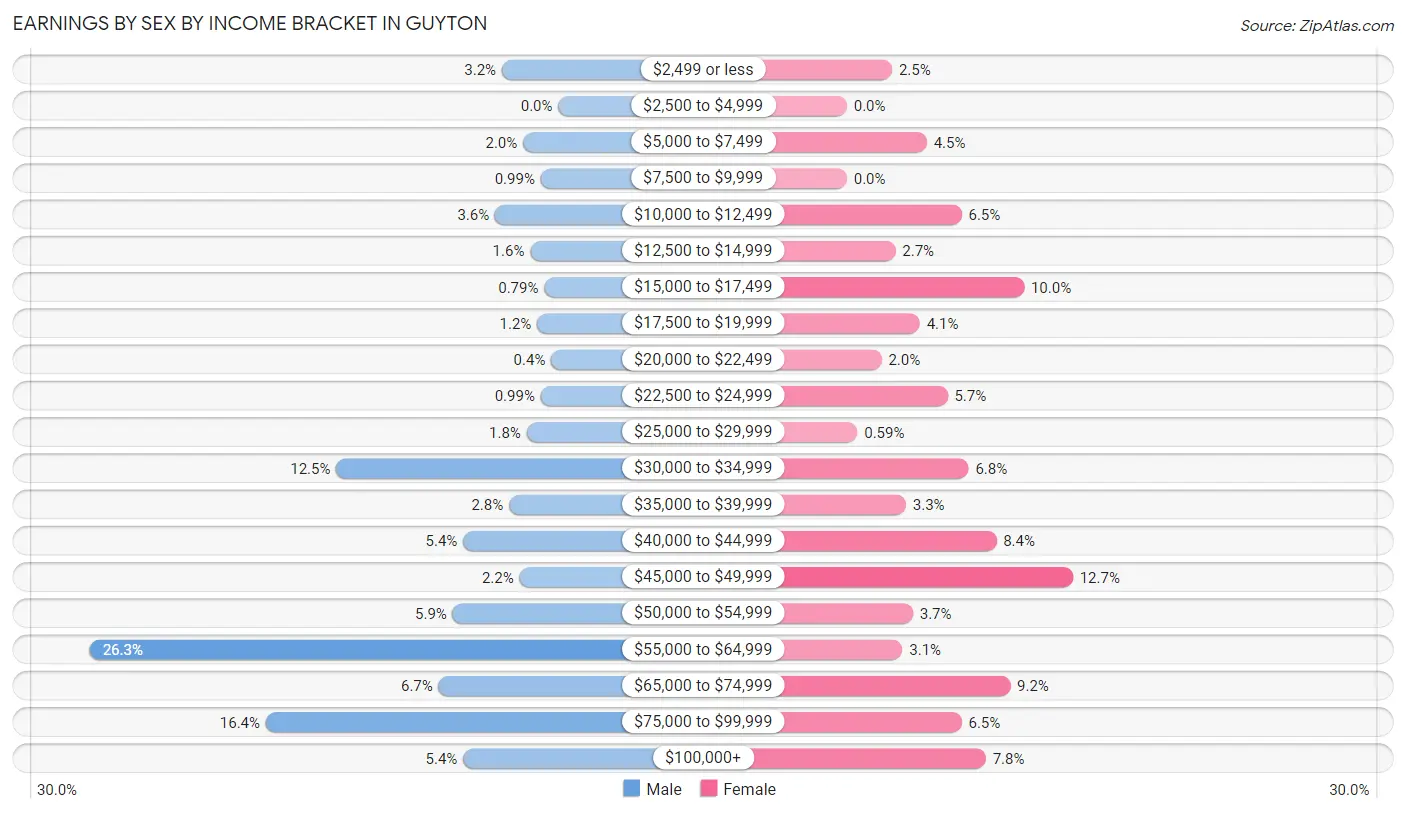
Earnings by Sex by Income Bracket in Guyton
The most common earnings brackets in Guyton are $55,000 to $64,999 for men (133 | 26.3%) and $45,000 to $49,999 for women (65 | 12.7%).
| Income | Male | Female |
| $2,499 or less | 16 (3.2%) | 13 (2.5%) |
| $2,500 to $4,999 | 0 (0.0%) | 0 (0.0%) |
| $5,000 to $7,499 | 10 (2.0%) | 23 (4.5%) |
| $7,500 to $9,999 | 5 (1.0%) | 0 (0.0%) |
| $10,000 to $12,499 | 18 (3.6%) | 33 (6.5%) |
| $12,500 to $14,999 | 8 (1.6%) | 14 (2.7%) |
| $15,000 to $17,499 | 4 (0.8%) | 51 (10.0%) |
| $17,500 to $19,999 | 6 (1.2%) | 21 (4.1%) |
| $20,000 to $22,499 | 2 (0.4%) | 10 (1.9%) |
| $22,500 to $24,999 | 5 (1.0%) | 29 (5.7%) |
| $25,000 to $29,999 | 9 (1.8%) | 3 (0.6%) |
| $30,000 to $34,999 | 63 (12.5%) | 35 (6.8%) |
| $35,000 to $39,999 | 14 (2.8%) | 17 (3.3%) |
| $40,000 to $44,999 | 27 (5.3%) | 43 (8.4%) |
| $45,000 to $49,999 | 11 (2.2%) | 65 (12.7%) |
| $50,000 to $54,999 | 30 (5.9%) | 19 (3.7%) |
| $55,000 to $64,999 | 133 (26.3%) | 16 (3.1%) |
| $65,000 to $74,999 | 34 (6.7%) | 47 (9.2%) |
| $75,000 to $99,999 | 83 (16.4%) | 33 (6.5%) |
| $100,000+ | 27 (5.3%) | 40 (7.8%) |
| Total | 505 (100.0%) | 512 (100.0%) |
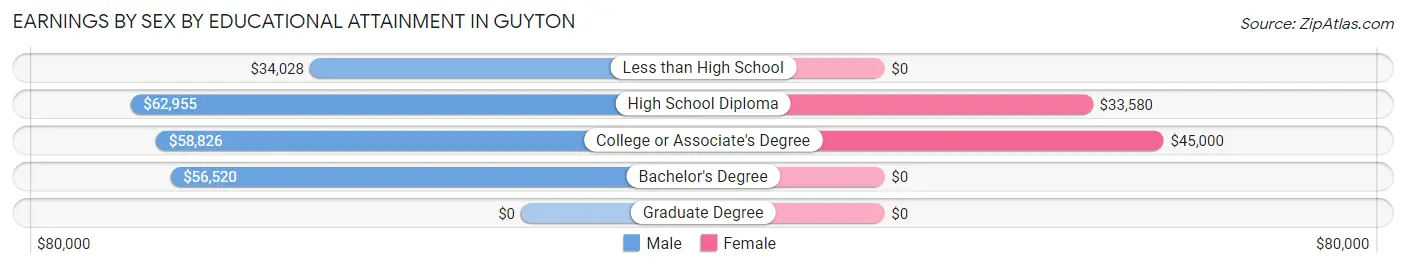
Earnings by Sex by Educational Attainment in Guyton
Average earnings in Guyton are $57,990 for men and $43,167 for women, a difference of 25.6%. Men with an educational attainment of high school diploma enjoy the highest average annual earnings of $62,955, while those with less than high school education earn the least with $34,028. Women with an educational attainment of college or associate's degree earn the most with the average annual earnings of $45,000, while those with high school diploma education have the smallest earnings of $33,580.
| Educational Attainment | Male Income | Female Income |
| Less than High School | $34,028 | $0 |
| High School Diploma | $62,955 | $33,580 |
| College or Associate's Degree | $58,826 | $45,000 |
| Bachelor's Degree | $56,520 | $0 |
| Graduate Degree | - | - |
| Total | $57,990 | $43,167 |
Family Income in Guyton
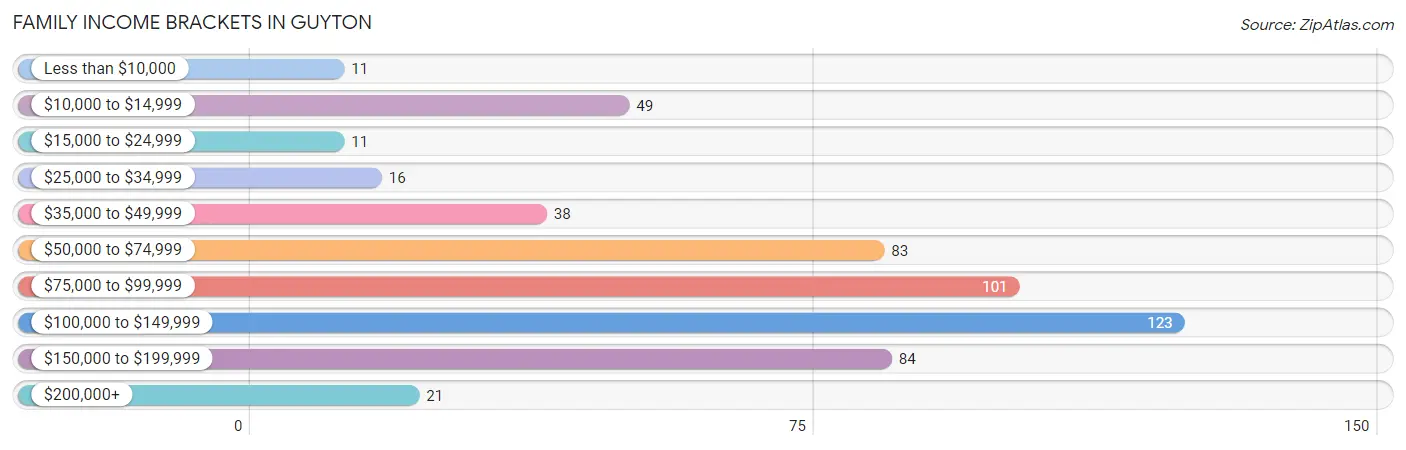
Family Income Brackets in Guyton
According to the Guyton family income data, there are 123 families falling into the $100,000 to $149,999 income range, which is the most common income bracket and makes up 22.9% of all families. Conversely, the less than $10,000 income bracket is the least frequent group with only 11 families (2.1%) belonging to this category.
| Income Bracket | # Families | % Families |
| Less than $10,000 | 11 | 2.0% |
| $10,000 to $14,999 | 49 | 9.1% |
| $15,000 to $24,999 | 11 | 2.0% |
| $25,000 to $34,999 | 16 | 3.0% |
| $35,000 to $49,999 | 38 | 7.1% |
| $50,000 to $74,999 | 83 | 15.5% |
| $75,000 to $99,999 | 101 | 18.8% |
| $100,000 to $149,999 | 123 | 22.9% |
| $150,000 to $199,999 | 84 | 15.6% |
| $200,000+ | 21 | 3.9% |
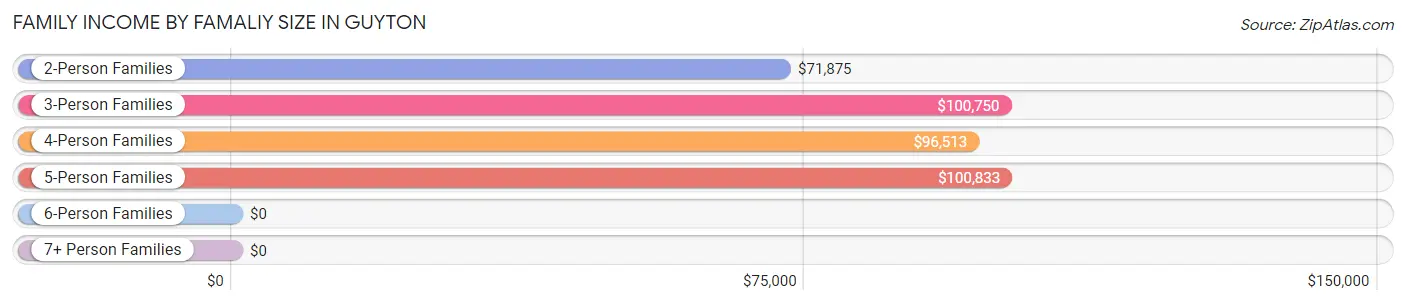
Family Income by Famaliy Size in Guyton
5-person families (44 | 8.2%) account for the highest median family income in Guyton with $100,833 per family, while 2-person families (202 | 37.6%) have the highest median income of $35,938 per family member.
| Income Bracket | # Families | Median Income |
| 2-Person Families | 202 (37.6%) | $71,875 |
| 3-Person Families | 131 (24.4%) | $100,750 |
| 4-Person Families | 91 (17.0%) | $96,513 |
| 5-Person Families | 44 (8.2%) | $100,833 |
| 6-Person Families | 62 (11.6%) | $0 |
| 7+ Person Families | 7 (1.3%) | $0 |
| Total | 537 (100.0%) | $90,197 |
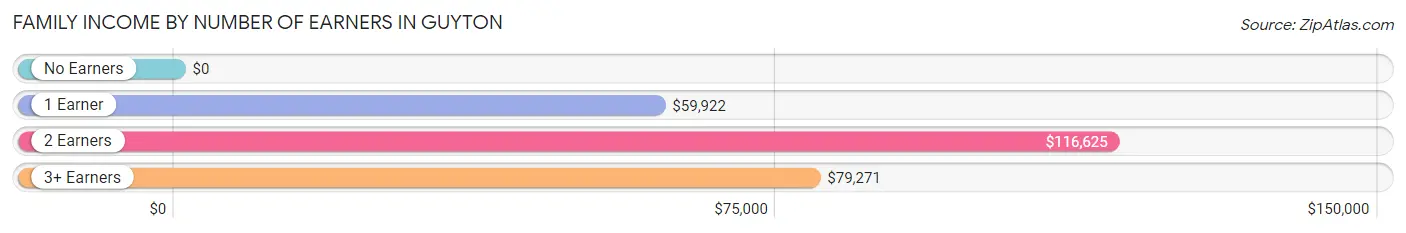
Family Income by Number of Earners in Guyton
| Number of Earners | # Families | Median Income |
| No Earners | 76 (14.1%) | $0 |
| 1 Earner | 149 (27.8%) | $59,922 |
| 2 Earners | 283 (52.7%) | $116,625 |
| 3+ Earners | 29 (5.4%) | $79,271 |
| Total | 537 (100.0%) | $90,197 |
Household Income in Guyton
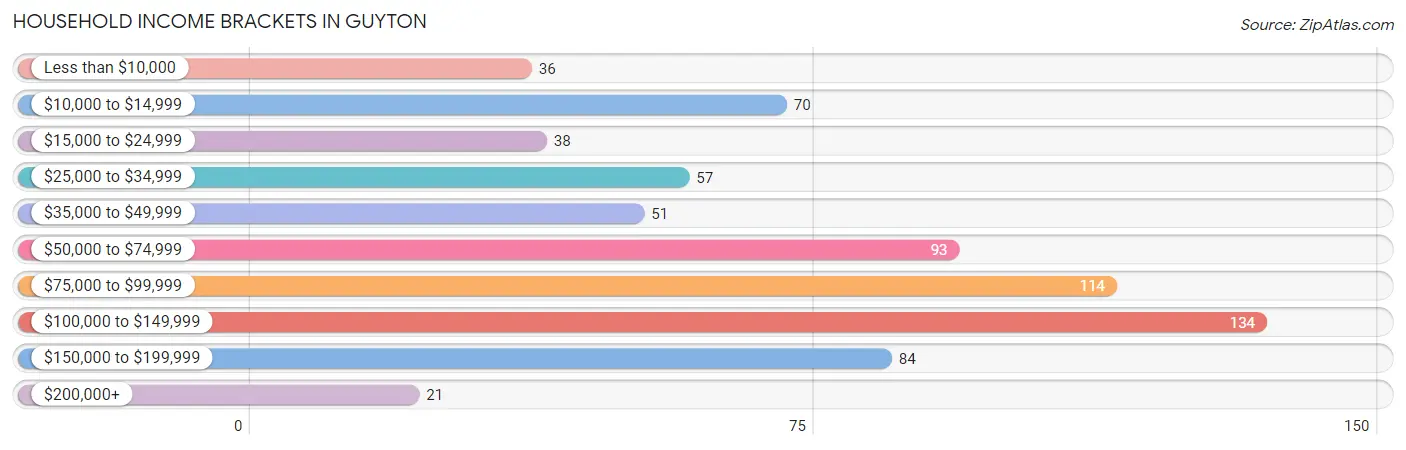
Household Income Brackets in Guyton
With 134 households falling in the category, the $100,000 to $149,999 income range is the most frequent in Guyton, accounting for 19.2% of all households. In contrast, only 21 households (3.0%) fall into the $200,000+ income bracket, making it the least populous group.
| Income Bracket | # Households | % Households |
| Less than $10,000 | 36 | 5.2% |
| $10,000 to $14,999 | 70 | 10.0% |
| $15,000 to $24,999 | 38 | 5.4% |
| $25,000 to $34,999 | 57 | 8.2% |
| $35,000 to $49,999 | 51 | 7.3% |
| $50,000 to $74,999 | 93 | 13.3% |
| $75,000 to $99,999 | 114 | 16.3% |
| $100,000 to $149,999 | 134 | 19.2% |
| $150,000 to $199,999 | 84 | 12.0% |
| $200,000+ | 21 | 3.0% |
Household Income by Householder Age in Guyton
The median household income in Guyton is $75,625, with the highest median household income of $89,583 found in the 45 to 64 years age bracket for the primary householder. A total of 169 households (24.2%) fall into this category. Meanwhile, the 15 to 24 years age bracket for the primary householder has the lowest median household income of $0, with 36 households (5.2%) in this group.

| Income Bracket | # Households | Median Income |
| 15 to 24 Years | 36 (5.2%) | $0 |
| 25 to 44 Years | 382 (54.7%) | $78,167 |
| 45 to 64 Years | 169 (24.2%) | $89,583 |
| 65+ Years | 111 (15.9%) | $38,594 |
| Total | 698 (100.0%) | $75,625 |
Poverty in Guyton
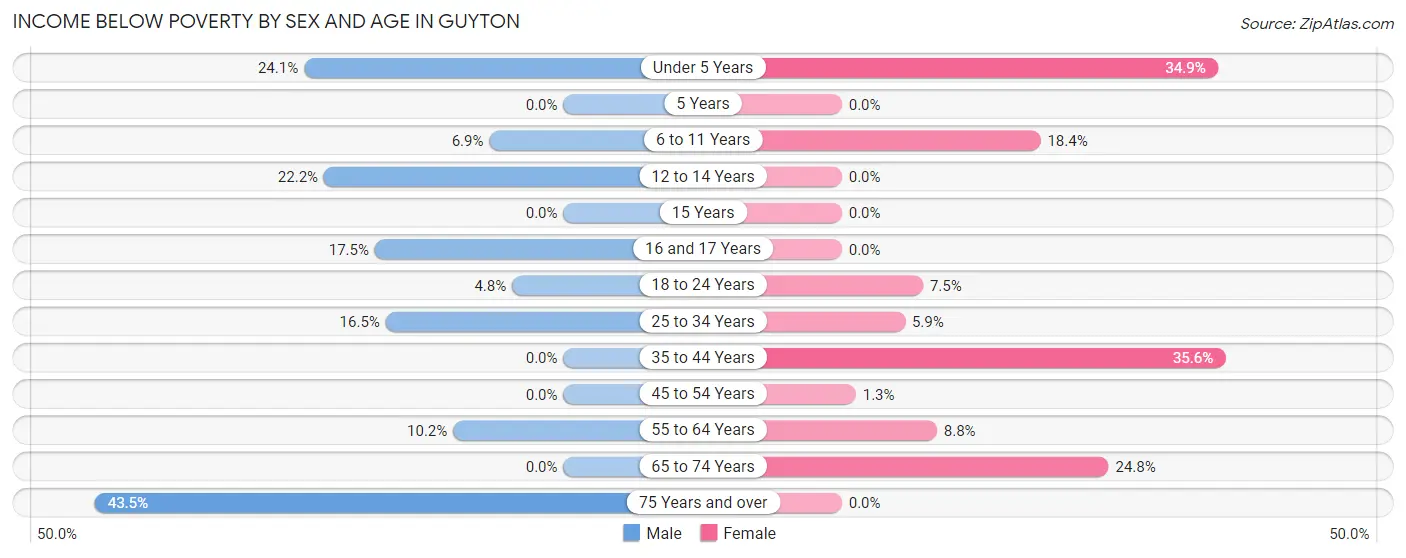
Income Below Poverty by Sex and Age in Guyton
With 11.0% poverty level for males and 16.2% for females among the residents of Guyton, 75 year old and over males and 35 to 44 year old females are the most vulnerable to poverty, with 10 males (43.5%) and 85 females (35.6%) in their respective age groups living below the poverty level.
| Age Bracket | Male | Female |
| Under 5 Years | 26 (24.1%) | 53 (34.9%) |
| 5 Years | 0 (0.0%) | 0 (0.0%) |
| 6 to 11 Years | 9 (6.9%) | 33 (18.4%) |
| 12 to 14 Years | 8 (22.2%) | 0 (0.0%) |
| 15 Years | 0 (0.0%) | 0 (0.0%) |
| 16 and 17 Years | 7 (17.5%) | 0 (0.0%) |
| 18 to 24 Years | 4 (4.8%) | 7 (7.5%) |
| 25 to 34 Years | 32 (16.5%) | 17 (5.9%) |
| 35 to 44 Years | 0 (0.0%) | 85 (35.6%) |
| 45 to 54 Years | 0 (0.0%) | 1 (1.3%) |
| 55 to 64 Years | 9 (10.2%) | 12 (8.8%) |
| 65 to 74 Years | 0 (0.0%) | 26 (24.8%) |
| 75 Years and over | 10 (43.5%) | 0 (0.0%) |
| Total | 105 (11.0%) | 234 (16.2%) |
Income Above Poverty by Sex and Age in Guyton
According to the poverty statistics in Guyton, males aged 5 years and females aged 5 years are the age groups that are most secure financially, with 100.0% of males and 100.0% of females in these age groups living above the poverty line.
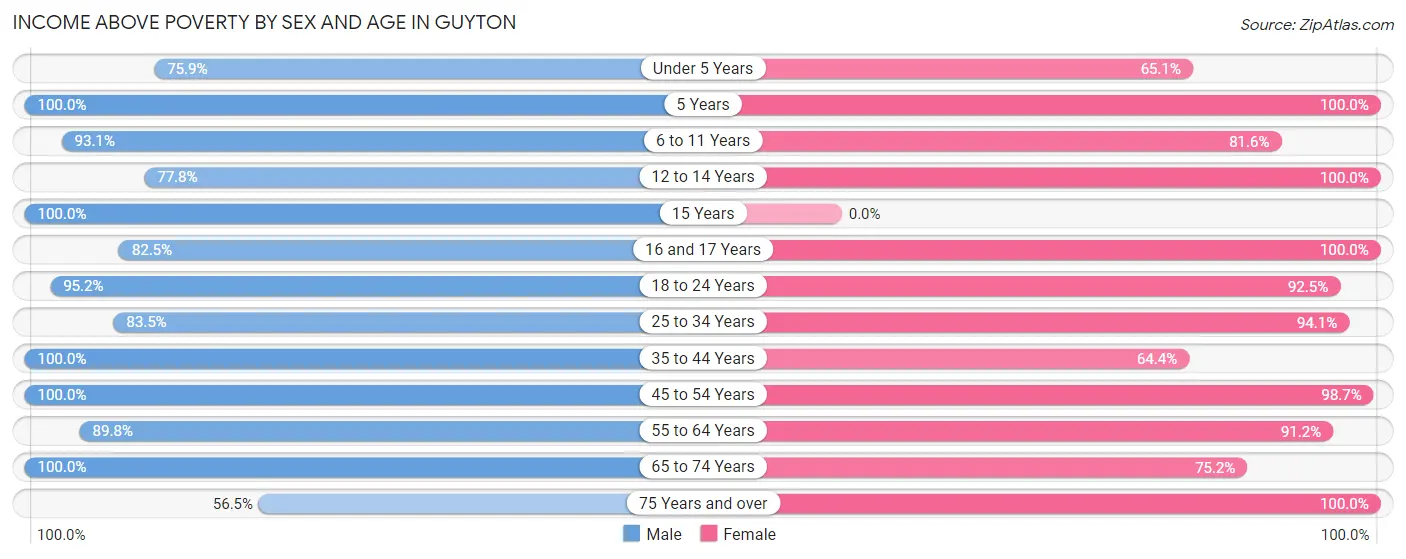
| Age Bracket | Male | Female |
| Under 5 Years | 82 (75.9%) | 99 (65.1%) |
| 5 Years | 2 (100.0%) | 4 (100.0%) |
| 6 to 11 Years | 122 (93.1%) | 146 (81.6%) |
| 12 to 14 Years | 28 (77.8%) | 68 (100.0%) |
| 15 Years | 10 (100.0%) | 0 (0.0%) |
| 16 and 17 Years | 33 (82.5%) | 85 (100.0%) |
| 18 to 24 Years | 80 (95.2%) | 86 (92.5%) |
| 25 to 34 Years | 162 (83.5%) | 273 (94.1%) |
| 35 to 44 Years | 111 (100.0%) | 154 (64.4%) |
| 45 to 54 Years | 91 (100.0%) | 76 (98.7%) |
| 55 to 64 Years | 79 (89.8%) | 124 (91.2%) |
| 65 to 74 Years | 36 (100.0%) | 79 (75.2%) |
| 75 Years and over | 13 (56.5%) | 15 (100.0%) |
| Total | 849 (89.0%) | 1,209 (83.8%) |
Income Below Poverty Among Married-Couple Families in Guyton
The poverty statistics for married-couple families in Guyton show that 8.5% or 36 of the total 426 families live below the poverty line. Families with 3 or 4 children have the highest poverty rate of 34.8%, comprising of 32 families. On the other hand, families with 1 or 2 children have the lowest poverty rate of 0.0%, which includes 0 families.
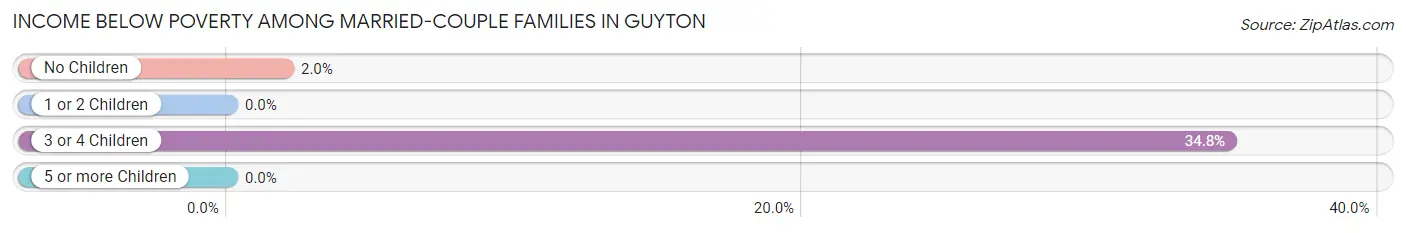
| Children | Above Poverty | Below Poverty |
| No Children | 201 (98.1%) | 4 (1.9%) |
| 1 or 2 Children | 129 (100.0%) | 0 (0.0%) |
| 3 or 4 Children | 60 (65.2%) | 32 (34.8%) |
| 5 or more Children | 0 (0.0%) | 0 (0.0%) |
| Total | 390 (91.5%) | 36 (8.5%) |
Income Below Poverty Among Single-Parent Households in Guyton
According to the poverty data in Guyton, 25.9% or 7 single-father households and 21.4% or 18 single-mother households are living below the poverty line. Among single-father households, those with no children have the highest poverty rate, with 7 households (63.6%) experiencing poverty. Likewise, among single-mother households, those with 1 or 2 children have the highest poverty rate, with 17 households (35.4%) falling below the poverty line.
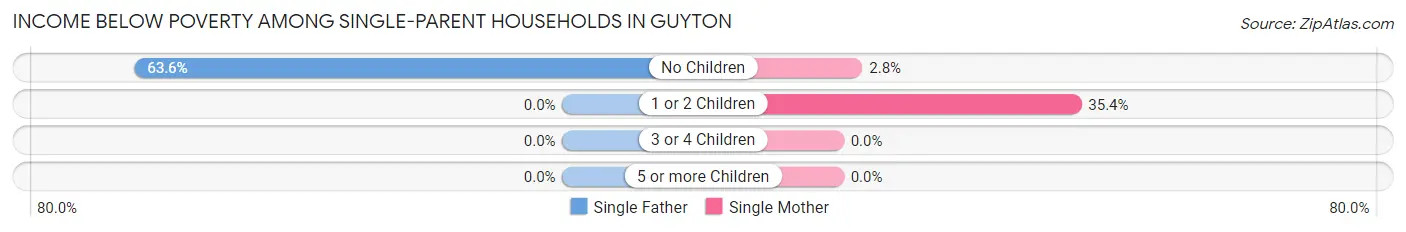
| Children | Single Father | Single Mother |
| No Children | 7 (63.6%) | 1 (2.8%) |
| 1 or 2 Children | 0 (0.0%) | 17 (35.4%) |
| 3 or 4 Children | 0 (0.0%) | 0 (0.0%) |
| 5 or more Children | 0 (0.0%) | 0 (0.0%) |
| Total | 7 (25.9%) | 18 (21.4%) |
Income Below Poverty Among Married-Couple vs Single-Parent Households in Guyton
The poverty data for Guyton shows that 36 of the married-couple family households (8.5%) and 25 of the single-parent households (22.5%) are living below the poverty level. Within the married-couple family households, those with 3 or 4 children have the highest poverty rate, with 32 households (34.8%) falling below the poverty line. Among the single-parent households, those with 1 or 2 children have the highest poverty rate, with 17 household (27.9%) living below poverty.
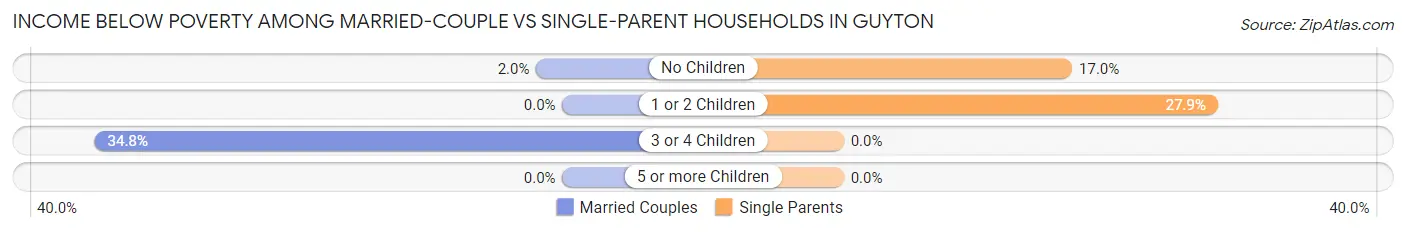
| Children | Married-Couple Families | Single-Parent Households |
| No Children | 4 (1.9%) | 8 (17.0%) |
| 1 or 2 Children | 0 (0.0%) | 17 (27.9%) |
| 3 or 4 Children | 32 (34.8%) | 0 (0.0%) |
| 5 or more Children | 0 (0.0%) | 0 (0.0%) |
| Total | 36 (8.5%) | 25 (22.5%) |
Employment Characteristics in Guyton
Employment by Class of Employer in Guyton
Among the 955 employed individuals in Guyton, private company employees (709 | 74.2%), local government employees (135 | 14.1%), and state government employees (55 | 5.8%) make up the most common classes of employment.
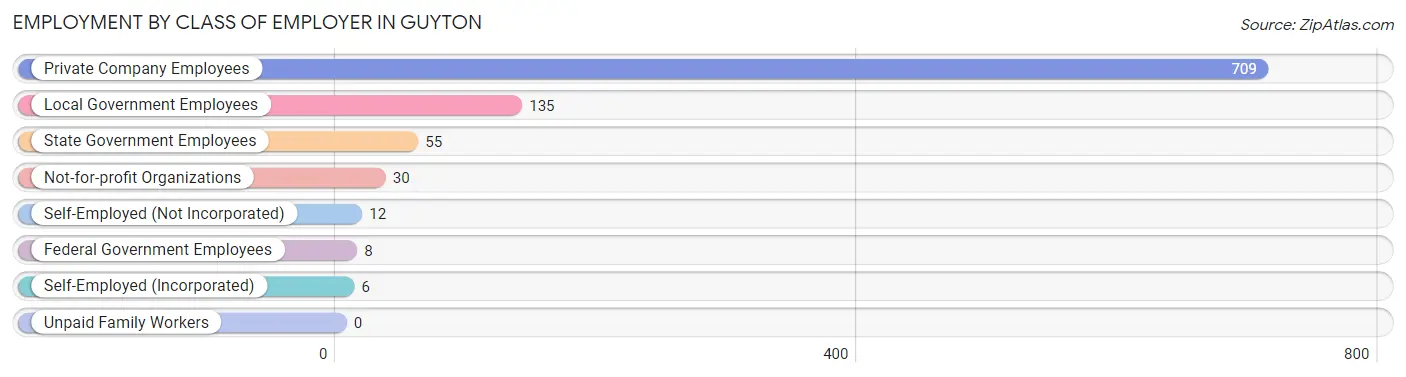
| Employer Class | # Employees | % Employees |
| Private Company Employees | 709 | 74.2% |
| Self-Employed (Incorporated) | 6 | 0.6% |
| Self-Employed (Not Incorporated) | 12 | 1.3% |
| Not-for-profit Organizations | 30 | 3.1% |
| Local Government Employees | 135 | 14.1% |
| State Government Employees | 55 | 5.8% |
| Federal Government Employees | 8 | 0.8% |
| Unpaid Family Workers | 0 | 0.0% |
| Total | 955 | 100.0% |
Employment Status by Age in Guyton
According to the labor force statistics for Guyton, out of the total population over 16 years of age (1,707), 67.8% or 1,157 individuals are in the labor force, with 16.3% or 189 of them unemployed. The age group with the highest labor force participation rate is 25 to 29 years, with 88.6% or 132 individuals in the labor force. Within the labor force, the 16 to 19 years age range has the highest percentage of unemployed individuals, with 73.1% or 49 of them being unemployed.
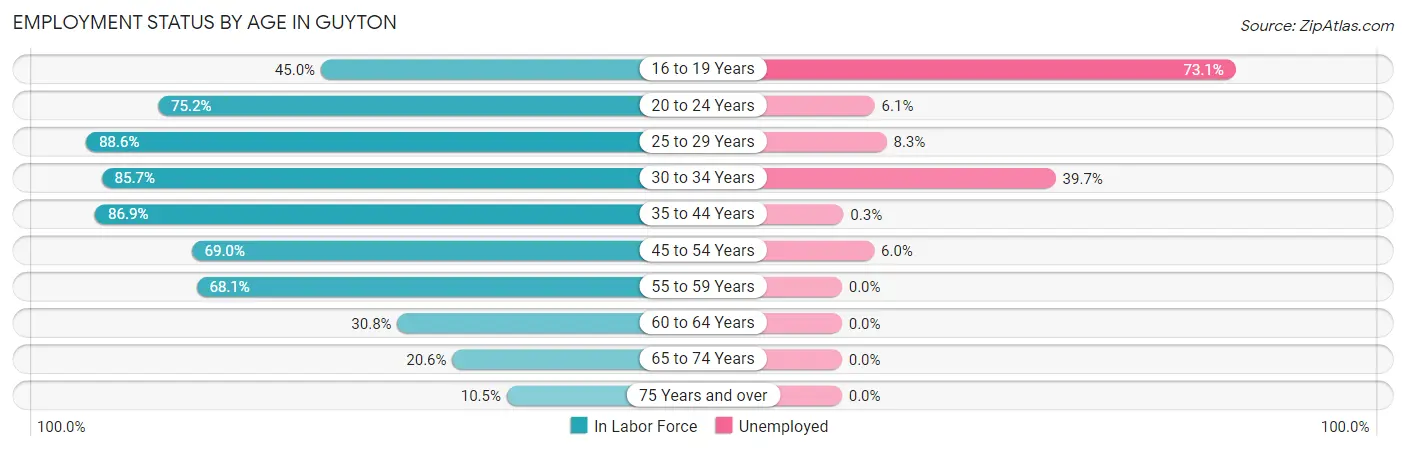
| Age Bracket | In Labor Force | Unemployed |
| 16 to 19 Years | 67 (45.0%) | 49 (73.1%) |
| 20 to 24 Years | 115 (75.2%) | 7 (6.1%) |
| 25 to 29 Years | 132 (88.6%) | 11 (8.3%) |
| 30 to 34 Years | 287 (85.7%) | 114 (39.7%) |
| 35 to 44 Years | 304 (86.9%) | 1 (0.3%) |
| 45 to 54 Years | 116 (69.0%) | 7 (6.0%) |
| 55 to 59 Years | 64 (68.1%) | 0 (0.0%) |
| 60 to 64 Years | 40 (30.8%) | 0 (0.0%) |
| 65 to 74 Years | 29 (20.6%) | 0 (0.0%) |
| 75 Years and over | 4 (10.5%) | 0 (0.0%) |
| Total | 1,157 (67.8%) | 189 (16.3%) |
Employment Status by Educational Attainment in Guyton
According to labor force statistics for Guyton, 76.9% of individuals (943) out of the total population between 25 and 64 years of age (1,226) are in the labor force, with 14.1% or 133 of them being unemployed. The group with the highest labor force participation rate are those with the educational attainment of college / associate degree, with 83.6% or 366 individuals in the labor force. Within the labor force, individuals with less than high school education have the highest percentage of unemployment, with 76.3% or 119 of them being unemployed.
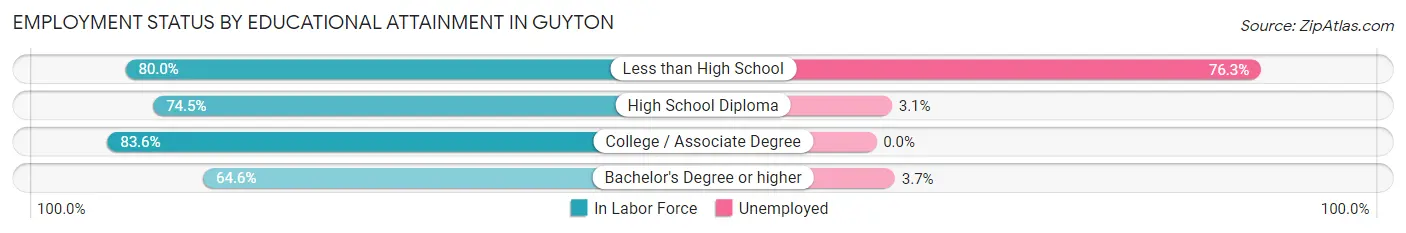
| Educational Attainment | In Labor Force | Unemployed |
| Less than High School | 156 (80.0%) | 149 (76.3%) |
| High School Diploma | 286 (74.5%) | 12 (3.1%) |
| College / Associate Degree | 366 (83.6%) | 0 (0.0%) |
| Bachelor's Degree or higher | 135 (64.6%) | 8 (3.7%) |
| Total | 943 (76.9%) | 173 (14.1%) |
Employment Occupations by Sex in Guyton
Management, Business, Science and Arts Occupations
The most common Management, Business, Science and Arts occupations in Guyton are Community & Social Service (86 | 8.9%), Management (85 | 8.8%), Business & Financial (57 | 5.9%), Health Diagnosing & Treating (56 | 5.8%), and Education Instruction & Library (39 | 4.0%).
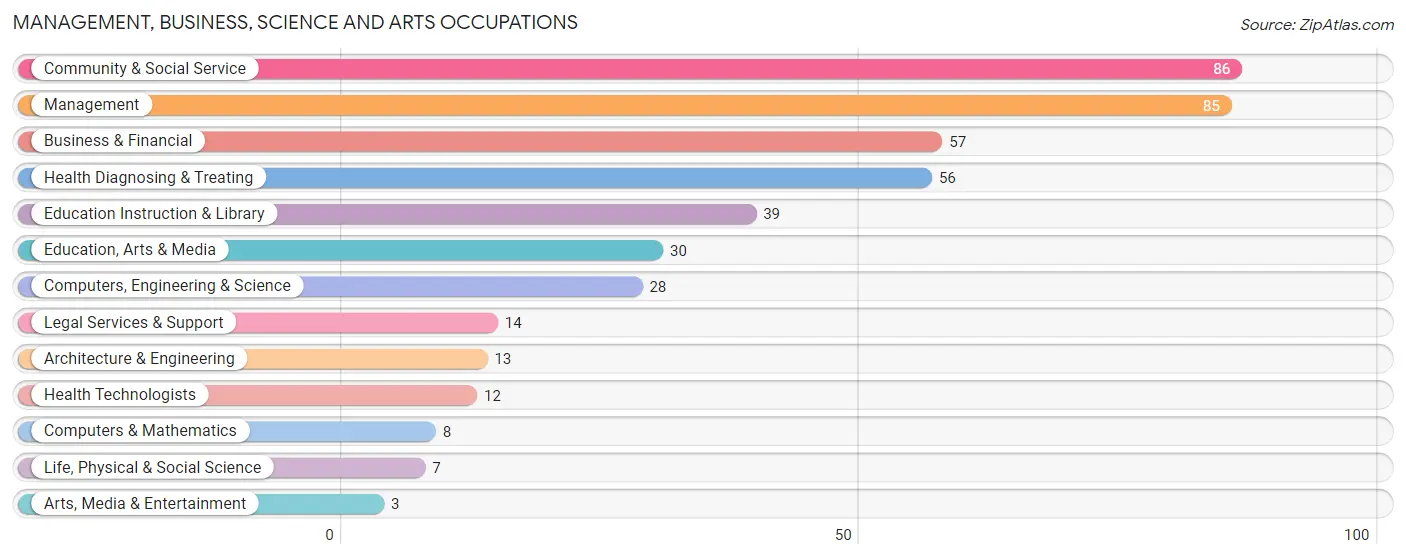
Management, Business, Science and Arts Occupations by Sex
Within the Management, Business, Science and Arts occupations in Guyton, the most male-oriented occupations are Computers & Mathematics (100.0%), Architecture & Engineering (100.0%), and Computers, Engineering & Science (78.6%), while the most female-oriented occupations are Arts, Media & Entertainment (100.0%), Health Diagnosing & Treating (92.9%), and Education Instruction & Library (92.3%).
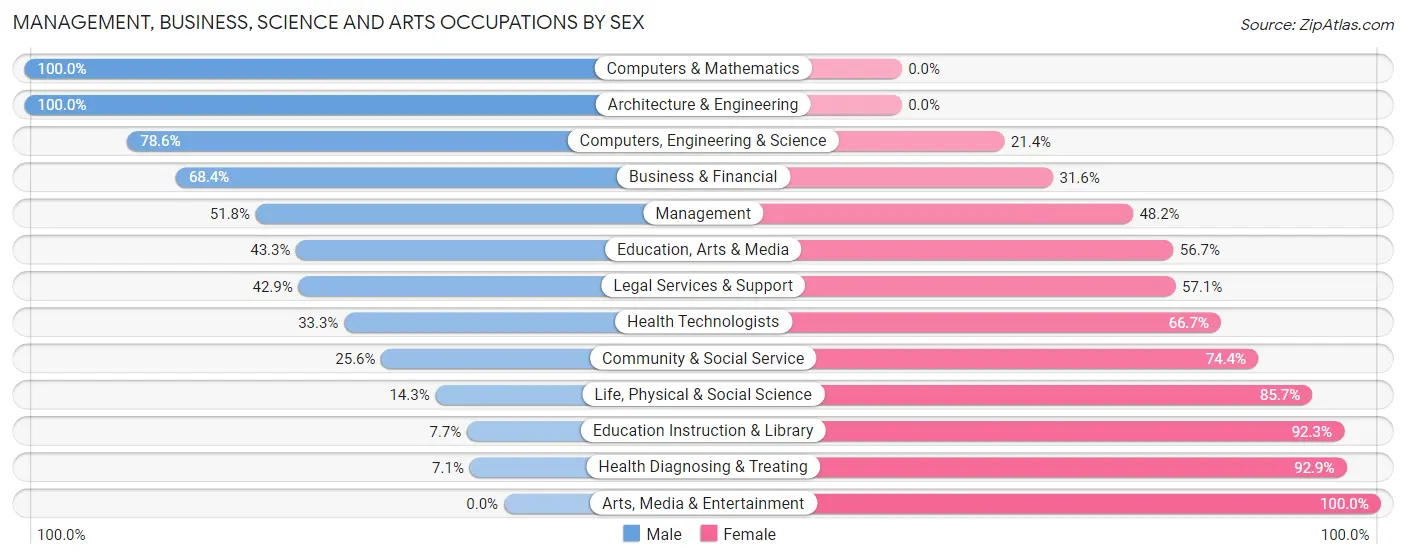
| Occupation | Male | Female |
| Management | 44 (51.8%) | 41 (48.2%) |
| Business & Financial | 39 (68.4%) | 18 (31.6%) |
| Computers, Engineering & Science | 22 (78.6%) | 6 (21.4%) |
| Computers & Mathematics | 8 (100.0%) | 0 (0.0%) |
| Architecture & Engineering | 13 (100.0%) | 0 (0.0%) |
| Life, Physical & Social Science | 1 (14.3%) | 6 (85.7%) |
| Community & Social Service | 22 (25.6%) | 64 (74.4%) |
| Education, Arts & Media | 13 (43.3%) | 17 (56.7%) |
| Legal Services & Support | 6 (42.9%) | 8 (57.1%) |
| Education Instruction & Library | 3 (7.7%) | 36 (92.3%) |
| Arts, Media & Entertainment | 0 (0.0%) | 3 (100.0%) |
| Health Diagnosing & Treating | 4 (7.1%) | 52 (92.9%) |
| Health Technologists | 4 (33.3%) | 8 (66.7%) |
| Total (Category) | 131 (42.0%) | 181 (58.0%) |
| Total (Overall) | 496 (51.2%) | 473 (48.8%) |
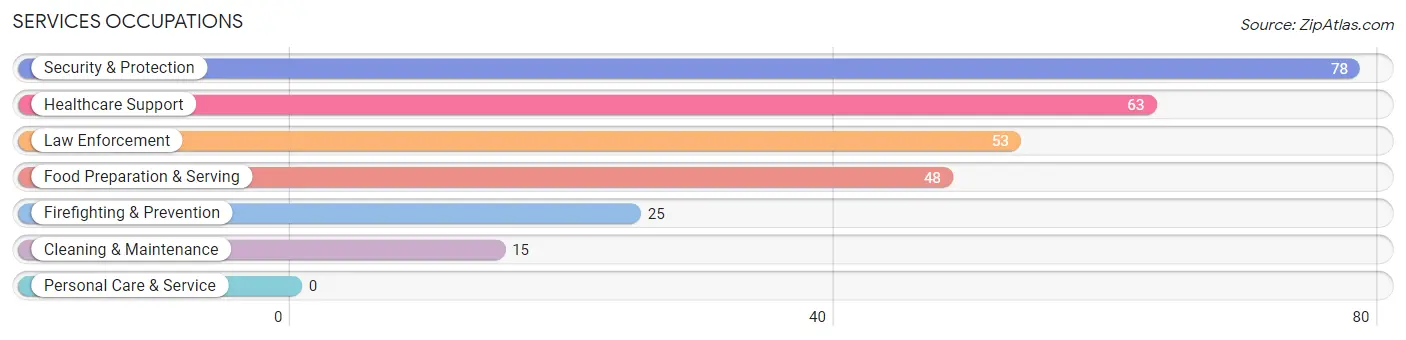
Services Occupations
The most common Services occupations in Guyton are Security & Protection (78 | 8.1%), Healthcare Support (63 | 6.5%), Law Enforcement (53 | 5.5%), Food Preparation & Serving (48 | 5.0%), and Firefighting & Prevention (25 | 2.6%).
Services Occupations by Sex
Within the Services occupations in Guyton, the most male-oriented occupations are Firefighting & Prevention (100.0%), Security & Protection (83.3%), and Law Enforcement (75.5%), while the most female-oriented occupations are Healthcare Support (90.5%), Cleaning & Maintenance (46.7%), and Food Preparation & Serving (39.6%).
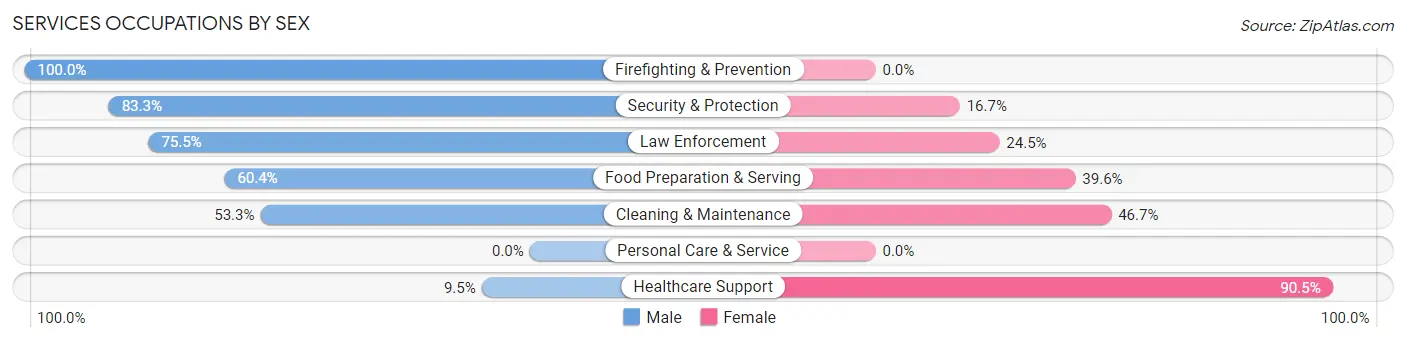
| Occupation | Male | Female |
| Healthcare Support | 6 (9.5%) | 57 (90.5%) |
| Security & Protection | 65 (83.3%) | 13 (16.7%) |
| Firefighting & Prevention | 25 (100.0%) | 0 (0.0%) |
| Law Enforcement | 40 (75.5%) | 13 (24.5%) |
| Food Preparation & Serving | 29 (60.4%) | 19 (39.6%) |
| Cleaning & Maintenance | 8 (53.3%) | 7 (46.7%) |
| Personal Care & Service | 0 (0.0%) | 0 (0.0%) |
| Total (Category) | 108 (52.9%) | 96 (47.1%) |
| Total (Overall) | 496 (51.2%) | 473 (48.8%) |
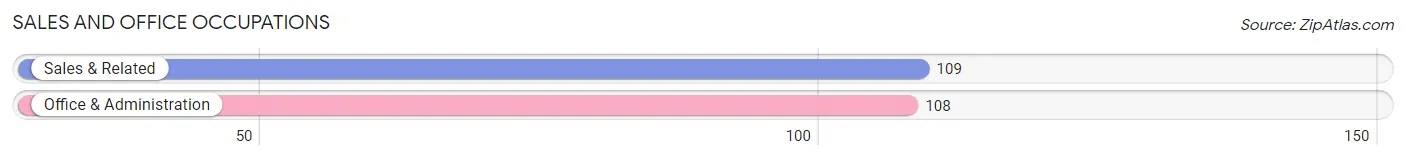
Sales and Office Occupations
The most common Sales and Office occupations in Guyton are Sales & Related (109 | 11.3%), and Office & Administration (108 | 11.2%).
Sales and Office Occupations by Sex
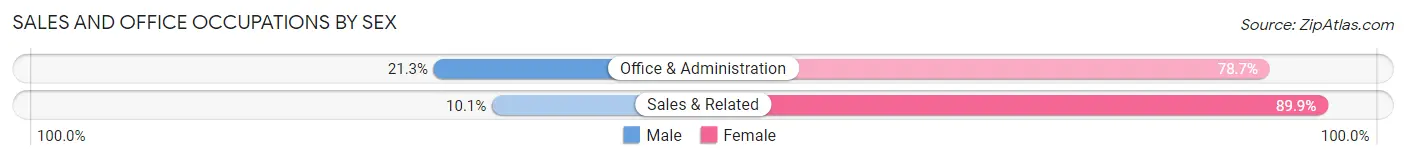
| Occupation | Male | Female |
| Sales & Related | 11 (10.1%) | 98 (89.9%) |
| Office & Administration | 23 (21.3%) | 85 (78.7%) |
| Total (Category) | 34 (15.7%) | 183 (84.3%) |
| Total (Overall) | 496 (51.2%) | 473 (48.8%) |
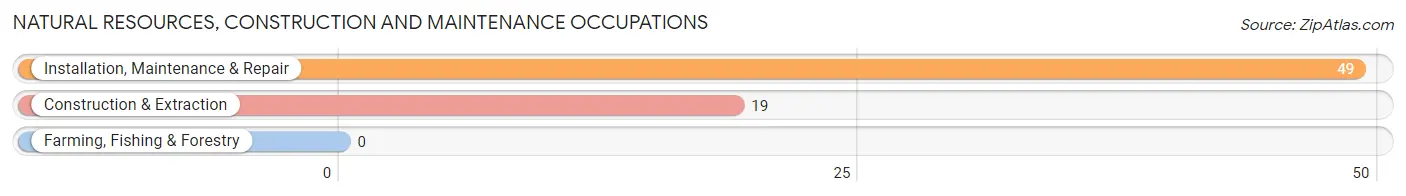
Natural Resources, Construction and Maintenance Occupations
The most common Natural Resources, Construction and Maintenance occupations in Guyton are Installation, Maintenance & Repair (49 | 5.1%), and Construction & Extraction (19 | 2.0%).
Natural Resources, Construction and Maintenance Occupations by Sex
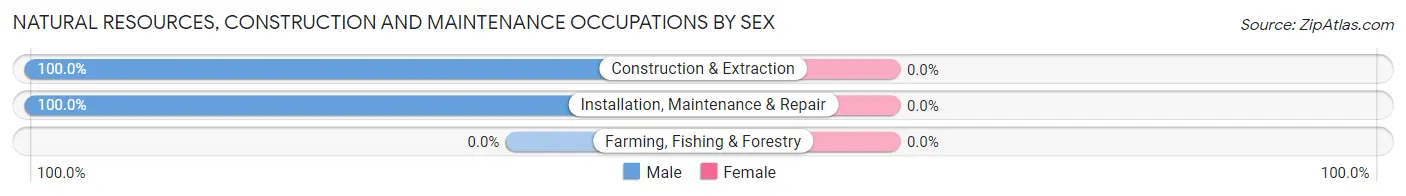
| Occupation | Male | Female |
| Farming, Fishing & Forestry | 0 (0.0%) | 0 (0.0%) |
| Construction & Extraction | 19 (100.0%) | 0 (0.0%) |
| Installation, Maintenance & Repair | 49 (100.0%) | 0 (0.0%) |
| Total (Category) | 68 (100.0%) | 0 (0.0%) |
| Total (Overall) | 496 (51.2%) | 473 (48.8%) |
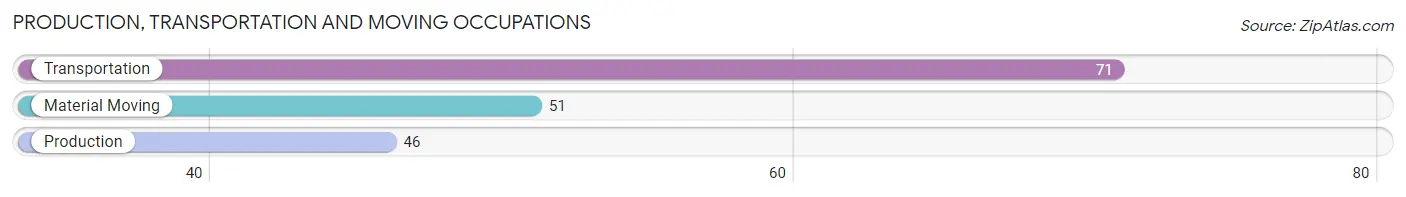
Production, Transportation and Moving Occupations
The most common Production, Transportation and Moving occupations in Guyton are Transportation (71 | 7.3%), Material Moving (51 | 5.3%), and Production (46 | 4.8%).
Production, Transportation and Moving Occupations by Sex
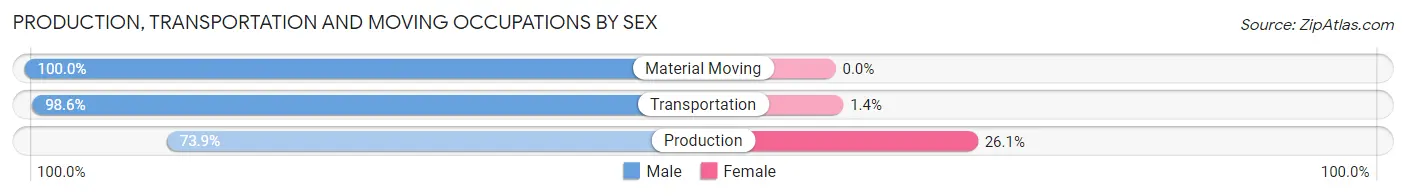
| Occupation | Male | Female |
| Production | 34 (73.9%) | 12 (26.1%) |
| Transportation | 70 (98.6%) | 1 (1.4%) |
| Material Moving | 51 (100.0%) | 0 (0.0%) |
| Total (Category) | 155 (92.3%) | 13 (7.7%) |
| Total (Overall) | 496 (51.2%) | 473 (48.8%) |
Employment Industries by Sex in Guyton
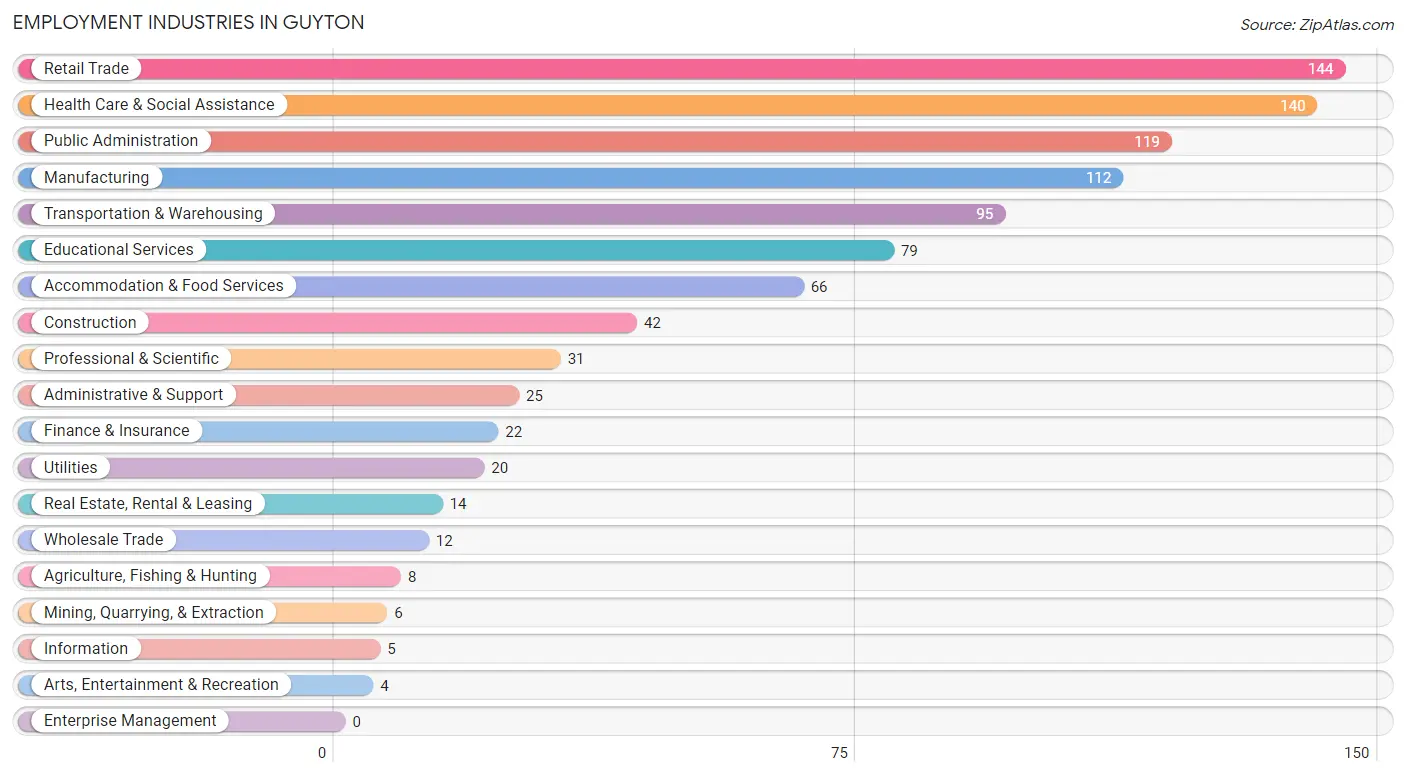
Employment Industries in Guyton
The major employment industries in Guyton include Retail Trade (144 | 14.9%), Health Care & Social Assistance (140 | 14.4%), Public Administration (119 | 12.3%), Manufacturing (112 | 11.6%), and Transportation & Warehousing (95 | 9.8%).
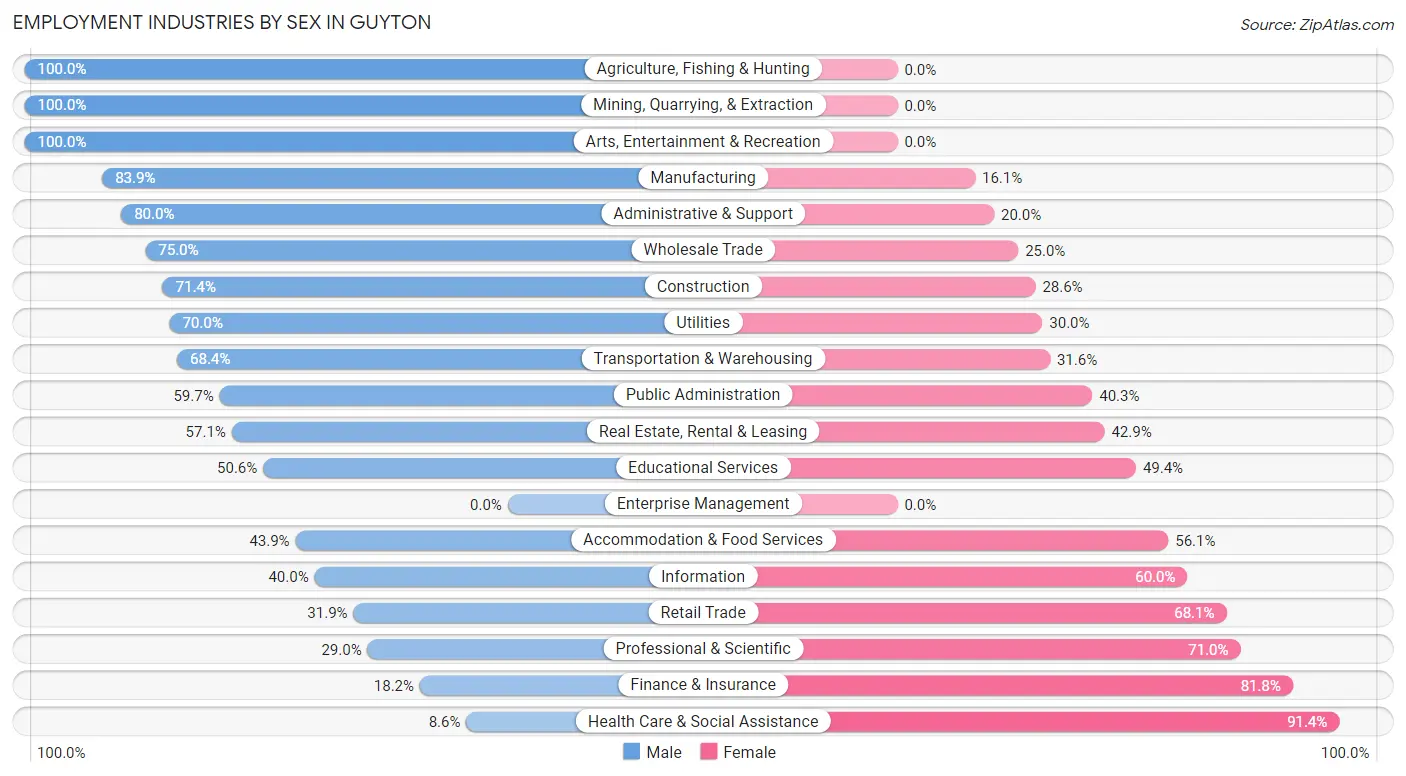
Employment Industries by Sex in Guyton
The Guyton industries that see more men than women are Agriculture, Fishing & Hunting (100.0%), Mining, Quarrying, & Extraction (100.0%), and Arts, Entertainment & Recreation (100.0%), whereas the industries that tend to have a higher number of women are Health Care & Social Assistance (91.4%), Finance & Insurance (81.8%), and Professional & Scientific (71.0%).
| Industry | Male | Female |
| Agriculture, Fishing & Hunting | 8 (100.0%) | 0 (0.0%) |
| Mining, Quarrying, & Extraction | 6 (100.0%) | 0 (0.0%) |
| Construction | 30 (71.4%) | 12 (28.6%) |
| Manufacturing | 94 (83.9%) | 18 (16.1%) |
| Wholesale Trade | 9 (75.0%) | 3 (25.0%) |
| Retail Trade | 46 (31.9%) | 98 (68.1%) |
| Transportation & Warehousing | 65 (68.4%) | 30 (31.6%) |
| Utilities | 14 (70.0%) | 6 (30.0%) |
| Information | 2 (40.0%) | 3 (60.0%) |
| Finance & Insurance | 4 (18.2%) | 18 (81.8%) |
| Real Estate, Rental & Leasing | 8 (57.1%) | 6 (42.9%) |
| Professional & Scientific | 9 (29.0%) | 22 (71.0%) |
| Enterprise Management | 0 (0.0%) | 0 (0.0%) |
| Administrative & Support | 20 (80.0%) | 5 (20.0%) |
| Educational Services | 40 (50.6%) | 39 (49.4%) |
| Health Care & Social Assistance | 12 (8.6%) | 128 (91.4%) |
| Arts, Entertainment & Recreation | 4 (100.0%) | 0 (0.0%) |
| Accommodation & Food Services | 29 (43.9%) | 37 (56.1%) |
| Public Administration | 71 (59.7%) | 48 (40.3%) |
| Total | 496 (51.2%) | 473 (48.8%) |
Education in Guyton
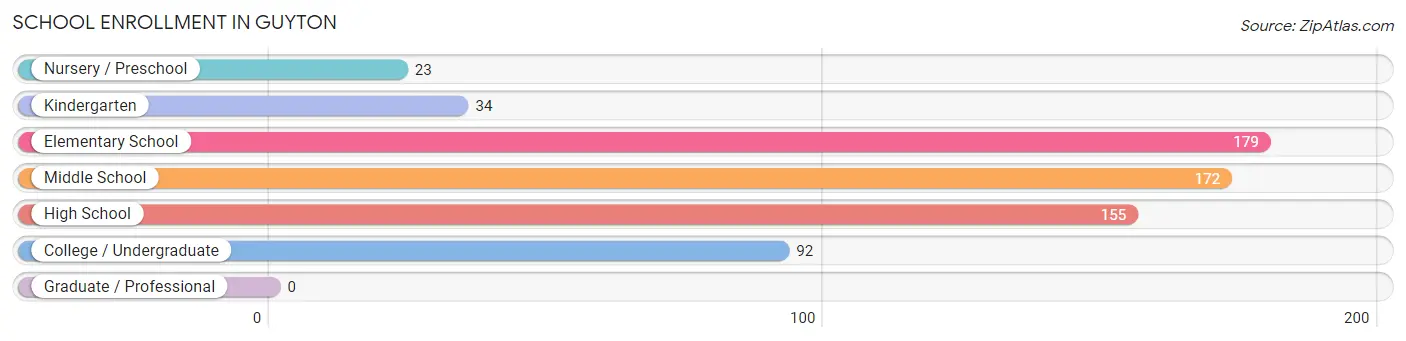
School Enrollment in Guyton
The most common levels of schooling among the 655 students in Guyton are elementary school (179 | 27.3%), middle school (172 | 26.3%), and high school (155 | 23.7%).
| School Level | # Students | % Students |
| Nursery / Preschool | 23 | 3.5% |
| Kindergarten | 34 | 5.2% |
| Elementary School | 179 | 27.3% |
| Middle School | 172 | 26.3% |
| High School | 155 | 23.7% |
| College / Undergraduate | 92 | 14.1% |
| Graduate / Professional | 0 | 0.0% |
| Total | 655 | 100.0% |
School Enrollment by Age by Funding Source in Guyton
Out of a total of 655 students who are enrolled in schools in Guyton, 35 (5.3%) attend a private institution, while the remaining 620 (94.7%) are enrolled in public schools. The age group of 3 to 4 year olds has the highest likelihood of being enrolled in private schools, with 8 (38.1% in the age bracket) enrolled. Conversely, the age group of 18 to 19 year olds has the lowest likelihood of being enrolled in a private school, with 4 (100.0% in the age bracket) attending a public institution.
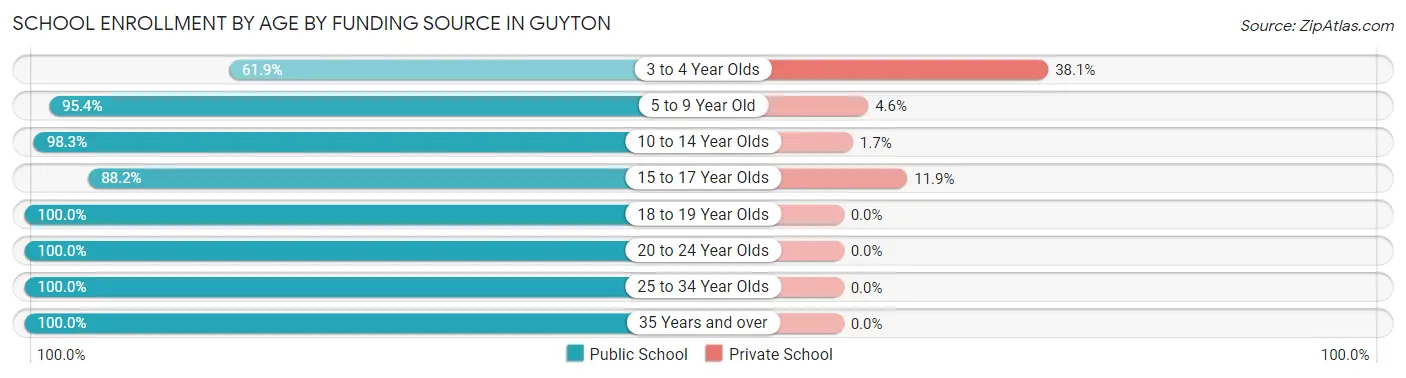
| Age Bracket | Public School | Private School |
| 3 to 4 Year Olds | 13 (61.9%) | 8 (38.1%) |
| 5 to 9 Year Old | 146 (95.4%) | 7 (4.6%) |
| 10 to 14 Year Olds | 229 (98.3%) | 4 (1.7%) |
| 15 to 17 Year Olds | 119 (88.1%) | 16 (11.8%) |
| 18 to 19 Year Olds | 4 (100.0%) | 0 (0.0%) |
| 20 to 24 Year Olds | 78 (100.0%) | 0 (0.0%) |
| 25 to 34 Year Olds | 26 (100.0%) | 0 (0.0%) |
| 35 Years and over | 5 (100.0%) | 0 (0.0%) |
| Total | 620 (94.7%) | 35 (5.3%) |
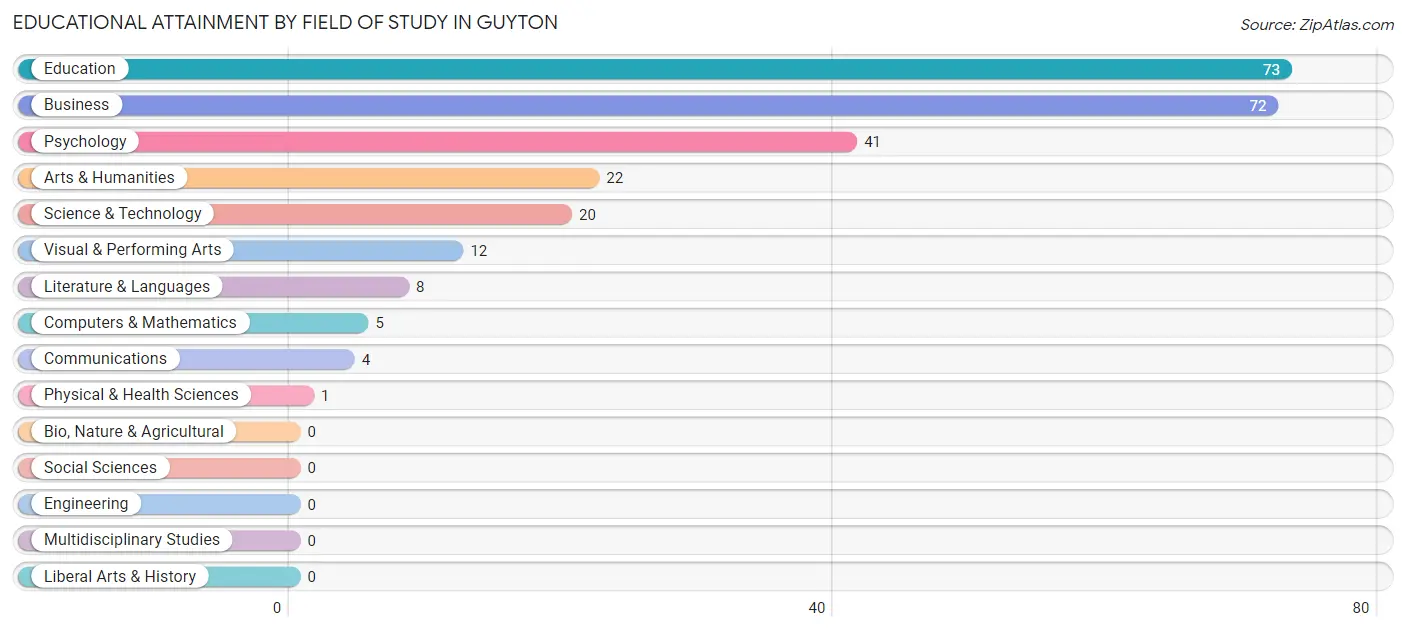
Educational Attainment by Field of Study in Guyton
Education (73 | 28.3%), business (72 | 27.9%), psychology (41 | 15.9%), arts & humanities (22 | 8.5%), and science & technology (20 | 7.7%) are the most common fields of study among 258 individuals in Guyton who have obtained a bachelor's degree or higher.
| Field of Study | # Graduates | % Graduates |
| Computers & Mathematics | 5 | 1.9% |
| Bio, Nature & Agricultural | 0 | 0.0% |
| Physical & Health Sciences | 1 | 0.4% |
| Psychology | 41 | 15.9% |
| Social Sciences | 0 | 0.0% |
| Engineering | 0 | 0.0% |
| Multidisciplinary Studies | 0 | 0.0% |
| Science & Technology | 20 | 7.7% |
| Business | 72 | 27.9% |
| Education | 73 | 28.3% |
| Literature & Languages | 8 | 3.1% |
| Liberal Arts & History | 0 | 0.0% |
| Visual & Performing Arts | 12 | 4.6% |
| Communications | 4 | 1.5% |
| Arts & Humanities | 22 | 8.5% |
| Total | 258 | 100.0% |
Transportation & Commute in Guyton
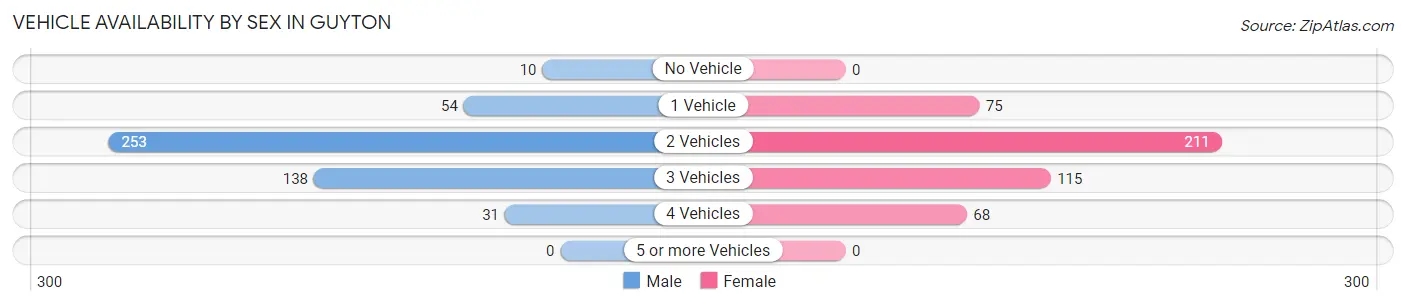
Vehicle Availability by Sex in Guyton
The most prevalent vehicle ownership categories in Guyton are males with 2 vehicles (253, accounting for 52.1%) and females with 2 vehicles (211, making up 53.9%).
| Vehicles Available | Male | Female |
| No Vehicle | 10 (2.1%) | 0 (0.0%) |
| 1 Vehicle | 54 (11.1%) | 75 (16.0%) |
| 2 Vehicles | 253 (52.1%) | 211 (45.0%) |
| 3 Vehicles | 138 (28.4%) | 115 (24.5%) |
| 4 Vehicles | 31 (6.4%) | 68 (14.5%) |
| 5 or more Vehicles | 0 (0.0%) | 0 (0.0%) |
| Total | 486 (100.0%) | 469 (100.0%) |
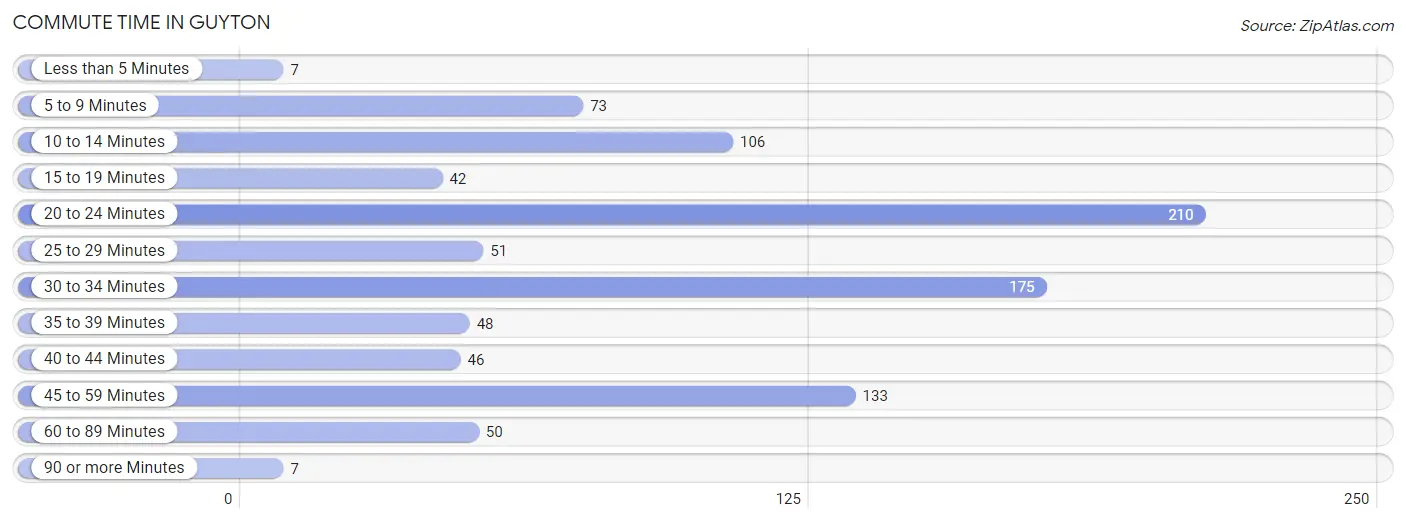
Commute Time in Guyton
The most frequently occuring commute durations in Guyton are 20 to 24 minutes (210 commuters, 22.2%), 30 to 34 minutes (175 commuters, 18.5%), and 45 to 59 minutes (133 commuters, 14.0%).
| Commute Time | # Commuters | % Commuters |
| Less than 5 Minutes | 7 | 0.7% |
| 5 to 9 Minutes | 73 | 7.7% |
| 10 to 14 Minutes | 106 | 11.2% |
| 15 to 19 Minutes | 42 | 4.4% |
| 20 to 24 Minutes | 210 | 22.2% |
| 25 to 29 Minutes | 51 | 5.4% |
| 30 to 34 Minutes | 175 | 18.5% |
| 35 to 39 Minutes | 48 | 5.1% |
| 40 to 44 Minutes | 46 | 4.9% |
| 45 to 59 Minutes | 133 | 14.0% |
| 60 to 89 Minutes | 50 | 5.3% |
| 90 or more Minutes | 7 | 0.7% |
Commute Time by Sex in Guyton
The most common commute times in Guyton are 20 to 24 minutes (132 commuters, 27.4%) for males and 10 to 14 minutes (86 commuters, 18.4%) for females.
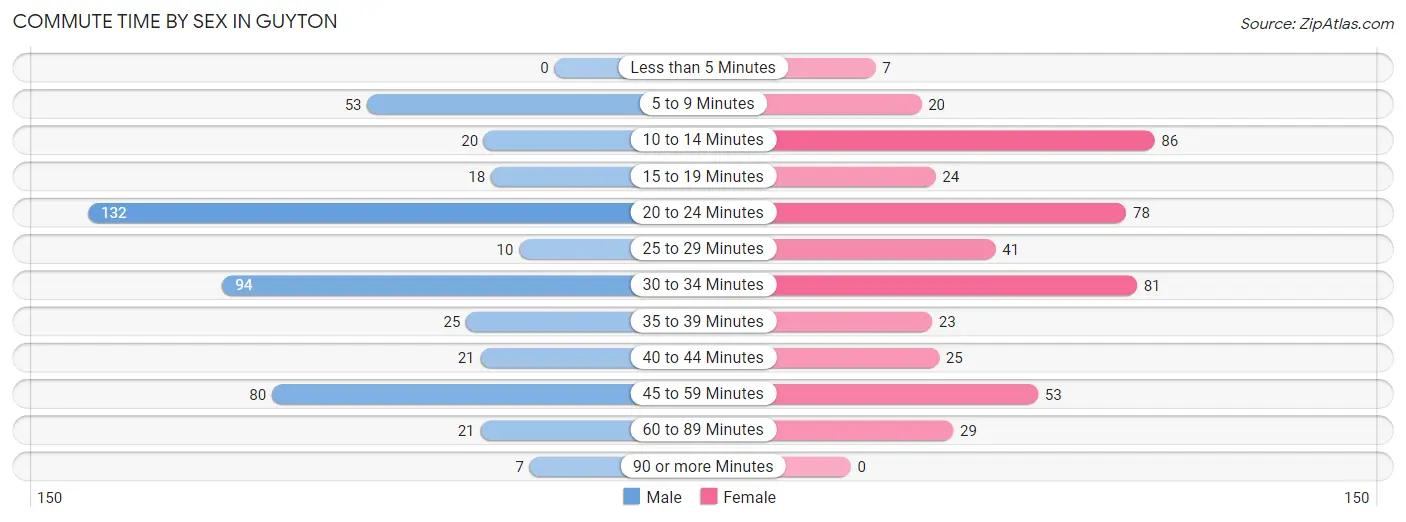
| Commute Time | Male | Female |
| Less than 5 Minutes | 0 (0.0%) | 7 (1.5%) |
| 5 to 9 Minutes | 53 (11.0%) | 20 (4.3%) |
| 10 to 14 Minutes | 20 (4.2%) | 86 (18.4%) |
| 15 to 19 Minutes | 18 (3.7%) | 24 (5.1%) |
| 20 to 24 Minutes | 132 (27.4%) | 78 (16.7%) |
| 25 to 29 Minutes | 10 (2.1%) | 41 (8.8%) |
| 30 to 34 Minutes | 94 (19.5%) | 81 (17.3%) |
| 35 to 39 Minutes | 25 (5.2%) | 23 (4.9%) |
| 40 to 44 Minutes | 21 (4.4%) | 25 (5.3%) |
| 45 to 59 Minutes | 80 (16.6%) | 53 (11.4%) |
| 60 to 89 Minutes | 21 (4.4%) | 29 (6.2%) |
| 90 or more Minutes | 7 (1.5%) | 0 (0.0%) |
Time of Departure to Work by Sex in Guyton
The most frequent times of departure to work in Guyton are 6:00 AM to 6:29 AM (74, 15.4%) for males and 8:00 AM to 8:29 AM (143, 30.6%) for females.
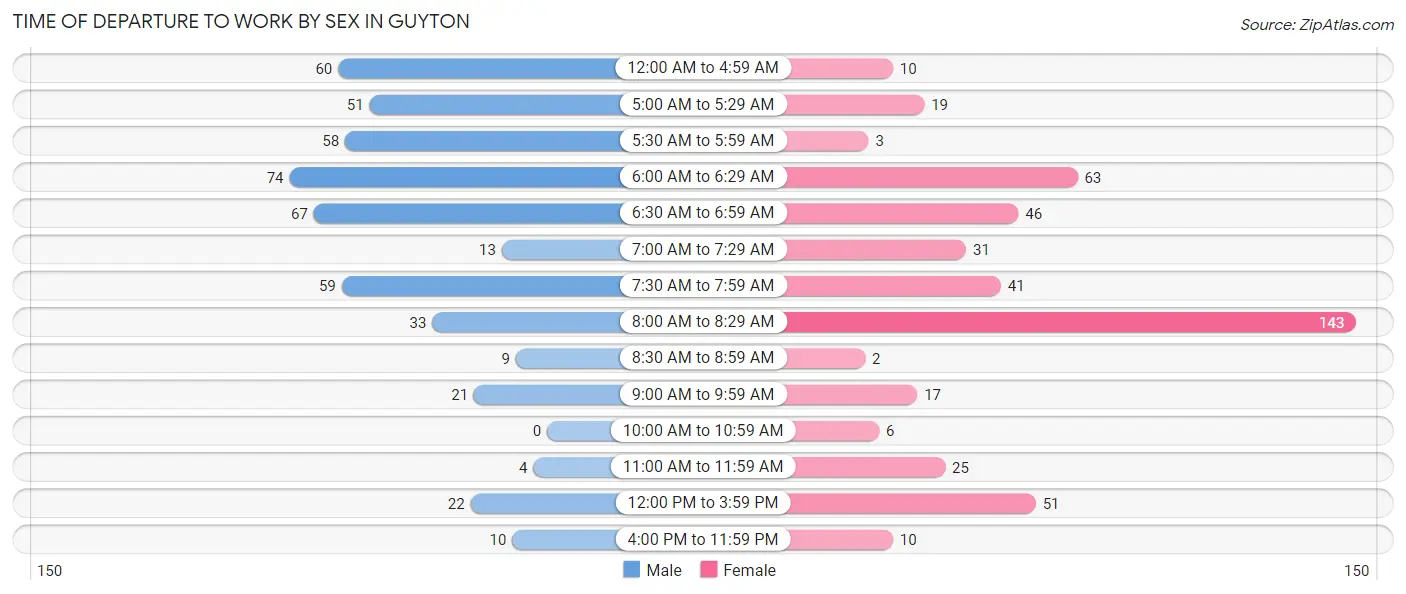
| Time of Departure | Male | Female |
| 12:00 AM to 4:59 AM | 60 (12.5%) | 10 (2.1%) |
| 5:00 AM to 5:29 AM | 51 (10.6%) | 19 (4.1%) |
| 5:30 AM to 5:59 AM | 58 (12.1%) | 3 (0.6%) |
| 6:00 AM to 6:29 AM | 74 (15.4%) | 63 (13.5%) |
| 6:30 AM to 6:59 AM | 67 (13.9%) | 46 (9.9%) |
| 7:00 AM to 7:29 AM | 13 (2.7%) | 31 (6.6%) |
| 7:30 AM to 7:59 AM | 59 (12.3%) | 41 (8.8%) |
| 8:00 AM to 8:29 AM | 33 (6.9%) | 143 (30.6%) |
| 8:30 AM to 8:59 AM | 9 (1.9%) | 2 (0.4%) |
| 9:00 AM to 9:59 AM | 21 (4.4%) | 17 (3.6%) |
| 10:00 AM to 10:59 AM | 0 (0.0%) | 6 (1.3%) |
| 11:00 AM to 11:59 AM | 4 (0.8%) | 25 (5.3%) |
| 12:00 PM to 3:59 PM | 22 (4.6%) | 51 (10.9%) |
| 4:00 PM to 11:59 PM | 10 (2.1%) | 10 (2.1%) |
| Total | 481 (100.0%) | 467 (100.0%) |
Housing Occupancy in Guyton
Occupancy by Ownership in Guyton
Of the total 698 dwellings in Guyton, owner-occupied units account for 529 (75.8%), while renter-occupied units make up 169 (24.2%).
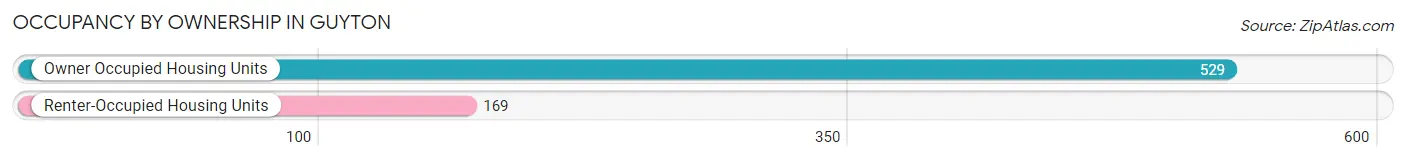
| Occupancy | # Housing Units | % Housing Units |
| Owner Occupied Housing Units | 529 | 75.8% |
| Renter-Occupied Housing Units | 169 | 24.2% |
| Total Occupied Housing Units | 698 | 100.0% |
Occupancy by Household Size in Guyton
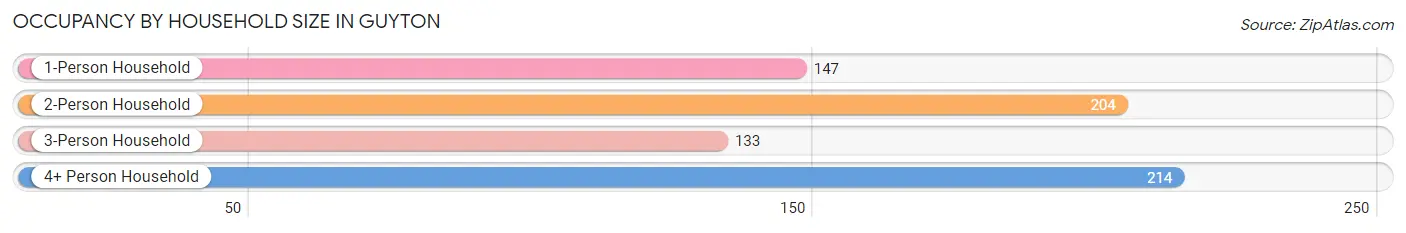
| Household Size | # Housing Units | % Housing Units |
| 1-Person Household | 147 | 21.1% |
| 2-Person Household | 204 | 29.2% |
| 3-Person Household | 133 | 19.1% |
| 4+ Person Household | 214 | 30.7% |
| Total Housing Units | 698 | 100.0% |
Occupancy by Ownership by Household Size in Guyton
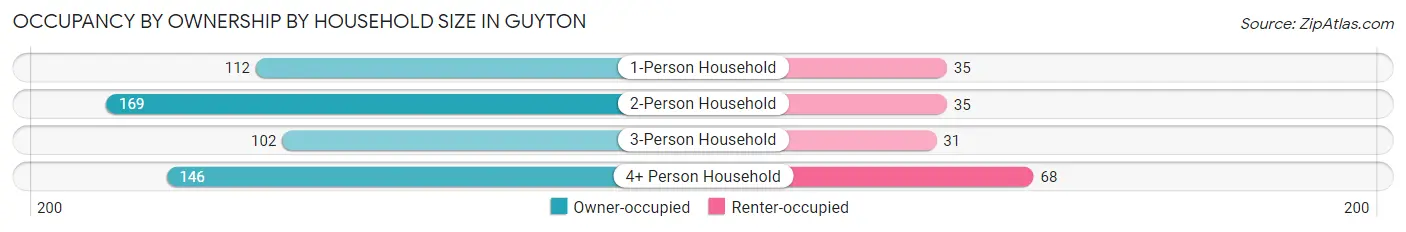
| Household Size | Owner-occupied | Renter-occupied |
| 1-Person Household | 112 (76.2%) | 35 (23.8%) |
| 2-Person Household | 169 (82.8%) | 35 (17.2%) |
| 3-Person Household | 102 (76.7%) | 31 (23.3%) |
| 4+ Person Household | 146 (68.2%) | 68 (31.8%) |
| Total Housing Units | 529 (75.8%) | 169 (24.2%) |
Occupancy by Educational Attainment in Guyton
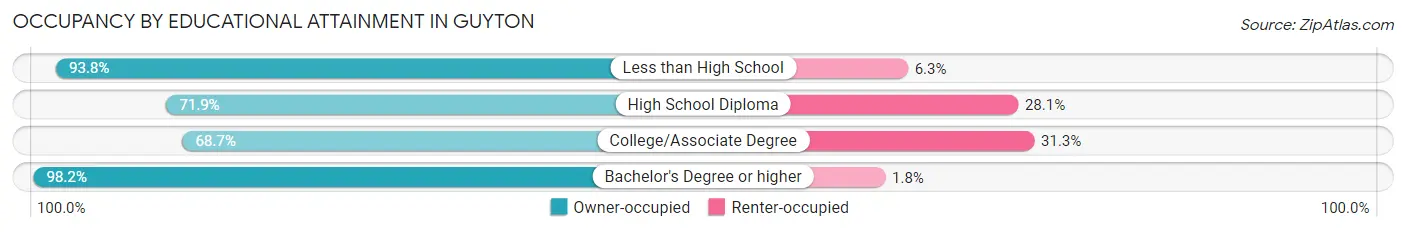
| Household Size | Owner-occupied | Renter-occupied |
| Less than High School | 30 (93.8%) | 2 (6.2%) |
| High School Diploma | 184 (71.9%) | 72 (28.1%) |
| College/Associate Degree | 204 (68.7%) | 93 (31.3%) |
| Bachelor's Degree or higher | 111 (98.2%) | 2 (1.8%) |
Occupancy by Age of Householder in Guyton
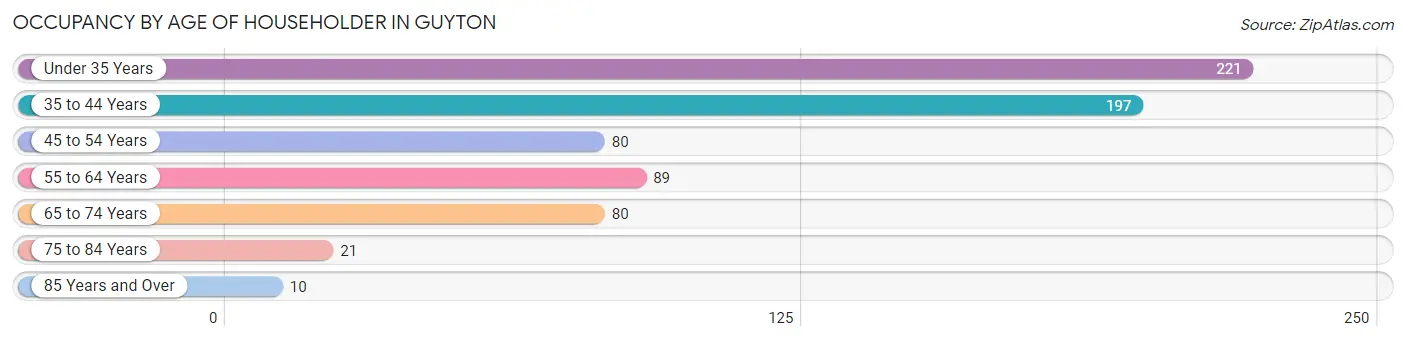
| Age Bracket | # Households | % Households |
| Under 35 Years | 221 | 31.7% |
| 35 to 44 Years | 197 | 28.2% |
| 45 to 54 Years | 80 | 11.5% |
| 55 to 64 Years | 89 | 12.8% |
| 65 to 74 Years | 80 | 11.5% |
| 75 to 84 Years | 21 | 3.0% |
| 85 Years and Over | 10 | 1.4% |
| Total | 698 | 100.0% |
Housing Finances in Guyton
Median Income by Occupancy in Guyton
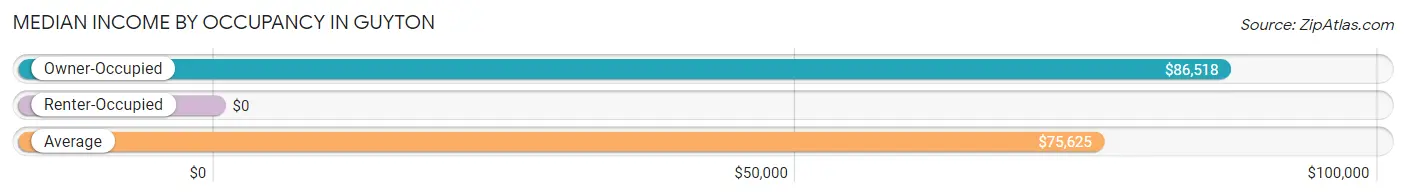
| Occupancy Type | # Households | Median Income |
| Owner-Occupied | 529 (75.8%) | $86,518 |
| Renter-Occupied | 169 (24.2%) | $0 |
| Average | 698 (100.0%) | $75,625 |
Occupancy by Householder Income Bracket in Guyton
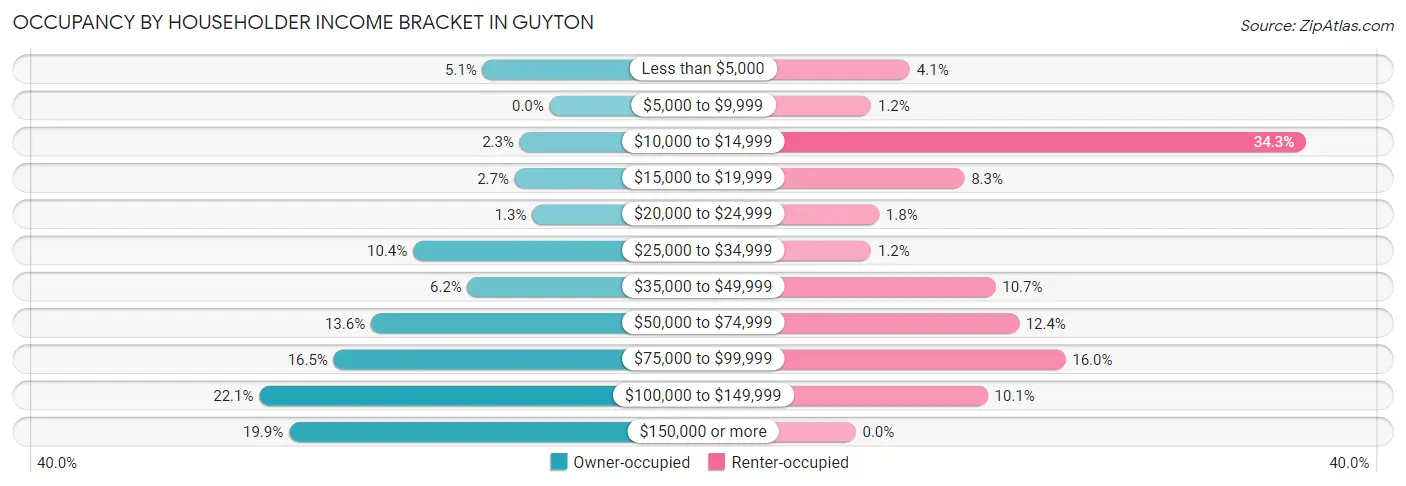
| Income Bracket | Owner-occupied | Renter-occupied |
| Less than $5,000 | 27 (5.1%) | 7 (4.1%) |
| $5,000 to $9,999 | 0 (0.0%) | 2 (1.2%) |
| $10,000 to $14,999 | 12 (2.3%) | 58 (34.3%) |
| $15,000 to $19,999 | 14 (2.6%) | 14 (8.3%) |
| $20,000 to $24,999 | 7 (1.3%) | 3 (1.8%) |
| $25,000 to $34,999 | 55 (10.4%) | 2 (1.2%) |
| $35,000 to $49,999 | 33 (6.2%) | 18 (10.6%) |
| $50,000 to $74,999 | 72 (13.6%) | 21 (12.4%) |
| $75,000 to $99,999 | 87 (16.5%) | 27 (16.0%) |
| $100,000 to $149,999 | 117 (22.1%) | 17 (10.1%) |
| $150,000 or more | 105 (19.9%) | 0 (0.0%) |
| Total | 529 (100.0%) | 169 (100.0%) |
Monthly Housing Cost Tiers in Guyton
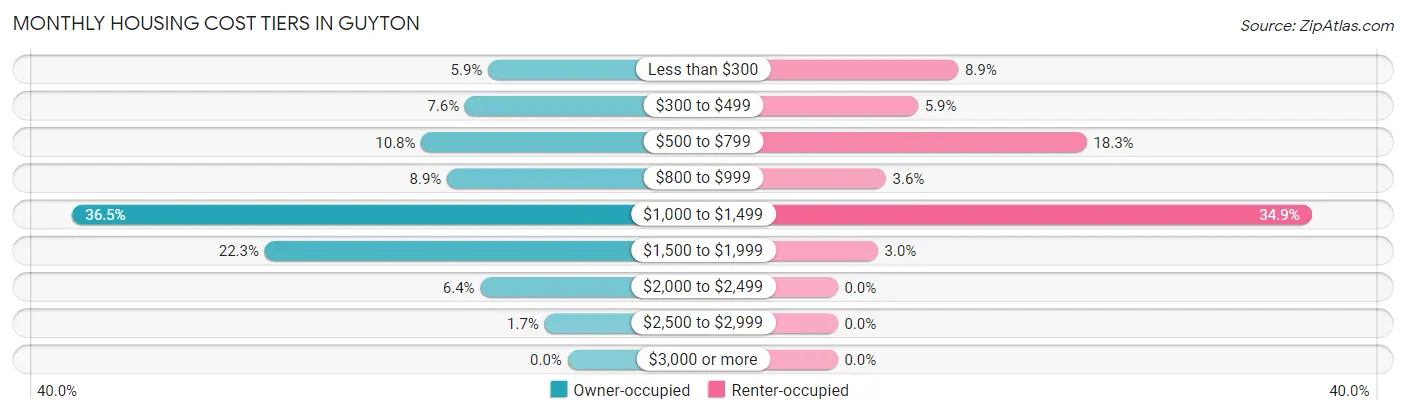
| Monthly Cost | Owner-occupied | Renter-occupied |
| Less than $300 | 31 (5.9%) | 15 (8.9%) |
| $300 to $499 | 40 (7.6%) | 10 (5.9%) |
| $500 to $799 | 57 (10.8%) | 31 (18.3%) |
| $800 to $999 | 47 (8.9%) | 6 (3.5%) |
| $1,000 to $1,499 | 193 (36.5%) | 59 (34.9%) |
| $1,500 to $1,999 | 118 (22.3%) | 5 (3.0%) |
| $2,000 to $2,499 | 34 (6.4%) | 0 (0.0%) |
| $2,500 to $2,999 | 9 (1.7%) | 0 (0.0%) |
| $3,000 or more | 0 (0.0%) | 0 (0.0%) |
| Total | 529 (100.0%) | 169 (100.0%) |
Physical Housing Characteristics in Guyton
Housing Structures in Guyton
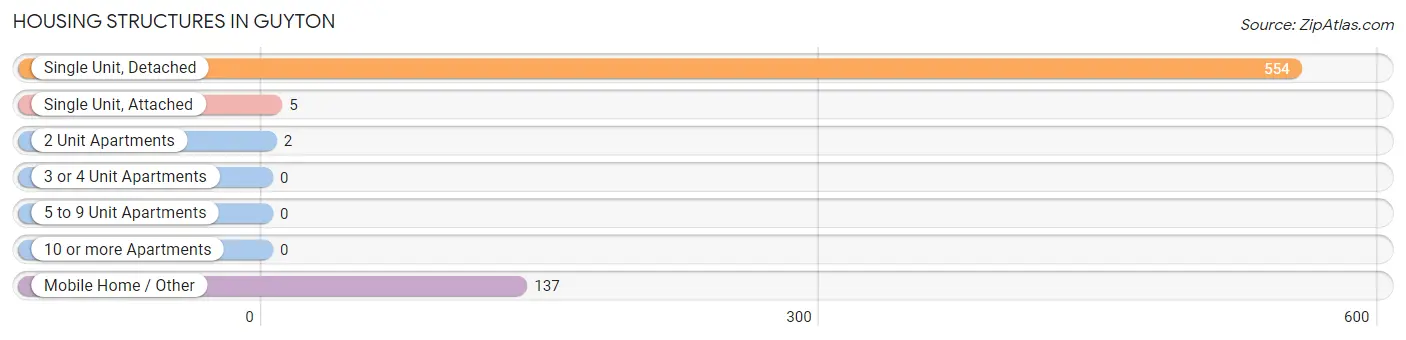
| Structure Type | # Housing Units | % Housing Units |
| Single Unit, Detached | 554 | 79.4% |
| Single Unit, Attached | 5 | 0.7% |
| 2 Unit Apartments | 2 | 0.3% |
| 3 or 4 Unit Apartments | 0 | 0.0% |
| 5 to 9 Unit Apartments | 0 | 0.0% |
| 10 or more Apartments | 0 | 0.0% |
| Mobile Home / Other | 137 | 19.6% |
| Total | 698 | 100.0% |
Housing Structures by Occupancy in Guyton
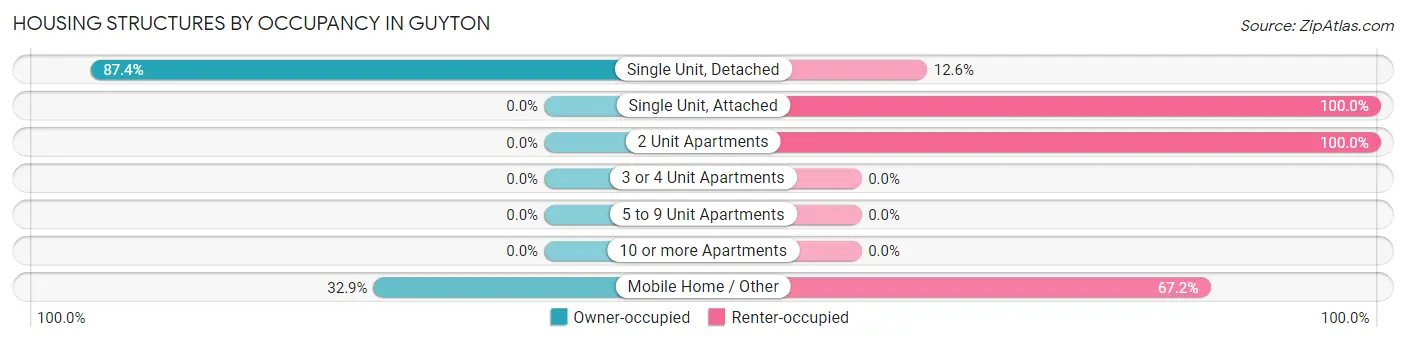
| Structure Type | Owner-occupied | Renter-occupied |
| Single Unit, Detached | 484 (87.4%) | 70 (12.6%) |
| Single Unit, Attached | 0 (0.0%) | 5 (100.0%) |
| 2 Unit Apartments | 0 (0.0%) | 2 (100.0%) |
| 3 or 4 Unit Apartments | 0 (0.0%) | 0 (0.0%) |
| 5 to 9 Unit Apartments | 0 (0.0%) | 0 (0.0%) |
| 10 or more Apartments | 0 (0.0%) | 0 (0.0%) |
| Mobile Home / Other | 45 (32.9%) | 92 (67.1%) |
| Total | 529 (75.8%) | 169 (24.2%) |
Housing Structures by Number of Rooms in Guyton
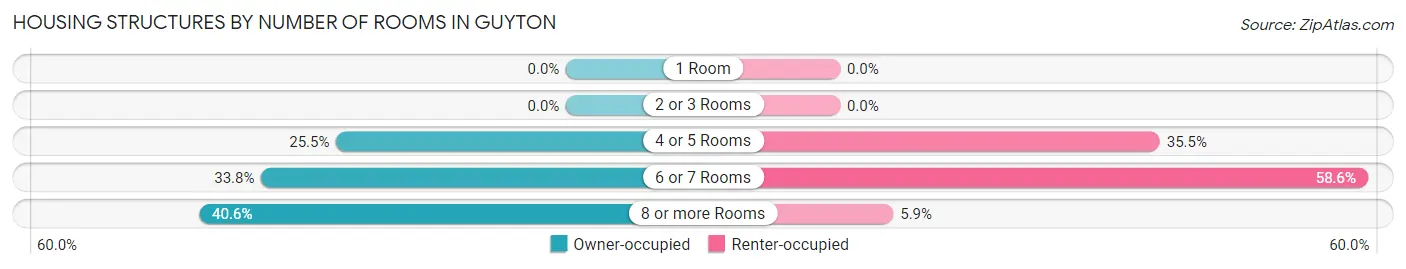
| Number of Rooms | Owner-occupied | Renter-occupied |
| 1 Room | 0 (0.0%) | 0 (0.0%) |
| 2 or 3 Rooms | 0 (0.0%) | 0 (0.0%) |
| 4 or 5 Rooms | 135 (25.5%) | 60 (35.5%) |
| 6 or 7 Rooms | 179 (33.8%) | 99 (58.6%) |
| 8 or more Rooms | 215 (40.6%) | 10 (5.9%) |
| Total | 529 (100.0%) | 169 (100.0%) |
Housing Structure by Heating Type in Guyton
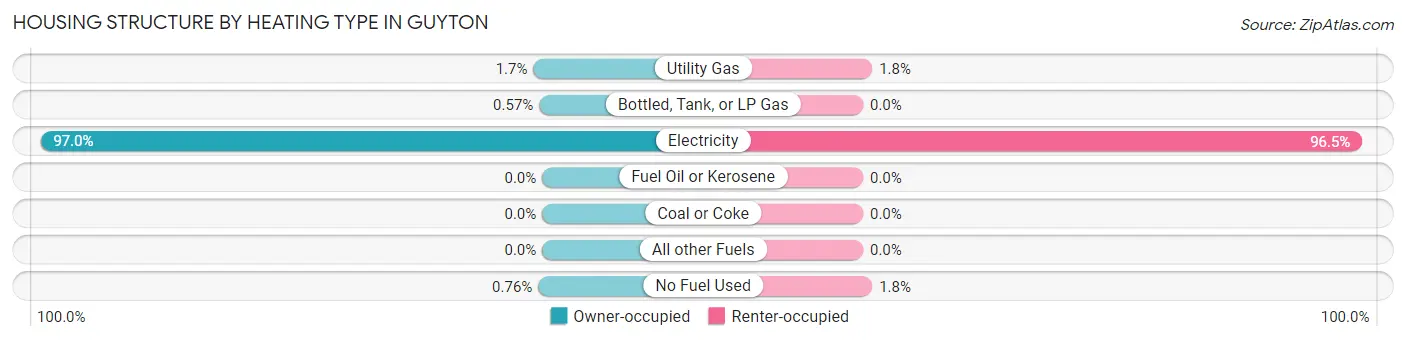
| Heating Type | Owner-occupied | Renter-occupied |
| Utility Gas | 9 (1.7%) | 3 (1.8%) |
| Bottled, Tank, or LP Gas | 3 (0.6%) | 0 (0.0%) |
| Electricity | 513 (97.0%) | 163 (96.5%) |
| Fuel Oil or Kerosene | 0 (0.0%) | 0 (0.0%) |
| Coal or Coke | 0 (0.0%) | 0 (0.0%) |
| All other Fuels | 0 (0.0%) | 0 (0.0%) |
| No Fuel Used | 4 (0.8%) | 3 (1.8%) |
| Total | 529 (100.0%) | 169 (100.0%) |
Household Vehicle Usage in Guyton
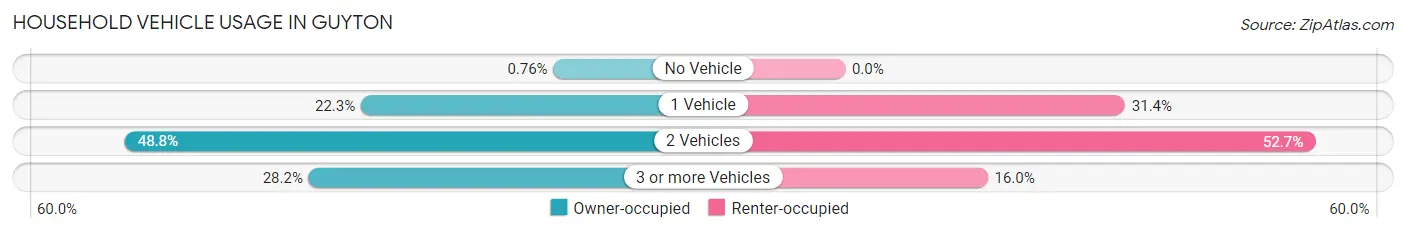
| Vehicles per Household | Owner-occupied | Renter-occupied |
| No Vehicle | 4 (0.8%) | 0 (0.0%) |
| 1 Vehicle | 118 (22.3%) | 53 (31.4%) |
| 2 Vehicles | 258 (48.8%) | 89 (52.7%) |
| 3 or more Vehicles | 149 (28.2%) | 27 (16.0%) |
| Total | 529 (100.0%) | 169 (100.0%) |
Real Estate & Mortgages in Guyton
Real Estate and Mortgage Overview in Guyton
| Characteristic | Without Mortgage | With Mortgage |
| Housing Units | 114 | 415 |
| Median Property Value | $169,400 | $188,000 |
| Median Household Income | $49,750 | $101 |
| Monthly Housing Costs | $456 | $0 |
| Real Estate Taxes | $1,333 | $29 |
Property Value by Mortgage Status in Guyton
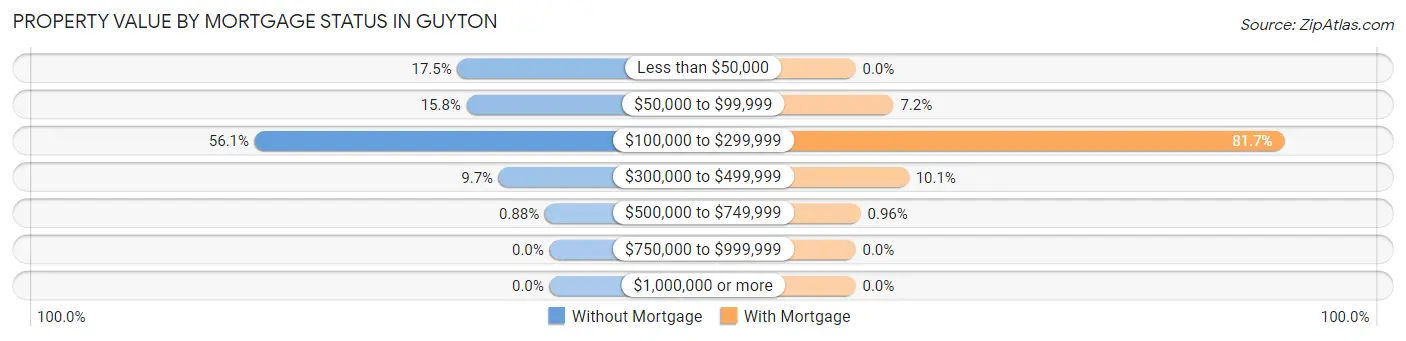
| Property Value | Without Mortgage | With Mortgage |
| Less than $50,000 | 20 (17.5%) | 0 (0.0%) |
| $50,000 to $99,999 | 18 (15.8%) | 30 (7.2%) |
| $100,000 to $299,999 | 64 (56.1%) | 339 (81.7%) |
| $300,000 to $499,999 | 11 (9.7%) | 42 (10.1%) |
| $500,000 to $749,999 | 1 (0.9%) | 4 (1.0%) |
| $750,000 to $999,999 | 0 (0.0%) | 0 (0.0%) |
| $1,000,000 or more | 0 (0.0%) | 0 (0.0%) |
| Total | 114 (100.0%) | 415 (100.0%) |
Household Income by Mortgage Status in Guyton
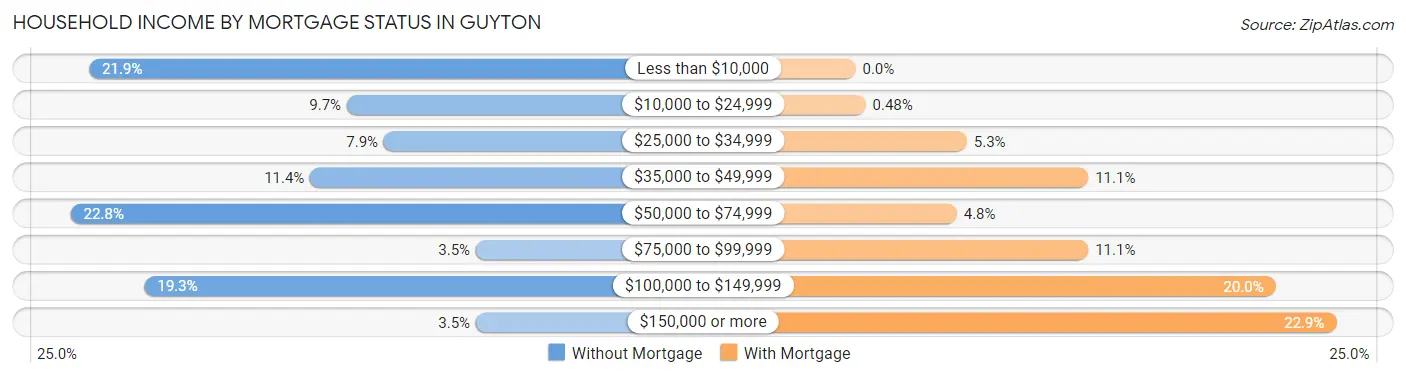
| Household Income | Without Mortgage | With Mortgage |
| Less than $10,000 | 25 (21.9%) | 0 (0.0%) |
| $10,000 to $24,999 | 11 (9.7%) | 2 (0.5%) |
| $25,000 to $34,999 | 9 (7.9%) | 22 (5.3%) |
| $35,000 to $49,999 | 13 (11.4%) | 46 (11.1%) |
| $50,000 to $74,999 | 26 (22.8%) | 20 (4.8%) |
| $75,000 to $99,999 | 4 (3.5%) | 46 (11.1%) |
| $100,000 to $149,999 | 22 (19.3%) | 83 (20.0%) |
| $150,000 or more | 4 (3.5%) | 95 (22.9%) |
| Total | 114 (100.0%) | 415 (100.0%) |
Property Value to Household Income Ratio in Guyton
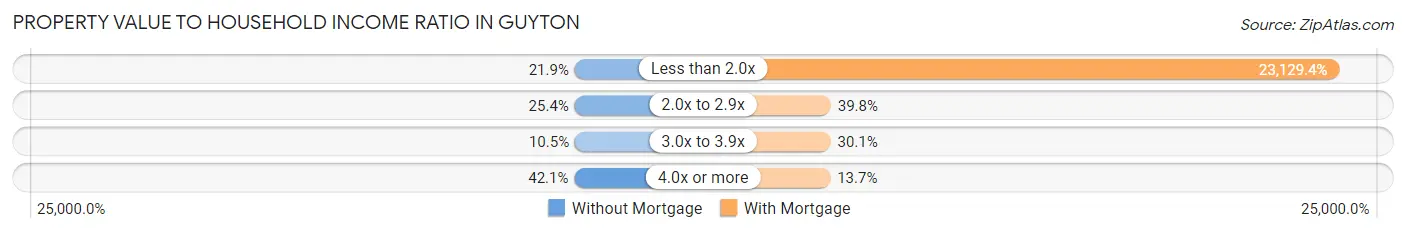
| Value-to-Income Ratio | Without Mortgage | With Mortgage |
| Less than 2.0x | 25 (21.9%) | 95,987 (23,129.4%) |
| 2.0x to 2.9x | 29 (25.4%) | 165 (39.8%) |
| 3.0x to 3.9x | 12 (10.5%) | 125 (30.1%) |
| 4.0x or more | 48 (42.1%) | 57 (13.7%) |
| Total | 114 (100.0%) | 415 (100.0%) |
Real Estate Taxes by Mortgage Status in Guyton
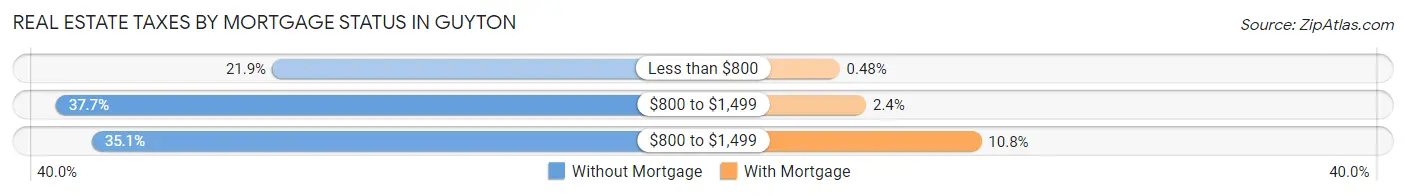
| Property Taxes | Without Mortgage | With Mortgage |
| Less than $800 | 25 (21.9%) | 2 (0.5%) |
| $800 to $1,499 | 43 (37.7%) | 10 (2.4%) |
| $800 to $1,499 | 40 (35.1%) | 45 (10.8%) |
| Total | 114 (100.0%) | 415 (100.0%) |
Health & Disability in Guyton
Health Insurance Coverage by Age in Guyton
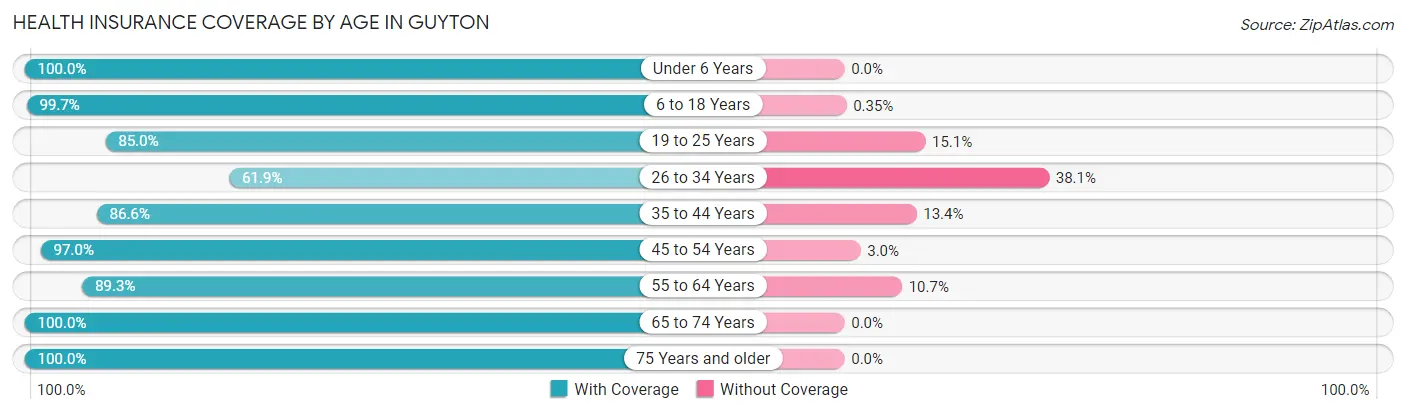
| Age Bracket | With Coverage | Without Coverage |
| Under 6 Years | 272 (100.0%) | 0 (0.0%) |
| 6 to 18 Years | 565 (99.7%) | 2 (0.4%) |
| 19 to 25 Years | 158 (85.0%) | 28 (15.0%) |
| 26 to 34 Years | 284 (61.9%) | 175 (38.1%) |
| 35 to 44 Years | 303 (86.6%) | 47 (13.4%) |
| 45 to 54 Years | 163 (97.0%) | 5 (3.0%) |
| 55 to 64 Years | 200 (89.3%) | 24 (10.7%) |
| 65 to 74 Years | 141 (100.0%) | 0 (0.0%) |
| 75 Years and older | 38 (100.0%) | 0 (0.0%) |
| Total | 2,124 (88.3%) | 281 (11.7%) |
Health Insurance Coverage by Citizenship Status in Guyton
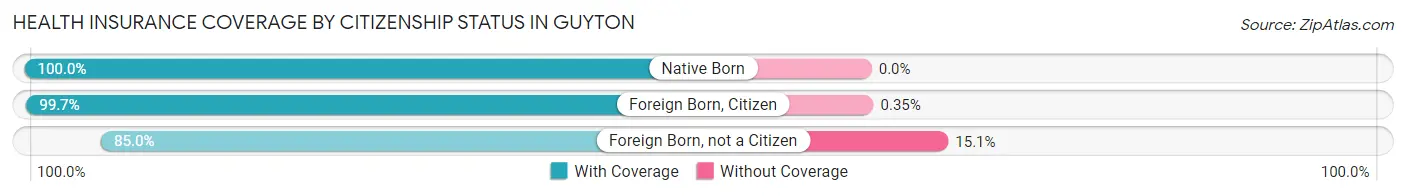
| Citizenship Status | With Coverage | Without Coverage |
| Native Born | 272 (100.0%) | 0 (0.0%) |
| Foreign Born, Citizen | 565 (99.7%) | 2 (0.4%) |
| Foreign Born, not a Citizen | 158 (85.0%) | 28 (15.0%) |
Health Insurance Coverage by Household Income in Guyton
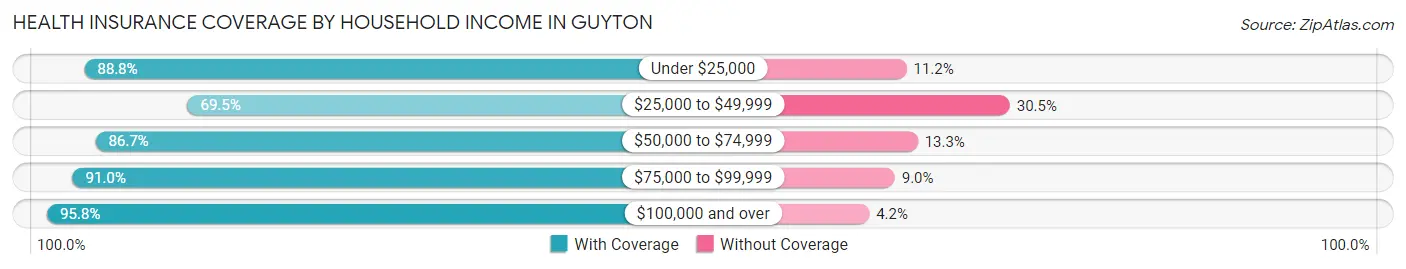
| Household Income | With Coverage | Without Coverage |
| Under $25,000 | 325 (88.8%) | 41 (11.2%) |
| $25,000 to $49,999 | 298 (69.5%) | 131 (30.5%) |
| $50,000 to $74,999 | 222 (86.7%) | 34 (13.3%) |
| $75,000 to $99,999 | 344 (91.0%) | 34 (9.0%) |
| $100,000 and over | 935 (95.8%) | 41 (4.2%) |
Public vs Private Health Insurance Coverage by Age in Guyton
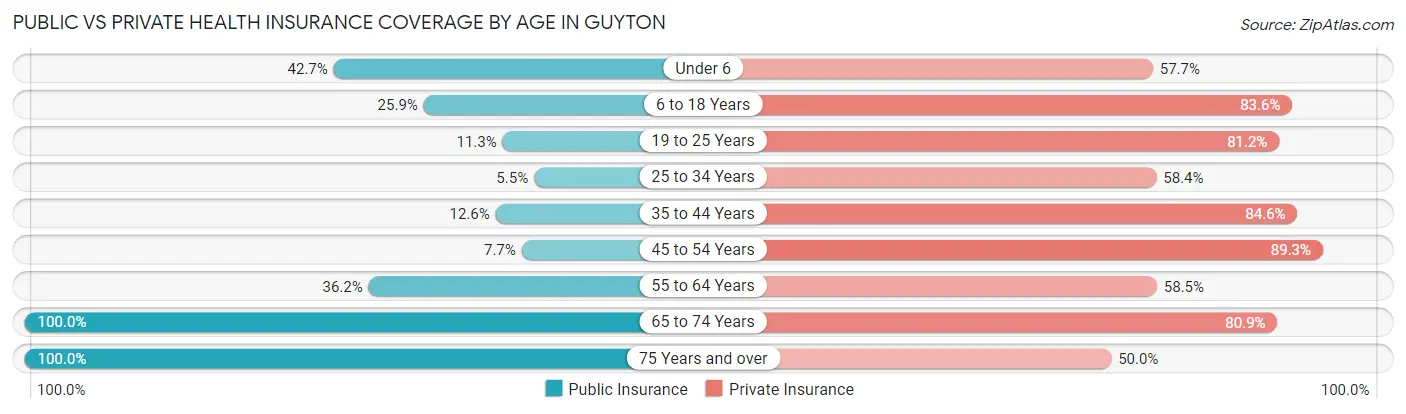
| Age Bracket | Public Insurance | Private Insurance |
| Under 6 | 116 (42.6%) | 157 (57.7%) |
| 6 to 18 Years | 147 (25.9%) | 474 (83.6%) |
| 19 to 25 Years | 21 (11.3%) | 151 (81.2%) |
| 25 to 34 Years | 25 (5.4%) | 268 (58.4%) |
| 35 to 44 Years | 44 (12.6%) | 296 (84.6%) |
| 45 to 54 Years | 13 (7.7%) | 150 (89.3%) |
| 55 to 64 Years | 81 (36.2%) | 131 (58.5%) |
| 65 to 74 Years | 141 (100.0%) | 114 (80.8%) |
| 75 Years and over | 38 (100.0%) | 19 (50.0%) |
| Total | 626 (26.0%) | 1,760 (73.2%) |
Disability Status by Sex by Age in Guyton
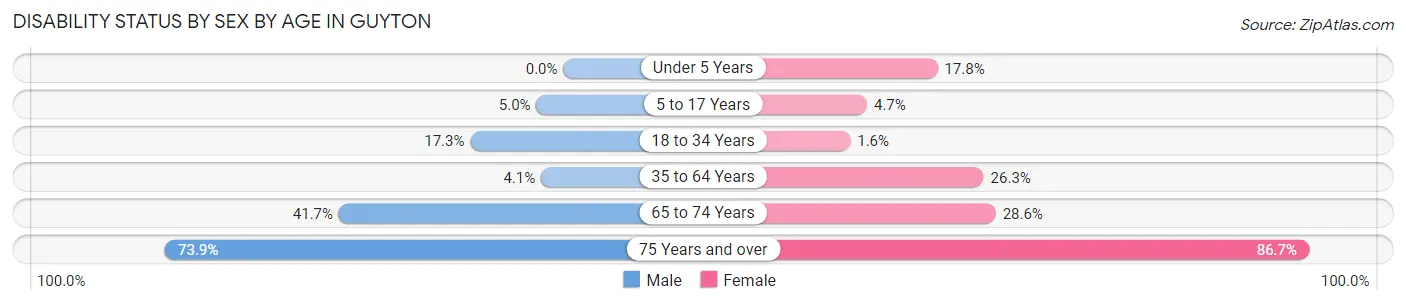
| Age Bracket | Male | Female |
| Under 5 Years | 0 (0.0%) | 27 (17.8%) |
| 5 to 17 Years | 11 (5.0%) | 16 (4.7%) |
| 18 to 34 Years | 48 (17.3%) | 6 (1.6%) |
| 35 to 64 Years | 12 (4.1%) | 119 (26.3%) |
| 65 to 74 Years | 15 (41.7%) | 30 (28.6%) |
| 75 Years and over | 17 (73.9%) | 13 (86.7%) |
Disability Class by Sex by Age in Guyton
Disability Class: Hearing Difficulty
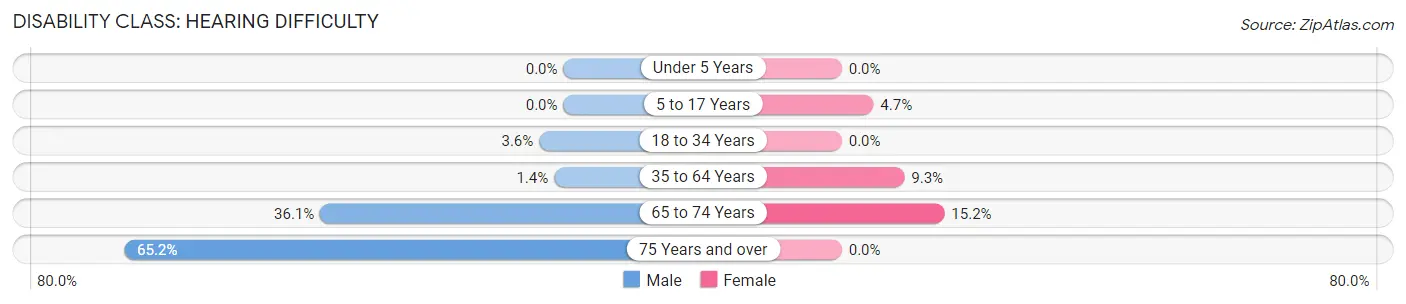
| Age Bracket | Male | Female |
| Under 5 Years | 0 (0.0%) | 0 (0.0%) |
| 5 to 17 Years | 0 (0.0%) | 16 (4.7%) |
| 18 to 34 Years | 10 (3.6%) | 0 (0.0%) |
| 35 to 64 Years | 4 (1.4%) | 42 (9.3%) |
| 65 to 74 Years | 13 (36.1%) | 16 (15.2%) |
| 75 Years and over | 15 (65.2%) | 0 (0.0%) |
Disability Class: Vision Difficulty
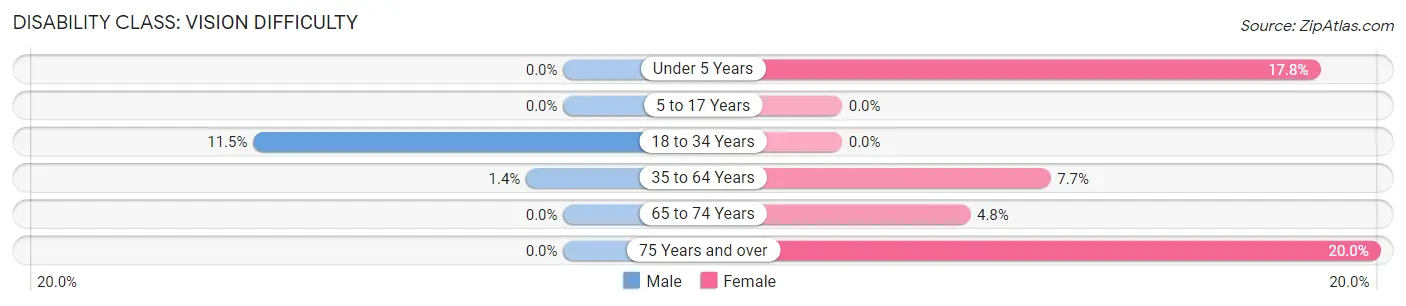
| Age Bracket | Male | Female |
| Under 5 Years | 0 (0.0%) | 27 (17.8%) |
| 5 to 17 Years | 0 (0.0%) | 0 (0.0%) |
| 18 to 34 Years | 32 (11.5%) | 0 (0.0%) |
| 35 to 64 Years | 4 (1.4%) | 35 (7.7%) |
| 65 to 74 Years | 0 (0.0%) | 5 (4.8%) |
| 75 Years and over | 0 (0.0%) | 3 (20.0%) |
Disability Class: Cognitive Difficulty
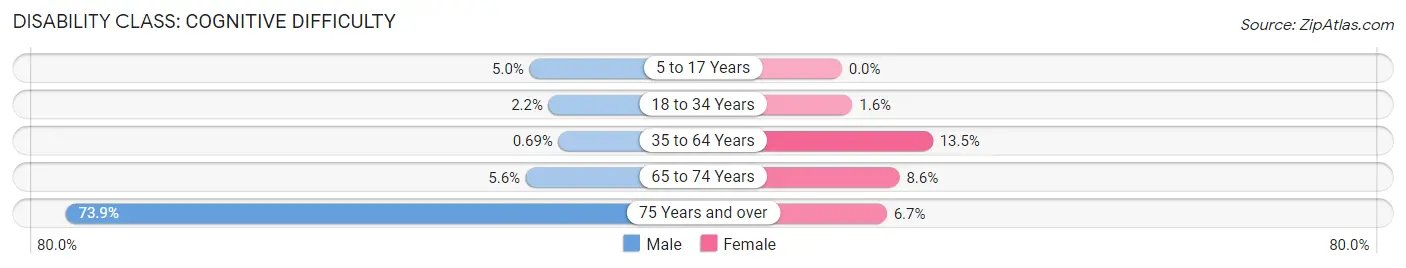
| Age Bracket | Male | Female |
| 5 to 17 Years | 11 (5.0%) | 0 (0.0%) |
| 18 to 34 Years | 6 (2.2%) | 6 (1.6%) |
| 35 to 64 Years | 2 (0.7%) | 61 (13.5%) |
| 65 to 74 Years | 2 (5.6%) | 9 (8.6%) |
| 75 Years and over | 17 (73.9%) | 1 (6.7%) |
Disability Class: Ambulatory Difficulty
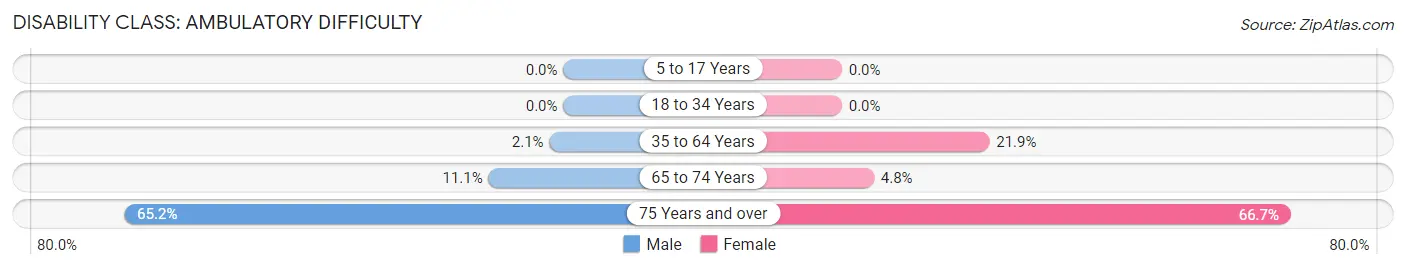
| Age Bracket | Male | Female |
| 5 to 17 Years | 0 (0.0%) | 0 (0.0%) |
| 18 to 34 Years | 0 (0.0%) | 0 (0.0%) |
| 35 to 64 Years | 6 (2.1%) | 99 (21.9%) |
| 65 to 74 Years | 4 (11.1%) | 5 (4.8%) |
| 75 Years and over | 15 (65.2%) | 10 (66.7%) |
Disability Class: Self-Care Difficulty
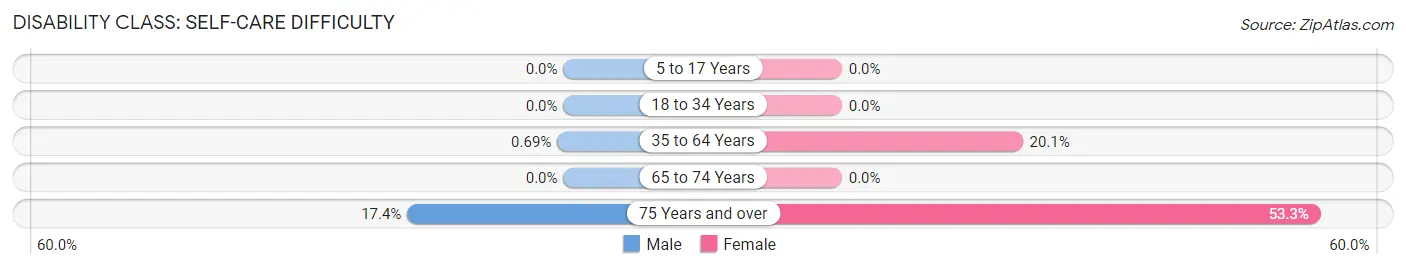
| Age Bracket | Male | Female |
| 5 to 17 Years | 0 (0.0%) | 0 (0.0%) |
| 18 to 34 Years | 0 (0.0%) | 0 (0.0%) |
| 35 to 64 Years | 2 (0.7%) | 91 (20.1%) |
| 65 to 74 Years | 0 (0.0%) | 0 (0.0%) |
| 75 Years and over | 4 (17.4%) | 8 (53.3%) |
Technology Access in Guyton
Computing Device Access in Guyton
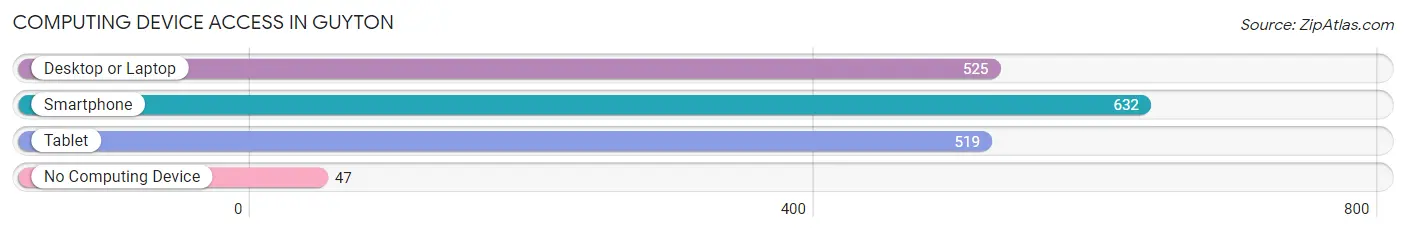
| Device Type | # Households | % Households |
| Desktop or Laptop | 525 | 75.2% |
| Smartphone | 632 | 90.5% |
| Tablet | 519 | 74.4% |
| No Computing Device | 47 | 6.7% |
| Total | 698 | 100.0% |
Internet Access in Guyton
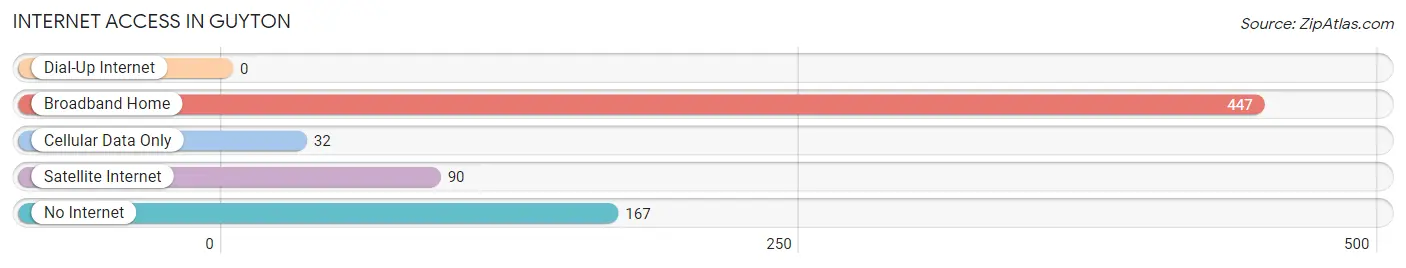
| Internet Type | # Households | % Households |
| Dial-Up Internet | 0 | 0.0% |
| Broadband Home | 447 | 64.0% |
| Cellular Data Only | 32 | 4.6% |
| Satellite Internet | 90 | 12.9% |
| No Internet | 167 | 23.9% |
| Total | 698 | 100.0% |
Guyton Summary
Guyton, Georgia is a small city located in Effingham County, Georgia. It is situated about 20 miles northwest of Savannah and is part of the Savannah Metropolitan Statistical Area. The city has a population of 2,717 people, according to the 2010 census.
Geography
Guyton is located in the southeastern corner of Effingham County, Georgia. It is situated on the banks of the Little Ogeechee River, which flows through the city. The city is bordered by the cities of Rincon to the north, Springfield to the east, and Eden to the south. The city is located in the Coastal Plain region of Georgia, and the terrain is mostly flat. The average elevation of Guyton is approximately 100 feet above sea level.
History
Guyton was founded in 1883 by William Guyton, a former Confederate soldier. The city was named after him, and he served as the first mayor of the city. The city was incorporated in 1891.
In the early 1900s, Guyton was a thriving agricultural community. The city was known for its production of cotton, corn, and other crops. The city also had a thriving lumber industry, and the city was home to several sawmills.
In the 1950s, Guyton began to experience a decline in its agricultural industry. The city began to focus more on its industrial sector, and several factories were built in the city. The city also began to attract more businesses and residents.
Economy
Guyton’s economy is largely based on manufacturing and retail. The city is home to several factories, including a paper mill, a plastics plant, and a furniture factory. The city also has several retail stores, including a Walmart Supercenter.
The city also has a thriving tourism industry. The city is home to several attractions, including the Guyton Historic District, the Guyton Museum, and the Guyton Nature Trail.
Demographics
According to the 2010 census, Guyton has a population of 2,717 people. The racial makeup of the city is 79.3% White, 16.2% African American, 0.7% Native American, 0.7% Asian, 0.1% Pacific Islander, 1.2% from other races, and 1.9% from two or more races. The median household income in Guyton is $41,944, and the median age is 37.
Conclusion
Guyton, Georgia is a small city located in Effingham County, Georgia. It is situated on the banks of the Little Ogeechee River and is part of the Savannah Metropolitan Statistical Area. The city has a population of 2,717 people, according to the 2010 census. Guyton’s economy is largely based on manufacturing and retail, and the city is home to several attractions, including the Guyton Historic District, the Guyton Museum, and the Guyton Nature Trail. The racial makeup of the city is 79.3% White, 16.2% African American, 0.7% Native American, 0.7% Asian, 0.1% Pacific Islander, 1.2% from other races, and 1.9% from two or more races. The median household income in Guyton is $41,944, and the median age is 37.
Common Questions
What is the Total Population of Guyton?
Total Population of Guyton is 2,405.
What is the Total Male Population of Guyton?
Total Male Population of Guyton is 957.
What is the Total Female Population of Guyton?
Total Female Population of Guyton is 1,448.
What is the Ratio of Males per 100 Females in Guyton?
There are 66.09 Males per 100 Females in Guyton.
What is the Ratio of Females per 100 Males in Guyton?
There are 151.31 Females per 100 Males in Guyton.
What is the Median Population Age in Guyton?
Median Population Age in Guyton is 30.4 Years.
What is the Average Family Size in Guyton
Average Family Size in Guyton is 4.1 People.
What is the Average Household Size in Guyton
Average Household Size in Guyton is 3.5 People.
What is Per Capita Income in Guyton?
Per Capita income in Guyton is $25,405.
What is the Median Family Income in Guyton?
Median Family Income in Guyton is $90,197.
What is the Median Household income in Guyton?
Median Household Income in Guyton is $75,625.
What is Income or Wage Gap in Guyton?
Income or Wage Gap in Guyton is 27.7%.
Women in Guyton earn 72.3 cents for every dollar earned by a man.
What is Inequality or Gini Index in Guyton?
Inequality or Gini Index in Guyton is 0.42.
How Large is the Labor Force in Guyton?
There are 1,157 People in the Labor Forcein in Guyton.
What is the Percentage of People in the Labor Force in Guyton?
67.8% of People are in the Labor Force in Guyton.
What is the Unemployment Rate in Guyton?
Unemployment Rate in Guyton is 16.3%.