Graham, GA
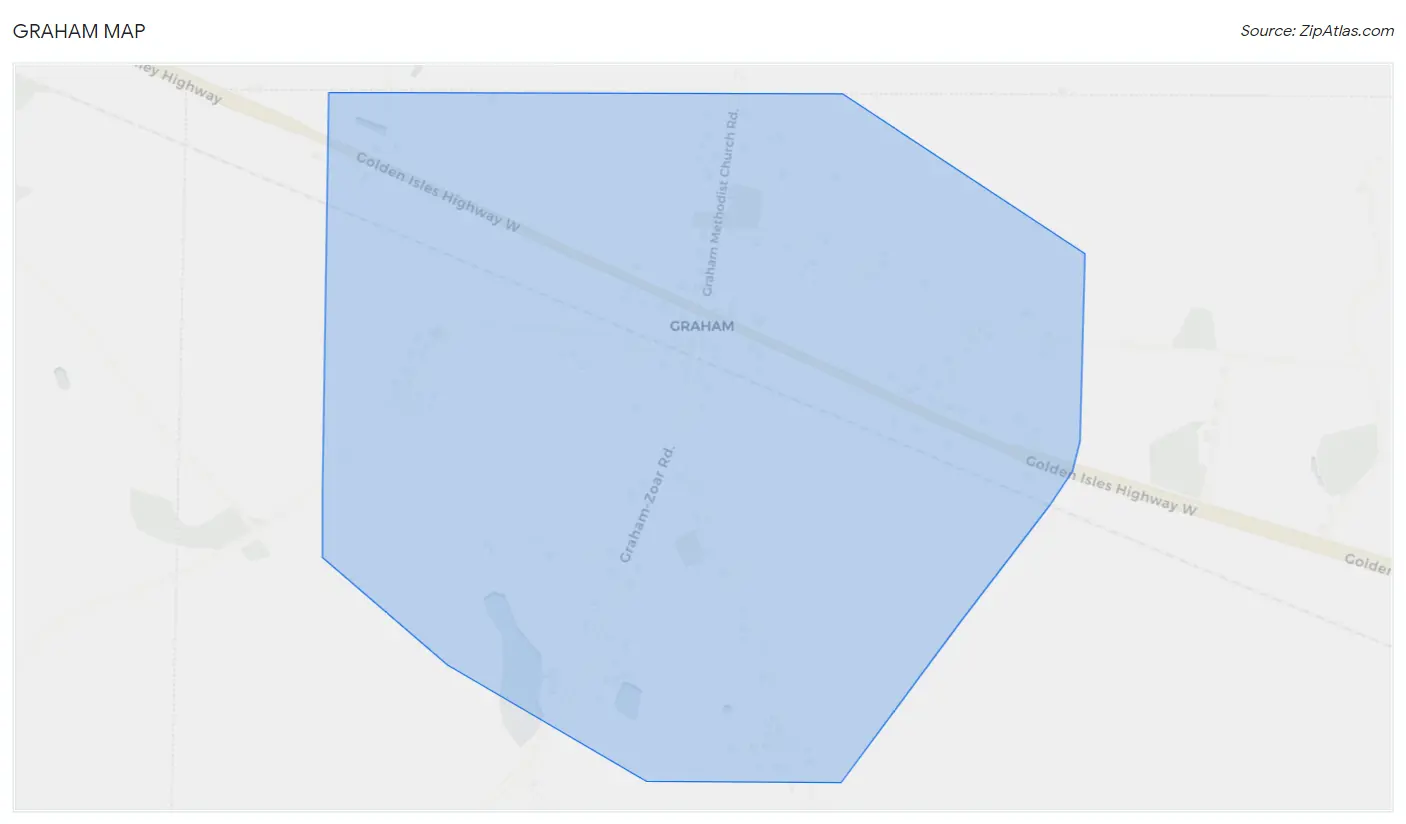
Graham Map
Graham Overview
672
TOTAL POPULATION
307
MALE POPULATION
365
FEMALE POPULATION
84.11
MALES / 100 FEMALES
118.89
FEMALES / 100 MALES
17.5
MEDIAN AGE
6.4
AVG FAMILY SIZE
5.3
AVG HOUSEHOLD SIZE
$9,941
PER CAPITA INCOME
$39,306
AVG FAMILY INCOME
$32,222
AVG HOUSEHOLD INCOME
$11,664
FAMILY INCOME DEFICIT
0.47
INEQUALITY / GINI INDEX
134
LABOR FORCE [ PEOPLE ]
33.9%
PERCENT IN LABOR FORCE
7.5%
UNEMPLOYMENT RATE
Race in Graham
The most populous races in Graham are Black / African American (501 | 74.6%), White / Caucasian (166 | 24.7%), and Hispanic or Latino (7 | 1.0%).
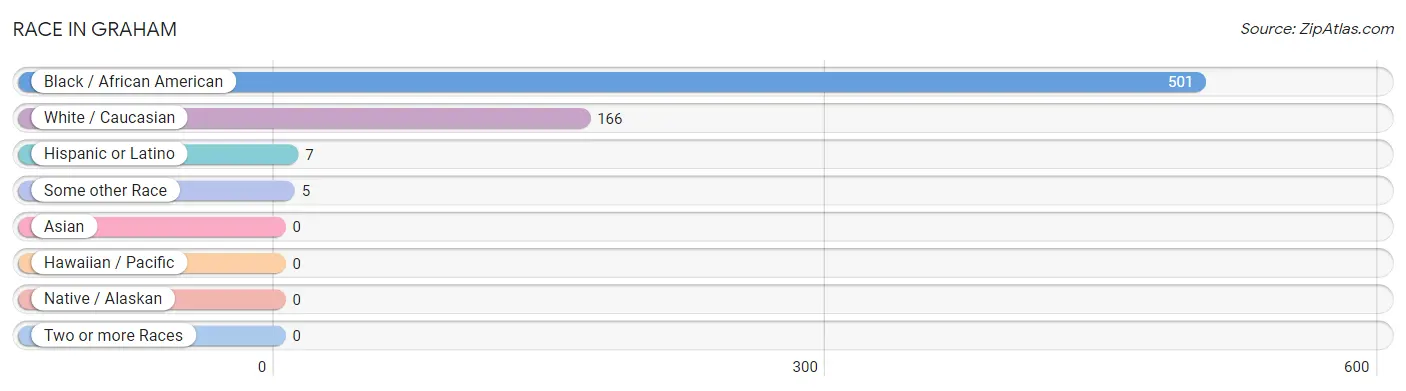
| Race | # Population | % Population |
| Asian | 0 | 0.0% |
| Black / African American | 501 | 74.6% |
| Hawaiian / Pacific | 0 | 0.0% |
| Hispanic or Latino | 7 | 1.0% |
| Native / Alaskan | 0 | 0.0% |
| White / Caucasian | 166 | 24.7% |
| Two or more Races | 0 | 0.0% |
| Some other Race | 5 | 0.7% |
| Total | 672 | 100.0% |
Ancestry in Graham
The most populous ancestries reported in Graham are American (14 | 2.1%), English (9 | 1.3%), German (8 | 1.2%), Mexican (7 | 1.0%), and British (3 | 0.4%), together accounting for 6.1% of all Graham residents.
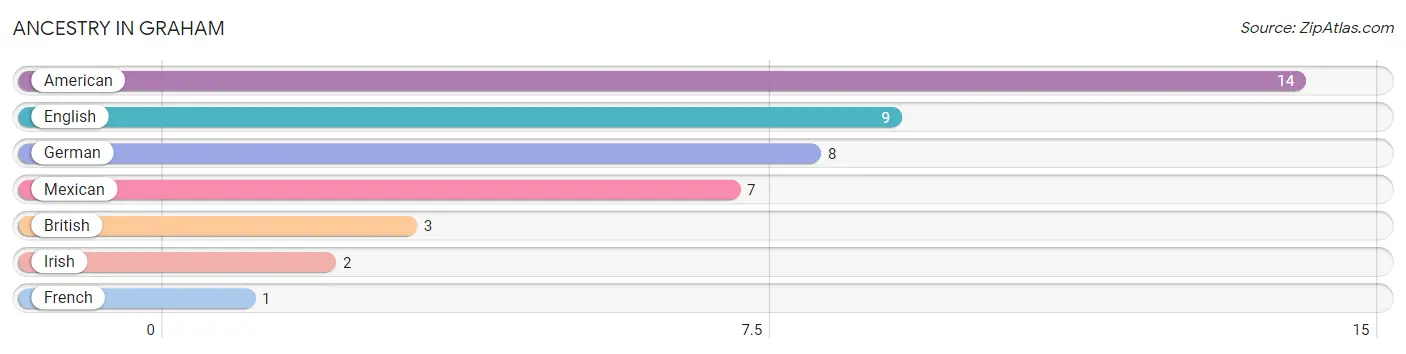
| Ancestry | # Population | % Population |
| American | 14 | 2.1% |
| British | 3 | 0.4% |
| English | 9 | 1.3% |
| French | 1 | 0.2% |
| German | 8 | 1.2% |
| Irish | 2 | 0.3% |
| Mexican | 7 | 1.0% | View All 7 Rows |
Immigrants in Graham
The most numerous immigrant groups reported in Graham came from Latin America (4 | 0.6%), Central America (3 | 0.4%), Mexico (3 | 0.4%), Caribbean (1 | 0.2%), and Cuba (1 | 0.2%), together accounting for 1.8% of all Graham residents.
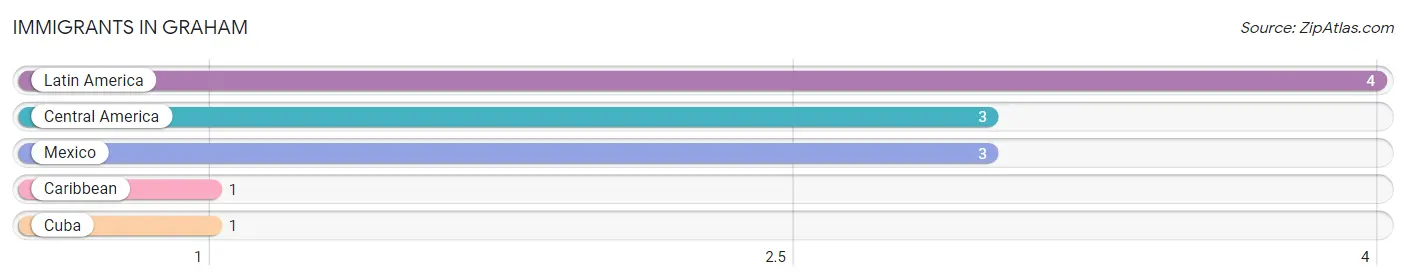
| Immigration Origin | # Population | % Population |
| Caribbean | 1 | 0.2% |
| Central America | 3 | 0.4% |
| Cuba | 1 | 0.2% |
| Latin America | 4 | 0.6% |
| Mexico | 3 | 0.4% | View All 5 Rows |
Sex and Age in Graham
Sex and Age in Graham
The most populous age groups in Graham are 5 to 9 Years (143 | 46.6%) for men and 10 to 14 Years (132 | 36.2%) for women.
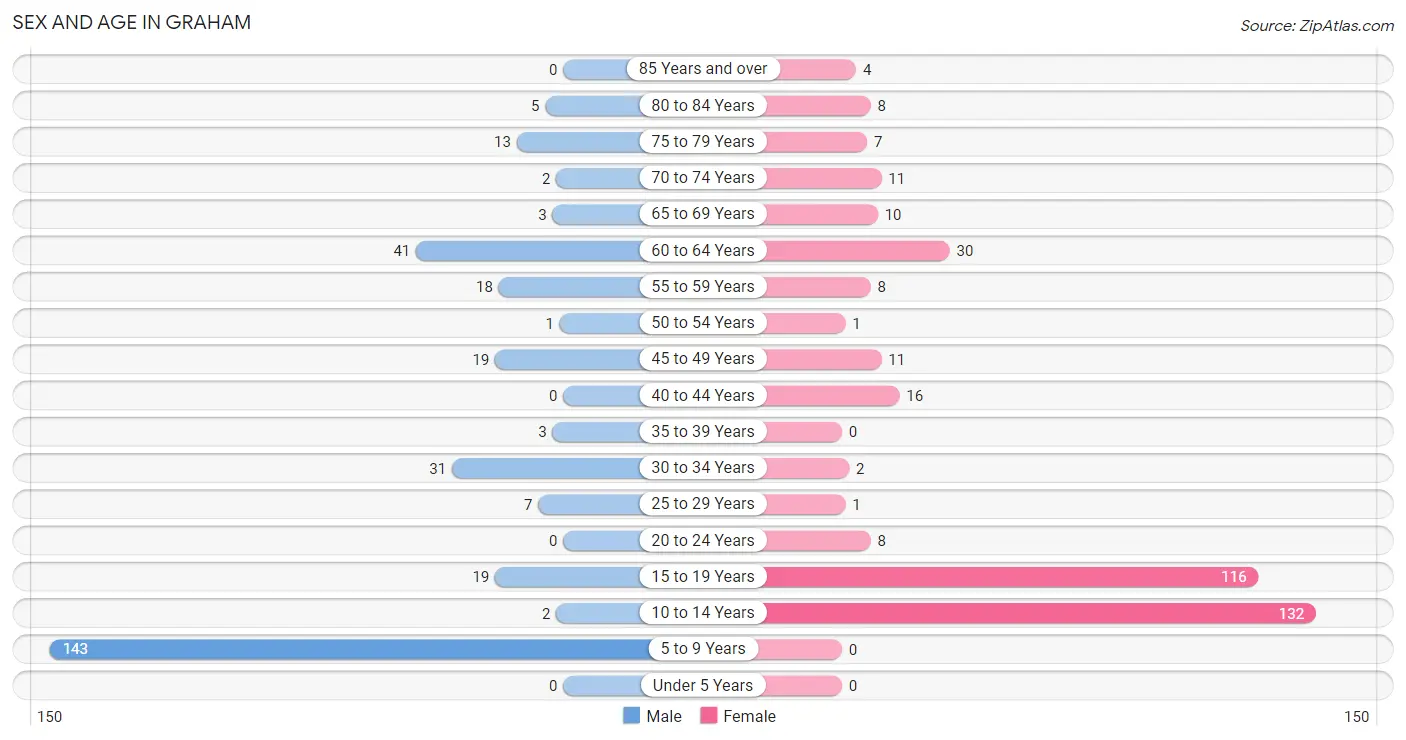
| Age Bracket | Male | Female |
| Under 5 Years | 0 (0.0%) | 0 (0.0%) |
| 5 to 9 Years | 143 (46.6%) | 0 (0.0%) |
| 10 to 14 Years | 2 (0.6%) | 132 (36.2%) |
| 15 to 19 Years | 19 (6.2%) | 116 (31.8%) |
| 20 to 24 Years | 0 (0.0%) | 8 (2.2%) |
| 25 to 29 Years | 7 (2.3%) | 1 (0.3%) |
| 30 to 34 Years | 31 (10.1%) | 2 (0.5%) |
| 35 to 39 Years | 3 (1.0%) | 0 (0.0%) |
| 40 to 44 Years | 0 (0.0%) | 16 (4.4%) |
| 45 to 49 Years | 19 (6.2%) | 11 (3.0%) |
| 50 to 54 Years | 1 (0.3%) | 1 (0.3%) |
| 55 to 59 Years | 18 (5.9%) | 8 (2.2%) |
| 60 to 64 Years | 41 (13.4%) | 30 (8.2%) |
| 65 to 69 Years | 3 (1.0%) | 10 (2.7%) |
| 70 to 74 Years | 2 (0.6%) | 11 (3.0%) |
| 75 to 79 Years | 13 (4.2%) | 7 (1.9%) |
| 80 to 84 Years | 5 (1.6%) | 8 (2.2%) |
| 85 Years and over | 0 (0.0%) | 4 (1.1%) |
| Total | 307 (100.0%) | 365 (100.0%) |
Families and Households in Graham
Median Family Size in Graham
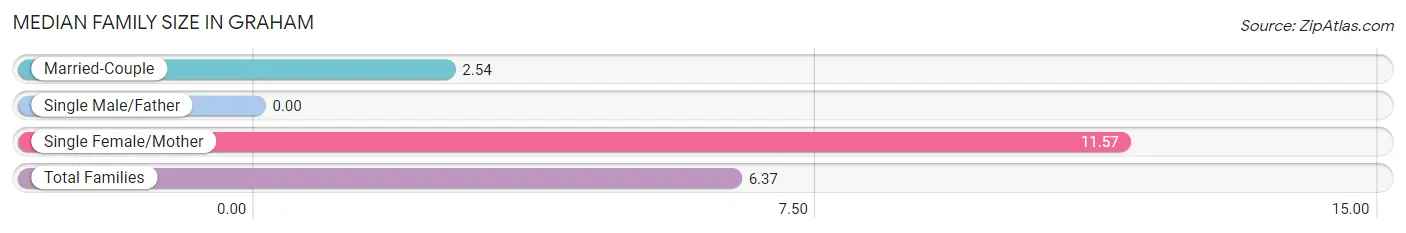
| Family Type | # Families | Family Size |
| Married-Couple | 57 (57.6%) | 2.54 |
| Single Male/Father | 0 (0.0%) | - |
| Single Female/Mother | 42 (42.4%) | 11.57 |
| Total Families | 99 (100.0%) | 6.37 |
Median Household Size in Graham
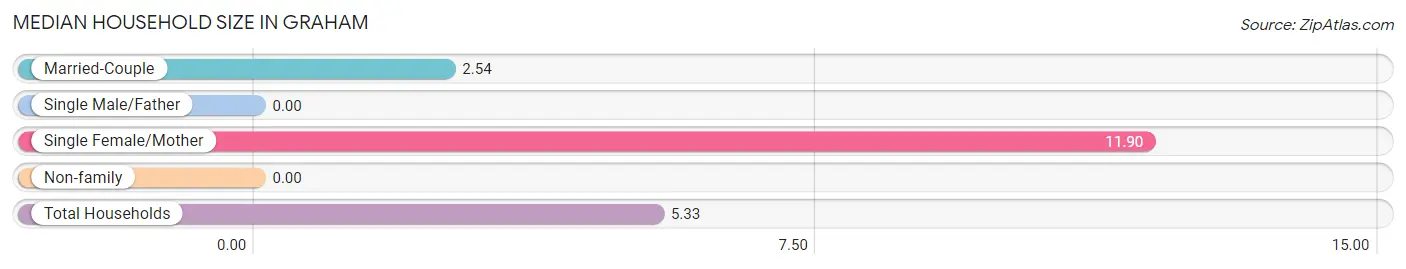
| Household Type | # Households | Household Size |
| Married-Couple | 57 (45.2%) | 2.54 |
| Single Male/Father | 0 (0.0%) | - |
| Single Female/Mother | 42 (33.3%) | 11.90 |
| Non-family | 27 (21.4%) | - |
| Total Households | 126 (100.0%) | 5.33 |
Household Size by Marriage Status in Graham
Out of a total of 126 households in Graham, 99 (78.6%) are family households, while 27 (21.4%) are nonfamily households. The most numerous type of family households are 2-person households, comprising 42, and the most common type of nonfamily households are 1-person households, comprising 27.
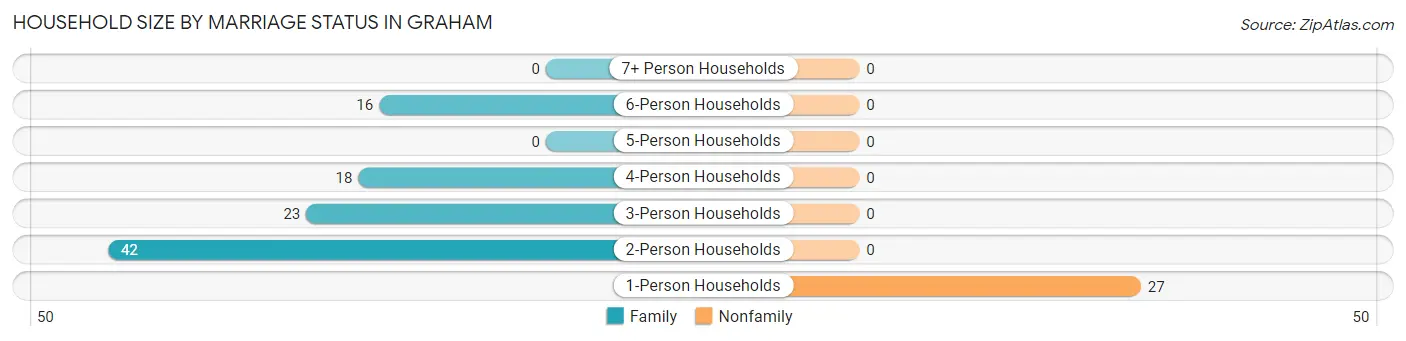
| Household Size | Family Households | Nonfamily Households |
| 1-Person Households | - | 27 (21.4%) |
| 2-Person Households | 42 (33.3%) | 0 (0.0%) |
| 3-Person Households | 23 (18.2%) | 0 (0.0%) |
| 4-Person Households | 18 (14.3%) | 0 (0.0%) |
| 5-Person Households | 0 (0.0%) | 0 (0.0%) |
| 6-Person Households | 16 (12.7%) | 0 (0.0%) |
| 7+ Person Households | 0 (0.0%) | 0 (0.0%) |
| Total | 99 (78.6%) | 27 (21.4%) |
Female Fertility in Graham
Fertility by Age in Graham
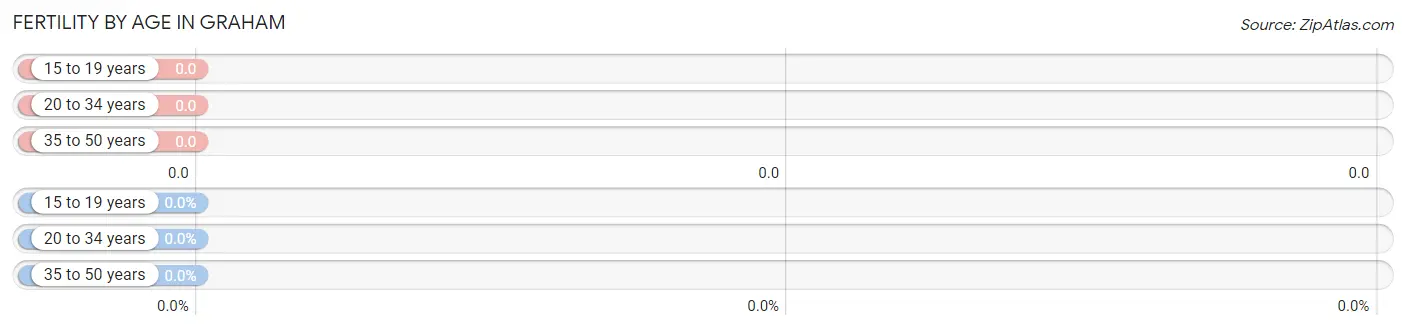
| Age Bracket | Women with Births | Births / 1,000 Women |
| 15 to 19 years | 0 (0.0%) | 0.0 |
| 20 to 34 years | 0 (0.0%) | 0.0 |
| 35 to 50 years | 0 (0.0%) | 0.0 |
| Total | 0 (0.0%) | 0.0 |
Fertility by Age by Marriage Status in Graham
| Age Bracket | Married | Unmarried |
| 15 to 19 years | 0 (0.0%) | 0 (0.0%) |
| 20 to 34 years | 0 (0.0%) | 0 (0.0%) |
| 35 to 50 years | 0 (0.0%) | 0 (0.0%) |
| Total | 0 (0.0%) | 0 (0.0%) |
Fertility by Education in Graham
| Educational Attainment | Women with Births | Births / 1,000 Women |
| Less than High School | 0 (0.0%) | 0.0 |
| High School Diploma | 0 (0.0%) | 0.0 |
| College or Associate's Degree | 0 (0.0%) | 0.0 |
| Bachelor's Degree | 0 (0.0%) | 0.0 |
| Graduate Degree | 0 (0.0%) | 0.0 |
| Total | 0 (0.0%) | 0.0 |
Fertility by Education by Marriage Status in Graham
| Educational Attainment | Married | Unmarried |
| Less than High School | 0 (0.0%) | 0 (0.0%) |
| High School Diploma | 0 (0.0%) | 0 (0.0%) |
| College or Associate's Degree | 0 (0.0%) | 0 (0.0%) |
| Bachelor's Degree | 0 (0.0%) | 0 (0.0%) |
| Graduate Degree | 0 (0.0%) | 0 (0.0%) |
| Total | 0 (0.0%) | 0 (0.0%) |
Income in Graham
Income Overview in Graham
Per Capita Income in Graham is $9,941, while median incomes of families and households are $39,306 and $32,222 respectively.
| Characteristic | Number | Measure |
| Per Capita Income | 672 | $9,941 |
| Median Family Income | 99 | $39,306 |
| Mean Family Income | 99 | $57,767 |
| Median Household Income | 126 | $32,222 |
| Mean Household Income | 126 | $50,446 |
| Income Deficit | 99 | $11,664 |
| Wage / Income Gap (%) | 672 | 0.00% |
| Wage / Income Gap ($) | 672 | 100.00¢ per $1 |
| Gini / Inequality Index | 672 | 0.47 |
Earnings by Sex in Graham
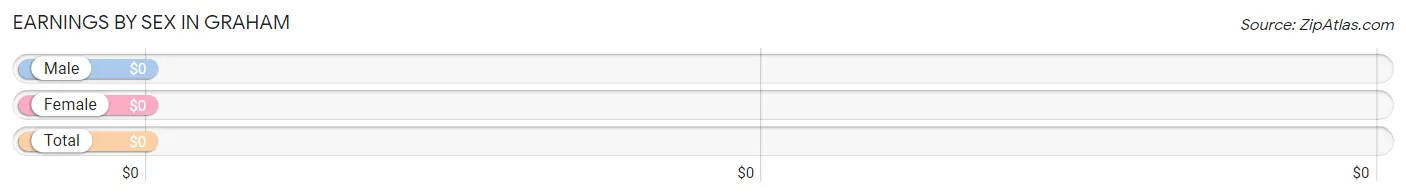
| Sex | Number | Average Earnings |
| Male | 81 (62.3%) | $0 |
| Female | 49 (37.7%) | $0 |
| Total | 130 (100.0%) | $0 |
Earnings by Sex by Income Bracket in Graham
The most common earnings brackets in Graham are $10,000 to $12,499 for men (31 | 38.3%) and $10,000 to $12,499 for women (12 | 24.5%).
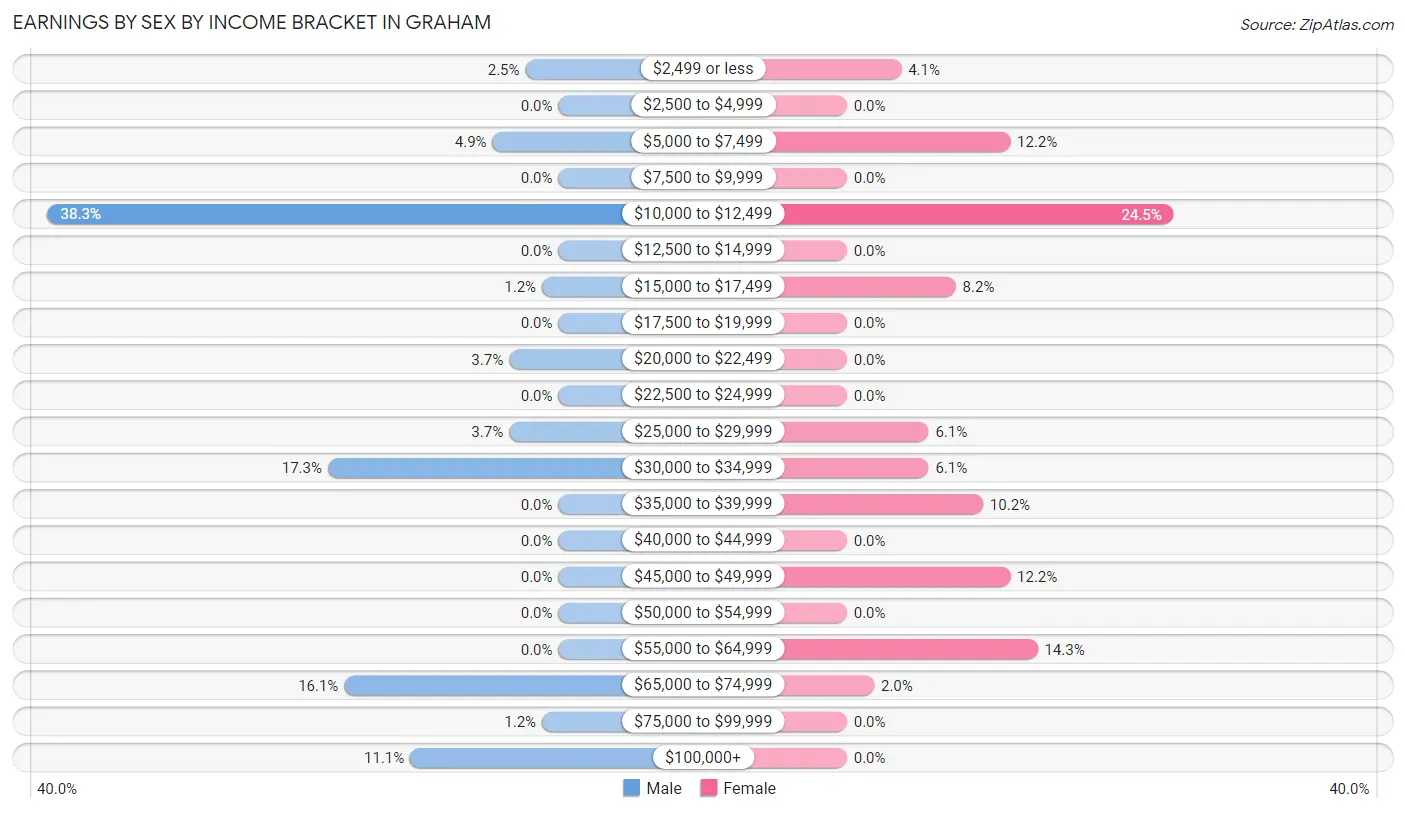
| Income | Male | Female |
| $2,499 or less | 2 (2.5%) | 2 (4.1%) |
| $2,500 to $4,999 | 0 (0.0%) | 0 (0.0%) |
| $5,000 to $7,499 | 4 (4.9%) | 6 (12.2%) |
| $7,500 to $9,999 | 0 (0.0%) | 0 (0.0%) |
| $10,000 to $12,499 | 31 (38.3%) | 12 (24.5%) |
| $12,500 to $14,999 | 0 (0.0%) | 0 (0.0%) |
| $15,000 to $17,499 | 1 (1.2%) | 4 (8.2%) |
| $17,500 to $19,999 | 0 (0.0%) | 0 (0.0%) |
| $20,000 to $22,499 | 3 (3.7%) | 0 (0.0%) |
| $22,500 to $24,999 | 0 (0.0%) | 0 (0.0%) |
| $25,000 to $29,999 | 3 (3.7%) | 3 (6.1%) |
| $30,000 to $34,999 | 14 (17.3%) | 3 (6.1%) |
| $35,000 to $39,999 | 0 (0.0%) | 5 (10.2%) |
| $40,000 to $44,999 | 0 (0.0%) | 0 (0.0%) |
| $45,000 to $49,999 | 0 (0.0%) | 6 (12.2%) |
| $50,000 to $54,999 | 0 (0.0%) | 0 (0.0%) |
| $55,000 to $64,999 | 0 (0.0%) | 7 (14.3%) |
| $65,000 to $74,999 | 13 (16.1%) | 1 (2.0%) |
| $75,000 to $99,999 | 1 (1.2%) | 0 (0.0%) |
| $100,000+ | 9 (11.1%) | 0 (0.0%) |
| Total | 81 (100.0%) | 49 (100.0%) |
Earnings by Sex by Educational Attainment in Graham
| Educational Attainment | Male Income | Female Income |
| Less than High School | - | - |
| High School Diploma | - | - |
| College or Associate's Degree | - | - |
| Bachelor's Degree | - | - |
| Graduate Degree | - | - |
| Total | - | - |
Family Income in Graham
Family Income Brackets in Graham
According to the Graham family income data, there are 29 families falling into the $15,000 to $24,999 income range, which is the most common income bracket and makes up 29.3% of all families.
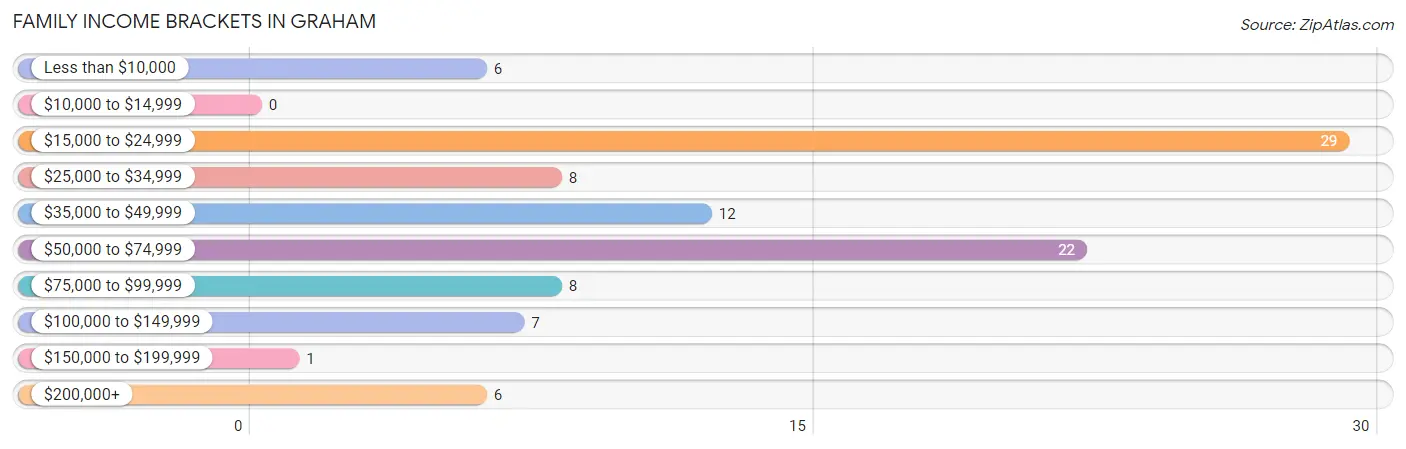
| Income Bracket | # Families | % Families |
| Less than $10,000 | 6 | 6.1% |
| $10,000 to $14,999 | 0 | 0.0% |
| $15,000 to $24,999 | 29 | 29.3% |
| $25,000 to $34,999 | 8 | 8.1% |
| $35,000 to $49,999 | 12 | 12.1% |
| $50,000 to $74,999 | 22 | 22.2% |
| $75,000 to $99,999 | 8 | 8.1% |
| $100,000 to $149,999 | 7 | 7.1% |
| $150,000 to $199,999 | 1 | 1.0% |
| $200,000+ | 6 | 6.1% |
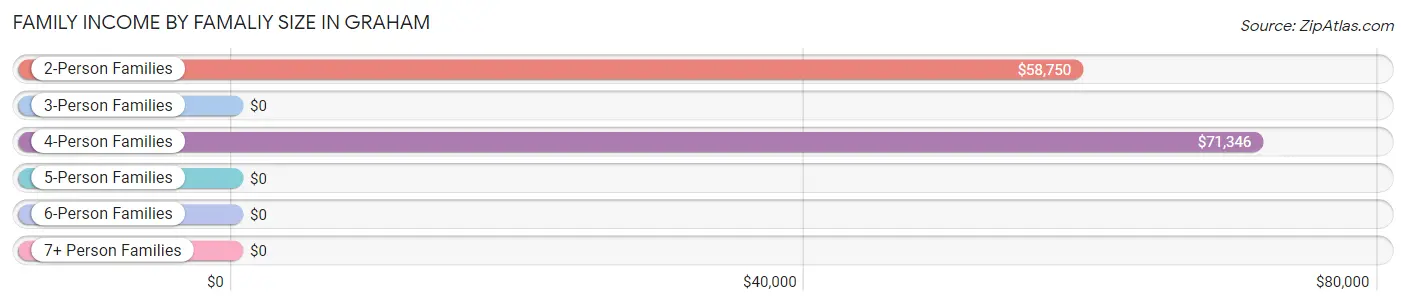
Family Income by Famaliy Size in Graham
4-person families (18 | 18.2%) account for the highest median family income in Graham with $71,346 per family, while 2-person families (42 | 42.4%) have the highest median income of $29,375 per family member.
| Income Bracket | # Families | Median Income |
| 2-Person Families | 42 (42.4%) | $58,750 |
| 3-Person Families | 23 (23.2%) | $0 |
| 4-Person Families | 18 (18.2%) | $71,346 |
| 5-Person Families | 16 (16.2%) | $0 |
| 6-Person Families | 0 (0.0%) | $0 |
| 7+ Person Families | 0 (0.0%) | $0 |
| Total | 99 (100.0%) | $39,306 |
Family Income by Number of Earners in Graham
| Number of Earners | # Families | Median Income |
| No Earners | 36 (36.4%) | $0 |
| 1 Earner | 38 (38.4%) | $0 |
| 2 Earners | 21 (21.2%) | $0 |
| 3+ Earners | 4 (4.0%) | $0 |
| Total | 99 (100.0%) | $39,306 |
Household Income in Graham
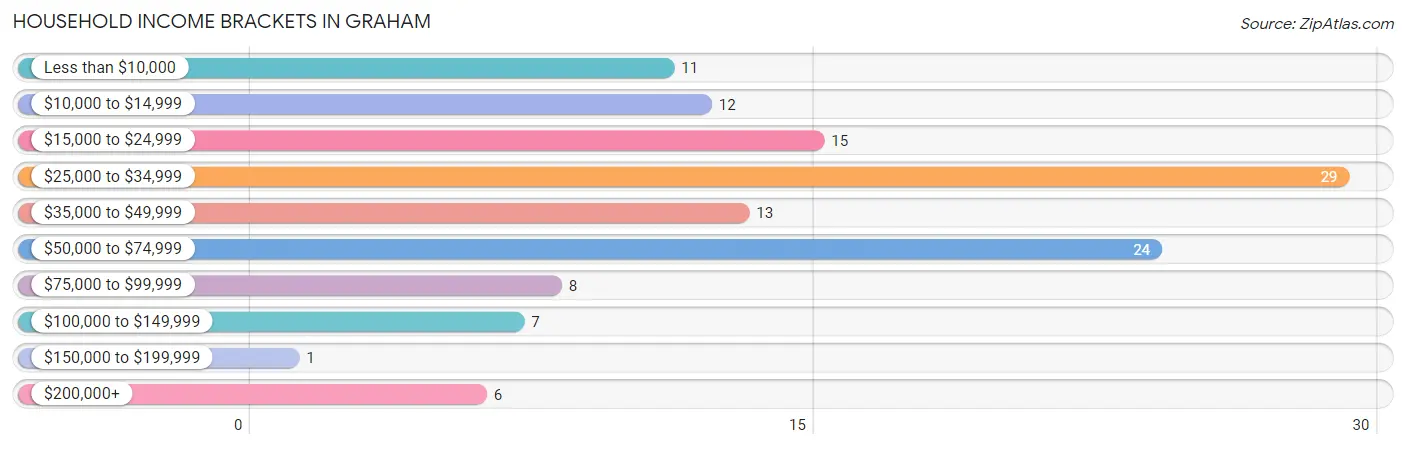
Household Income Brackets in Graham
With 29 households falling in the category, the $25,000 to $34,999 income range is the most frequent in Graham, accounting for 23.0% of all households. In contrast, only 1 households (0.8%) fall into the $150,000 to $199,999 income bracket, making it the least populous group.
| Income Bracket | # Households | % Households |
| Less than $10,000 | 11 | 8.7% |
| $10,000 to $14,999 | 12 | 9.5% |
| $15,000 to $24,999 | 15 | 11.9% |
| $25,000 to $34,999 | 29 | 23.0% |
| $35,000 to $49,999 | 13 | 10.3% |
| $50,000 to $74,999 | 24 | 19.0% |
| $75,000 to $99,999 | 8 | 6.3% |
| $100,000 to $149,999 | 7 | 5.6% |
| $150,000 to $199,999 | 1 | 0.8% |
| $200,000+ | 6 | 4.8% |
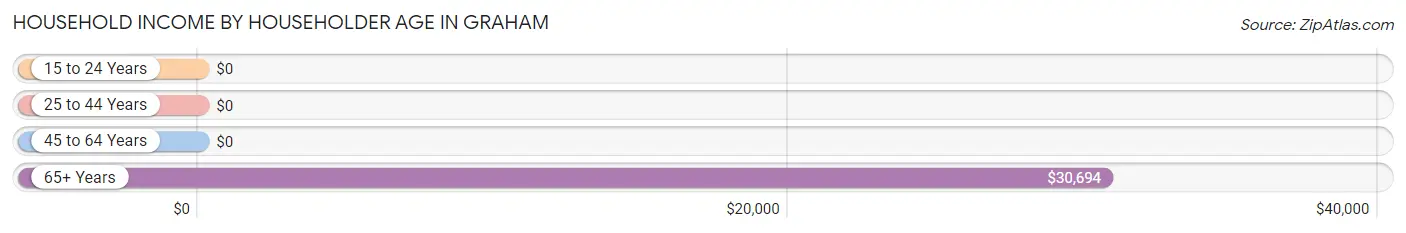
Household Income by Householder Age in Graham
The median household income in Graham is $32,222, with the highest median household income of $30,694 found in the 65+ years age bracket for the primary householder. A total of 43 households (34.1%) fall into this category.
| Income Bracket | # Households | Median Income |
| 15 to 24 Years | 0 (0.0%) | $0 |
| 25 to 44 Years | 18 (14.3%) | $0 |
| 45 to 64 Years | 65 (51.6%) | $0 |
| 65+ Years | 43 (34.1%) | $30,694 |
| Total | 126 (100.0%) | $32,222 |
Poverty in Graham
Income Below Poverty by Sex and Age in Graham
With 61.6% poverty level for males and 75.9% for females among the residents of Graham, 6 to 11 year old males and 6 to 11 year old females are the most vulnerable to poverty, with 143 males (100.0%) and 120 females (98.4%) in their respective age groups living below the poverty level.
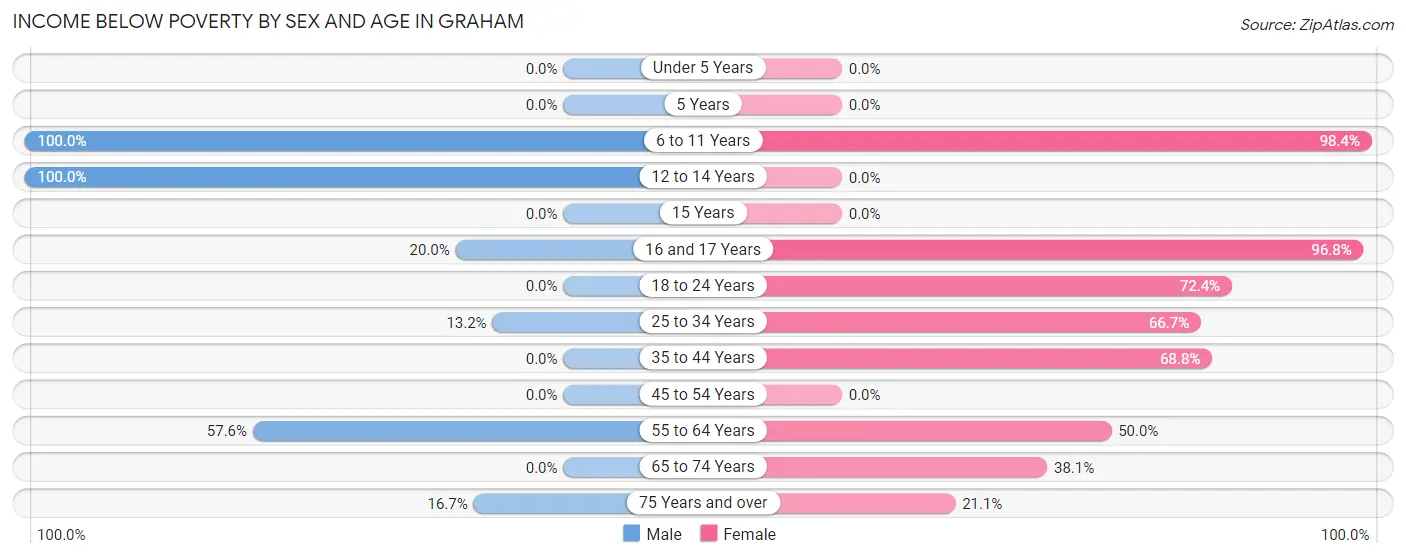
| Age Bracket | Male | Female |
| Under 5 Years | 0 (0.0%) | 0 (0.0%) |
| 5 Years | 0 (0.0%) | 0 (0.0%) |
| 6 to 11 Years | 143 (100.0%) | 120 (98.4%) |
| 12 to 14 Years | 2 (100.0%) | 0 (0.0%) |
| 15 Years | 0 (0.0%) | 0 (0.0%) |
| 16 and 17 Years | 2 (20.0%) | 92 (96.8%) |
| 18 to 24 Years | 0 (0.0%) | 21 (72.4%) |
| 25 to 34 Years | 5 (13.2%) | 2 (66.7%) |
| 35 to 44 Years | 0 (0.0%) | 11 (68.8%) |
| 45 to 54 Years | 0 (0.0%) | 0 (0.0%) |
| 55 to 64 Years | 34 (57.6%) | 19 (50.0%) |
| 65 to 74 Years | 0 (0.0%) | 8 (38.1%) |
| 75 Years and over | 3 (16.7%) | 4 (21.0%) |
| Total | 189 (61.6%) | 277 (75.9%) |
Income Above Poverty by Sex and Age in Graham
According to the poverty statistics in Graham, males aged 18 to 24 years and females aged 12 to 14 years are the age groups that are most secure financially, with 100.0% of males and 100.0% of females in these age groups living above the poverty line.
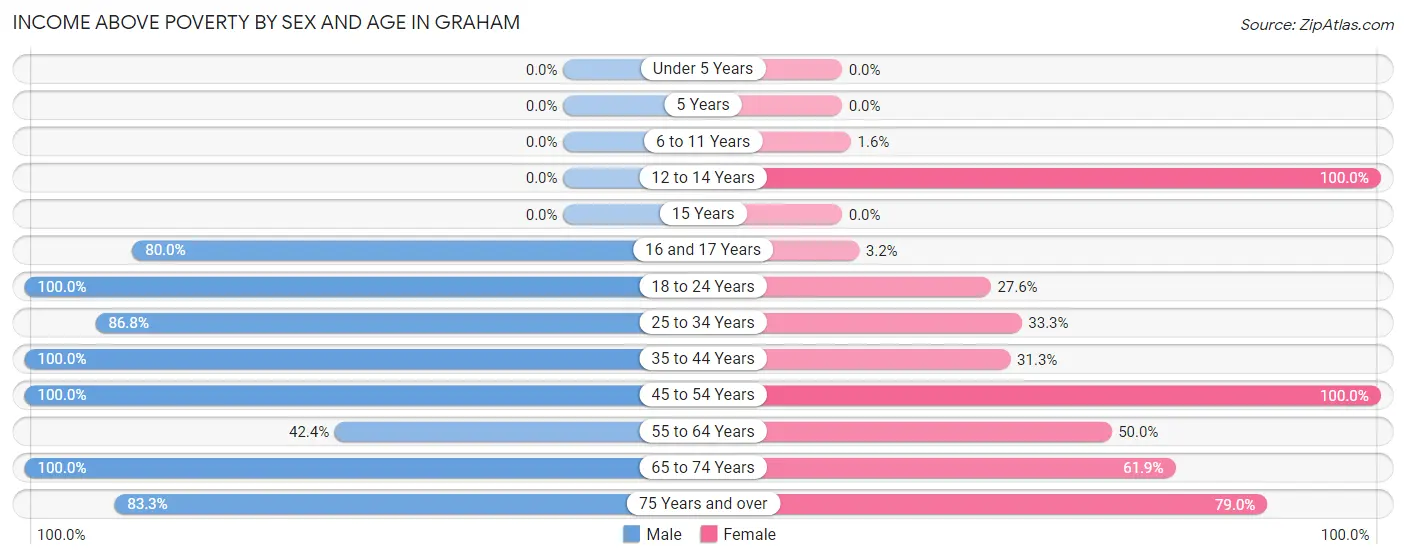
| Age Bracket | Male | Female |
| Under 5 Years | 0 (0.0%) | 0 (0.0%) |
| 5 Years | 0 (0.0%) | 0 (0.0%) |
| 6 to 11 Years | 0 (0.0%) | 2 (1.6%) |
| 12 to 14 Years | 0 (0.0%) | 10 (100.0%) |
| 15 Years | 0 (0.0%) | 0 (0.0%) |
| 16 and 17 Years | 8 (80.0%) | 3 (3.2%) |
| 18 to 24 Years | 9 (100.0%) | 8 (27.6%) |
| 25 to 34 Years | 33 (86.8%) | 1 (33.3%) |
| 35 to 44 Years | 3 (100.0%) | 5 (31.2%) |
| 45 to 54 Years | 20 (100.0%) | 12 (100.0%) |
| 55 to 64 Years | 25 (42.4%) | 19 (50.0%) |
| 65 to 74 Years | 5 (100.0%) | 13 (61.9%) |
| 75 Years and over | 15 (83.3%) | 15 (78.9%) |
| Total | 118 (38.4%) | 88 (24.1%) |
Income Below Poverty Among Married-Couple Families in Graham
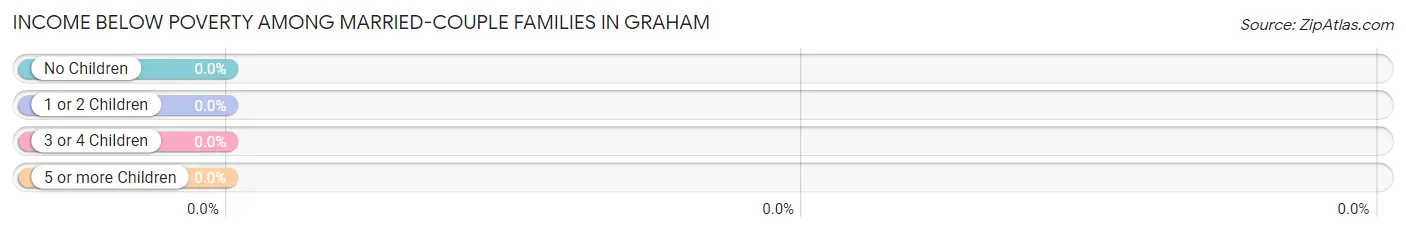
| Children | Above Poverty | Below Poverty |
| No Children | 42 (100.0%) | 0 (0.0%) |
| 1 or 2 Children | 15 (100.0%) | 0 (0.0%) |
| 3 or 4 Children | 0 (0.0%) | 0 (0.0%) |
| 5 or more Children | 0 (0.0%) | 0 (0.0%) |
| Total | 57 (100.0%) | 0 (0.0%) |
Income Below Poverty Among Single-Parent Households in Graham
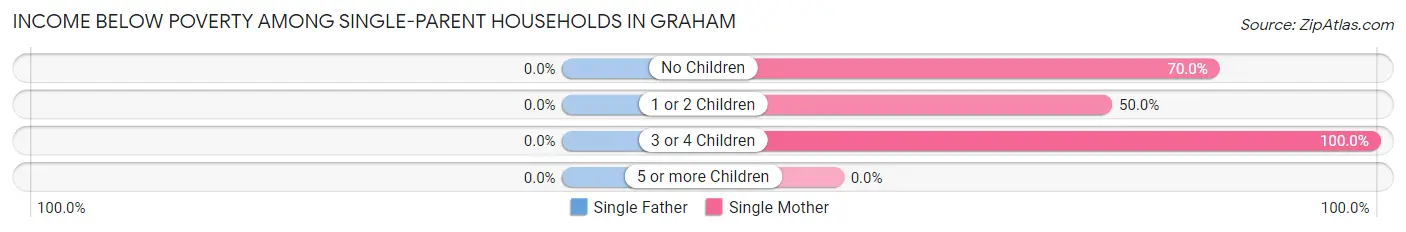
| Children | Single Father | Single Mother |
| No Children | 0 (0.0%) | 14 (70.0%) |
| 1 or 2 Children | 0 (0.0%) | 3 (50.0%) |
| 3 or 4 Children | 0 (0.0%) | 16 (100.0%) |
| 5 or more Children | 0 (0.0%) | 0 (0.0%) |
| Total | 0 (0.0%) | 33 (78.6%) |
Income Below Poverty Among Married-Couple vs Single-Parent Households in Graham
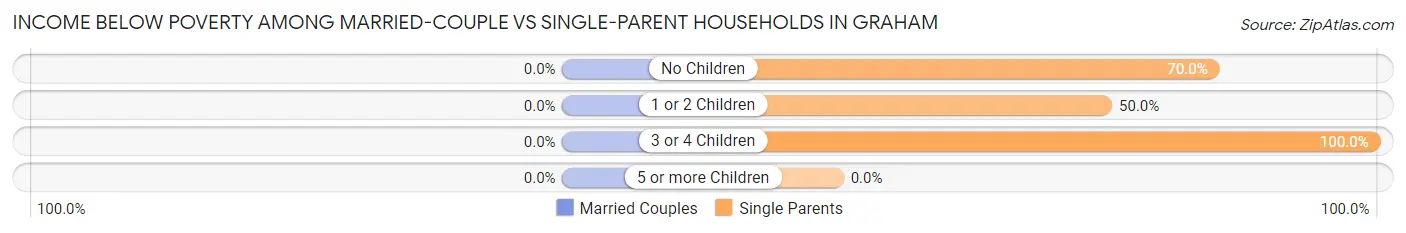
| Children | Married-Couple Families | Single-Parent Households |
| No Children | 0 (0.0%) | 14 (70.0%) |
| 1 or 2 Children | 0 (0.0%) | 3 (50.0%) |
| 3 or 4 Children | 0 (0.0%) | 16 (100.0%) |
| 5 or more Children | 0 (0.0%) | 0 (0.0%) |
| Total | 0 (0.0%) | 33 (78.6%) |
Employment Characteristics in Graham
Employment by Class of Employer in Graham
Among the 124 employed individuals in Graham, private company employees (106 | 85.5%), local government employees (8 | 6.5%), and self-employed (not incorporated) (4 | 3.2%) make up the most common classes of employment.
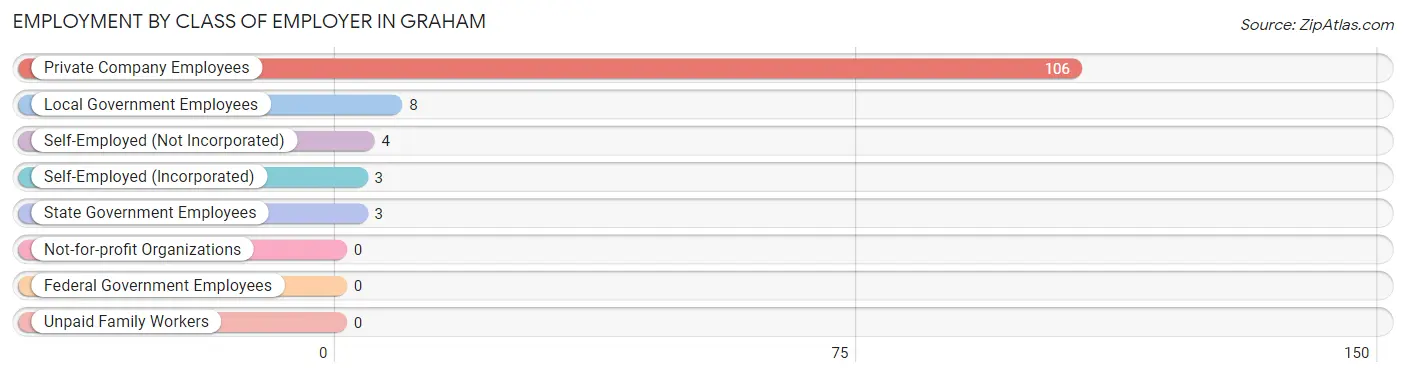
| Employer Class | # Employees | % Employees |
| Private Company Employees | 106 | 85.5% |
| Self-Employed (Incorporated) | 3 | 2.4% |
| Self-Employed (Not Incorporated) | 4 | 3.2% |
| Not-for-profit Organizations | 0 | 0.0% |
| Local Government Employees | 8 | 6.5% |
| State Government Employees | 3 | 2.4% |
| Federal Government Employees | 0 | 0.0% |
| Unpaid Family Workers | 0 | 0.0% |
| Total | 124 | 100.0% |
Employment Status by Age in Graham
According to the labor force statistics for Graham, out of the total population over 16 years of age (395), 33.9% or 134 individuals are in the labor force, with 7.5% or 10 of them unemployed. The age group with the highest labor force participation rate is 20 to 24 years, with 100.0% or 8 individuals in the labor force. Within the labor force, the 16 to 19 years age range has the highest percentage of unemployed individuals, with 100.0% or 4 of them being unemployed.
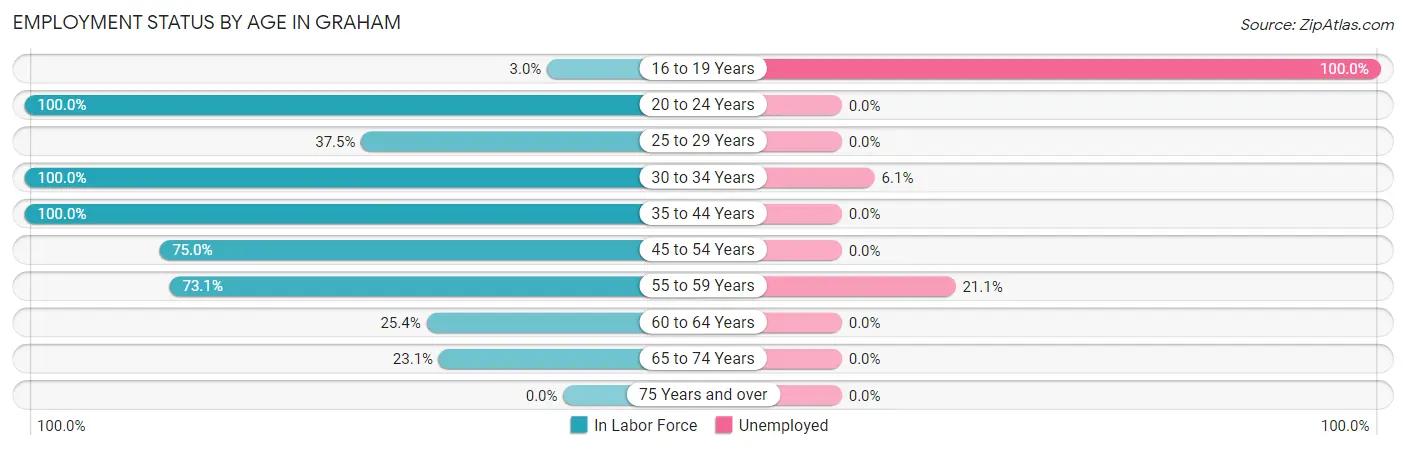
| Age Bracket | In Labor Force | Unemployed |
| 16 to 19 Years | 4 (3.0%) | 4 (100.0%) |
| 20 to 24 Years | 8 (100.0%) | 0 (0.0%) |
| 25 to 29 Years | 3 (37.5%) | 0 (0.0%) |
| 30 to 34 Years | 33 (100.0%) | 2 (6.1%) |
| 35 to 44 Years | 19 (100.0%) | 0 (0.0%) |
| 45 to 54 Years | 24 (75.0%) | 0 (0.0%) |
| 55 to 59 Years | 19 (73.1%) | 4 (21.1%) |
| 60 to 64 Years | 18 (25.4%) | 0 (0.0%) |
| 65 to 74 Years | 6 (23.1%) | 0 (0.0%) |
| 75 Years and over | 0 (0.0%) | 0 (0.0%) |
| Total | 134 (33.9%) | 10 (7.5%) |
Employment Status by Educational Attainment in Graham
According to labor force statistics for Graham, 61.4% of individuals (116) out of the total population between 25 and 64 years of age (189) are in the labor force, with 5.2% or 6 of them being unemployed. The group with the highest labor force participation rate are those with the educational attainment of less than high school, with 71.4% or 15 individuals in the labor force. Within the labor force, individuals with high school diploma education have the highest percentage of unemployment, with 7.3% or 6 of them being unemployed.
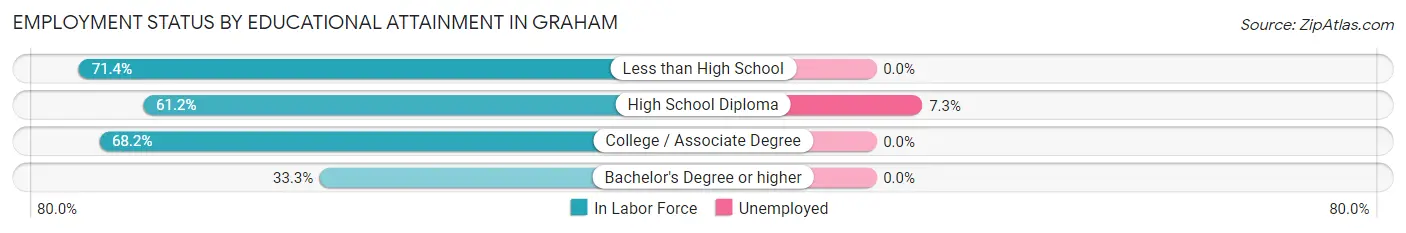
| Educational Attainment | In Labor Force | Unemployed |
| Less than High School | 15 (71.4%) | 0 (0.0%) |
| High School Diploma | 82 (61.2%) | 10 (7.3%) |
| College / Associate Degree | 15 (68.2%) | 0 (0.0%) |
| Bachelor's Degree or higher | 4 (33.3%) | 0 (0.0%) |
| Total | 116 (61.4%) | 10 (5.2%) |
Employment Occupations by Sex in Graham
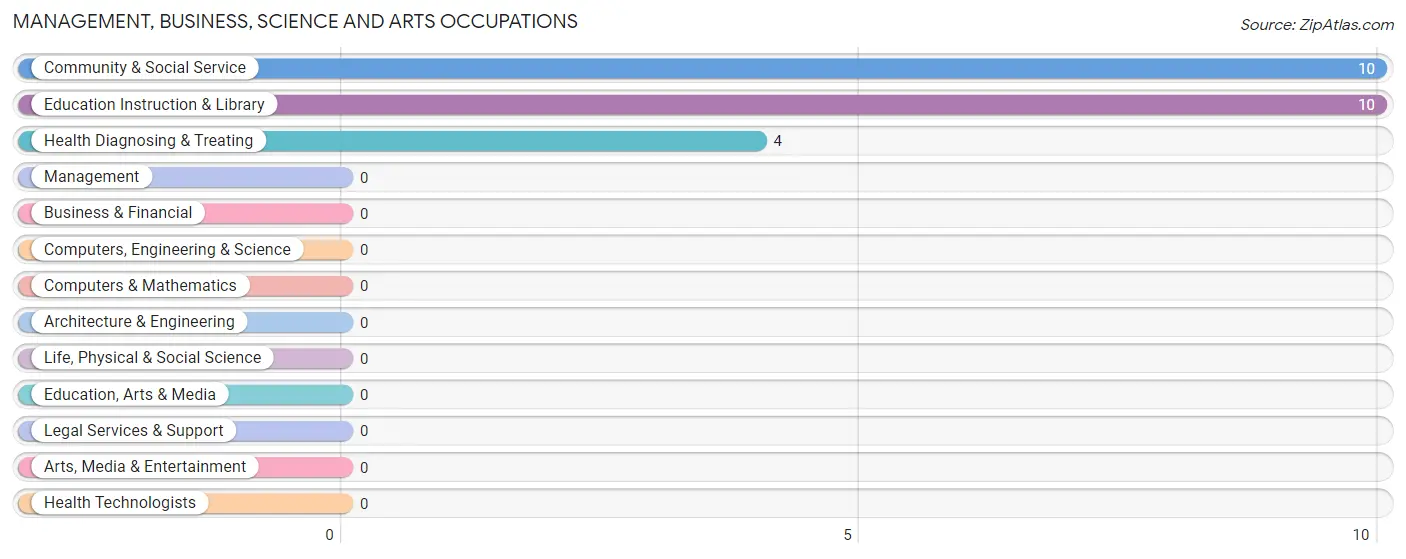
Management, Business, Science and Arts Occupations
The most common Management, Business, Science and Arts occupations in Graham are Community & Social Service (10 | 8.1%), Education Instruction & Library (10 | 8.1%), and Health Diagnosing & Treating (4 | 3.2%).
Management, Business, Science and Arts Occupations by Sex
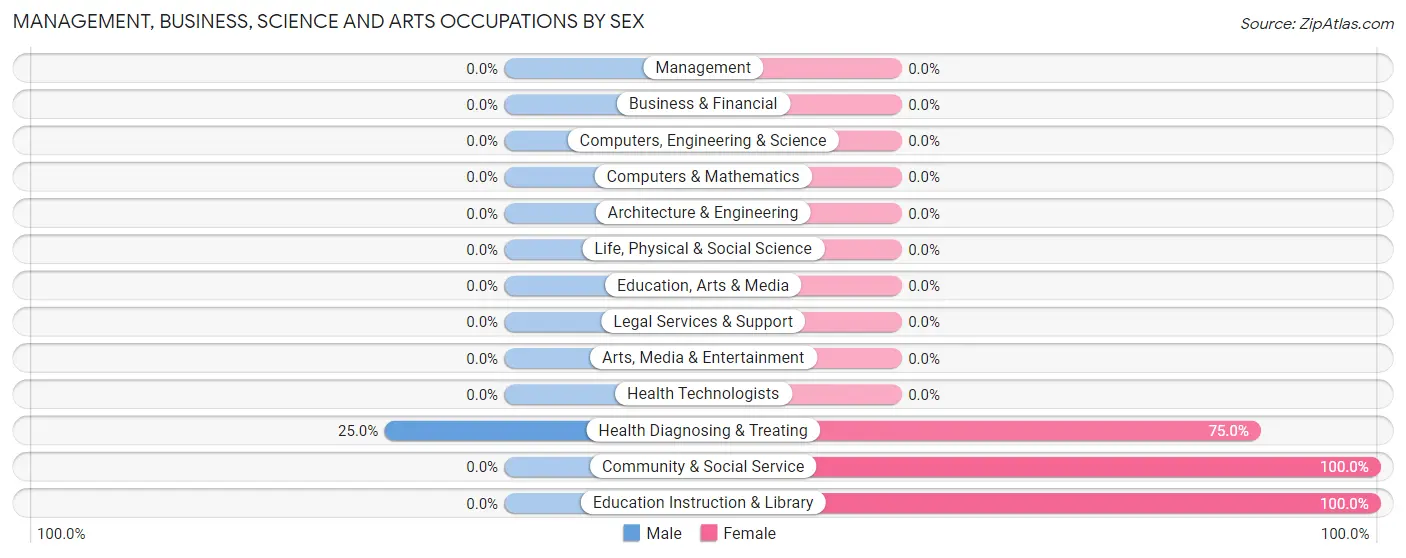
| Occupation | Male | Female |
| Management | 0 (0.0%) | 0 (0.0%) |
| Business & Financial | 0 (0.0%) | 0 (0.0%) |
| Computers, Engineering & Science | 0 (0.0%) | 0 (0.0%) |
| Computers & Mathematics | 0 (0.0%) | 0 (0.0%) |
| Architecture & Engineering | 0 (0.0%) | 0 (0.0%) |
| Life, Physical & Social Science | 0 (0.0%) | 0 (0.0%) |
| Community & Social Service | 0 (0.0%) | 10 (100.0%) |
| Education, Arts & Media | 0 (0.0%) | 0 (0.0%) |
| Legal Services & Support | 0 (0.0%) | 0 (0.0%) |
| Education Instruction & Library | 0 (0.0%) | 10 (100.0%) |
| Arts, Media & Entertainment | 0 (0.0%) | 0 (0.0%) |
| Health Diagnosing & Treating | 1 (25.0%) | 3 (75.0%) |
| Health Technologists | 0 (0.0%) | 0 (0.0%) |
| Total (Category) | 1 (7.1%) | 13 (92.9%) |
| Total (Overall) | 75 (60.5%) | 49 (39.5%) |
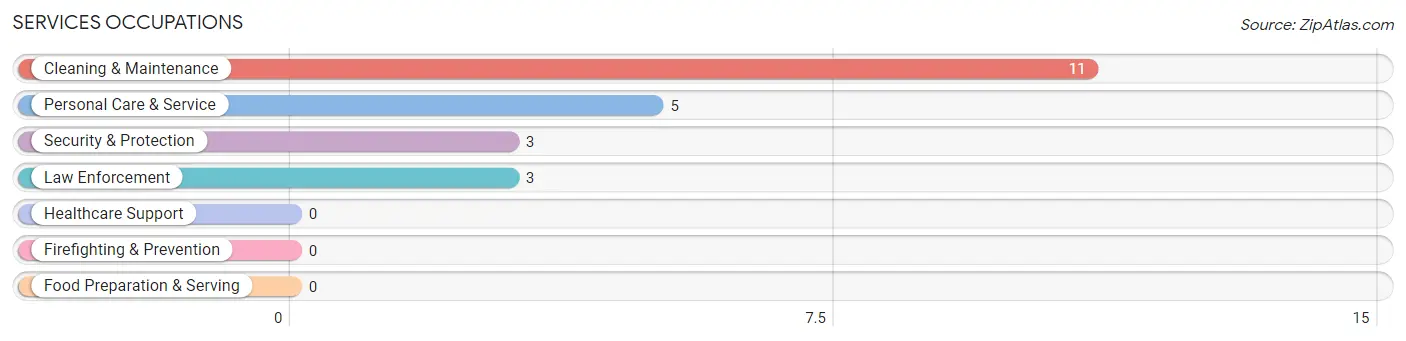
Services Occupations
The most common Services occupations in Graham are Cleaning & Maintenance (11 | 8.9%), Personal Care & Service (5 | 4.0%), Security & Protection (3 | 2.4%), and Law Enforcement (3 | 2.4%).
Services Occupations by Sex
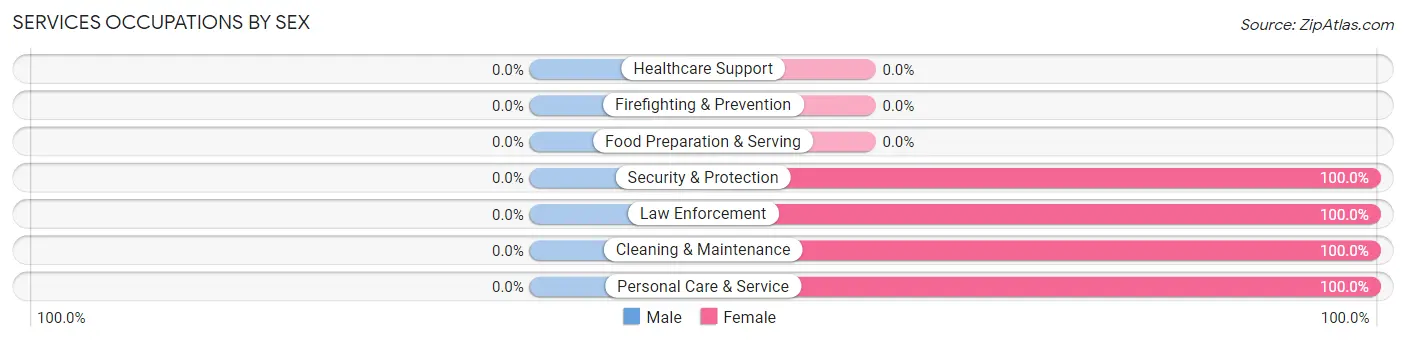
| Occupation | Male | Female |
| Healthcare Support | 0 (0.0%) | 0 (0.0%) |
| Security & Protection | 0 (0.0%) | 3 (100.0%) |
| Firefighting & Prevention | 0 (0.0%) | 0 (0.0%) |
| Law Enforcement | 0 (0.0%) | 3 (100.0%) |
| Food Preparation & Serving | 0 (0.0%) | 0 (0.0%) |
| Cleaning & Maintenance | 0 (0.0%) | 11 (100.0%) |
| Personal Care & Service | 0 (0.0%) | 5 (100.0%) |
| Total (Category) | 0 (0.0%) | 19 (100.0%) |
| Total (Overall) | 75 (60.5%) | 49 (39.5%) |
Sales and Office Occupations
The most common Sales and Office occupations in Graham are Office & Administration (12 | 9.7%), and Sales & Related (9 | 7.3%).
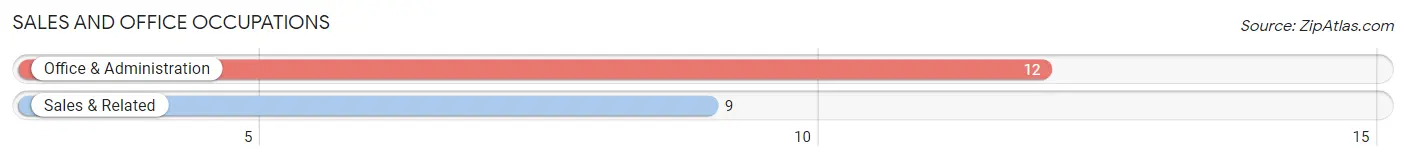
Sales and Office Occupations by Sex
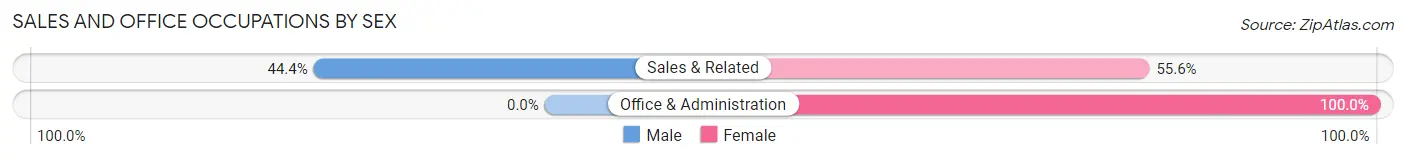
| Occupation | Male | Female |
| Sales & Related | 4 (44.4%) | 5 (55.6%) |
| Office & Administration | 0 (0.0%) | 12 (100.0%) |
| Total (Category) | 4 (19.1%) | 17 (80.9%) |
| Total (Overall) | 75 (60.5%) | 49 (39.5%) |
Natural Resources, Construction and Maintenance Occupations
The most common Natural Resources, Construction and Maintenance occupations in Graham are Installation, Maintenance & Repair (5 | 4.0%), and Construction & Extraction (4 | 3.2%).
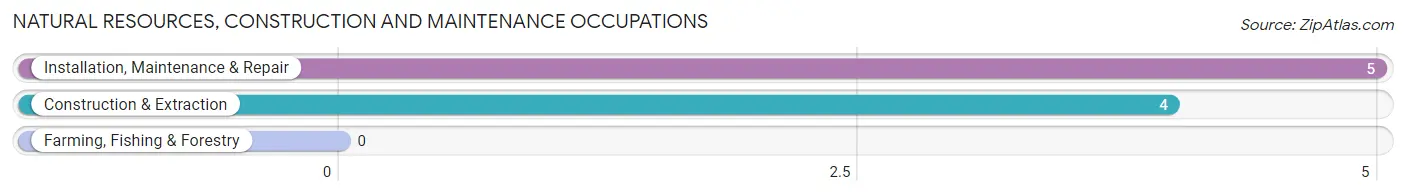
Natural Resources, Construction and Maintenance Occupations by Sex
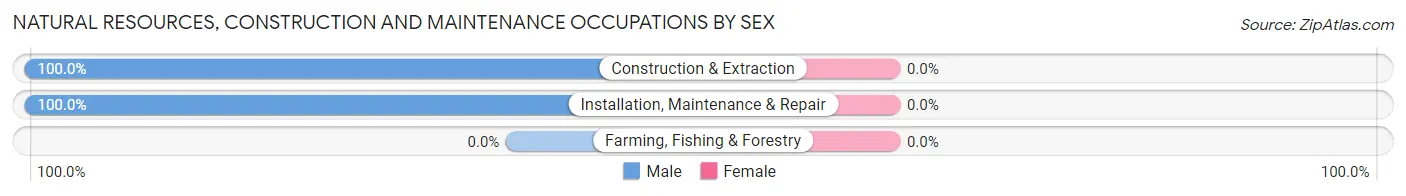
| Occupation | Male | Female |
| Farming, Fishing & Forestry | 0 (0.0%) | 0 (0.0%) |
| Construction & Extraction | 4 (100.0%) | 0 (0.0%) |
| Installation, Maintenance & Repair | 5 (100.0%) | 0 (0.0%) |
| Total (Category) | 9 (100.0%) | 0 (0.0%) |
| Total (Overall) | 75 (60.5%) | 49 (39.5%) |
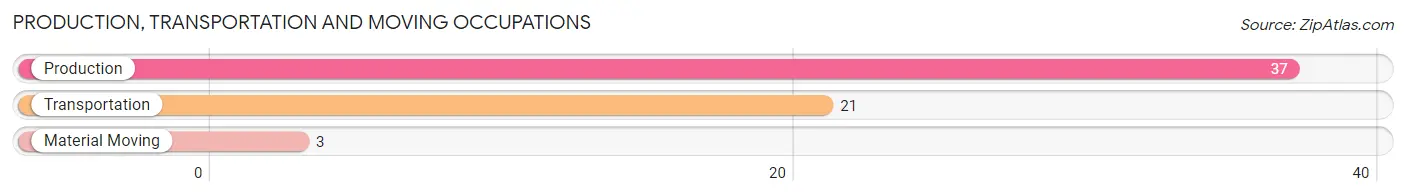
Production, Transportation and Moving Occupations
The most common Production, Transportation and Moving occupations in Graham are Production (37 | 29.8%), Transportation (21 | 16.9%), and Material Moving (3 | 2.4%).
Production, Transportation and Moving Occupations by Sex
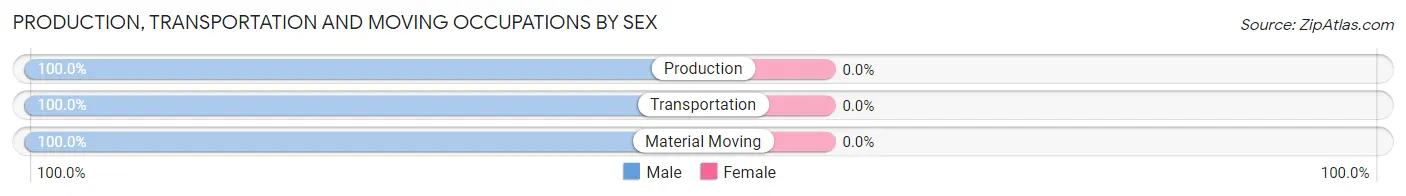
| Occupation | Male | Female |
| Production | 37 (100.0%) | 0 (0.0%) |
| Transportation | 21 (100.0%) | 0 (0.0%) |
| Material Moving | 3 (100.0%) | 0 (0.0%) |
| Total (Category) | 61 (100.0%) | 0 (0.0%) |
| Total (Overall) | 75 (60.5%) | 49 (39.5%) |
Employment Industries by Sex in Graham
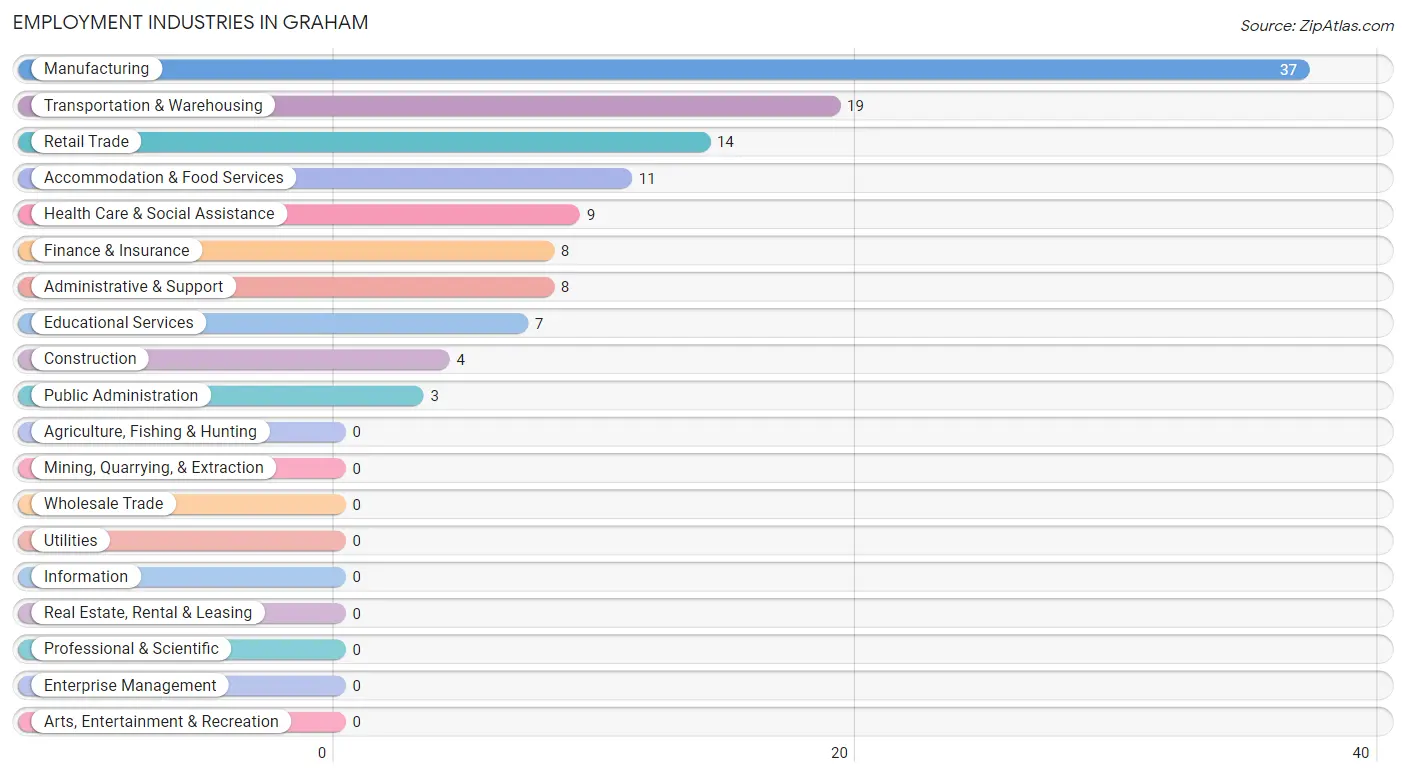
Employment Industries in Graham
The major employment industries in Graham include Manufacturing (37 | 29.8%), Transportation & Warehousing (19 | 15.3%), Retail Trade (14 | 11.3%), Accommodation & Food Services (11 | 8.9%), and Health Care & Social Assistance (9 | 7.3%).
Employment Industries by Sex in Graham
The Graham industries that see more men than women are Construction (100.0%), Manufacturing (100.0%), and Transportation & Warehousing (100.0%), whereas the industries that tend to have a higher number of women are Finance & Insurance (100.0%), Educational Services (100.0%), and Accommodation & Food Services (100.0%).
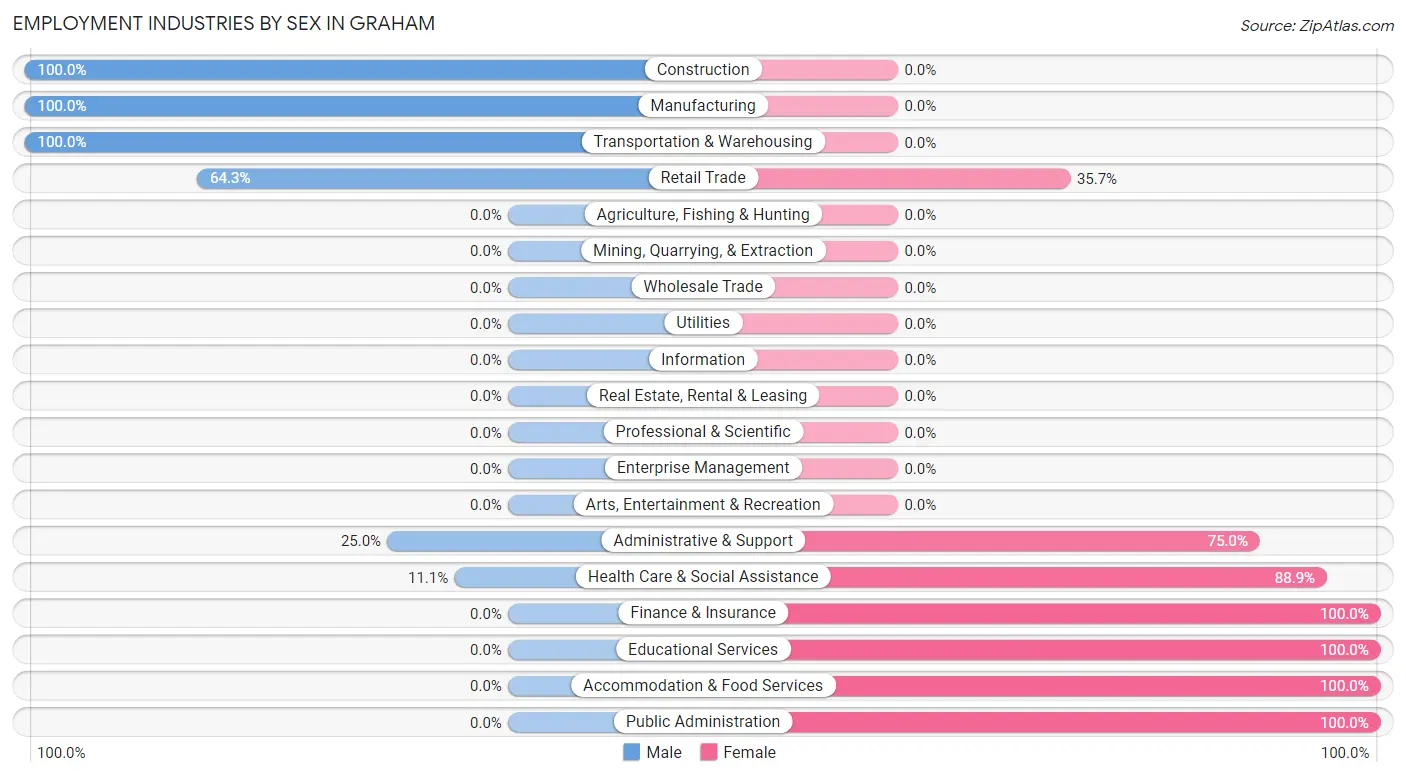
| Industry | Male | Female |
| Agriculture, Fishing & Hunting | 0 (0.0%) | 0 (0.0%) |
| Mining, Quarrying, & Extraction | 0 (0.0%) | 0 (0.0%) |
| Construction | 4 (100.0%) | 0 (0.0%) |
| Manufacturing | 37 (100.0%) | 0 (0.0%) |
| Wholesale Trade | 0 (0.0%) | 0 (0.0%) |
| Retail Trade | 9 (64.3%) | 5 (35.7%) |
| Transportation & Warehousing | 19 (100.0%) | 0 (0.0%) |
| Utilities | 0 (0.0%) | 0 (0.0%) |
| Information | 0 (0.0%) | 0 (0.0%) |
| Finance & Insurance | 0 (0.0%) | 8 (100.0%) |
| Real Estate, Rental & Leasing | 0 (0.0%) | 0 (0.0%) |
| Professional & Scientific | 0 (0.0%) | 0 (0.0%) |
| Enterprise Management | 0 (0.0%) | 0 (0.0%) |
| Administrative & Support | 2 (25.0%) | 6 (75.0%) |
| Educational Services | 0 (0.0%) | 7 (100.0%) |
| Health Care & Social Assistance | 1 (11.1%) | 8 (88.9%) |
| Arts, Entertainment & Recreation | 0 (0.0%) | 0 (0.0%) |
| Accommodation & Food Services | 0 (0.0%) | 11 (100.0%) |
| Public Administration | 0 (0.0%) | 3 (100.0%) |
| Total | 75 (60.5%) | 49 (39.5%) |
Education in Graham
School Enrollment in Graham
The most common levels of schooling among the 410 students in Graham are elementary school (145 | 35.4%), high school (134 | 32.7%), and middle school (129 | 31.5%).
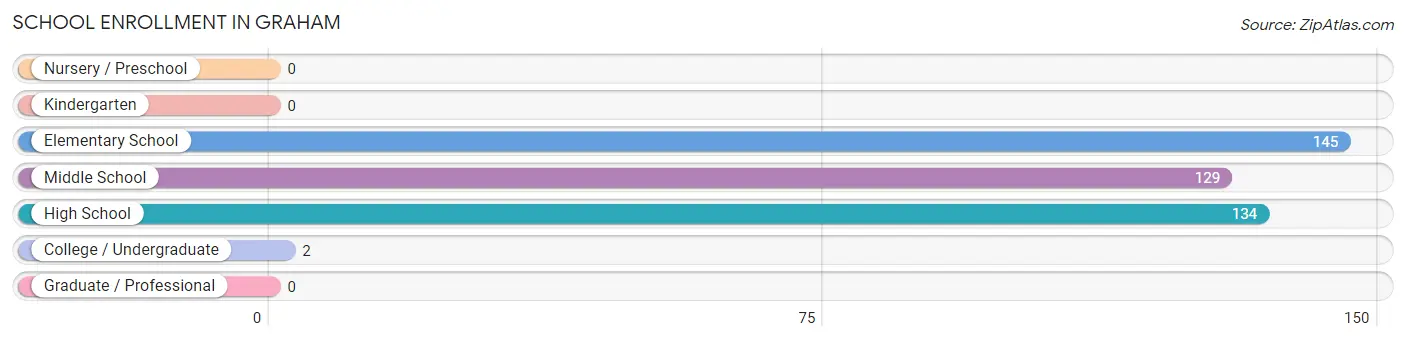
| School Level | # Students | % Students |
| Nursery / Preschool | 0 | 0.0% |
| Kindergarten | 0 | 0.0% |
| Elementary School | 145 | 35.4% |
| Middle School | 129 | 31.5% |
| High School | 134 | 32.7% |
| College / Undergraduate | 2 | 0.5% |
| Graduate / Professional | 0 | 0.0% |
| Total | 410 | 100.0% |
School Enrollment by Age by Funding Source in Graham
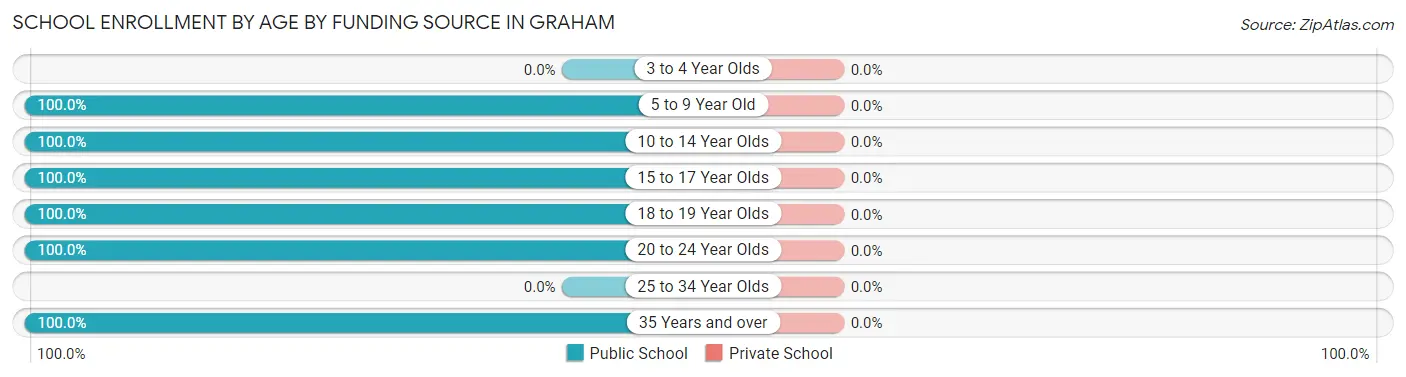
| Age Bracket | Public School | Private School |
| 3 to 4 Year Olds | 0 (0.0%) | 0 (0.0%) |
| 5 to 9 Year Old | 143 (100.0%) | 0 (0.0%) |
| 10 to 14 Year Olds | 131 (100.0%) | 0 (0.0%) |
| 15 to 17 Year Olds | 102 (100.0%) | 0 (0.0%) |
| 18 to 19 Year Olds | 30 (100.0%) | 0 (0.0%) |
| 20 to 24 Year Olds | 2 (100.0%) | 0 (0.0%) |
| 25 to 34 Year Olds | 0 (0.0%) | 0 (0.0%) |
| 35 Years and over | 2 (100.0%) | 0 (0.0%) |
| Total | 410 (100.0%) | 0 (0.0%) |
Educational Attainment by Field of Study in Graham
Business (8 | 61.5%), and education (5 | 38.5%) are the most common fields of study among 13 individuals in Graham who have obtained a bachelor's degree or higher.
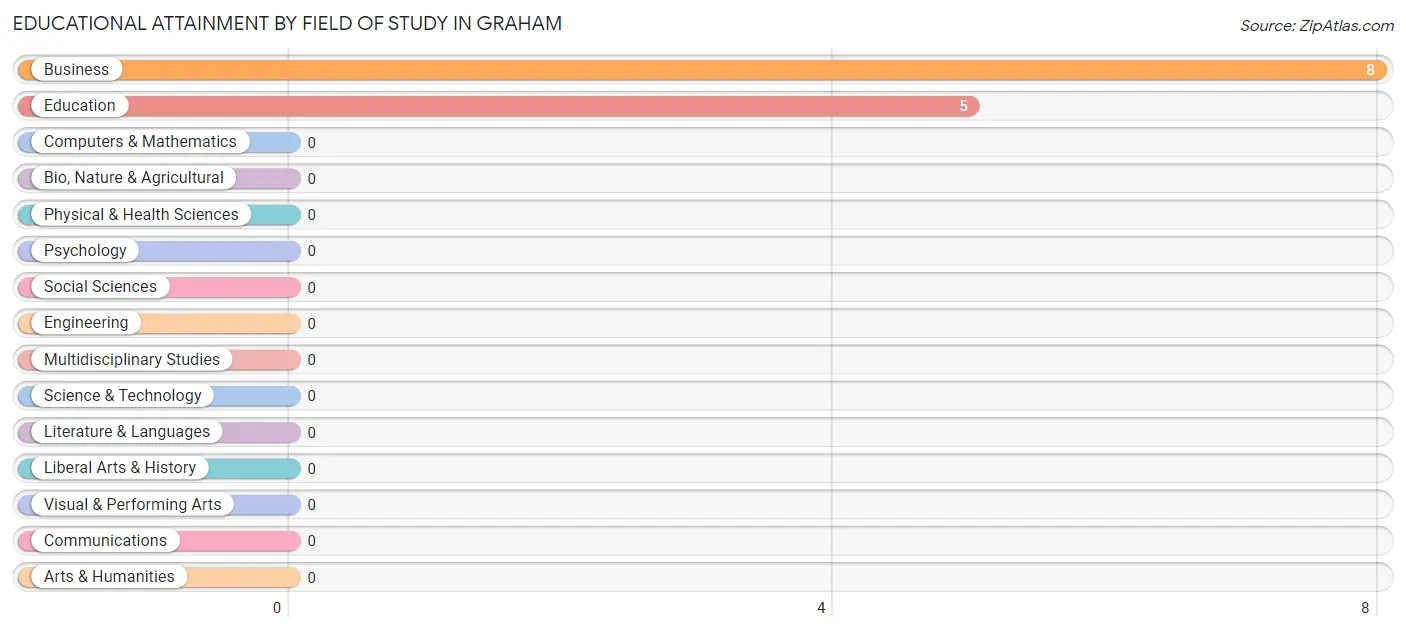
| Field of Study | # Graduates | % Graduates |
| Computers & Mathematics | 0 | 0.0% |
| Bio, Nature & Agricultural | 0 | 0.0% |
| Physical & Health Sciences | 0 | 0.0% |
| Psychology | 0 | 0.0% |
| Social Sciences | 0 | 0.0% |
| Engineering | 0 | 0.0% |
| Multidisciplinary Studies | 0 | 0.0% |
| Science & Technology | 0 | 0.0% |
| Business | 8 | 61.5% |
| Education | 5 | 38.5% |
| Literature & Languages | 0 | 0.0% |
| Liberal Arts & History | 0 | 0.0% |
| Visual & Performing Arts | 0 | 0.0% |
| Communications | 0 | 0.0% |
| Arts & Humanities | 0 | 0.0% |
| Total | 13 | 100.0% |
Transportation & Commute in Graham
Vehicle Availability by Sex in Graham
The most prevalent vehicle ownership categories in Graham are males with 2 vehicles (47, accounting for 62.7%) and females with 2 vehicles (15, making up 95.9%).
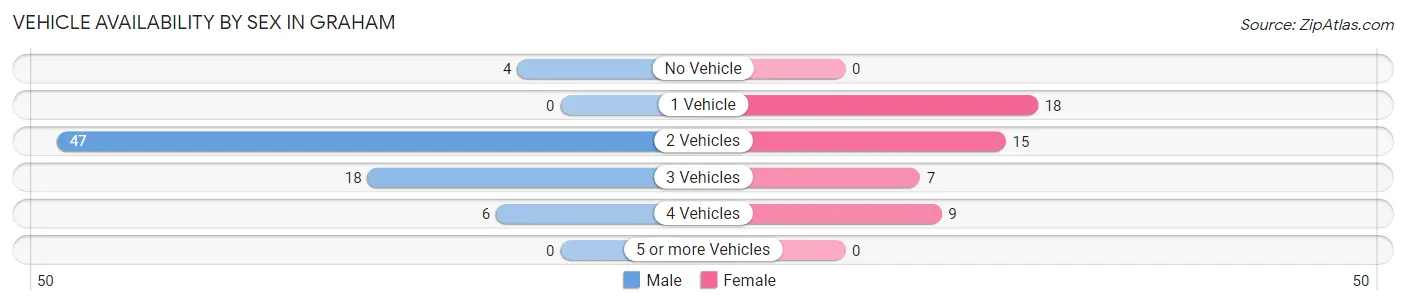
| Vehicles Available | Male | Female |
| No Vehicle | 4 (5.3%) | 0 (0.0%) |
| 1 Vehicle | 0 (0.0%) | 18 (36.7%) |
| 2 Vehicles | 47 (62.7%) | 15 (30.6%) |
| 3 Vehicles | 18 (24.0%) | 7 (14.3%) |
| 4 Vehicles | 6 (8.0%) | 9 (18.4%) |
| 5 or more Vehicles | 0 (0.0%) | 0 (0.0%) |
| Total | 75 (100.0%) | 49 (100.0%) |
Commute Time in Graham
The most frequently occuring commute durations in Graham are 30 to 34 minutes (38 commuters, 30.6%), 10 to 14 minutes (30 commuters, 24.2%), and 15 to 19 minutes (24 commuters, 19.4%).
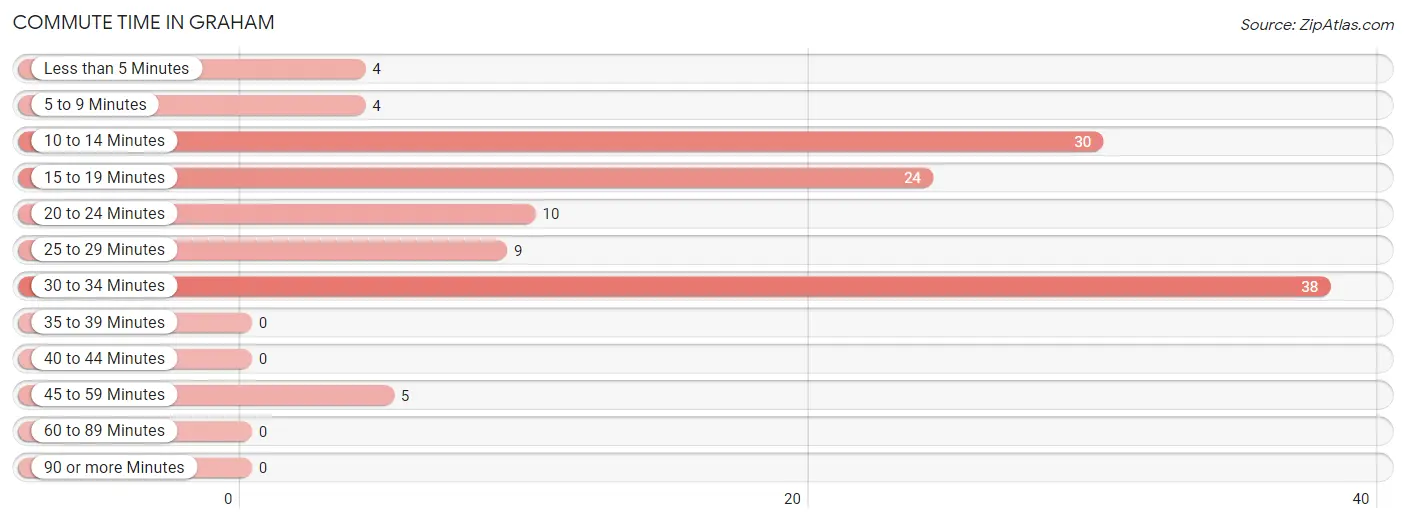
| Commute Time | # Commuters | % Commuters |
| Less than 5 Minutes | 4 | 3.2% |
| 5 to 9 Minutes | 4 | 3.2% |
| 10 to 14 Minutes | 30 | 24.2% |
| 15 to 19 Minutes | 24 | 19.4% |
| 20 to 24 Minutes | 10 | 8.1% |
| 25 to 29 Minutes | 9 | 7.3% |
| 30 to 34 Minutes | 38 | 30.6% |
| 35 to 39 Minutes | 0 | 0.0% |
| 40 to 44 Minutes | 0 | 0.0% |
| 45 to 59 Minutes | 5 | 4.0% |
| 60 to 89 Minutes | 0 | 0.0% |
| 90 or more Minutes | 0 | 0.0% |
Commute Time by Sex in Graham
The most common commute times in Graham are 30 to 34 minutes (38 commuters, 50.7%) for males and 15 to 19 minutes (15 commuters, 30.6%) for females.
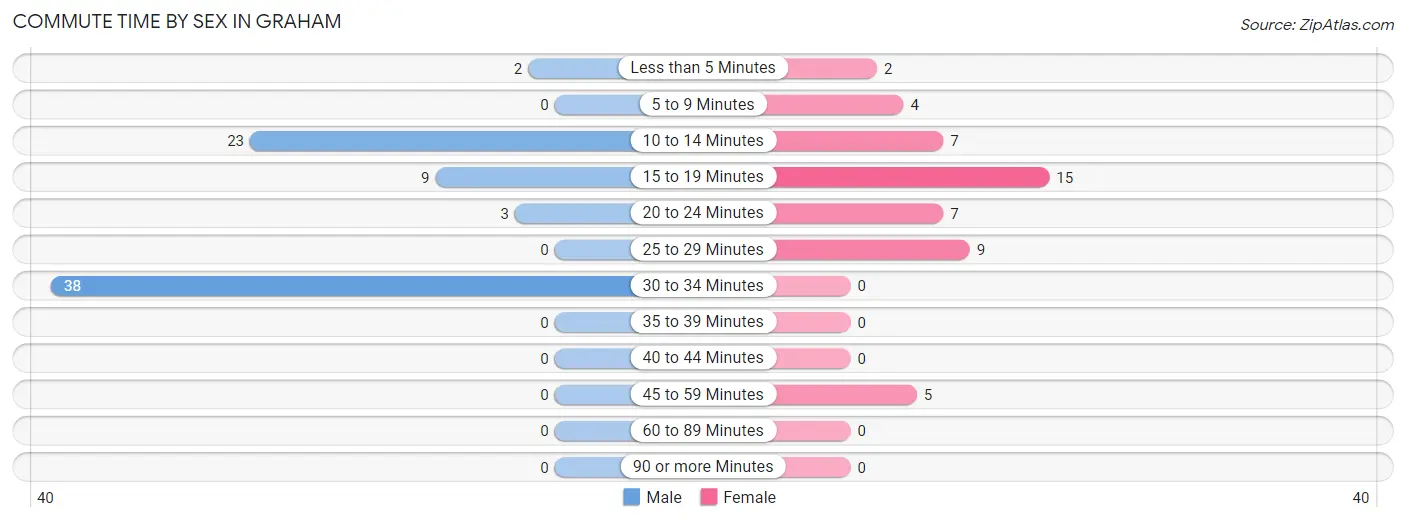
| Commute Time | Male | Female |
| Less than 5 Minutes | 2 (2.7%) | 2 (4.1%) |
| 5 to 9 Minutes | 0 (0.0%) | 4 (8.2%) |
| 10 to 14 Minutes | 23 (30.7%) | 7 (14.3%) |
| 15 to 19 Minutes | 9 (12.0%) | 15 (30.6%) |
| 20 to 24 Minutes | 3 (4.0%) | 7 (14.3%) |
| 25 to 29 Minutes | 0 (0.0%) | 9 (18.4%) |
| 30 to 34 Minutes | 38 (50.7%) | 0 (0.0%) |
| 35 to 39 Minutes | 0 (0.0%) | 0 (0.0%) |
| 40 to 44 Minutes | 0 (0.0%) | 0 (0.0%) |
| 45 to 59 Minutes | 0 (0.0%) | 5 (10.2%) |
| 60 to 89 Minutes | 0 (0.0%) | 0 (0.0%) |
| 90 or more Minutes | 0 (0.0%) | 0 (0.0%) |
Time of Departure to Work by Sex in Graham
The most frequent times of departure to work in Graham are 12:00 PM to 3:59 PM (31, 41.3%) for males and 7:00 AM to 7:29 AM (14, 28.6%) for females.
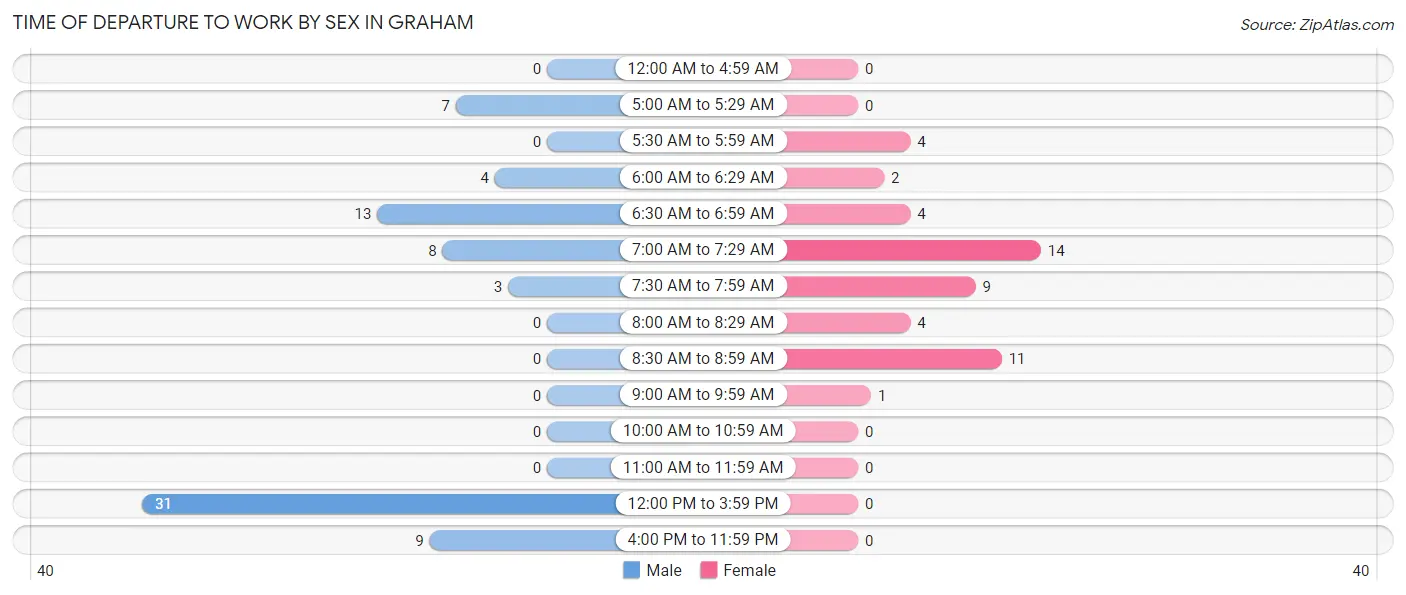
| Time of Departure | Male | Female |
| 12:00 AM to 4:59 AM | 0 (0.0%) | 0 (0.0%) |
| 5:00 AM to 5:29 AM | 7 (9.3%) | 0 (0.0%) |
| 5:30 AM to 5:59 AM | 0 (0.0%) | 4 (8.2%) |
| 6:00 AM to 6:29 AM | 4 (5.3%) | 2 (4.1%) |
| 6:30 AM to 6:59 AM | 13 (17.3%) | 4 (8.2%) |
| 7:00 AM to 7:29 AM | 8 (10.7%) | 14 (28.6%) |
| 7:30 AM to 7:59 AM | 3 (4.0%) | 9 (18.4%) |
| 8:00 AM to 8:29 AM | 0 (0.0%) | 4 (8.2%) |
| 8:30 AM to 8:59 AM | 0 (0.0%) | 11 (22.5%) |
| 9:00 AM to 9:59 AM | 0 (0.0%) | 1 (2.0%) |
| 10:00 AM to 10:59 AM | 0 (0.0%) | 0 (0.0%) |
| 11:00 AM to 11:59 AM | 0 (0.0%) | 0 (0.0%) |
| 12:00 PM to 3:59 PM | 31 (41.3%) | 0 (0.0%) |
| 4:00 PM to 11:59 PM | 9 (12.0%) | 0 (0.0%) |
| Total | 75 (100.0%) | 49 (100.0%) |
Housing Occupancy in Graham
Occupancy by Ownership in Graham
Of the total 126 dwellings in Graham, owner-occupied units account for 105 (83.3%), while renter-occupied units make up 21 (16.7%).
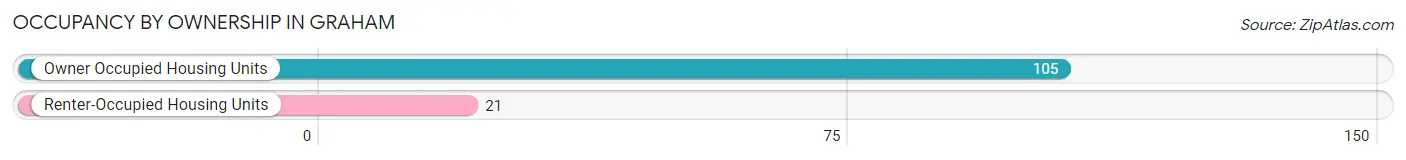
| Occupancy | # Housing Units | % Housing Units |
| Owner Occupied Housing Units | 105 | 83.3% |
| Renter-Occupied Housing Units | 21 | 16.7% |
| Total Occupied Housing Units | 126 | 100.0% |
Occupancy by Household Size in Graham
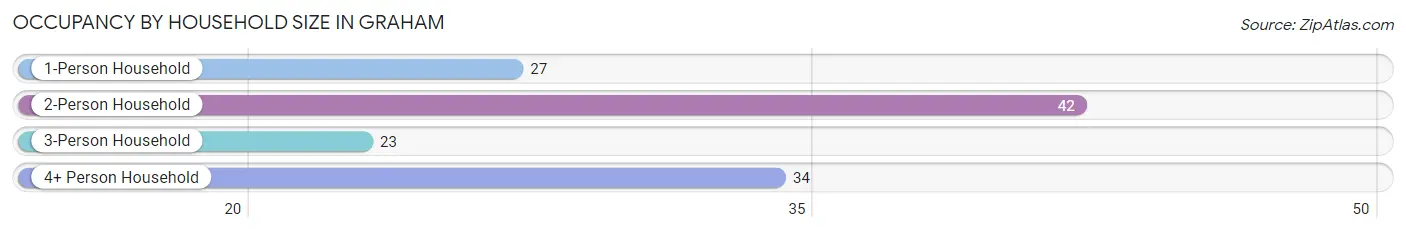
| Household Size | # Housing Units | % Housing Units |
| 1-Person Household | 27 | 21.4% |
| 2-Person Household | 42 | 33.3% |
| 3-Person Household | 23 | 18.2% |
| 4+ Person Household | 34 | 27.0% |
| Total Housing Units | 126 | 100.0% |
Occupancy by Ownership by Household Size in Graham
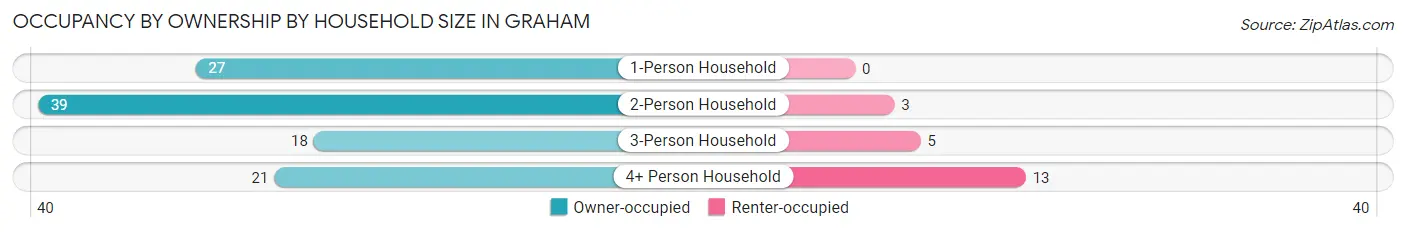
| Household Size | Owner-occupied | Renter-occupied |
| 1-Person Household | 27 (100.0%) | 0 (0.0%) |
| 2-Person Household | 39 (92.9%) | 3 (7.1%) |
| 3-Person Household | 18 (78.3%) | 5 (21.7%) |
| 4+ Person Household | 21 (61.8%) | 13 (38.2%) |
| Total Housing Units | 105 (83.3%) | 21 (16.7%) |
Occupancy by Educational Attainment in Graham
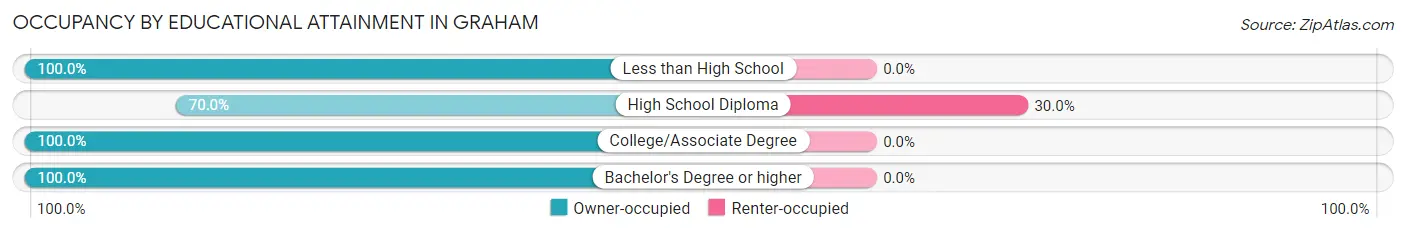
| Household Size | Owner-occupied | Renter-occupied |
| Less than High School | 29 (100.0%) | 0 (0.0%) |
| High School Diploma | 49 (70.0%) | 21 (30.0%) |
| College/Associate Degree | 23 (100.0%) | 0 (0.0%) |
| Bachelor's Degree or higher | 4 (100.0%) | 0 (0.0%) |
Occupancy by Age of Householder in Graham
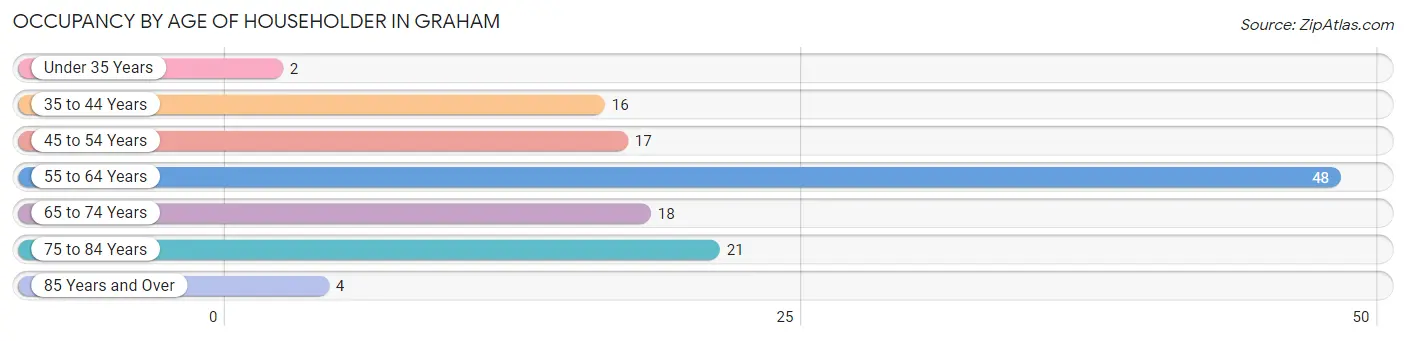
| Age Bracket | # Households | % Households |
| Under 35 Years | 2 | 1.6% |
| 35 to 44 Years | 16 | 12.7% |
| 45 to 54 Years | 17 | 13.5% |
| 55 to 64 Years | 48 | 38.1% |
| 65 to 74 Years | 18 | 14.3% |
| 75 to 84 Years | 21 | 16.7% |
| 85 Years and Over | 4 | 3.2% |
| Total | 126 | 100.0% |
Housing Finances in Graham
Median Income by Occupancy in Graham
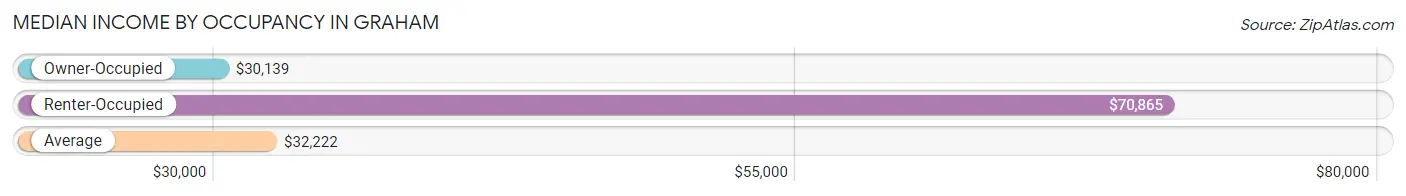
| Occupancy Type | # Households | Median Income |
| Owner-Occupied | 105 (83.3%) | $30,139 |
| Renter-Occupied | 21 (16.7%) | $70,865 |
| Average | 126 (100.0%) | $32,222 |
Occupancy by Householder Income Bracket in Graham
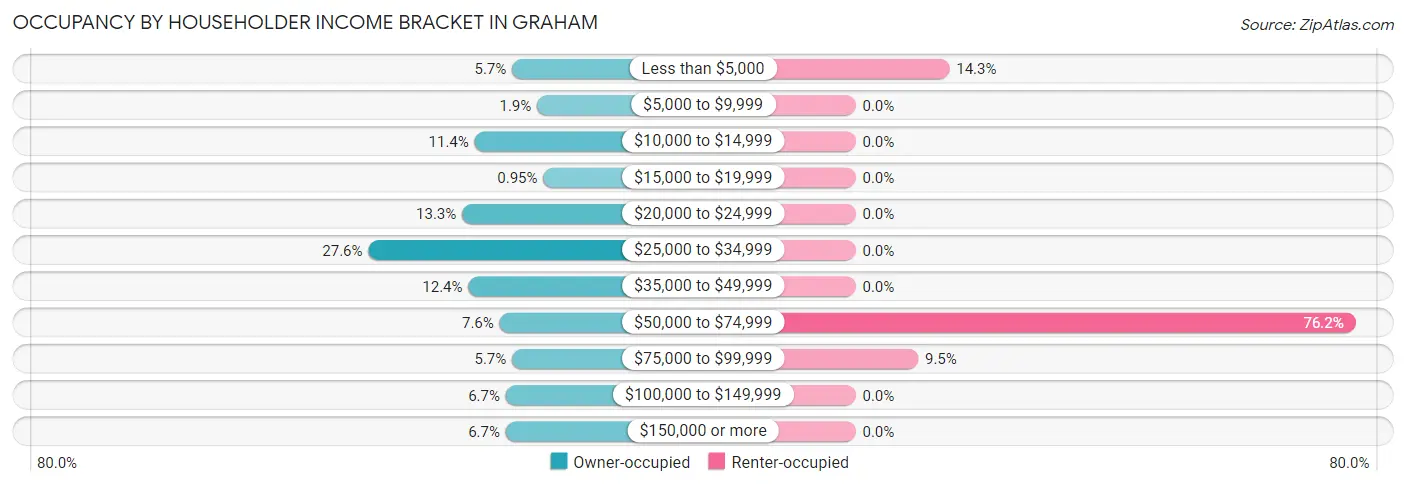
| Income Bracket | Owner-occupied | Renter-occupied |
| Less than $5,000 | 6 (5.7%) | 3 (14.3%) |
| $5,000 to $9,999 | 2 (1.9%) | 0 (0.0%) |
| $10,000 to $14,999 | 12 (11.4%) | 0 (0.0%) |
| $15,000 to $19,999 | 1 (0.9%) | 0 (0.0%) |
| $20,000 to $24,999 | 14 (13.3%) | 0 (0.0%) |
| $25,000 to $34,999 | 29 (27.6%) | 0 (0.0%) |
| $35,000 to $49,999 | 13 (12.4%) | 0 (0.0%) |
| $50,000 to $74,999 | 8 (7.6%) | 16 (76.2%) |
| $75,000 to $99,999 | 6 (5.7%) | 2 (9.5%) |
| $100,000 to $149,999 | 7 (6.7%) | 0 (0.0%) |
| $150,000 or more | 7 (6.7%) | 0 (0.0%) |
| Total | 105 (100.0%) | 21 (100.0%) |
Monthly Housing Cost Tiers in Graham
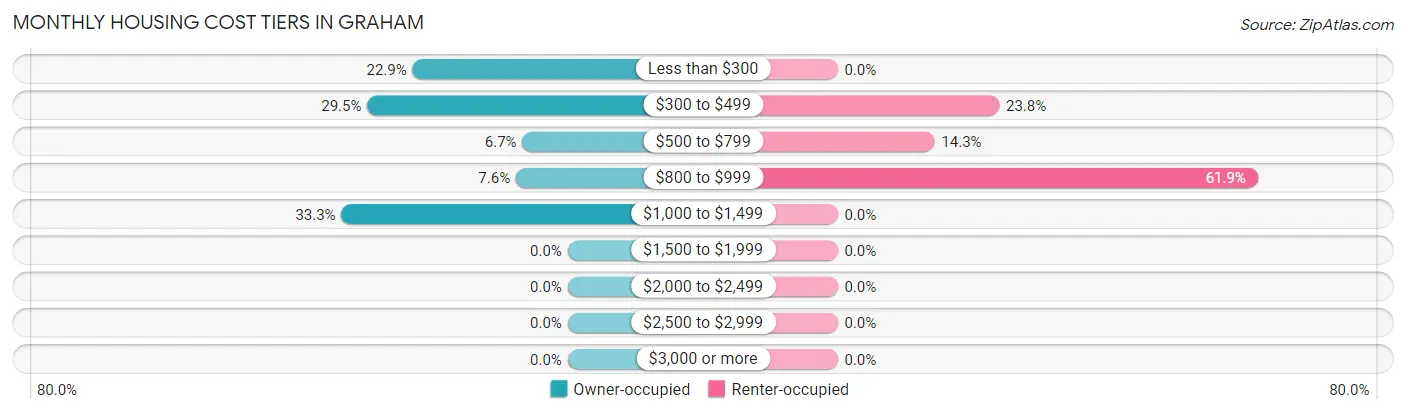
| Monthly Cost | Owner-occupied | Renter-occupied |
| Less than $300 | 24 (22.9%) | 0 (0.0%) |
| $300 to $499 | 31 (29.5%) | 5 (23.8%) |
| $500 to $799 | 7 (6.7%) | 3 (14.3%) |
| $800 to $999 | 8 (7.6%) | 13 (61.9%) |
| $1,000 to $1,499 | 35 (33.3%) | 0 (0.0%) |
| $1,500 to $1,999 | 0 (0.0%) | 0 (0.0%) |
| $2,000 to $2,499 | 0 (0.0%) | 0 (0.0%) |
| $2,500 to $2,999 | 0 (0.0%) | 0 (0.0%) |
| $3,000 or more | 0 (0.0%) | 0 (0.0%) |
| Total | 105 (100.0%) | 21 (100.0%) |
Physical Housing Characteristics in Graham
Housing Structures in Graham
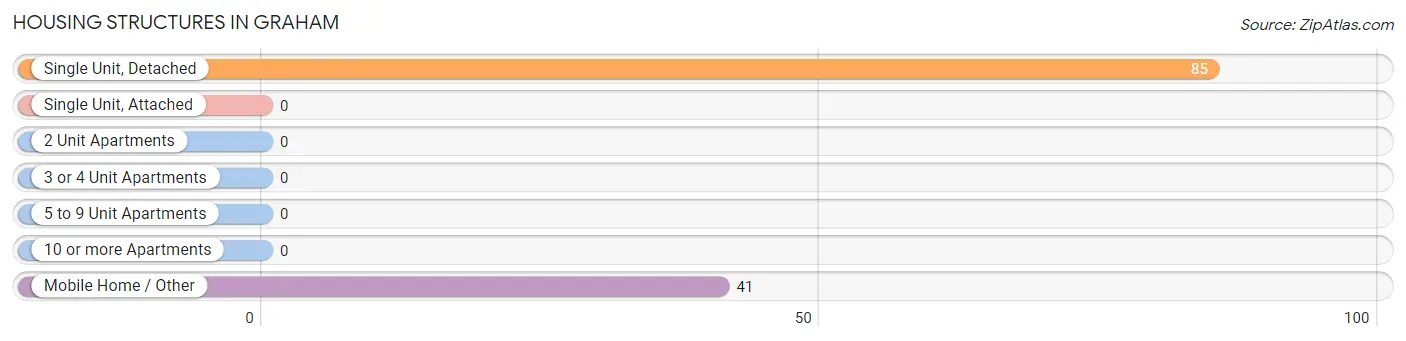
| Structure Type | # Housing Units | % Housing Units |
| Single Unit, Detached | 85 | 67.5% |
| Single Unit, Attached | 0 | 0.0% |
| 2 Unit Apartments | 0 | 0.0% |
| 3 or 4 Unit Apartments | 0 | 0.0% |
| 5 to 9 Unit Apartments | 0 | 0.0% |
| 10 or more Apartments | 0 | 0.0% |
| Mobile Home / Other | 41 | 32.5% |
| Total | 126 | 100.0% |
Housing Structures by Occupancy in Graham
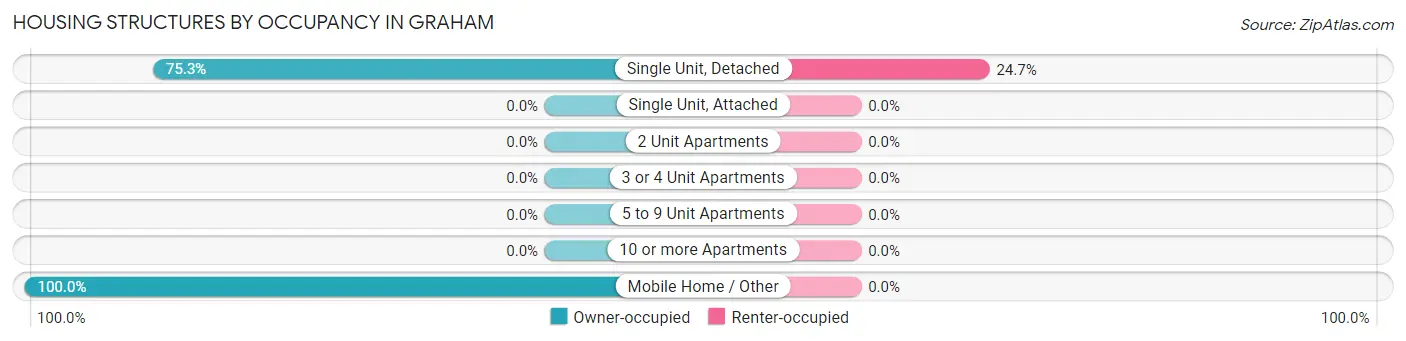
| Structure Type | Owner-occupied | Renter-occupied |
| Single Unit, Detached | 64 (75.3%) | 21 (24.7%) |
| Single Unit, Attached | 0 (0.0%) | 0 (0.0%) |
| 2 Unit Apartments | 0 (0.0%) | 0 (0.0%) |
| 3 or 4 Unit Apartments | 0 (0.0%) | 0 (0.0%) |
| 5 to 9 Unit Apartments | 0 (0.0%) | 0 (0.0%) |
| 10 or more Apartments | 0 (0.0%) | 0 (0.0%) |
| Mobile Home / Other | 41 (100.0%) | 0 (0.0%) |
| Total | 105 (83.3%) | 21 (16.7%) |
Housing Structures by Number of Rooms in Graham
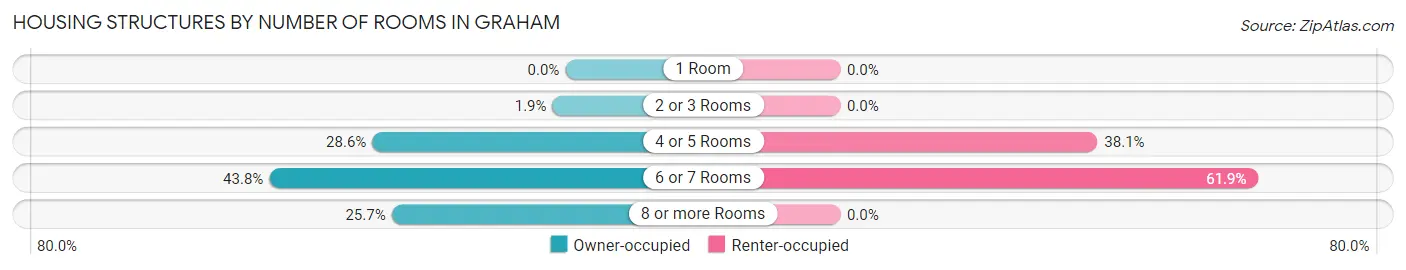
| Number of Rooms | Owner-occupied | Renter-occupied |
| 1 Room | 0 (0.0%) | 0 (0.0%) |
| 2 or 3 Rooms | 2 (1.9%) | 0 (0.0%) |
| 4 or 5 Rooms | 30 (28.6%) | 8 (38.1%) |
| 6 or 7 Rooms | 46 (43.8%) | 13 (61.9%) |
| 8 or more Rooms | 27 (25.7%) | 0 (0.0%) |
| Total | 105 (100.0%) | 21 (100.0%) |
Housing Structure by Heating Type in Graham
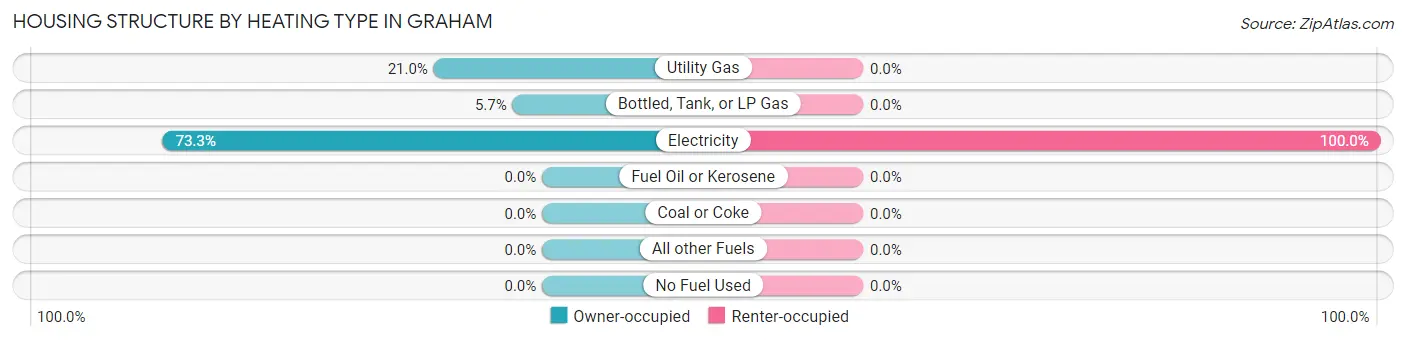
| Heating Type | Owner-occupied | Renter-occupied |
| Utility Gas | 22 (20.9%) | 0 (0.0%) |
| Bottled, Tank, or LP Gas | 6 (5.7%) | 0 (0.0%) |
| Electricity | 77 (73.3%) | 21 (100.0%) |
| Fuel Oil or Kerosene | 0 (0.0%) | 0 (0.0%) |
| Coal or Coke | 0 (0.0%) | 0 (0.0%) |
| All other Fuels | 0 (0.0%) | 0 (0.0%) |
| No Fuel Used | 0 (0.0%) | 0 (0.0%) |
| Total | 105 (100.0%) | 21 (100.0%) |
Household Vehicle Usage in Graham
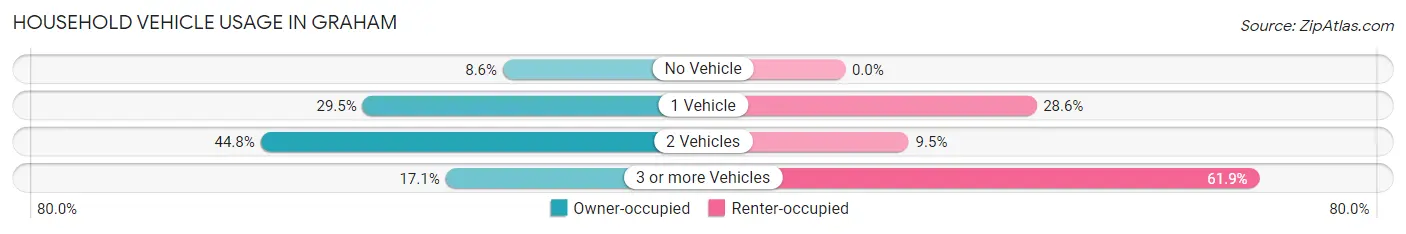
| Vehicles per Household | Owner-occupied | Renter-occupied |
| No Vehicle | 9 (8.6%) | 0 (0.0%) |
| 1 Vehicle | 31 (29.5%) | 6 (28.6%) |
| 2 Vehicles | 47 (44.8%) | 2 (9.5%) |
| 3 or more Vehicles | 18 (17.1%) | 13 (61.9%) |
| Total | 105 (100.0%) | 21 (100.0%) |
Real Estate & Mortgages in Graham
Real Estate and Mortgage Overview in Graham
| Characteristic | Without Mortgage | With Mortgage |
| Housing Units | 75 | 30 |
| Median Property Value | $57,500 | $63,600 |
| Median Household Income | $27,426 | $7 |
| Monthly Housing Costs | $368 | $0 |
| Real Estate Taxes | $368 | $0 |
Property Value by Mortgage Status in Graham
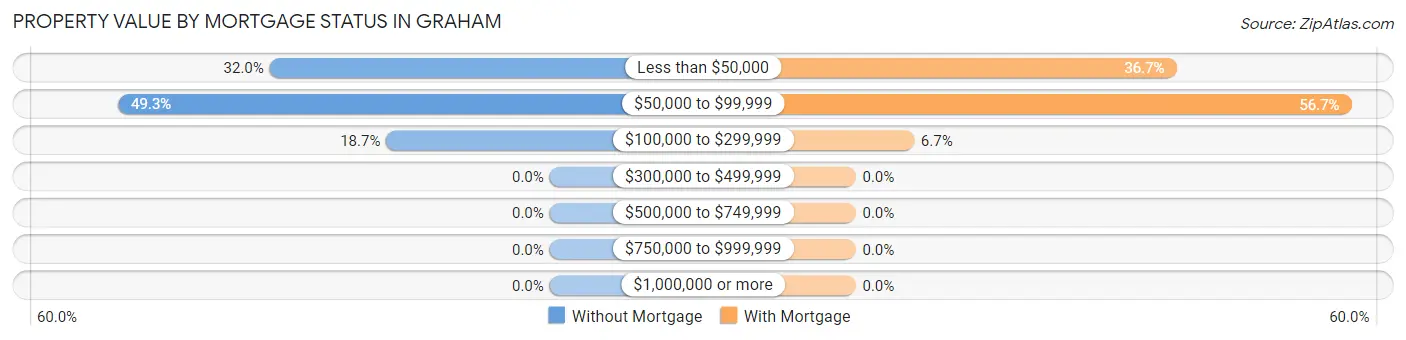
| Property Value | Without Mortgage | With Mortgage |
| Less than $50,000 | 24 (32.0%) | 11 (36.7%) |
| $50,000 to $99,999 | 37 (49.3%) | 17 (56.7%) |
| $100,000 to $299,999 | 14 (18.7%) | 2 (6.7%) |
| $300,000 to $499,999 | 0 (0.0%) | 0 (0.0%) |
| $500,000 to $749,999 | 0 (0.0%) | 0 (0.0%) |
| $750,000 to $999,999 | 0 (0.0%) | 0 (0.0%) |
| $1,000,000 or more | 0 (0.0%) | 0 (0.0%) |
| Total | 75 (100.0%) | 30 (100.0%) |
Household Income by Mortgage Status in Graham
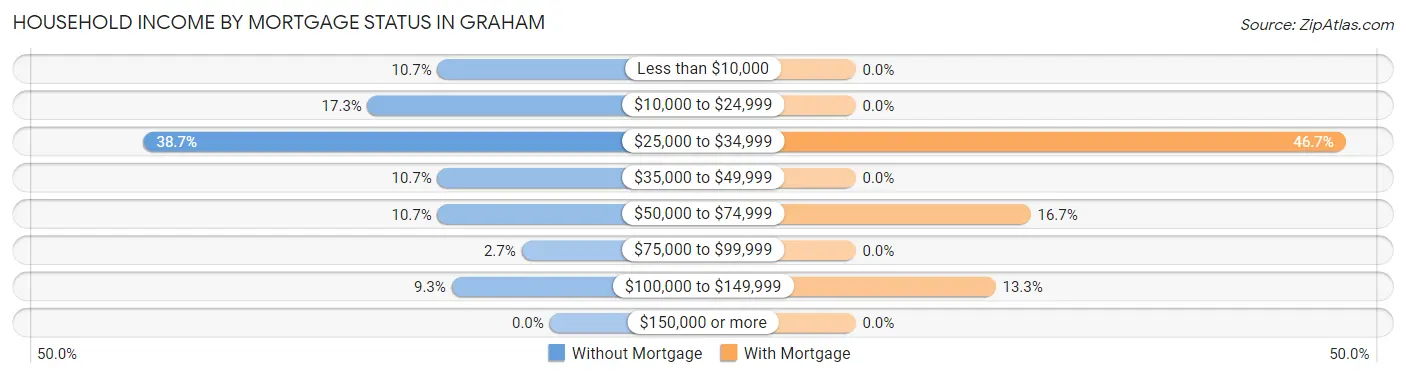
| Household Income | Without Mortgage | With Mortgage |
| Less than $10,000 | 8 (10.7%) | 0 (0.0%) |
| $10,000 to $24,999 | 13 (17.3%) | 0 (0.0%) |
| $25,000 to $34,999 | 29 (38.7%) | 14 (46.7%) |
| $35,000 to $49,999 | 8 (10.7%) | 0 (0.0%) |
| $50,000 to $74,999 | 8 (10.7%) | 5 (16.7%) |
| $75,000 to $99,999 | 2 (2.7%) | 0 (0.0%) |
| $100,000 to $149,999 | 7 (9.3%) | 4 (13.3%) |
| $150,000 or more | 0 (0.0%) | 0 (0.0%) |
| Total | 75 (100.0%) | 30 (100.0%) |
Property Value to Household Income Ratio in Graham
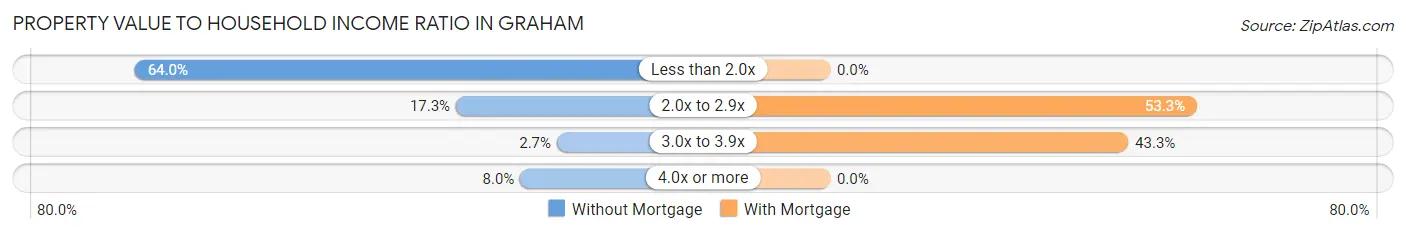
| Value-to-Income Ratio | Without Mortgage | With Mortgage |
| Less than 2.0x | 48 (64.0%) | 0 (0.0%) |
| 2.0x to 2.9x | 13 (17.3%) | 16 (53.3%) |
| 3.0x to 3.9x | 2 (2.7%) | 13 (43.3%) |
| 4.0x or more | 6 (8.0%) | 0 (0.0%) |
| Total | 75 (100.0%) | 30 (100.0%) |
Real Estate Taxes by Mortgage Status in Graham
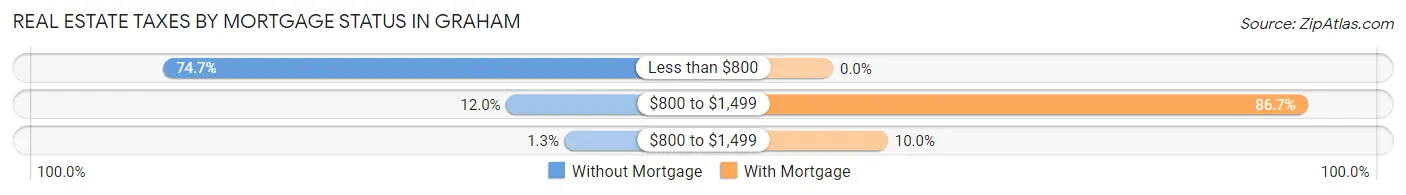
| Property Taxes | Without Mortgage | With Mortgage |
| Less than $800 | 56 (74.7%) | 0 (0.0%) |
| $800 to $1,499 | 9 (12.0%) | 26 (86.7%) |
| $800 to $1,499 | 1 (1.3%) | 3 (10.0%) |
| Total | 75 (100.0%) | 30 (100.0%) |
Health & Disability in Graham
Health Insurance Coverage by Age in Graham
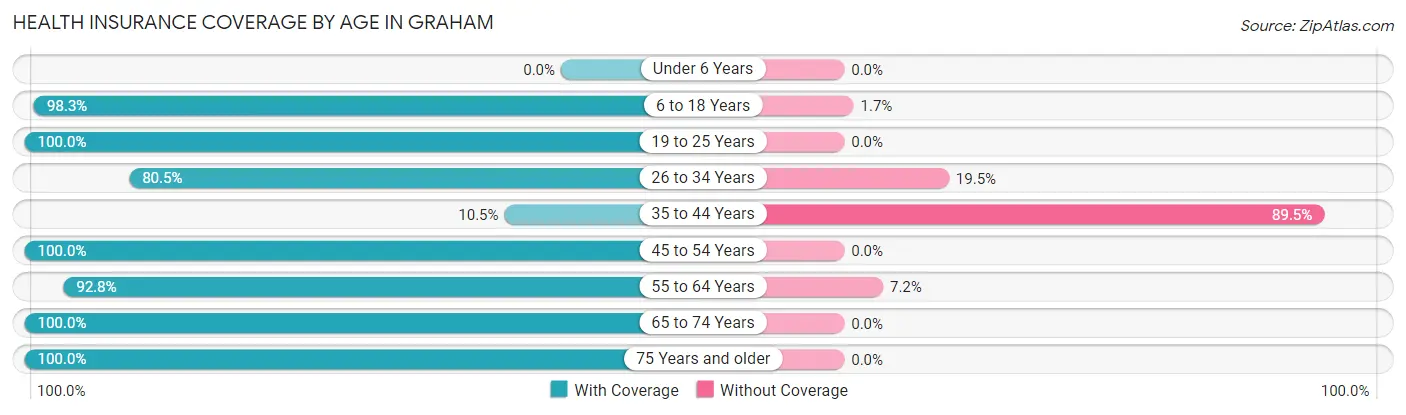
| Age Bracket | With Coverage | Without Coverage |
| Under 6 Years | 0 (0.0%) | 0 (0.0%) |
| 6 to 18 Years | 395 (98.3%) | 7 (1.7%) |
| 19 to 25 Years | 18 (100.0%) | 0 (0.0%) |
| 26 to 34 Years | 33 (80.5%) | 8 (19.5%) |
| 35 to 44 Years | 2 (10.5%) | 17 (89.5%) |
| 45 to 54 Years | 32 (100.0%) | 0 (0.0%) |
| 55 to 64 Years | 90 (92.8%) | 7 (7.2%) |
| 65 to 74 Years | 26 (100.0%) | 0 (0.0%) |
| 75 Years and older | 37 (100.0%) | 0 (0.0%) |
| Total | 633 (94.2%) | 39 (5.8%) |
Health Insurance Coverage by Citizenship Status in Graham
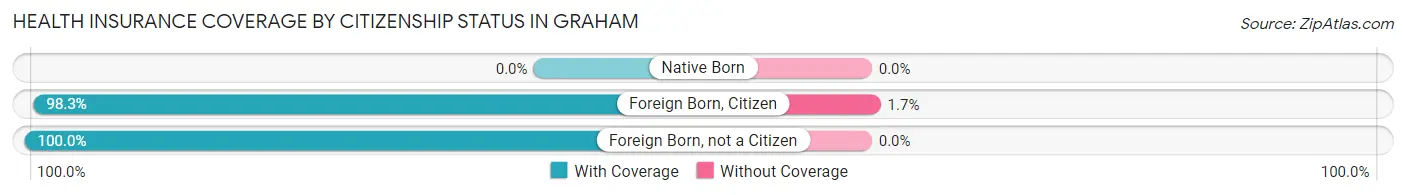
| Citizenship Status | With Coverage | Without Coverage |
| Native Born | 0 (0.0%) | 0 (0.0%) |
| Foreign Born, Citizen | 395 (98.3%) | 7 (1.7%) |
| Foreign Born, not a Citizen | 18 (100.0%) | 0 (0.0%) |
Health Insurance Coverage by Household Income in Graham
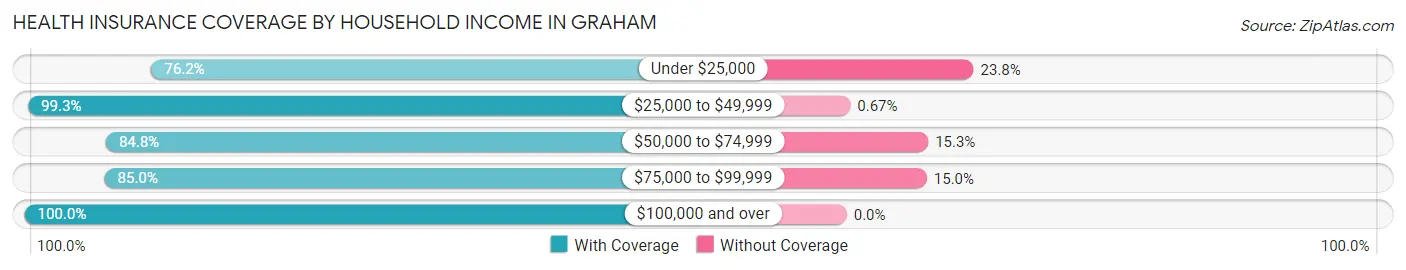
| Household Income | With Coverage | Without Coverage |
| Under $25,000 | 77 (76.2%) | 24 (23.8%) |
| $25,000 to $49,999 | 447 (99.3%) | 3 (0.7%) |
| $50,000 to $74,999 | 50 (84.8%) | 9 (15.2%) |
| $75,000 to $99,999 | 17 (85.0%) | 3 (15.0%) |
| $100,000 and over | 42 (100.0%) | 0 (0.0%) |
Public vs Private Health Insurance Coverage by Age in Graham
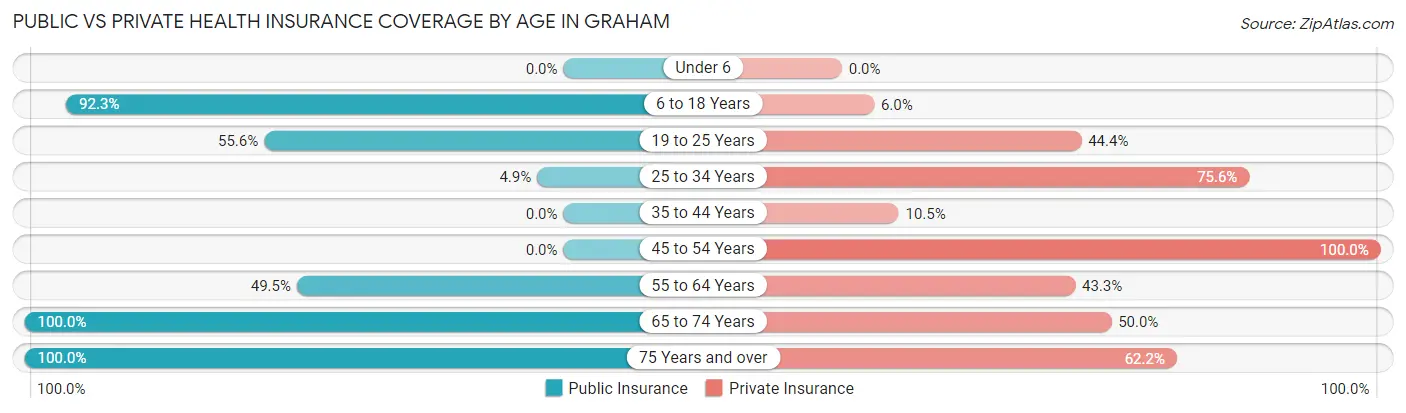
| Age Bracket | Public Insurance | Private Insurance |
| Under 6 | 0 (0.0%) | 0 (0.0%) |
| 6 to 18 Years | 371 (92.3%) | 24 (6.0%) |
| 19 to 25 Years | 10 (55.6%) | 8 (44.4%) |
| 25 to 34 Years | 2 (4.9%) | 31 (75.6%) |
| 35 to 44 Years | 0 (0.0%) | 2 (10.5%) |
| 45 to 54 Years | 0 (0.0%) | 32 (100.0%) |
| 55 to 64 Years | 48 (49.5%) | 42 (43.3%) |
| 65 to 74 Years | 26 (100.0%) | 13 (50.0%) |
| 75 Years and over | 37 (100.0%) | 23 (62.2%) |
| Total | 494 (73.5%) | 175 (26.0%) |
Disability Status by Sex by Age in Graham
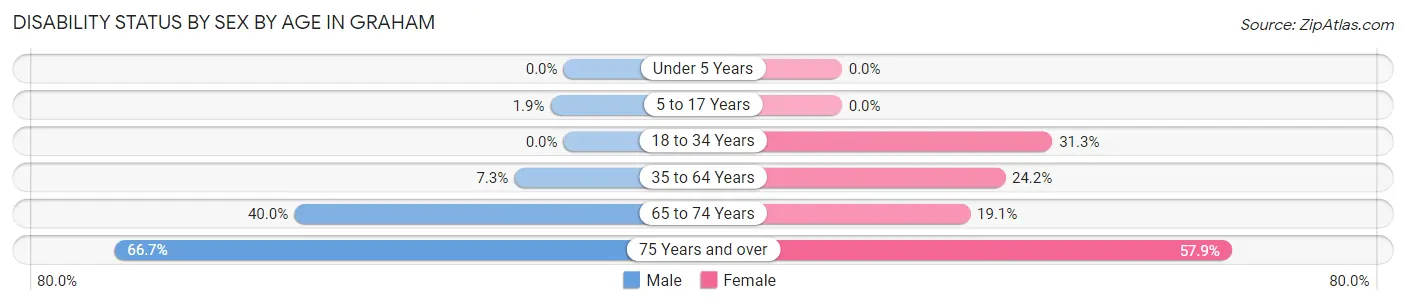
| Age Bracket | Male | Female |
| Under 5 Years | 0 (0.0%) | 0 (0.0%) |
| 5 to 17 Years | 3 (1.9%) | 0 (0.0%) |
| 18 to 34 Years | 0 (0.0%) | 10 (31.2%) |
| 35 to 64 Years | 6 (7.3%) | 16 (24.2%) |
| 65 to 74 Years | 2 (40.0%) | 4 (19.1%) |
| 75 Years and over | 12 (66.7%) | 11 (57.9%) |
Disability Class by Sex by Age in Graham
Disability Class: Hearing Difficulty
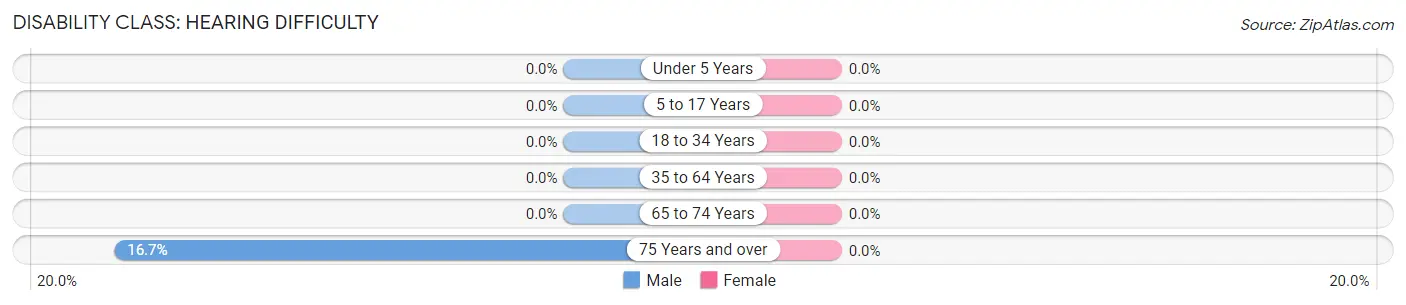
| Age Bracket | Male | Female |
| Under 5 Years | 0 (0.0%) | 0 (0.0%) |
| 5 to 17 Years | 0 (0.0%) | 0 (0.0%) |
| 18 to 34 Years | 0 (0.0%) | 0 (0.0%) |
| 35 to 64 Years | 0 (0.0%) | 0 (0.0%) |
| 65 to 74 Years | 0 (0.0%) | 0 (0.0%) |
| 75 Years and over | 3 (16.7%) | 0 (0.0%) |
Disability Class: Vision Difficulty
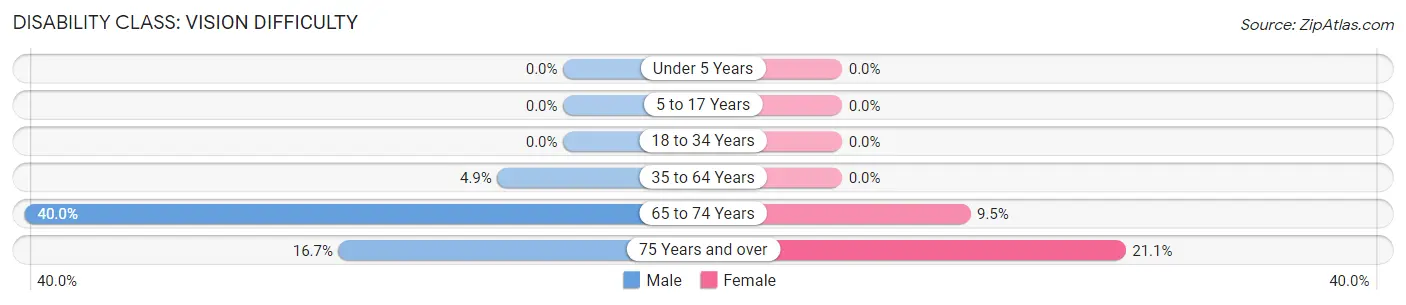
| Age Bracket | Male | Female |
| Under 5 Years | 0 (0.0%) | 0 (0.0%) |
| 5 to 17 Years | 0 (0.0%) | 0 (0.0%) |
| 18 to 34 Years | 0 (0.0%) | 0 (0.0%) |
| 35 to 64 Years | 4 (4.9%) | 0 (0.0%) |
| 65 to 74 Years | 2 (40.0%) | 2 (9.5%) |
| 75 Years and over | 3 (16.7%) | 4 (21.0%) |
Disability Class: Cognitive Difficulty
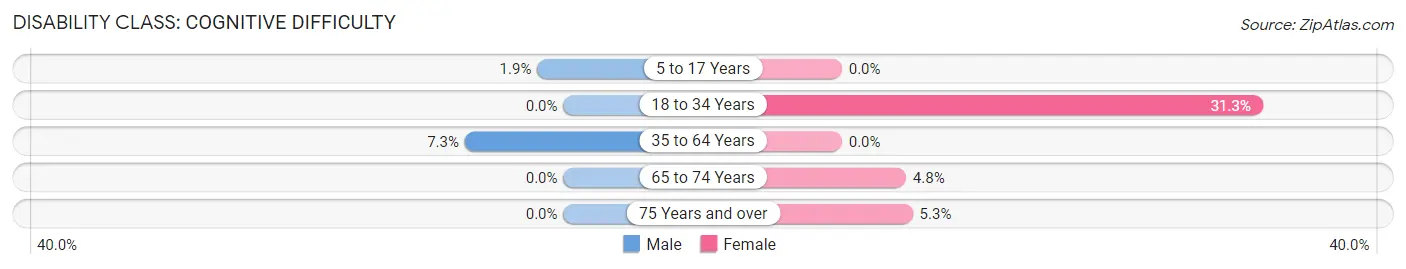
| Age Bracket | Male | Female |
| 5 to 17 Years | 3 (1.9%) | 0 (0.0%) |
| 18 to 34 Years | 0 (0.0%) | 10 (31.2%) |
| 35 to 64 Years | 6 (7.3%) | 0 (0.0%) |
| 65 to 74 Years | 0 (0.0%) | 1 (4.8%) |
| 75 Years and over | 0 (0.0%) | 1 (5.3%) |
Disability Class: Ambulatory Difficulty
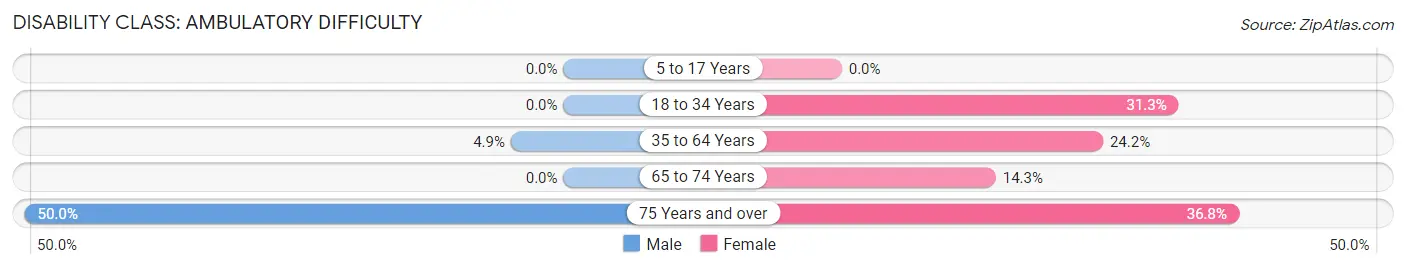
| Age Bracket | Male | Female |
| 5 to 17 Years | 0 (0.0%) | 0 (0.0%) |
| 18 to 34 Years | 0 (0.0%) | 10 (31.2%) |
| 35 to 64 Years | 4 (4.9%) | 16 (24.2%) |
| 65 to 74 Years | 0 (0.0%) | 3 (14.3%) |
| 75 Years and over | 9 (50.0%) | 7 (36.8%) |
Disability Class: Self-Care Difficulty
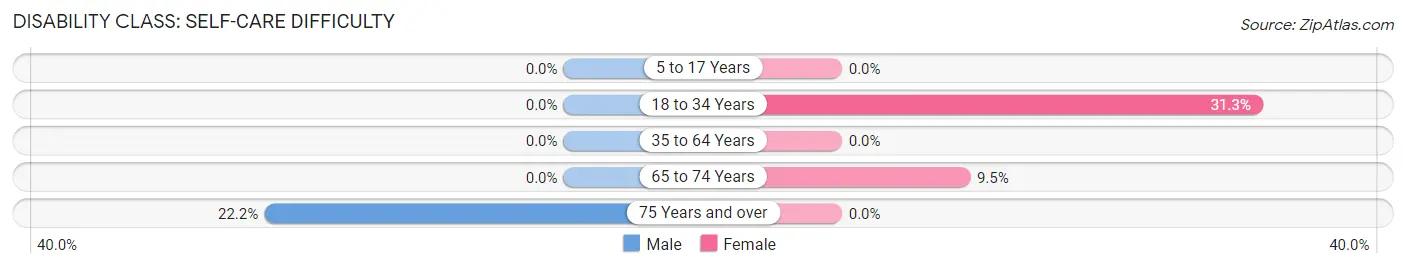
| Age Bracket | Male | Female |
| 5 to 17 Years | 0 (0.0%) | 0 (0.0%) |
| 18 to 34 Years | 0 (0.0%) | 10 (31.2%) |
| 35 to 64 Years | 0 (0.0%) | 0 (0.0%) |
| 65 to 74 Years | 0 (0.0%) | 2 (9.5%) |
| 75 Years and over | 4 (22.2%) | 0 (0.0%) |
Technology Access in Graham
Computing Device Access in Graham
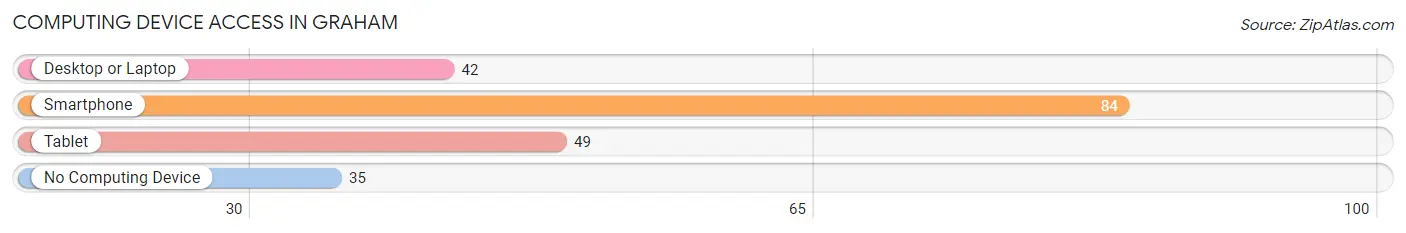
| Device Type | # Households | % Households |
| Desktop or Laptop | 42 | 33.3% |
| Smartphone | 84 | 66.7% |
| Tablet | 49 | 38.9% |
| No Computing Device | 35 | 27.8% |
| Total | 126 | 100.0% |
Internet Access in Graham
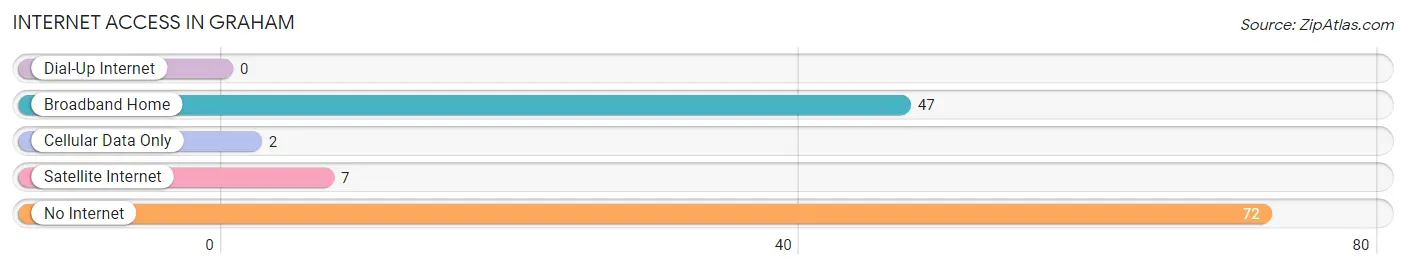
| Internet Type | # Households | % Households |
| Dial-Up Internet | 0 | 0.0% |
| Broadband Home | 47 | 37.3% |
| Cellular Data Only | 2 | 1.6% |
| Satellite Internet | 7 | 5.6% |
| No Internet | 72 | 57.1% |
| Total | 126 | 100.0% |
Graham Summary
Graham, Georgia is a small city located in the northwest corner of the state, in the foothills of the Appalachian Mountains. It is part of the Chattanooga, Tennessee-Georgia metropolitan area, and is the county seat of Catoosa County. The city has a population of approximately 4,000 people, and is known for its rural charm and small-town atmosphere.
History
The area that is now Graham was first settled in the early 1800s by settlers from North Carolina. The town was originally known as “Catoosa Station”, and was named after the nearby Cherokee village of Catoosa. In 1851, the town was renamed “Graham” in honor of the Reverend John Graham, a local minister.
In the late 1800s, Graham began to grow and develop as a commercial center for the surrounding area. The town was home to several stores, a hotel, a bank, and a post office. In 1891, the town was incorporated, and in 1895, the first public school was established.
Geography
Graham is located in the northwest corner of Georgia, in the foothills of the Appalachian Mountains. The city is situated along the banks of the Conasauga River, and is surrounded by the Cherokee National Forest. The city is located approximately 30 miles from Chattanooga, Tennessee, and is part of the Chattanooga, Tennessee-Georgia metropolitan area.
The climate in Graham is humid subtropical, with hot, humid summers and mild winters. The average annual temperature is around 60 degrees Fahrenheit, and the average annual precipitation is around 50 inches.
Economy
The economy of Graham is largely based on agriculture and tourism. The city is home to several farms, and the surrounding area is known for its production of corn, soybeans, and other crops. The city is also home to several tourist attractions, including the Catoosa County Historical Museum, the Graham Historic District, and the Conasauga River.
In addition to agriculture and tourism, Graham is home to several small businesses, including restaurants, retail stores, and service providers. The city is also home to several manufacturing companies, including a paper mill and a furniture factory.
Demographics
As of the 2010 census, the population of Graham was 4,000 people. The racial makeup of the city was 94.3% White, 2.2% African American, 0.7% Native American, 0.3% Asian, 0.1% Pacific Islander, and 2.4% from other races. The median household income was $35,000, and the median family income was $41,000.
The population of Graham is largely Christian, with the majority of residents belonging to the Baptist, Methodist, and Presbyterian denominations. The city is also home to a small Jewish community.
Conclusion
Graham, Georgia is a small city located in the northwest corner of the state, in the foothills of the Appalachian Mountains. It is part of the Chattanooga, Tennessee-Georgia metropolitan area, and is the county seat of Catoosa County. The city has a population of approximately 4,000 people, and is known for its rural charm and small-town atmosphere. The economy of Graham is largely based on agriculture and tourism, and the population is largely Christian. Graham is a charming city with a rich history and a vibrant economy.
Common Questions
What is the Total Population of Graham?
Total Population of Graham is 672.
What is the Total Male Population of Graham?
Total Male Population of Graham is 307.
What is the Total Female Population of Graham?
Total Female Population of Graham is 365.
What is the Ratio of Males per 100 Females in Graham?
There are 84.11 Males per 100 Females in Graham.
What is the Ratio of Females per 100 Males in Graham?
There are 118.89 Females per 100 Males in Graham.
What is the Median Population Age in Graham?
Median Population Age in Graham is 17.5 Years.
What is the Average Family Size in Graham
Average Family Size in Graham is 6.4 People.
What is the Average Household Size in Graham
Average Household Size in Graham is 5.3 People.
What is Per Capita Income in Graham?
Per Capita income in Graham is $9,941.
What is the Median Family Income in Graham?
Median Family Income in Graham is $39,306.
What is the Median Household income in Graham?
Median Household Income in Graham is $32,222.
What is Family Income Deficit in Graham?
Family Income Deficit in Graham is $11,664.
Families that are below poverty line in Graham earn $11,664 less on average than the poverty threshold level.
What is Inequality or Gini Index in Graham?
Inequality or Gini Index in Graham is 0.47.
How Large is the Labor Force in Graham?
There are 134 People in the Labor Forcein in Graham.
What is the Percentage of People in the Labor Force in Graham?
33.9% of People are in the Labor Force in Graham.
What is the Unemployment Rate in Graham?
Unemployment Rate in Graham is 7.5%.