Good Hope, GA
Good Hope Map
Good Hope Overview
365
TOTAL POPULATION
192
MALE POPULATION
173
FEMALE POPULATION
110.98
MALES / 100 FEMALES
90.10
FEMALES / 100 MALES
38.3
MEDIAN AGE
2.7
AVG FAMILY SIZE
2.4
AVG HOUSEHOLD SIZE
$32,694
PER CAPITA INCOME
$84,583
AVG FAMILY INCOME
$72,188
AVG HOUSEHOLD INCOME
20.7%
WAGE / INCOME GAP [ % ]
79.3¢/ $1
WAGE / INCOME GAP [ $ ]
0.33
INEQUALITY / GINI INDEX
161
LABOR FORCE [ PEOPLE ]
56.1%
PERCENT IN LABOR FORCE
Good Hope Zip Codes
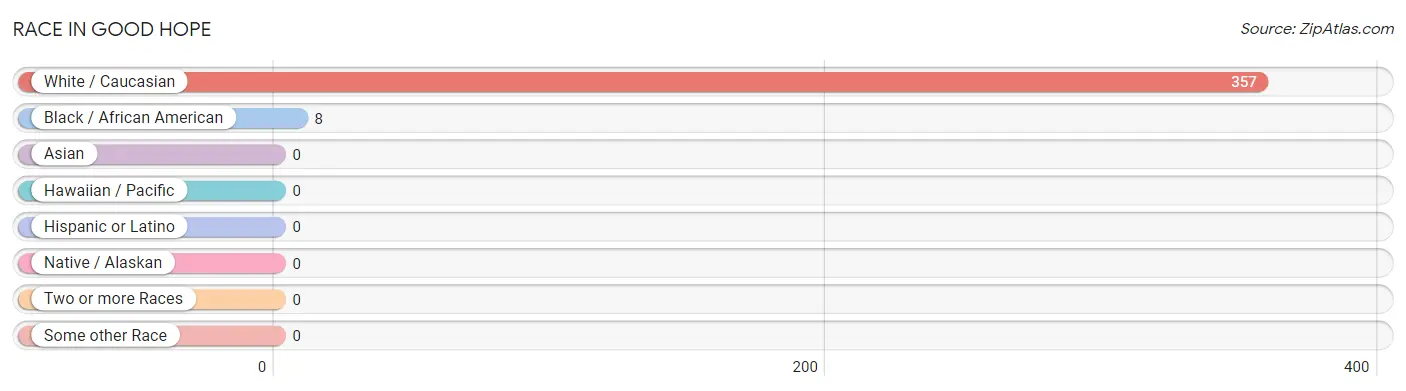
Race in Good Hope
The most populous races in Good Hope are White / Caucasian (357 | 97.8%), and Black / African American (8 | 2.2%).
| Race | # Population | % Population |
| Asian | 0 | 0.0% |
| Black / African American | 8 | 2.2% |
| Hawaiian / Pacific | 0 | 0.0% |
| Hispanic or Latino | 0 | 0.0% |
| Native / Alaskan | 0 | 0.0% |
| White / Caucasian | 357 | 97.8% |
| Two or more Races | 0 | 0.0% |
| Some other Race | 0 | 0.0% |
| Total | 365 | 100.0% |
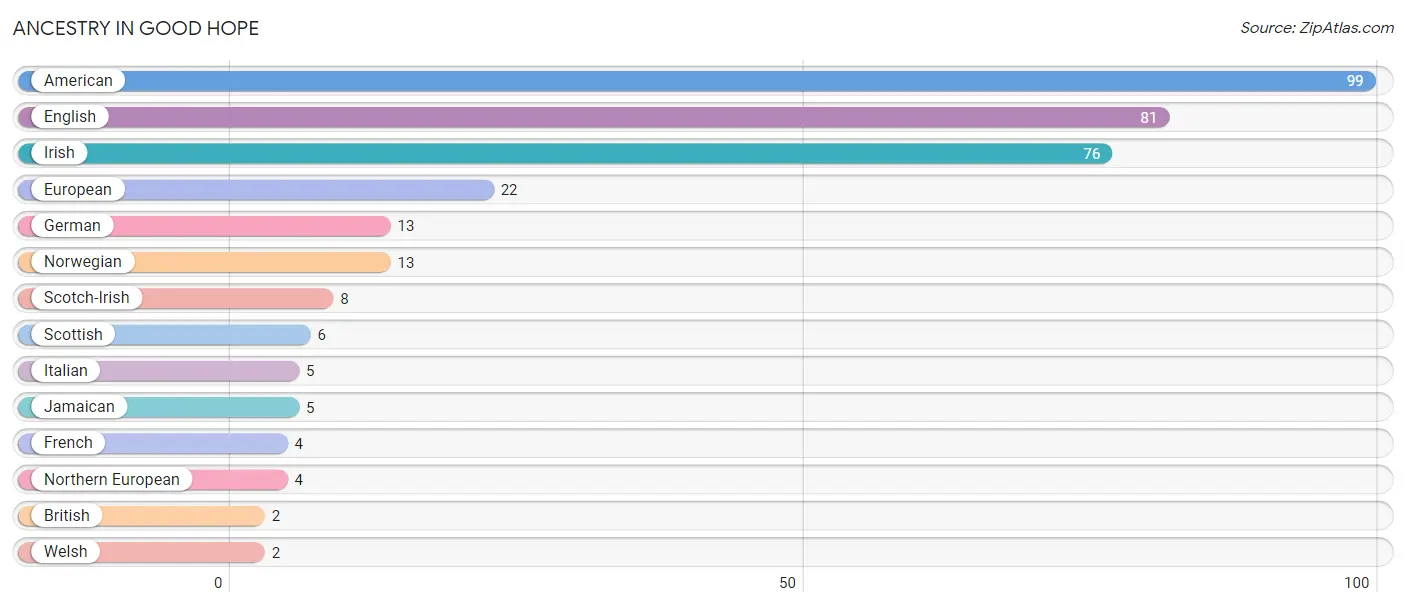
Ancestry in Good Hope
The most populous ancestries reported in Good Hope are American (99 | 27.1%), English (81 | 22.2%), Irish (76 | 20.8%), European (22 | 6.0%), and German (13 | 3.6%), together accounting for 79.7% of all Good Hope residents.
| Ancestry | # Population | % Population |
| American | 99 | 27.1% |
| British | 2 | 0.5% |
| English | 81 | 22.2% |
| European | 22 | 6.0% |
| French | 4 | 1.1% |
| German | 13 | 3.6% |
| Irish | 76 | 20.8% |
| Italian | 5 | 1.4% |
| Jamaican | 5 | 1.4% |
| Northern European | 4 | 1.1% |
| Norwegian | 13 | 3.6% |
| Scotch-Irish | 8 | 2.2% |
| Scottish | 6 | 1.6% |
| Welsh | 2 | 0.5% | View All 14 Rows |
Immigrants in Good Hope

| Immigration Origin | # Population | % Population | View All 0 Rows |
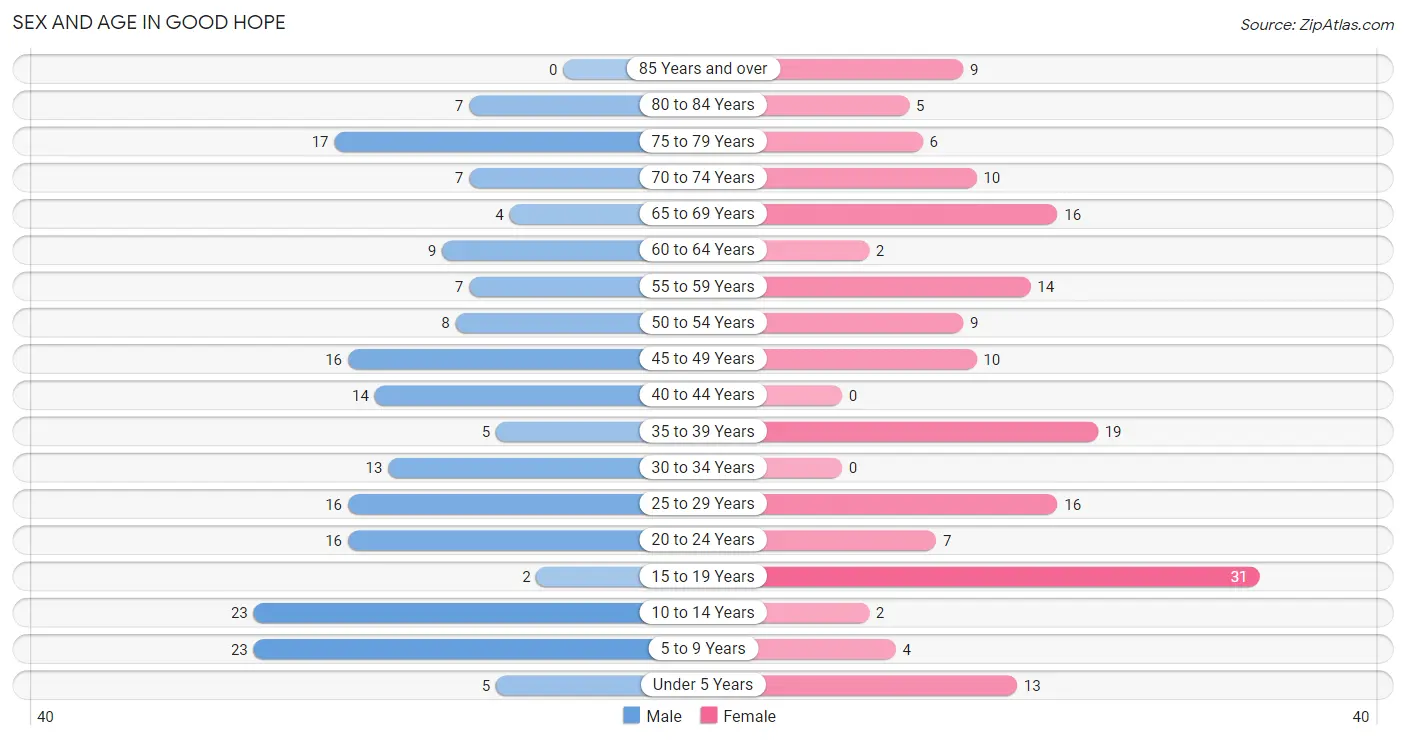
Sex and Age in Good Hope
Sex and Age in Good Hope
The most populous age groups in Good Hope are 5 to 9 Years (23 | 12.0%) for men and 15 to 19 Years (31 | 17.9%) for women.
| Age Bracket | Male | Female |
| Under 5 Years | 5 (2.6%) | 13 (7.5%) |
| 5 to 9 Years | 23 (12.0%) | 4 (2.3%) |
| 10 to 14 Years | 23 (12.0%) | 2 (1.2%) |
| 15 to 19 Years | 2 (1.0%) | 31 (17.9%) |
| 20 to 24 Years | 16 (8.3%) | 7 (4.1%) |
| 25 to 29 Years | 16 (8.3%) | 16 (9.2%) |
| 30 to 34 Years | 13 (6.8%) | 0 (0.0%) |
| 35 to 39 Years | 5 (2.6%) | 19 (11.0%) |
| 40 to 44 Years | 14 (7.3%) | 0 (0.0%) |
| 45 to 49 Years | 16 (8.3%) | 10 (5.8%) |
| 50 to 54 Years | 8 (4.2%) | 9 (5.2%) |
| 55 to 59 Years | 7 (3.6%) | 14 (8.1%) |
| 60 to 64 Years | 9 (4.7%) | 2 (1.2%) |
| 65 to 69 Years | 4 (2.1%) | 16 (9.2%) |
| 70 to 74 Years | 7 (3.6%) | 10 (5.8%) |
| 75 to 79 Years | 17 (8.8%) | 6 (3.5%) |
| 80 to 84 Years | 7 (3.6%) | 5 (2.9%) |
| 85 Years and over | 0 (0.0%) | 9 (5.2%) |
| Total | 192 (100.0%) | 173 (100.0%) |
Families and Households in Good Hope
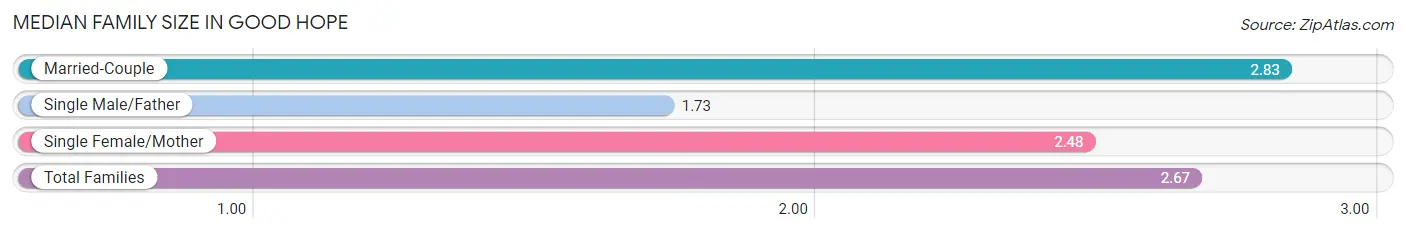
Median Family Size in Good Hope
The median family size in Good Hope is 2.67 persons per family, with married-couple families (93 | 73.2%) accounting for the largest median family size of 2.83 persons per family. On the other hand, single male/father families (11 | 8.7%) represent the smallest median family size with 1.73 persons per family.
| Family Type | # Families | Family Size |
| Married-Couple | 93 (73.2%) | 2.83 |
| Single Male/Father | 11 (8.7%) | 1.73 |
| Single Female/Mother | 23 (18.1%) | 2.48 |
| Total Families | 127 (100.0%) | 2.67 |
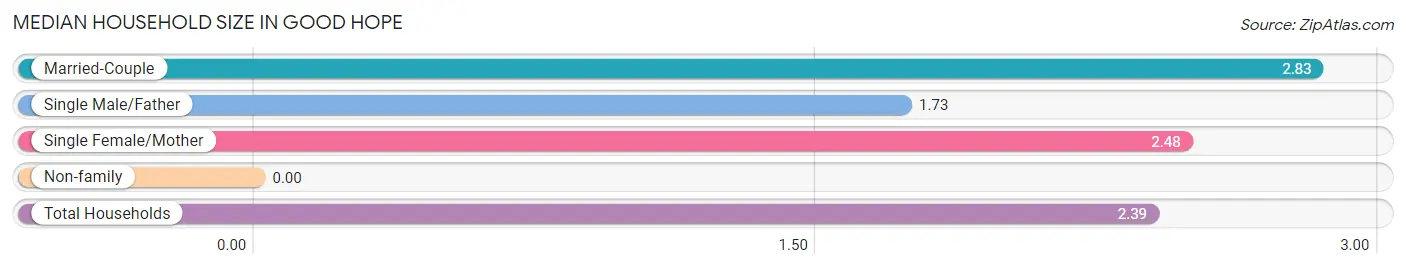
Median Household Size in Good Hope
| Household Type | # Households | Household Size |
| Married-Couple | 93 (60.8%) | 2.83 |
| Single Male/Father | 11 (7.2%) | 1.73 |
| Single Female/Mother | 23 (15.0%) | 2.48 |
| Non-family | 26 (17.0%) | - |
| Total Households | 153 (100.0%) | 2.39 |
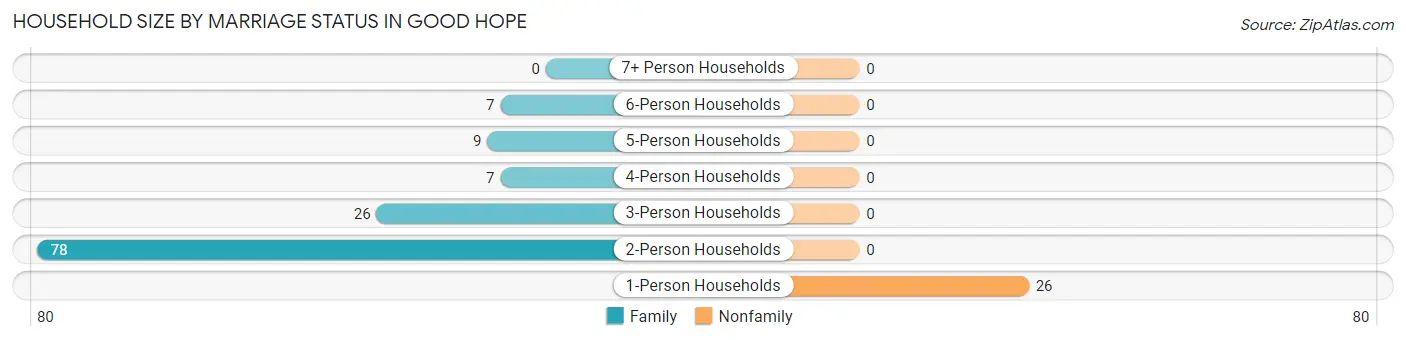
Household Size by Marriage Status in Good Hope
Out of a total of 153 households in Good Hope, 127 (83.0%) are family households, while 26 (17.0%) are nonfamily households. The most numerous type of family households are 2-person households, comprising 78, and the most common type of nonfamily households are 1-person households, comprising 26.
| Household Size | Family Households | Nonfamily Households |
| 1-Person Households | - | 26 (17.0%) |
| 2-Person Households | 78 (51.0%) | 0 (0.0%) |
| 3-Person Households | 26 (17.0%) | 0 (0.0%) |
| 4-Person Households | 7 (4.6%) | 0 (0.0%) |
| 5-Person Households | 9 (5.9%) | 0 (0.0%) |
| 6-Person Households | 7 (4.6%) | 0 (0.0%) |
| 7+ Person Households | 0 (0.0%) | 0 (0.0%) |
| Total | 127 (83.0%) | 26 (17.0%) |
Female Fertility in Good Hope
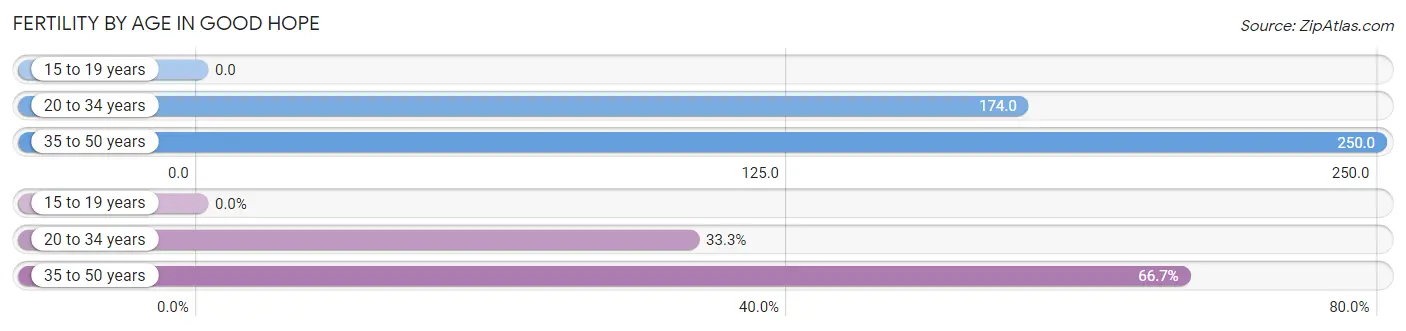
Fertility by Age in Good Hope
Average fertility rate in Good Hope is 140.0 births per 1,000 women. Women in the age bracket of 35 to 50 years have the highest fertility rate with 250.0 births per 1,000 women. Women in the age bracket of 35 to 50 years acount for 66.7% of all women with births.
| Age Bracket | Women with Births | Births / 1,000 Women |
| 15 to 19 years | 0 (0.0%) | 0.0 |
| 20 to 34 years | 4 (33.3%) | 174.0 |
| 35 to 50 years | 8 (66.7%) | 250.0 |
| Total | 12 (100.0%) | 140.0 |
Fertility by Age by Marriage Status in Good Hope
75.0% of women with births (12) in Good Hope are married. The highest percentage of unmarried women with births falls into 35 to 50 years age bracket with 37.5% of them unmarried at the time of birth, while the lowest percentage of unmarried women with births belong to 20 to 34 years age bracket with 0.0% of them unmarried.
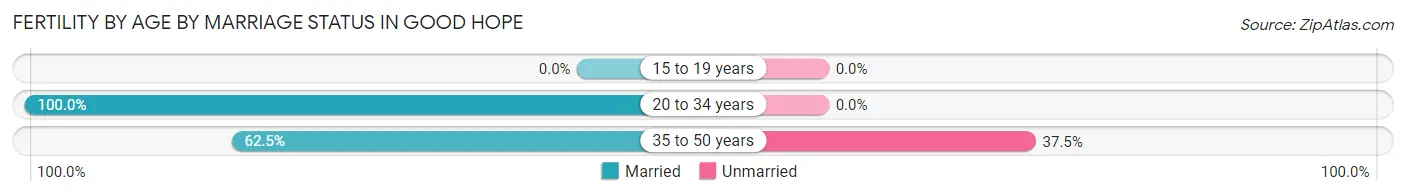
| Age Bracket | Married | Unmarried |
| 15 to 19 years | 0 (0.0%) | 0 (0.0%) |
| 20 to 34 years | 4 (100.0%) | 0 (0.0%) |
| 35 to 50 years | 5 (62.5%) | 3 (37.5%) |
| Total | 9 (75.0%) | 3 (25.0%) |
Fertility by Education in Good Hope
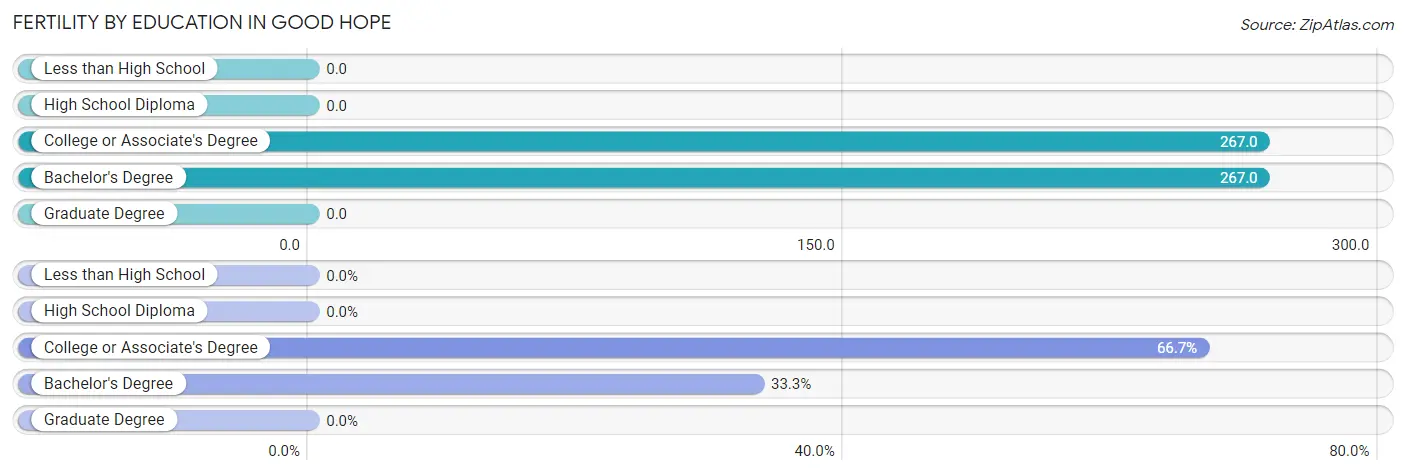
| Educational Attainment | Women with Births | Births / 1,000 Women |
| Less than High School | 0 (0.0%) | 0.0 |
| High School Diploma | 0 (0.0%) | 0.0 |
| College or Associate's Degree | 8 (66.7%) | 267.0 |
| Bachelor's Degree | 4 (33.3%) | 267.0 |
| Graduate Degree | 0 (0.0%) | 0.0 |
| Total | 12 (100.0%) | 140.0 |
Fertility by Education by Marriage Status in Good Hope
25.0% of women with births in Good Hope are unmarried. Women with the educational attainment of bachelor's degree are most likely to be married with 100.0% of them married at childbirth, while women with the educational attainment of college or associate's degree are least likely to be married with 37.5% of them unmarried at childbirth.
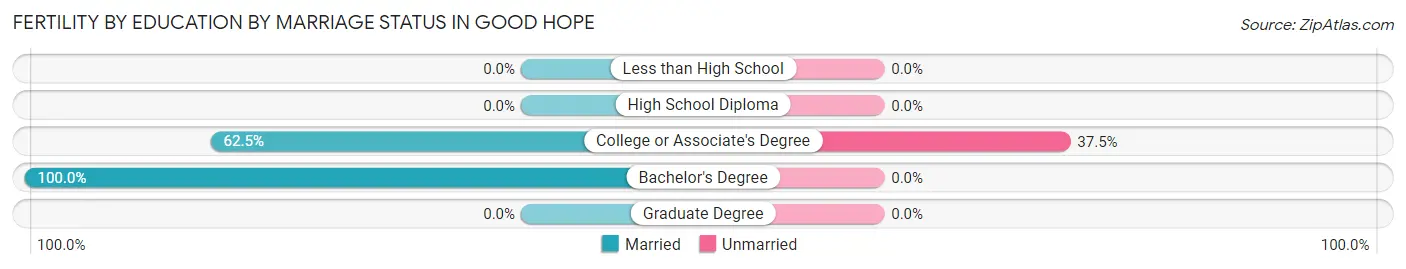
| Educational Attainment | Married | Unmarried |
| Less than High School | 0 (0.0%) | 0 (0.0%) |
| High School Diploma | 0 (0.0%) | 0 (0.0%) |
| College or Associate's Degree | 5 (62.5%) | 3 (37.5%) |
| Bachelor's Degree | 4 (100.0%) | 0 (0.0%) |
| Graduate Degree | 0 (0.0%) | 0 (0.0%) |
| Total | 9 (75.0%) | 3 (25.0%) |
Income in Good Hope
Income Overview in Good Hope
Per Capita Income in Good Hope is $32,694, while median incomes of families and households are $84,583 and $72,188 respectively.
| Characteristic | Number | Measure |
| Per Capita Income | 365 | $32,694 |
| Median Family Income | 127 | $84,583 |
| Mean Family Income | 127 | $86,256 |
| Median Household Income | 153 | $72,188 |
| Mean Household Income | 153 | $80,305 |
| Income Deficit | 127 | $0 |
| Wage / Income Gap (%) | 365 | 20.68% |
| Wage / Income Gap ($) | 365 | 79.32¢ per $1 |
| Gini / Inequality Index | 365 | 0.33 |
Earnings by Sex in Good Hope
Average Earnings in Good Hope are $53,603, $57,857 for men and $45,893 for women, a difference of 20.7%.
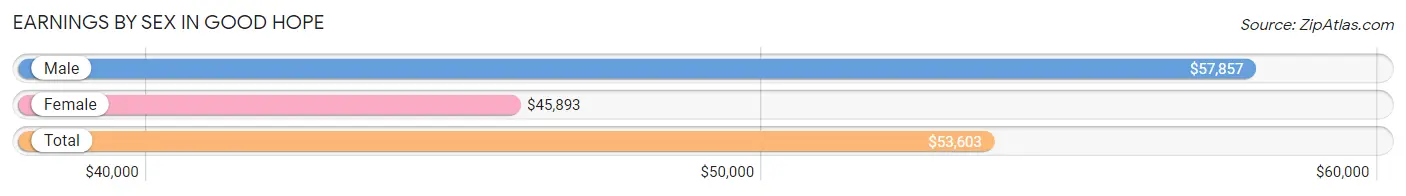
| Sex | Number | Average Earnings |
| Male | 102 (57.0%) | $57,857 |
| Female | 77 (43.0%) | $45,893 |
| Total | 179 (100.0%) | $53,603 |
Earnings by Sex by Income Bracket in Good Hope
The most common earnings brackets in Good Hope are $50,000 to $54,999 for men (26 | 25.5%) and $55,000 to $64,999 for women (18 | 23.4%).
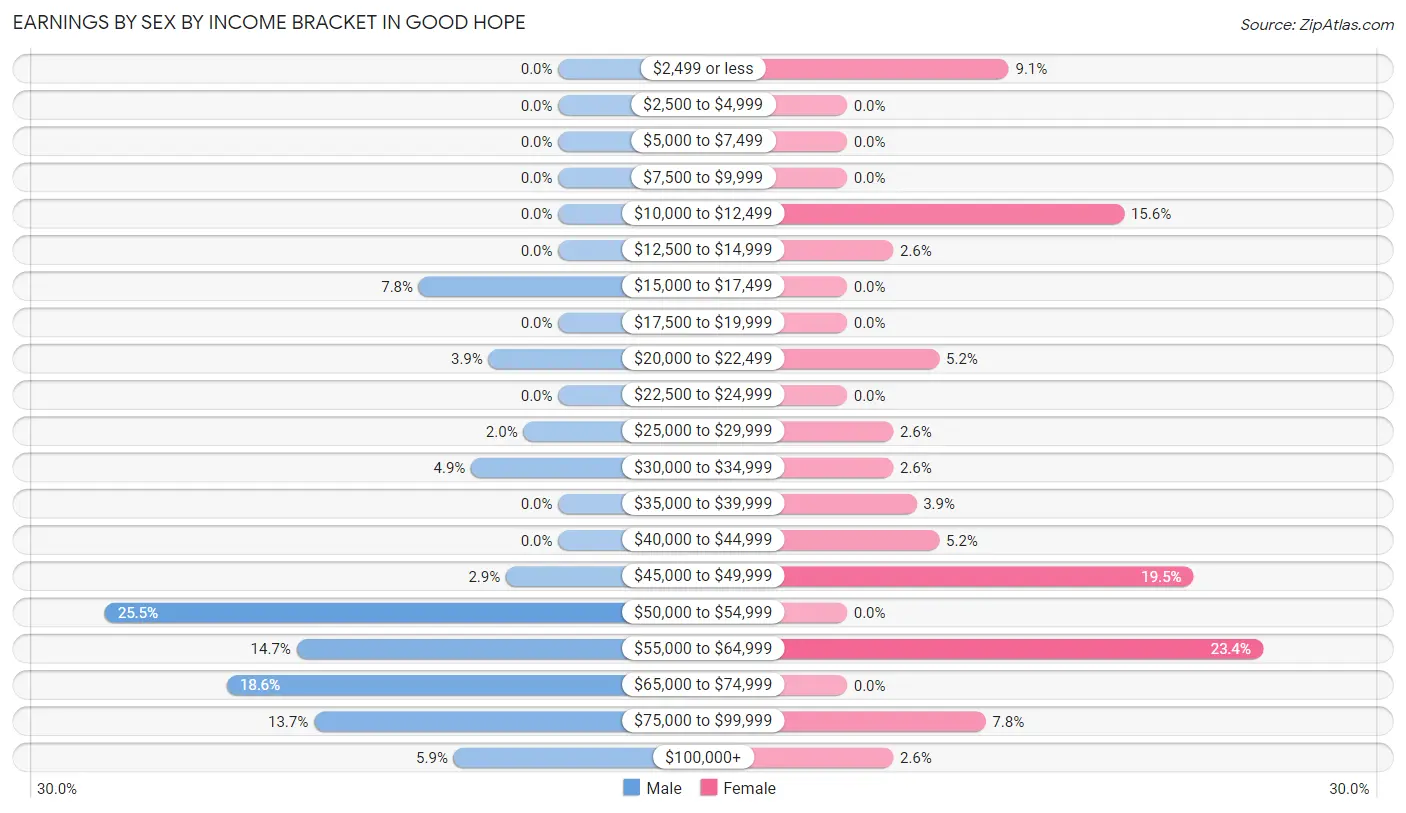
| Income | Male | Female |
| $2,499 or less | 0 (0.0%) | 7 (9.1%) |
| $2,500 to $4,999 | 0 (0.0%) | 0 (0.0%) |
| $5,000 to $7,499 | 0 (0.0%) | 0 (0.0%) |
| $7,500 to $9,999 | 0 (0.0%) | 0 (0.0%) |
| $10,000 to $12,499 | 0 (0.0%) | 12 (15.6%) |
| $12,500 to $14,999 | 0 (0.0%) | 2 (2.6%) |
| $15,000 to $17,499 | 8 (7.8%) | 0 (0.0%) |
| $17,500 to $19,999 | 0 (0.0%) | 0 (0.0%) |
| $20,000 to $22,499 | 4 (3.9%) | 4 (5.2%) |
| $22,500 to $24,999 | 0 (0.0%) | 0 (0.0%) |
| $25,000 to $29,999 | 2 (2.0%) | 2 (2.6%) |
| $30,000 to $34,999 | 5 (4.9%) | 2 (2.6%) |
| $35,000 to $39,999 | 0 (0.0%) | 3 (3.9%) |
| $40,000 to $44,999 | 0 (0.0%) | 4 (5.2%) |
| $45,000 to $49,999 | 3 (2.9%) | 15 (19.5%) |
| $50,000 to $54,999 | 26 (25.5%) | 0 (0.0%) |
| $55,000 to $64,999 | 15 (14.7%) | 18 (23.4%) |
| $65,000 to $74,999 | 19 (18.6%) | 0 (0.0%) |
| $75,000 to $99,999 | 14 (13.7%) | 6 (7.8%) |
| $100,000+ | 6 (5.9%) | 2 (2.6%) |
| Total | 102 (100.0%) | 77 (100.0%) |
Earnings by Sex by Educational Attainment in Good Hope
Average earnings in Good Hope are $60,833 for men and $48,281 for women, a difference of 20.6%. Men with an educational attainment of high school diploma enjoy the highest average annual earnings of $72,083, while those with less than high school education earn the least with $47,083. Women with an educational attainment of graduate degree earn the most with the average annual earnings of $61,750, while those with college or associate's degree education have the smallest earnings of $41,250.
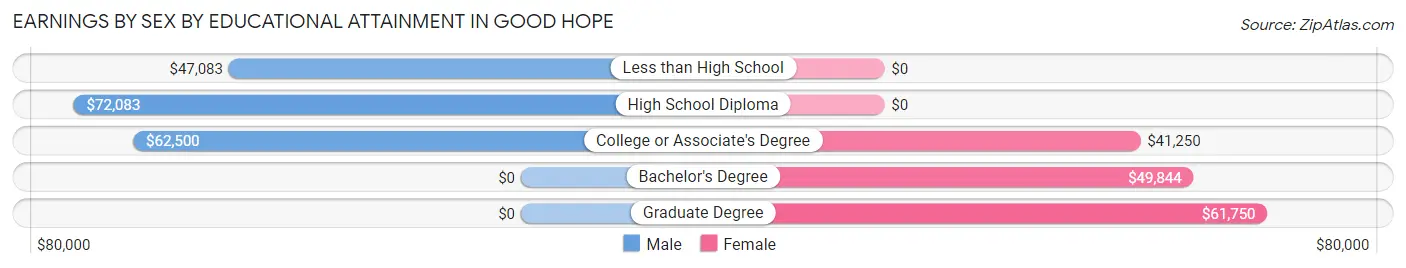
| Educational Attainment | Male Income | Female Income |
| Less than High School | $47,083 | $0 |
| High School Diploma | $72,083 | $0 |
| College or Associate's Degree | $62,500 | $41,250 |
| Bachelor's Degree | - | - |
| Graduate Degree | - | - |
| Total | $60,833 | $48,281 |
Family Income in Good Hope
Family Income Brackets in Good Hope
According to the Good Hope family income data, there are 37 families falling into the $100,000 to $149,999 income range, which is the most common income bracket and makes up 29.1% of all families.
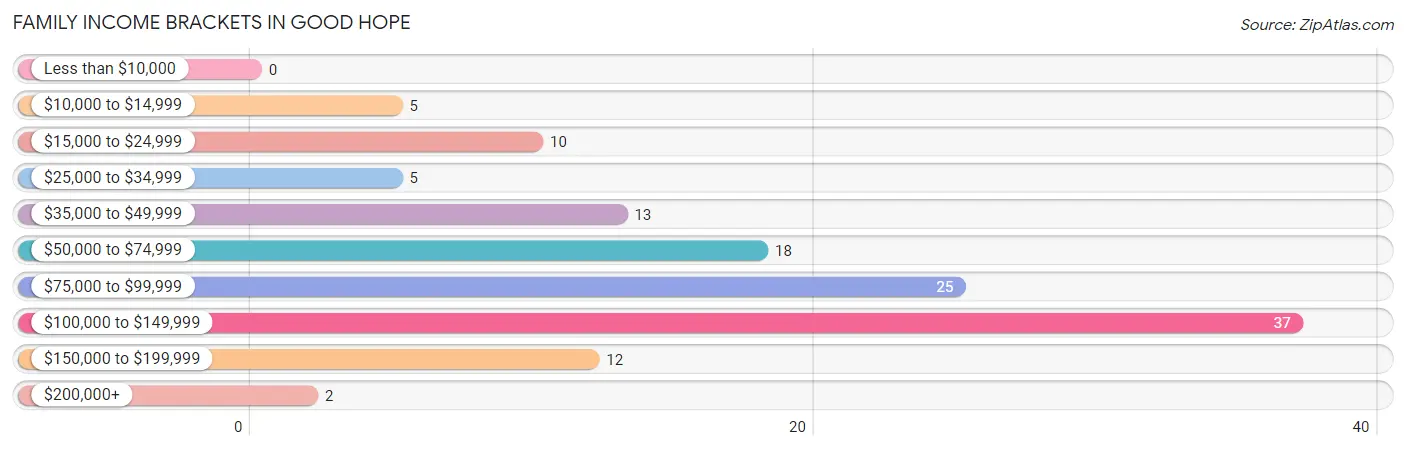
| Income Bracket | # Families | % Families |
| Less than $10,000 | 0 | 0.0% |
| $10,000 to $14,999 | 5 | 3.9% |
| $15,000 to $24,999 | 10 | 7.9% |
| $25,000 to $34,999 | 5 | 3.9% |
| $35,000 to $49,999 | 13 | 10.2% |
| $50,000 to $74,999 | 18 | 14.2% |
| $75,000 to $99,999 | 25 | 19.7% |
| $100,000 to $149,999 | 37 | 29.1% |
| $150,000 to $199,999 | 12 | 9.4% |
| $200,000+ | 2 | 1.6% |
Family Income by Famaliy Size in Good Hope
4-person families (7 | 5.5%) account for the highest median family income in Good Hope with $101,563 per family, while 2-person families (78 | 61.4%) have the highest median income of $40,625 per family member.
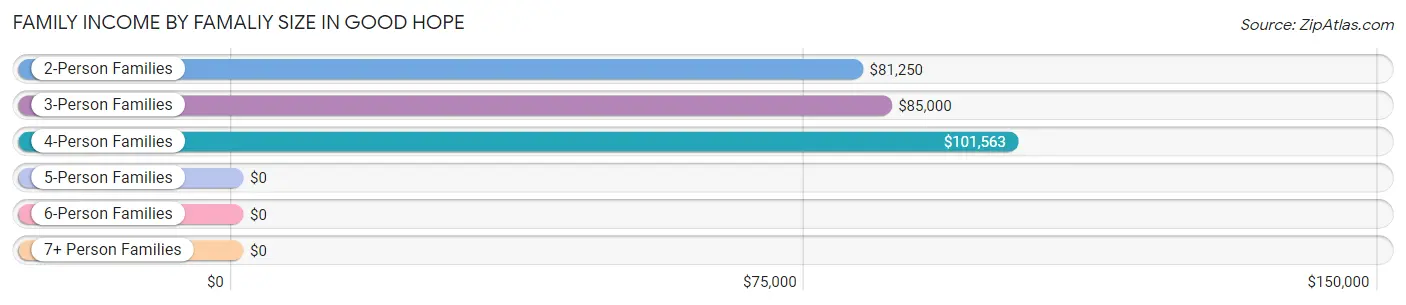
| Income Bracket | # Families | Median Income |
| 2-Person Families | 78 (61.4%) | $81,250 |
| 3-Person Families | 26 (20.5%) | $85,000 |
| 4-Person Families | 7 (5.5%) | $101,563 |
| 5-Person Families | 9 (7.1%) | $0 |
| 6-Person Families | 7 (5.5%) | $0 |
| 7+ Person Families | 0 (0.0%) | $0 |
| Total | 127 (100.0%) | $84,583 |
Family Income by Number of Earners in Good Hope
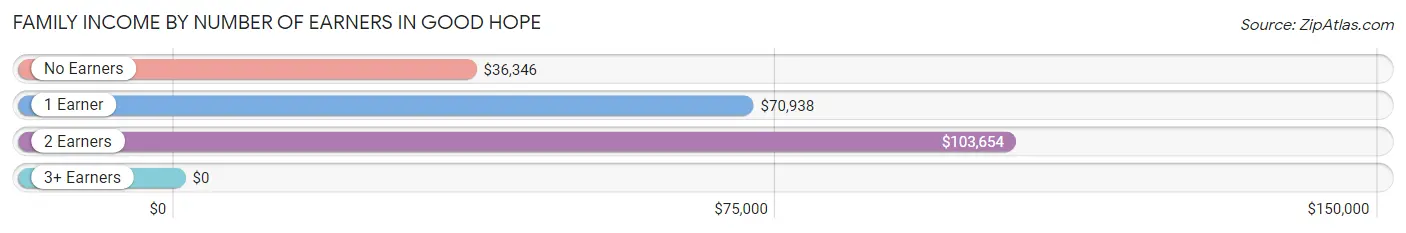
| Number of Earners | # Families | Median Income |
| No Earners | 32 (25.2%) | $36,346 |
| 1 Earner | 27 (21.3%) | $70,938 |
| 2 Earners | 64 (50.4%) | $103,654 |
| 3+ Earners | 4 (3.2%) | $0 |
| Total | 127 (100.0%) | $84,583 |
Household Income in Good Hope
Household Income Brackets in Good Hope
With 37 households falling in the category, the $50,000 to $74,999 income range is the most frequent in Good Hope, accounting for 24.2% of all households. In contrast, only 2 households (1.3%) fall into the less than $10,000 income bracket, making it the least populous group.
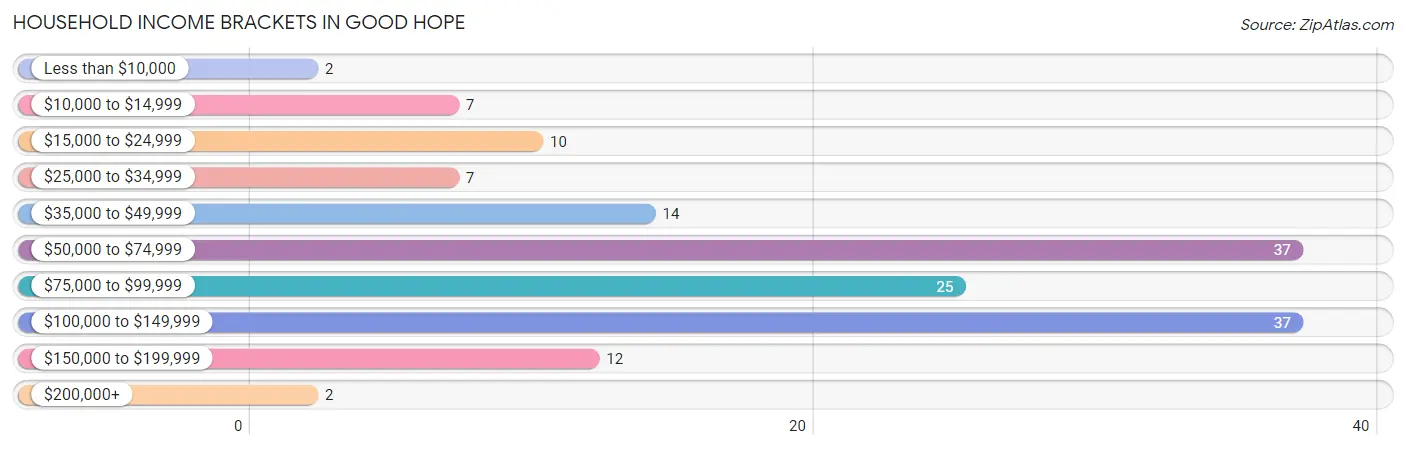
| Income Bracket | # Households | % Households |
| Less than $10,000 | 2 | 1.3% |
| $10,000 to $14,999 | 7 | 4.6% |
| $15,000 to $24,999 | 10 | 6.5% |
| $25,000 to $34,999 | 7 | 4.6% |
| $35,000 to $49,999 | 14 | 9.2% |
| $50,000 to $74,999 | 37 | 24.2% |
| $75,000 to $99,999 | 25 | 16.3% |
| $100,000 to $149,999 | 37 | 24.2% |
| $150,000 to $199,999 | 12 | 7.8% |
| $200,000+ | 2 | 1.3% |
Household Income by Householder Age in Good Hope
The median household income in Good Hope is $72,188, with the highest median household income of $81,667 found in the 45 to 64 years age bracket for the primary householder. A total of 44 households (28.8%) fall into this category. Meanwhile, the 15 to 24 years age bracket for the primary householder has the lowest median household income of $0, with 13 households (8.5%) in this group.
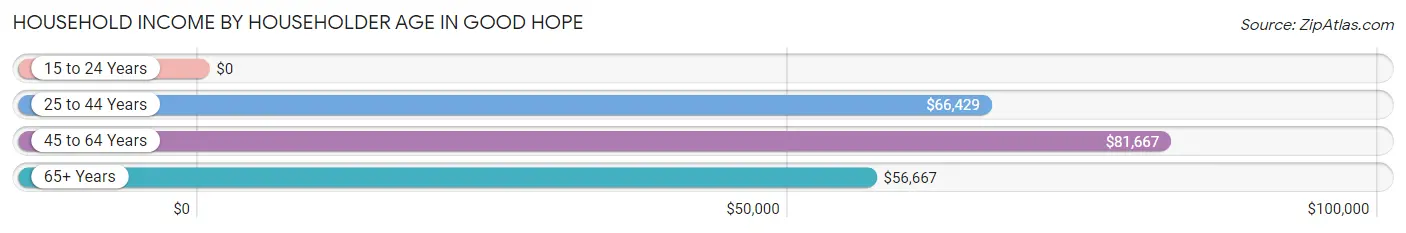
| Income Bracket | # Households | Median Income |
| 15 to 24 Years | 13 (8.5%) | $0 |
| 25 to 44 Years | 44 (28.8%) | $66,429 |
| 45 to 64 Years | 44 (28.8%) | $81,667 |
| 65+ Years | 52 (34.0%) | $56,667 |
| Total | 153 (100.0%) | $72,188 |
Poverty in Good Hope
Income Below Poverty by Sex and Age in Good Hope
With 10.4% poverty level for males and 12.7% for females among the residents of Good Hope, 15 year old males and under 5 year old females are the most vulnerable to poverty, with 2 males (100.0%) and 5 females (38.5%) in their respective age groups living below the poverty level.
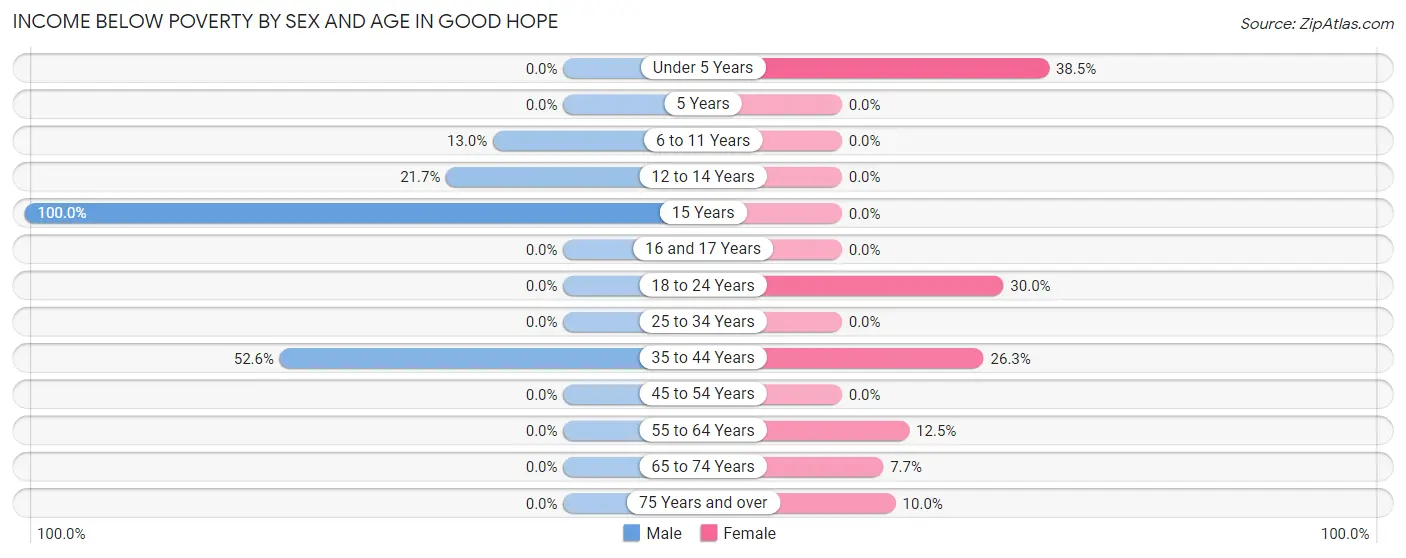
| Age Bracket | Male | Female |
| Under 5 Years | 0 (0.0%) | 5 (38.5%) |
| 5 Years | 0 (0.0%) | 0 (0.0%) |
| 6 to 11 Years | 3 (13.0%) | 0 (0.0%) |
| 12 to 14 Years | 5 (21.7%) | 0 (0.0%) |
| 15 Years | 2 (100.0%) | 0 (0.0%) |
| 16 and 17 Years | 0 (0.0%) | 0 (0.0%) |
| 18 to 24 Years | 0 (0.0%) | 6 (30.0%) |
| 25 to 34 Years | 0 (0.0%) | 0 (0.0%) |
| 35 to 44 Years | 10 (52.6%) | 5 (26.3%) |
| 45 to 54 Years | 0 (0.0%) | 0 (0.0%) |
| 55 to 64 Years | 0 (0.0%) | 2 (12.5%) |
| 65 to 74 Years | 0 (0.0%) | 2 (7.7%) |
| 75 Years and over | 0 (0.0%) | 2 (10.0%) |
| Total | 20 (10.4%) | 22 (12.7%) |
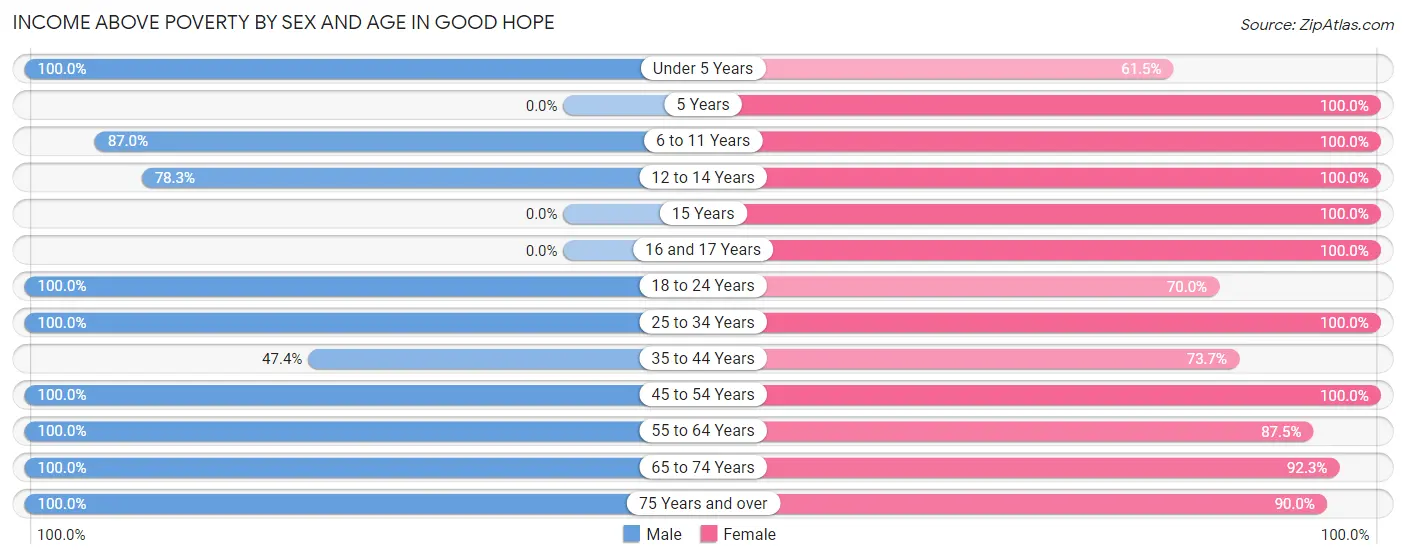
Income Above Poverty by Sex and Age in Good Hope
According to the poverty statistics in Good Hope, males aged under 5 years and females aged 5 years are the age groups that are most secure financially, with 100.0% of males and 100.0% of females in these age groups living above the poverty line.
| Age Bracket | Male | Female |
| Under 5 Years | 5 (100.0%) | 8 (61.5%) |
| 5 Years | 0 (0.0%) | 2 (100.0%) |
| 6 to 11 Years | 20 (87.0%) | 2 (100.0%) |
| 12 to 14 Years | 18 (78.3%) | 2 (100.0%) |
| 15 Years | 0 (0.0%) | 6 (100.0%) |
| 16 and 17 Years | 0 (0.0%) | 12 (100.0%) |
| 18 to 24 Years | 16 (100.0%) | 14 (70.0%) |
| 25 to 34 Years | 29 (100.0%) | 16 (100.0%) |
| 35 to 44 Years | 9 (47.4%) | 14 (73.7%) |
| 45 to 54 Years | 24 (100.0%) | 19 (100.0%) |
| 55 to 64 Years | 16 (100.0%) | 14 (87.5%) |
| 65 to 74 Years | 11 (100.0%) | 24 (92.3%) |
| 75 Years and over | 24 (100.0%) | 18 (90.0%) |
| Total | 172 (89.6%) | 151 (87.3%) |
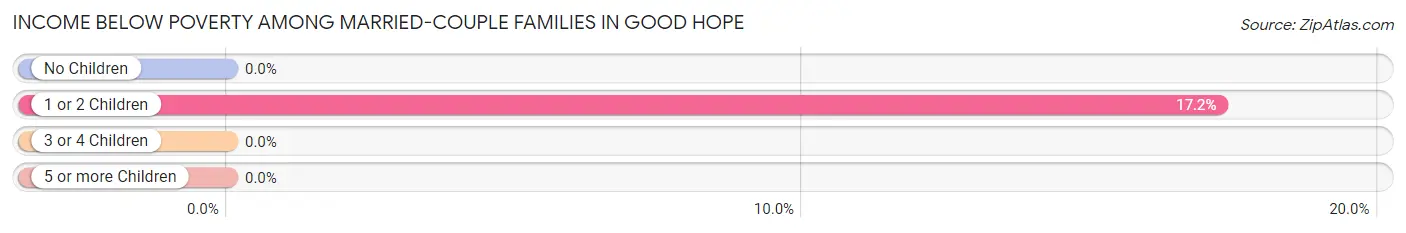
Income Below Poverty Among Married-Couple Families in Good Hope
The poverty statistics for married-couple families in Good Hope show that 5.4% or 5 of the total 93 families live below the poverty line. Families with 1 or 2 children have the highest poverty rate of 17.2%, comprising of 5 families. On the other hand, families with no children have the lowest poverty rate of 0.0%, which includes 0 families.
| Children | Above Poverty | Below Poverty |
| No Children | 57 (100.0%) | 0 (0.0%) |
| 1 or 2 Children | 24 (82.8%) | 5 (17.2%) |
| 3 or 4 Children | 7 (100.0%) | 0 (0.0%) |
| 5 or more Children | 0 (0.0%) | 0 (0.0%) |
| Total | 88 (94.6%) | 5 (5.4%) |
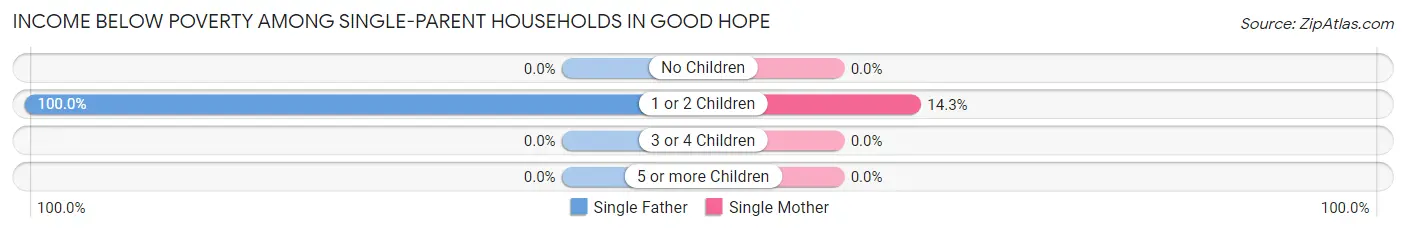
Income Below Poverty Among Single-Parent Households in Good Hope
According to the poverty data in Good Hope, 45.5% or 5 single-father households and 8.7% or 2 single-mother households are living below the poverty line. Among single-father households, those with 1 or 2 children have the highest poverty rate, with 5 households (100.0%) experiencing poverty. Likewise, among single-mother households, those with 1 or 2 children have the highest poverty rate, with 2 households (14.3%) falling below the poverty line.
| Children | Single Father | Single Mother |
| No Children | 0 (0.0%) | 0 (0.0%) |
| 1 or 2 Children | 5 (100.0%) | 2 (14.3%) |
| 3 or 4 Children | 0 (0.0%) | 0 (0.0%) |
| 5 or more Children | 0 (0.0%) | 0 (0.0%) |
| Total | 5 (45.5%) | 2 (8.7%) |
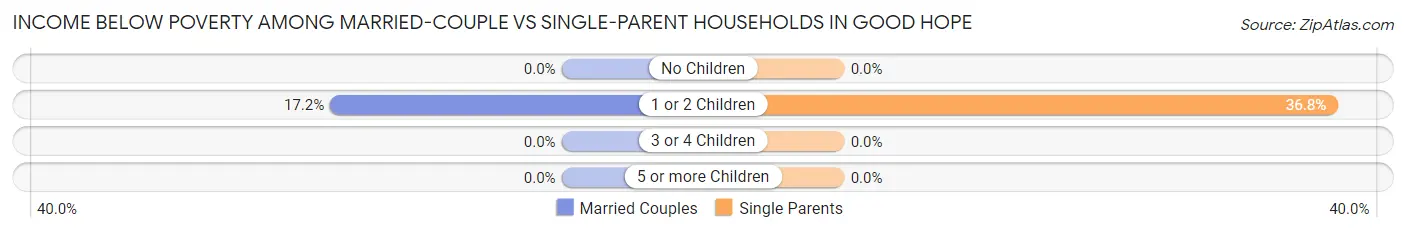
Income Below Poverty Among Married-Couple vs Single-Parent Households in Good Hope
The poverty data for Good Hope shows that 5 of the married-couple family households (5.4%) and 7 of the single-parent households (20.6%) are living below the poverty level. Within the married-couple family households, those with 1 or 2 children have the highest poverty rate, with 5 households (17.2%) falling below the poverty line. Among the single-parent households, those with 1 or 2 children have the highest poverty rate, with 7 household (36.8%) living below poverty.
| Children | Married-Couple Families | Single-Parent Households |
| No Children | 0 (0.0%) | 0 (0.0%) |
| 1 or 2 Children | 5 (17.2%) | 7 (36.8%) |
| 3 or 4 Children | 0 (0.0%) | 0 (0.0%) |
| 5 or more Children | 0 (0.0%) | 0 (0.0%) |
| Total | 5 (5.4%) | 7 (20.6%) |
Employment Characteristics in Good Hope
Employment by Class of Employer in Good Hope
Among the 161 employed individuals in Good Hope, private company employees (79 | 49.1%), local government employees (43 | 26.7%), and state government employees (26 | 16.2%) make up the most common classes of employment.
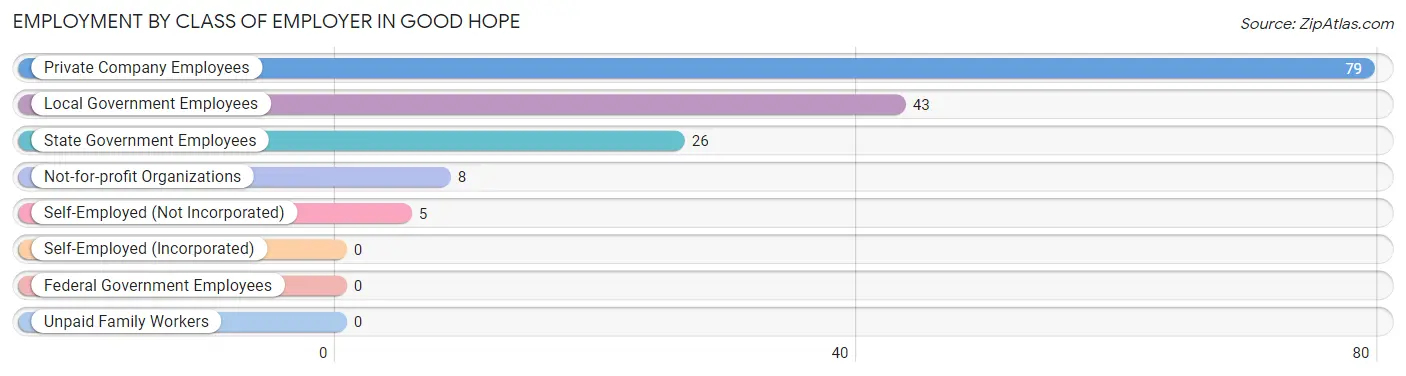
| Employer Class | # Employees | % Employees |
| Private Company Employees | 79 | 49.1% |
| Self-Employed (Incorporated) | 0 | 0.0% |
| Self-Employed (Not Incorporated) | 5 | 3.1% |
| Not-for-profit Organizations | 8 | 5.0% |
| Local Government Employees | 43 | 26.7% |
| State Government Employees | 26 | 16.2% |
| Federal Government Employees | 0 | 0.0% |
| Unpaid Family Workers | 0 | 0.0% |
| Total | 161 | 100.0% |
Employment Status by Age in Good Hope
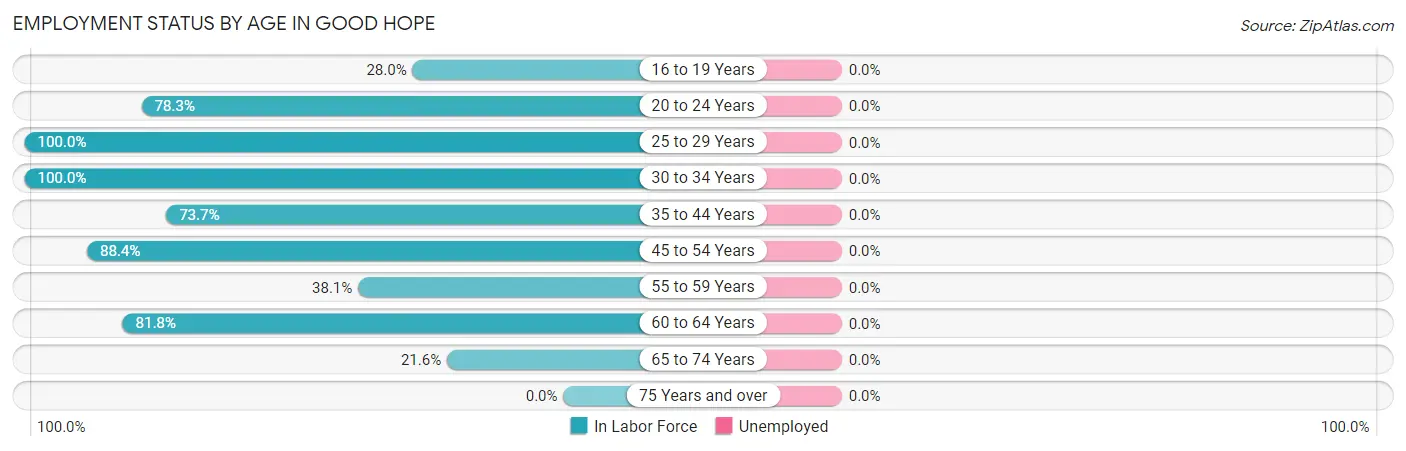
| Age Bracket | In Labor Force | Unemployed |
| 16 to 19 Years | 7 (28.0%) | 0 (0.0%) |
| 20 to 24 Years | 18 (78.3%) | 0 (0.0%) |
| 25 to 29 Years | 32 (100.0%) | 0 (0.0%) |
| 30 to 34 Years | 13 (100.0%) | 0 (0.0%) |
| 35 to 44 Years | 28 (73.7%) | 0 (0.0%) |
| 45 to 54 Years | 38 (88.4%) | 0 (0.0%) |
| 55 to 59 Years | 8 (38.1%) | 0 (0.0%) |
| 60 to 64 Years | 9 (81.8%) | 0 (0.0%) |
| 65 to 74 Years | 8 (21.6%) | 0 (0.0%) |
| 75 Years and over | 0 (0.0%) | 0 (0.0%) |
| Total | 161 (56.1%) | 0 (0.0%) |
Employment Status by Educational Attainment in Good Hope
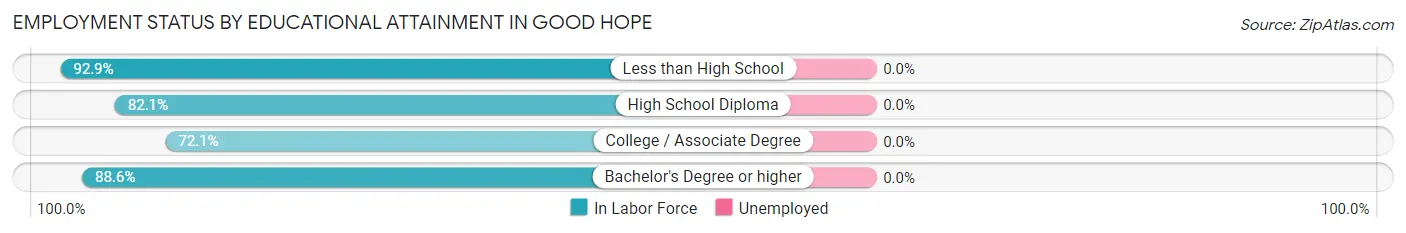
| Educational Attainment | In Labor Force | Unemployed |
| Less than High School | 13 (92.9%) | 0 (0.0%) |
| High School Diploma | 32 (82.1%) | 0 (0.0%) |
| College / Associate Degree | 44 (72.1%) | 0 (0.0%) |
| Bachelor's Degree or higher | 39 (88.6%) | 0 (0.0%) |
| Total | 128 (81.0%) | 0 (0.0%) |
Employment Occupations by Sex in Good Hope
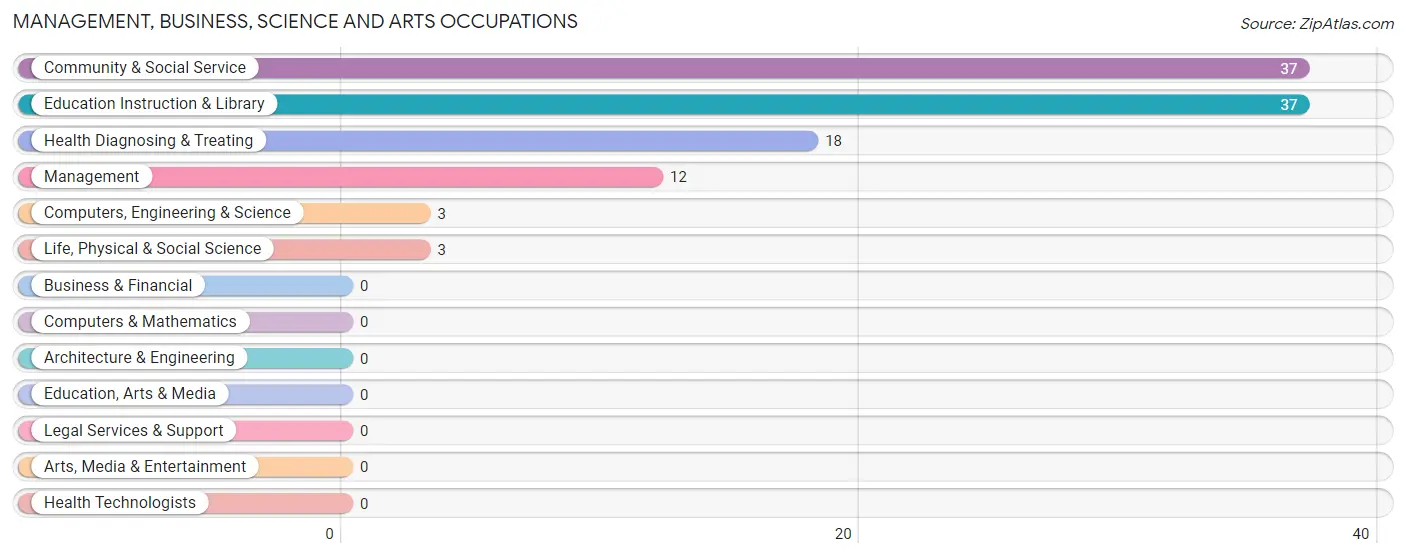
Management, Business, Science and Arts Occupations
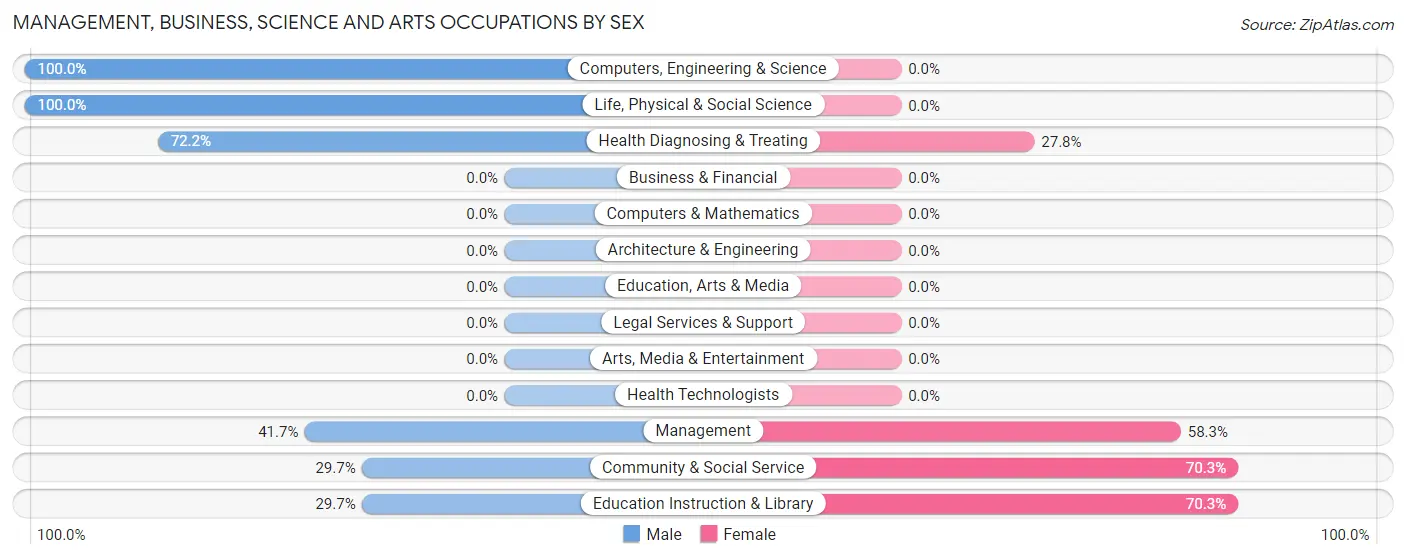
The most common Management, Business, Science and Arts occupations in Good Hope are Community & Social Service (37 | 23.0%), Education Instruction & Library (37 | 23.0%), Health Diagnosing & Treating (18 | 11.2%), Management (12 | 7.4%), and Computers, Engineering & Science (3 | 1.9%).
Management, Business, Science and Arts Occupations by Sex
Within the Management, Business, Science and Arts occupations in Good Hope, the most male-oriented occupations are Computers, Engineering & Science (100.0%), Life, Physical & Social Science (100.0%), and Health Diagnosing & Treating (72.2%), while the most female-oriented occupations are Community & Social Service (70.3%), Education Instruction & Library (70.3%), and Management (58.3%).
| Occupation | Male | Female |
| Management | 5 (41.7%) | 7 (58.3%) |
| Business & Financial | 0 (0.0%) | 0 (0.0%) |
| Computers, Engineering & Science | 3 (100.0%) | 0 (0.0%) |
| Computers & Mathematics | 0 (0.0%) | 0 (0.0%) |
| Architecture & Engineering | 0 (0.0%) | 0 (0.0%) |
| Life, Physical & Social Science | 3 (100.0%) | 0 (0.0%) |
| Community & Social Service | 11 (29.7%) | 26 (70.3%) |
| Education, Arts & Media | 0 (0.0%) | 0 (0.0%) |
| Legal Services & Support | 0 (0.0%) | 0 (0.0%) |
| Education Instruction & Library | 11 (29.7%) | 26 (70.3%) |
| Arts, Media & Entertainment | 0 (0.0%) | 0 (0.0%) |
| Health Diagnosing & Treating | 13 (72.2%) | 5 (27.8%) |
| Health Technologists | 0 (0.0%) | 0 (0.0%) |
| Total (Category) | 32 (45.7%) | 38 (54.3%) |
| Total (Overall) | 95 (59.0%) | 66 (41.0%) |
Services Occupations
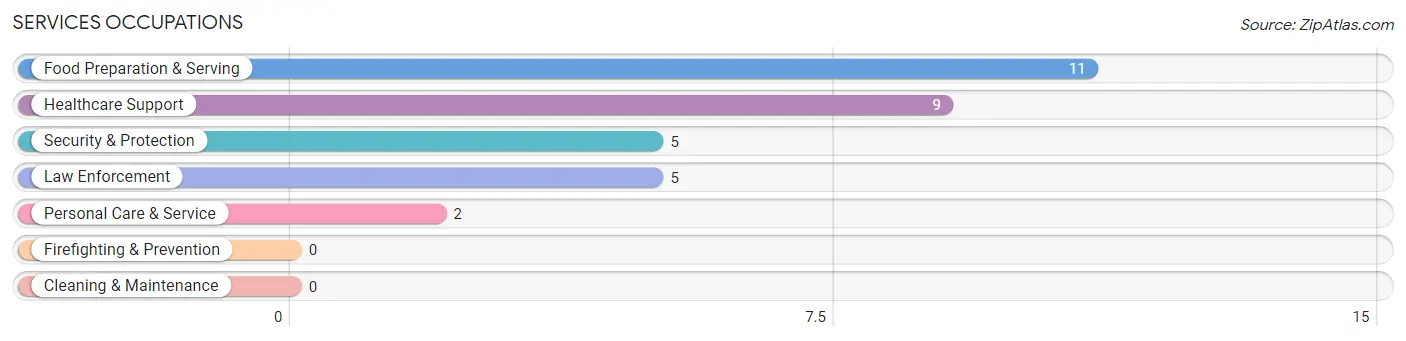
The most common Services occupations in Good Hope are Food Preparation & Serving (11 | 6.8%), Healthcare Support (9 | 5.6%), Security & Protection (5 | 3.1%), Law Enforcement (5 | 3.1%), and Personal Care & Service (2 | 1.2%).
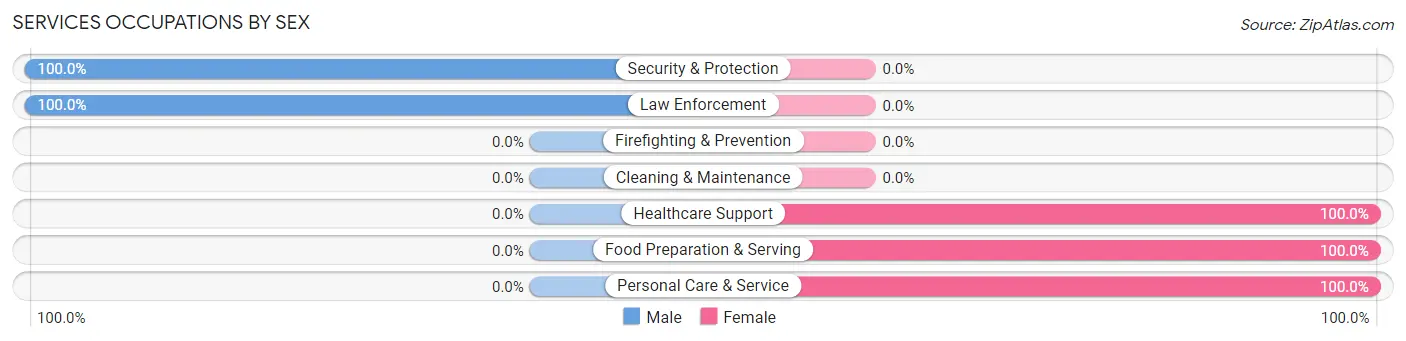
Services Occupations by Sex
Within the Services occupations in Good Hope, the most male-oriented occupations are Security & Protection (100.0%), and Law Enforcement (100.0%), while the most female-oriented occupations are Healthcare Support (100.0%), Food Preparation & Serving (100.0%), and Personal Care & Service (100.0%).
| Occupation | Male | Female |
| Healthcare Support | 0 (0.0%) | 9 (100.0%) |
| Security & Protection | 5 (100.0%) | 0 (0.0%) |
| Firefighting & Prevention | 0 (0.0%) | 0 (0.0%) |
| Law Enforcement | 5 (100.0%) | 0 (0.0%) |
| Food Preparation & Serving | 0 (0.0%) | 11 (100.0%) |
| Cleaning & Maintenance | 0 (0.0%) | 0 (0.0%) |
| Personal Care & Service | 0 (0.0%) | 2 (100.0%) |
| Total (Category) | 5 (18.5%) | 22 (81.5%) |
| Total (Overall) | 95 (59.0%) | 66 (41.0%) |
Sales and Office Occupations
The most common Sales and Office occupations in Good Hope are Office & Administration (8 | 5.0%), and Sales & Related (4 | 2.5%).
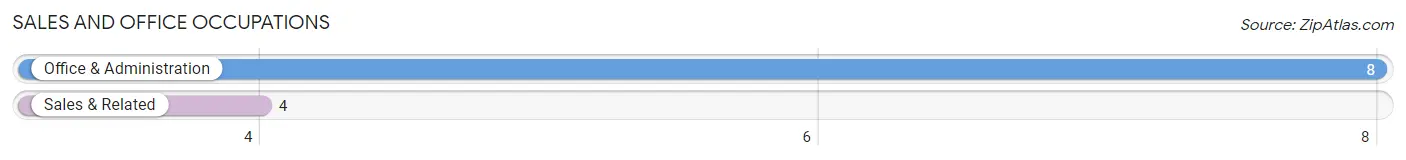
Sales and Office Occupations by Sex
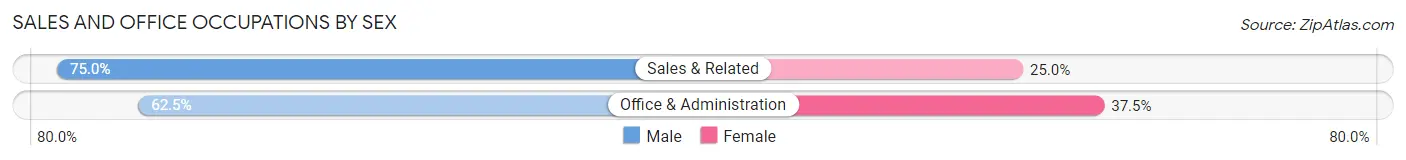
| Occupation | Male | Female |
| Sales & Related | 3 (75.0%) | 1 (25.0%) |
| Office & Administration | 5 (62.5%) | 3 (37.5%) |
| Total (Category) | 8 (66.7%) | 4 (33.3%) |
| Total (Overall) | 95 (59.0%) | 66 (41.0%) |
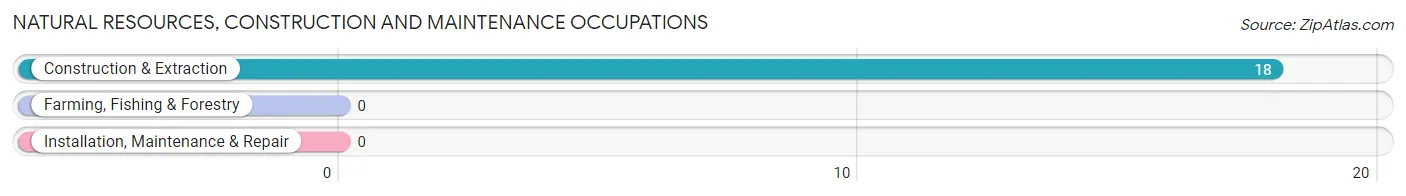
Natural Resources, Construction and Maintenance Occupations
The most common Natural Resources, Construction and Maintenance occupations in Good Hope are , and Construction & Extraction (18 | 11.2%).
Natural Resources, Construction and Maintenance Occupations by Sex
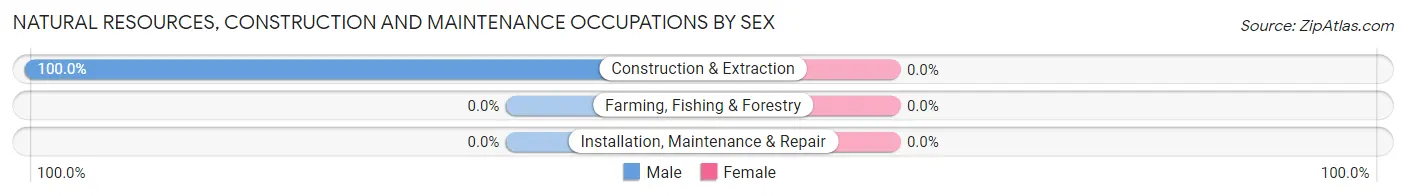
| Occupation | Male | Female |
| Farming, Fishing & Forestry | 0 (0.0%) | 0 (0.0%) |
| Construction & Extraction | 18 (100.0%) | 0 (0.0%) |
| Installation, Maintenance & Repair | 0 (0.0%) | 0 (0.0%) |
| Total (Category) | 18 (100.0%) | 0 (0.0%) |
| Total (Overall) | 95 (59.0%) | 66 (41.0%) |
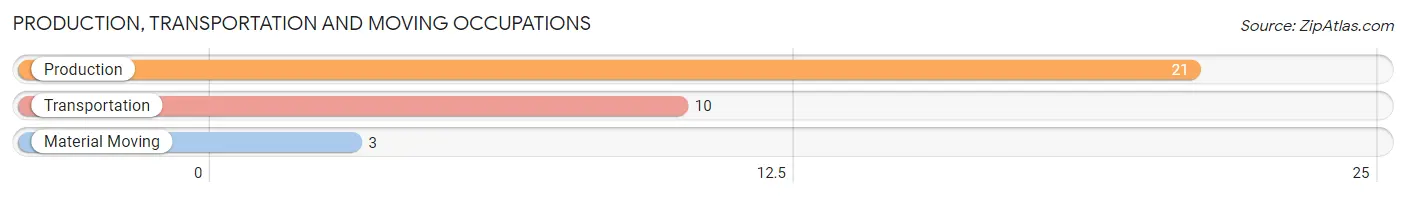
Production, Transportation and Moving Occupations
The most common Production, Transportation and Moving occupations in Good Hope are Production (21 | 13.0%), Transportation (10 | 6.2%), and Material Moving (3 | 1.9%).
Production, Transportation and Moving Occupations by Sex
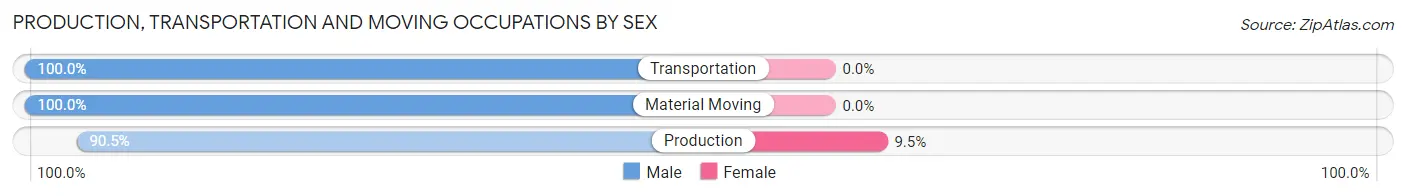
| Occupation | Male | Female |
| Production | 19 (90.5%) | 2 (9.5%) |
| Transportation | 10 (100.0%) | 0 (0.0%) |
| Material Moving | 3 (100.0%) | 0 (0.0%) |
| Total (Category) | 32 (94.1%) | 2 (5.9%) |
| Total (Overall) | 95 (59.0%) | 66 (41.0%) |
Employment Industries by Sex in Good Hope
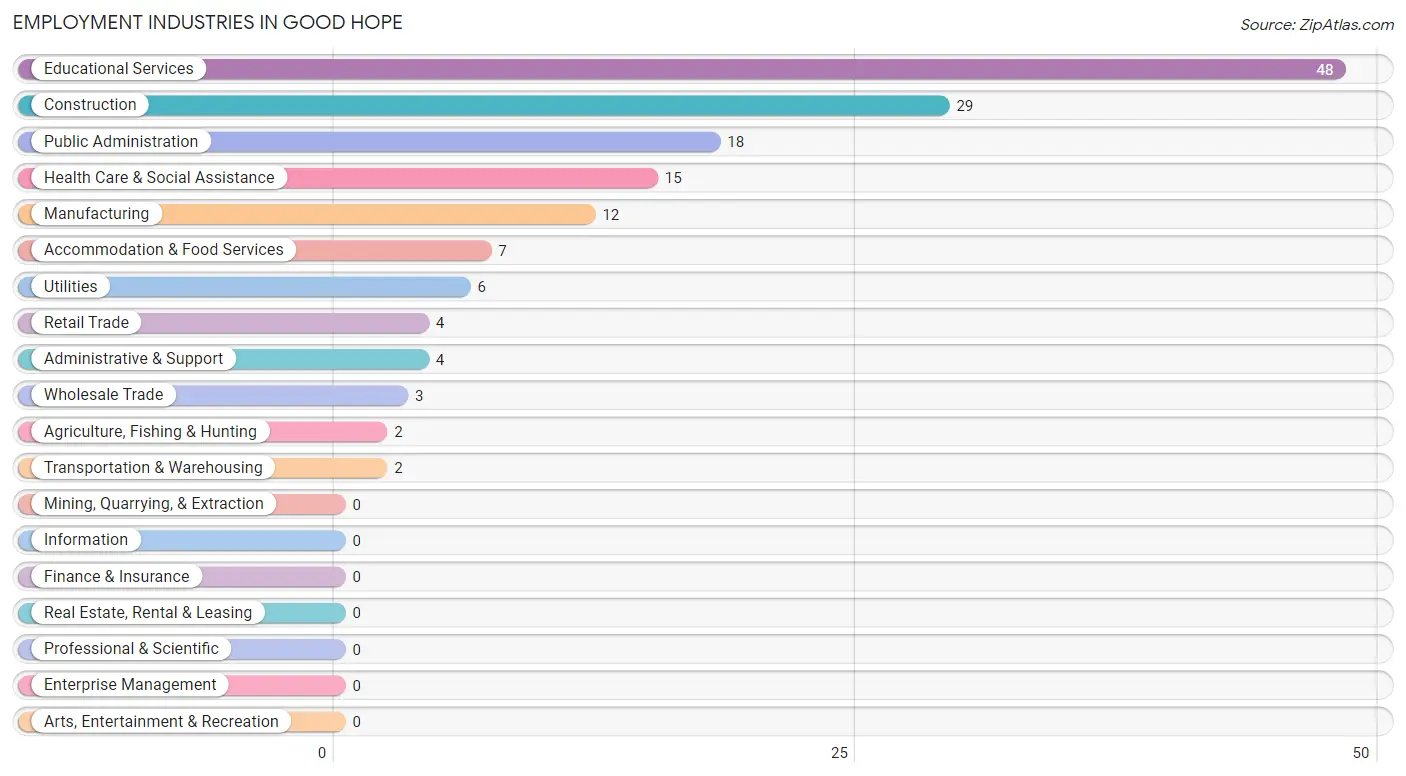
Employment Industries in Good Hope
The major employment industries in Good Hope include Educational Services (48 | 29.8%), Construction (29 | 18.0%), Public Administration (18 | 11.2%), Health Care & Social Assistance (15 | 9.3%), and Manufacturing (12 | 7.4%).
Employment Industries by Sex in Good Hope
The Good Hope industries that see more men than women are Agriculture, Fishing & Hunting (100.0%), Construction (100.0%), and Wholesale Trade (100.0%), whereas the industries that tend to have a higher number of women are Health Care & Social Assistance (100.0%), Accommodation & Food Services (100.0%), and Educational Services (77.1%).
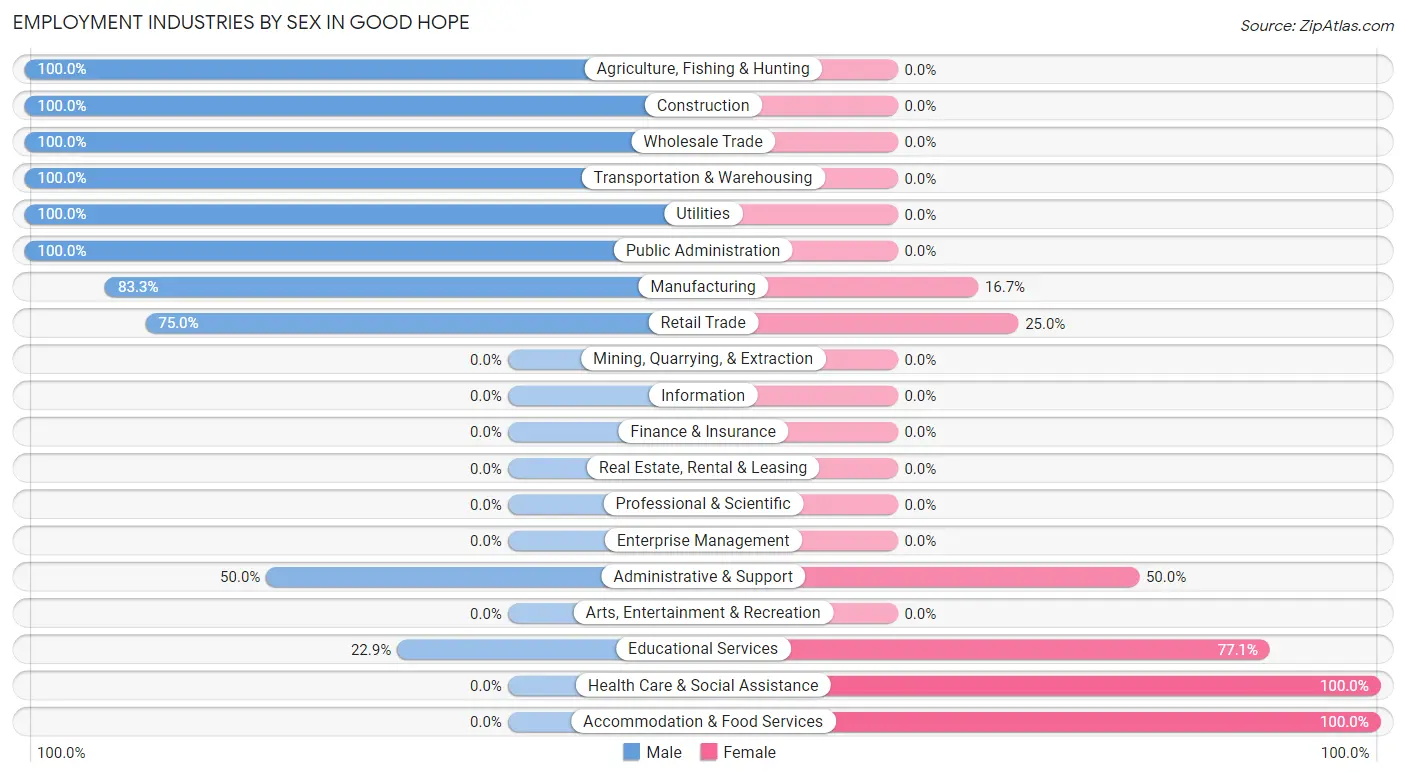
| Industry | Male | Female |
| Agriculture, Fishing & Hunting | 2 (100.0%) | 0 (0.0%) |
| Mining, Quarrying, & Extraction | 0 (0.0%) | 0 (0.0%) |
| Construction | 29 (100.0%) | 0 (0.0%) |
| Manufacturing | 10 (83.3%) | 2 (16.7%) |
| Wholesale Trade | 3 (100.0%) | 0 (0.0%) |
| Retail Trade | 3 (75.0%) | 1 (25.0%) |
| Transportation & Warehousing | 2 (100.0%) | 0 (0.0%) |
| Utilities | 6 (100.0%) | 0 (0.0%) |
| Information | 0 (0.0%) | 0 (0.0%) |
| Finance & Insurance | 0 (0.0%) | 0 (0.0%) |
| Real Estate, Rental & Leasing | 0 (0.0%) | 0 (0.0%) |
| Professional & Scientific | 0 (0.0%) | 0 (0.0%) |
| Enterprise Management | 0 (0.0%) | 0 (0.0%) |
| Administrative & Support | 2 (50.0%) | 2 (50.0%) |
| Educational Services | 11 (22.9%) | 37 (77.1%) |
| Health Care & Social Assistance | 0 (0.0%) | 15 (100.0%) |
| Arts, Entertainment & Recreation | 0 (0.0%) | 0 (0.0%) |
| Accommodation & Food Services | 0 (0.0%) | 7 (100.0%) |
| Public Administration | 18 (100.0%) | 0 (0.0%) |
| Total | 95 (59.0%) | 66 (41.0%) |
Education in Good Hope
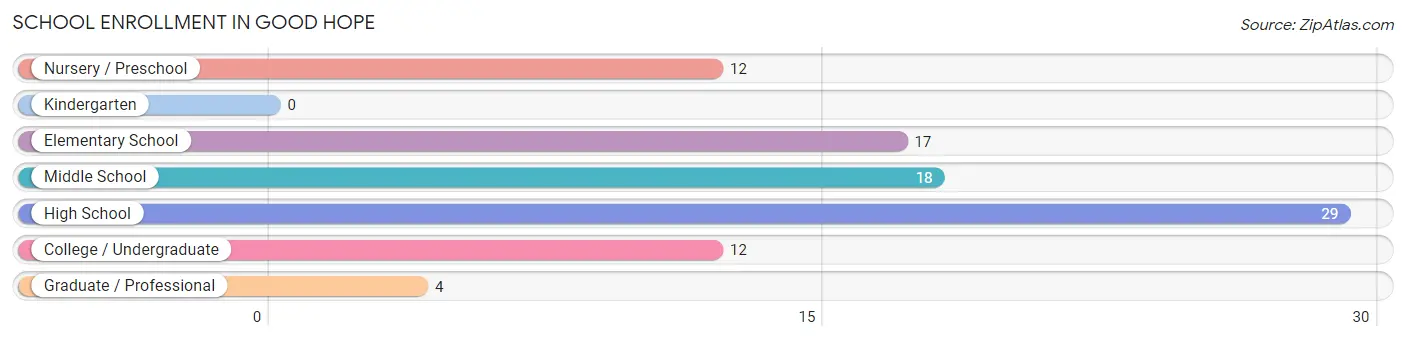
School Enrollment in Good Hope
The most common levels of schooling among the 92 students in Good Hope are high school (29 | 31.5%), middle school (18 | 19.6%), and elementary school (17 | 18.5%).
| School Level | # Students | % Students |
| Nursery / Preschool | 12 | 13.0% |
| Kindergarten | 0 | 0.0% |
| Elementary School | 17 | 18.5% |
| Middle School | 18 | 19.6% |
| High School | 29 | 31.5% |
| College / Undergraduate | 12 | 13.0% |
| Graduate / Professional | 4 | 4.3% |
| Total | 92 | 100.0% |
School Enrollment by Age by Funding Source in Good Hope
Out of a total of 92 students who are enrolled in schools in Good Hope, 37 (40.2%) attend a private institution, while the remaining 55 (59.8%) are enrolled in public schools. The age group of 20 to 24 year olds has the highest likelihood of being enrolled in private schools, with 5 (100.0% in the age bracket) enrolled. Conversely, the age group of 3 to 4 year olds has the lowest likelihood of being enrolled in a private school, with 2 (100.0% in the age bracket) attending a public institution.
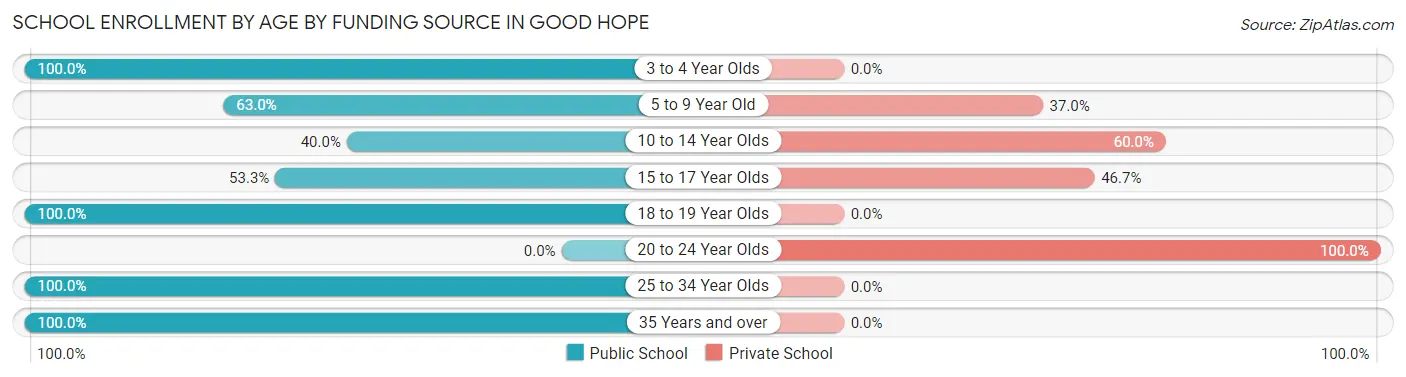
| Age Bracket | Public School | Private School |
| 3 to 4 Year Olds | 2 (100.0%) | 0 (0.0%) |
| 5 to 9 Year Old | 17 (63.0%) | 10 (37.0%) |
| 10 to 14 Year Olds | 10 (40.0%) | 15 (60.0%) |
| 15 to 17 Year Olds | 8 (53.3%) | 7 (46.7%) |
| 18 to 19 Year Olds | 7 (100.0%) | 0 (0.0%) |
| 20 to 24 Year Olds | 0 (0.0%) | 5 (100.0%) |
| 25 to 34 Year Olds | 4 (100.0%) | 0 (0.0%) |
| 35 Years and over | 7 (100.0%) | 0 (0.0%) |
| Total | 55 (59.8%) | 37 (40.2%) |
Educational Attainment by Field of Study in Good Hope
Education (41 | 58.6%), arts & humanities (14 | 20.0%), business (7 | 10.0%), computers & mathematics (5 | 7.1%), and psychology (2 | 2.9%) are the most common fields of study among 70 individuals in Good Hope who have obtained a bachelor's degree or higher.
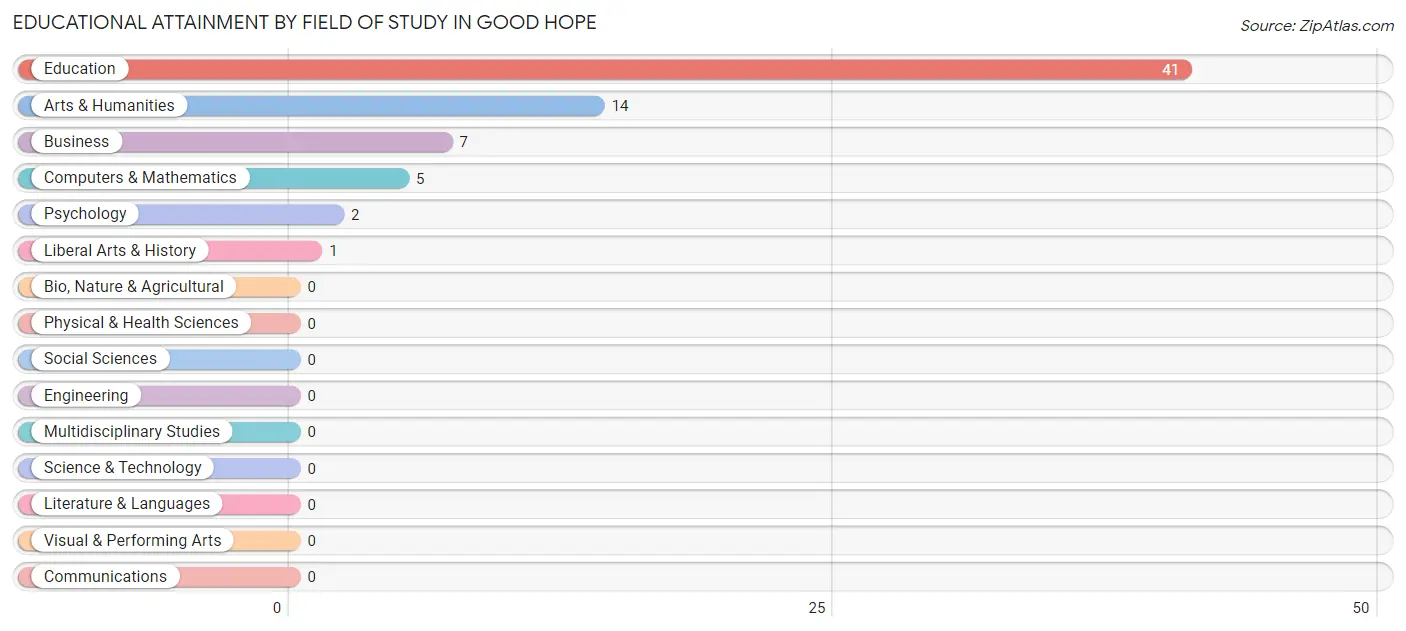
| Field of Study | # Graduates | % Graduates |
| Computers & Mathematics | 5 | 7.1% |
| Bio, Nature & Agricultural | 0 | 0.0% |
| Physical & Health Sciences | 0 | 0.0% |
| Psychology | 2 | 2.9% |
| Social Sciences | 0 | 0.0% |
| Engineering | 0 | 0.0% |
| Multidisciplinary Studies | 0 | 0.0% |
| Science & Technology | 0 | 0.0% |
| Business | 7 | 10.0% |
| Education | 41 | 58.6% |
| Literature & Languages | 0 | 0.0% |
| Liberal Arts & History | 1 | 1.4% |
| Visual & Performing Arts | 0 | 0.0% |
| Communications | 0 | 0.0% |
| Arts & Humanities | 14 | 20.0% |
| Total | 70 | 100.0% |
Transportation & Commute in Good Hope
Vehicle Availability by Sex in Good Hope
The most prevalent vehicle ownership categories in Good Hope are males with 2 vehicles (48, accounting for 50.5%) and females with 2 vehicles (43, making up 72.7%).
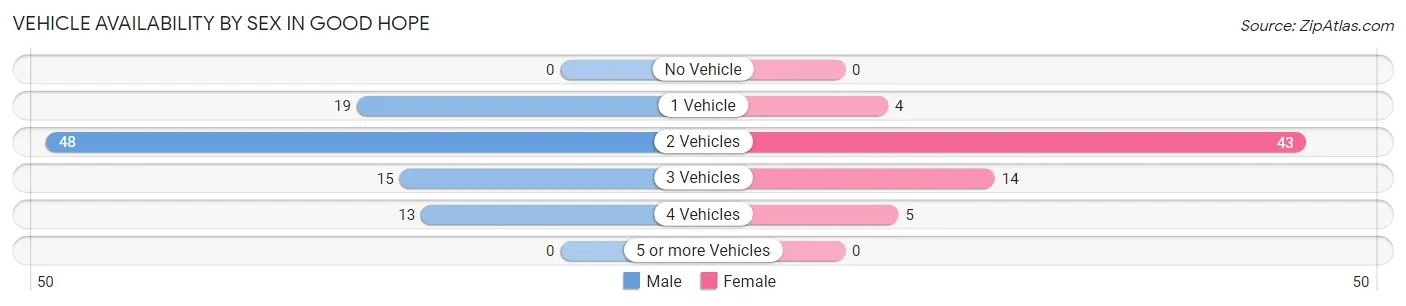
| Vehicles Available | Male | Female |
| No Vehicle | 0 (0.0%) | 0 (0.0%) |
| 1 Vehicle | 19 (20.0%) | 4 (6.1%) |
| 2 Vehicles | 48 (50.5%) | 43 (65.1%) |
| 3 Vehicles | 15 (15.8%) | 14 (21.2%) |
| 4 Vehicles | 13 (13.7%) | 5 (7.6%) |
| 5 or more Vehicles | 0 (0.0%) | 0 (0.0%) |
| Total | 95 (100.0%) | 66 (100.0%) |
Commute Time in Good Hope
The most frequently occuring commute durations in Good Hope are 30 to 34 minutes (28 commuters, 17.6%), 20 to 24 minutes (26 commuters, 16.4%), and 15 to 19 minutes (24 commuters, 15.1%).
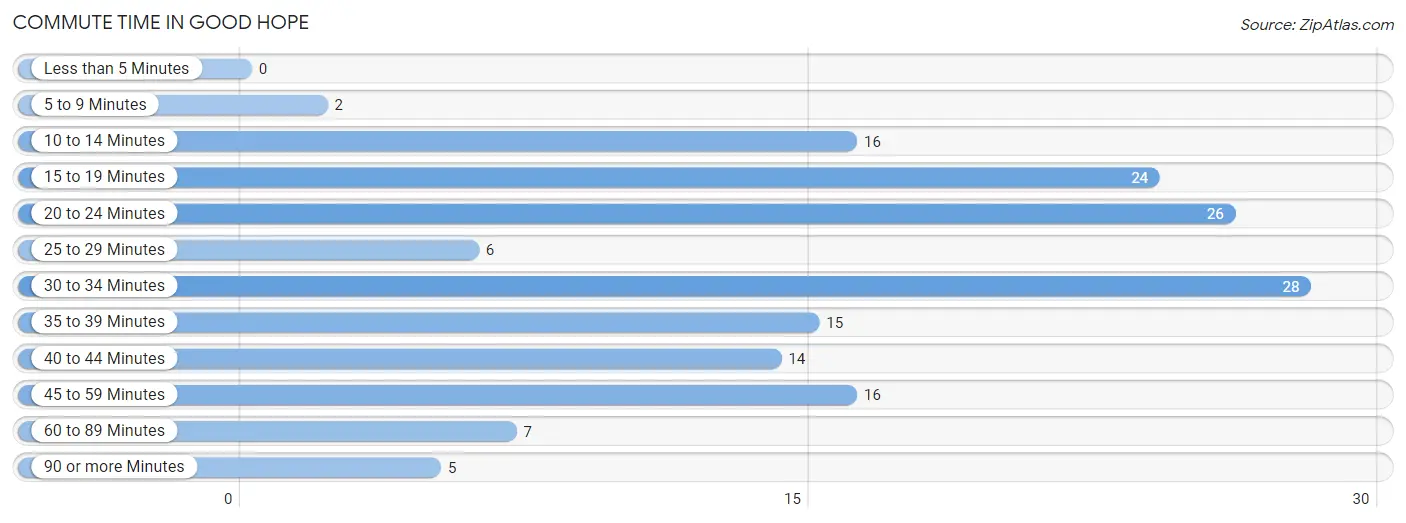
| Commute Time | # Commuters | % Commuters |
| Less than 5 Minutes | 0 | 0.0% |
| 5 to 9 Minutes | 2 | 1.3% |
| 10 to 14 Minutes | 16 | 10.1% |
| 15 to 19 Minutes | 24 | 15.1% |
| 20 to 24 Minutes | 26 | 16.4% |
| 25 to 29 Minutes | 6 | 3.8% |
| 30 to 34 Minutes | 28 | 17.6% |
| 35 to 39 Minutes | 15 | 9.4% |
| 40 to 44 Minutes | 14 | 8.8% |
| 45 to 59 Minutes | 16 | 10.1% |
| 60 to 89 Minutes | 7 | 4.4% |
| 90 or more Minutes | 5 | 3.1% |
Commute Time by Sex in Good Hope
The most common commute times in Good Hope are 20 to 24 minutes (16 commuters, 16.8%) for males and 30 to 34 minutes (21 commuters, 32.8%) for females.
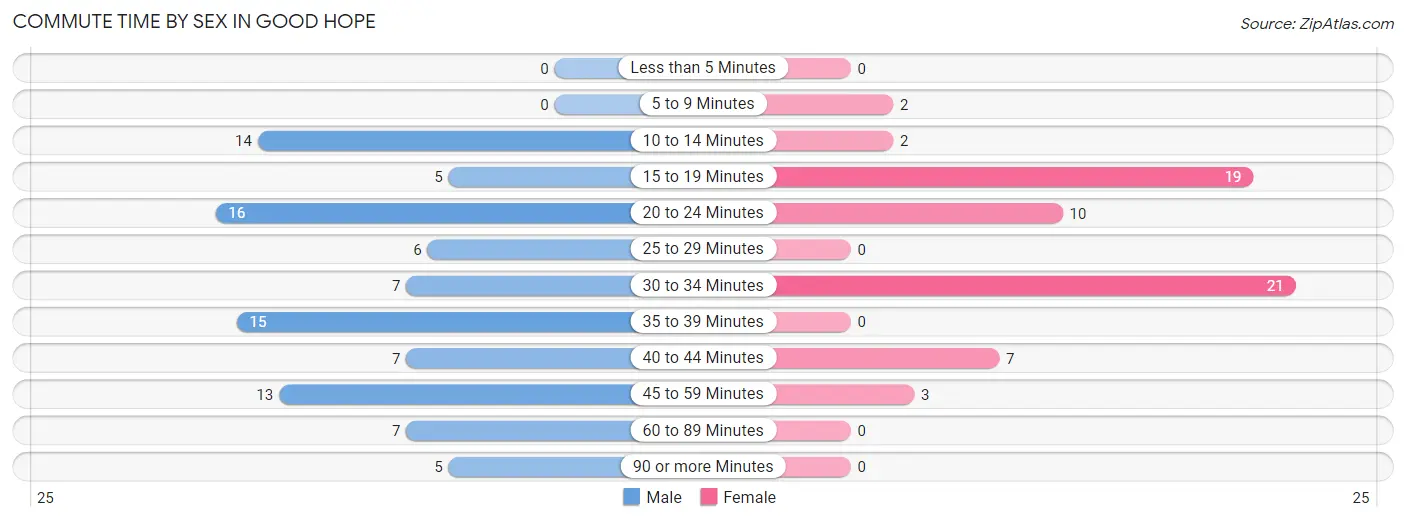
| Commute Time | Male | Female |
| Less than 5 Minutes | 0 (0.0%) | 0 (0.0%) |
| 5 to 9 Minutes | 0 (0.0%) | 2 (3.1%) |
| 10 to 14 Minutes | 14 (14.7%) | 2 (3.1%) |
| 15 to 19 Minutes | 5 (5.3%) | 19 (29.7%) |
| 20 to 24 Minutes | 16 (16.8%) | 10 (15.6%) |
| 25 to 29 Minutes | 6 (6.3%) | 0 (0.0%) |
| 30 to 34 Minutes | 7 (7.4%) | 21 (32.8%) |
| 35 to 39 Minutes | 15 (15.8%) | 0 (0.0%) |
| 40 to 44 Minutes | 7 (7.4%) | 7 (10.9%) |
| 45 to 59 Minutes | 13 (13.7%) | 3 (4.7%) |
| 60 to 89 Minutes | 7 (7.4%) | 0 (0.0%) |
| 90 or more Minutes | 5 (5.3%) | 0 (0.0%) |
Time of Departure to Work by Sex in Good Hope
The most frequent times of departure to work in Good Hope are 7:30 AM to 7:59 AM (23, 24.2%) for males and 6:30 AM to 6:59 AM (18, 28.1%) for females.
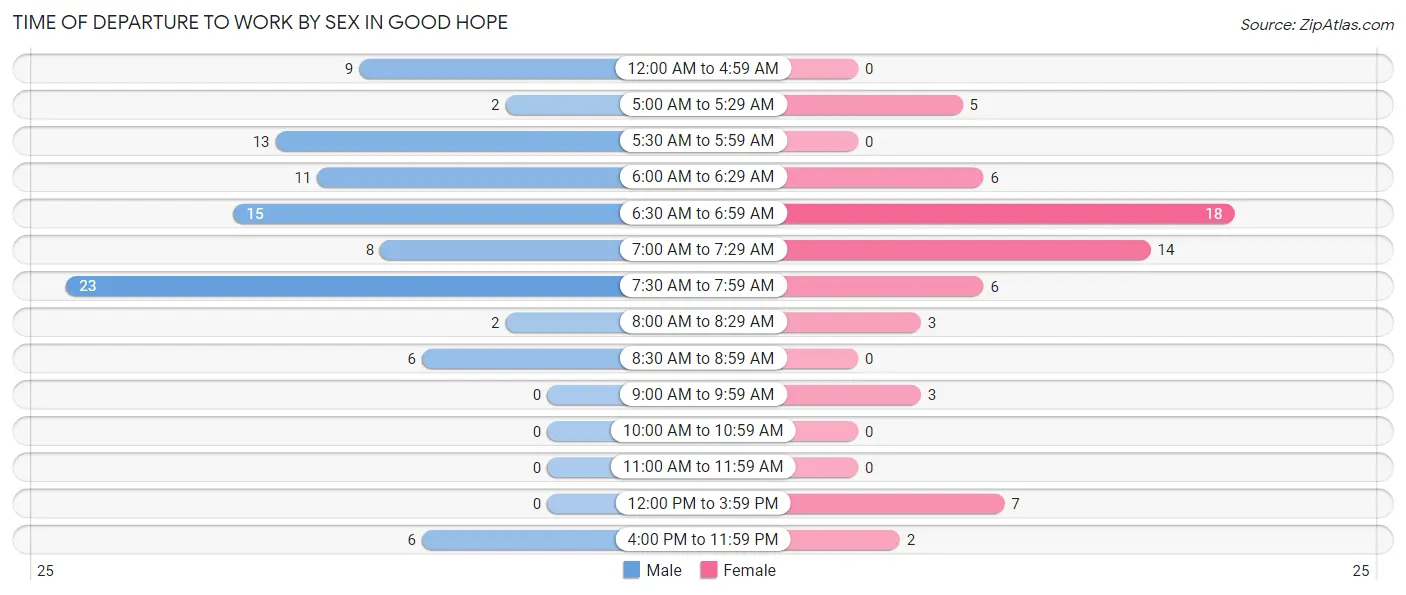
| Time of Departure | Male | Female |
| 12:00 AM to 4:59 AM | 9 (9.5%) | 0 (0.0%) |
| 5:00 AM to 5:29 AM | 2 (2.1%) | 5 (7.8%) |
| 5:30 AM to 5:59 AM | 13 (13.7%) | 0 (0.0%) |
| 6:00 AM to 6:29 AM | 11 (11.6%) | 6 (9.4%) |
| 6:30 AM to 6:59 AM | 15 (15.8%) | 18 (28.1%) |
| 7:00 AM to 7:29 AM | 8 (8.4%) | 14 (21.9%) |
| 7:30 AM to 7:59 AM | 23 (24.2%) | 6 (9.4%) |
| 8:00 AM to 8:29 AM | 2 (2.1%) | 3 (4.7%) |
| 8:30 AM to 8:59 AM | 6 (6.3%) | 0 (0.0%) |
| 9:00 AM to 9:59 AM | 0 (0.0%) | 3 (4.7%) |
| 10:00 AM to 10:59 AM | 0 (0.0%) | 0 (0.0%) |
| 11:00 AM to 11:59 AM | 0 (0.0%) | 0 (0.0%) |
| 12:00 PM to 3:59 PM | 0 (0.0%) | 7 (10.9%) |
| 4:00 PM to 11:59 PM | 6 (6.3%) | 2 (3.1%) |
| Total | 95 (100.0%) | 64 (100.0%) |
Housing Occupancy in Good Hope
Occupancy by Ownership in Good Hope
Of the total 153 dwellings in Good Hope, owner-occupied units account for 129 (84.3%), while renter-occupied units make up 24 (15.7%).
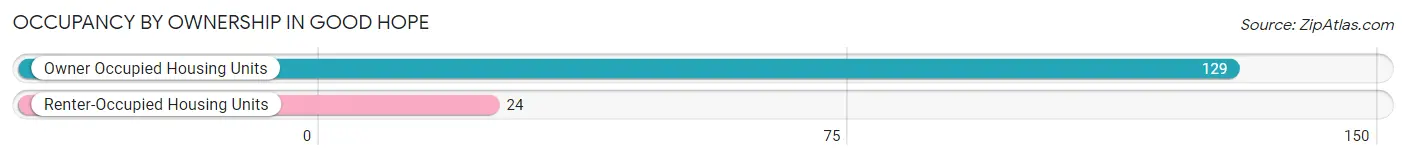
| Occupancy | # Housing Units | % Housing Units |
| Owner Occupied Housing Units | 129 | 84.3% |
| Renter-Occupied Housing Units | 24 | 15.7% |
| Total Occupied Housing Units | 153 | 100.0% |
Occupancy by Household Size in Good Hope
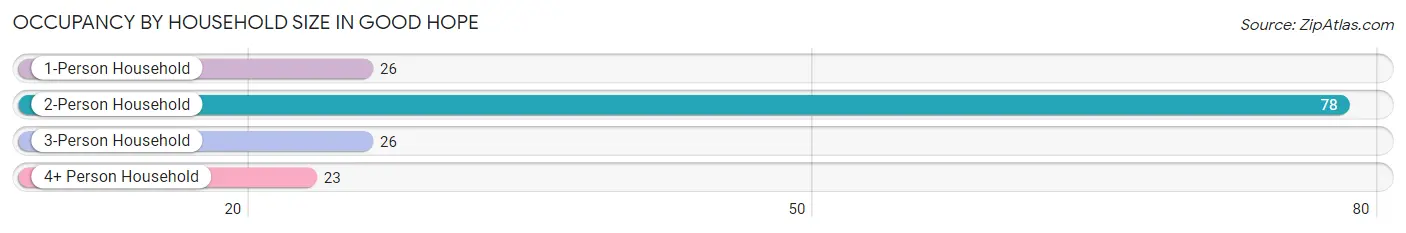
| Household Size | # Housing Units | % Housing Units |
| 1-Person Household | 26 | 17.0% |
| 2-Person Household | 78 | 51.0% |
| 3-Person Household | 26 | 17.0% |
| 4+ Person Household | 23 | 15.0% |
| Total Housing Units | 153 | 100.0% |
Occupancy by Ownership by Household Size in Good Hope
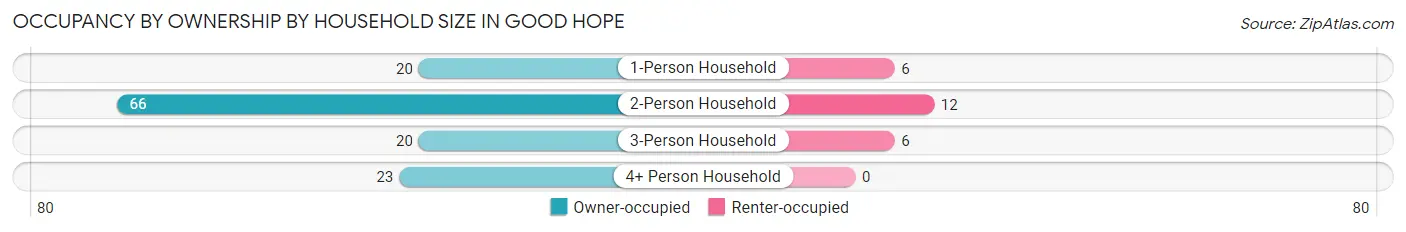
| Household Size | Owner-occupied | Renter-occupied |
| 1-Person Household | 20 (76.9%) | 6 (23.1%) |
| 2-Person Household | 66 (84.6%) | 12 (15.4%) |
| 3-Person Household | 20 (76.9%) | 6 (23.1%) |
| 4+ Person Household | 23 (100.0%) | 0 (0.0%) |
| Total Housing Units | 129 (84.3%) | 24 (15.7%) |
Occupancy by Educational Attainment in Good Hope
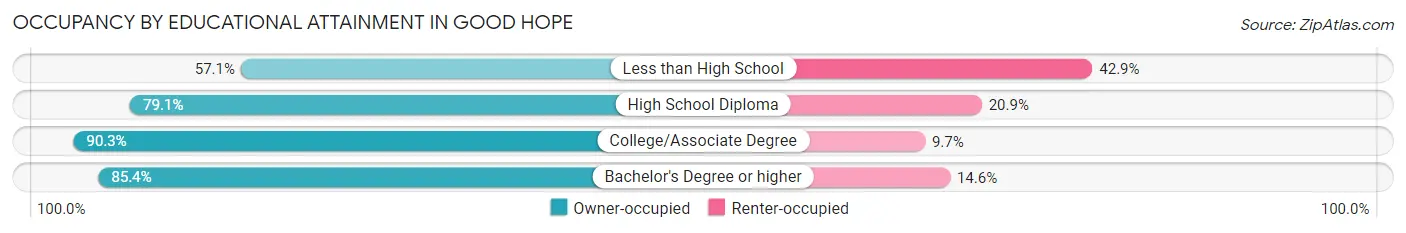
| Household Size | Owner-occupied | Renter-occupied |
| Less than High School | 4 (57.1%) | 3 (42.9%) |
| High School Diploma | 34 (79.1%) | 9 (20.9%) |
| College/Associate Degree | 56 (90.3%) | 6 (9.7%) |
| Bachelor's Degree or higher | 35 (85.4%) | 6 (14.6%) |
Occupancy by Age of Householder in Good Hope
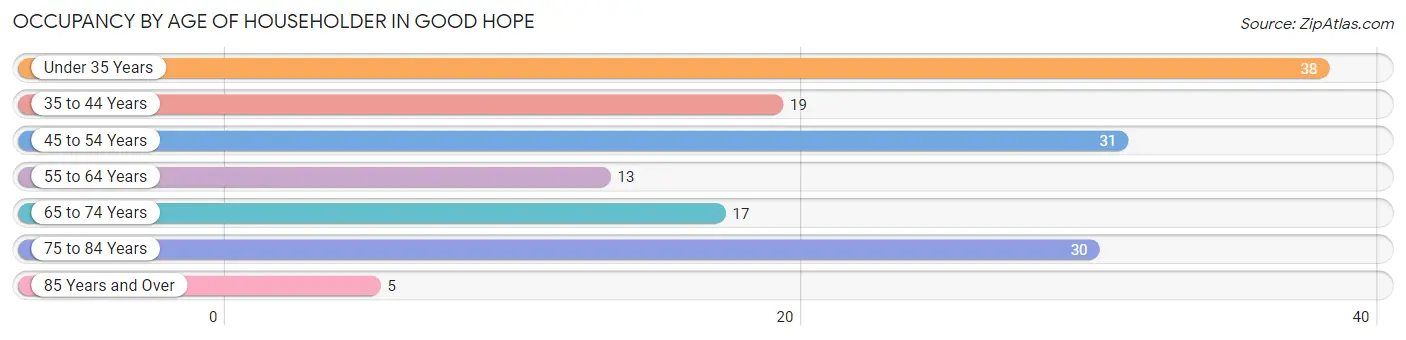
| Age Bracket | # Households | % Households |
| Under 35 Years | 38 | 24.8% |
| 35 to 44 Years | 19 | 12.4% |
| 45 to 54 Years | 31 | 20.3% |
| 55 to 64 Years | 13 | 8.5% |
| 65 to 74 Years | 17 | 11.1% |
| 75 to 84 Years | 30 | 19.6% |
| 85 Years and Over | 5 | 3.3% |
| Total | 153 | 100.0% |
Housing Finances in Good Hope
Median Income by Occupancy in Good Hope
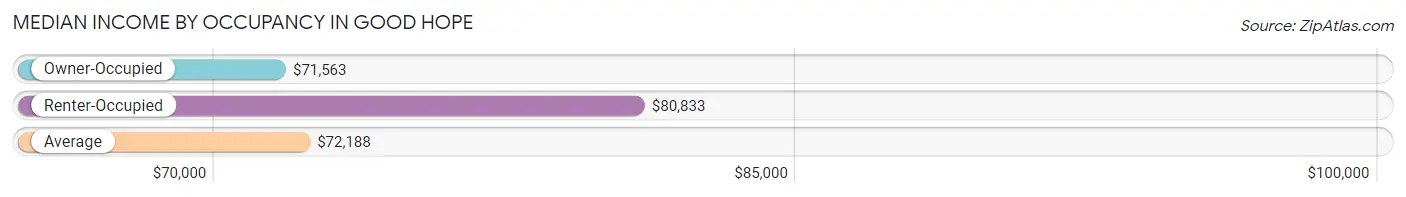
| Occupancy Type | # Households | Median Income |
| Owner-Occupied | 129 (84.3%) | $71,563 |
| Renter-Occupied | 24 (15.7%) | $80,833 |
| Average | 153 (100.0%) | $72,188 |
Occupancy by Householder Income Bracket in Good Hope
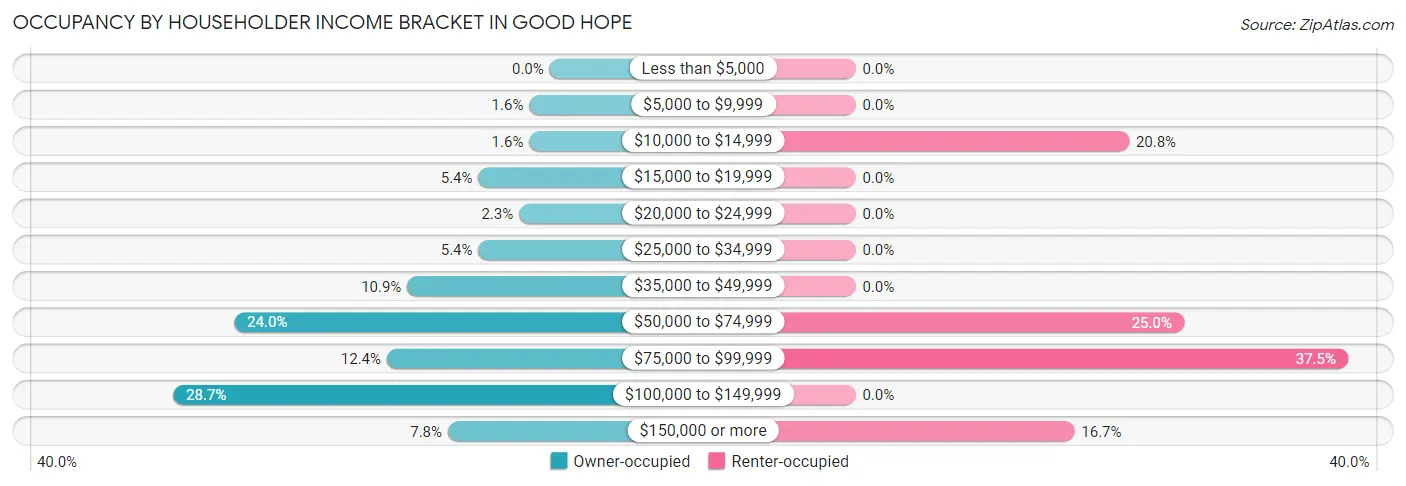
| Income Bracket | Owner-occupied | Renter-occupied |
| Less than $5,000 | 0 (0.0%) | 0 (0.0%) |
| $5,000 to $9,999 | 2 (1.5%) | 0 (0.0%) |
| $10,000 to $14,999 | 2 (1.5%) | 5 (20.8%) |
| $15,000 to $19,999 | 7 (5.4%) | 0 (0.0%) |
| $20,000 to $24,999 | 3 (2.3%) | 0 (0.0%) |
| $25,000 to $34,999 | 7 (5.4%) | 0 (0.0%) |
| $35,000 to $49,999 | 14 (10.8%) | 0 (0.0%) |
| $50,000 to $74,999 | 31 (24.0%) | 6 (25.0%) |
| $75,000 to $99,999 | 16 (12.4%) | 9 (37.5%) |
| $100,000 to $149,999 | 37 (28.7%) | 0 (0.0%) |
| $150,000 or more | 10 (7.7%) | 4 (16.7%) |
| Total | 129 (100.0%) | 24 (100.0%) |
Monthly Housing Cost Tiers in Good Hope
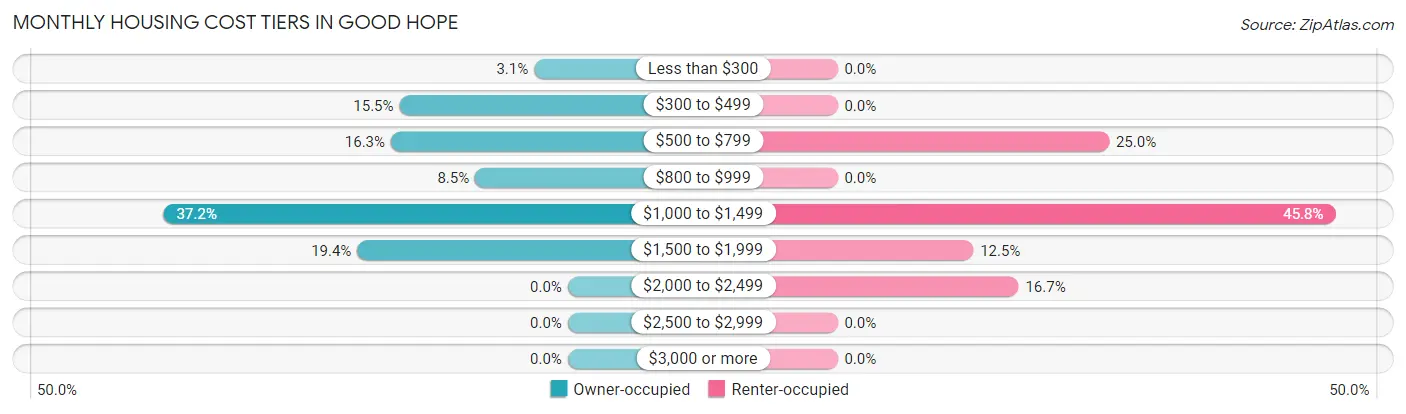
| Monthly Cost | Owner-occupied | Renter-occupied |
| Less than $300 | 4 (3.1%) | 0 (0.0%) |
| $300 to $499 | 20 (15.5%) | 0 (0.0%) |
| $500 to $799 | 21 (16.3%) | 6 (25.0%) |
| $800 to $999 | 11 (8.5%) | 0 (0.0%) |
| $1,000 to $1,499 | 48 (37.2%) | 11 (45.8%) |
| $1,500 to $1,999 | 25 (19.4%) | 3 (12.5%) |
| $2,000 to $2,499 | 0 (0.0%) | 4 (16.7%) |
| $2,500 to $2,999 | 0 (0.0%) | 0 (0.0%) |
| $3,000 or more | 0 (0.0%) | 0 (0.0%) |
| Total | 129 (100.0%) | 24 (100.0%) |
Physical Housing Characteristics in Good Hope
Housing Structures in Good Hope
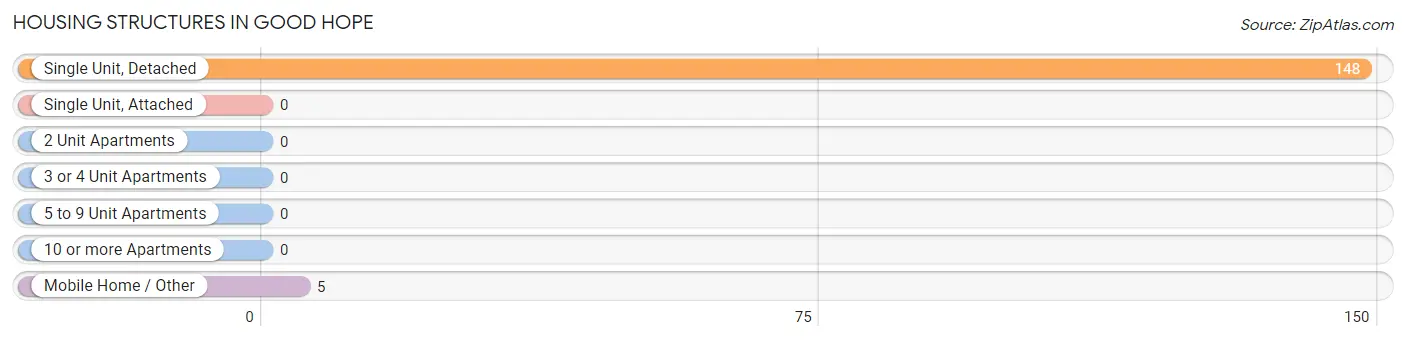
| Structure Type | # Housing Units | % Housing Units |
| Single Unit, Detached | 148 | 96.7% |
| Single Unit, Attached | 0 | 0.0% |
| 2 Unit Apartments | 0 | 0.0% |
| 3 or 4 Unit Apartments | 0 | 0.0% |
| 5 to 9 Unit Apartments | 0 | 0.0% |
| 10 or more Apartments | 0 | 0.0% |
| Mobile Home / Other | 5 | 3.3% |
| Total | 153 | 100.0% |
Housing Structures by Occupancy in Good Hope
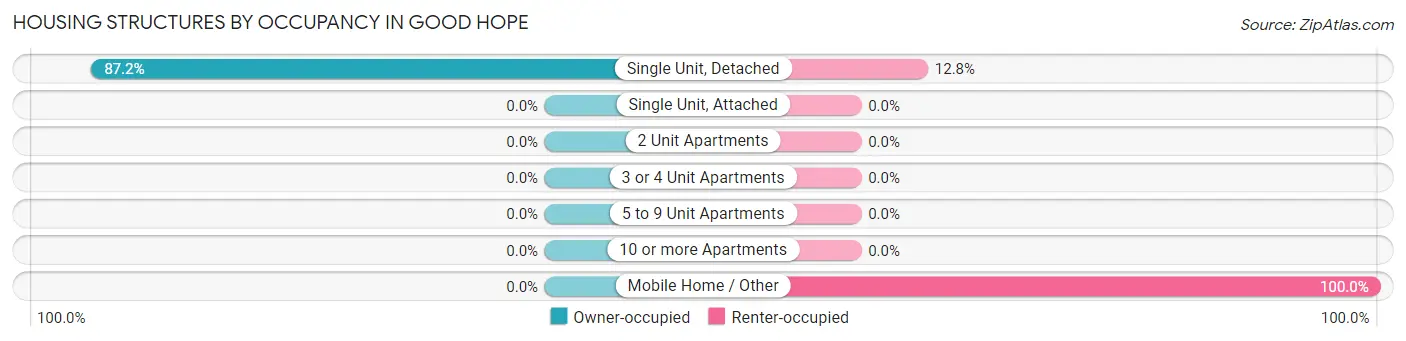
| Structure Type | Owner-occupied | Renter-occupied |
| Single Unit, Detached | 129 (87.2%) | 19 (12.8%) |
| Single Unit, Attached | 0 (0.0%) | 0 (0.0%) |
| 2 Unit Apartments | 0 (0.0%) | 0 (0.0%) |
| 3 or 4 Unit Apartments | 0 (0.0%) | 0 (0.0%) |
| 5 to 9 Unit Apartments | 0 (0.0%) | 0 (0.0%) |
| 10 or more Apartments | 0 (0.0%) | 0 (0.0%) |
| Mobile Home / Other | 0 (0.0%) | 5 (100.0%) |
| Total | 129 (84.3%) | 24 (15.7%) |
Housing Structures by Number of Rooms in Good Hope
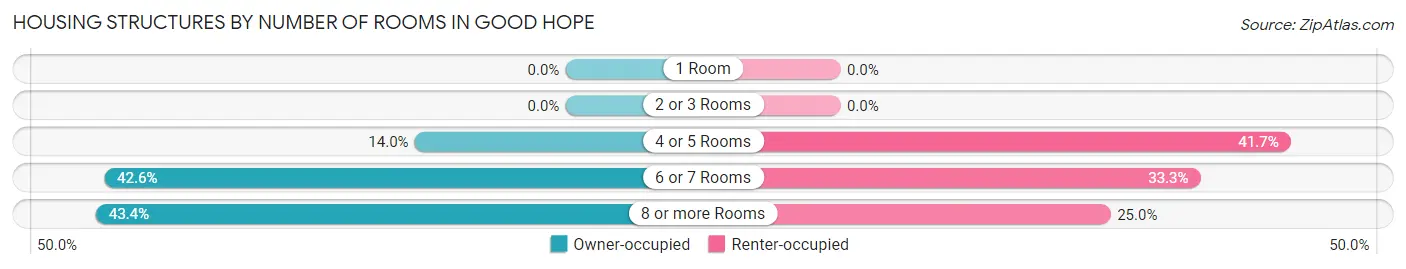
| Number of Rooms | Owner-occupied | Renter-occupied |
| 1 Room | 0 (0.0%) | 0 (0.0%) |
| 2 or 3 Rooms | 0 (0.0%) | 0 (0.0%) |
| 4 or 5 Rooms | 18 (14.0%) | 10 (41.7%) |
| 6 or 7 Rooms | 55 (42.6%) | 8 (33.3%) |
| 8 or more Rooms | 56 (43.4%) | 6 (25.0%) |
| Total | 129 (100.0%) | 24 (100.0%) |
Housing Structure by Heating Type in Good Hope
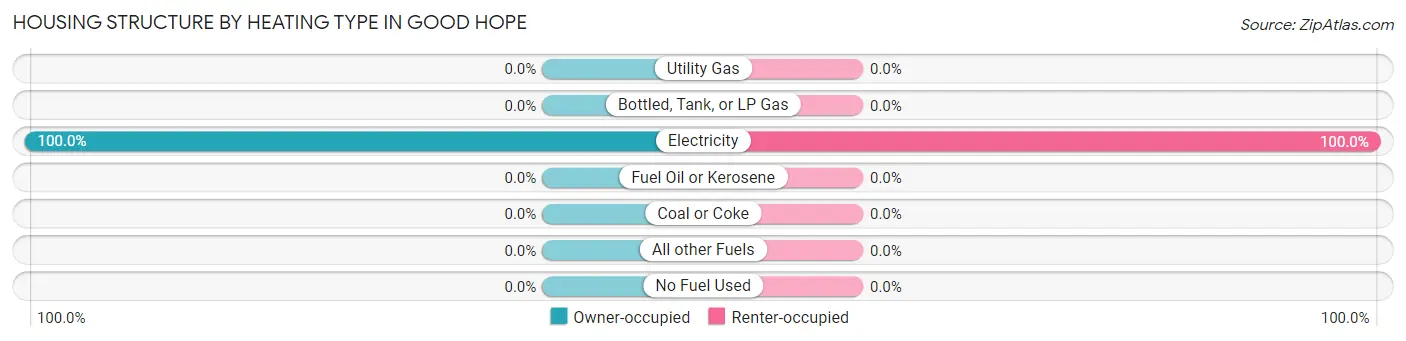
| Heating Type | Owner-occupied | Renter-occupied |
| Utility Gas | 0 (0.0%) | 0 (0.0%) |
| Bottled, Tank, or LP Gas | 0 (0.0%) | 0 (0.0%) |
| Electricity | 129 (100.0%) | 24 (100.0%) |
| Fuel Oil or Kerosene | 0 (0.0%) | 0 (0.0%) |
| Coal or Coke | 0 (0.0%) | 0 (0.0%) |
| All other Fuels | 0 (0.0%) | 0 (0.0%) |
| No Fuel Used | 0 (0.0%) | 0 (0.0%) |
| Total | 129 (100.0%) | 24 (100.0%) |
Household Vehicle Usage in Good Hope
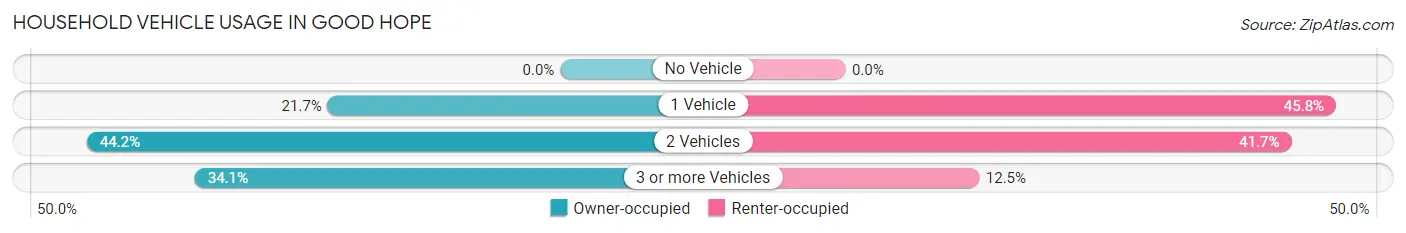
| Vehicles per Household | Owner-occupied | Renter-occupied |
| No Vehicle | 0 (0.0%) | 0 (0.0%) |
| 1 Vehicle | 28 (21.7%) | 11 (45.8%) |
| 2 Vehicles | 57 (44.2%) | 10 (41.7%) |
| 3 or more Vehicles | 44 (34.1%) | 3 (12.5%) |
| Total | 129 (100.0%) | 24 (100.0%) |
Real Estate & Mortgages in Good Hope
Real Estate and Mortgage Overview in Good Hope
| Characteristic | Without Mortgage | With Mortgage |
| Housing Units | 52 | 77 |
| Median Property Value | $240,000 | $255,400 |
| Median Household Income | $61,250 | $3 |
| Monthly Housing Costs | $527 | $0 |
| Real Estate Taxes | $2,200 | $0 |
Property Value by Mortgage Status in Good Hope
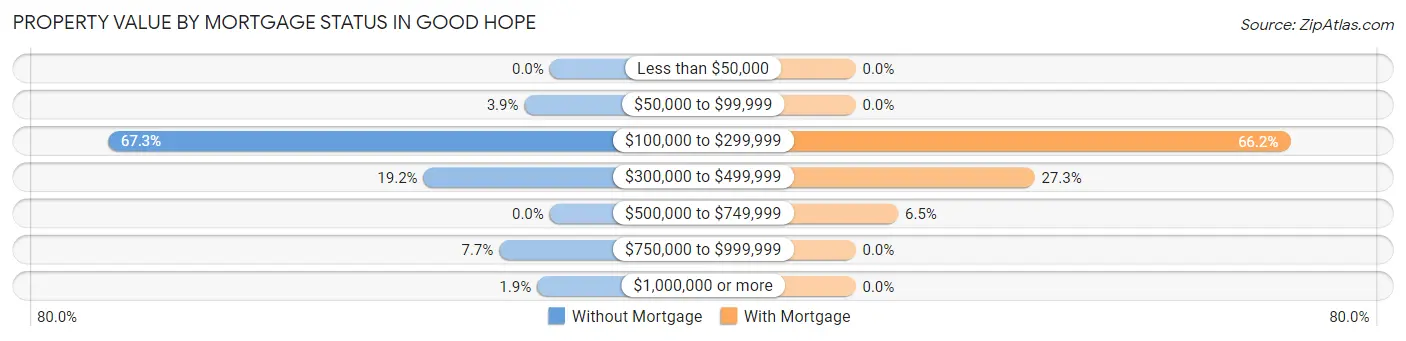
| Property Value | Without Mortgage | With Mortgage |
| Less than $50,000 | 0 (0.0%) | 0 (0.0%) |
| $50,000 to $99,999 | 2 (3.8%) | 0 (0.0%) |
| $100,000 to $299,999 | 35 (67.3%) | 51 (66.2%) |
| $300,000 to $499,999 | 10 (19.2%) | 21 (27.3%) |
| $500,000 to $749,999 | 0 (0.0%) | 5 (6.5%) |
| $750,000 to $999,999 | 4 (7.7%) | 0 (0.0%) |
| $1,000,000 or more | 1 (1.9%) | 0 (0.0%) |
| Total | 52 (100.0%) | 77 (100.0%) |
Household Income by Mortgage Status in Good Hope
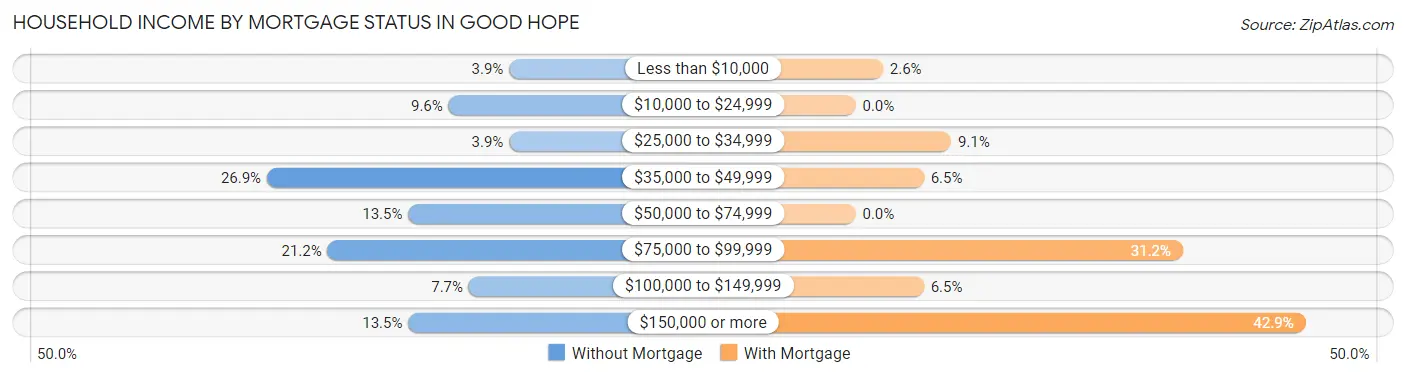
| Household Income | Without Mortgage | With Mortgage |
| Less than $10,000 | 2 (3.8%) | 2 (2.6%) |
| $10,000 to $24,999 | 5 (9.6%) | 0 (0.0%) |
| $25,000 to $34,999 | 2 (3.8%) | 7 (9.1%) |
| $35,000 to $49,999 | 14 (26.9%) | 5 (6.5%) |
| $50,000 to $74,999 | 7 (13.5%) | 0 (0.0%) |
| $75,000 to $99,999 | 11 (21.1%) | 24 (31.2%) |
| $100,000 to $149,999 | 4 (7.7%) | 5 (6.5%) |
| $150,000 or more | 7 (13.5%) | 33 (42.9%) |
| Total | 52 (100.0%) | 77 (100.0%) |
Property Value to Household Income Ratio in Good Hope
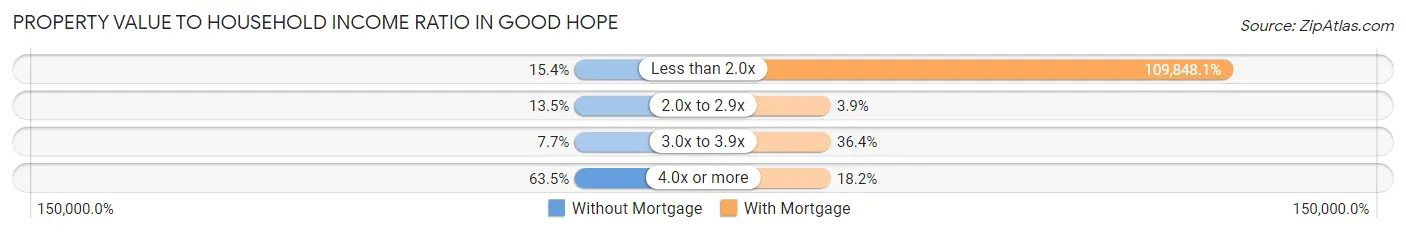
| Value-to-Income Ratio | Without Mortgage | With Mortgage |
| Less than 2.0x | 8 (15.4%) | 84,583 (109,848.0%) |
| 2.0x to 2.9x | 7 (13.5%) | 3 (3.9%) |
| 3.0x to 3.9x | 4 (7.7%) | 28 (36.4%) |
| 4.0x or more | 33 (63.5%) | 14 (18.2%) |
| Total | 52 (100.0%) | 77 (100.0%) |
Real Estate Taxes by Mortgage Status in Good Hope
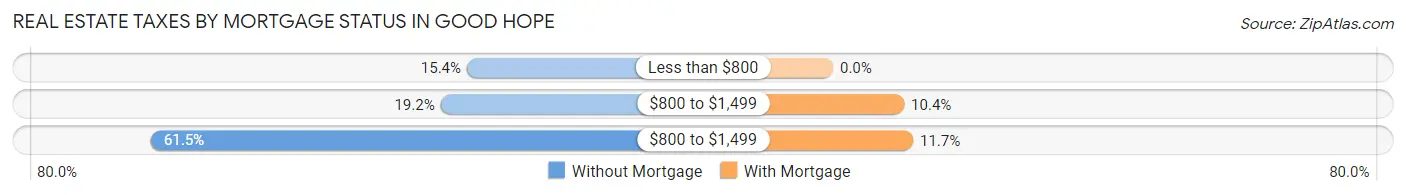
| Property Taxes | Without Mortgage | With Mortgage |
| Less than $800 | 8 (15.4%) | 0 (0.0%) |
| $800 to $1,499 | 10 (19.2%) | 8 (10.4%) |
| $800 to $1,499 | 32 (61.5%) | 9 (11.7%) |
| Total | 52 (100.0%) | 77 (100.0%) |
Health & Disability in Good Hope
Health Insurance Coverage by Age in Good Hope
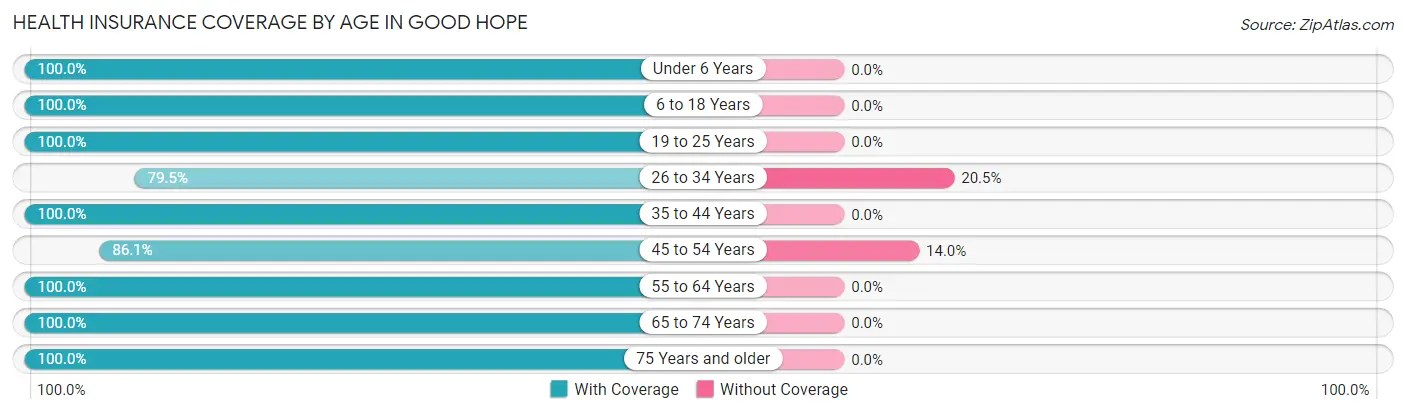
| Age Bracket | With Coverage | Without Coverage |
| Under 6 Years | 20 (100.0%) | 0 (0.0%) |
| 6 to 18 Years | 77 (100.0%) | 0 (0.0%) |
| 19 to 25 Years | 35 (100.0%) | 0 (0.0%) |
| 26 to 34 Years | 31 (79.5%) | 8 (20.5%) |
| 35 to 44 Years | 38 (100.0%) | 0 (0.0%) |
| 45 to 54 Years | 37 (86.1%) | 6 (14.0%) |
| 55 to 64 Years | 32 (100.0%) | 0 (0.0%) |
| 65 to 74 Years | 37 (100.0%) | 0 (0.0%) |
| 75 Years and older | 44 (100.0%) | 0 (0.0%) |
| Total | 351 (96.2%) | 14 (3.8%) |
Health Insurance Coverage by Citizenship Status in Good Hope
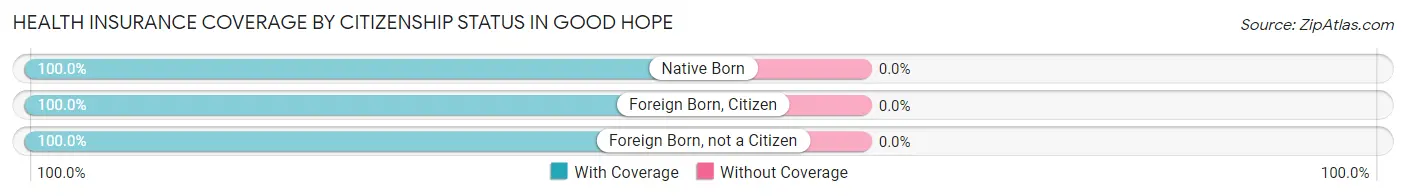
| Citizenship Status | With Coverage | Without Coverage |
| Native Born | 20 (100.0%) | 0 (0.0%) |
| Foreign Born, Citizen | 77 (100.0%) | 0 (0.0%) |
| Foreign Born, not a Citizen | 35 (100.0%) | 0 (0.0%) |
Health Insurance Coverage by Household Income in Good Hope
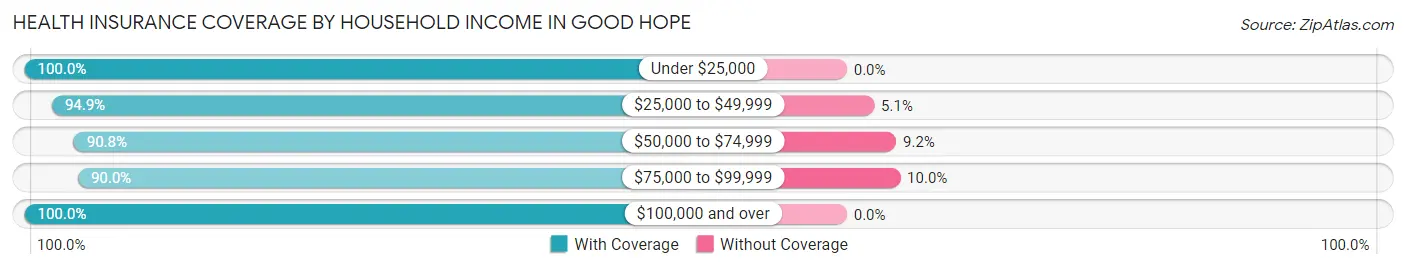
| Household Income | With Coverage | Without Coverage |
| Under $25,000 | 46 (100.0%) | 0 (0.0%) |
| $25,000 to $49,999 | 37 (94.9%) | 2 (5.1%) |
| $50,000 to $74,999 | 59 (90.8%) | 6 (9.2%) |
| $75,000 to $99,999 | 54 (90.0%) | 6 (10.0%) |
| $100,000 and over | 155 (100.0%) | 0 (0.0%) |
Public vs Private Health Insurance Coverage by Age in Good Hope
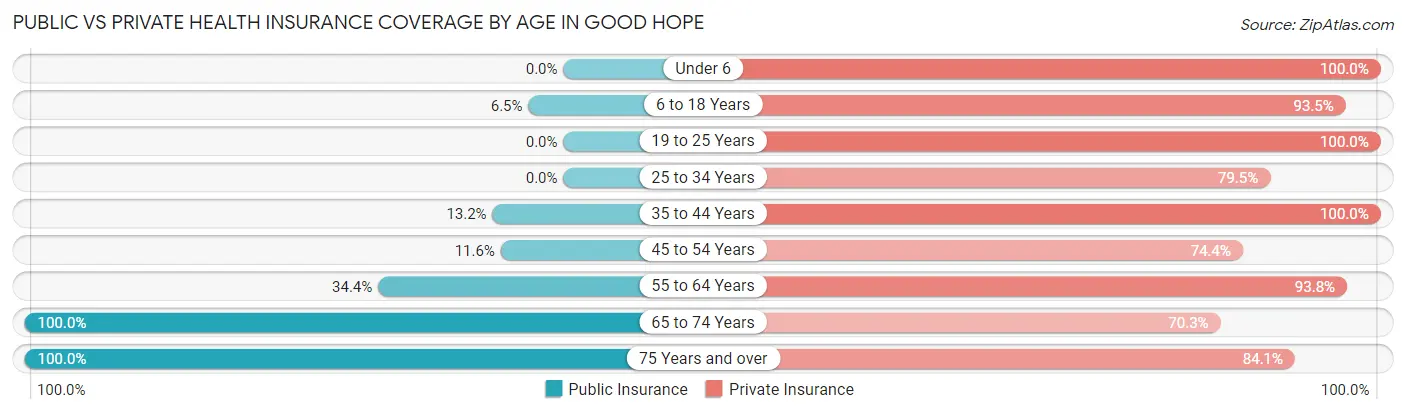
| Age Bracket | Public Insurance | Private Insurance |
| Under 6 | 0 (0.0%) | 20 (100.0%) |
| 6 to 18 Years | 5 (6.5%) | 72 (93.5%) |
| 19 to 25 Years | 0 (0.0%) | 35 (100.0%) |
| 25 to 34 Years | 0 (0.0%) | 31 (79.5%) |
| 35 to 44 Years | 5 (13.2%) | 38 (100.0%) |
| 45 to 54 Years | 5 (11.6%) | 32 (74.4%) |
| 55 to 64 Years | 11 (34.4%) | 30 (93.8%) |
| 65 to 74 Years | 37 (100.0%) | 26 (70.3%) |
| 75 Years and over | 44 (100.0%) | 37 (84.1%) |
| Total | 107 (29.3%) | 321 (87.9%) |
Disability Status by Sex by Age in Good Hope
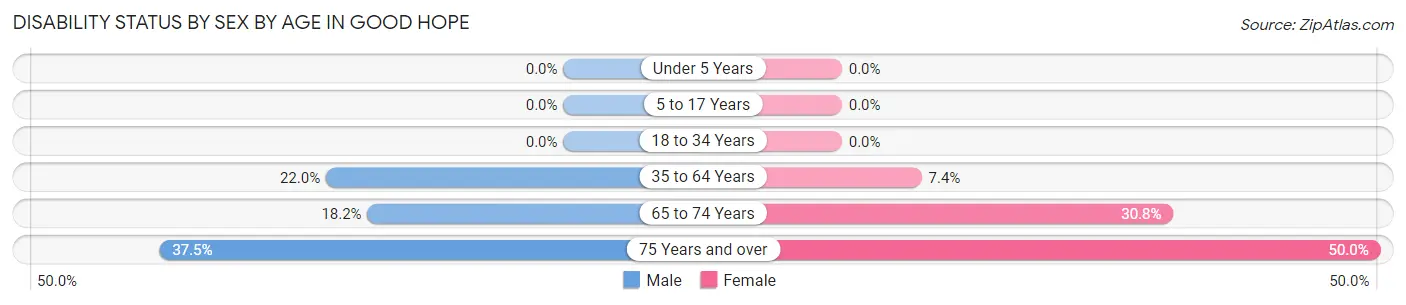
| Age Bracket | Male | Female |
| Under 5 Years | 0 (0.0%) | 0 (0.0%) |
| 5 to 17 Years | 0 (0.0%) | 0 (0.0%) |
| 18 to 34 Years | 0 (0.0%) | 0 (0.0%) |
| 35 to 64 Years | 13 (22.0%) | 4 (7.4%) |
| 65 to 74 Years | 2 (18.2%) | 8 (30.8%) |
| 75 Years and over | 9 (37.5%) | 10 (50.0%) |
Disability Class by Sex by Age in Good Hope
Disability Class: Hearing Difficulty
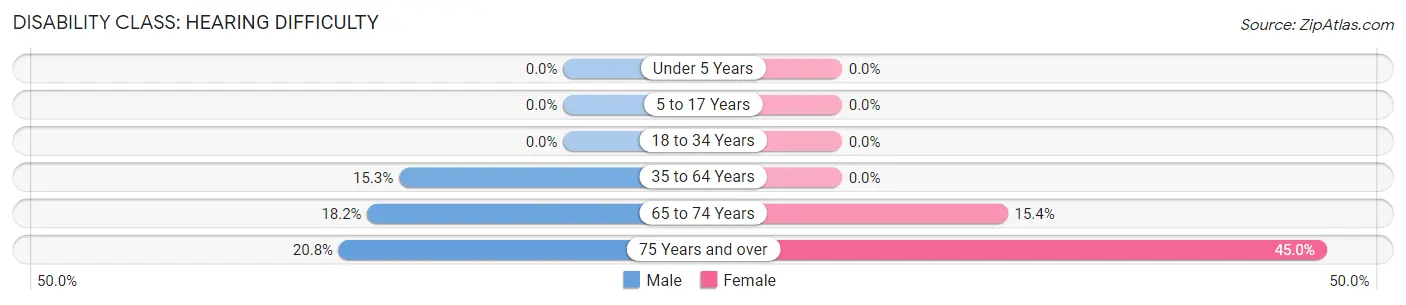
| Age Bracket | Male | Female |
| Under 5 Years | 0 (0.0%) | 0 (0.0%) |
| 5 to 17 Years | 0 (0.0%) | 0 (0.0%) |
| 18 to 34 Years | 0 (0.0%) | 0 (0.0%) |
| 35 to 64 Years | 9 (15.2%) | 0 (0.0%) |
| 65 to 74 Years | 2 (18.2%) | 4 (15.4%) |
| 75 Years and over | 5 (20.8%) | 9 (45.0%) |
Disability Class: Vision Difficulty
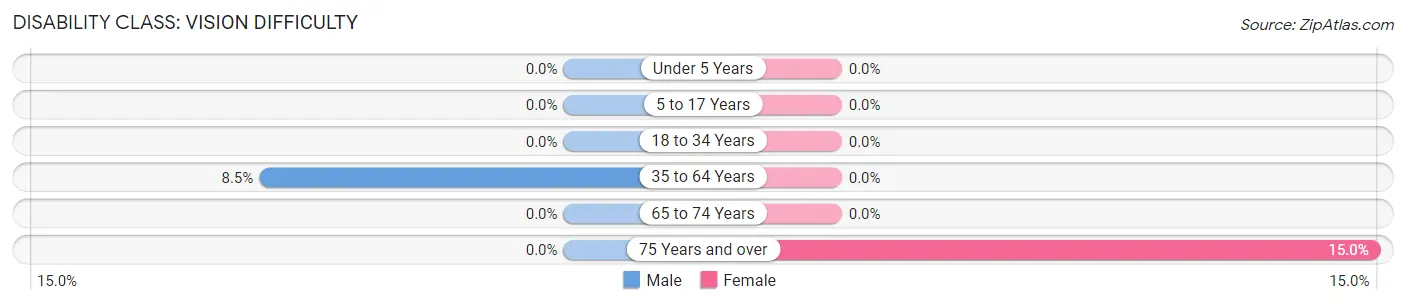
| Age Bracket | Male | Female |
| Under 5 Years | 0 (0.0%) | 0 (0.0%) |
| 5 to 17 Years | 0 (0.0%) | 0 (0.0%) |
| 18 to 34 Years | 0 (0.0%) | 0 (0.0%) |
| 35 to 64 Years | 5 (8.5%) | 0 (0.0%) |
| 65 to 74 Years | 0 (0.0%) | 0 (0.0%) |
| 75 Years and over | 0 (0.0%) | 3 (15.0%) |
Disability Class: Cognitive Difficulty
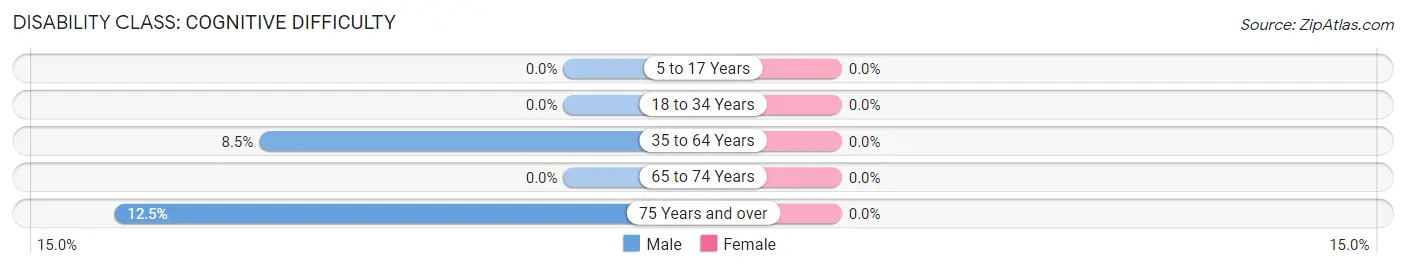
| Age Bracket | Male | Female |
| 5 to 17 Years | 0 (0.0%) | 0 (0.0%) |
| 18 to 34 Years | 0 (0.0%) | 0 (0.0%) |
| 35 to 64 Years | 5 (8.5%) | 0 (0.0%) |
| 65 to 74 Years | 0 (0.0%) | 0 (0.0%) |
| 75 Years and over | 3 (12.5%) | 0 (0.0%) |
Disability Class: Ambulatory Difficulty
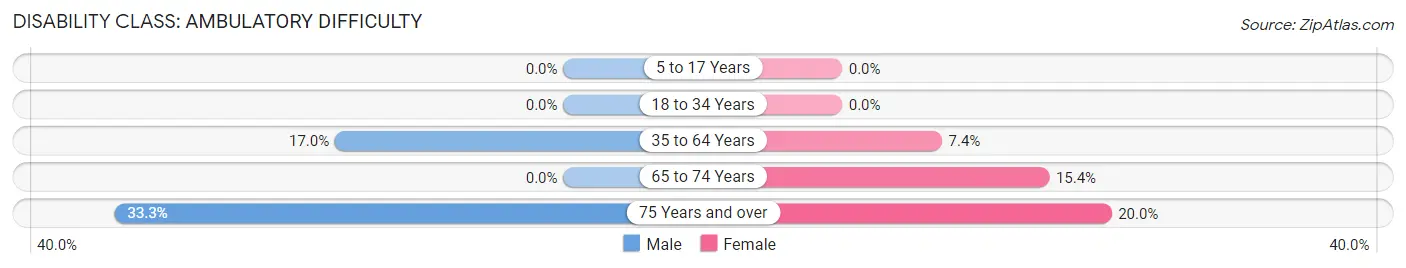
| Age Bracket | Male | Female |
| 5 to 17 Years | 0 (0.0%) | 0 (0.0%) |
| 18 to 34 Years | 0 (0.0%) | 0 (0.0%) |
| 35 to 64 Years | 10 (17.0%) | 4 (7.4%) |
| 65 to 74 Years | 0 (0.0%) | 4 (15.4%) |
| 75 Years and over | 8 (33.3%) | 4 (20.0%) |
Disability Class: Self-Care Difficulty
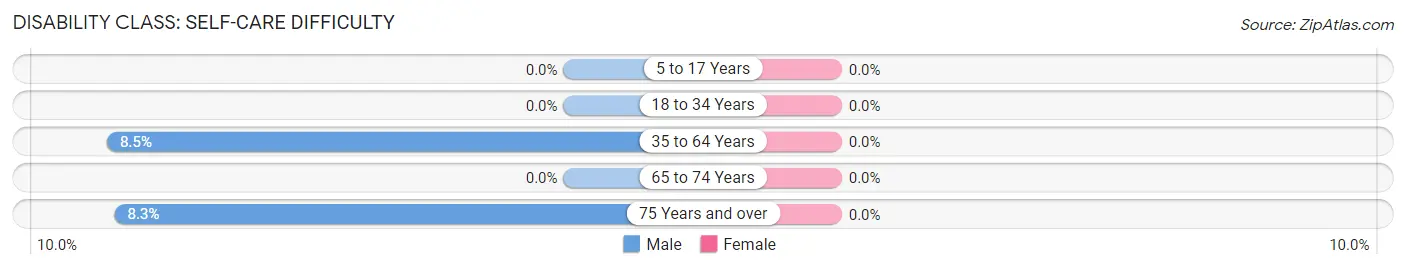
| Age Bracket | Male | Female |
| 5 to 17 Years | 0 (0.0%) | 0 (0.0%) |
| 18 to 34 Years | 0 (0.0%) | 0 (0.0%) |
| 35 to 64 Years | 5 (8.5%) | 0 (0.0%) |
| 65 to 74 Years | 0 (0.0%) | 0 (0.0%) |
| 75 Years and over | 2 (8.3%) | 0 (0.0%) |
Technology Access in Good Hope
Computing Device Access in Good Hope
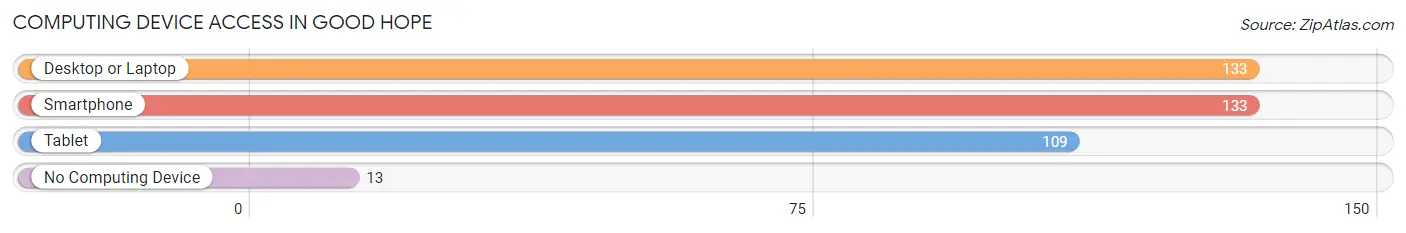
| Device Type | # Households | % Households |
| Desktop or Laptop | 133 | 86.9% |
| Smartphone | 133 | 86.9% |
| Tablet | 109 | 71.2% |
| No Computing Device | 13 | 8.5% |
| Total | 153 | 100.0% |
Internet Access in Good Hope
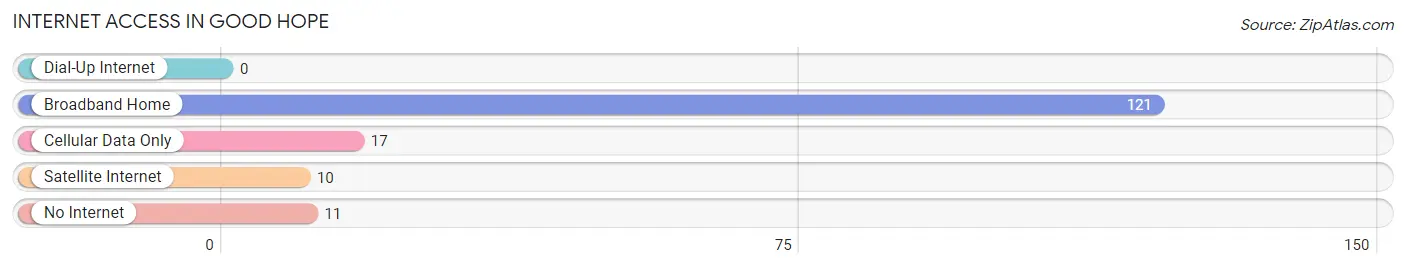
| Internet Type | # Households | % Households |
| Dial-Up Internet | 0 | 0.0% |
| Broadband Home | 121 | 79.1% |
| Cellular Data Only | 17 | 11.1% |
| Satellite Internet | 10 | 6.5% |
| No Internet | 11 | 7.2% |
| Total | 153 | 100.0% |
Good Hope Summary
Good Hope is a small town located in the state of Georgia, United States. It is situated in the western part of the state, in the foothills of the Appalachian Mountains. The town is located in the county of Gordon, and is part of the Calhoun-Gordon Metropolitan Statistical Area. The population of Good Hope was estimated to be 1,845 in the year 2020.
History
Good Hope was founded in 1832 by a group of settlers from North Carolina. The town was named after the nearby Good Hope Baptist Church, which was established in 1831. The town was originally a farming community, and the main crops grown were cotton, corn, and tobacco. The town was also known for its iron ore deposits, which were mined and used to make tools and weapons.
In the late 19th century, the town began to grow and develop. The railroad was built through the town in 1887, and this allowed for the transportation of goods and people. The town also became a popular tourist destination, as it was located near the Chattahoochee National Forest.
Geography
Good Hope is located in the foothills of the Appalachian Mountains, in the western part of the state of Georgia. The town is situated in the county of Gordon, and is part of the Calhoun-Gordon Metropolitan Statistical Area. The town is located at an elevation of 1,072 feet above sea level.
The town is located in a humid subtropical climate zone, and the average temperature in the summer months is around 80 degrees Fahrenheit. The average temperature in the winter months is around 40 degrees Fahrenheit. The town receives an average of 48 inches of precipitation per year.
Economy
The economy of Good Hope is largely based on agriculture and tourism. The town is home to several farms, which produce a variety of crops, including cotton, corn, and tobacco. The town is also home to several tourist attractions, such as the Chattahoochee National Forest and the nearby Lake Lanier.
The town is also home to several small businesses, including restaurants, retail stores, and service providers. The town is also home to several manufacturing companies, which produce a variety of products, including furniture, clothing, and electronics.
Demographics
The population of Good Hope was estimated to be 1,845 in the year 2020. The town has a population that is predominantly white, with a small percentage of African Americans and Hispanics. The median household income in the town is $41,945, and the median age is 39.7 years. The town has a high school graduation rate of 87.3%, and the unemployment rate is 4.2%.
Common Questions
What is the Total Population of Good Hope?
Total Population of Good Hope is 365.
What is the Total Male Population of Good Hope?
Total Male Population of Good Hope is 192.
What is the Total Female Population of Good Hope?
Total Female Population of Good Hope is 173.
What is the Ratio of Males per 100 Females in Good Hope?
There are 110.98 Males per 100 Females in Good Hope.
What is the Ratio of Females per 100 Males in Good Hope?
There are 90.10 Females per 100 Males in Good Hope.
What is the Median Population Age in Good Hope?
Median Population Age in Good Hope is 38.3 Years.
What is the Average Family Size in Good Hope
Average Family Size in Good Hope is 2.7 People.
What is the Average Household Size in Good Hope
Average Household Size in Good Hope is 2.4 People.
What is Per Capita Income in Good Hope?
Per Capita income in Good Hope is $32,694.
What is the Median Family Income in Good Hope?
Median Family Income in Good Hope is $84,583.
What is the Median Household income in Good Hope?
Median Household Income in Good Hope is $72,188.
What is Income or Wage Gap in Good Hope?
Income or Wage Gap in Good Hope is 20.7%.
Women in Good Hope earn 79.3 cents for every dollar earned by a man.
What is Inequality or Gini Index in Good Hope?
Inequality or Gini Index in Good Hope is 0.33.
How Large is the Labor Force in Good Hope?
There are 161 People in the Labor Forcein in Good Hope.
What is the Percentage of People in the Labor Force in Good Hope?
56.1% of People are in the Labor Force in Good Hope.