Fairview, GA
Fairview Map
Fairview Overview
5,718
TOTAL POPULATION
2,671
MALE POPULATION
3,047
FEMALE POPULATION
87.66
MALES / 100 FEMALES
114.08
FEMALES / 100 MALES
47.7
MEDIAN AGE
3.0
AVG FAMILY SIZE
2.4
AVG HOUSEHOLD SIZE
$27,250
PER CAPITA INCOME
$58,333
AVG FAMILY INCOME
$48,902
AVG HOUSEHOLD INCOME
21.9%
WAGE / INCOME GAP [ % ]
78.1¢/ $1
WAGE / INCOME GAP [ $ ]
0.41
INEQUALITY / GINI INDEX
2,438
LABOR FORCE [ PEOPLE ]
51.5%
PERCENT IN LABOR FORCE
3.0%
UNEMPLOYMENT RATE
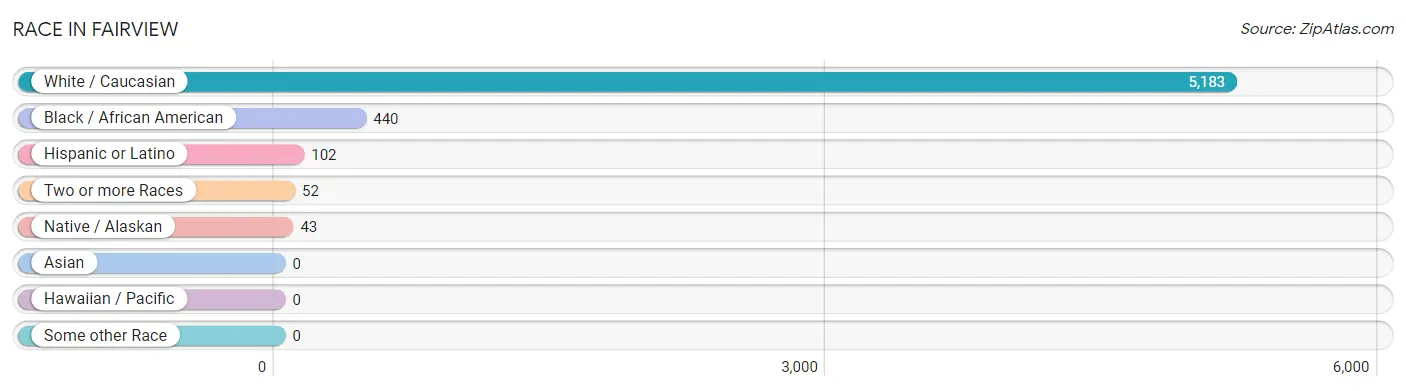
Race in Fairview
The most populous races in Fairview are White / Caucasian (5,183 | 90.6%), Black / African American (440 | 7.7%), and Hispanic or Latino (102 | 1.8%).
| Race | # Population | % Population |
| Asian | 0 | 0.0% |
| Black / African American | 440 | 7.7% |
| Hawaiian / Pacific | 0 | 0.0% |
| Hispanic or Latino | 102 | 1.8% |
| Native / Alaskan | 43 | 0.7% |
| White / Caucasian | 5,183 | 90.6% |
| Two or more Races | 52 | 0.9% |
| Some other Race | 0 | 0.0% |
| Total | 5,718 | 100.0% |
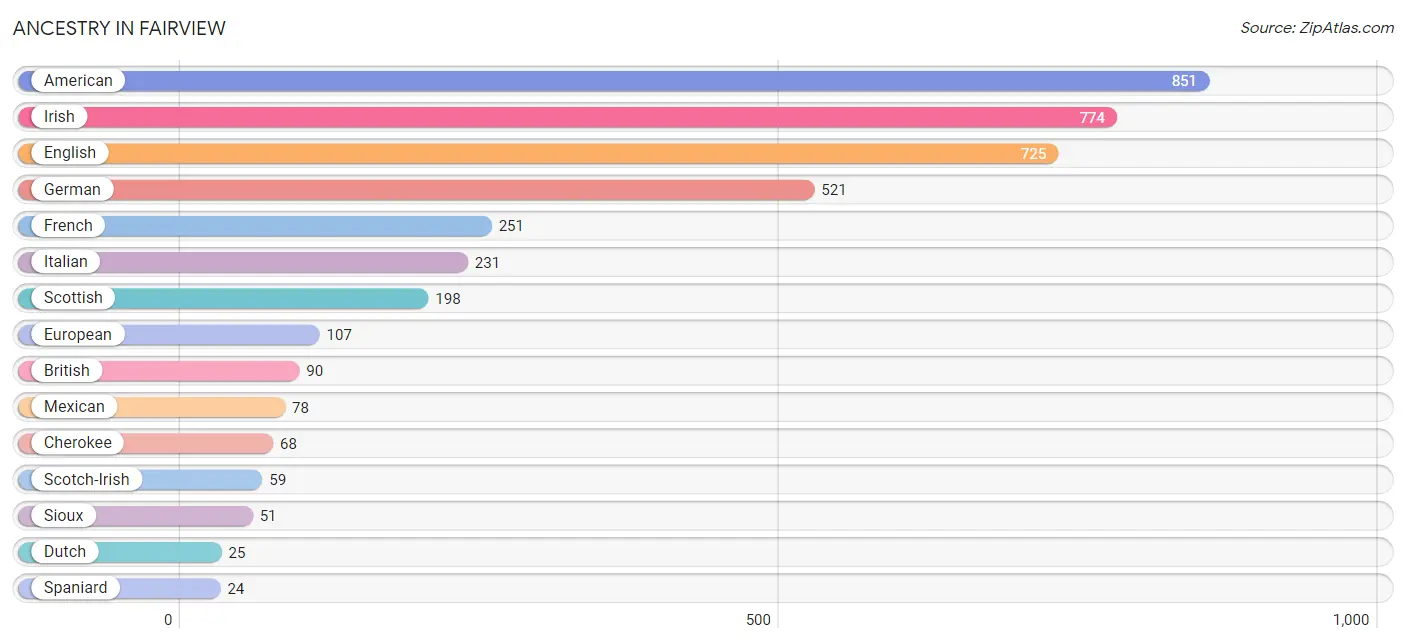
Ancestry in Fairview
The most populous ancestries reported in Fairview are American (851 | 14.9%), Irish (774 | 13.5%), English (725 | 12.7%), German (521 | 9.1%), and French (251 | 4.4%), together accounting for 54.6% of all Fairview residents.
| Ancestry | # Population | % Population |
| African | 11 | 0.2% |
| American | 851 | 14.9% |
| Apache | 8 | 0.1% |
| Barbadian | 16 | 0.3% |
| Blackfeet | 8 | 0.1% |
| British | 90 | 1.6% |
| Cherokee | 68 | 1.2% |
| Choctaw | 7 | 0.1% |
| Dutch | 25 | 0.4% |
| English | 725 | 12.7% |
| European | 107 | 1.9% |
| French | 251 | 4.4% |
| German | 521 | 9.1% |
| Irish | 774 | 13.5% |
| Italian | 231 | 4.0% |
| Mexican | 78 | 1.4% |
| Scotch-Irish | 59 | 1.0% |
| Scottish | 198 | 3.5% |
| Sioux | 51 | 0.9% |
| Spaniard | 24 | 0.4% |
| Subsaharan African | 11 | 0.2% | View All 21 Rows |
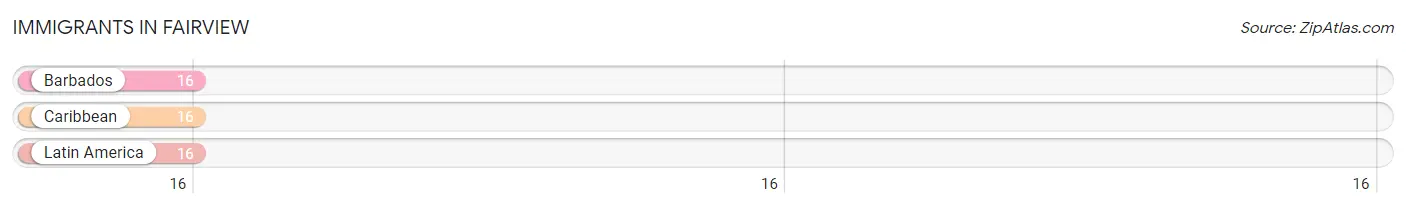
Immigrants in Fairview
The most numerous immigrant groups reported in Fairview came from Barbados (16 | 0.3%), Caribbean (16 | 0.3%), and Latin America (16 | 0.3%), together accounting for 0.8% of all Fairview residents.
| Immigration Origin | # Population | % Population |
| Barbados | 16 | 0.3% |
| Caribbean | 16 | 0.3% |
| Latin America | 16 | 0.3% | View All 3 Rows |
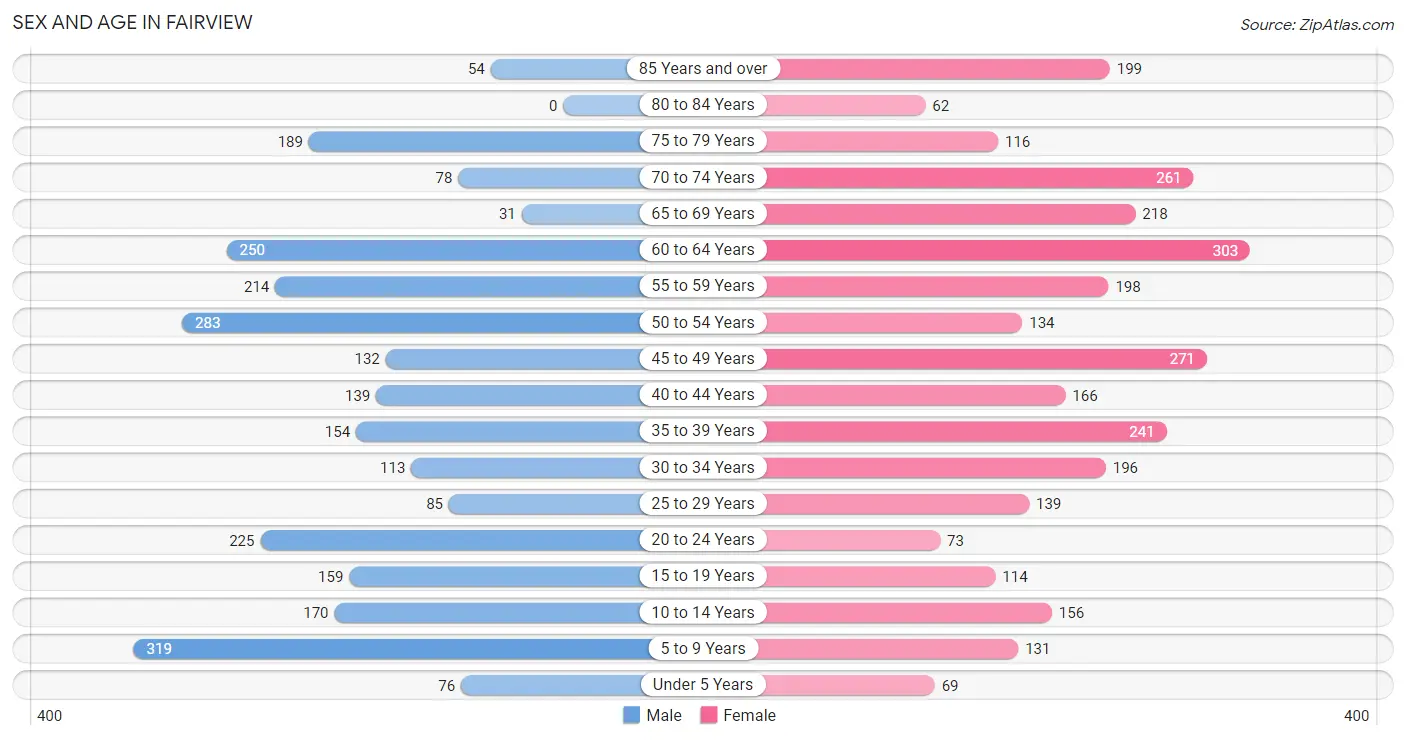
Sex and Age in Fairview
Sex and Age in Fairview
The most populous age groups in Fairview are 5 to 9 Years (319 | 11.9%) for men and 60 to 64 Years (303 | 9.9%) for women.
| Age Bracket | Male | Female |
| Under 5 Years | 76 (2.9%) | 69 (2.3%) |
| 5 to 9 Years | 319 (11.9%) | 131 (4.3%) |
| 10 to 14 Years | 170 (6.4%) | 156 (5.1%) |
| 15 to 19 Years | 159 (5.9%) | 114 (3.7%) |
| 20 to 24 Years | 225 (8.4%) | 73 (2.4%) |
| 25 to 29 Years | 85 (3.2%) | 139 (4.6%) |
| 30 to 34 Years | 113 (4.2%) | 196 (6.4%) |
| 35 to 39 Years | 154 (5.8%) | 241 (7.9%) |
| 40 to 44 Years | 139 (5.2%) | 166 (5.4%) |
| 45 to 49 Years | 132 (4.9%) | 271 (8.9%) |
| 50 to 54 Years | 283 (10.6%) | 134 (4.4%) |
| 55 to 59 Years | 214 (8.0%) | 198 (6.5%) |
| 60 to 64 Years | 250 (9.4%) | 303 (9.9%) |
| 65 to 69 Years | 31 (1.2%) | 218 (7.1%) |
| 70 to 74 Years | 78 (2.9%) | 261 (8.6%) |
| 75 to 79 Years | 189 (7.1%) | 116 (3.8%) |
| 80 to 84 Years | 0 (0.0%) | 62 (2.0%) |
| 85 Years and over | 54 (2.0%) | 199 (6.5%) |
| Total | 2,671 (100.0%) | 3,047 (100.0%) |
Families and Households in Fairview
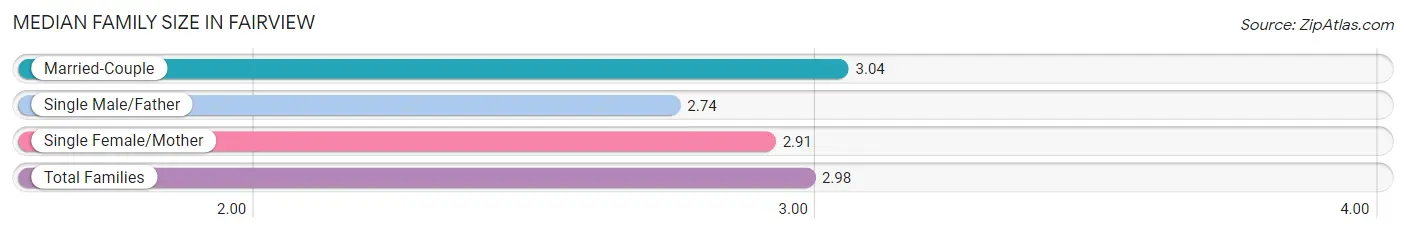
Median Family Size in Fairview
The median family size in Fairview is 2.98 persons per family, with married-couple families (1,008 | 62.3%) accounting for the largest median family size of 3.04 persons per family. On the other hand, single male/father families (128 | 7.9%) represent the smallest median family size with 2.74 persons per family.
| Family Type | # Families | Family Size |
| Married-Couple | 1,008 (62.3%) | 3.04 |
| Single Male/Father | 128 (7.9%) | 2.74 |
| Single Female/Mother | 482 (29.8%) | 2.91 |
| Total Families | 1,618 (100.0%) | 2.98 |
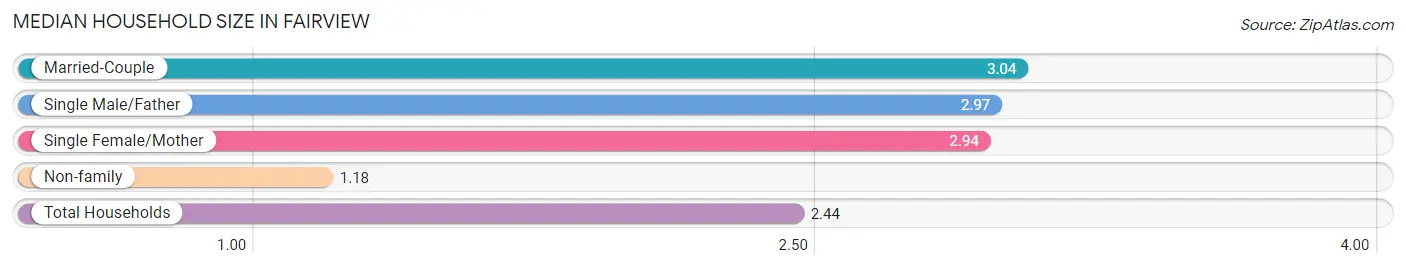
Median Household Size in Fairview
The median household size in Fairview is 2.44 persons per household, with married-couple households (1,008 | 42.9%) accounting for the largest median household size of 3.04 persons per household. non-family households (730 | 31.1%) represent the smallest median household size with 1.18 persons per household.
| Household Type | # Households | Household Size |
| Married-Couple | 1,008 (42.9%) | 3.04 |
| Single Male/Father | 128 (5.4%) | 2.97 |
| Single Female/Mother | 482 (20.5%) | 2.94 |
| Non-family | 730 (31.1%) | 1.18 |
| Total Households | 2,348 (100.0%) | 2.44 |
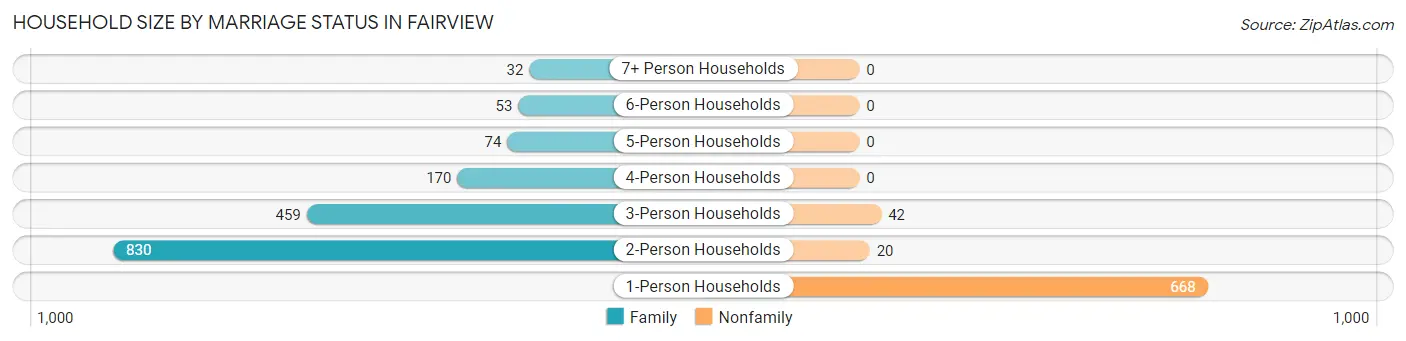
Household Size by Marriage Status in Fairview
Out of a total of 2,348 households in Fairview, 1,618 (68.9%) are family households, while 730 (31.1%) are nonfamily households. The most numerous type of family households are 2-person households, comprising 830, and the most common type of nonfamily households are 1-person households, comprising 668.
| Household Size | Family Households | Nonfamily Households |
| 1-Person Households | - | 668 (28.4%) |
| 2-Person Households | 830 (35.3%) | 20 (0.9%) |
| 3-Person Households | 459 (19.6%) | 42 (1.8%) |
| 4-Person Households | 170 (7.2%) | 0 (0.0%) |
| 5-Person Households | 74 (3.2%) | 0 (0.0%) |
| 6-Person Households | 53 (2.3%) | 0 (0.0%) |
| 7+ Person Households | 32 (1.4%) | 0 (0.0%) |
| Total | 1,618 (68.9%) | 730 (31.1%) |
Female Fertility in Fairview
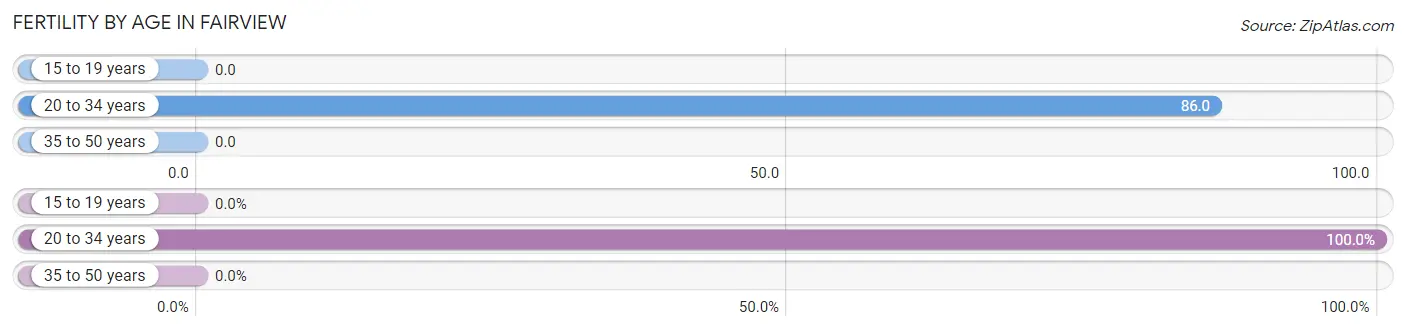
Fertility by Age in Fairview
Average fertility rate in Fairview is 28.0 births per 1,000 women. Women in the age bracket of 20 to 34 years have the highest fertility rate with 86.0 births per 1,000 women. Women in the age bracket of 20 to 34 years acount for 100.0% of all women with births.
| Age Bracket | Women with Births | Births / 1,000 Women |
| 15 to 19 years | 0 (0.0%) | 0.0 |
| 20 to 34 years | 35 (100.0%) | 86.0 |
| 35 to 50 years | 0 (0.0%) | 0.0 |
| Total | 35 (100.0%) | 28.0 |
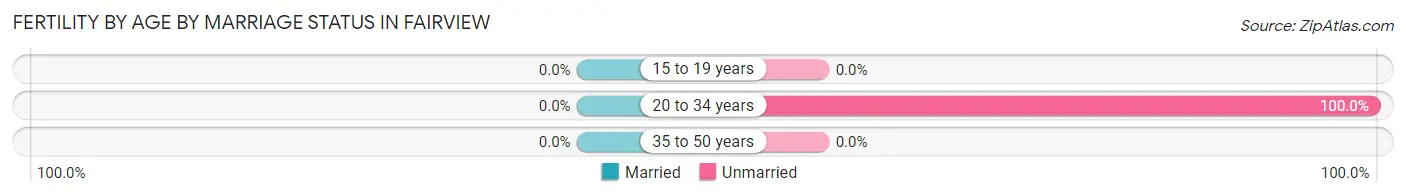
Fertility by Age by Marriage Status in Fairview
| Age Bracket | Married | Unmarried |
| 15 to 19 years | 0 (0.0%) | 0 (0.0%) |
| 20 to 34 years | 0 (0.0%) | 35 (100.0%) |
| 35 to 50 years | 0 (0.0%) | 0 (0.0%) |
| Total | 0 (0.0%) | 35 (100.0%) |
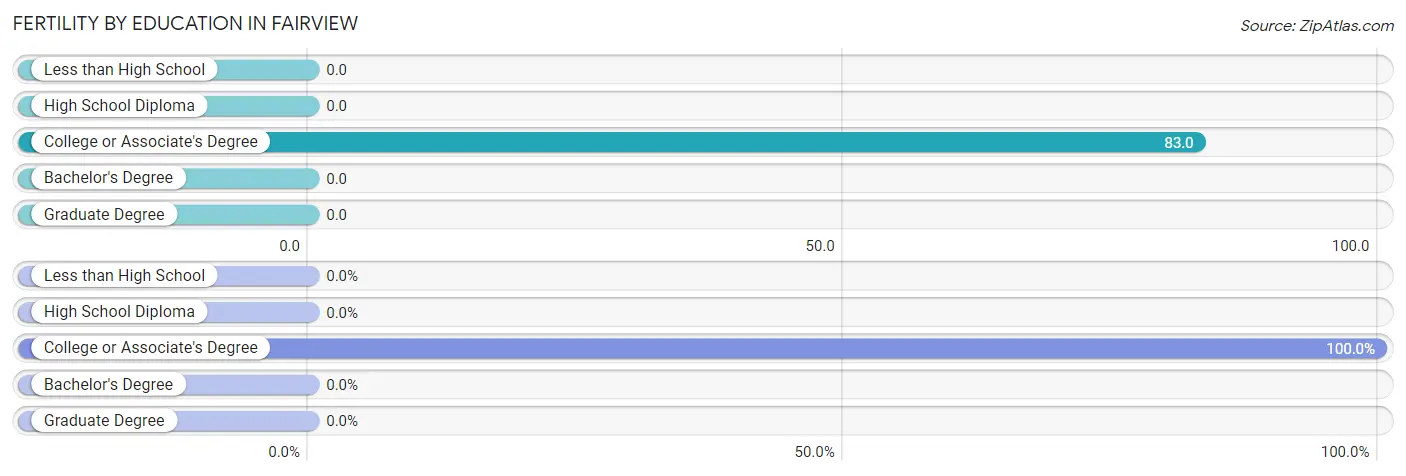
Fertility by Education in Fairview
| Educational Attainment | Women with Births | Births / 1,000 Women |
| Less than High School | 0 (0.0%) | 0.0 |
| High School Diploma | 0 (0.0%) | 0.0 |
| College or Associate's Degree | 35 (100.0%) | 83.0 |
| Bachelor's Degree | 0 (0.0%) | 0.0 |
| Graduate Degree | 0 (0.0%) | 0.0 |
| Total | 35 (100.0%) | 28.0 |
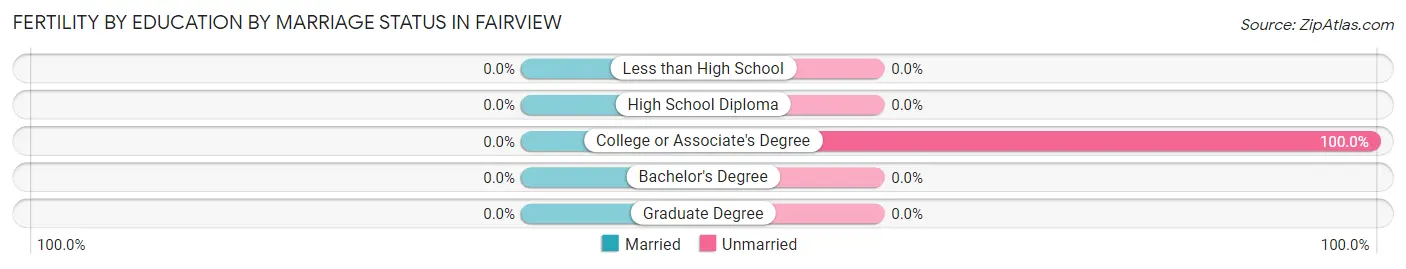
Fertility by Education by Marriage Status in Fairview
| Educational Attainment | Married | Unmarried |
| Less than High School | 0 (0.0%) | 0 (0.0%) |
| High School Diploma | 0 (0.0%) | 0 (0.0%) |
| College or Associate's Degree | 0 (0.0%) | 35 (100.0%) |
| Bachelor's Degree | 0 (0.0%) | 0 (0.0%) |
| Graduate Degree | 0 (0.0%) | 0 (0.0%) |
| Total | 0 (0.0%) | 35 (100.0%) |
Income in Fairview
Income Overview in Fairview
Per Capita Income in Fairview is $27,250, while median incomes of families and households are $58,333 and $48,902 respectively.
| Characteristic | Number | Measure |
| Per Capita Income | 5,718 | $27,250 |
| Median Family Income | 1,618 | $58,333 |
| Mean Family Income | 1,618 | $75,873 |
| Median Household Income | 2,348 | $48,902 |
| Mean Household Income | 2,348 | $62,788 |
| Income Deficit | 1,618 | $0 |
| Wage / Income Gap (%) | 5,718 | 21.91% |
| Wage / Income Gap ($) | 5,718 | 78.09¢ per $1 |
| Gini / Inequality Index | 5,718 | 0.41 |
Earnings by Sex in Fairview
Average Earnings in Fairview are $36,583, $43,023 for men and $33,598 for women, a difference of 21.9%.
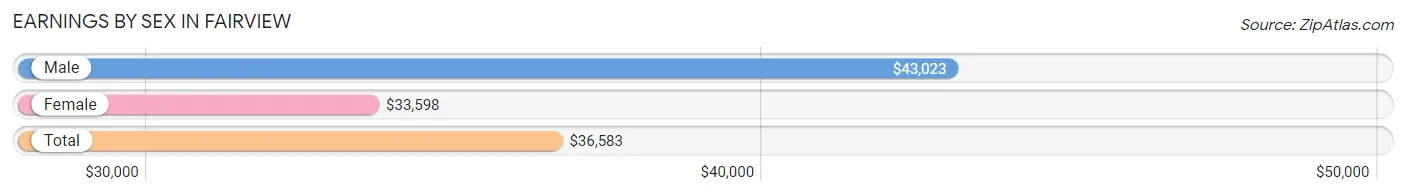
| Sex | Number | Average Earnings |
| Male | 1,275 (50.4%) | $43,023 |
| Female | 1,256 (49.6%) | $33,598 |
| Total | 2,531 (100.0%) | $36,583 |
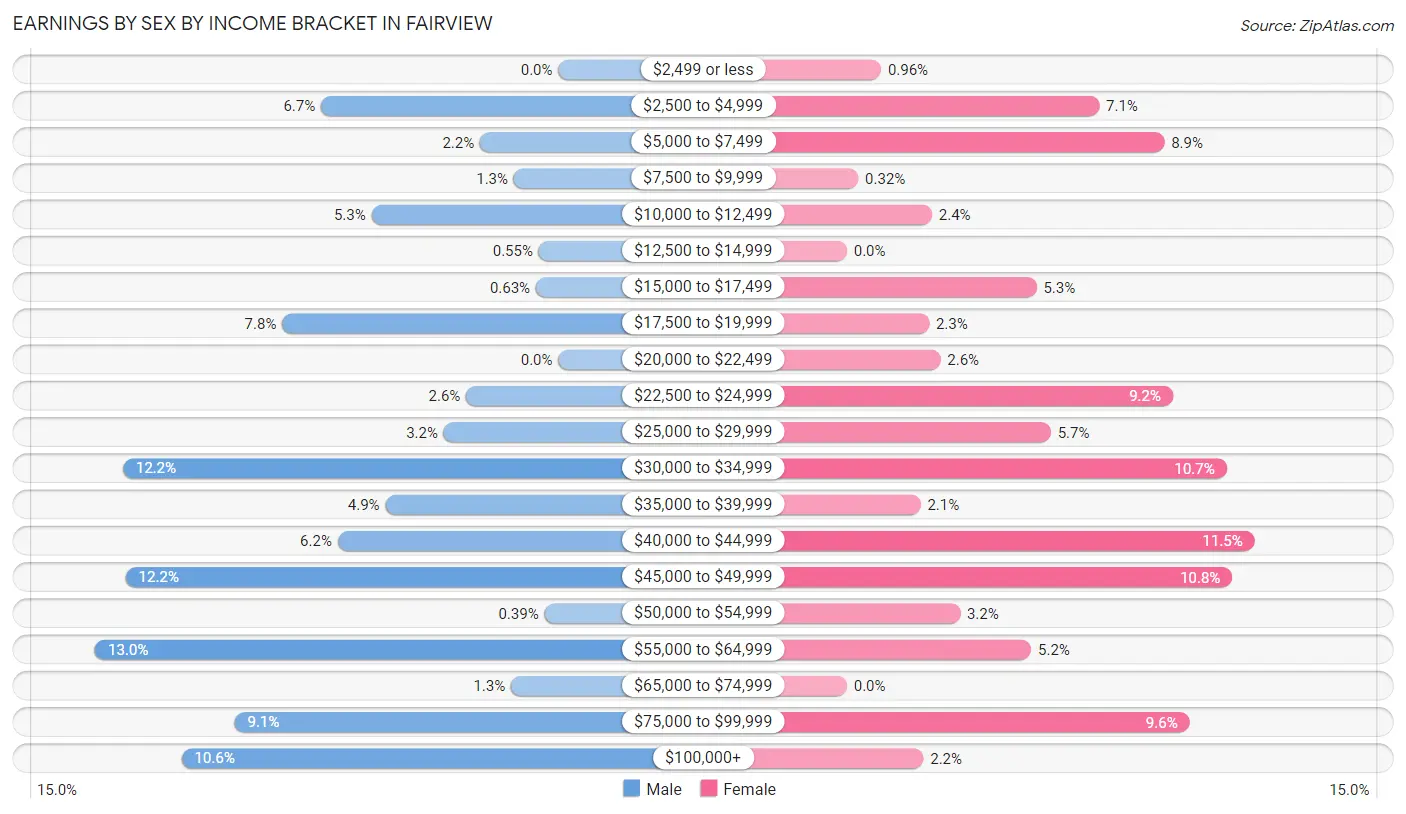
Earnings by Sex by Income Bracket in Fairview
The most common earnings brackets in Fairview are $55,000 to $64,999 for men (166 | 13.0%) and $40,000 to $44,999 for women (144 | 11.5%).
| Income | Male | Female |
| $2,499 or less | 0 (0.0%) | 12 (1.0%) |
| $2,500 to $4,999 | 85 (6.7%) | 89 (7.1%) |
| $5,000 to $7,499 | 28 (2.2%) | 112 (8.9%) |
| $7,500 to $9,999 | 16 (1.3%) | 4 (0.3%) |
| $10,000 to $12,499 | 67 (5.2%) | 30 (2.4%) |
| $12,500 to $14,999 | 7 (0.5%) | 0 (0.0%) |
| $15,000 to $17,499 | 8 (0.6%) | 67 (5.3%) |
| $17,500 to $19,999 | 99 (7.8%) | 29 (2.3%) |
| $20,000 to $22,499 | 0 (0.0%) | 33 (2.6%) |
| $22,500 to $24,999 | 33 (2.6%) | 115 (9.2%) |
| $25,000 to $29,999 | 41 (3.2%) | 72 (5.7%) |
| $30,000 to $34,999 | 156 (12.2%) | 134 (10.7%) |
| $35,000 to $39,999 | 62 (4.9%) | 26 (2.1%) |
| $40,000 to $44,999 | 79 (6.2%) | 144 (11.5%) |
| $45,000 to $49,999 | 155 (12.2%) | 136 (10.8%) |
| $50,000 to $54,999 | 5 (0.4%) | 40 (3.2%) |
| $55,000 to $64,999 | 166 (13.0%) | 65 (5.2%) |
| $65,000 to $74,999 | 17 (1.3%) | 0 (0.0%) |
| $75,000 to $99,999 | 116 (9.1%) | 121 (9.6%) |
| $100,000+ | 135 (10.6%) | 27 (2.1%) |
| Total | 1,275 (100.0%) | 1,256 (100.0%) |
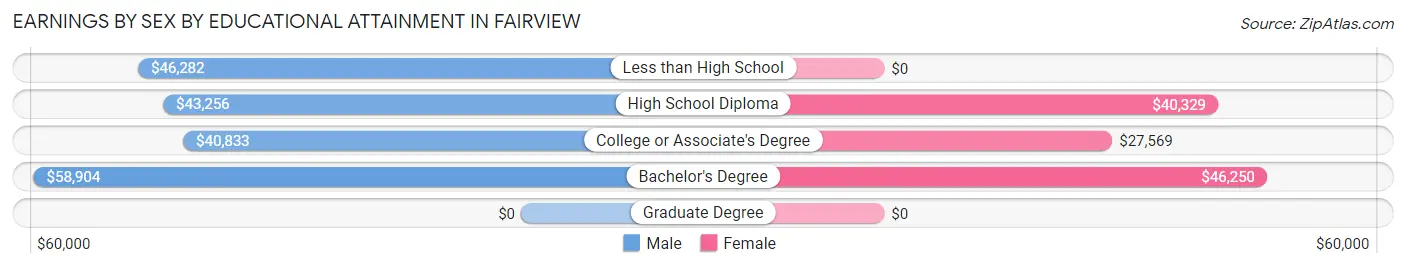
Earnings by Sex by Educational Attainment in Fairview
Average earnings in Fairview are $45,890 for men and $34,451 for women, a difference of 24.9%. Men with an educational attainment of bachelor's degree enjoy the highest average annual earnings of $58,904, while those with college or associate's degree education earn the least with $40,833. Women with an educational attainment of bachelor's degree earn the most with the average annual earnings of $46,250, while those with college or associate's degree education have the smallest earnings of $27,569.
| Educational Attainment | Male Income | Female Income |
| Less than High School | $46,282 | $0 |
| High School Diploma | $43,256 | $40,329 |
| College or Associate's Degree | $40,833 | $27,569 |
| Bachelor's Degree | $58,904 | $46,250 |
| Graduate Degree | - | - |
| Total | $45,890 | $34,451 |
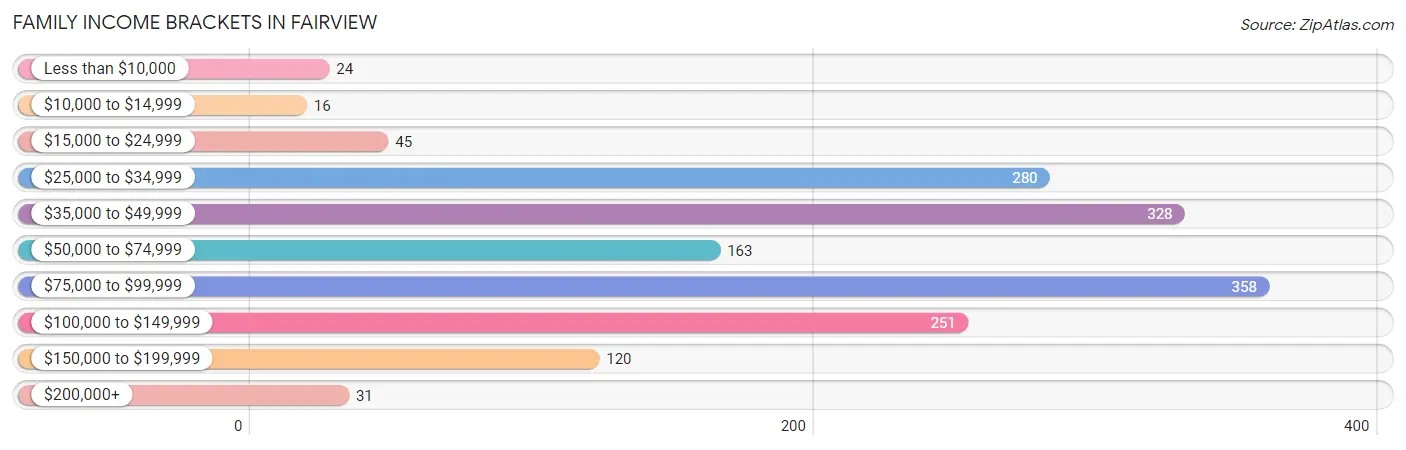
Family Income in Fairview
Family Income Brackets in Fairview
According to the Fairview family income data, there are 358 families falling into the $75,000 to $99,999 income range, which is the most common income bracket and makes up 22.1% of all families. Conversely, the $10,000 to $14,999 income bracket is the least frequent group with only 16 families (1.0%) belonging to this category.
| Income Bracket | # Families | % Families |
| Less than $10,000 | 24 | 1.5% |
| $10,000 to $14,999 | 16 | 1.0% |
| $15,000 to $24,999 | 45 | 2.8% |
| $25,000 to $34,999 | 280 | 17.3% |
| $35,000 to $49,999 | 328 | 20.3% |
| $50,000 to $74,999 | 163 | 10.1% |
| $75,000 to $99,999 | 358 | 22.1% |
| $100,000 to $149,999 | 251 | 15.5% |
| $150,000 to $199,999 | 120 | 7.4% |
| $200,000+ | 31 | 1.9% |
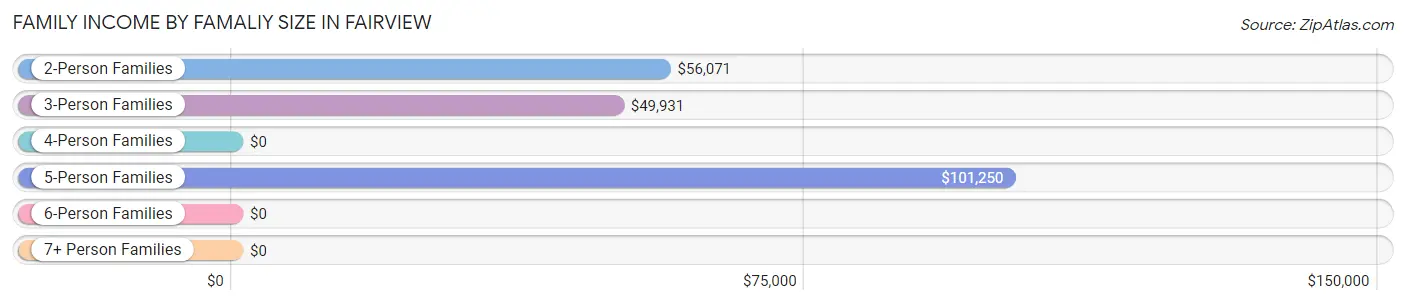
Family Income by Famaliy Size in Fairview
5-person families (74 | 4.6%) account for the highest median family income in Fairview with $101,250 per family, while 2-person families (848 | 52.4%) have the highest median income of $28,036 per family member.
| Income Bracket | # Families | Median Income |
| 2-Person Families | 848 (52.4%) | $56,071 |
| 3-Person Families | 455 (28.1%) | $49,931 |
| 4-Person Families | 156 (9.6%) | $0 |
| 5-Person Families | 74 (4.6%) | $101,250 |
| 6-Person Families | 53 (3.3%) | $0 |
| 7+ Person Families | 32 (2.0%) | $0 |
| Total | 1,618 (100.0%) | $58,333 |
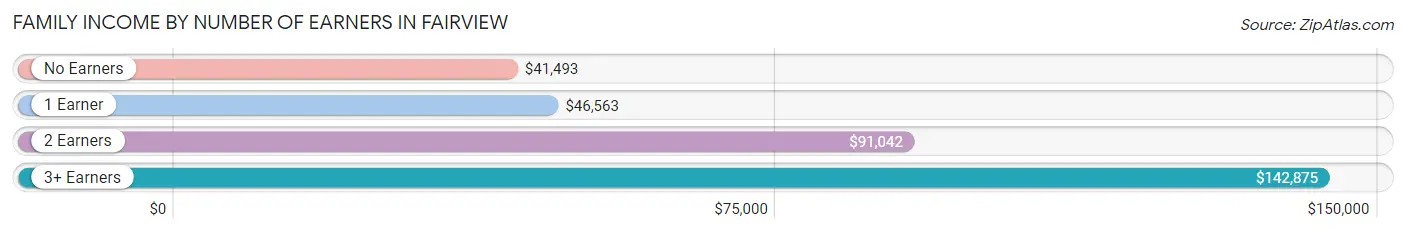
Family Income by Number of Earners in Fairview
The median family income in Fairview is $58,333, with families comprising 3+ earners (131) having the highest median family income of $142,875, while families with no earners (322) have the lowest median family income of $41,493, accounting for 8.1% and 19.9% of families, respectively.
| Number of Earners | # Families | Median Income |
| No Earners | 322 (19.9%) | $41,493 |
| 1 Earner | 667 (41.2%) | $46,563 |
| 2 Earners | 498 (30.8%) | $91,042 |
| 3+ Earners | 131 (8.1%) | $142,875 |
| Total | 1,618 (100.0%) | $58,333 |
Household Income in Fairview
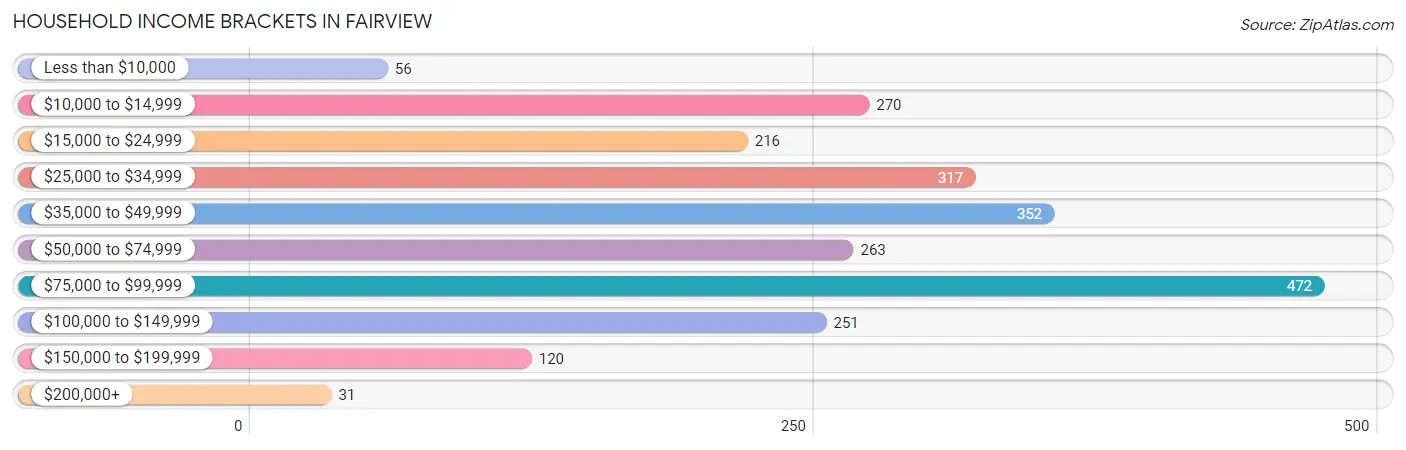
Household Income Brackets in Fairview
With 472 households falling in the category, the $75,000 to $99,999 income range is the most frequent in Fairview, accounting for 20.1% of all households. In contrast, only 31 households (1.3%) fall into the $200,000+ income bracket, making it the least populous group.
| Income Bracket | # Households | % Households |
| Less than $10,000 | 56 | 2.4% |
| $10,000 to $14,999 | 270 | 11.5% |
| $15,000 to $24,999 | 216 | 9.2% |
| $25,000 to $34,999 | 317 | 13.5% |
| $35,000 to $49,999 | 352 | 15.0% |
| $50,000 to $74,999 | 263 | 11.2% |
| $75,000 to $99,999 | 472 | 20.1% |
| $100,000 to $149,999 | 251 | 10.7% |
| $150,000 to $199,999 | 120 | 5.1% |
| $200,000+ | 31 | 1.3% |
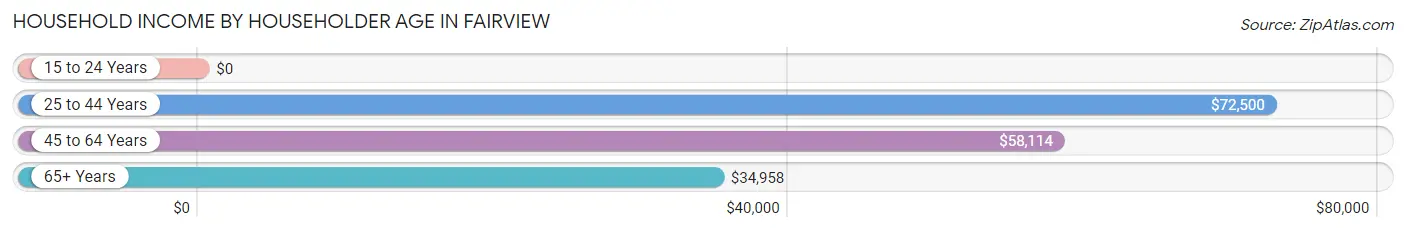
Household Income by Householder Age in Fairview
The median household income in Fairview is $48,902, with the highest median household income of $72,500 found in the 25 to 44 years age bracket for the primary householder. A total of 560 households (23.8%) fall into this category. Meanwhile, the 15 to 24 years age bracket for the primary householder has the lowest median household income of $0, with 35 households (1.5%) in this group.
| Income Bracket | # Households | Median Income |
| 15 to 24 Years | 35 (1.5%) | $0 |
| 25 to 44 Years | 560 (23.8%) | $72,500 |
| 45 to 64 Years | 870 (37.0%) | $58,114 |
| 65+ Years | 883 (37.6%) | $34,958 |
| Total | 2,348 (100.0%) | $48,902 |
Poverty in Fairview
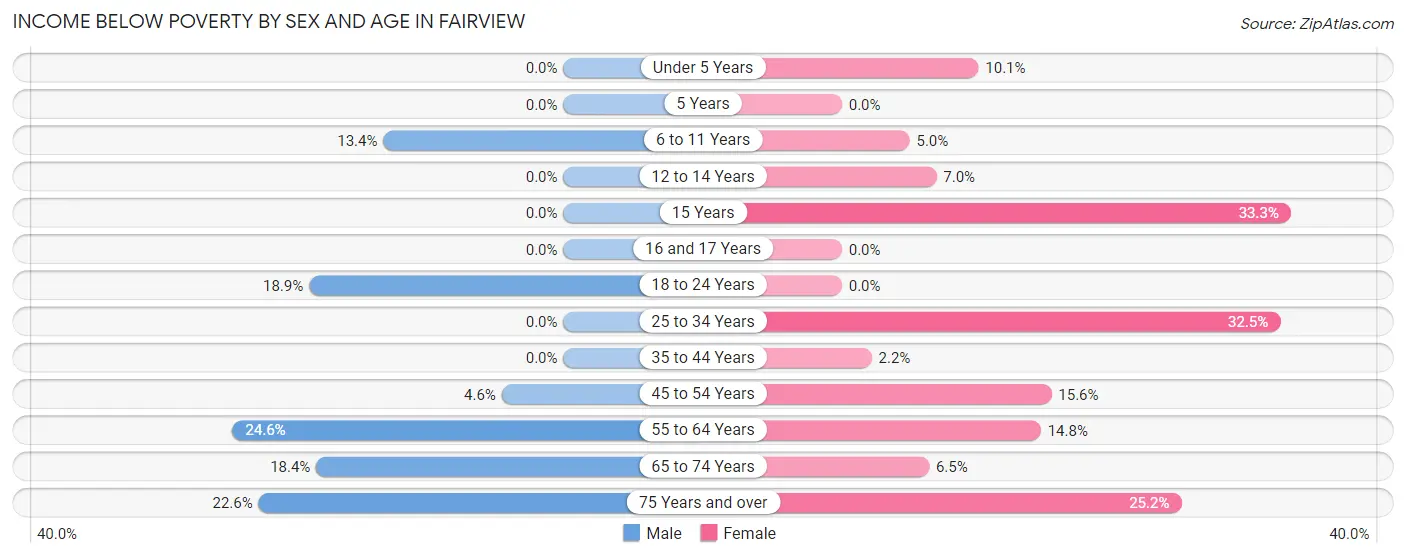
Income Below Poverty by Sex and Age in Fairview
With 11.4% poverty level for males and 14.0% for females among the residents of Fairview, 55 to 64 year old males and 15 year old females are the most vulnerable to poverty, with 114 males (24.6%) and 21 females (33.3%) in their respective age groups living below the poverty level.
| Age Bracket | Male | Female |
| Under 5 Years | 0 (0.0%) | 7 (10.1%) |
| 5 Years | 0 (0.0%) | 0 (0.0%) |
| 6 to 11 Years | 50 (13.4%) | 8 (5.0%) |
| 12 to 14 Years | 0 (0.0%) | 8 (7.0%) |
| 15 Years | 0 (0.0%) | 21 (33.3%) |
| 16 and 17 Years | 0 (0.0%) | 0 (0.0%) |
| 18 to 24 Years | 47 (18.9%) | 0 (0.0%) |
| 25 to 34 Years | 0 (0.0%) | 109 (32.5%) |
| 35 to 44 Years | 0 (0.0%) | 9 (2.2%) |
| 45 to 54 Years | 19 (4.6%) | 63 (15.6%) |
| 55 to 64 Years | 114 (24.6%) | 74 (14.8%) |
| 65 to 74 Years | 20 (18.3%) | 31 (6.5%) |
| 75 Years and over | 55 (22.6%) | 95 (25.2%) |
| Total | 305 (11.4%) | 425 (14.0%) |
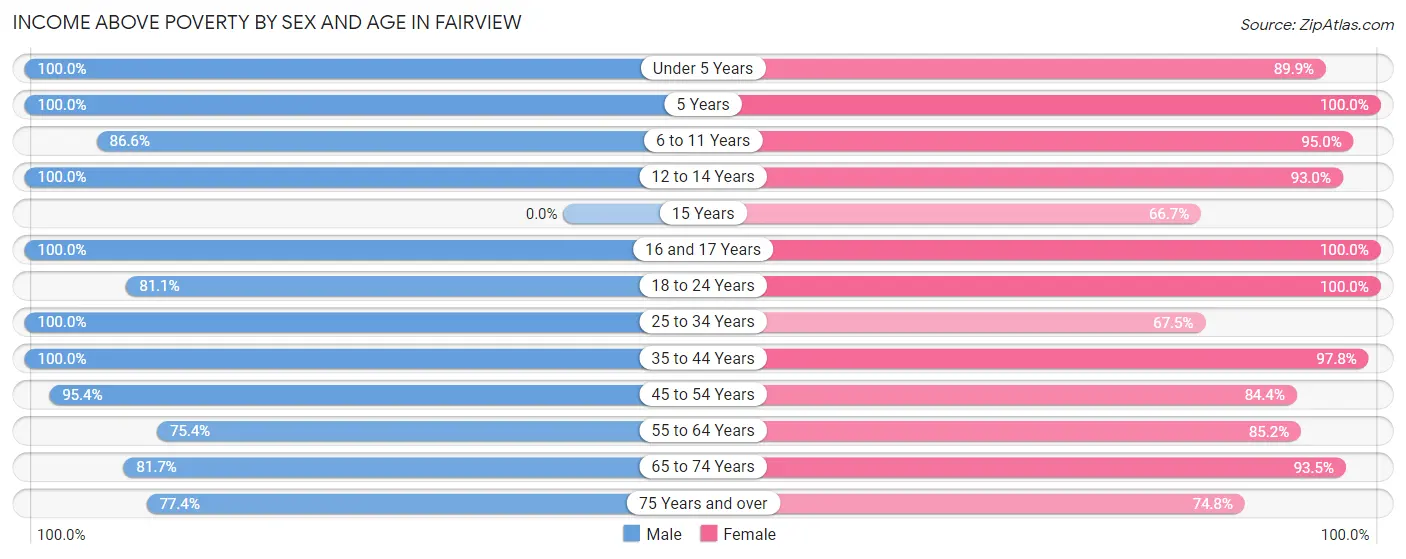
Income Above Poverty by Sex and Age in Fairview
According to the poverty statistics in Fairview, males aged under 5 years and females aged 5 years are the age groups that are most secure financially, with 100.0% of males and 100.0% of females in these age groups living above the poverty line.
| Age Bracket | Male | Female |
| Under 5 Years | 76 (100.0%) | 62 (89.9%) |
| 5 Years | 26 (100.0%) | 14 (100.0%) |
| 6 to 11 Years | 324 (86.6%) | 151 (95.0%) |
| 12 to 14 Years | 89 (100.0%) | 106 (93.0%) |
| 15 Years | 0 (0.0%) | 42 (66.7%) |
| 16 and 17 Years | 135 (100.0%) | 47 (100.0%) |
| 18 to 24 Years | 202 (81.1%) | 77 (100.0%) |
| 25 to 34 Years | 198 (100.0%) | 226 (67.5%) |
| 35 to 44 Years | 293 (100.0%) | 398 (97.8%) |
| 45 to 54 Years | 396 (95.4%) | 342 (84.4%) |
| 55 to 64 Years | 350 (75.4%) | 427 (85.2%) |
| 65 to 74 Years | 89 (81.7%) | 448 (93.5%) |
| 75 Years and over | 188 (77.4%) | 282 (74.8%) |
| Total | 2,366 (88.6%) | 2,622 (86.1%) |
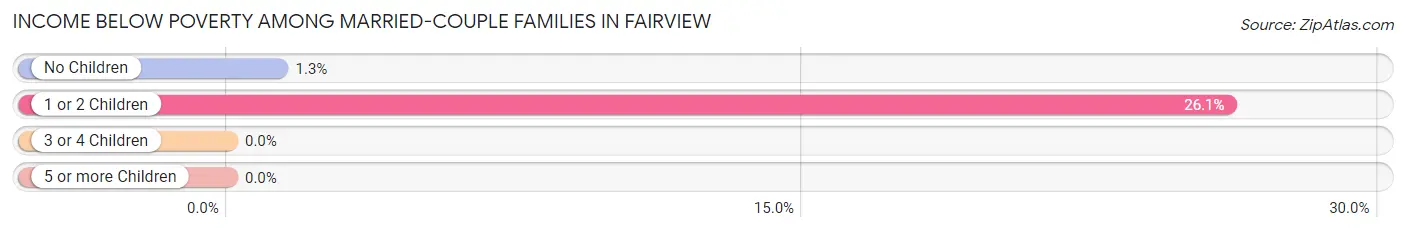
Income Below Poverty Among Married-Couple Families in Fairview
The poverty statistics for married-couple families in Fairview show that 6.9% or 70 of the total 1,008 families live below the poverty line. Families with 1 or 2 children have the highest poverty rate of 26.1%, comprising of 61 families. On the other hand, families with 3 or 4 children have the lowest poverty rate of 0.0%, which includes 0 families.
| Children | Above Poverty | Below Poverty |
| No Children | 673 (98.7%) | 9 (1.3%) |
| 1 or 2 Children | 173 (73.9%) | 61 (26.1%) |
| 3 or 4 Children | 92 (100.0%) | 0 (0.0%) |
| 5 or more Children | 0 (0.0%) | 0 (0.0%) |
| Total | 938 (93.1%) | 70 (6.9%) |
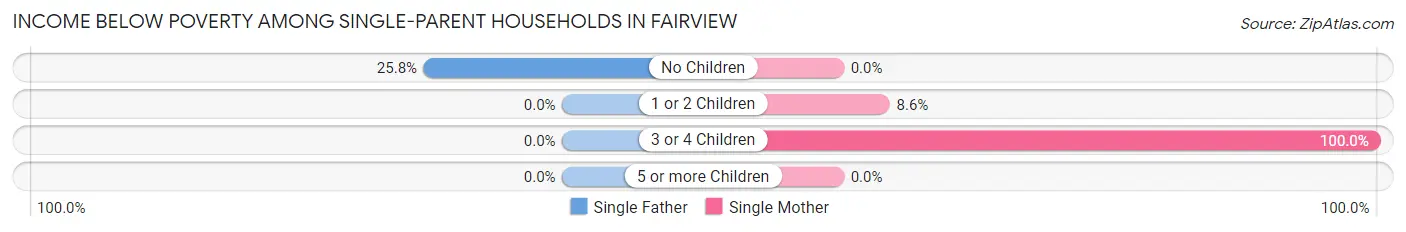
Income Below Poverty Among Single-Parent Households in Fairview
According to the poverty data in Fairview, 6.2% or 8 single-father households and 4.8% or 23 single-mother households are living below the poverty line. Among single-father households, those with no children have the highest poverty rate, with 8 households (25.8%) experiencing poverty. Likewise, among single-mother households, those with 3 or 4 children have the highest poverty rate, with 7 households (100.0%) falling below the poverty line.
| Children | Single Father | Single Mother |
| No Children | 8 (25.8%) | 0 (0.0%) |
| 1 or 2 Children | 0 (0.0%) | 16 (8.6%) |
| 3 or 4 Children | 0 (0.0%) | 7 (100.0%) |
| 5 or more Children | 0 (0.0%) | 0 (0.0%) |
| Total | 8 (6.2%) | 23 (4.8%) |
Income Below Poverty Among Married-Couple vs Single-Parent Households in Fairview
The poverty data for Fairview shows that 70 of the married-couple family households (6.9%) and 31 of the single-parent households (5.1%) are living below the poverty level. Within the married-couple family households, those with 1 or 2 children have the highest poverty rate, with 61 households (26.1%) falling below the poverty line. Among the single-parent households, those with 3 or 4 children have the highest poverty rate, with 7 household (100.0%) living below poverty.
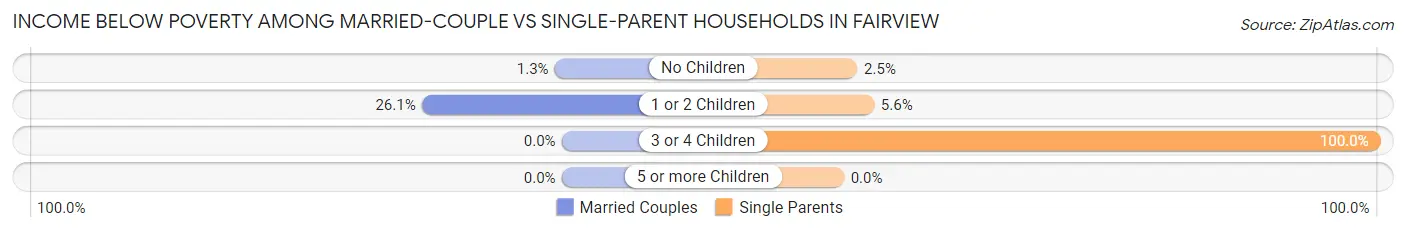
| Children | Married-Couple Families | Single-Parent Households |
| No Children | 9 (1.3%) | 8 (2.5%) |
| 1 or 2 Children | 61 (26.1%) | 16 (5.6%) |
| 3 or 4 Children | 0 (0.0%) | 7 (100.0%) |
| 5 or more Children | 0 (0.0%) | 0 (0.0%) |
| Total | 70 (6.9%) | 31 (5.1%) |
Employment Characteristics in Fairview
Employment by Class of Employer in Fairview
Among the 2,355 employed individuals in Fairview, private company employees (1,816 | 77.1%), local government employees (199 | 8.5%), and not-for-profit organizations (114 | 4.8%) make up the most common classes of employment.
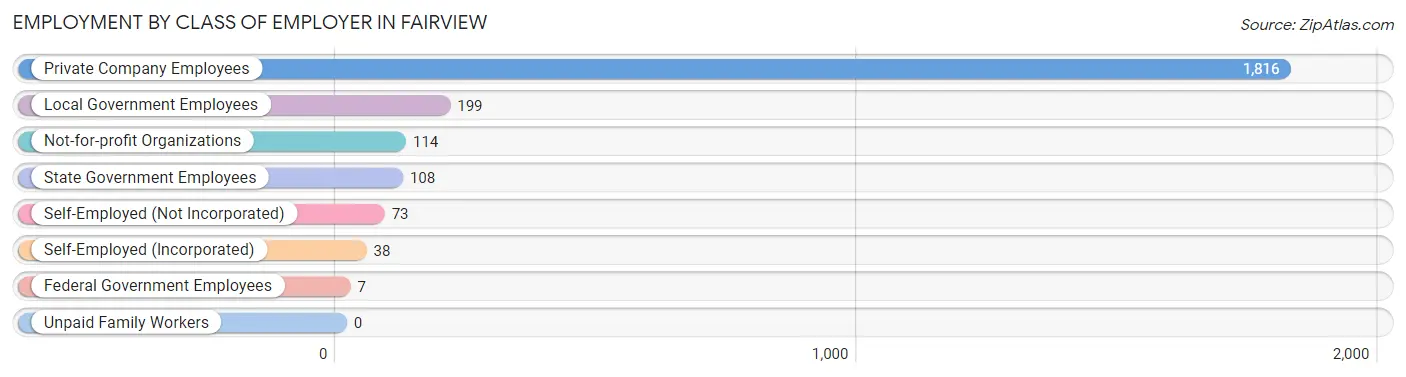
| Employer Class | # Employees | % Employees |
| Private Company Employees | 1,816 | 77.1% |
| Self-Employed (Incorporated) | 38 | 1.6% |
| Self-Employed (Not Incorporated) | 73 | 3.1% |
| Not-for-profit Organizations | 114 | 4.8% |
| Local Government Employees | 199 | 8.5% |
| State Government Employees | 108 | 4.6% |
| Federal Government Employees | 7 | 0.3% |
| Unpaid Family Workers | 0 | 0.0% |
| Total | 2,355 | 100.0% |
Employment Status by Age in Fairview
According to the labor force statistics for Fairview, out of the total population over 16 years of age (4,734), 51.5% or 2,438 individuals are in the labor force, with 3.0% or 73 of them unemployed. The age group with the highest labor force participation rate is 35 to 44 years, with 84.9% or 594 individuals in the labor force. Within the labor force, the 16 to 19 years age range has the highest percentage of unemployed individuals, with 33.8% or 24 of them being unemployed.
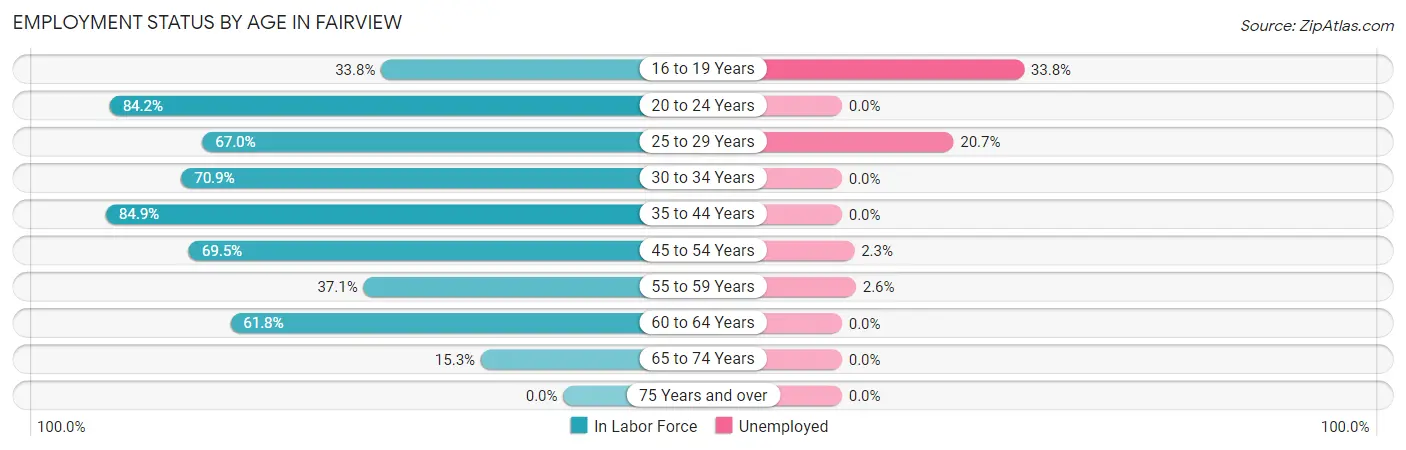
| Age Bracket | In Labor Force | Unemployed |
| 16 to 19 Years | 71 (33.8%) | 24 (33.8%) |
| 20 to 24 Years | 251 (84.2%) | 0 (0.0%) |
| 25 to 29 Years | 150 (67.0%) | 31 (20.7%) |
| 30 to 34 Years | 219 (70.9%) | 0 (0.0%) |
| 35 to 44 Years | 594 (84.9%) | 0 (0.0%) |
| 45 to 54 Years | 570 (69.5%) | 13 (2.3%) |
| 55 to 59 Years | 153 (37.1%) | 4 (2.6%) |
| 60 to 64 Years | 342 (61.8%) | 0 (0.0%) |
| 65 to 74 Years | 90 (15.3%) | 0 (0.0%) |
| 75 Years and over | 0 (0.0%) | 0 (0.0%) |
| Total | 2,438 (51.5%) | 73 (3.0%) |
Employment Status by Educational Attainment in Fairview
According to labor force statistics for Fairview, 67.2% of individuals (2,028) out of the total population between 25 and 64 years of age (3,018) are in the labor force, with 2.4% or 49 of them being unemployed. The group with the highest labor force participation rate are those with the educational attainment of college / associate degree, with 80.5% or 674 individuals in the labor force. Within the labor force, individuals with less than high school education have the highest percentage of unemployment, with 11.0% or 31 of them being unemployed.
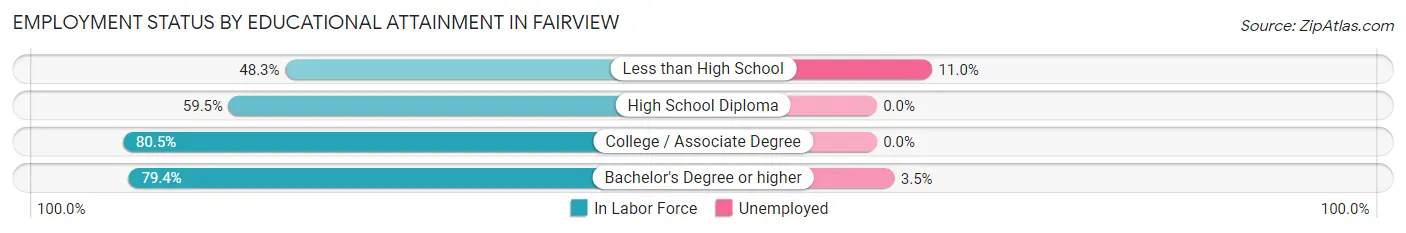
| Educational Attainment | In Labor Force | Unemployed |
| Less than High School | 282 (48.3%) | 64 (11.0%) |
| High School Diploma | 587 (59.5%) | 0 (0.0%) |
| College / Associate Degree | 674 (80.5%) | 0 (0.0%) |
| Bachelor's Degree or higher | 485 (79.4%) | 21 (3.5%) |
| Total | 2,028 (67.2%) | 72 (2.4%) |
Employment Occupations by Sex in Fairview
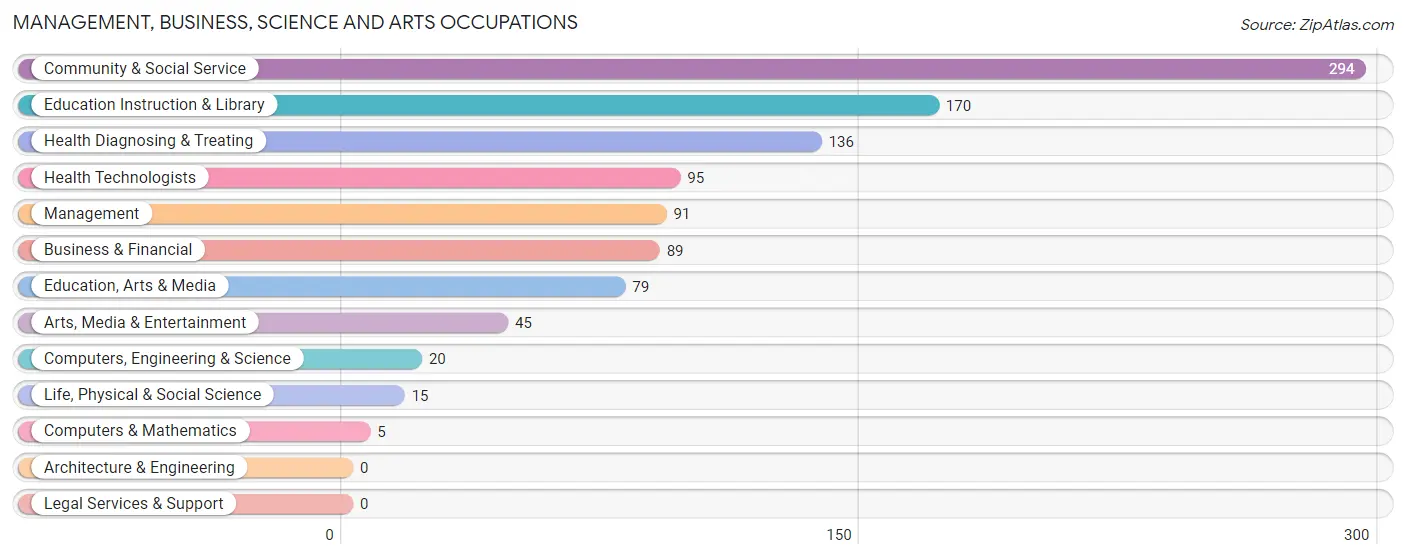
Management, Business, Science and Arts Occupations
The most common Management, Business, Science and Arts occupations in Fairview are Community & Social Service (294 | 12.4%), Education Instruction & Library (170 | 7.2%), Health Diagnosing & Treating (136 | 5.7%), Health Technologists (95 | 4.0%), and Management (91 | 3.8%).
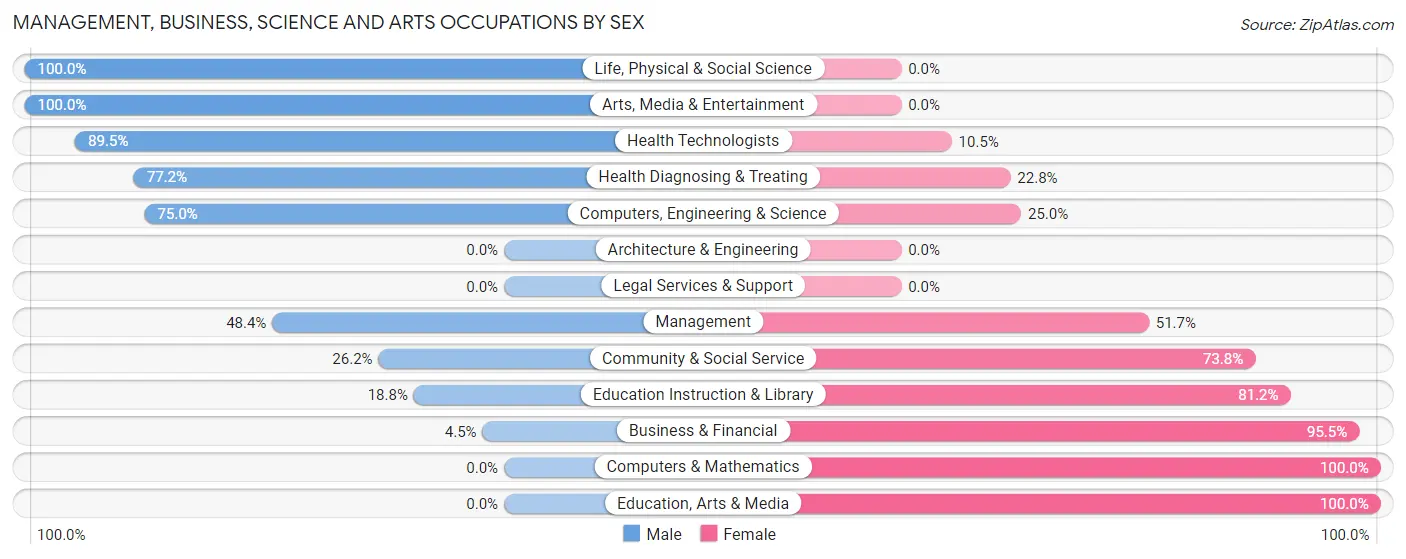
Management, Business, Science and Arts Occupations by Sex
Within the Management, Business, Science and Arts occupations in Fairview, the most male-oriented occupations are Life, Physical & Social Science (100.0%), Arts, Media & Entertainment (100.0%), and Health Technologists (89.5%), while the most female-oriented occupations are Computers & Mathematics (100.0%), Education, Arts & Media (100.0%), and Business & Financial (95.5%).
| Occupation | Male | Female |
| Management | 44 (48.3%) | 47 (51.6%) |
| Business & Financial | 4 (4.5%) | 85 (95.5%) |
| Computers, Engineering & Science | 15 (75.0%) | 5 (25.0%) |
| Computers & Mathematics | 0 (0.0%) | 5 (100.0%) |
| Architecture & Engineering | 0 (0.0%) | 0 (0.0%) |
| Life, Physical & Social Science | 15 (100.0%) | 0 (0.0%) |
| Community & Social Service | 77 (26.2%) | 217 (73.8%) |
| Education, Arts & Media | 0 (0.0%) | 79 (100.0%) |
| Legal Services & Support | 0 (0.0%) | 0 (0.0%) |
| Education Instruction & Library | 32 (18.8%) | 138 (81.2%) |
| Arts, Media & Entertainment | 45 (100.0%) | 0 (0.0%) |
| Health Diagnosing & Treating | 105 (77.2%) | 31 (22.8%) |
| Health Technologists | 85 (89.5%) | 10 (10.5%) |
| Total (Category) | 245 (38.9%) | 385 (61.1%) |
| Total (Overall) | 1,158 (48.9%) | 1,210 (51.1%) |
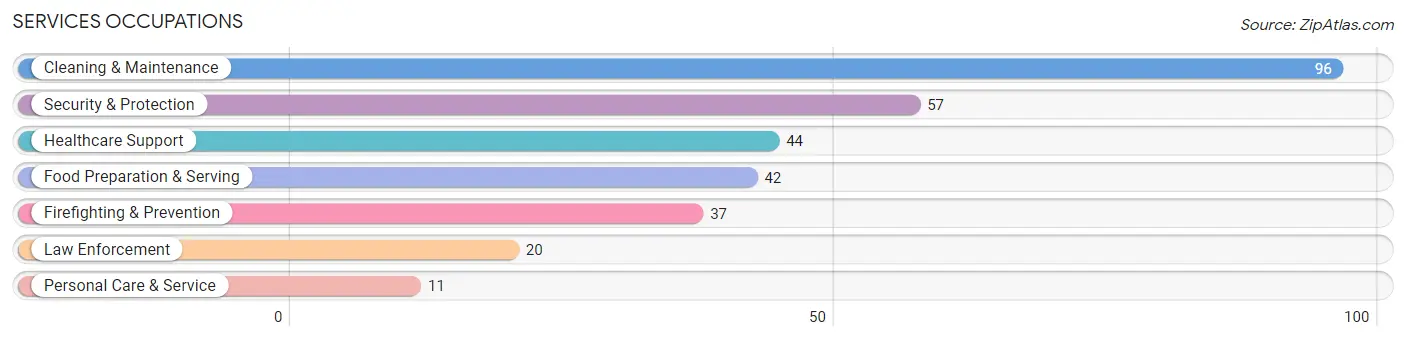
Services Occupations
The most common Services occupations in Fairview are Cleaning & Maintenance (96 | 4.1%), Security & Protection (57 | 2.4%), Healthcare Support (44 | 1.9%), Food Preparation & Serving (42 | 1.8%), and Firefighting & Prevention (37 | 1.6%).
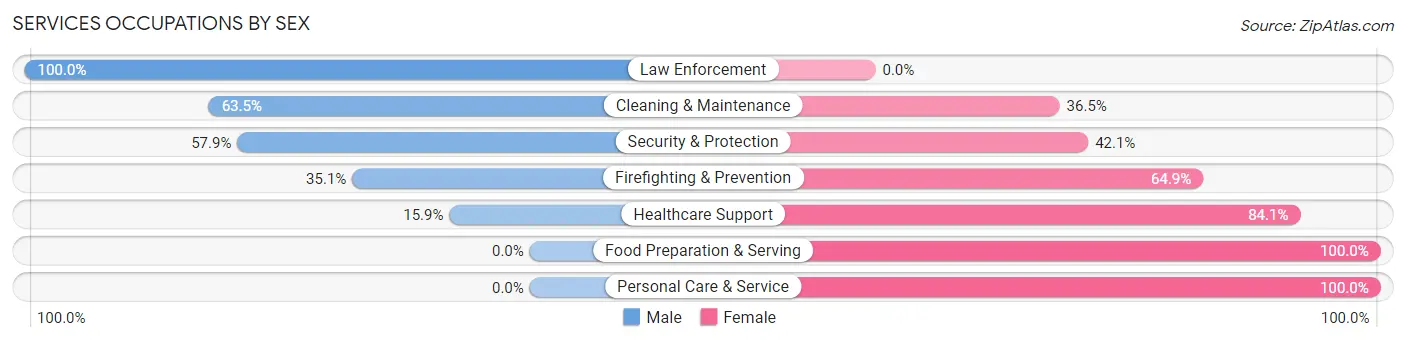
Services Occupations by Sex
Within the Services occupations in Fairview, the most male-oriented occupations are Law Enforcement (100.0%), Cleaning & Maintenance (63.5%), and Security & Protection (57.9%), while the most female-oriented occupations are Food Preparation & Serving (100.0%), Personal Care & Service (100.0%), and Healthcare Support (84.1%).
| Occupation | Male | Female |
| Healthcare Support | 7 (15.9%) | 37 (84.1%) |
| Security & Protection | 33 (57.9%) | 24 (42.1%) |
| Firefighting & Prevention | 13 (35.1%) | 24 (64.9%) |
| Law Enforcement | 20 (100.0%) | 0 (0.0%) |
| Food Preparation & Serving | 0 (0.0%) | 42 (100.0%) |
| Cleaning & Maintenance | 61 (63.5%) | 35 (36.5%) |
| Personal Care & Service | 0 (0.0%) | 11 (100.0%) |
| Total (Category) | 101 (40.4%) | 149 (59.6%) |
| Total (Overall) | 1,158 (48.9%) | 1,210 (51.1%) |
Sales and Office Occupations
The most common Sales and Office occupations in Fairview are Office & Administration (376 | 15.9%), and Sales & Related (274 | 11.6%).

Sales and Office Occupations by Sex
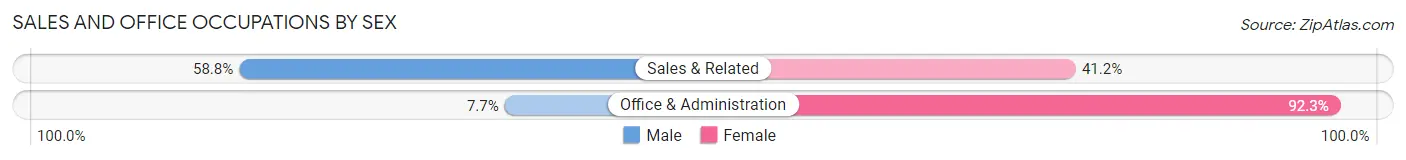
| Occupation | Male | Female |
| Sales & Related | 161 (58.8%) | 113 (41.2%) |
| Office & Administration | 29 (7.7%) | 347 (92.3%) |
| Total (Category) | 190 (29.2%) | 460 (70.8%) |
| Total (Overall) | 1,158 (48.9%) | 1,210 (51.1%) |
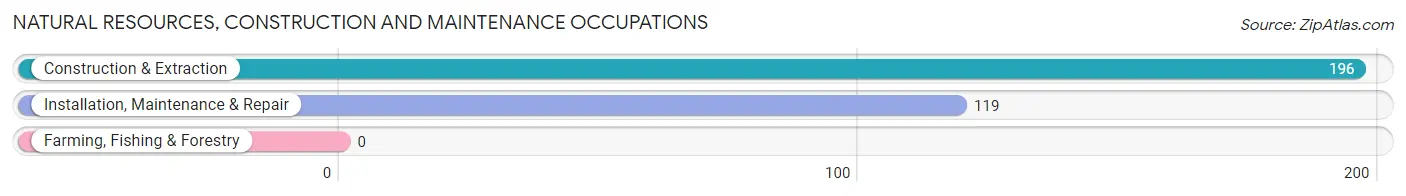
Natural Resources, Construction and Maintenance Occupations
The most common Natural Resources, Construction and Maintenance occupations in Fairview are Construction & Extraction (196 | 8.3%), and Installation, Maintenance & Repair (119 | 5.0%).
Natural Resources, Construction and Maintenance Occupations by Sex
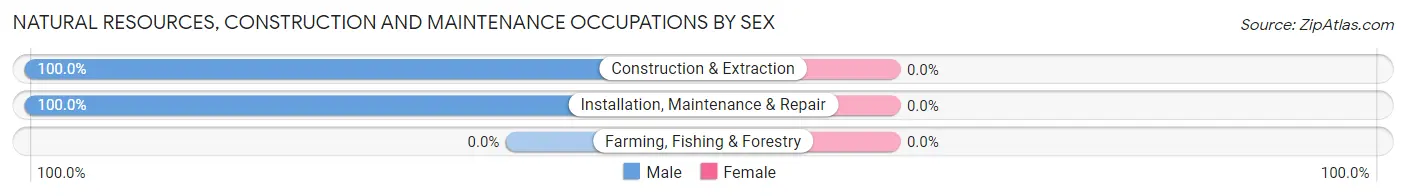
| Occupation | Male | Female |
| Farming, Fishing & Forestry | 0 (0.0%) | 0 (0.0%) |
| Construction & Extraction | 196 (100.0%) | 0 (0.0%) |
| Installation, Maintenance & Repair | 119 (100.0%) | 0 (0.0%) |
| Total (Category) | 315 (100.0%) | 0 (0.0%) |
| Total (Overall) | 1,158 (48.9%) | 1,210 (51.1%) |
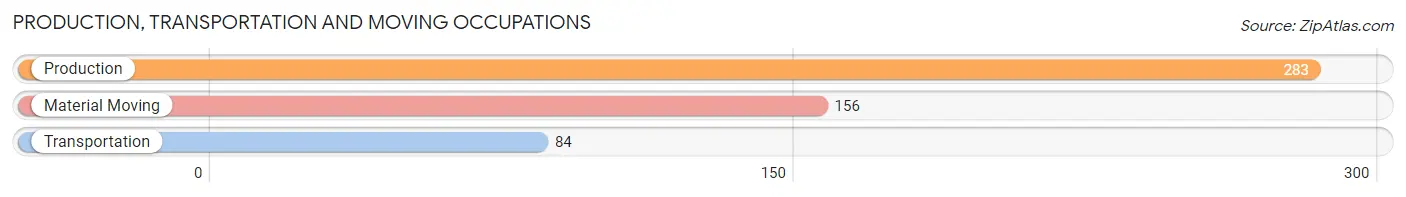
Production, Transportation and Moving Occupations
The most common Production, Transportation and Moving occupations in Fairview are Production (283 | 11.9%), Material Moving (156 | 6.6%), and Transportation (84 | 3.5%).
Production, Transportation and Moving Occupations by Sex
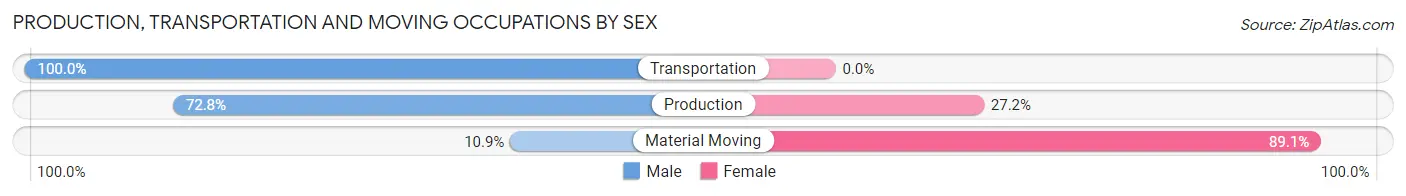
| Occupation | Male | Female |
| Production | 206 (72.8%) | 77 (27.2%) |
| Transportation | 84 (100.0%) | 0 (0.0%) |
| Material Moving | 17 (10.9%) | 139 (89.1%) |
| Total (Category) | 307 (58.7%) | 216 (41.3%) |
| Total (Overall) | 1,158 (48.9%) | 1,210 (51.1%) |
Employment Industries by Sex in Fairview
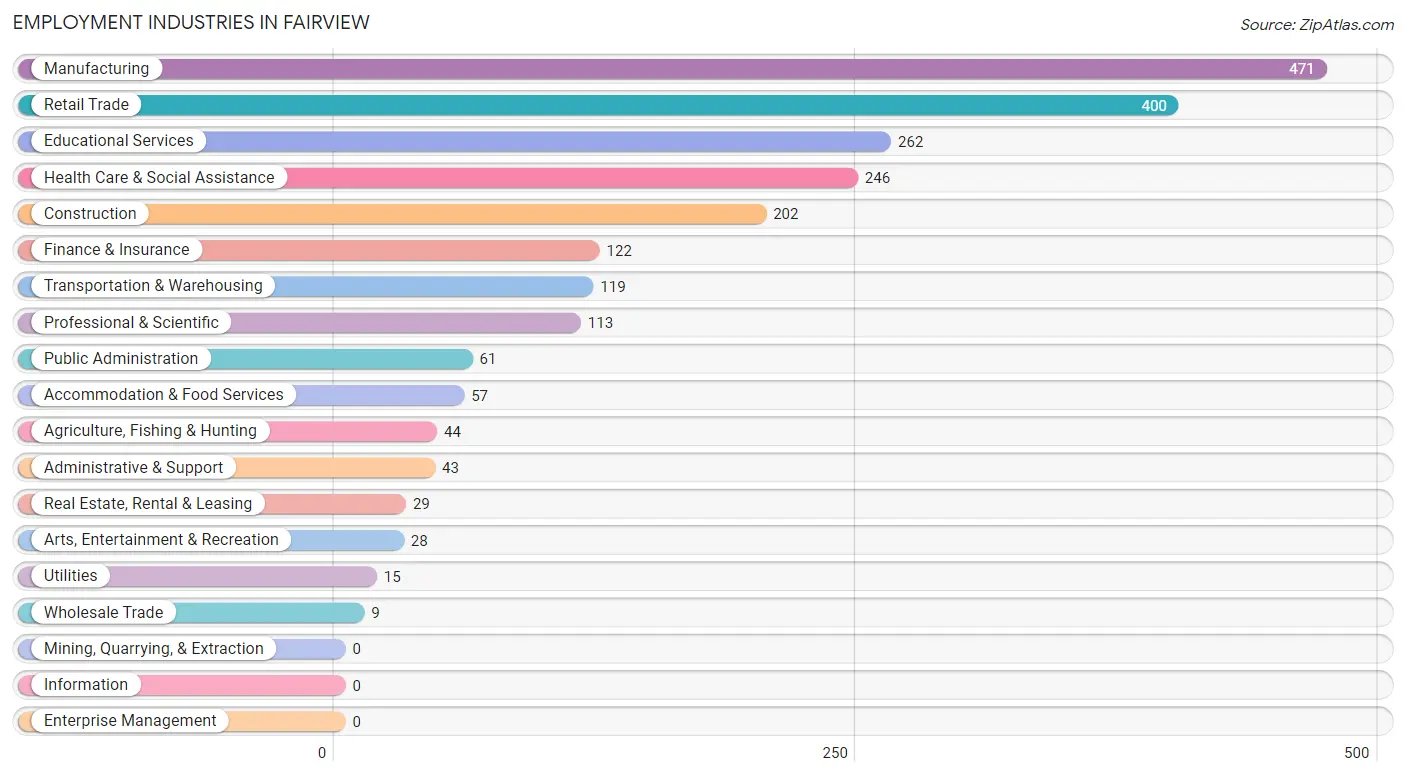
Employment Industries in Fairview
The major employment industries in Fairview include Manufacturing (471 | 19.9%), Retail Trade (400 | 16.9%), Educational Services (262 | 11.1%), Health Care & Social Assistance (246 | 10.4%), and Construction (202 | 8.5%).
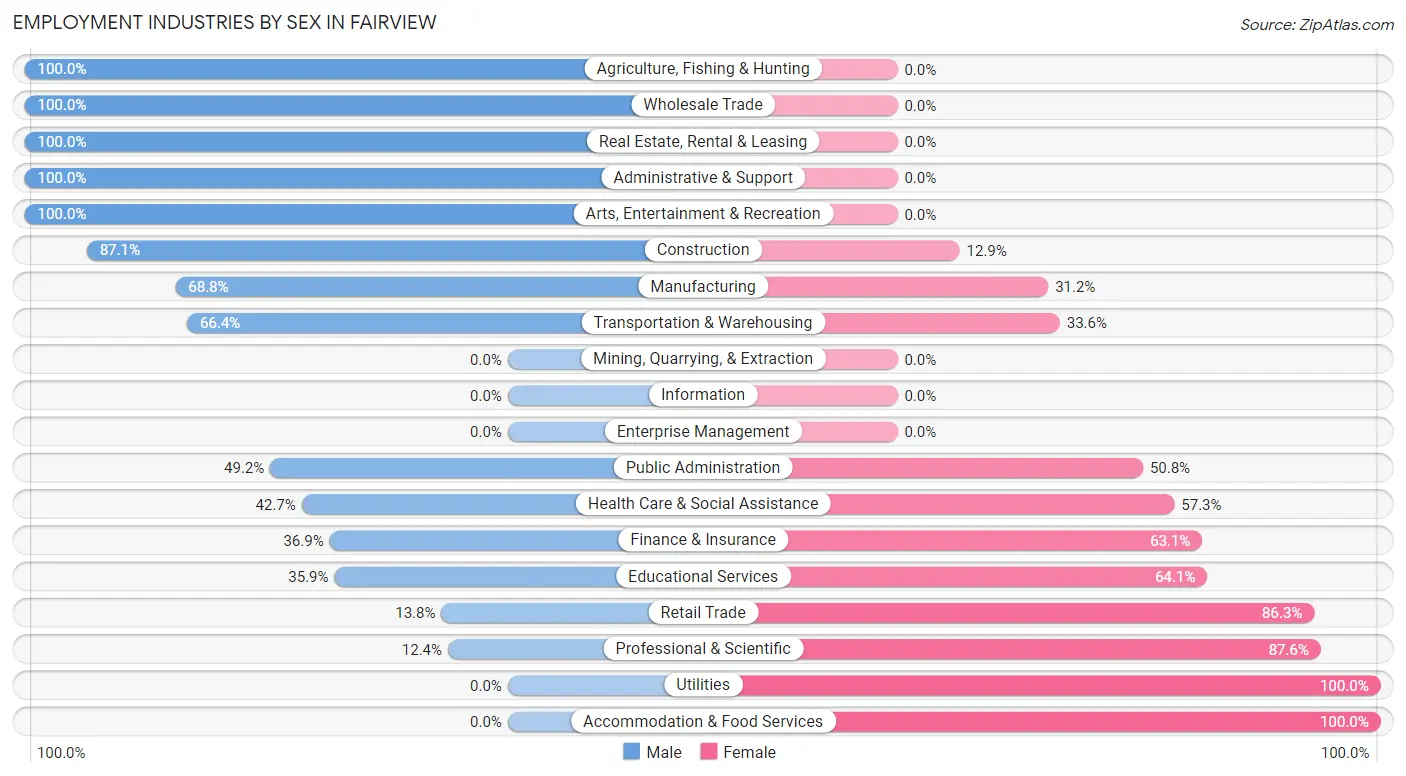
Employment Industries by Sex in Fairview
The Fairview industries that see more men than women are Agriculture, Fishing & Hunting (100.0%), Wholesale Trade (100.0%), and Real Estate, Rental & Leasing (100.0%), whereas the industries that tend to have a higher number of women are Utilities (100.0%), Accommodation & Food Services (100.0%), and Professional & Scientific (87.6%).
| Industry | Male | Female |
| Agriculture, Fishing & Hunting | 44 (100.0%) | 0 (0.0%) |
| Mining, Quarrying, & Extraction | 0 (0.0%) | 0 (0.0%) |
| Construction | 176 (87.1%) | 26 (12.9%) |
| Manufacturing | 324 (68.8%) | 147 (31.2%) |
| Wholesale Trade | 9 (100.0%) | 0 (0.0%) |
| Retail Trade | 55 (13.8%) | 345 (86.3%) |
| Transportation & Warehousing | 79 (66.4%) | 40 (33.6%) |
| Utilities | 0 (0.0%) | 15 (100.0%) |
| Information | 0 (0.0%) | 0 (0.0%) |
| Finance & Insurance | 45 (36.9%) | 77 (63.1%) |
| Real Estate, Rental & Leasing | 29 (100.0%) | 0 (0.0%) |
| Professional & Scientific | 14 (12.4%) | 99 (87.6%) |
| Enterprise Management | 0 (0.0%) | 0 (0.0%) |
| Administrative & Support | 43 (100.0%) | 0 (0.0%) |
| Educational Services | 94 (35.9%) | 168 (64.1%) |
| Health Care & Social Assistance | 105 (42.7%) | 141 (57.3%) |
| Arts, Entertainment & Recreation | 28 (100.0%) | 0 (0.0%) |
| Accommodation & Food Services | 0 (0.0%) | 57 (100.0%) |
| Public Administration | 30 (49.2%) | 31 (50.8%) |
| Total | 1,158 (48.9%) | 1,210 (51.1%) |
Education in Fairview
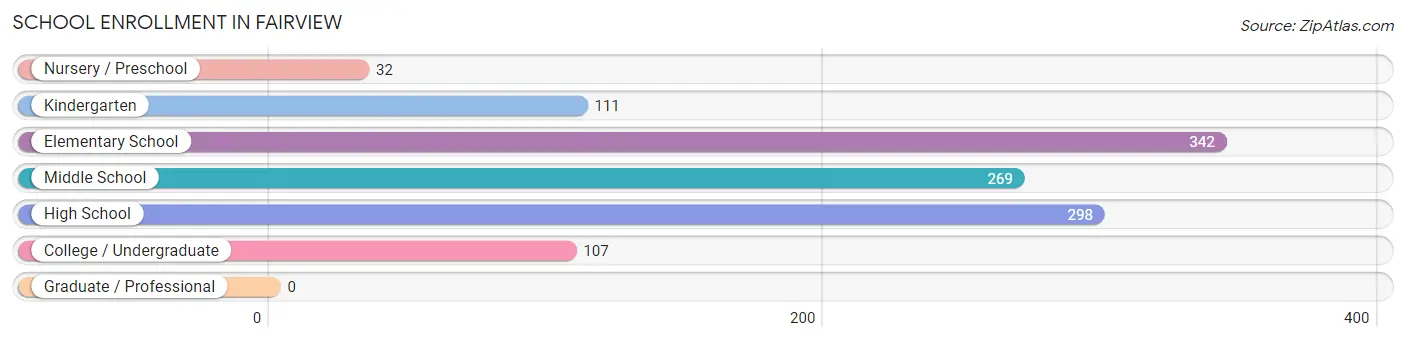
School Enrollment in Fairview
The most common levels of schooling among the 1,159 students in Fairview are elementary school (342 | 29.5%), high school (298 | 25.7%), and middle school (269 | 23.2%).
| School Level | # Students | % Students |
| Nursery / Preschool | 32 | 2.8% |
| Kindergarten | 111 | 9.6% |
| Elementary School | 342 | 29.5% |
| Middle School | 269 | 23.2% |
| High School | 298 | 25.7% |
| College / Undergraduate | 107 | 9.2% |
| Graduate / Professional | 0 | 0.0% |
| Total | 1,159 | 100.0% |
School Enrollment by Age by Funding Source in Fairview
Out of a total of 1,159 students who are enrolled in schools in Fairview, 61 (5.3%) attend a private institution, while the remaining 1,098 (94.7%) are enrolled in public schools. The age group of 15 to 17 year olds has the highest likelihood of being enrolled in private schools, with 33 (13.5% in the age bracket) enrolled. Conversely, the age group of 3 to 4 year olds has the lowest likelihood of being enrolled in a private school, with 32 (100.0% in the age bracket) attending a public institution.
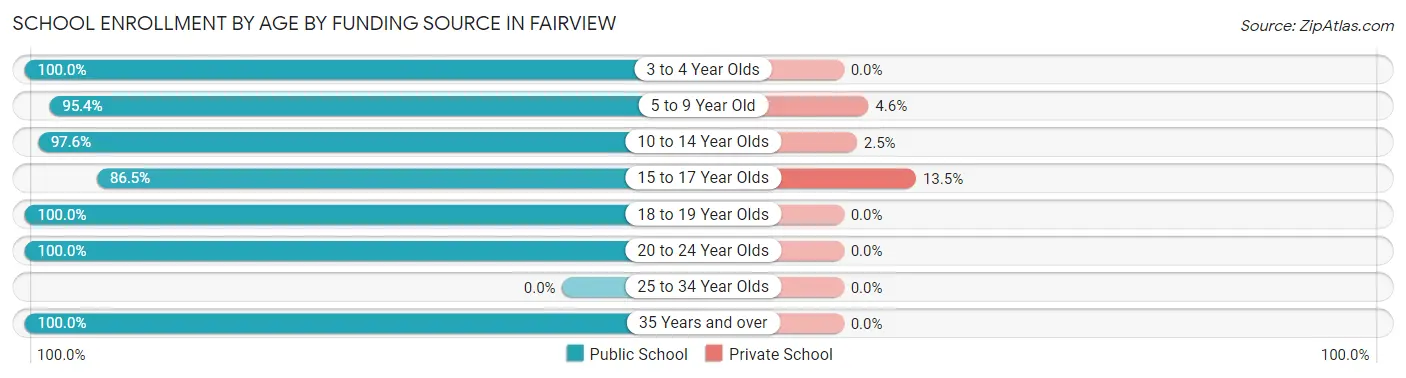
| Age Bracket | Public School | Private School |
| 3 to 4 Year Olds | 32 (100.0%) | 0 (0.0%) |
| 5 to 9 Year Old | 414 (95.4%) | 20 (4.6%) |
| 10 to 14 Year Olds | 318 (97.6%) | 8 (2.5%) |
| 15 to 17 Year Olds | 212 (86.5%) | 33 (13.5%) |
| 18 to 19 Year Olds | 4 (100.0%) | 0 (0.0%) |
| 20 to 24 Year Olds | 83 (100.0%) | 0 (0.0%) |
| 25 to 34 Year Olds | 0 (0.0%) | 0 (0.0%) |
| 35 Years and over | 35 (100.0%) | 0 (0.0%) |
| Total | 1,098 (94.7%) | 61 (5.3%) |
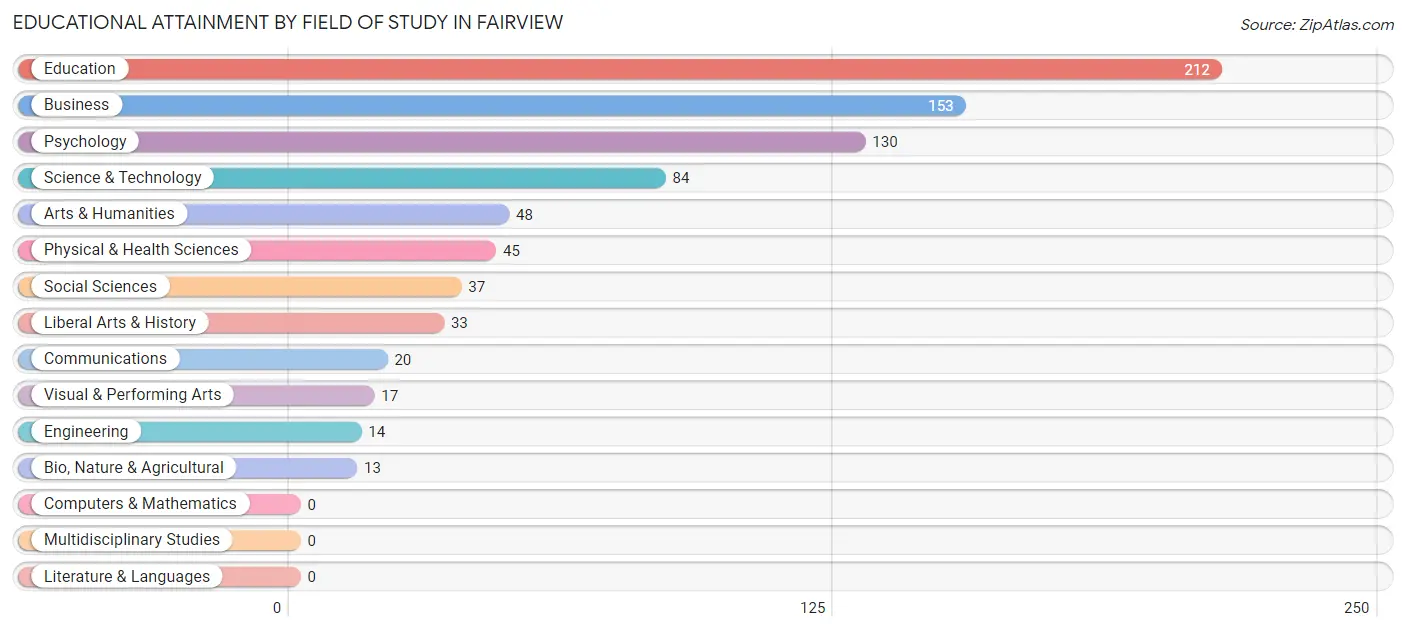
Educational Attainment by Field of Study in Fairview
Education (212 | 26.3%), business (153 | 19.0%), psychology (130 | 16.1%), science & technology (84 | 10.4%), and arts & humanities (48 | 6.0%) are the most common fields of study among 806 individuals in Fairview who have obtained a bachelor's degree or higher.
| Field of Study | # Graduates | % Graduates |
| Computers & Mathematics | 0 | 0.0% |
| Bio, Nature & Agricultural | 13 | 1.6% |
| Physical & Health Sciences | 45 | 5.6% |
| Psychology | 130 | 16.1% |
| Social Sciences | 37 | 4.6% |
| Engineering | 14 | 1.7% |
| Multidisciplinary Studies | 0 | 0.0% |
| Science & Technology | 84 | 10.4% |
| Business | 153 | 19.0% |
| Education | 212 | 26.3% |
| Literature & Languages | 0 | 0.0% |
| Liberal Arts & History | 33 | 4.1% |
| Visual & Performing Arts | 17 | 2.1% |
| Communications | 20 | 2.5% |
| Arts & Humanities | 48 | 6.0% |
| Total | 806 | 100.0% |
Transportation & Commute in Fairview
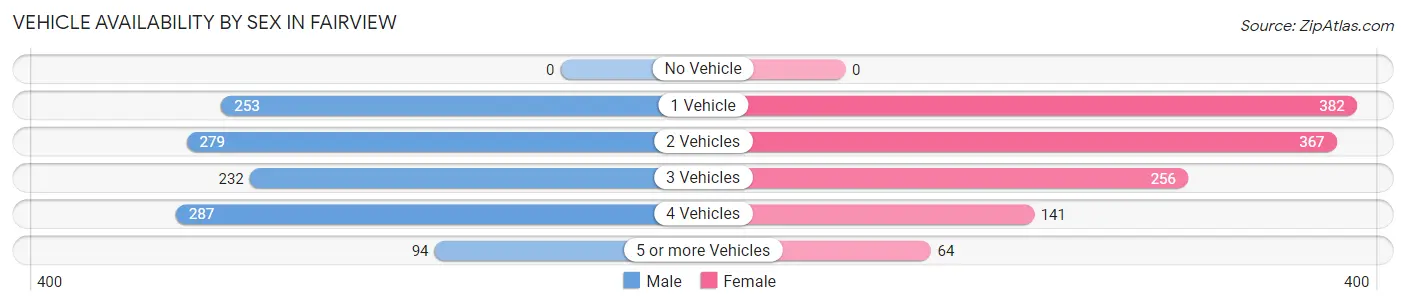
Vehicle Availability by Sex in Fairview
The most prevalent vehicle ownership categories in Fairview are males with 4 vehicles (287, accounting for 25.1%) and females with 4 vehicles (141, making up 23.7%).
| Vehicles Available | Male | Female |
| No Vehicle | 0 (0.0%) | 0 (0.0%) |
| 1 Vehicle | 253 (22.1%) | 382 (31.6%) |
| 2 Vehicles | 279 (24.4%) | 367 (30.3%) |
| 3 Vehicles | 232 (20.3%) | 256 (21.2%) |
| 4 Vehicles | 287 (25.1%) | 141 (11.7%) |
| 5 or more Vehicles | 94 (8.2%) | 64 (5.3%) |
| Total | 1,145 (100.0%) | 1,210 (100.0%) |
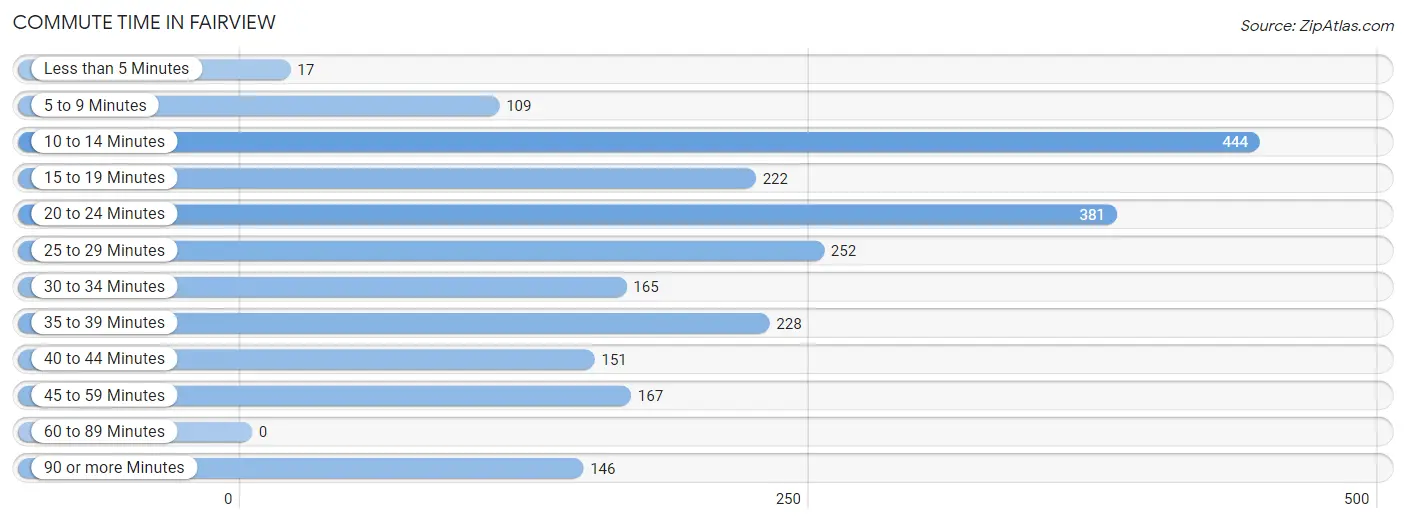
Commute Time in Fairview
The most frequently occuring commute durations in Fairview are 10 to 14 minutes (444 commuters, 19.5%), 20 to 24 minutes (381 commuters, 16.7%), and 25 to 29 minutes (252 commuters, 11.0%).
| Commute Time | # Commuters | % Commuters |
| Less than 5 Minutes | 17 | 0.7% |
| 5 to 9 Minutes | 109 | 4.8% |
| 10 to 14 Minutes | 444 | 19.5% |
| 15 to 19 Minutes | 222 | 9.7% |
| 20 to 24 Minutes | 381 | 16.7% |
| 25 to 29 Minutes | 252 | 11.0% |
| 30 to 34 Minutes | 165 | 7.2% |
| 35 to 39 Minutes | 228 | 10.0% |
| 40 to 44 Minutes | 151 | 6.6% |
| 45 to 59 Minutes | 167 | 7.3% |
| 60 to 89 Minutes | 0 | 0.0% |
| 90 or more Minutes | 146 | 6.4% |
Commute Time by Sex in Fairview
The most common commute times in Fairview are 20 to 24 minutes (222 commuters, 19.9%) for males and 10 to 14 minutes (269 commuters, 23.1%) for females.
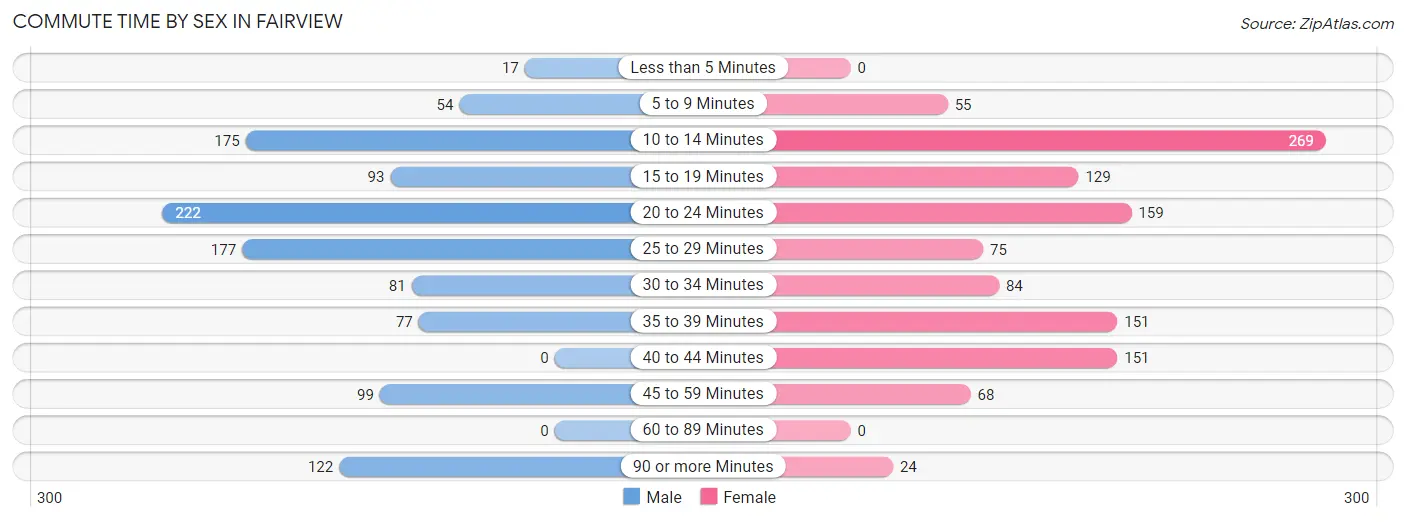
| Commute Time | Male | Female |
| Less than 5 Minutes | 17 (1.5%) | 0 (0.0%) |
| 5 to 9 Minutes | 54 (4.8%) | 55 (4.7%) |
| 10 to 14 Minutes | 175 (15.7%) | 269 (23.1%) |
| 15 to 19 Minutes | 93 (8.3%) | 129 (11.1%) |
| 20 to 24 Minutes | 222 (19.9%) | 159 (13.7%) |
| 25 to 29 Minutes | 177 (15.9%) | 75 (6.4%) |
| 30 to 34 Minutes | 81 (7.2%) | 84 (7.2%) |
| 35 to 39 Minutes | 77 (6.9%) | 151 (13.0%) |
| 40 to 44 Minutes | 0 (0.0%) | 151 (13.0%) |
| 45 to 59 Minutes | 99 (8.9%) | 68 (5.8%) |
| 60 to 89 Minutes | 0 (0.0%) | 0 (0.0%) |
| 90 or more Minutes | 122 (10.9%) | 24 (2.1%) |
Time of Departure to Work by Sex in Fairview
The most frequent times of departure to work in Fairview are 6:30 AM to 6:59 AM (294, 26.3%) for males and 6:30 AM to 6:59 AM (303, 26.0%) for females.
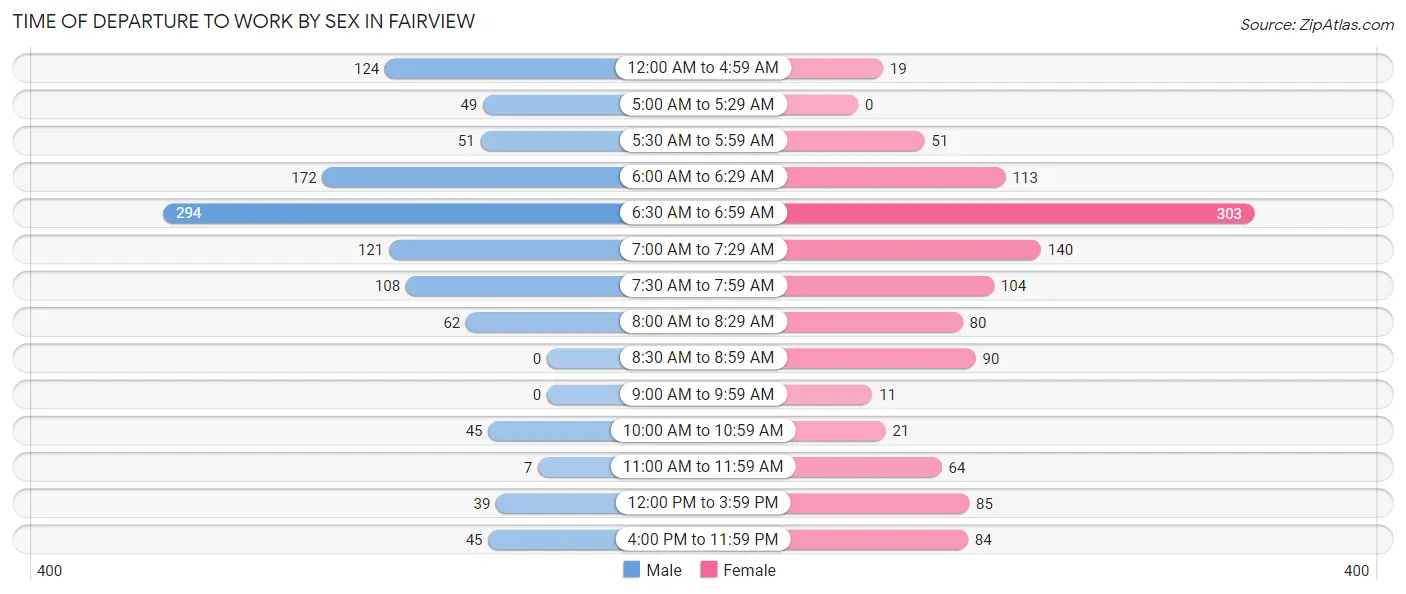
| Time of Departure | Male | Female |
| 12:00 AM to 4:59 AM | 124 (11.1%) | 19 (1.6%) |
| 5:00 AM to 5:29 AM | 49 (4.4%) | 0 (0.0%) |
| 5:30 AM to 5:59 AM | 51 (4.6%) | 51 (4.4%) |
| 6:00 AM to 6:29 AM | 172 (15.4%) | 113 (9.7%) |
| 6:30 AM to 6:59 AM | 294 (26.3%) | 303 (26.0%) |
| 7:00 AM to 7:29 AM | 121 (10.8%) | 140 (12.0%) |
| 7:30 AM to 7:59 AM | 108 (9.7%) | 104 (8.9%) |
| 8:00 AM to 8:29 AM | 62 (5.6%) | 80 (6.9%) |
| 8:30 AM to 8:59 AM | 0 (0.0%) | 90 (7.7%) |
| 9:00 AM to 9:59 AM | 0 (0.0%) | 11 (0.9%) |
| 10:00 AM to 10:59 AM | 45 (4.0%) | 21 (1.8%) |
| 11:00 AM to 11:59 AM | 7 (0.6%) | 64 (5.5%) |
| 12:00 PM to 3:59 PM | 39 (3.5%) | 85 (7.3%) |
| 4:00 PM to 11:59 PM | 45 (4.0%) | 84 (7.2%) |
| Total | 1,117 (100.0%) | 1,165 (100.0%) |
Housing Occupancy in Fairview
Occupancy by Ownership in Fairview
Of the total 2,348 dwellings in Fairview, owner-occupied units account for 1,950 (83.1%), while renter-occupied units make up 398 (17.0%).
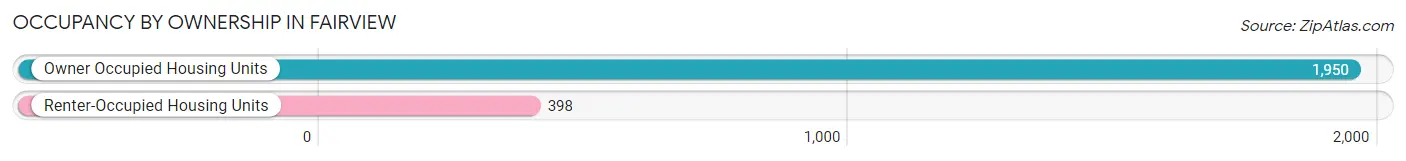
| Occupancy | # Housing Units | % Housing Units |
| Owner Occupied Housing Units | 1,950 | 83.1% |
| Renter-Occupied Housing Units | 398 | 17.0% |
| Total Occupied Housing Units | 2,348 | 100.0% |
Occupancy by Household Size in Fairview
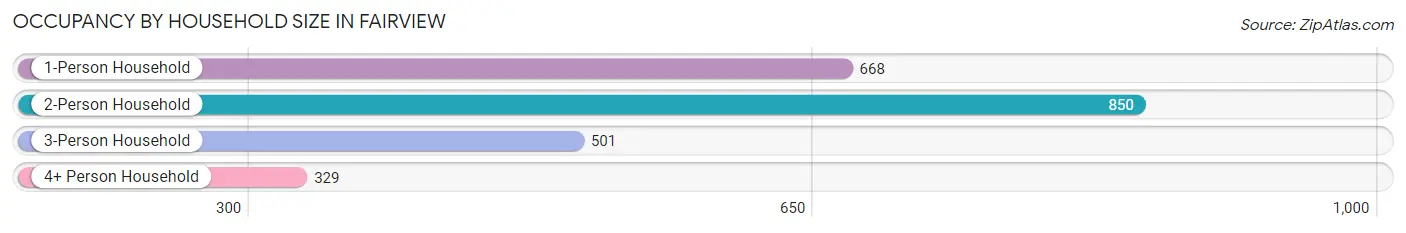
| Household Size | # Housing Units | % Housing Units |
| 1-Person Household | 668 | 28.4% |
| 2-Person Household | 850 | 36.2% |
| 3-Person Household | 501 | 21.3% |
| 4+ Person Household | 329 | 14.0% |
| Total Housing Units | 2,348 | 100.0% |
Occupancy by Ownership by Household Size in Fairview
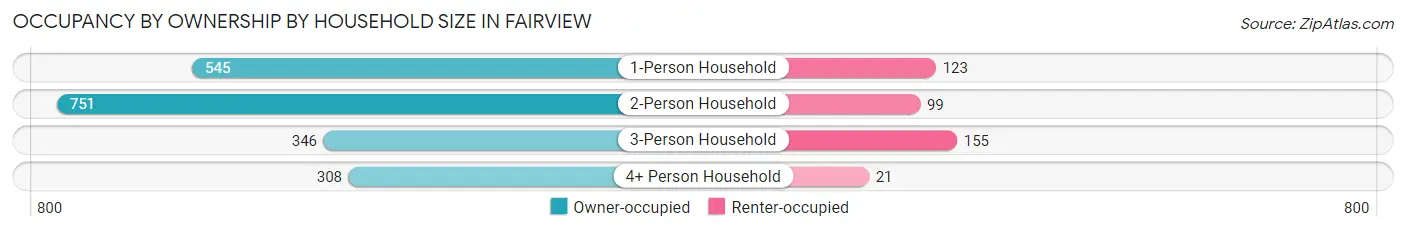
| Household Size | Owner-occupied | Renter-occupied |
| 1-Person Household | 545 (81.6%) | 123 (18.4%) |
| 2-Person Household | 751 (88.3%) | 99 (11.7%) |
| 3-Person Household | 346 (69.1%) | 155 (30.9%) |
| 4+ Person Household | 308 (93.6%) | 21 (6.4%) |
| Total Housing Units | 1,950 (83.1%) | 398 (17.0%) |
Occupancy by Educational Attainment in Fairview
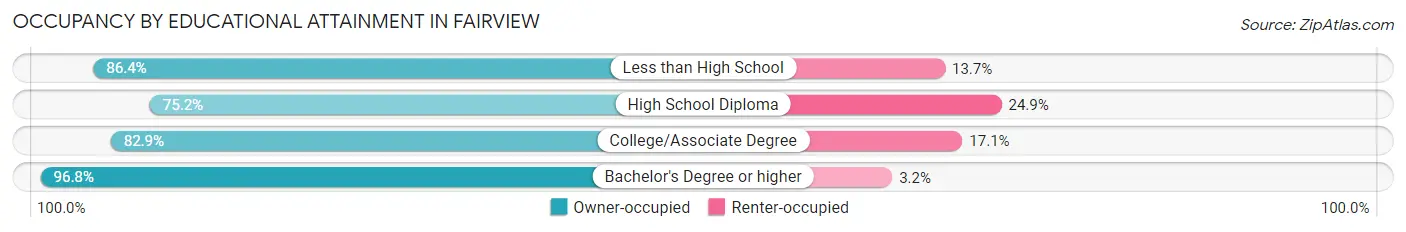
| Household Size | Owner-occupied | Renter-occupied |
| Less than High School | 310 (86.4%) | 49 (13.7%) |
| High School Diploma | 638 (75.1%) | 211 (24.8%) |
| College/Associate Degree | 606 (82.9%) | 125 (17.1%) |
| Bachelor's Degree or higher | 396 (96.8%) | 13 (3.2%) |
Occupancy by Age of Householder in Fairview
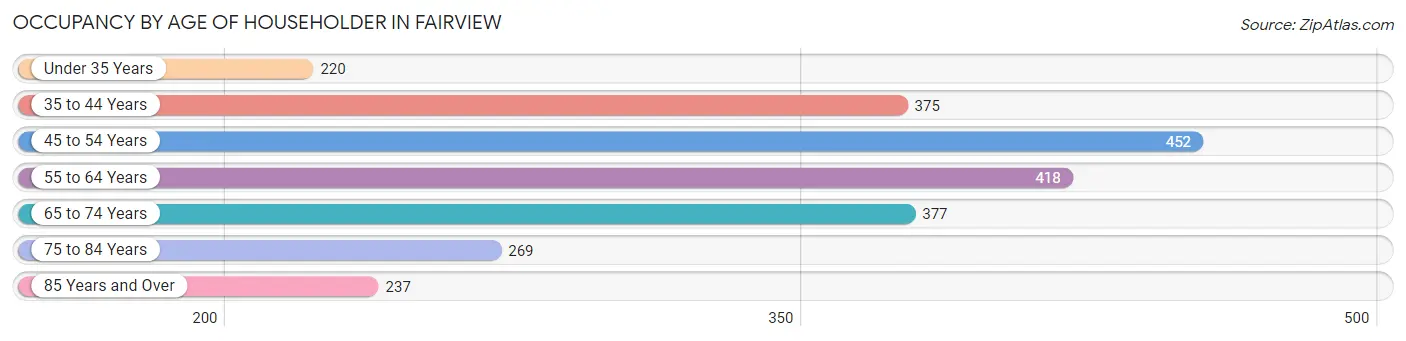
| Age Bracket | # Households | % Households |
| Under 35 Years | 220 | 9.4% |
| 35 to 44 Years | 375 | 16.0% |
| 45 to 54 Years | 452 | 19.3% |
| 55 to 64 Years | 418 | 17.8% |
| 65 to 74 Years | 377 | 16.1% |
| 75 to 84 Years | 269 | 11.5% |
| 85 Years and Over | 237 | 10.1% |
| Total | 2,348 | 100.0% |
Housing Finances in Fairview
Median Income by Occupancy in Fairview
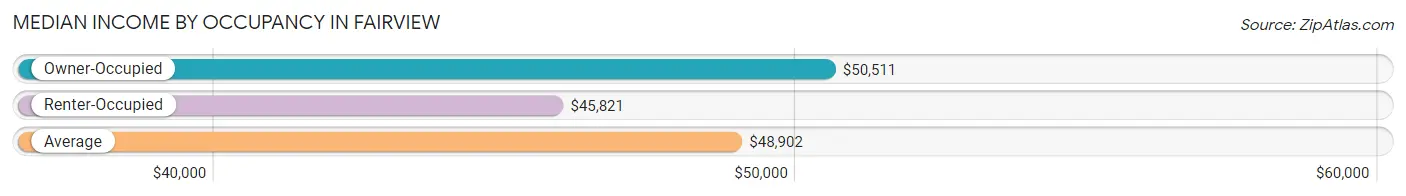
| Occupancy Type | # Households | Median Income |
| Owner-Occupied | 1,950 (83.1%) | $50,511 |
| Renter-Occupied | 398 (17.0%) | $45,821 |
| Average | 2,348 (100.0%) | $48,902 |
Occupancy by Householder Income Bracket in Fairview
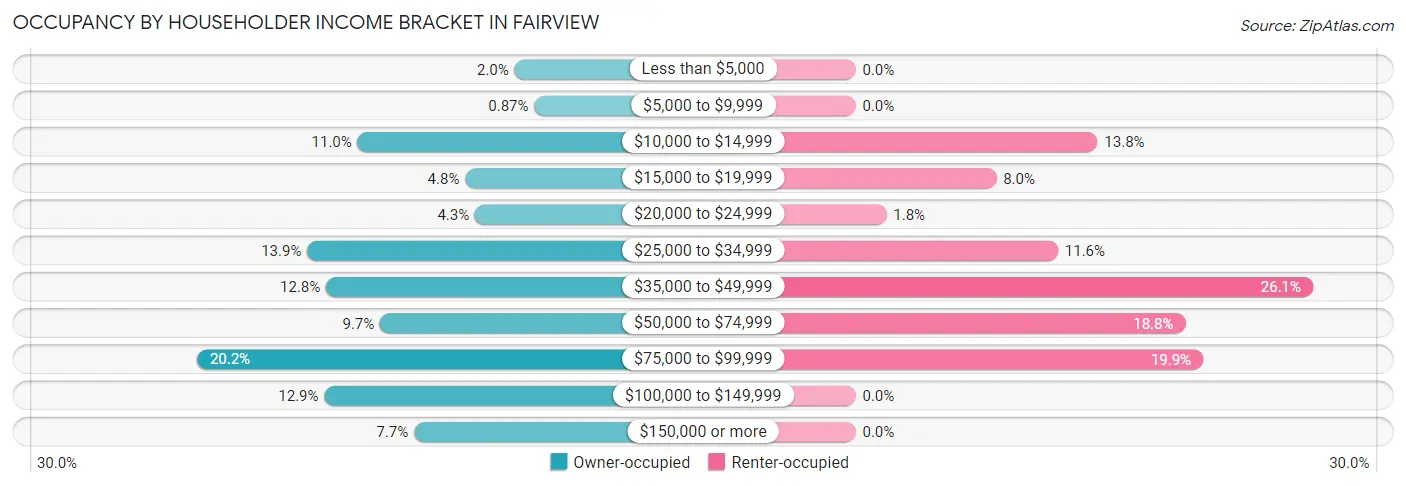
| Income Bracket | Owner-occupied | Renter-occupied |
| Less than $5,000 | 39 (2.0%) | 0 (0.0%) |
| $5,000 to $9,999 | 17 (0.9%) | 0 (0.0%) |
| $10,000 to $14,999 | 214 (11.0%) | 55 (13.8%) |
| $15,000 to $19,999 | 94 (4.8%) | 32 (8.0%) |
| $20,000 to $24,999 | 83 (4.3%) | 7 (1.8%) |
| $25,000 to $34,999 | 270 (13.9%) | 46 (11.6%) |
| $35,000 to $49,999 | 249 (12.8%) | 104 (26.1%) |
| $50,000 to $74,999 | 189 (9.7%) | 75 (18.8%) |
| $75,000 to $99,999 | 393 (20.2%) | 79 (19.9%) |
| $100,000 to $149,999 | 251 (12.9%) | 0 (0.0%) |
| $150,000 or more | 151 (7.7%) | 0 (0.0%) |
| Total | 1,950 (100.0%) | 398 (100.0%) |
Monthly Housing Cost Tiers in Fairview
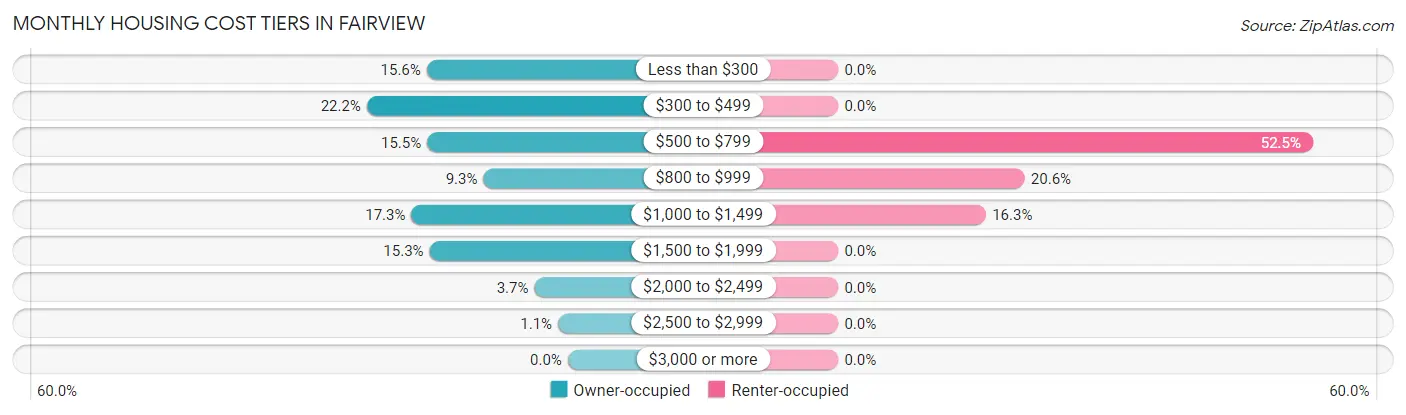
| Monthly Cost | Owner-occupied | Renter-occupied |
| Less than $300 | 304 (15.6%) | 0 (0.0%) |
| $300 to $499 | 433 (22.2%) | 0 (0.0%) |
| $500 to $799 | 303 (15.5%) | 209 (52.5%) |
| $800 to $999 | 182 (9.3%) | 82 (20.6%) |
| $1,000 to $1,499 | 337 (17.3%) | 65 (16.3%) |
| $1,500 to $1,999 | 298 (15.3%) | 0 (0.0%) |
| $2,000 to $2,499 | 72 (3.7%) | 0 (0.0%) |
| $2,500 to $2,999 | 21 (1.1%) | 0 (0.0%) |
| $3,000 or more | 0 (0.0%) | 0 (0.0%) |
| Total | 1,950 (100.0%) | 398 (100.0%) |
Physical Housing Characteristics in Fairview
Housing Structures in Fairview
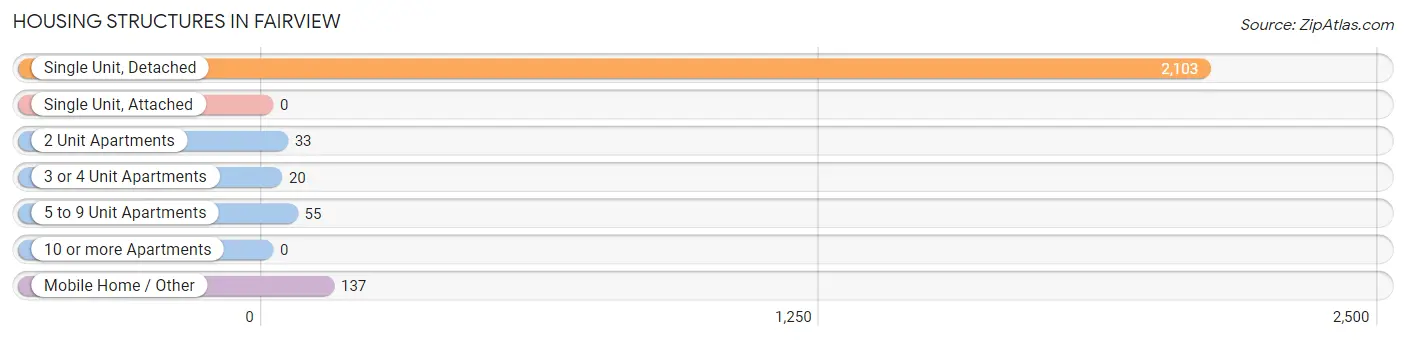
| Structure Type | # Housing Units | % Housing Units |
| Single Unit, Detached | 2,103 | 89.6% |
| Single Unit, Attached | 0 | 0.0% |
| 2 Unit Apartments | 33 | 1.4% |
| 3 or 4 Unit Apartments | 20 | 0.9% |
| 5 to 9 Unit Apartments | 55 | 2.3% |
| 10 or more Apartments | 0 | 0.0% |
| Mobile Home / Other | 137 | 5.8% |
| Total | 2,348 | 100.0% |
Housing Structures by Occupancy in Fairview
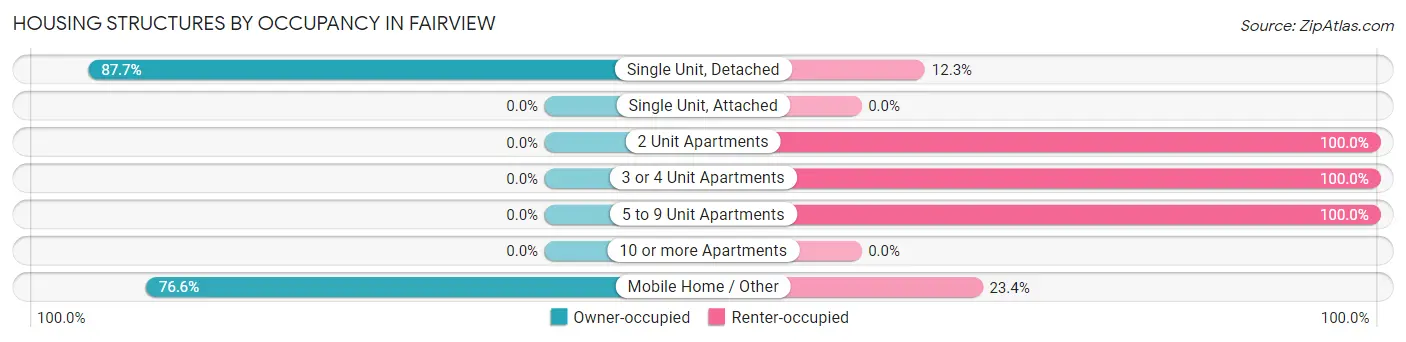
| Structure Type | Owner-occupied | Renter-occupied |
| Single Unit, Detached | 1,845 (87.7%) | 258 (12.3%) |
| Single Unit, Attached | 0 (0.0%) | 0 (0.0%) |
| 2 Unit Apartments | 0 (0.0%) | 33 (100.0%) |
| 3 or 4 Unit Apartments | 0 (0.0%) | 20 (100.0%) |
| 5 to 9 Unit Apartments | 0 (0.0%) | 55 (100.0%) |
| 10 or more Apartments | 0 (0.0%) | 0 (0.0%) |
| Mobile Home / Other | 105 (76.6%) | 32 (23.4%) |
| Total | 1,950 (83.1%) | 398 (17.0%) |
Housing Structures by Number of Rooms in Fairview
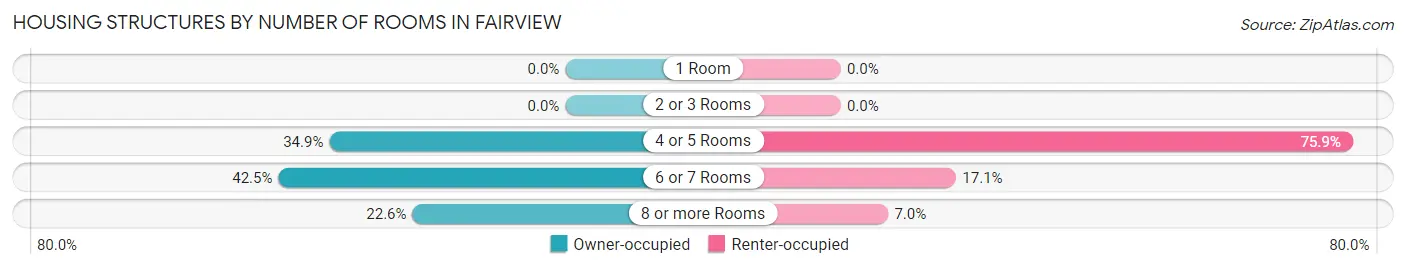
| Number of Rooms | Owner-occupied | Renter-occupied |
| 1 Room | 0 (0.0%) | 0 (0.0%) |
| 2 or 3 Rooms | 0 (0.0%) | 0 (0.0%) |
| 4 or 5 Rooms | 681 (34.9%) | 302 (75.9%) |
| 6 or 7 Rooms | 828 (42.5%) | 68 (17.1%) |
| 8 or more Rooms | 441 (22.6%) | 28 (7.0%) |
| Total | 1,950 (100.0%) | 398 (100.0%) |
Housing Structure by Heating Type in Fairview
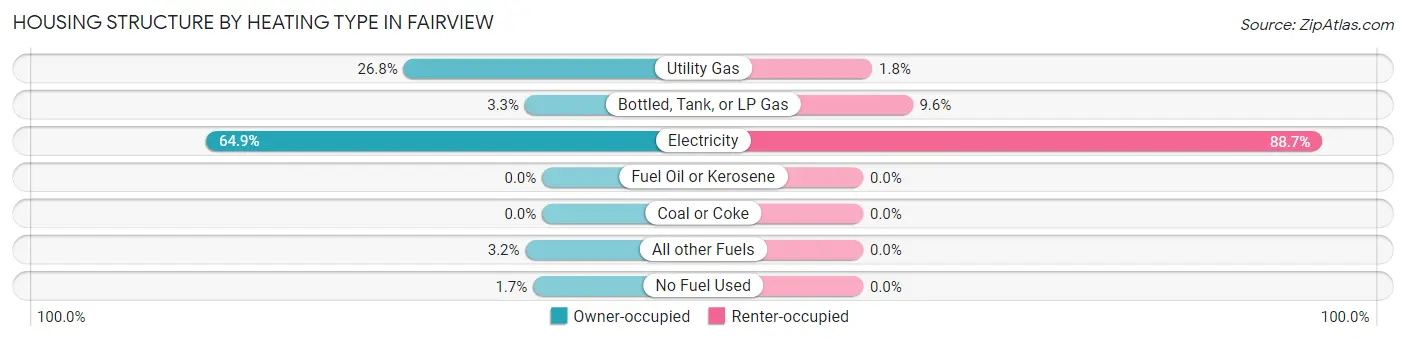
| Heating Type | Owner-occupied | Renter-occupied |
| Utility Gas | 522 (26.8%) | 7 (1.8%) |
| Bottled, Tank, or LP Gas | 65 (3.3%) | 38 (9.6%) |
| Electricity | 1,266 (64.9%) | 353 (88.7%) |
| Fuel Oil or Kerosene | 0 (0.0%) | 0 (0.0%) |
| Coal or Coke | 0 (0.0%) | 0 (0.0%) |
| All other Fuels | 63 (3.2%) | 0 (0.0%) |
| No Fuel Used | 34 (1.7%) | 0 (0.0%) |
| Total | 1,950 (100.0%) | 398 (100.0%) |
Household Vehicle Usage in Fairview
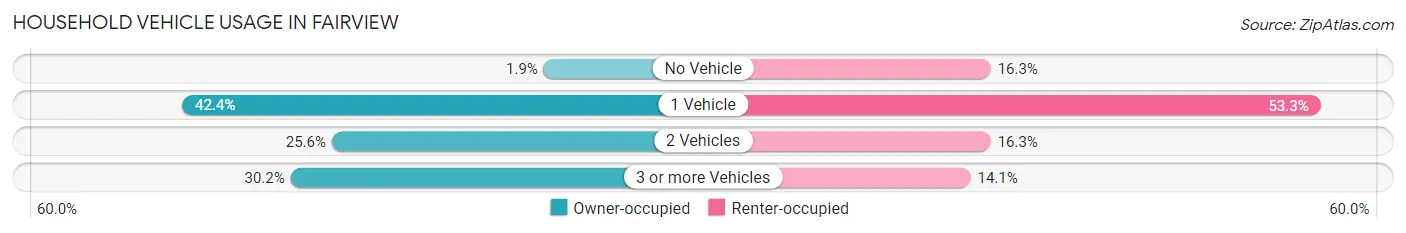
| Vehicles per Household | Owner-occupied | Renter-occupied |
| No Vehicle | 36 (1.8%) | 65 (16.3%) |
| 1 Vehicle | 826 (42.4%) | 212 (53.3%) |
| 2 Vehicles | 499 (25.6%) | 65 (16.3%) |
| 3 or more Vehicles | 589 (30.2%) | 56 (14.1%) |
| Total | 1,950 (100.0%) | 398 (100.0%) |
Real Estate & Mortgages in Fairview
Real Estate and Mortgage Overview in Fairview
| Characteristic | Without Mortgage | With Mortgage |
| Housing Units | 830 | 1,120 |
| Median Property Value | $138,200 | $158,400 |
| Median Household Income | $35,417 | $95 |
| Monthly Housing Costs | $343 | $0 |
| Real Estate Taxes | $639 | $63 |
Property Value by Mortgage Status in Fairview
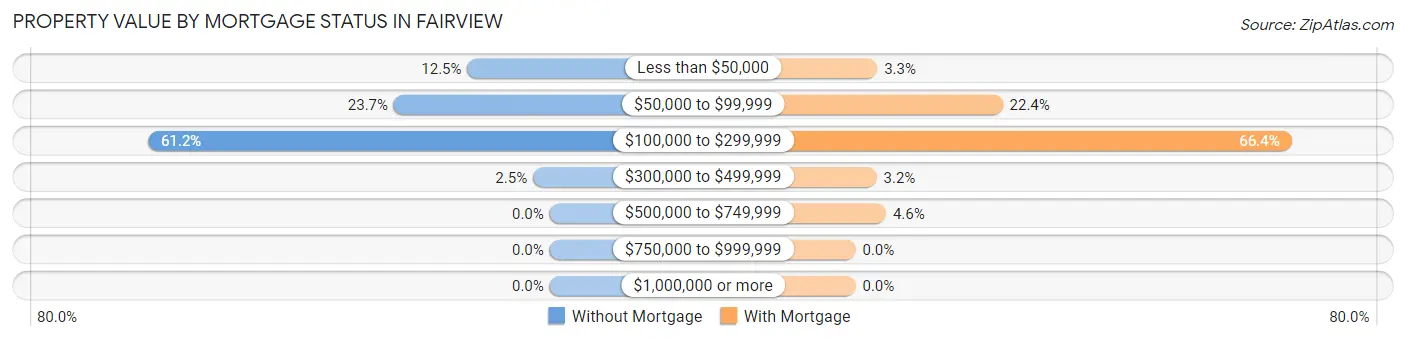
| Property Value | Without Mortgage | With Mortgage |
| Less than $50,000 | 104 (12.5%) | 37 (3.3%) |
| $50,000 to $99,999 | 197 (23.7%) | 251 (22.4%) |
| $100,000 to $299,999 | 508 (61.2%) | 744 (66.4%) |
| $300,000 to $499,999 | 21 (2.5%) | 36 (3.2%) |
| $500,000 to $749,999 | 0 (0.0%) | 52 (4.6%) |
| $750,000 to $999,999 | 0 (0.0%) | 0 (0.0%) |
| $1,000,000 or more | 0 (0.0%) | 0 (0.0%) |
| Total | 830 (100.0%) | 1,120 (100.0%) |
Household Income by Mortgage Status in Fairview
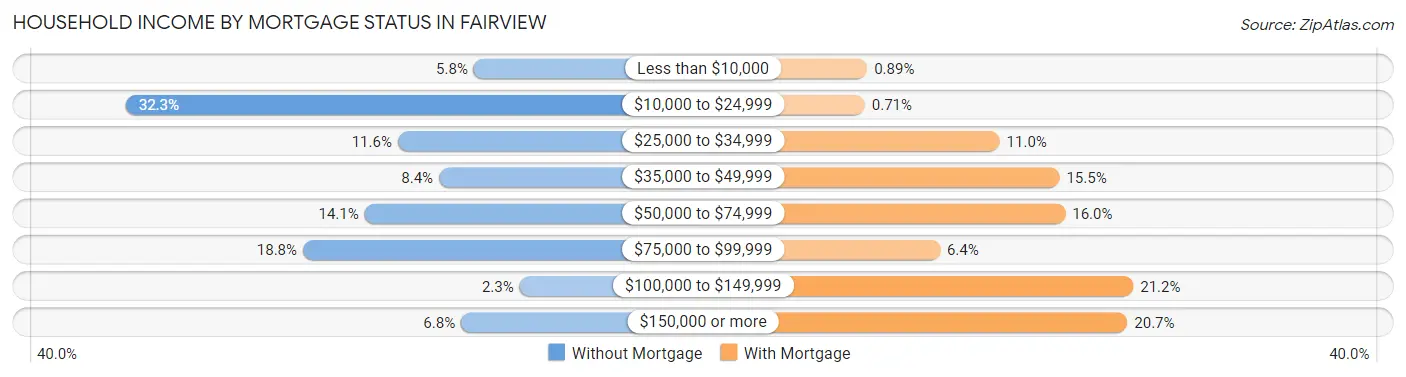
| Household Income | Without Mortgage | With Mortgage |
| Less than $10,000 | 48 (5.8%) | 10 (0.9%) |
| $10,000 to $24,999 | 268 (32.3%) | 8 (0.7%) |
| $25,000 to $34,999 | 96 (11.6%) | 123 (11.0%) |
| $35,000 to $49,999 | 70 (8.4%) | 174 (15.5%) |
| $50,000 to $74,999 | 117 (14.1%) | 179 (16.0%) |
| $75,000 to $99,999 | 156 (18.8%) | 72 (6.4%) |
| $100,000 to $149,999 | 19 (2.3%) | 237 (21.2%) |
| $150,000 or more | 56 (6.8%) | 232 (20.7%) |
| Total | 830 (100.0%) | 1,120 (100.0%) |
Property Value to Household Income Ratio in Fairview
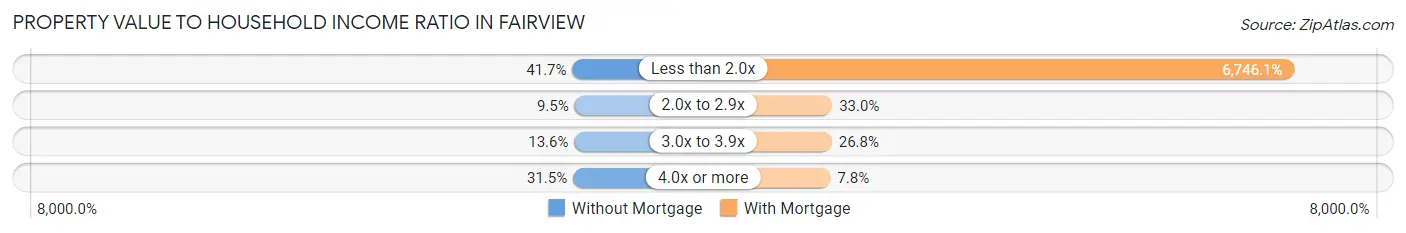
| Value-to-Income Ratio | Without Mortgage | With Mortgage |
| Less than 2.0x | 346 (41.7%) | 75,556 (6,746.1%) |
| 2.0x to 2.9x | 79 (9.5%) | 369 (33.0%) |
| 3.0x to 3.9x | 113 (13.6%) | 300 (26.8%) |
| 4.0x or more | 261 (31.5%) | 87 (7.8%) |
| Total | 830 (100.0%) | 1,120 (100.0%) |
Real Estate Taxes by Mortgage Status in Fairview
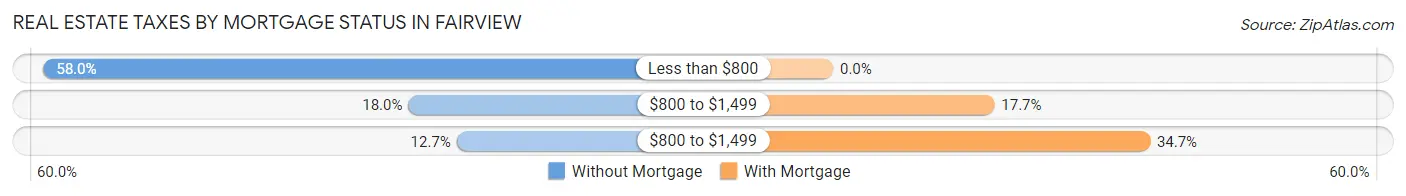
| Property Taxes | Without Mortgage | With Mortgage |
| Less than $800 | 481 (58.0%) | 0 (0.0%) |
| $800 to $1,499 | 149 (17.9%) | 198 (17.7%) |
| $800 to $1,499 | 105 (12.7%) | 389 (34.7%) |
| Total | 830 (100.0%) | 1,120 (100.0%) |
Health & Disability in Fairview
Health Insurance Coverage by Age in Fairview
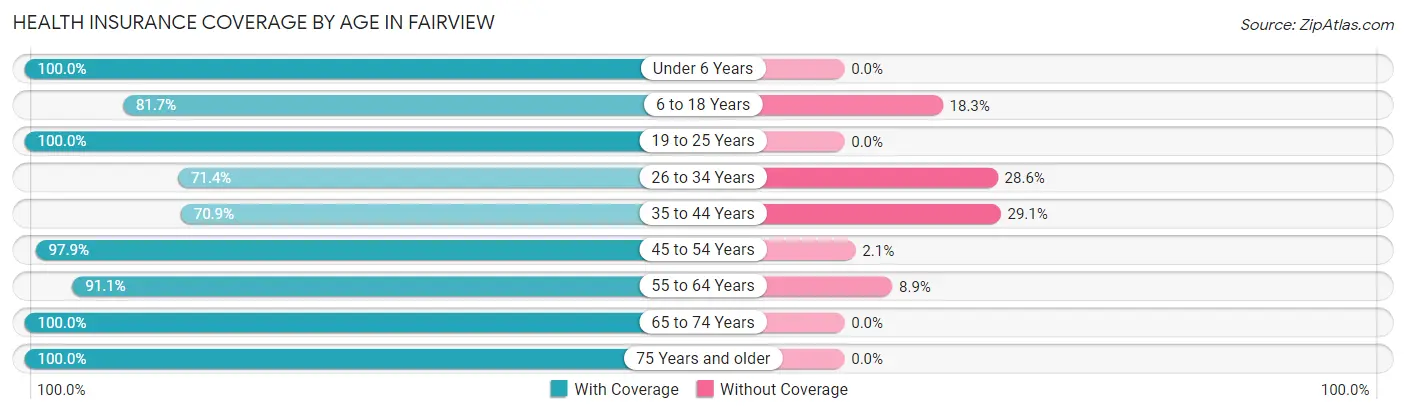
| Age Bracket | With Coverage | Without Coverage |
| Under 6 Years | 185 (100.0%) | 0 (0.0%) |
| 6 to 18 Years | 824 (81.7%) | 185 (18.3%) |
| 19 to 25 Years | 317 (100.0%) | 0 (0.0%) |
| 26 to 34 Years | 367 (71.4%) | 147 (28.6%) |
| 35 to 44 Years | 496 (70.9%) | 204 (29.1%) |
| 45 to 54 Years | 803 (97.9%) | 17 (2.1%) |
| 55 to 64 Years | 879 (91.1%) | 86 (8.9%) |
| 65 to 74 Years | 588 (100.0%) | 0 (0.0%) |
| 75 Years and older | 620 (100.0%) | 0 (0.0%) |
| Total | 5,079 (88.8%) | 639 (11.2%) |
Health Insurance Coverage by Citizenship Status in Fairview
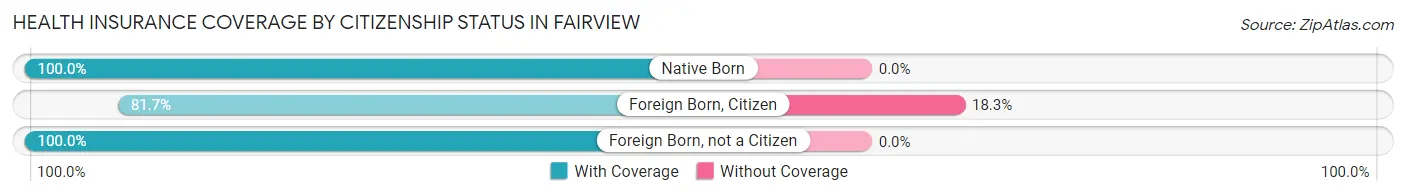
| Citizenship Status | With Coverage | Without Coverage |
| Native Born | 185 (100.0%) | 0 (0.0%) |
| Foreign Born, Citizen | 824 (81.7%) | 185 (18.3%) |
| Foreign Born, not a Citizen | 317 (100.0%) | 0 (0.0%) |
Health Insurance Coverage by Household Income in Fairview
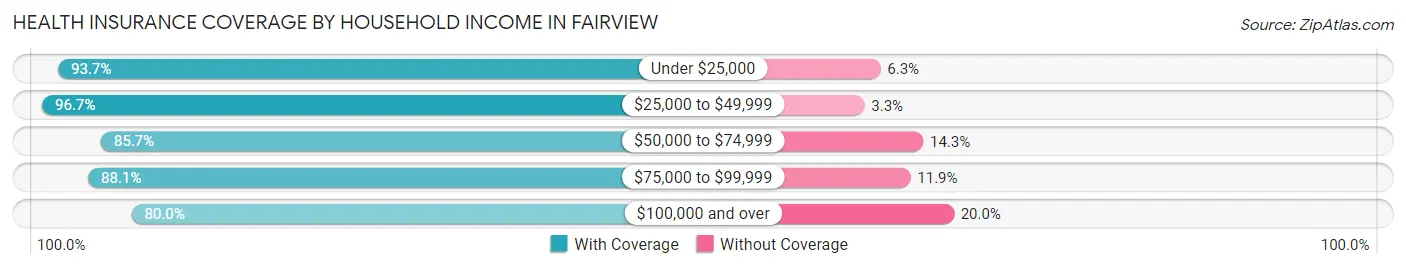
| Household Income | With Coverage | Without Coverage |
| Under $25,000 | 612 (93.7%) | 41 (6.3%) |
| $25,000 to $49,999 | 1,559 (96.7%) | 53 (3.3%) |
| $50,000 to $74,999 | 642 (85.7%) | 107 (14.3%) |
| $75,000 to $99,999 | 1,124 (88.1%) | 152 (11.9%) |
| $100,000 and over | 1,142 (80.0%) | 286 (20.0%) |
Public vs Private Health Insurance Coverage by Age in Fairview
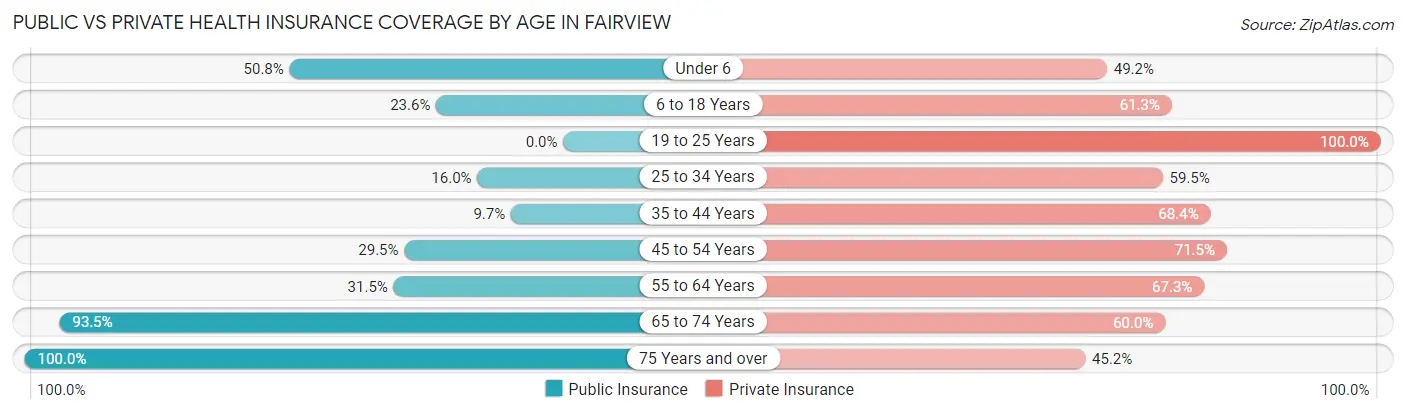
| Age Bracket | Public Insurance | Private Insurance |
| Under 6 | 94 (50.8%) | 91 (49.2%) |
| 6 to 18 Years | 238 (23.6%) | 618 (61.3%) |
| 19 to 25 Years | 0 (0.0%) | 317 (100.0%) |
| 25 to 34 Years | 82 (16.0%) | 306 (59.5%) |
| 35 to 44 Years | 68 (9.7%) | 479 (68.4%) |
| 45 to 54 Years | 242 (29.5%) | 586 (71.5%) |
| 55 to 64 Years | 304 (31.5%) | 649 (67.2%) |
| 65 to 74 Years | 550 (93.5%) | 353 (60.0%) |
| 75 Years and over | 620 (100.0%) | 280 (45.2%) |
| Total | 2,198 (38.4%) | 3,679 (64.3%) |
Disability Status by Sex by Age in Fairview
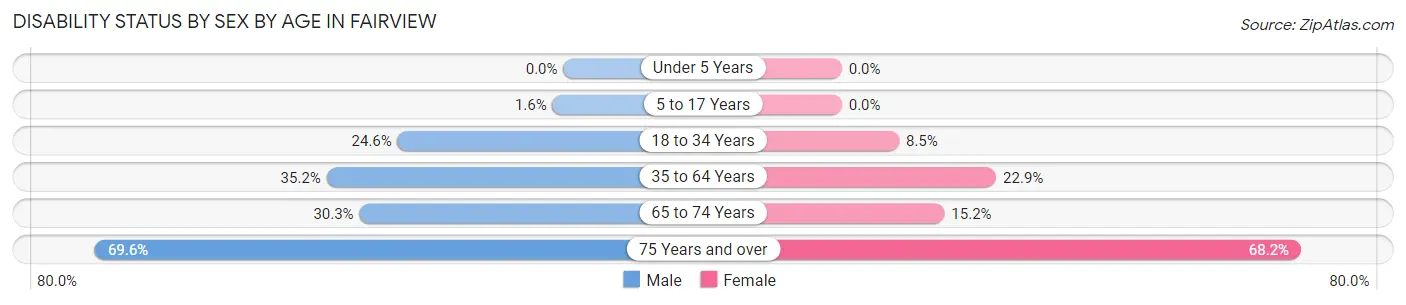
| Age Bracket | Male | Female |
| Under 5 Years | 0 (0.0%) | 0 (0.0%) |
| 5 to 17 Years | 10 (1.6%) | 0 (0.0%) |
| 18 to 34 Years | 110 (24.6%) | 35 (8.5%) |
| 35 to 64 Years | 412 (35.1%) | 301 (22.9%) |
| 65 to 74 Years | 33 (30.3%) | 73 (15.2%) |
| 75 Years and over | 169 (69.6%) | 257 (68.2%) |
Disability Class by Sex by Age in Fairview
Disability Class: Hearing Difficulty
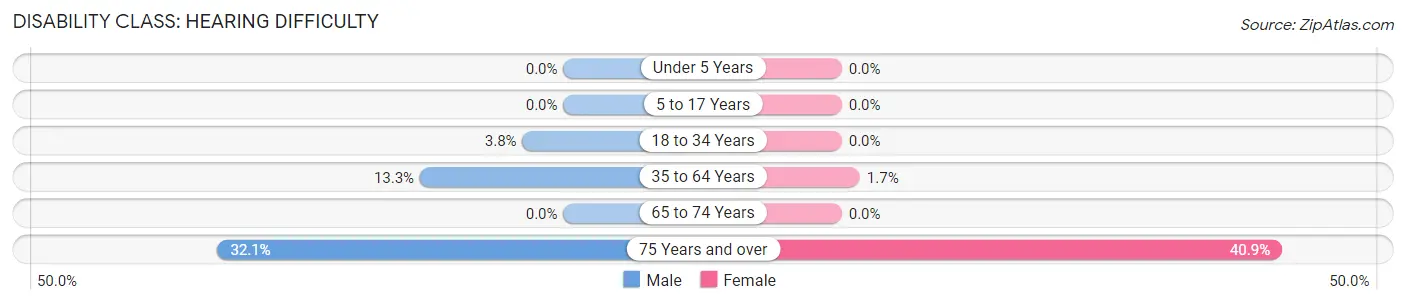
| Age Bracket | Male | Female |
| Under 5 Years | 0 (0.0%) | 0 (0.0%) |
| 5 to 17 Years | 0 (0.0%) | 0 (0.0%) |
| 18 to 34 Years | 17 (3.8%) | 0 (0.0%) |
| 35 to 64 Years | 156 (13.3%) | 22 (1.7%) |
| 65 to 74 Years | 0 (0.0%) | 0 (0.0%) |
| 75 Years and over | 78 (32.1%) | 154 (40.8%) |
Disability Class: Vision Difficulty
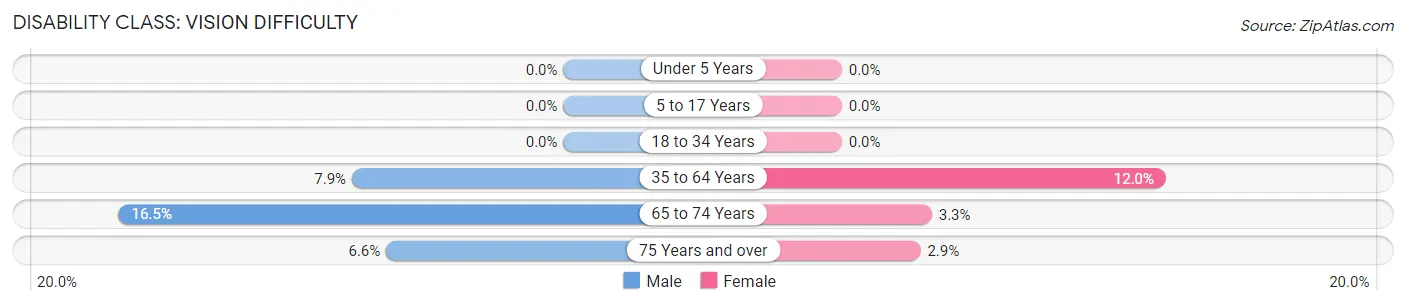
| Age Bracket | Male | Female |
| Under 5 Years | 0 (0.0%) | 0 (0.0%) |
| 5 to 17 Years | 0 (0.0%) | 0 (0.0%) |
| 18 to 34 Years | 0 (0.0%) | 0 (0.0%) |
| 35 to 64 Years | 92 (7.9%) | 158 (12.0%) |
| 65 to 74 Years | 18 (16.5%) | 16 (3.3%) |
| 75 Years and over | 16 (6.6%) | 11 (2.9%) |
Disability Class: Cognitive Difficulty
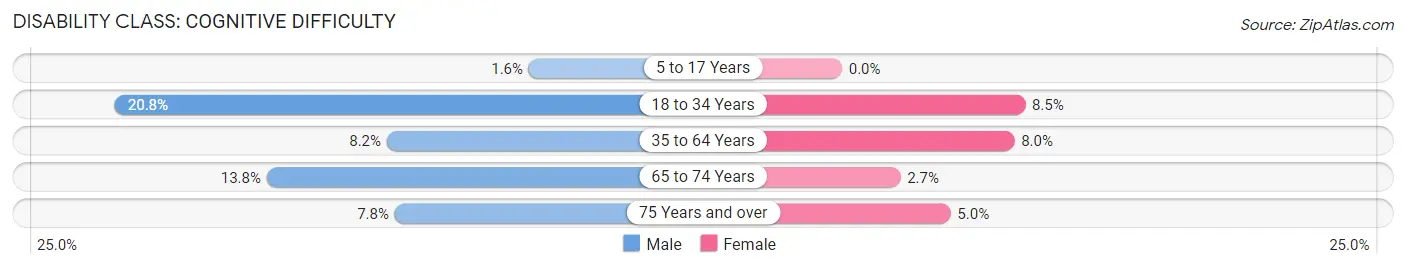
| Age Bracket | Male | Female |
| 5 to 17 Years | 10 (1.6%) | 0 (0.0%) |
| 18 to 34 Years | 93 (20.8%) | 35 (8.5%) |
| 35 to 64 Years | 96 (8.2%) | 105 (8.0%) |
| 65 to 74 Years | 15 (13.8%) | 13 (2.7%) |
| 75 Years and over | 19 (7.8%) | 19 (5.0%) |
Disability Class: Ambulatory Difficulty
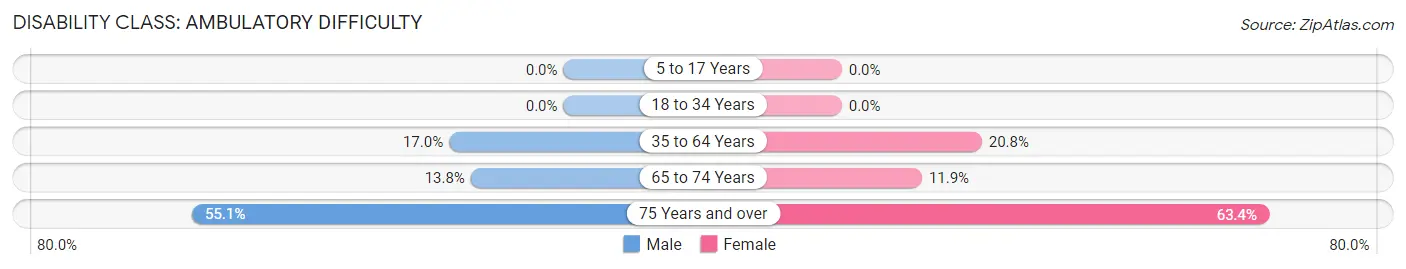
| Age Bracket | Male | Female |
| 5 to 17 Years | 0 (0.0%) | 0 (0.0%) |
| 18 to 34 Years | 0 (0.0%) | 0 (0.0%) |
| 35 to 64 Years | 199 (17.0%) | 273 (20.8%) |
| 65 to 74 Years | 15 (13.8%) | 57 (11.9%) |
| 75 Years and over | 134 (55.1%) | 239 (63.4%) |
Disability Class: Self-Care Difficulty
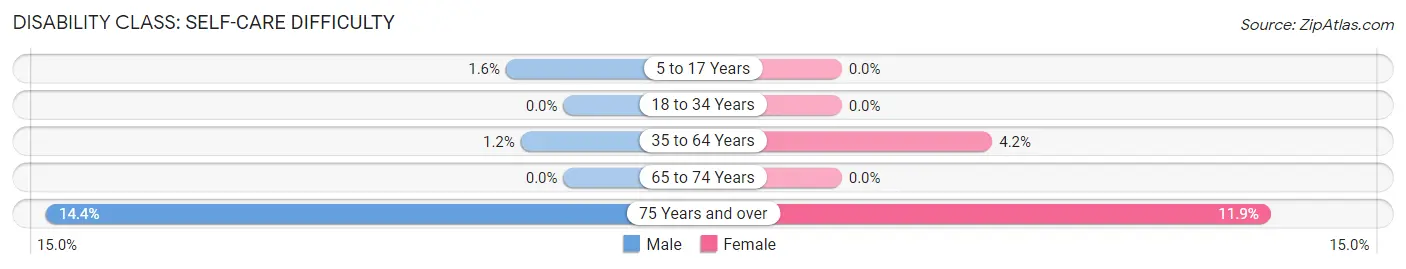
| Age Bracket | Male | Female |
| 5 to 17 Years | 10 (1.6%) | 0 (0.0%) |
| 18 to 34 Years | 0 (0.0%) | 0 (0.0%) |
| 35 to 64 Years | 14 (1.2%) | 55 (4.2%) |
| 65 to 74 Years | 0 (0.0%) | 0 (0.0%) |
| 75 Years and over | 35 (14.4%) | 45 (11.9%) |
Technology Access in Fairview
Computing Device Access in Fairview
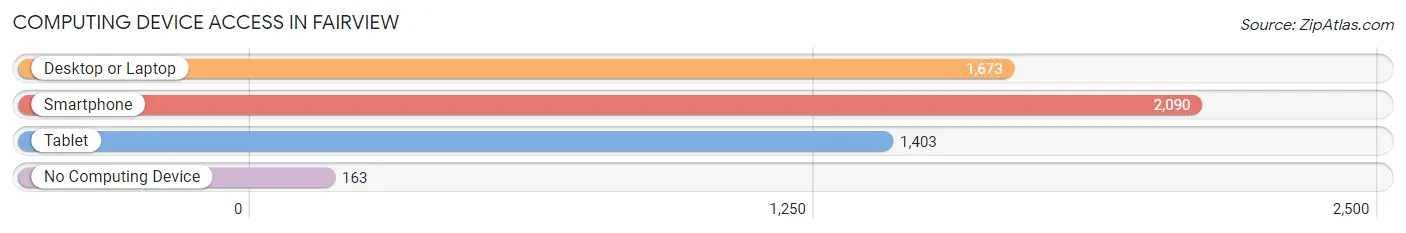
| Device Type | # Households | % Households |
| Desktop or Laptop | 1,673 | 71.3% |
| Smartphone | 2,090 | 89.0% |
| Tablet | 1,403 | 59.8% |
| No Computing Device | 163 | 6.9% |
| Total | 2,348 | 100.0% |
Internet Access in Fairview
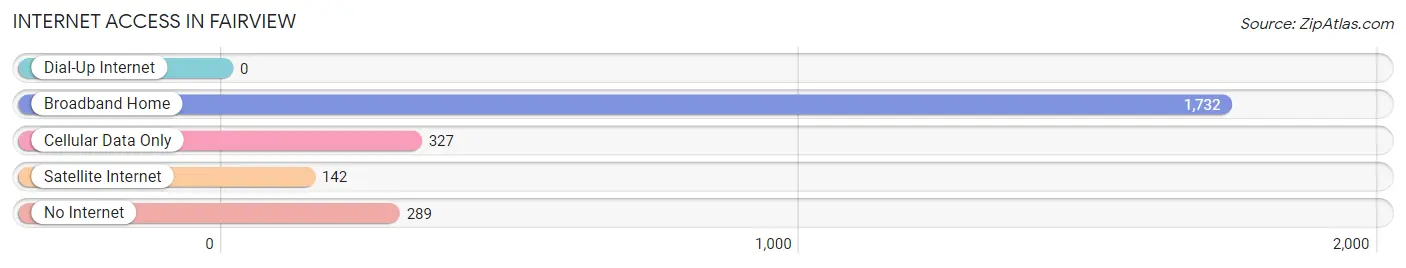
| Internet Type | # Households | % Households |
| Dial-Up Internet | 0 | 0.0% |
| Broadband Home | 1,732 | 73.8% |
| Cellular Data Only | 327 | 13.9% |
| Satellite Internet | 142 | 6.0% |
| No Internet | 289 | 12.3% |
| Total | 2,348 | 100.0% |
Fairview Summary
History
The small town of Fairview, Georgia is located in the northwest corner of the state, in the foothills of the Appalachian Mountains. It was first settled in the early 1800s by a group of settlers from North Carolina. The town was originally known as Fairview Crossroads, and was named for the view of the surrounding countryside from the crossroads. The town was incorporated in 1883, and the population has grown steadily since then.
The town has a rich history of industry and agriculture. In the late 1800s, the town was home to several cotton mills, as well as a sawmill and a gristmill. The town also had a thriving dairy industry, with several local farms producing milk and other dairy products. In the early 1900s, the town was home to several brickyards, which produced bricks for the construction of homes and businesses in the area.
The town was also home to several churches, including the Fairview Methodist Church, which was founded in 1883. The church is still active today, and is the oldest church in the town.
Geography
Fairview is located in the northwest corner of Georgia, in the foothills of the Appalachian Mountains. The town is situated on the banks of the Etowah River, and is surrounded by rolling hills and forests. The town is located about 30 miles from the city of Atlanta, and is accessible by several major highways.
The town has a total area of 4.2 square miles, with a population of approximately 1,500 people. The town is located at an elevation of 1,000 feet above sea level, and has a humid subtropical climate. The average temperature in the summer is around 80 degrees Fahrenheit, and the average temperature in the winter is around 40 degrees Fahrenheit.
Economy
The economy of Fairview is largely based on agriculture and tourism. The town is home to several farms, which produce a variety of crops, including corn, soybeans, and hay. The town is also home to several wineries, which produce a variety of wines.
The town is also home to several small businesses, including restaurants, shops, and other services. The town is also home to several manufacturing companies, which produce a variety of products, including furniture, clothing, and electronics.
Demographics
As of the 2010 census, the population of Fairview was 1,500 people. The racial makeup of the town was 95.3% White, 1.7% African American, 0.7% Native American, 0.3% Asian, and 2.0% from other races. The median household income was $37,500, and the median family income was $45,000. The per capita income was $19,000.
Conclusion
Fairview, Georgia is a small town located in the northwest corner of the state, in the foothills of the Appalachian Mountains. The town has a rich history of industry and agriculture, and is home to several small businesses and manufacturing companies. The town has a population of approximately 1,500 people, and the median household income is $37,500. The town is a popular tourist destination, and is home to several wineries and farms.
Common Questions
What is the Total Population of Fairview?
Total Population of Fairview is 5,718.
What is the Total Male Population of Fairview?
Total Male Population of Fairview is 2,671.
What is the Total Female Population of Fairview?
Total Female Population of Fairview is 3,047.
What is the Ratio of Males per 100 Females in Fairview?
There are 87.66 Males per 100 Females in Fairview.
What is the Ratio of Females per 100 Males in Fairview?
There are 114.08 Females per 100 Males in Fairview.
What is the Median Population Age in Fairview?
Median Population Age in Fairview is 47.7 Years.
What is the Average Family Size in Fairview
Average Family Size in Fairview is 3.0 People.
What is the Average Household Size in Fairview
Average Household Size in Fairview is 2.4 People.
What is Per Capita Income in Fairview?
Per Capita income in Fairview is $27,250.
What is the Median Family Income in Fairview?
Median Family Income in Fairview is $58,333.
What is the Median Household income in Fairview?
Median Household Income in Fairview is $48,902.
What is Income or Wage Gap in Fairview?
Income or Wage Gap in Fairview is 21.9%.
Women in Fairview earn 78.1 cents for every dollar earned by a man.
What is Inequality or Gini Index in Fairview?
Inequality or Gini Index in Fairview is 0.41.
How Large is the Labor Force in Fairview?
There are 2,438 People in the Labor Forcein in Fairview.
What is the Percentage of People in the Labor Force in Fairview?
51.5% of People are in the Labor Force in Fairview.
What is the Unemployment Rate in Fairview?
Unemployment Rate in Fairview is 3.0%.