Coolidge, GA
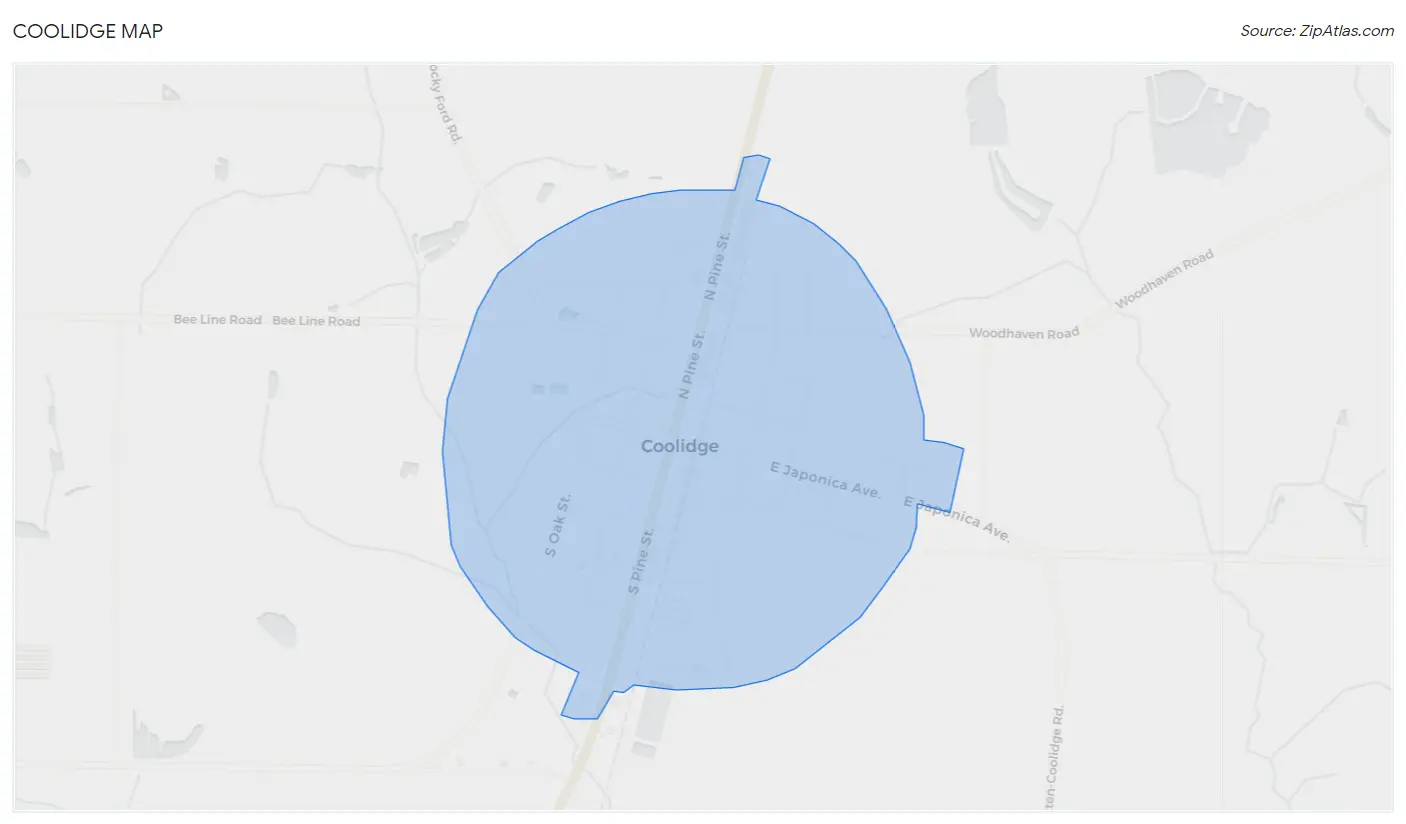
Coolidge Map
Coolidge Overview
775
TOTAL POPULATION
475
MALE POPULATION
300
FEMALE POPULATION
158.33
MALES / 100 FEMALES
63.16
FEMALES / 100 MALES
41.1
MEDIAN AGE
3.0
AVG FAMILY SIZE
2.2
AVG HOUSEHOLD SIZE
$22,077
PER CAPITA INCOME
$38,939
AVG FAMILY INCOME
$38,750
AVG HOUSEHOLD INCOME
62.5%
WAGE / INCOME GAP [ % ]
37.5¢/ $1
WAGE / INCOME GAP [ $ ]
$7,778
FAMILY INCOME DEFICIT
0.37
INEQUALITY / GINI INDEX
392
LABOR FORCE [ PEOPLE ]
64.4%
PERCENT IN LABOR FORCE
Coolidge Zip Codes
Coolidge Area Codes
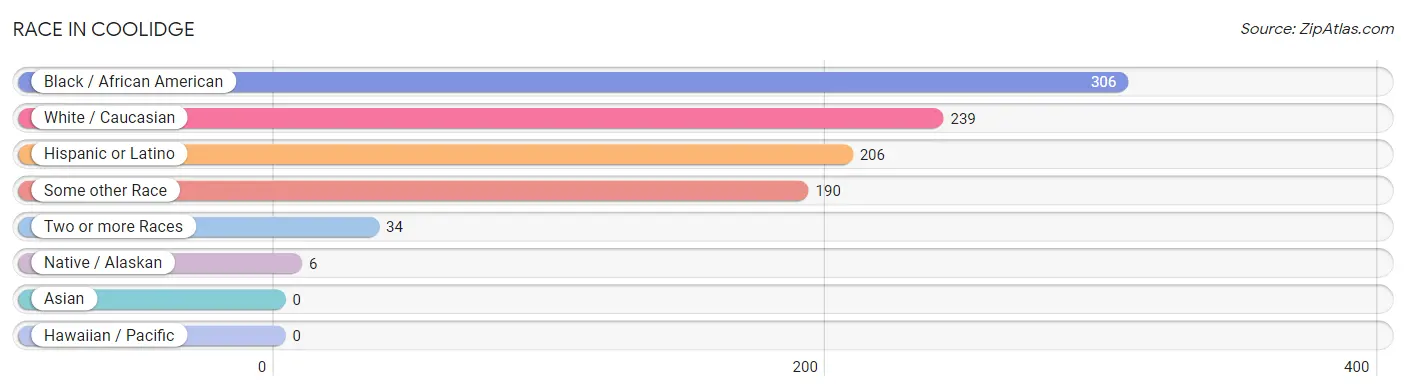
Race in Coolidge
The most populous races in Coolidge are Black / African American (306 | 39.5%), White / Caucasian (239 | 30.8%), and Hispanic or Latino (206 | 26.6%).
| Race | # Population | % Population |
| Asian | 0 | 0.0% |
| Black / African American | 306 | 39.5% |
| Hawaiian / Pacific | 0 | 0.0% |
| Hispanic or Latino | 206 | 26.6% |
| Native / Alaskan | 6 | 0.8% |
| White / Caucasian | 239 | 30.8% |
| Two or more Races | 34 | 4.4% |
| Some other Race | 190 | 24.5% |
| Total | 775 | 100.0% |
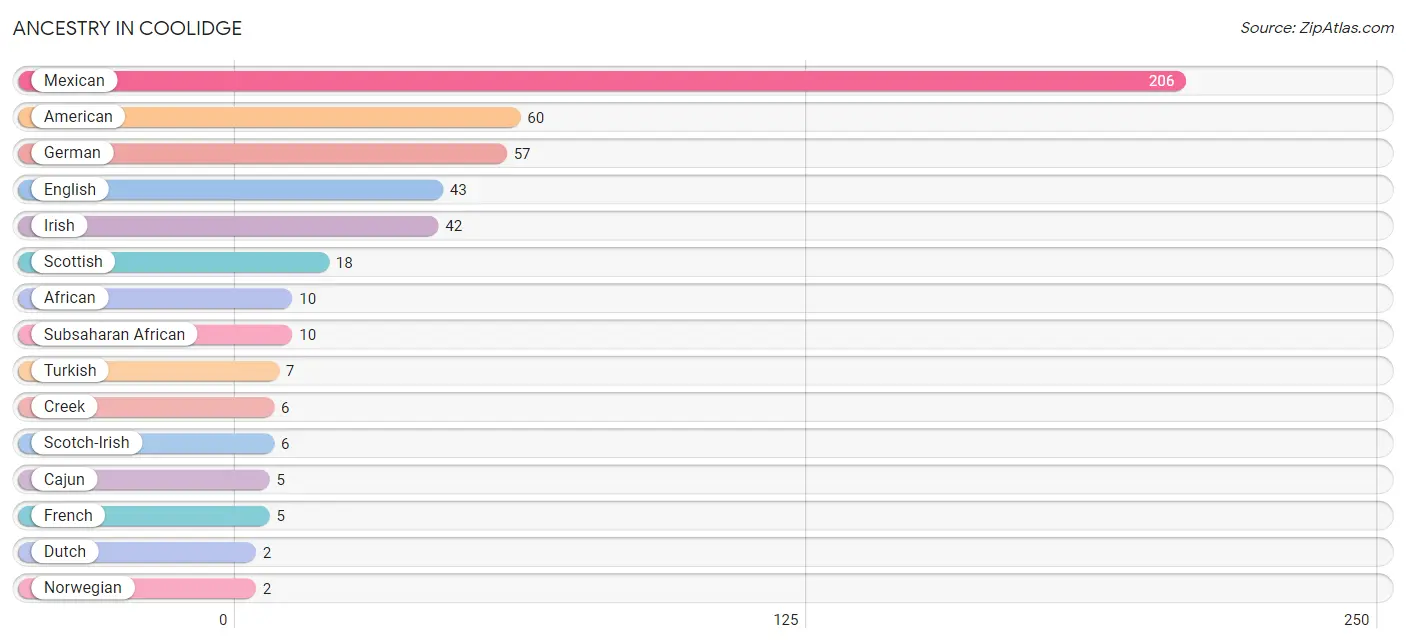
Ancestry in Coolidge
The most populous ancestries reported in Coolidge are Mexican (206 | 26.6%), American (60 | 7.7%), German (57 | 7.3%), English (43 | 5.6%), and Irish (42 | 5.4%), together accounting for 52.6% of all Coolidge residents.
| Ancestry | # Population | % Population |
| African | 10 | 1.3% |
| American | 60 | 7.7% |
| Cajun | 5 | 0.6% |
| Creek | 6 | 0.8% |
| Dutch | 2 | 0.3% |
| English | 43 | 5.6% |
| European | 1 | 0.1% |
| French | 5 | 0.6% |
| German | 57 | 7.3% |
| Irish | 42 | 5.4% |
| Mexican | 206 | 26.6% |
| Norwegian | 2 | 0.3% |
| Polish | 2 | 0.3% |
| Scotch-Irish | 6 | 0.8% |
| Scottish | 18 | 2.3% |
| Subsaharan African | 10 | 1.3% |
| Turkish | 7 | 0.9% |
| Welsh | 1 | 0.1% | View All 18 Rows |
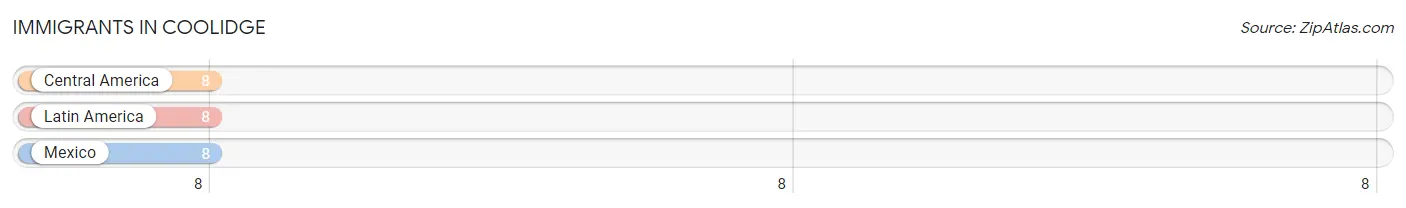
Immigrants in Coolidge
The most numerous immigrant groups reported in Coolidge came from Central America (8 | 1.0%), Latin America (8 | 1.0%), and Mexico (8 | 1.0%), together accounting for 3.1% of all Coolidge residents.
| Immigration Origin | # Population | % Population |
| Central America | 8 | 1.0% |
| Latin America | 8 | 1.0% |
| Mexico | 8 | 1.0% | View All 3 Rows |
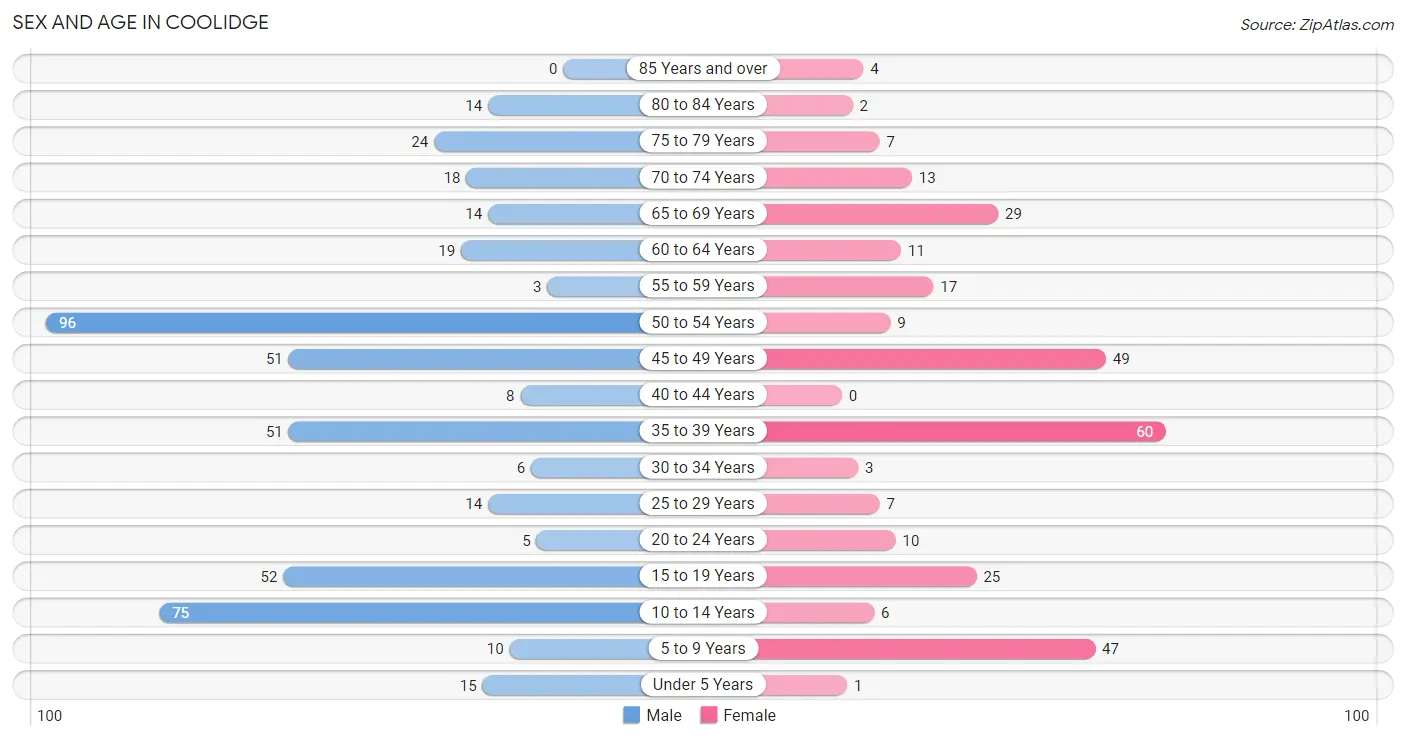
Sex and Age in Coolidge
Sex and Age in Coolidge
The most populous age groups in Coolidge are 50 to 54 Years (96 | 20.2%) for men and 35 to 39 Years (60 | 20.0%) for women.
| Age Bracket | Male | Female |
| Under 5 Years | 15 (3.2%) | 1 (0.3%) |
| 5 to 9 Years | 10 (2.1%) | 47 (15.7%) |
| 10 to 14 Years | 75 (15.8%) | 6 (2.0%) |
| 15 to 19 Years | 52 (11.0%) | 25 (8.3%) |
| 20 to 24 Years | 5 (1.1%) | 10 (3.3%) |
| 25 to 29 Years | 14 (2.9%) | 7 (2.3%) |
| 30 to 34 Years | 6 (1.3%) | 3 (1.0%) |
| 35 to 39 Years | 51 (10.7%) | 60 (20.0%) |
| 40 to 44 Years | 8 (1.7%) | 0 (0.0%) |
| 45 to 49 Years | 51 (10.7%) | 49 (16.3%) |
| 50 to 54 Years | 96 (20.2%) | 9 (3.0%) |
| 55 to 59 Years | 3 (0.6%) | 17 (5.7%) |
| 60 to 64 Years | 19 (4.0%) | 11 (3.7%) |
| 65 to 69 Years | 14 (2.9%) | 29 (9.7%) |
| 70 to 74 Years | 18 (3.8%) | 13 (4.3%) |
| 75 to 79 Years | 24 (5.1%) | 7 (2.3%) |
| 80 to 84 Years | 14 (2.9%) | 2 (0.7%) |
| 85 Years and over | 0 (0.0%) | 4 (1.3%) |
| Total | 475 (100.0%) | 300 (100.0%) |
Families and Households in Coolidge
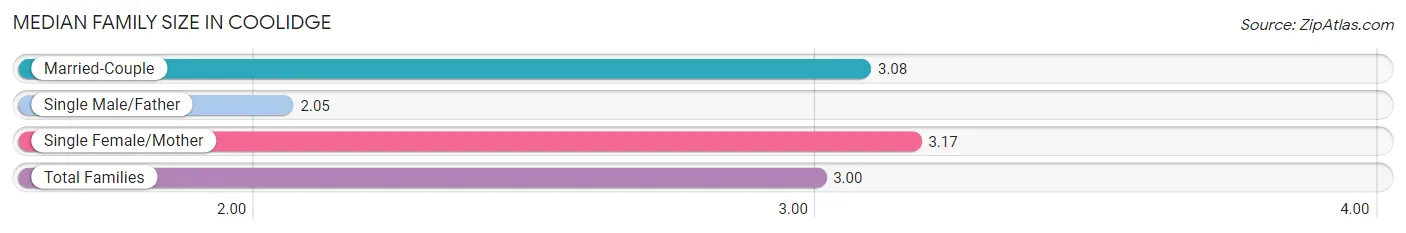
Median Family Size in Coolidge
The median family size in Coolidge is 3.00 persons per family, with single female/mother families (48 | 25.0%) accounting for the largest median family size of 3.17 persons per family. On the other hand, single male/father families (19 | 9.9%) represent the smallest median family size with 2.05 persons per family.
| Family Type | # Families | Family Size |
| Married-Couple | 125 (65.1%) | 3.08 |
| Single Male/Father | 19 (9.9%) | 2.05 |
| Single Female/Mother | 48 (25.0%) | 3.17 |
| Total Families | 192 (100.0%) | 3.00 |
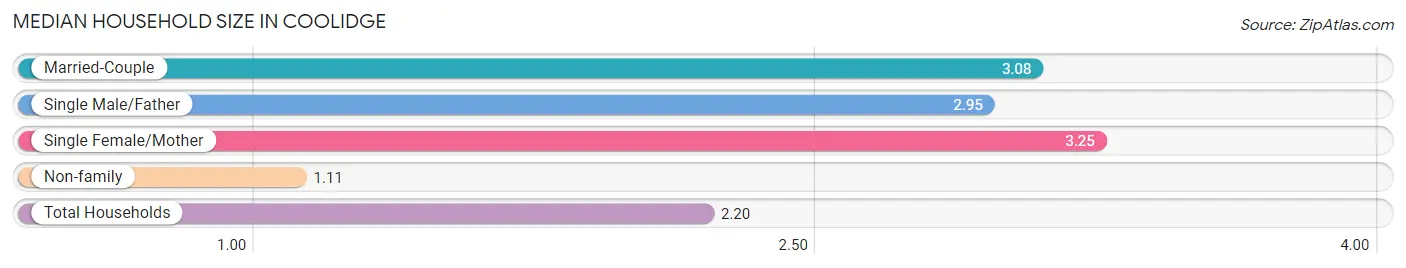
Median Household Size in Coolidge
The median household size in Coolidge is 2.20 persons per household, with single female/mother households (48 | 13.6%) accounting for the largest median household size of 3.25 persons per household. non-family households (161 | 45.6%) represent the smallest median household size with 1.11 persons per household.
| Household Type | # Households | Household Size |
| Married-Couple | 125 (35.4%) | 3.08 |
| Single Male/Father | 19 (5.4%) | 2.95 |
| Single Female/Mother | 48 (13.6%) | 3.25 |
| Non-family | 161 (45.6%) | 1.11 |
| Total Households | 353 (100.0%) | 2.20 |
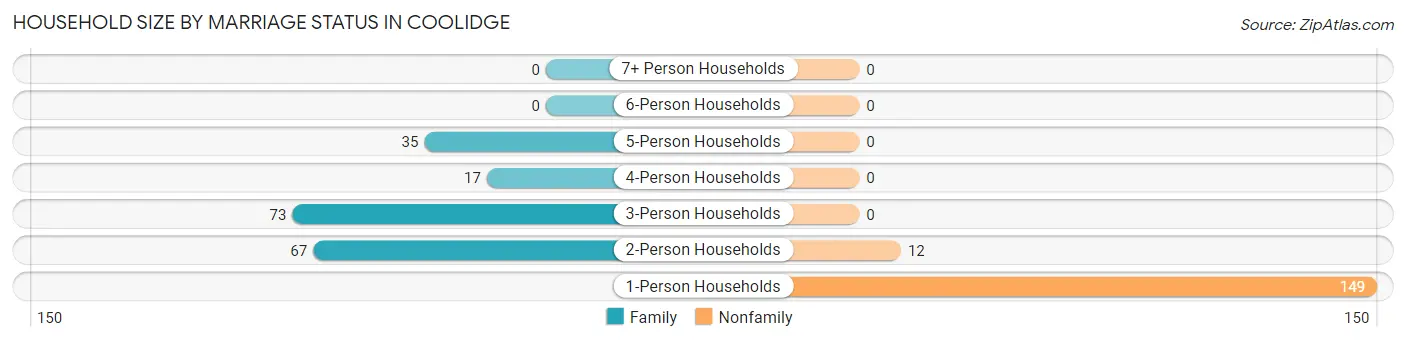
Household Size by Marriage Status in Coolidge
Out of a total of 353 households in Coolidge, 192 (54.4%) are family households, while 161 (45.6%) are nonfamily households. The most numerous type of family households are 3-person households, comprising 73, and the most common type of nonfamily households are 1-person households, comprising 149.
| Household Size | Family Households | Nonfamily Households |
| 1-Person Households | - | 149 (42.2%) |
| 2-Person Households | 67 (19.0%) | 12 (3.4%) |
| 3-Person Households | 73 (20.7%) | 0 (0.0%) |
| 4-Person Households | 17 (4.8%) | 0 (0.0%) |
| 5-Person Households | 35 (9.9%) | 0 (0.0%) |
| 6-Person Households | 0 (0.0%) | 0 (0.0%) |
| 7+ Person Households | 0 (0.0%) | 0 (0.0%) |
| Total | 192 (54.4%) | 161 (45.6%) |
Female Fertility in Coolidge
Fertility by Age in Coolidge
| Age Bracket | Women with Births | Births / 1,000 Women |
| 15 to 19 years | 0 (0.0%) | 0.0 |
| 20 to 34 years | 0 (0.0%) | 0.0 |
| 35 to 50 years | 0 (0.0%) | 0.0 |
| Total | 0 (0.0%) | 0.0 |
Fertility by Age by Marriage Status in Coolidge
| Age Bracket | Married | Unmarried |
| 15 to 19 years | 0 (0.0%) | 0 (0.0%) |
| 20 to 34 years | 0 (0.0%) | 0 (0.0%) |
| 35 to 50 years | 0 (0.0%) | 0 (0.0%) |
| Total | 0 (0.0%) | 0 (0.0%) |
Fertility by Education in Coolidge
| Educational Attainment | Women with Births | Births / 1,000 Women |
| Less than High School | 0 (0.0%) | 0.0 |
| High School Diploma | 0 (0.0%) | 0.0 |
| College or Associate's Degree | 0 (0.0%) | 0.0 |
| Bachelor's Degree | 0 (0.0%) | 0.0 |
| Graduate Degree | 0 (0.0%) | 0.0 |
| Total | 0 (0.0%) | 0.0 |
Fertility by Education by Marriage Status in Coolidge
| Educational Attainment | Married | Unmarried |
| Less than High School | 0 (0.0%) | 0 (0.0%) |
| High School Diploma | 0 (0.0%) | 0 (0.0%) |
| College or Associate's Degree | 0 (0.0%) | 0 (0.0%) |
| Bachelor's Degree | 0 (0.0%) | 0 (0.0%) |
| Graduate Degree | 0 (0.0%) | 0 (0.0%) |
| Total | 0 (0.0%) | 0 (0.0%) |
Income in Coolidge
Income Overview in Coolidge
Per Capita Income in Coolidge is $22,077, while median incomes of families and households are $38,939 and $38,750 respectively.
| Characteristic | Number | Measure |
| Per Capita Income | 775 | $22,077 |
| Median Family Income | 192 | $38,939 |
| Mean Family Income | 192 | $46,425 |
| Median Household Income | 353 | $38,750 |
| Mean Household Income | 353 | $47,042 |
| Income Deficit | 192 | $7,778 |
| Wage / Income Gap (%) | 775 | 62.51% |
| Wage / Income Gap ($) | 775 | 37.49¢ per $1 |
| Gini / Inequality Index | 775 | 0.37 |
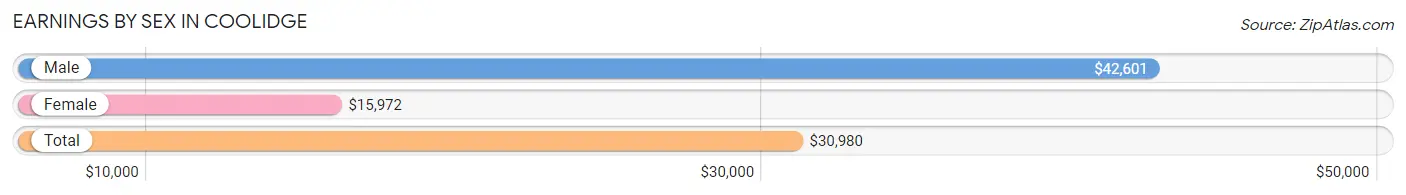
Earnings by Sex in Coolidge
Average Earnings in Coolidge are $30,980, $42,601 for men and $15,972 for women, a difference of 62.5%.
| Sex | Number | Average Earnings |
| Male | 255 (65.0%) | $42,601 |
| Female | 137 (34.9%) | $15,972 |
| Total | 392 (100.0%) | $30,980 |
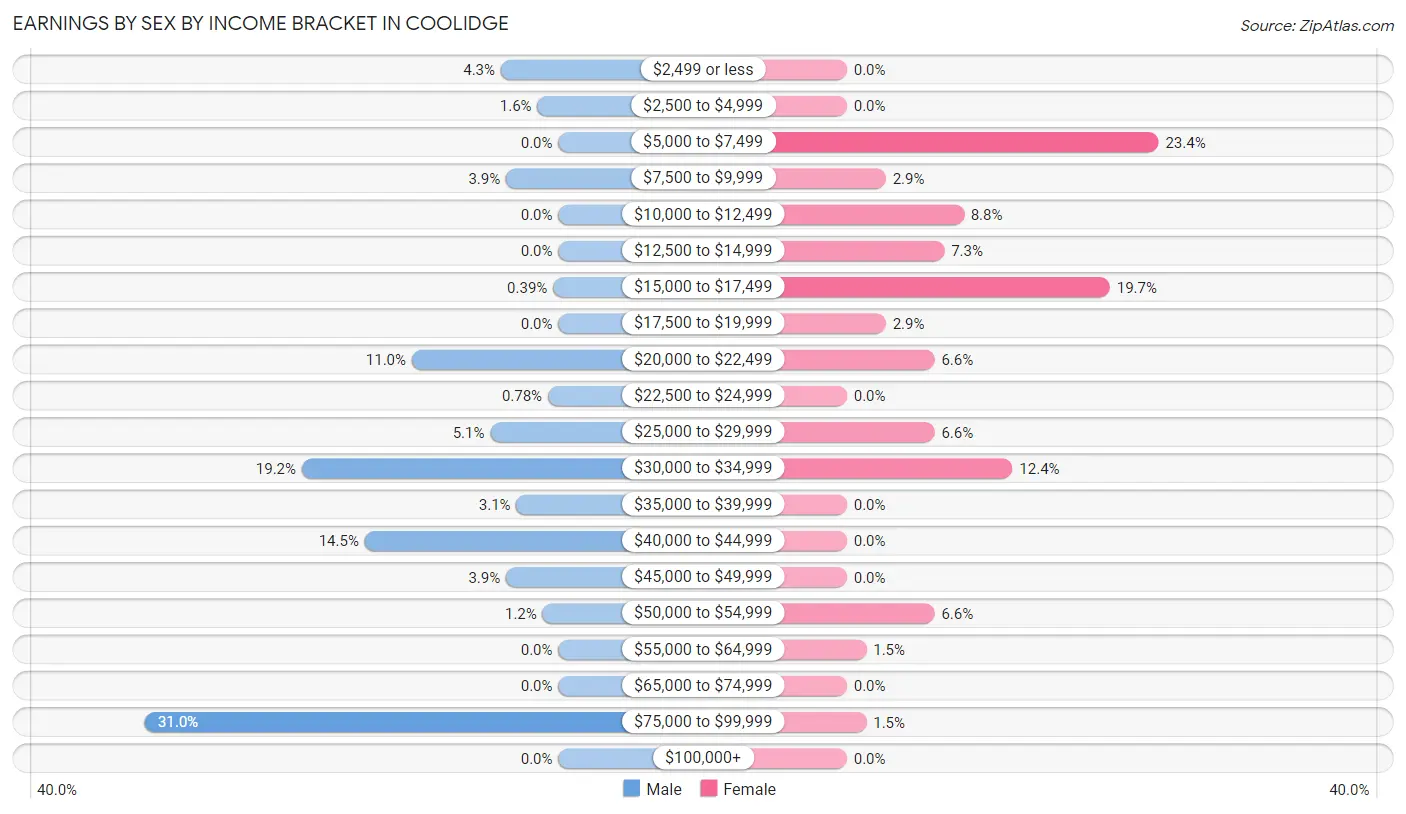
Earnings by Sex by Income Bracket in Coolidge
The most common earnings brackets in Coolidge are $75,000 to $99,999 for men (79 | 31.0%) and $5,000 to $7,499 for women (32 | 23.4%).
| Income | Male | Female |
| $2,499 or less | 11 (4.3%) | 0 (0.0%) |
| $2,500 to $4,999 | 4 (1.6%) | 0 (0.0%) |
| $5,000 to $7,499 | 0 (0.0%) | 32 (23.4%) |
| $7,500 to $9,999 | 10 (3.9%) | 4 (2.9%) |
| $10,000 to $12,499 | 0 (0.0%) | 12 (8.8%) |
| $12,500 to $14,999 | 0 (0.0%) | 10 (7.3%) |
| $15,000 to $17,499 | 1 (0.4%) | 27 (19.7%) |
| $17,500 to $19,999 | 0 (0.0%) | 4 (2.9%) |
| $20,000 to $22,499 | 28 (11.0%) | 9 (6.6%) |
| $22,500 to $24,999 | 2 (0.8%) | 0 (0.0%) |
| $25,000 to $29,999 | 13 (5.1%) | 9 (6.6%) |
| $30,000 to $34,999 | 49 (19.2%) | 17 (12.4%) |
| $35,000 to $39,999 | 8 (3.1%) | 0 (0.0%) |
| $40,000 to $44,999 | 37 (14.5%) | 0 (0.0%) |
| $45,000 to $49,999 | 10 (3.9%) | 0 (0.0%) |
| $50,000 to $54,999 | 3 (1.2%) | 9 (6.6%) |
| $55,000 to $64,999 | 0 (0.0%) | 2 (1.5%) |
| $65,000 to $74,999 | 0 (0.0%) | 0 (0.0%) |
| $75,000 to $99,999 | 79 (31.0%) | 2 (1.5%) |
| $100,000+ | 0 (0.0%) | 0 (0.0%) |
| Total | 255 (100.0%) | 137 (100.0%) |
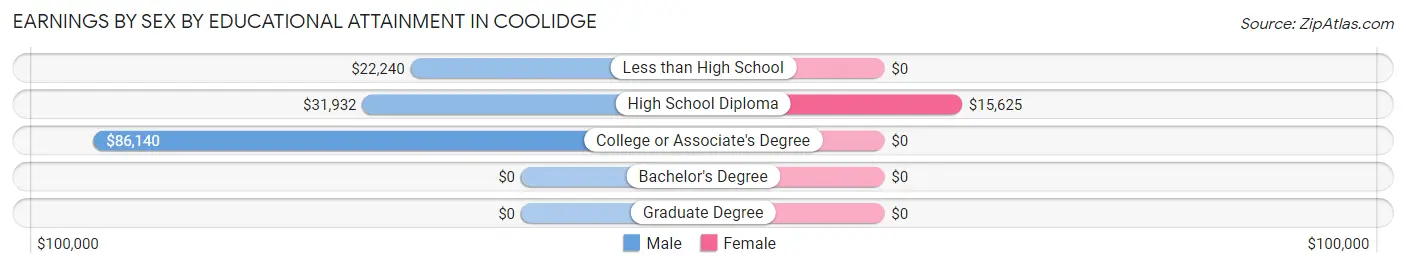
Earnings by Sex by Educational Attainment in Coolidge
Average earnings in Coolidge are $43,007 for men and $15,147 for women, a difference of 64.8%. Men with an educational attainment of college or associate's degree enjoy the highest average annual earnings of $86,140, while those with less than high school education earn the least with $22,240. Women with an educational attainment of high school diploma earn the most with the average annual earnings of $15,625, while those with high school diploma education have the smallest earnings of $15,625.
| Educational Attainment | Male Income | Female Income |
| Less than High School | $22,240 | $0 |
| High School Diploma | $31,932 | $15,625 |
| College or Associate's Degree | $86,140 | $0 |
| Bachelor's Degree | - | - |
| Graduate Degree | - | - |
| Total | $43,007 | $15,147 |
Family Income in Coolidge
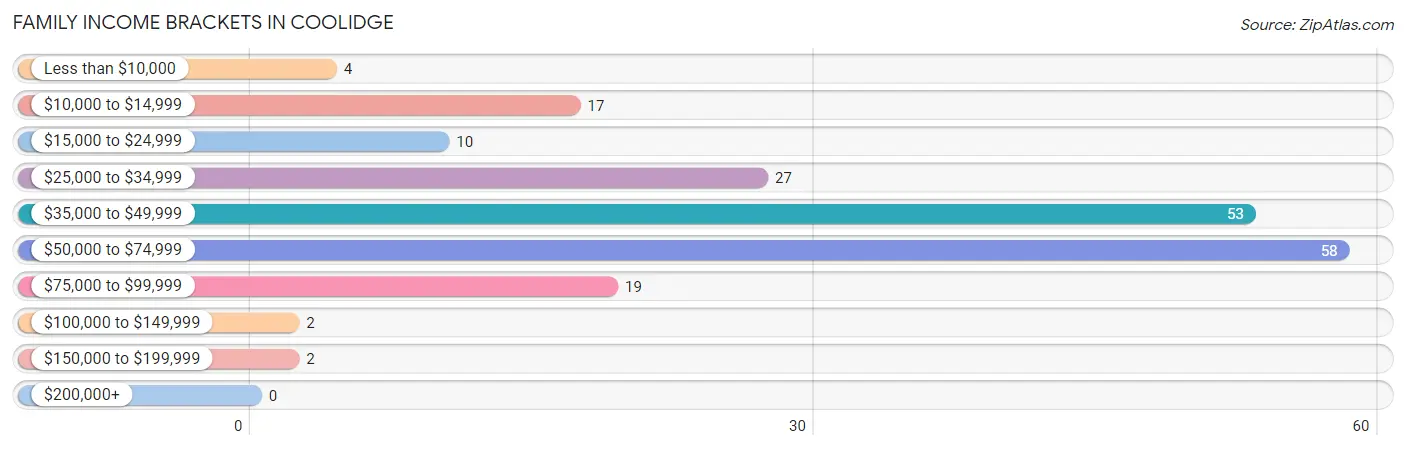
Family Income Brackets in Coolidge
According to the Coolidge family income data, there are 58 families falling into the $50,000 to $74,999 income range, which is the most common income bracket and makes up 30.2% of all families.
| Income Bracket | # Families | % Families |
| Less than $10,000 | 4 | 2.1% |
| $10,000 to $14,999 | 17 | 8.9% |
| $15,000 to $24,999 | 10 | 5.2% |
| $25,000 to $34,999 | 27 | 14.1% |
| $35,000 to $49,999 | 53 | 27.6% |
| $50,000 to $74,999 | 58 | 30.2% |
| $75,000 to $99,999 | 19 | 9.9% |
| $100,000 to $149,999 | 2 | 1.0% |
| $150,000 to $199,999 | 2 | 1.0% |
| $200,000+ | 0 | 0.0% |
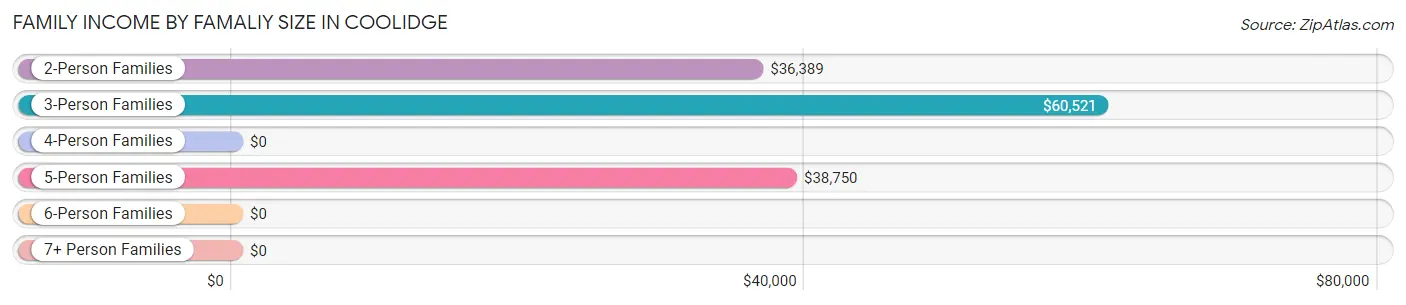
Family Income by Famaliy Size in Coolidge
3-person families (75 | 39.1%) account for the highest median family income in Coolidge with $60,521 per family, while 3-person families (75 | 39.1%) have the highest median income of $20,174 per family member.
| Income Bracket | # Families | Median Income |
| 2-Person Families | 74 (38.5%) | $36,389 |
| 3-Person Families | 75 (39.1%) | $60,521 |
| 4-Person Families | 8 (4.2%) | $0 |
| 5-Person Families | 35 (18.2%) | $38,750 |
| 6-Person Families | 0 (0.0%) | $0 |
| 7+ Person Families | 0 (0.0%) | $0 |
| Total | 192 (100.0%) | $38,939 |
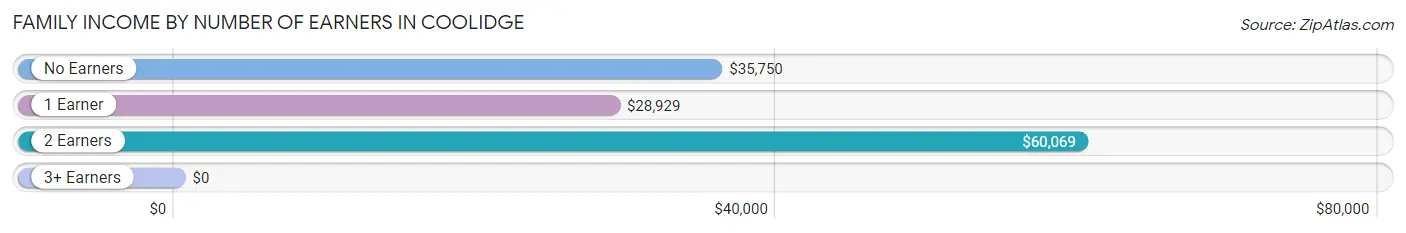
Family Income by Number of Earners in Coolidge
| Number of Earners | # Families | Median Income |
| No Earners | 28 (14.6%) | $35,750 |
| 1 Earner | 70 (36.5%) | $28,929 |
| 2 Earners | 94 (49.0%) | $60,069 |
| 3+ Earners | 0 (0.0%) | $0 |
| Total | 192 (100.0%) | $38,939 |
Household Income in Coolidge
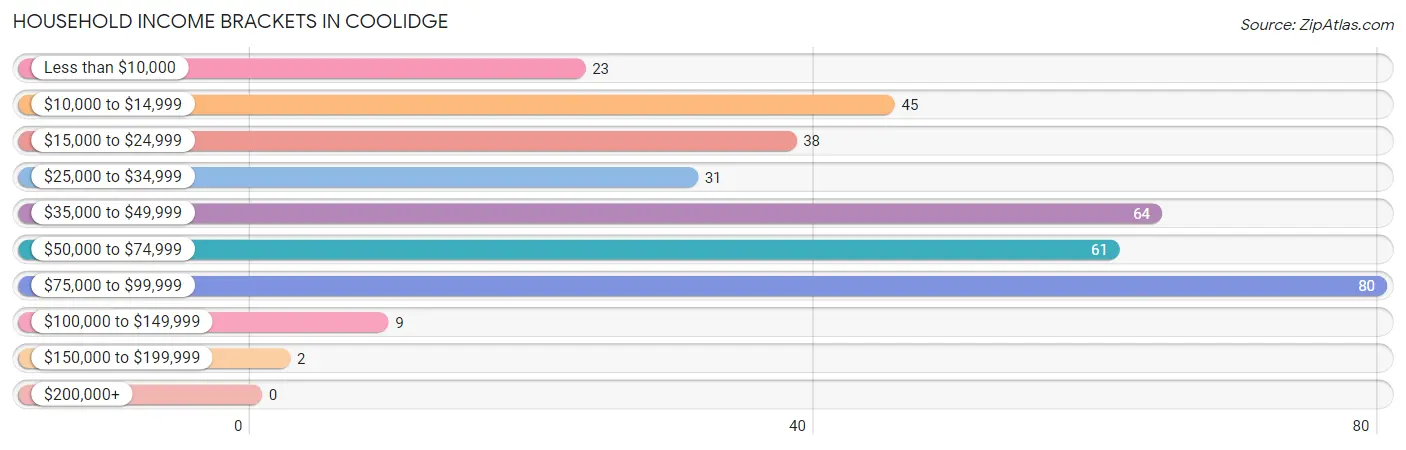
Household Income Brackets in Coolidge
With 80 households falling in the category, the $75,000 to $99,999 income range is the most frequent in Coolidge, accounting for 22.7% of all households.
| Income Bracket | # Households | % Households |
| Less than $10,000 | 23 | 6.5% |
| $10,000 to $14,999 | 45 | 12.7% |
| $15,000 to $24,999 | 38 | 10.8% |
| $25,000 to $34,999 | 31 | 8.8% |
| $35,000 to $49,999 | 64 | 18.1% |
| $50,000 to $74,999 | 61 | 17.3% |
| $75,000 to $99,999 | 80 | 22.7% |
| $100,000 to $149,999 | 9 | 2.5% |
| $150,000 to $199,999 | 2 | 0.6% |
| $200,000+ | 0 | 0.0% |
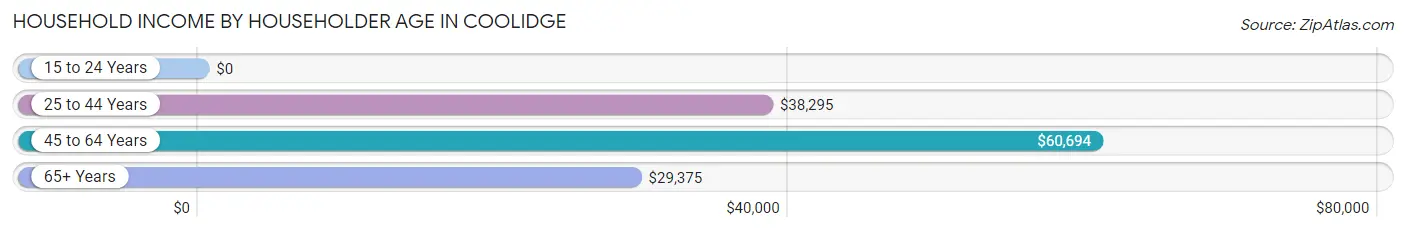
Household Income by Householder Age in Coolidge
The median household income in Coolidge is $38,750, with the highest median household income of $60,694 found in the 45 to 64 years age bracket for the primary householder. A total of 210 households (59.5%) fall into this category. Meanwhile, the 15 to 24 years age bracket for the primary householder has the lowest median household income of $0, with 3 households (0.9%) in this group.
| Income Bracket | # Households | Median Income |
| 15 to 24 Years | 3 (0.9%) | $0 |
| 25 to 44 Years | 81 (23.0%) | $38,295 |
| 45 to 64 Years | 210 (59.5%) | $60,694 |
| 65+ Years | 59 (16.7%) | $29,375 |
| Total | 353 (100.0%) | $38,750 |
Poverty in Coolidge
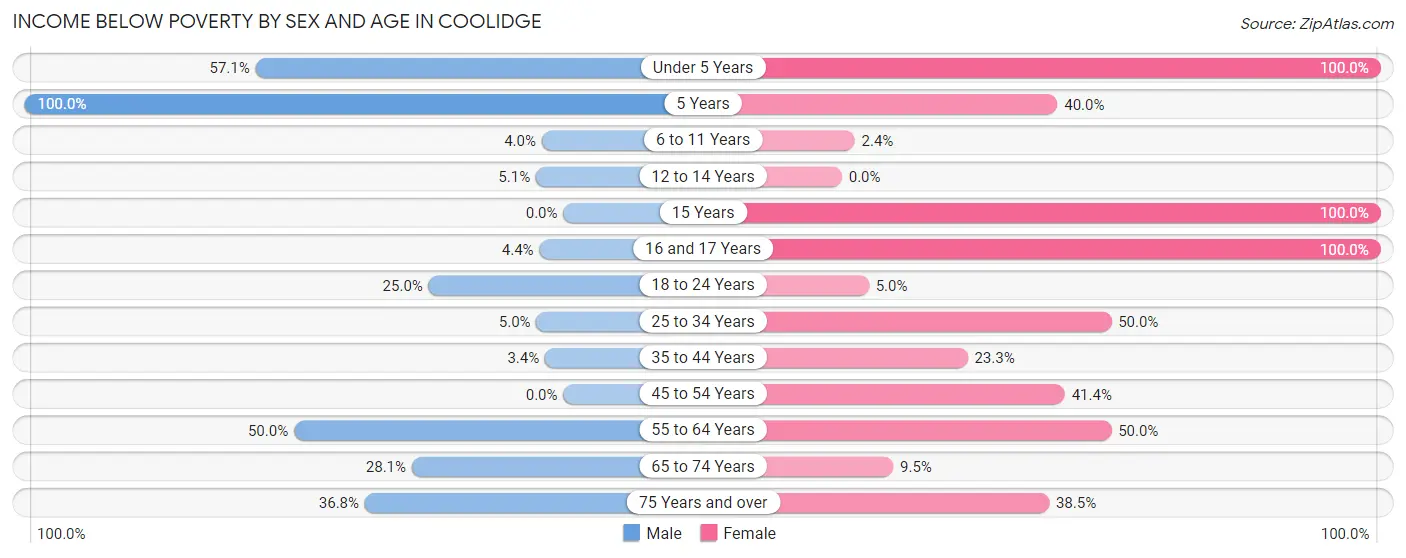
Income Below Poverty by Sex and Age in Coolidge
With 10.9% poverty level for males and 28.7% for females among the residents of Coolidge, 5 year old males and under 5 year old females are the most vulnerable to poverty, with 1 males (100.0%) and 1 females (100.0%) in their respective age groups living below the poverty level.
| Age Bracket | Male | Female |
| Under 5 Years | 4 (57.1%) | 1 (100.0%) |
| 5 Years | 1 (100.0%) | 2 (40.0%) |
| 6 to 11 Years | 1 (4.0%) | 1 (2.4%) |
| 12 to 14 Years | 3 (5.1%) | 0 (0.0%) |
| 15 Years | 0 (0.0%) | 12 (100.0%) |
| 16 and 17 Years | 2 (4.4%) | 3 (100.0%) |
| 18 to 24 Years | 3 (25.0%) | 1 (5.0%) |
| 25 to 34 Years | 1 (5.0%) | 5 (50.0%) |
| 35 to 44 Years | 2 (3.4%) | 14 (23.3%) |
| 45 to 54 Years | 0 (0.0%) | 24 (41.4%) |
| 55 to 64 Years | 11 (50.0%) | 14 (50.0%) |
| 65 to 74 Years | 9 (28.1%) | 4 (9.5%) |
| 75 Years and over | 14 (36.8%) | 5 (38.5%) |
| Total | 51 (10.9%) | 86 (28.7%) |
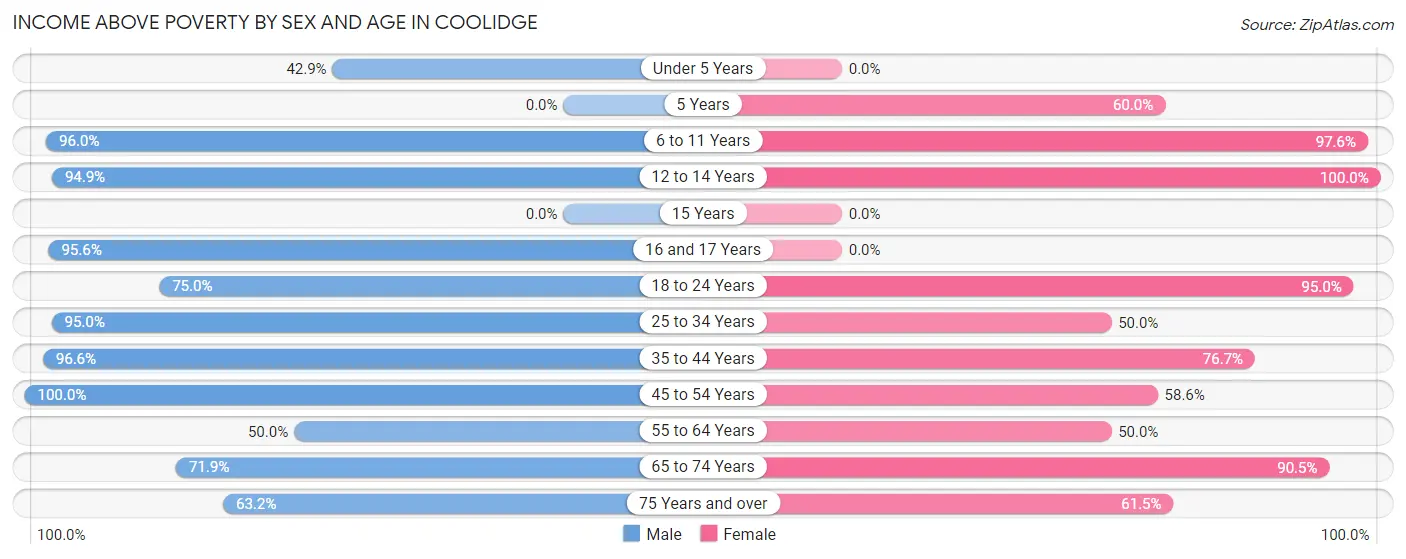
Income Above Poverty by Sex and Age in Coolidge
According to the poverty statistics in Coolidge, males aged 45 to 54 years and females aged 12 to 14 years are the age groups that are most secure financially, with 100.0% of males and 100.0% of females in these age groups living above the poverty line.
| Age Bracket | Male | Female |
| Under 5 Years | 3 (42.9%) | 0 (0.0%) |
| 5 Years | 0 (0.0%) | 3 (60.0%) |
| 6 to 11 Years | 24 (96.0%) | 41 (97.6%) |
| 12 to 14 Years | 56 (94.9%) | 6 (100.0%) |
| 15 Years | 0 (0.0%) | 0 (0.0%) |
| 16 and 17 Years | 43 (95.6%) | 0 (0.0%) |
| 18 to 24 Years | 9 (75.0%) | 19 (95.0%) |
| 25 to 34 Years | 19 (95.0%) | 5 (50.0%) |
| 35 to 44 Years | 57 (96.6%) | 46 (76.7%) |
| 45 to 54 Years | 147 (100.0%) | 34 (58.6%) |
| 55 to 64 Years | 11 (50.0%) | 14 (50.0%) |
| 65 to 74 Years | 23 (71.9%) | 38 (90.5%) |
| 75 Years and over | 24 (63.2%) | 8 (61.5%) |
| Total | 416 (89.1%) | 214 (71.3%) |
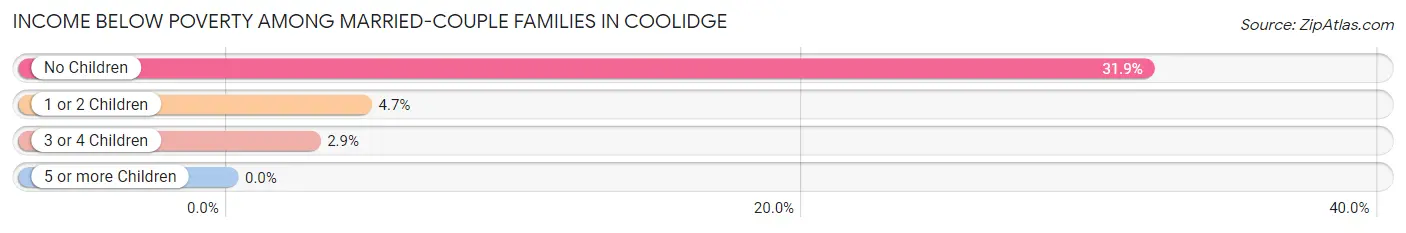
Income Below Poverty Among Married-Couple Families in Coolidge
The poverty statistics for married-couple families in Coolidge show that 14.4% or 18 of the total 125 families live below the poverty line. Families with no children have the highest poverty rate of 31.9%, comprising of 15 families. On the other hand, families with 3 or 4 children have the lowest poverty rate of 2.9%, which includes 1 families.
| Children | Above Poverty | Below Poverty |
| No Children | 32 (68.1%) | 15 (31.9%) |
| 1 or 2 Children | 41 (95.4%) | 2 (4.6%) |
| 3 or 4 Children | 34 (97.1%) | 1 (2.9%) |
| 5 or more Children | 0 (0.0%) | 0 (0.0%) |
| Total | 107 (85.6%) | 18 (14.4%) |
Income Below Poverty Among Single-Parent Households in Coolidge
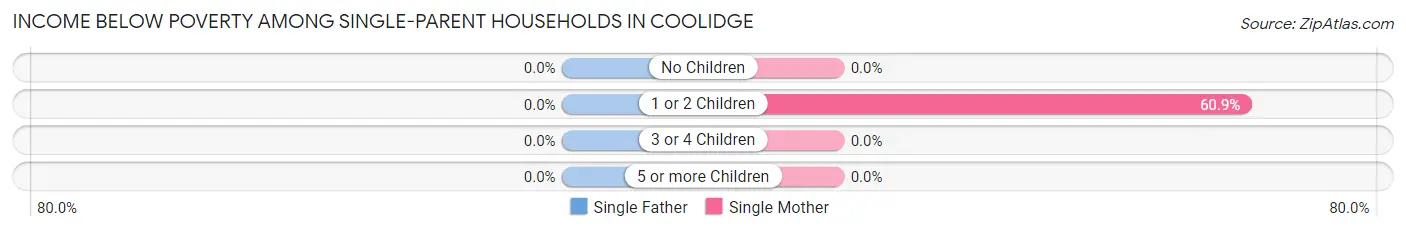
| Children | Single Father | Single Mother |
| No Children | 0 (0.0%) | 0 (0.0%) |
| 1 or 2 Children | 0 (0.0%) | 14 (60.9%) |
| 3 or 4 Children | 0 (0.0%) | 0 (0.0%) |
| 5 or more Children | 0 (0.0%) | 0 (0.0%) |
| Total | 0 (0.0%) | 14 (29.2%) |
Income Below Poverty Among Married-Couple vs Single-Parent Households in Coolidge
The poverty data for Coolidge shows that 18 of the married-couple family households (14.4%) and 14 of the single-parent households (20.9%) are living below the poverty level. Within the married-couple family households, those with no children have the highest poverty rate, with 15 households (31.9%) falling below the poverty line. Among the single-parent households, those with 1 or 2 children have the highest poverty rate, with 14 household (46.7%) living below poverty.
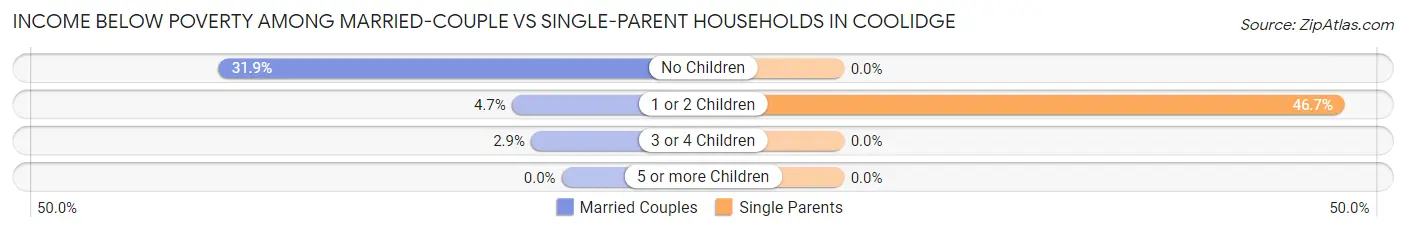
| Children | Married-Couple Families | Single-Parent Households |
| No Children | 15 (31.9%) | 0 (0.0%) |
| 1 or 2 Children | 2 (4.6%) | 14 (46.7%) |
| 3 or 4 Children | 1 (2.9%) | 0 (0.0%) |
| 5 or more Children | 0 (0.0%) | 0 (0.0%) |
| Total | 18 (14.4%) | 14 (20.9%) |
Employment Characteristics in Coolidge
Employment by Class of Employer in Coolidge
Among the 383 employed individuals in Coolidge, private company employees (291 | 76.0%), self-employed (incorporated) (53 | 13.8%), and self-employed (not incorporated) (25 | 6.5%) make up the most common classes of employment.
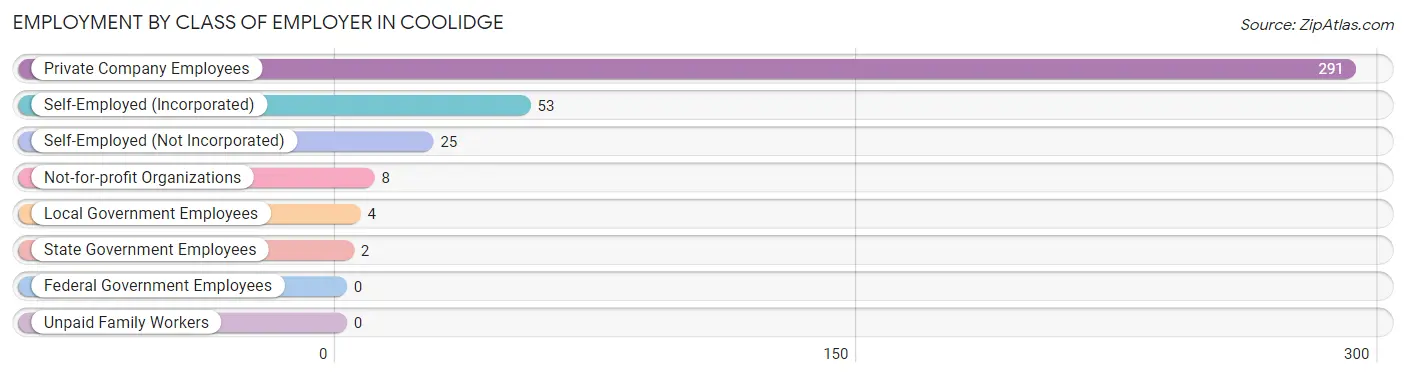
| Employer Class | # Employees | % Employees |
| Private Company Employees | 291 | 76.0% |
| Self-Employed (Incorporated) | 53 | 13.8% |
| Self-Employed (Not Incorporated) | 25 | 6.5% |
| Not-for-profit Organizations | 8 | 2.1% |
| Local Government Employees | 4 | 1.0% |
| State Government Employees | 2 | 0.5% |
| Federal Government Employees | 0 | 0.0% |
| Unpaid Family Workers | 0 | 0.0% |
| Total | 383 | 100.0% |
Employment Status by Age in Coolidge
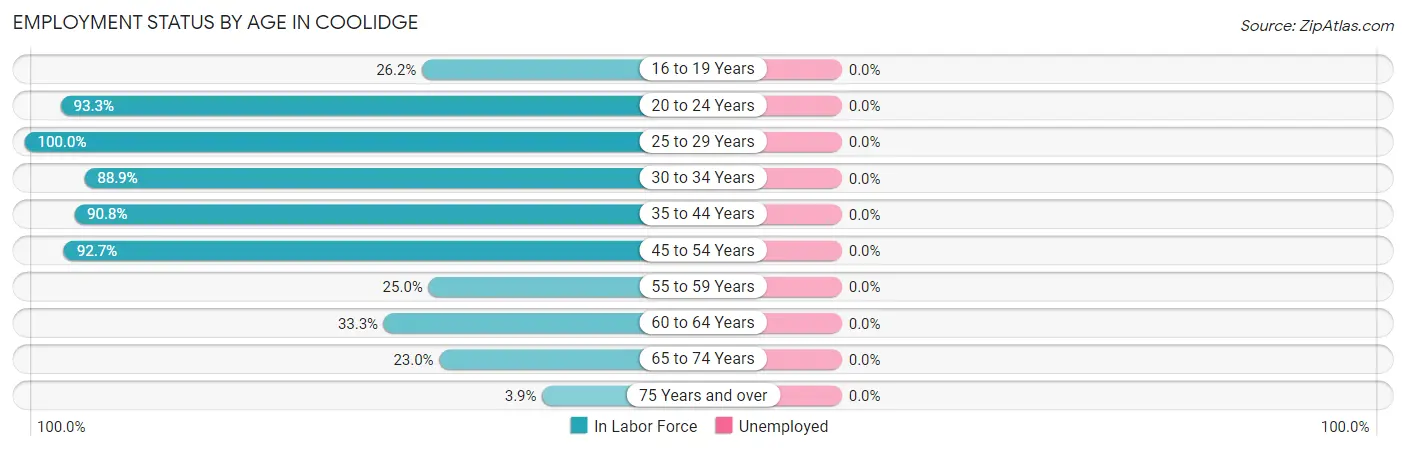
| Age Bracket | In Labor Force | Unemployed |
| 16 to 19 Years | 17 (26.2%) | 0 (0.0%) |
| 20 to 24 Years | 14 (93.3%) | 0 (0.0%) |
| 25 to 29 Years | 21 (100.0%) | 0 (0.0%) |
| 30 to 34 Years | 8 (88.9%) | 0 (0.0%) |
| 35 to 44 Years | 108 (90.8%) | 0 (0.0%) |
| 45 to 54 Years | 190 (92.7%) | 0 (0.0%) |
| 55 to 59 Years | 5 (25.0%) | 0 (0.0%) |
| 60 to 64 Years | 10 (33.3%) | 0 (0.0%) |
| 65 to 74 Years | 17 (23.0%) | 0 (0.0%) |
| 75 Years and over | 2 (3.9%) | 0 (0.0%) |
| Total | 392 (64.4%) | 0 (0.0%) |
Employment Status by Educational Attainment in Coolidge
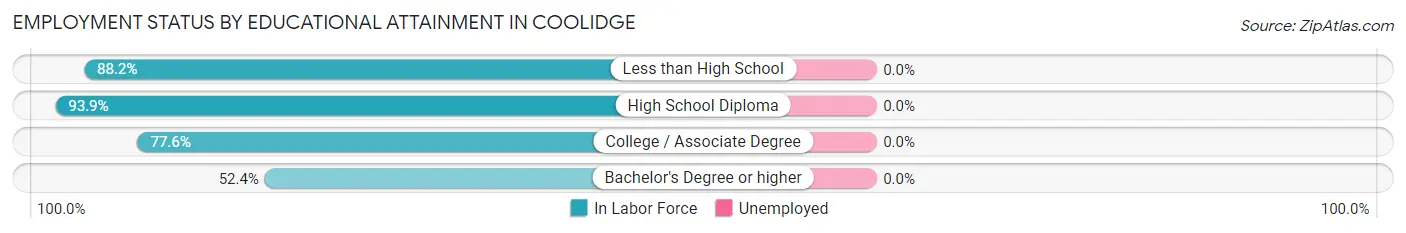
| Educational Attainment | In Labor Force | Unemployed |
| Less than High School | 82 (88.2%) | 0 (0.0%) |
| High School Diploma | 138 (93.9%) | 0 (0.0%) |
| College / Associate Degree | 111 (77.6%) | 0 (0.0%) |
| Bachelor's Degree or higher | 11 (52.4%) | 0 (0.0%) |
| Total | 342 (84.7%) | 0 (0.0%) |
Employment Occupations by Sex in Coolidge
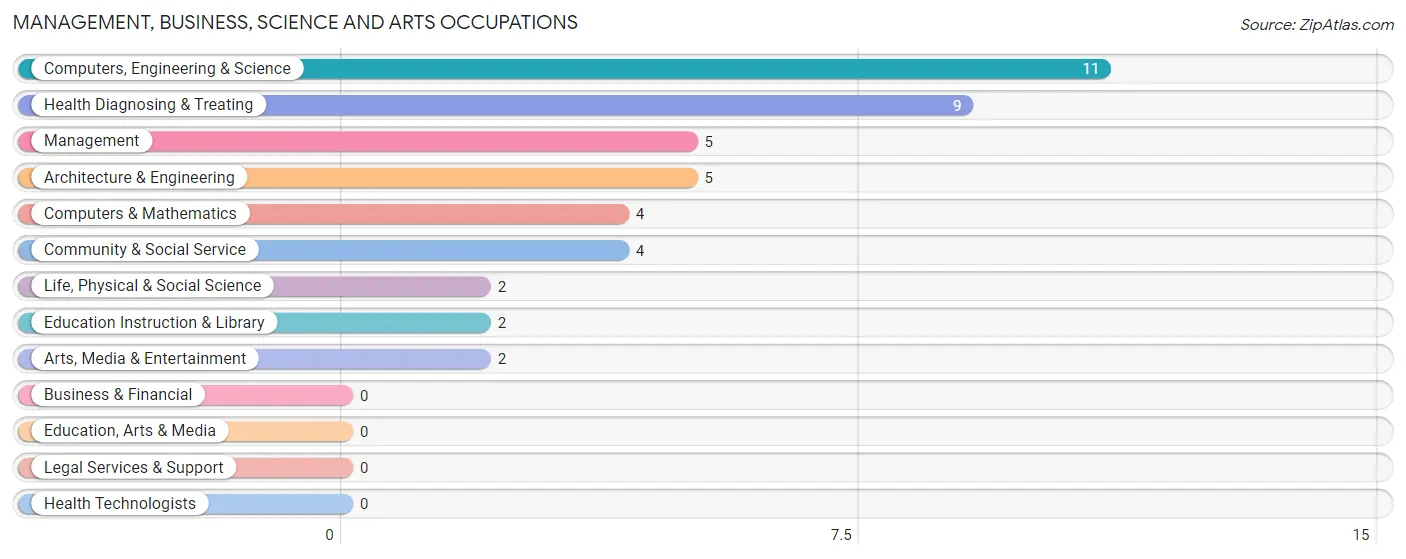
Management, Business, Science and Arts Occupations
The most common Management, Business, Science and Arts occupations in Coolidge are Computers, Engineering & Science (11 | 2.8%), Health Diagnosing & Treating (9 | 2.3%), Management (5 | 1.3%), Architecture & Engineering (5 | 1.3%), and Computers & Mathematics (4 | 1.0%).
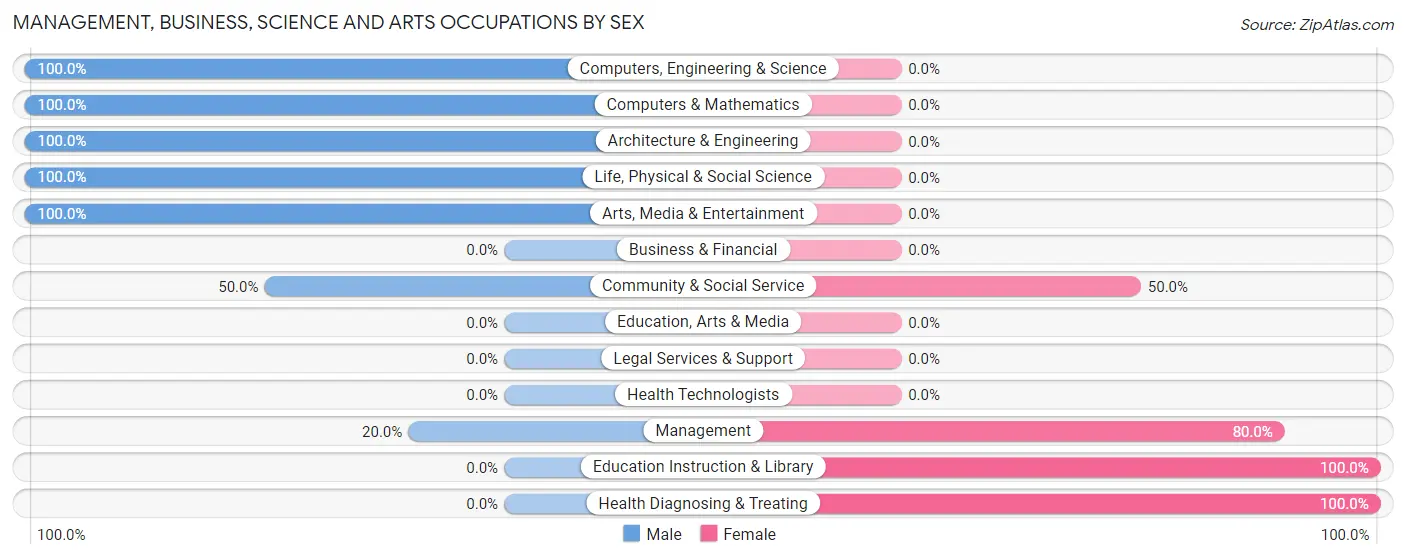
Management, Business, Science and Arts Occupations by Sex
Within the Management, Business, Science and Arts occupations in Coolidge, the most male-oriented occupations are Computers, Engineering & Science (100.0%), Computers & Mathematics (100.0%), and Architecture & Engineering (100.0%), while the most female-oriented occupations are Education Instruction & Library (100.0%), Health Diagnosing & Treating (100.0%), and Management (80.0%).
| Occupation | Male | Female |
| Management | 1 (20.0%) | 4 (80.0%) |
| Business & Financial | 0 (0.0%) | 0 (0.0%) |
| Computers, Engineering & Science | 11 (100.0%) | 0 (0.0%) |
| Computers & Mathematics | 4 (100.0%) | 0 (0.0%) |
| Architecture & Engineering | 5 (100.0%) | 0 (0.0%) |
| Life, Physical & Social Science | 2 (100.0%) | 0 (0.0%) |
| Community & Social Service | 2 (50.0%) | 2 (50.0%) |
| Education, Arts & Media | 0 (0.0%) | 0 (0.0%) |
| Legal Services & Support | 0 (0.0%) | 0 (0.0%) |
| Education Instruction & Library | 0 (0.0%) | 2 (100.0%) |
| Arts, Media & Entertainment | 2 (100.0%) | 0 (0.0%) |
| Health Diagnosing & Treating | 0 (0.0%) | 9 (100.0%) |
| Health Technologists | 0 (0.0%) | 0 (0.0%) |
| Total (Category) | 14 (48.3%) | 15 (51.7%) |
| Total (Overall) | 255 (65.0%) | 137 (34.9%) |
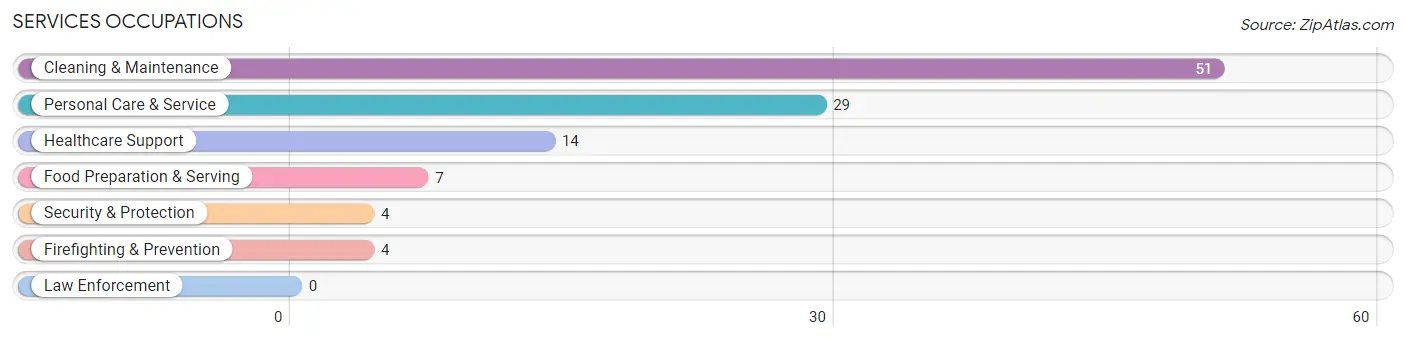
Services Occupations
The most common Services occupations in Coolidge are Cleaning & Maintenance (51 | 13.0%), Personal Care & Service (29 | 7.4%), Healthcare Support (14 | 3.6%), Food Preparation & Serving (7 | 1.8%), and Security & Protection (4 | 1.0%).
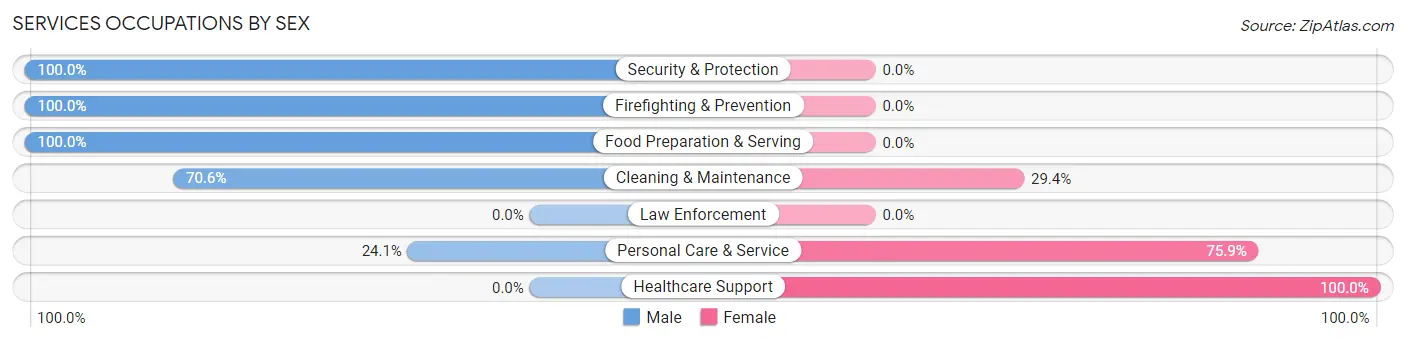
Services Occupations by Sex
Within the Services occupations in Coolidge, the most male-oriented occupations are Security & Protection (100.0%), Firefighting & Prevention (100.0%), and Food Preparation & Serving (100.0%), while the most female-oriented occupations are Healthcare Support (100.0%), Personal Care & Service (75.9%), and Cleaning & Maintenance (29.4%).
| Occupation | Male | Female |
| Healthcare Support | 0 (0.0%) | 14 (100.0%) |
| Security & Protection | 4 (100.0%) | 0 (0.0%) |
| Firefighting & Prevention | 4 (100.0%) | 0 (0.0%) |
| Law Enforcement | 0 (0.0%) | 0 (0.0%) |
| Food Preparation & Serving | 7 (100.0%) | 0 (0.0%) |
| Cleaning & Maintenance | 36 (70.6%) | 15 (29.4%) |
| Personal Care & Service | 7 (24.1%) | 22 (75.9%) |
| Total (Category) | 54 (51.4%) | 51 (48.6%) |
| Total (Overall) | 255 (65.0%) | 137 (34.9%) |
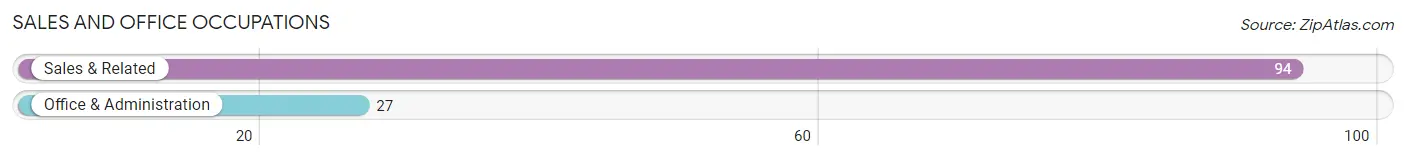
Sales and Office Occupations
The most common Sales and Office occupations in Coolidge are Sales & Related (94 | 24.0%), and Office & Administration (27 | 6.9%).
Sales and Office Occupations by Sex
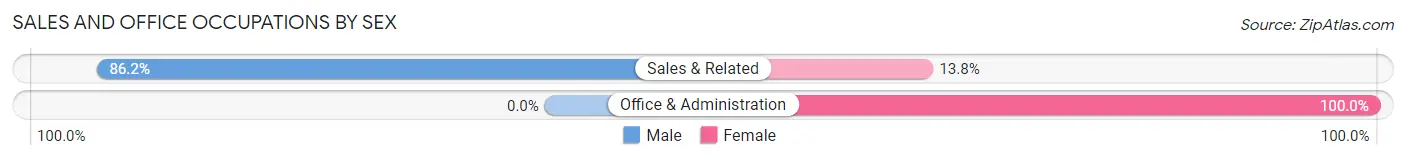
| Occupation | Male | Female |
| Sales & Related | 81 (86.2%) | 13 (13.8%) |
| Office & Administration | 0 (0.0%) | 27 (100.0%) |
| Total (Category) | 81 (66.9%) | 40 (33.1%) |
| Total (Overall) | 255 (65.0%) | 137 (34.9%) |
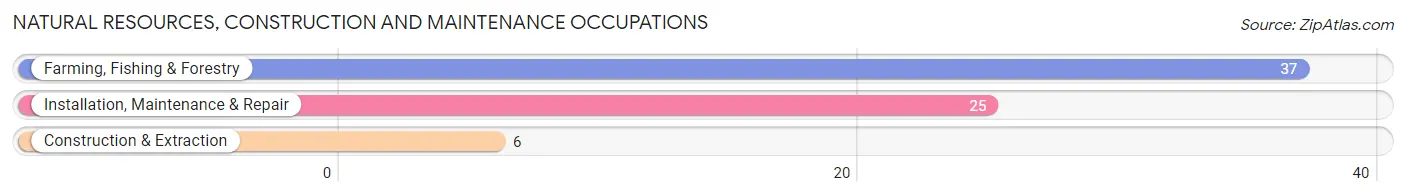
Natural Resources, Construction and Maintenance Occupations
The most common Natural Resources, Construction and Maintenance occupations in Coolidge are Farming, Fishing & Forestry (37 | 9.4%), Installation, Maintenance & Repair (25 | 6.4%), and Construction & Extraction (6 | 1.5%).
Natural Resources, Construction and Maintenance Occupations by Sex
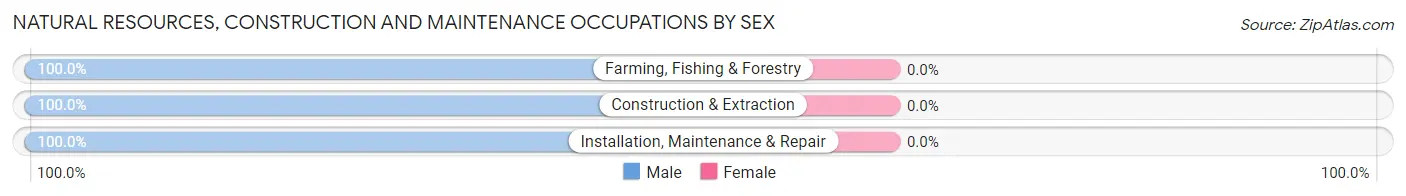
| Occupation | Male | Female |
| Farming, Fishing & Forestry | 37 (100.0%) | 0 (0.0%) |
| Construction & Extraction | 6 (100.0%) | 0 (0.0%) |
| Installation, Maintenance & Repair | 25 (100.0%) | 0 (0.0%) |
| Total (Category) | 68 (100.0%) | 0 (0.0%) |
| Total (Overall) | 255 (65.0%) | 137 (34.9%) |
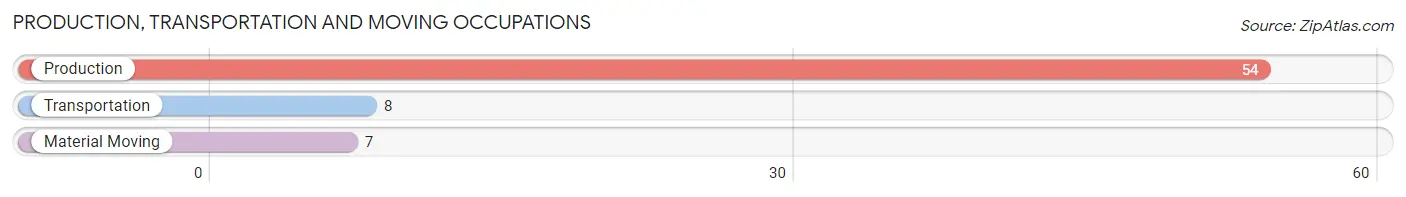
Production, Transportation and Moving Occupations
The most common Production, Transportation and Moving occupations in Coolidge are Production (54 | 13.8%), Transportation (8 | 2.0%), and Material Moving (7 | 1.8%).
Production, Transportation and Moving Occupations by Sex
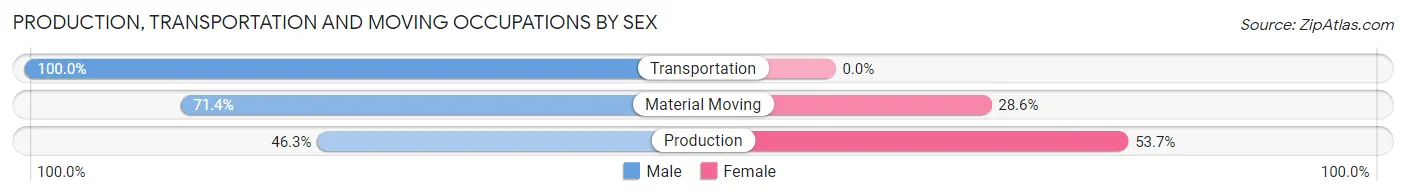
| Occupation | Male | Female |
| Production | 25 (46.3%) | 29 (53.7%) |
| Transportation | 8 (100.0%) | 0 (0.0%) |
| Material Moving | 5 (71.4%) | 2 (28.6%) |
| Total (Category) | 38 (55.1%) | 31 (44.9%) |
| Total (Overall) | 255 (65.0%) | 137 (34.9%) |
Employment Industries by Sex in Coolidge
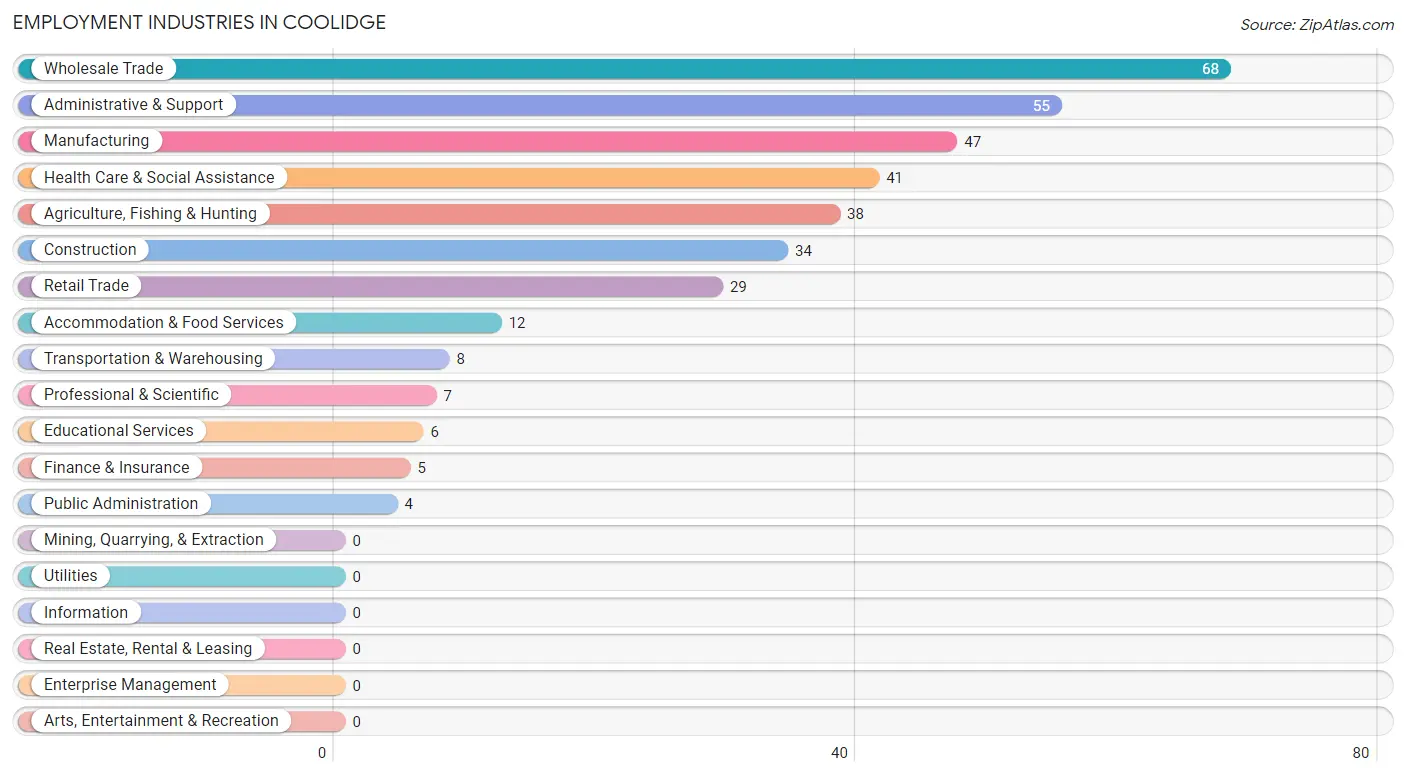
Employment Industries in Coolidge
The major employment industries in Coolidge include Wholesale Trade (68 | 17.3%), Administrative & Support (55 | 14.0%), Manufacturing (47 | 12.0%), Health Care & Social Assistance (41 | 10.5%), and Agriculture, Fishing & Hunting (38 | 9.7%).
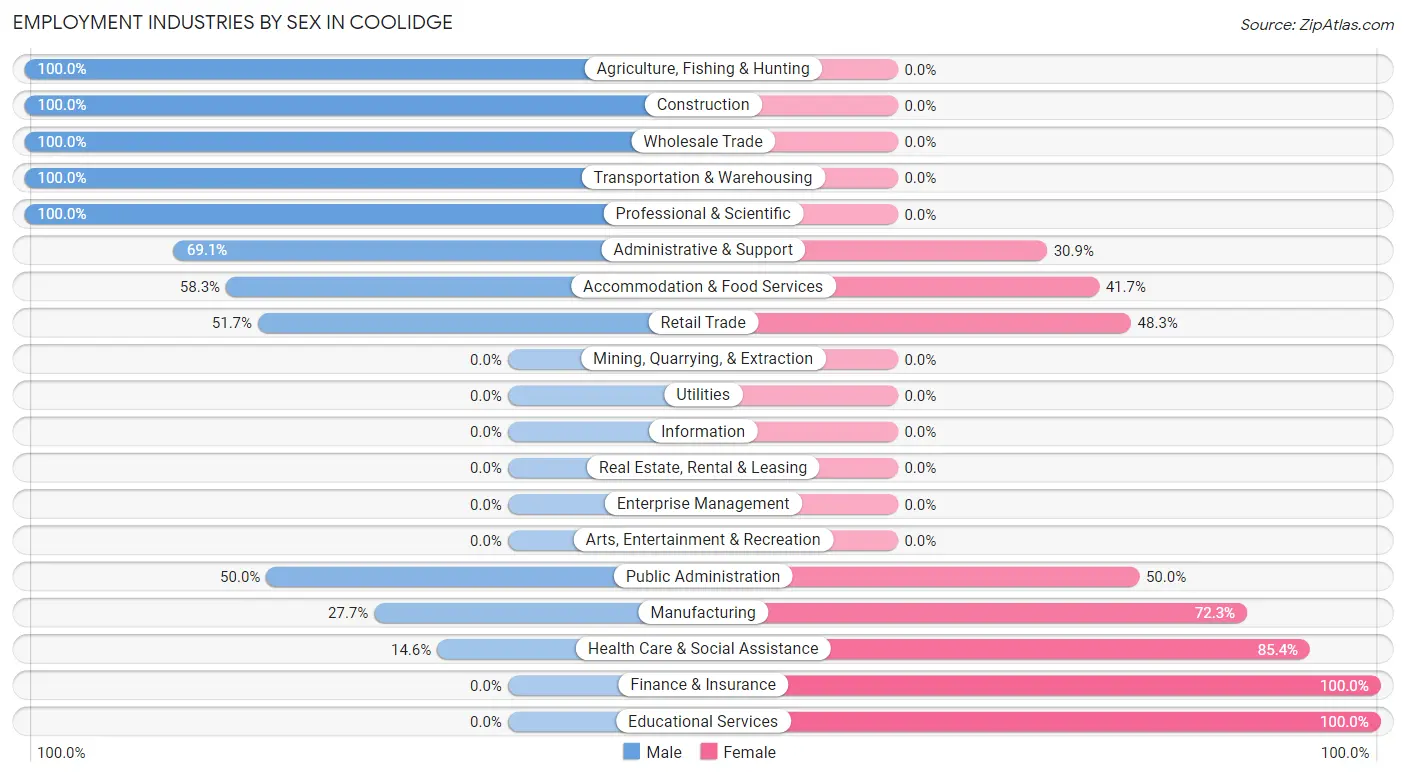
Employment Industries by Sex in Coolidge
The Coolidge industries that see more men than women are Agriculture, Fishing & Hunting (100.0%), Construction (100.0%), and Wholesale Trade (100.0%), whereas the industries that tend to have a higher number of women are Finance & Insurance (100.0%), Educational Services (100.0%), and Health Care & Social Assistance (85.4%).
| Industry | Male | Female |
| Agriculture, Fishing & Hunting | 38 (100.0%) | 0 (0.0%) |
| Mining, Quarrying, & Extraction | 0 (0.0%) | 0 (0.0%) |
| Construction | 34 (100.0%) | 0 (0.0%) |
| Manufacturing | 13 (27.7%) | 34 (72.3%) |
| Wholesale Trade | 68 (100.0%) | 0 (0.0%) |
| Retail Trade | 15 (51.7%) | 14 (48.3%) |
| Transportation & Warehousing | 8 (100.0%) | 0 (0.0%) |
| Utilities | 0 (0.0%) | 0 (0.0%) |
| Information | 0 (0.0%) | 0 (0.0%) |
| Finance & Insurance | 0 (0.0%) | 5 (100.0%) |
| Real Estate, Rental & Leasing | 0 (0.0%) | 0 (0.0%) |
| Professional & Scientific | 7 (100.0%) | 0 (0.0%) |
| Enterprise Management | 0 (0.0%) | 0 (0.0%) |
| Administrative & Support | 38 (69.1%) | 17 (30.9%) |
| Educational Services | 0 (0.0%) | 6 (100.0%) |
| Health Care & Social Assistance | 6 (14.6%) | 35 (85.4%) |
| Arts, Entertainment & Recreation | 0 (0.0%) | 0 (0.0%) |
| Accommodation & Food Services | 7 (58.3%) | 5 (41.7%) |
| Public Administration | 2 (50.0%) | 2 (50.0%) |
| Total | 255 (65.0%) | 137 (34.9%) |
Education in Coolidge
School Enrollment in Coolidge
The most common levels of schooling among the 233 students in Coolidge are middle school (70 | 30.0%), elementary school (59 | 25.3%), and high school (56 | 24.0%).
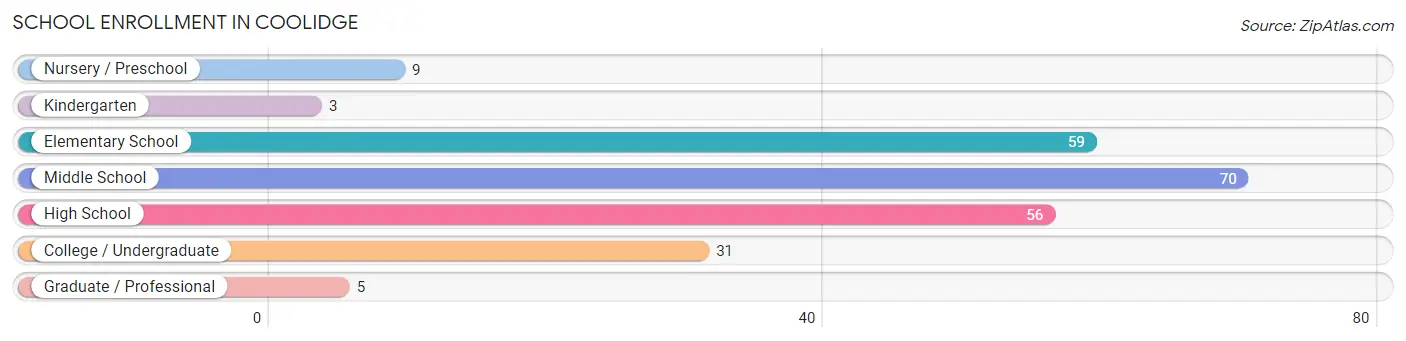
| School Level | # Students | % Students |
| Nursery / Preschool | 9 | 3.9% |
| Kindergarten | 3 | 1.3% |
| Elementary School | 59 | 25.3% |
| Middle School | 70 | 30.0% |
| High School | 56 | 24.0% |
| College / Undergraduate | 31 | 13.3% |
| Graduate / Professional | 5 | 2.1% |
| Total | 233 | 100.0% |
School Enrollment by Age by Funding Source in Coolidge
Out of a total of 233 students who are enrolled in schools in Coolidge, 2 (0.9%) attend a private institution, while the remaining 231 (99.1%) are enrolled in public schools. The age group of 3 to 4 year olds has the highest likelihood of being enrolled in private schools, with 2 (33.3% in the age bracket) enrolled. Conversely, the age group of 5 to 9 year old has the lowest likelihood of being enrolled in a private school, with 57 (100.0% in the age bracket) attending a public institution.
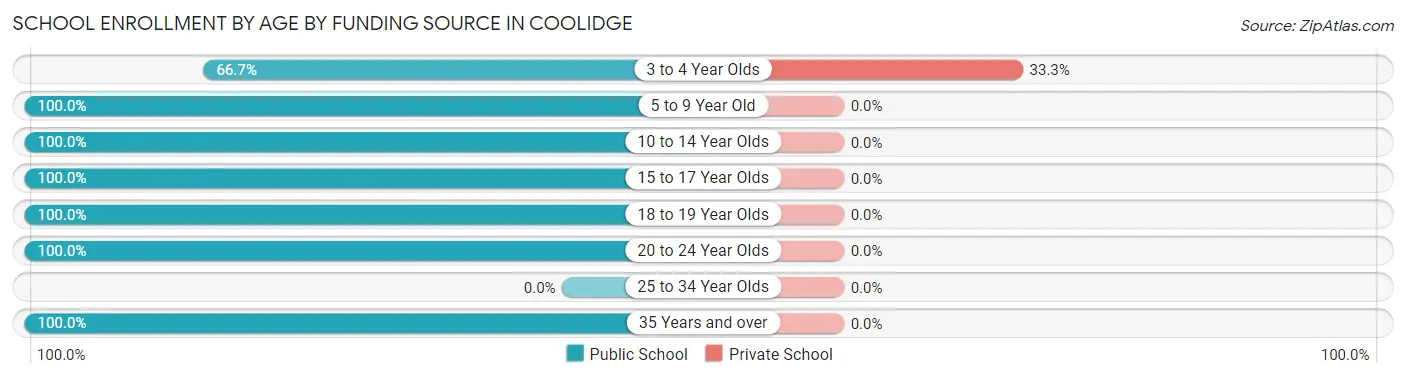
| Age Bracket | Public School | Private School |
| 3 to 4 Year Olds | 4 (66.7%) | 2 (33.3%) |
| 5 to 9 Year Old | 57 (100.0%) | 0 (0.0%) |
| 10 to 14 Year Olds | 78 (100.0%) | 0 (0.0%) |
| 15 to 17 Year Olds | 56 (100.0%) | 0 (0.0%) |
| 18 to 19 Year Olds | 17 (100.0%) | 0 (0.0%) |
| 20 to 24 Year Olds | 9 (100.0%) | 0 (0.0%) |
| 25 to 34 Year Olds | 0 (0.0%) | 0 (0.0%) |
| 35 Years and over | 10 (100.0%) | 0 (0.0%) |
| Total | 231 (99.1%) | 2 (0.9%) |
Educational Attainment by Field of Study in Coolidge
Literature & languages (8 | 26.7%), business (7 | 23.3%), arts & humanities (7 | 23.3%), education (6 | 20.0%), and liberal arts & history (2 | 6.7%) are the most common fields of study among 30 individuals in Coolidge who have obtained a bachelor's degree or higher.
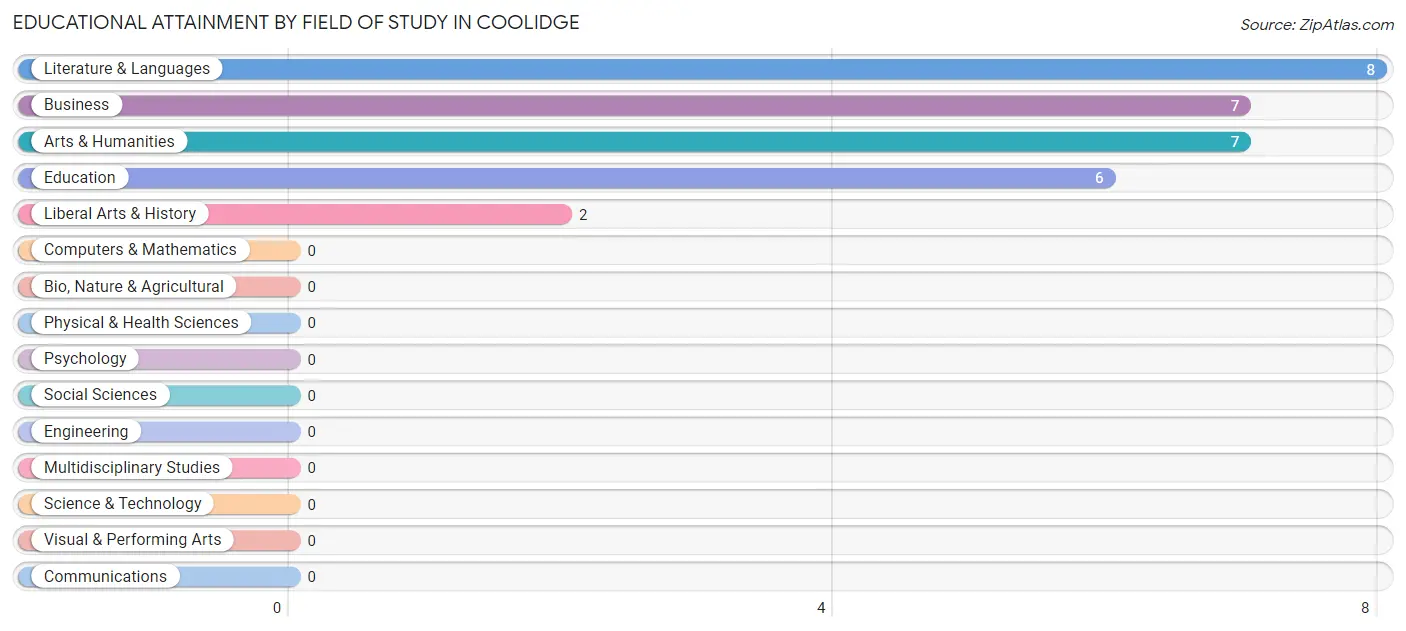
| Field of Study | # Graduates | % Graduates |
| Computers & Mathematics | 0 | 0.0% |
| Bio, Nature & Agricultural | 0 | 0.0% |
| Physical & Health Sciences | 0 | 0.0% |
| Psychology | 0 | 0.0% |
| Social Sciences | 0 | 0.0% |
| Engineering | 0 | 0.0% |
| Multidisciplinary Studies | 0 | 0.0% |
| Science & Technology | 0 | 0.0% |
| Business | 7 | 23.3% |
| Education | 6 | 20.0% |
| Literature & Languages | 8 | 26.7% |
| Liberal Arts & History | 2 | 6.7% |
| Visual & Performing Arts | 0 | 0.0% |
| Communications | 0 | 0.0% |
| Arts & Humanities | 7 | 23.3% |
| Total | 30 | 100.0% |
Transportation & Commute in Coolidge
Vehicle Availability by Sex in Coolidge
The most prevalent vehicle ownership categories in Coolidge are males with 2 vehicles (155, accounting for 60.8%) and females with 2 vehicles (66, making up 121.1%).
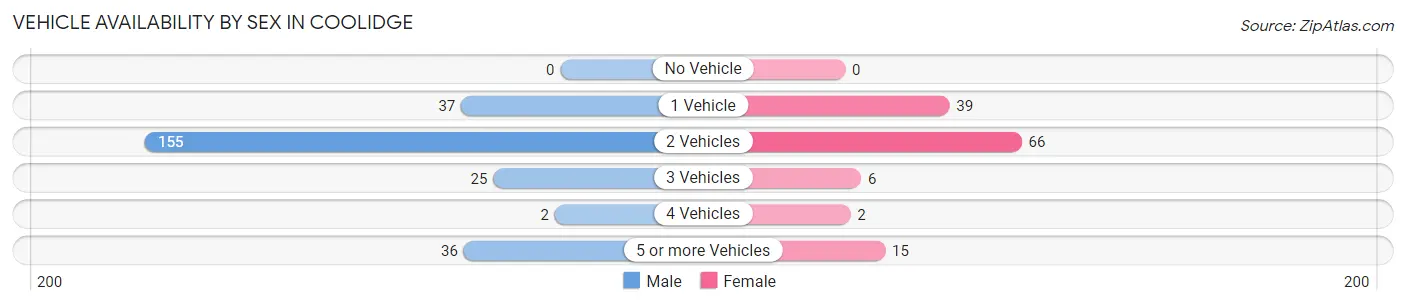
| Vehicles Available | Male | Female |
| No Vehicle | 0 (0.0%) | 0 (0.0%) |
| 1 Vehicle | 37 (14.5%) | 39 (30.5%) |
| 2 Vehicles | 155 (60.8%) | 66 (51.6%) |
| 3 Vehicles | 25 (9.8%) | 6 (4.7%) |
| 4 Vehicles | 2 (0.8%) | 2 (1.6%) |
| 5 or more Vehicles | 36 (14.1%) | 15 (11.7%) |
| Total | 255 (100.0%) | 128 (100.0%) |
Commute Time in Coolidge
The most frequently occuring commute durations in Coolidge are 30 to 34 minutes (88 commuters, 24.4%), less than 5 minutes (65 commuters, 18.0%), and 25 to 29 minutes (49 commuters, 13.6%).
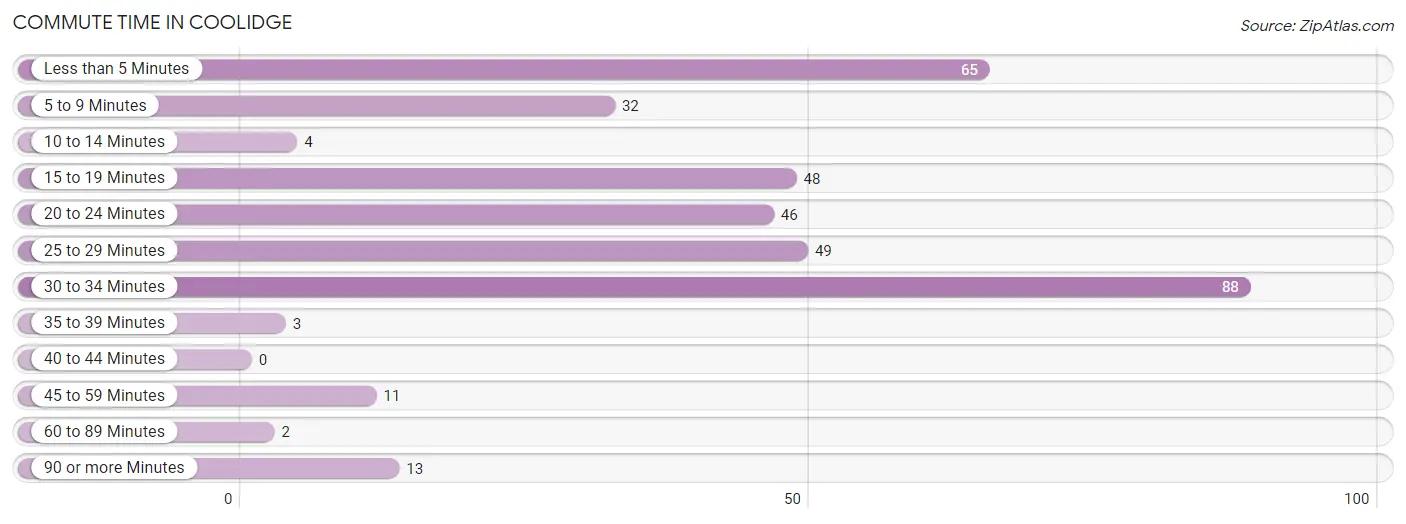
| Commute Time | # Commuters | % Commuters |
| Less than 5 Minutes | 65 | 18.0% |
| 5 to 9 Minutes | 32 | 8.9% |
| 10 to 14 Minutes | 4 | 1.1% |
| 15 to 19 Minutes | 48 | 13.3% |
| 20 to 24 Minutes | 46 | 12.7% |
| 25 to 29 Minutes | 49 | 13.6% |
| 30 to 34 Minutes | 88 | 24.4% |
| 35 to 39 Minutes | 3 | 0.8% |
| 40 to 44 Minutes | 0 | 0.0% |
| 45 to 59 Minutes | 11 | 3.0% |
| 60 to 89 Minutes | 2 | 0.5% |
| 90 or more Minutes | 13 | 3.6% |
Commute Time by Sex in Coolidge
The most common commute times in Coolidge are 30 to 34 minutes (75 commuters, 29.8%) for males and less than 5 minutes (31 commuters, 28.4%) for females.
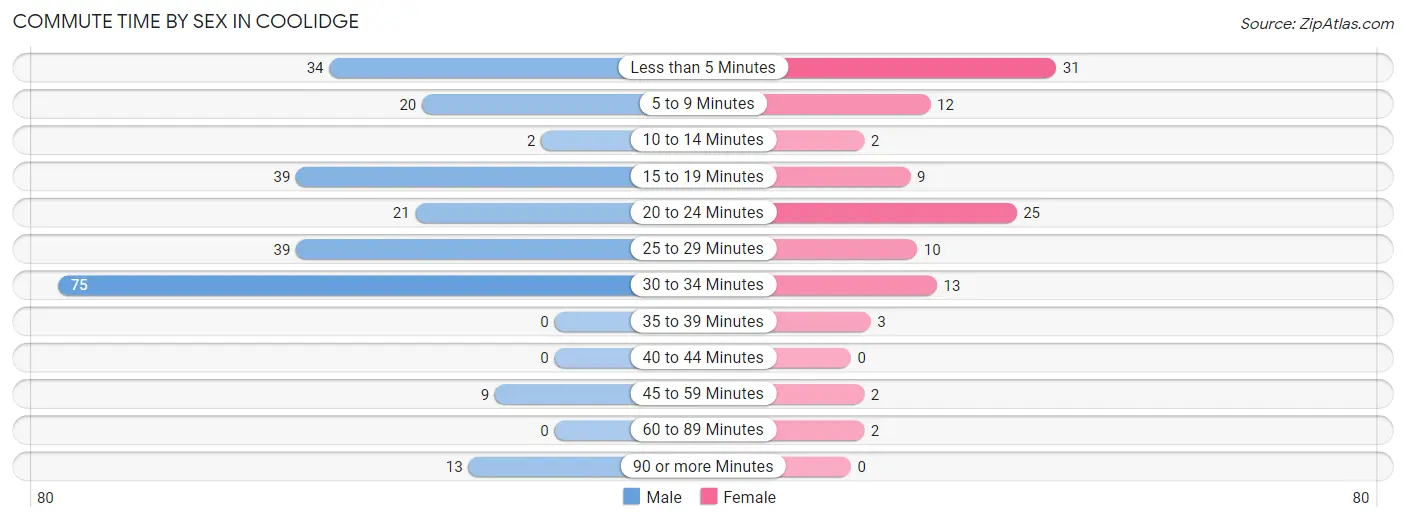
| Commute Time | Male | Female |
| Less than 5 Minutes | 34 (13.5%) | 31 (28.4%) |
| 5 to 9 Minutes | 20 (7.9%) | 12 (11.0%) |
| 10 to 14 Minutes | 2 (0.8%) | 2 (1.8%) |
| 15 to 19 Minutes | 39 (15.5%) | 9 (8.3%) |
| 20 to 24 Minutes | 21 (8.3%) | 25 (22.9%) |
| 25 to 29 Minutes | 39 (15.5%) | 10 (9.2%) |
| 30 to 34 Minutes | 75 (29.8%) | 13 (11.9%) |
| 35 to 39 Minutes | 0 (0.0%) | 3 (2.8%) |
| 40 to 44 Minutes | 0 (0.0%) | 0 (0.0%) |
| 45 to 59 Minutes | 9 (3.6%) | 2 (1.8%) |
| 60 to 89 Minutes | 0 (0.0%) | 2 (1.8%) |
| 90 or more Minutes | 13 (5.2%) | 0 (0.0%) |
Time of Departure to Work by Sex in Coolidge
The most frequent times of departure to work in Coolidge are 7:30 AM to 7:59 AM (83, 32.9%) for males and 7:00 AM to 7:29 AM (46, 42.2%) for females.
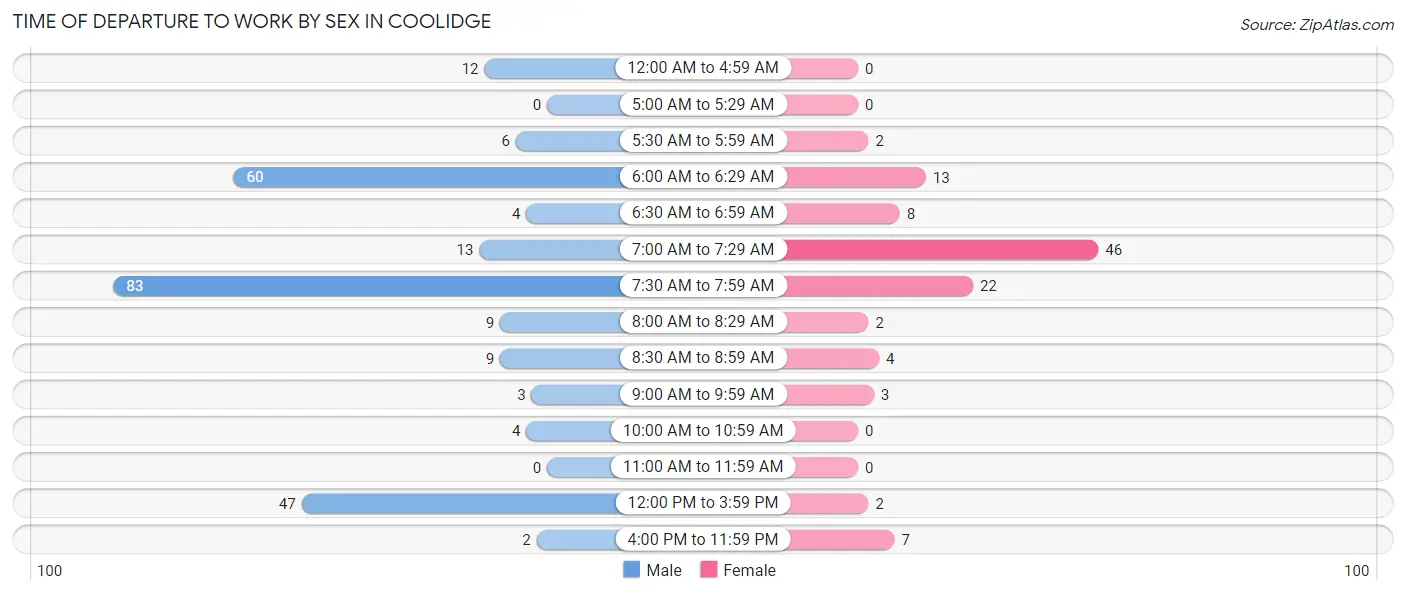
| Time of Departure | Male | Female |
| 12:00 AM to 4:59 AM | 12 (4.8%) | 0 (0.0%) |
| 5:00 AM to 5:29 AM | 0 (0.0%) | 0 (0.0%) |
| 5:30 AM to 5:59 AM | 6 (2.4%) | 2 (1.8%) |
| 6:00 AM to 6:29 AM | 60 (23.8%) | 13 (11.9%) |
| 6:30 AM to 6:59 AM | 4 (1.6%) | 8 (7.3%) |
| 7:00 AM to 7:29 AM | 13 (5.2%) | 46 (42.2%) |
| 7:30 AM to 7:59 AM | 83 (32.9%) | 22 (20.2%) |
| 8:00 AM to 8:29 AM | 9 (3.6%) | 2 (1.8%) |
| 8:30 AM to 8:59 AM | 9 (3.6%) | 4 (3.7%) |
| 9:00 AM to 9:59 AM | 3 (1.2%) | 3 (2.8%) |
| 10:00 AM to 10:59 AM | 4 (1.6%) | 0 (0.0%) |
| 11:00 AM to 11:59 AM | 0 (0.0%) | 0 (0.0%) |
| 12:00 PM to 3:59 PM | 47 (18.6%) | 2 (1.8%) |
| 4:00 PM to 11:59 PM | 2 (0.8%) | 7 (6.4%) |
| Total | 252 (100.0%) | 109 (100.0%) |
Housing Occupancy in Coolidge
Occupancy by Ownership in Coolidge
Of the total 353 dwellings in Coolidge, owner-occupied units account for 202 (57.2%), while renter-occupied units make up 151 (42.8%).
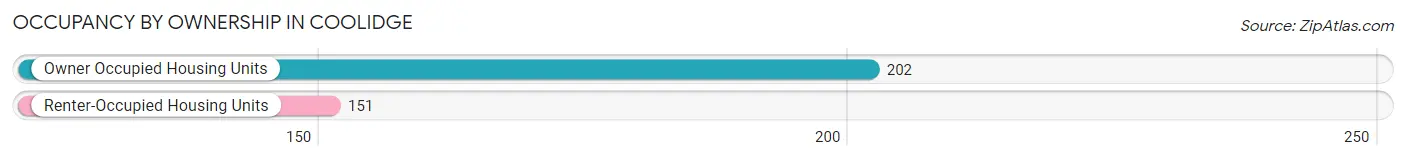
| Occupancy | # Housing Units | % Housing Units |
| Owner Occupied Housing Units | 202 | 57.2% |
| Renter-Occupied Housing Units | 151 | 42.8% |
| Total Occupied Housing Units | 353 | 100.0% |
Occupancy by Household Size in Coolidge
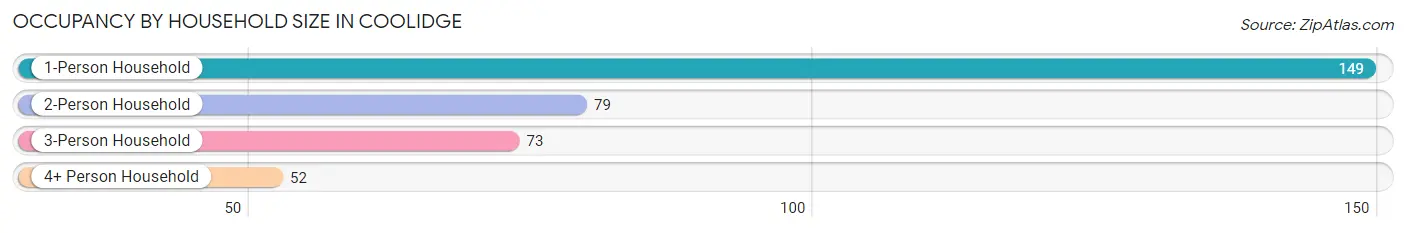
| Household Size | # Housing Units | % Housing Units |
| 1-Person Household | 149 | 42.2% |
| 2-Person Household | 79 | 22.4% |
| 3-Person Household | 73 | 20.7% |
| 4+ Person Household | 52 | 14.7% |
| Total Housing Units | 353 | 100.0% |
Occupancy by Ownership by Household Size in Coolidge
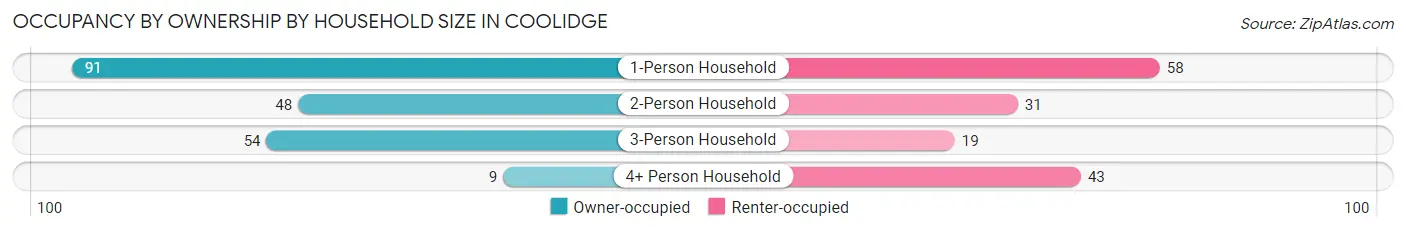
| Household Size | Owner-occupied | Renter-occupied |
| 1-Person Household | 91 (61.1%) | 58 (38.9%) |
| 2-Person Household | 48 (60.8%) | 31 (39.2%) |
| 3-Person Household | 54 (74.0%) | 19 (26.0%) |
| 4+ Person Household | 9 (17.3%) | 43 (82.7%) |
| Total Housing Units | 202 (57.2%) | 151 (42.8%) |
Occupancy by Educational Attainment in Coolidge
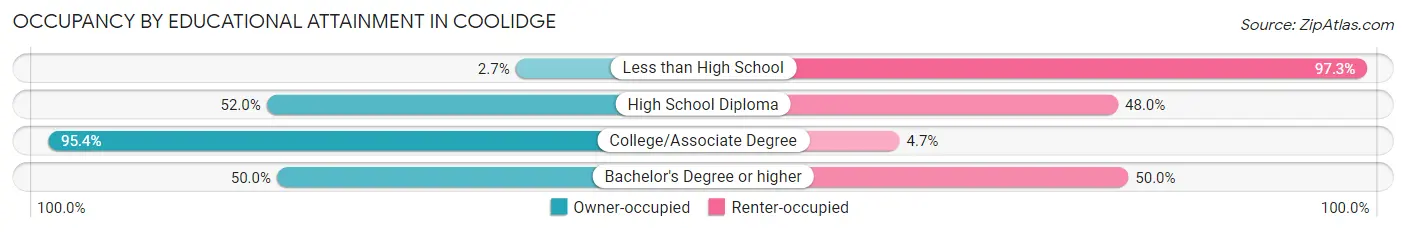
| Household Size | Owner-occupied | Renter-occupied |
| Less than High School | 2 (2.7%) | 73 (97.3%) |
| High School Diploma | 64 (52.0%) | 59 (48.0%) |
| College/Associate Degree | 123 (95.4%) | 6 (4.6%) |
| Bachelor's Degree or higher | 13 (50.0%) | 13 (50.0%) |
Occupancy by Age of Householder in Coolidge
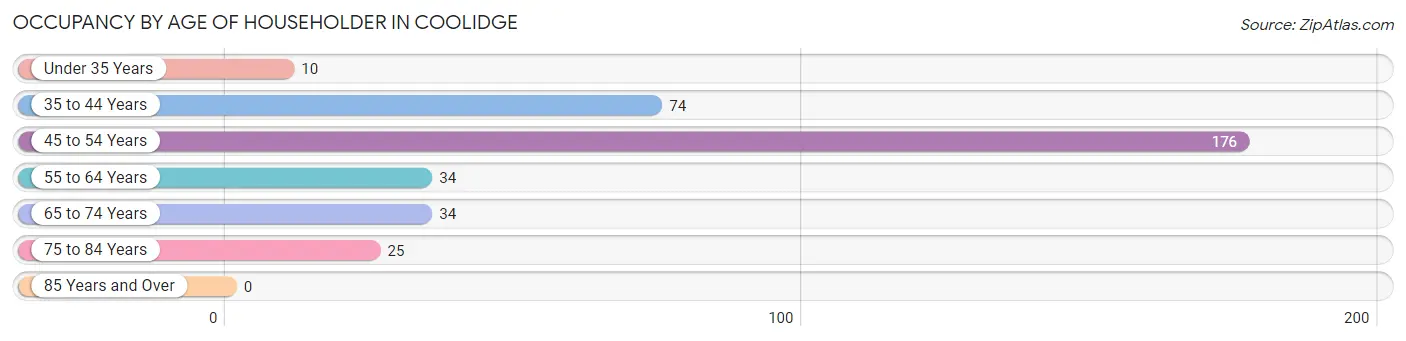
| Age Bracket | # Households | % Households |
| Under 35 Years | 10 | 2.8% |
| 35 to 44 Years | 74 | 21.0% |
| 45 to 54 Years | 176 | 49.9% |
| 55 to 64 Years | 34 | 9.6% |
| 65 to 74 Years | 34 | 9.6% |
| 75 to 84 Years | 25 | 7.1% |
| 85 Years and Over | 0 | 0.0% |
| Total | 353 | 100.0% |
Housing Finances in Coolidge
Median Income by Occupancy in Coolidge
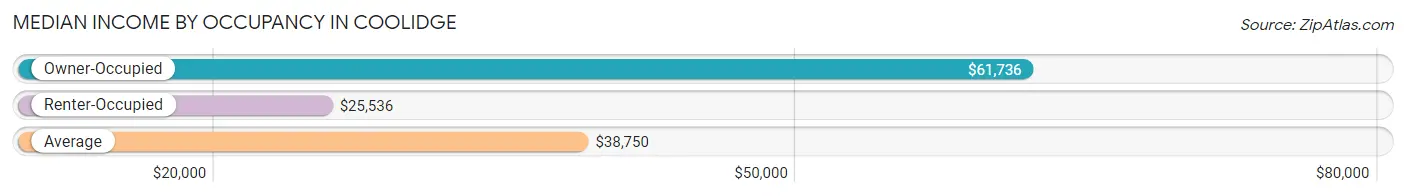
| Occupancy Type | # Households | Median Income |
| Owner-Occupied | 202 (57.2%) | $61,736 |
| Renter-Occupied | 151 (42.8%) | $25,536 |
| Average | 353 (100.0%) | $38,750 |
Occupancy by Householder Income Bracket in Coolidge
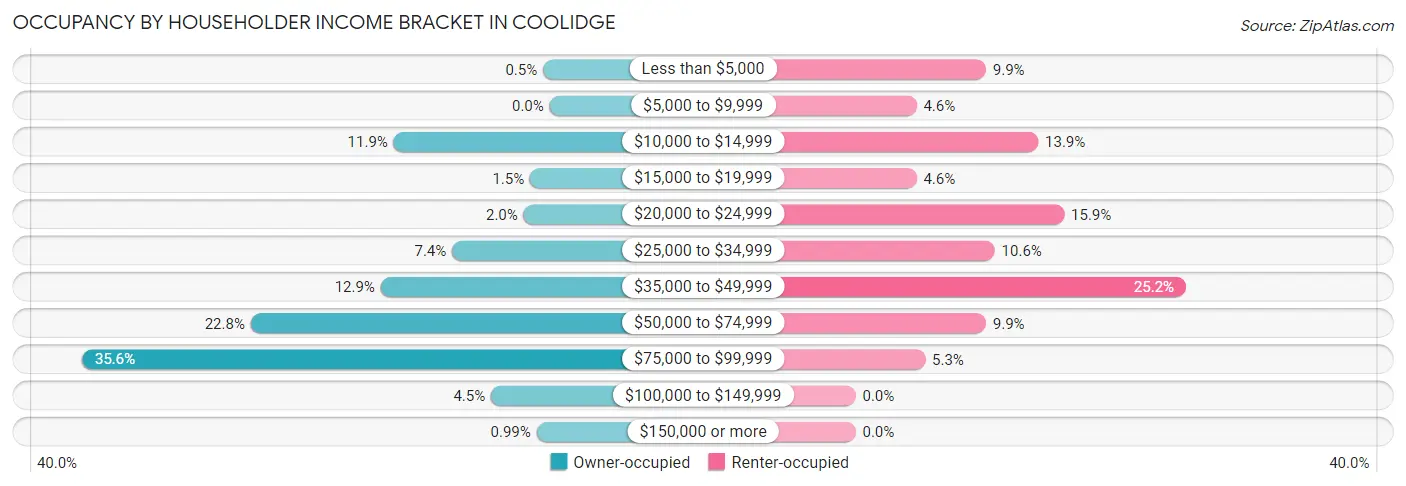
| Income Bracket | Owner-occupied | Renter-occupied |
| Less than $5,000 | 1 (0.5%) | 15 (9.9%) |
| $5,000 to $9,999 | 0 (0.0%) | 7 (4.6%) |
| $10,000 to $14,999 | 24 (11.9%) | 21 (13.9%) |
| $15,000 to $19,999 | 3 (1.5%) | 7 (4.6%) |
| $20,000 to $24,999 | 4 (2.0%) | 24 (15.9%) |
| $25,000 to $34,999 | 15 (7.4%) | 16 (10.6%) |
| $35,000 to $49,999 | 26 (12.9%) | 38 (25.2%) |
| $50,000 to $74,999 | 46 (22.8%) | 15 (9.9%) |
| $75,000 to $99,999 | 72 (35.6%) | 8 (5.3%) |
| $100,000 to $149,999 | 9 (4.5%) | 0 (0.0%) |
| $150,000 or more | 2 (1.0%) | 0 (0.0%) |
| Total | 202 (100.0%) | 151 (100.0%) |
Monthly Housing Cost Tiers in Coolidge
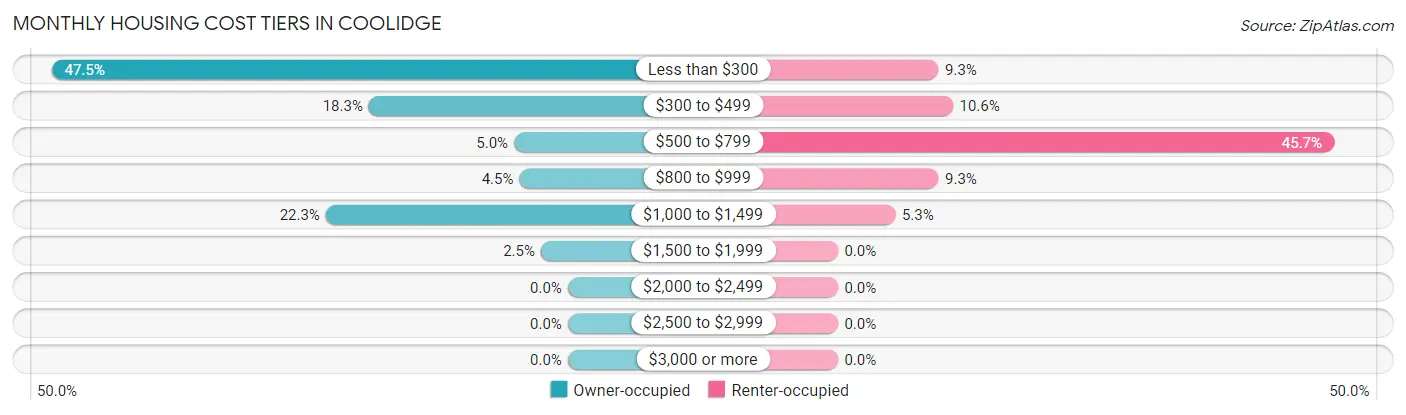
| Monthly Cost | Owner-occupied | Renter-occupied |
| Less than $300 | 96 (47.5%) | 14 (9.3%) |
| $300 to $499 | 37 (18.3%) | 16 (10.6%) |
| $500 to $799 | 10 (5.0%) | 69 (45.7%) |
| $800 to $999 | 9 (4.5%) | 14 (9.3%) |
| $1,000 to $1,499 | 45 (22.3%) | 8 (5.3%) |
| $1,500 to $1,999 | 5 (2.5%) | 0 (0.0%) |
| $2,000 to $2,499 | 0 (0.0%) | 0 (0.0%) |
| $2,500 to $2,999 | 0 (0.0%) | 0 (0.0%) |
| $3,000 or more | 0 (0.0%) | 0 (0.0%) |
| Total | 202 (100.0%) | 151 (100.0%) |
Physical Housing Characteristics in Coolidge
Housing Structures in Coolidge
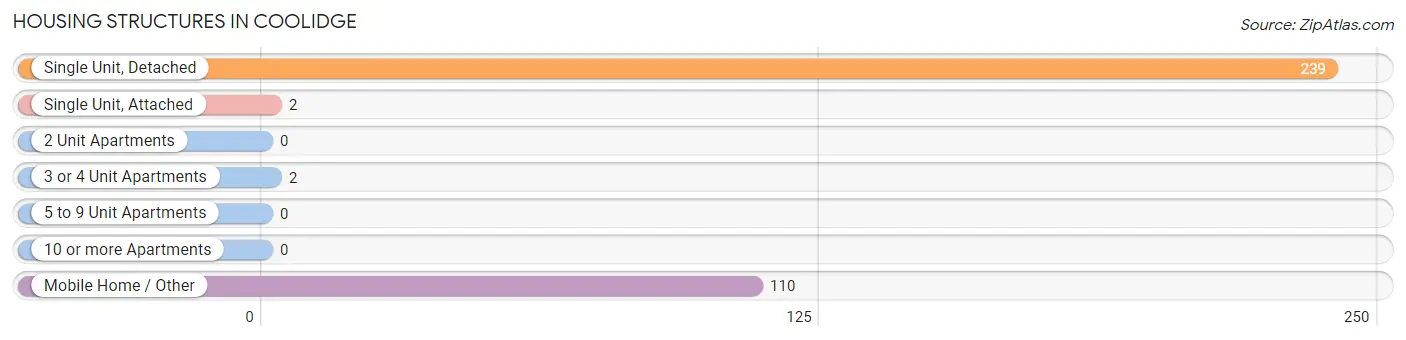
| Structure Type | # Housing Units | % Housing Units |
| Single Unit, Detached | 239 | 67.7% |
| Single Unit, Attached | 2 | 0.6% |
| 2 Unit Apartments | 0 | 0.0% |
| 3 or 4 Unit Apartments | 2 | 0.6% |
| 5 to 9 Unit Apartments | 0 | 0.0% |
| 10 or more Apartments | 0 | 0.0% |
| Mobile Home / Other | 110 | 31.2% |
| Total | 353 | 100.0% |
Housing Structures by Occupancy in Coolidge
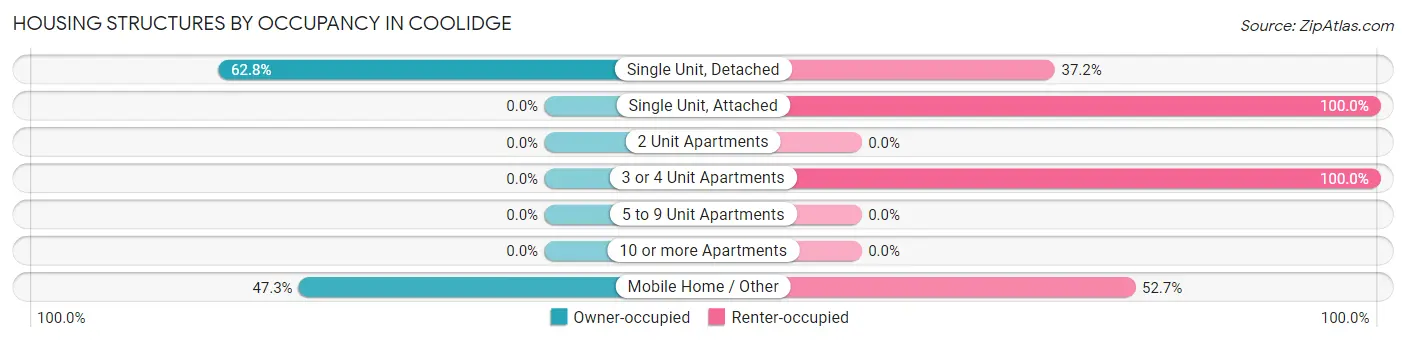
| Structure Type | Owner-occupied | Renter-occupied |
| Single Unit, Detached | 150 (62.8%) | 89 (37.2%) |
| Single Unit, Attached | 0 (0.0%) | 2 (100.0%) |
| 2 Unit Apartments | 0 (0.0%) | 0 (0.0%) |
| 3 or 4 Unit Apartments | 0 (0.0%) | 2 (100.0%) |
| 5 to 9 Unit Apartments | 0 (0.0%) | 0 (0.0%) |
| 10 or more Apartments | 0 (0.0%) | 0 (0.0%) |
| Mobile Home / Other | 52 (47.3%) | 58 (52.7%) |
| Total | 202 (57.2%) | 151 (42.8%) |
Housing Structures by Number of Rooms in Coolidge
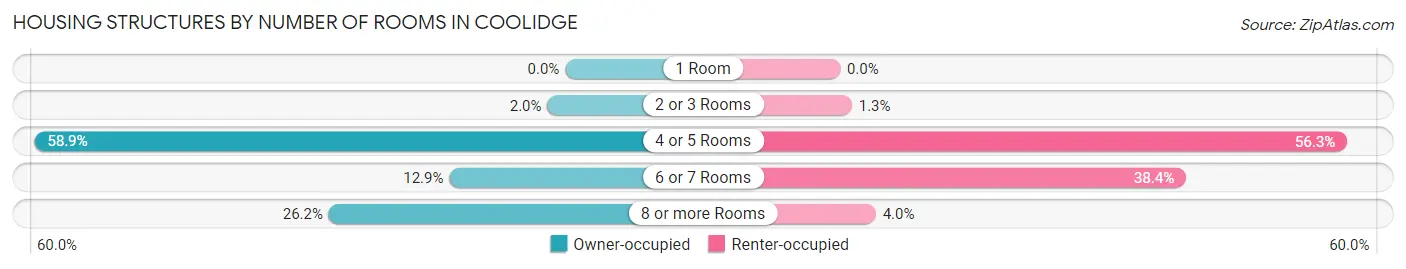
| Number of Rooms | Owner-occupied | Renter-occupied |
| 1 Room | 0 (0.0%) | 0 (0.0%) |
| 2 or 3 Rooms | 4 (2.0%) | 2 (1.3%) |
| 4 or 5 Rooms | 119 (58.9%) | 85 (56.3%) |
| 6 or 7 Rooms | 26 (12.9%) | 58 (38.4%) |
| 8 or more Rooms | 53 (26.2%) | 6 (4.0%) |
| Total | 202 (100.0%) | 151 (100.0%) |
Housing Structure by Heating Type in Coolidge
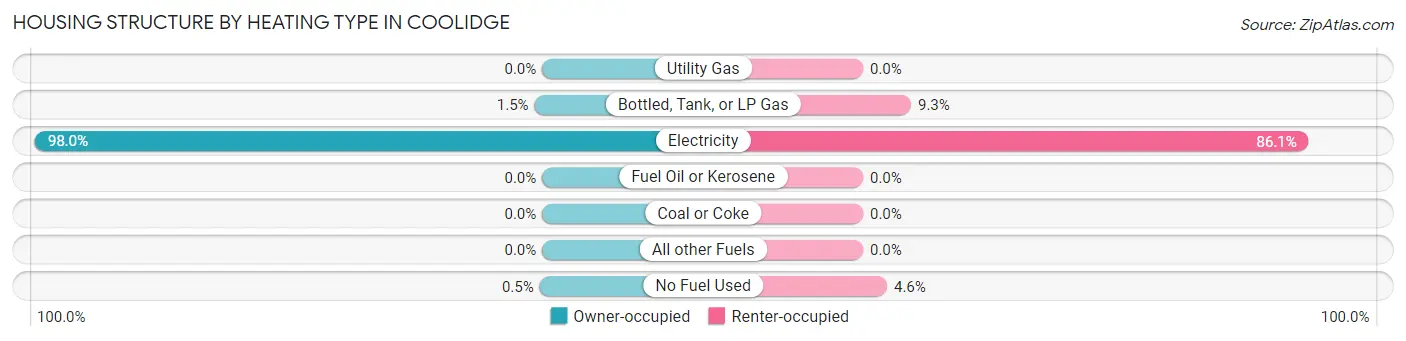
| Heating Type | Owner-occupied | Renter-occupied |
| Utility Gas | 0 (0.0%) | 0 (0.0%) |
| Bottled, Tank, or LP Gas | 3 (1.5%) | 14 (9.3%) |
| Electricity | 198 (98.0%) | 130 (86.1%) |
| Fuel Oil or Kerosene | 0 (0.0%) | 0 (0.0%) |
| Coal or Coke | 0 (0.0%) | 0 (0.0%) |
| All other Fuels | 0 (0.0%) | 0 (0.0%) |
| No Fuel Used | 1 (0.5%) | 7 (4.6%) |
| Total | 202 (100.0%) | 151 (100.0%) |
Household Vehicle Usage in Coolidge
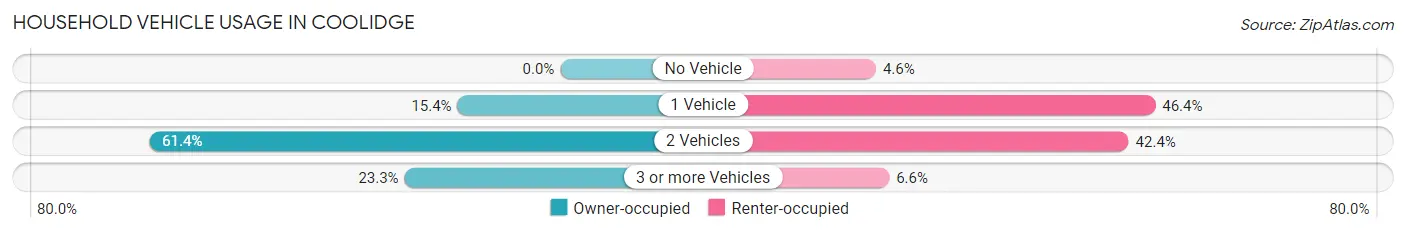
| Vehicles per Household | Owner-occupied | Renter-occupied |
| No Vehicle | 0 (0.0%) | 7 (4.6%) |
| 1 Vehicle | 31 (15.3%) | 70 (46.4%) |
| 2 Vehicles | 124 (61.4%) | 64 (42.4%) |
| 3 or more Vehicles | 47 (23.3%) | 10 (6.6%) |
| Total | 202 (100.0%) | 151 (100.0%) |
Real Estate & Mortgages in Coolidge
Real Estate and Mortgage Overview in Coolidge
| Characteristic | Without Mortgage | With Mortgage |
| Housing Units | 172 | 30 |
| Median Property Value | $131,600 | $95,000 |
| Median Household Income | $61,667 | $0 |
| Monthly Housing Costs | $267 | $0 |
| Real Estate Taxes | - | - |
Property Value by Mortgage Status in Coolidge
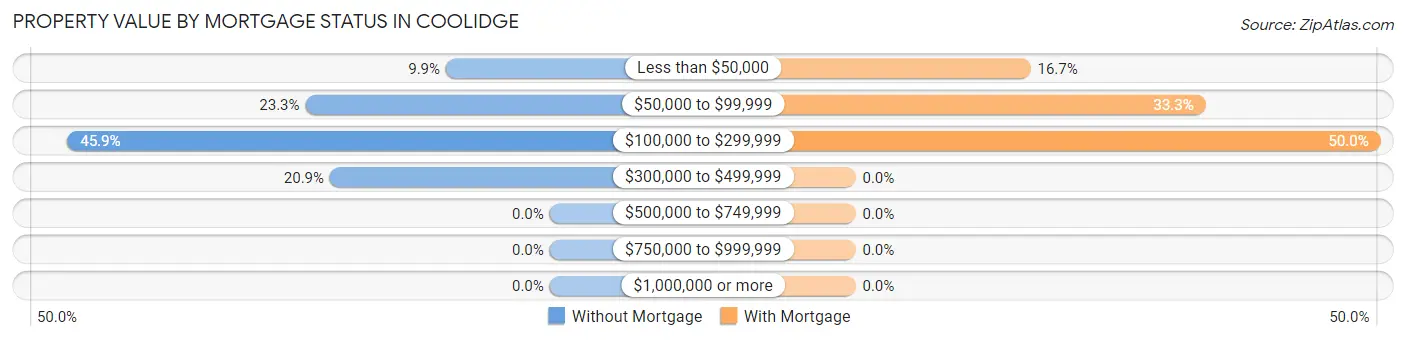
| Property Value | Without Mortgage | With Mortgage |
| Less than $50,000 | 17 (9.9%) | 5 (16.7%) |
| $50,000 to $99,999 | 40 (23.3%) | 10 (33.3%) |
| $100,000 to $299,999 | 79 (45.9%) | 15 (50.0%) |
| $300,000 to $499,999 | 36 (20.9%) | 0 (0.0%) |
| $500,000 to $749,999 | 0 (0.0%) | 0 (0.0%) |
| $750,000 to $999,999 | 0 (0.0%) | 0 (0.0%) |
| $1,000,000 or more | 0 (0.0%) | 0 (0.0%) |
| Total | 172 (100.0%) | 30 (100.0%) |
Household Income by Mortgage Status in Coolidge
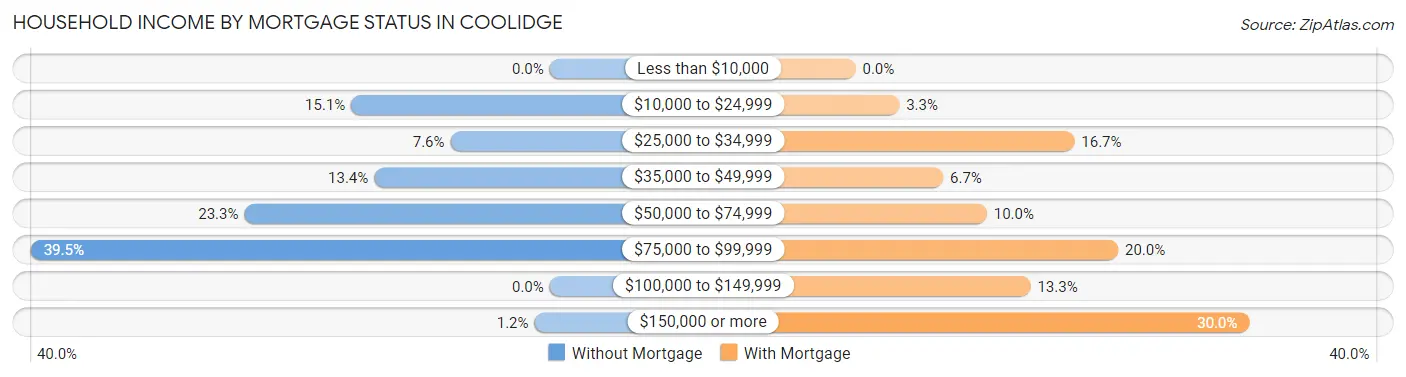
| Household Income | Without Mortgage | With Mortgage |
| Less than $10,000 | 0 (0.0%) | 0 (0.0%) |
| $10,000 to $24,999 | 26 (15.1%) | 1 (3.3%) |
| $25,000 to $34,999 | 13 (7.6%) | 5 (16.7%) |
| $35,000 to $49,999 | 23 (13.4%) | 2 (6.7%) |
| $50,000 to $74,999 | 40 (23.3%) | 3 (10.0%) |
| $75,000 to $99,999 | 68 (39.5%) | 6 (20.0%) |
| $100,000 to $149,999 | 0 (0.0%) | 4 (13.3%) |
| $150,000 or more | 2 (1.2%) | 9 (30.0%) |
| Total | 172 (100.0%) | 30 (100.0%) |
Property Value to Household Income Ratio in Coolidge
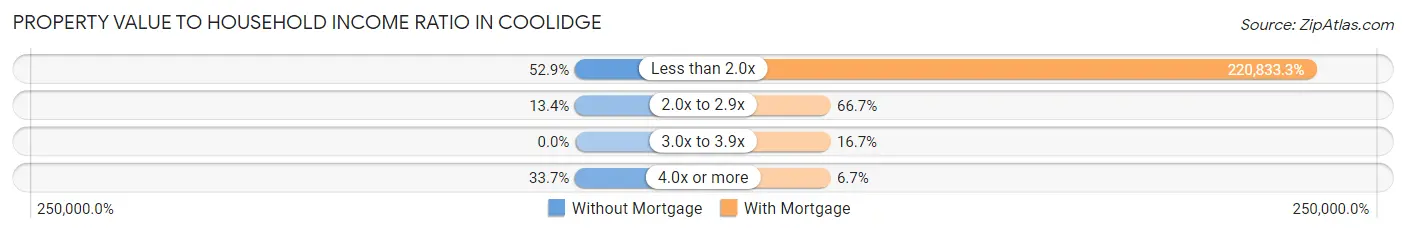
| Value-to-Income Ratio | Without Mortgage | With Mortgage |
| Less than 2.0x | 91 (52.9%) | 66,250 (220,833.3%) |
| 2.0x to 2.9x | 23 (13.4%) | 20 (66.7%) |
| 3.0x to 3.9x | 0 (0.0%) | 5 (16.7%) |
| 4.0x or more | 58 (33.7%) | 2 (6.7%) |
| Total | 172 (100.0%) | 30 (100.0%) |
Real Estate Taxes by Mortgage Status in Coolidge
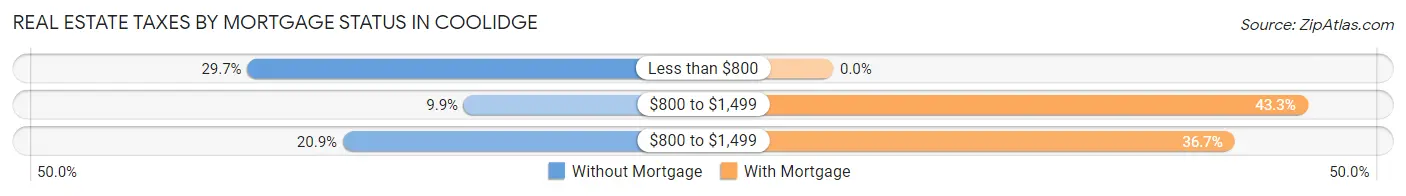
| Property Taxes | Without Mortgage | With Mortgage |
| Less than $800 | 51 (29.6%) | 0 (0.0%) |
| $800 to $1,499 | 17 (9.9%) | 13 (43.3%) |
| $800 to $1,499 | 36 (20.9%) | 11 (36.7%) |
| Total | 172 (100.0%) | 30 (100.0%) |
Health & Disability in Coolidge
Health Insurance Coverage by Age in Coolidge
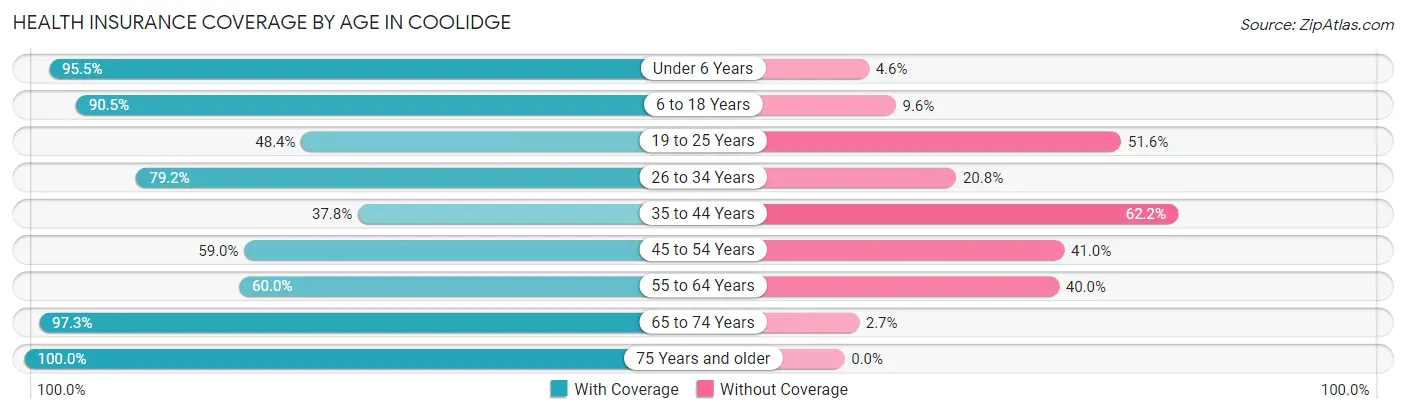
| Age Bracket | With Coverage | Without Coverage |
| Under 6 Years | 21 (95.5%) | 1 (4.5%) |
| 6 to 18 Years | 180 (90.4%) | 19 (9.6%) |
| 19 to 25 Years | 15 (48.4%) | 16 (51.6%) |
| 26 to 34 Years | 19 (79.2%) | 5 (20.8%) |
| 35 to 44 Years | 45 (37.8%) | 74 (62.2%) |
| 45 to 54 Years | 121 (59.0%) | 84 (41.0%) |
| 55 to 64 Years | 30 (60.0%) | 20 (40.0%) |
| 65 to 74 Years | 72 (97.3%) | 2 (2.7%) |
| 75 Years and older | 51 (100.0%) | 0 (0.0%) |
| Total | 554 (71.5%) | 221 (28.5%) |
Health Insurance Coverage by Citizenship Status in Coolidge
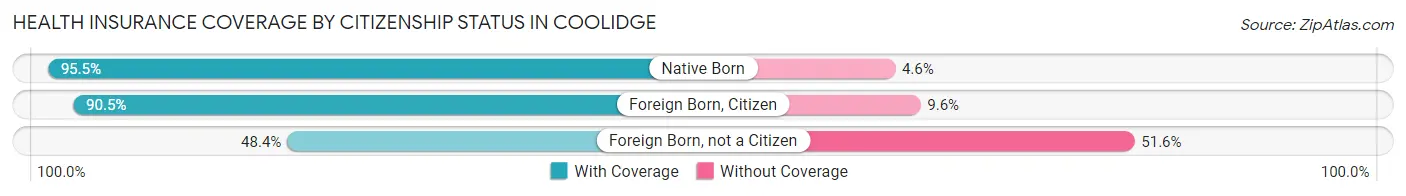
| Citizenship Status | With Coverage | Without Coverage |
| Native Born | 21 (95.5%) | 1 (4.5%) |
| Foreign Born, Citizen | 180 (90.4%) | 19 (9.6%) |
| Foreign Born, not a Citizen | 15 (48.4%) | 16 (51.6%) |
Health Insurance Coverage by Household Income in Coolidge
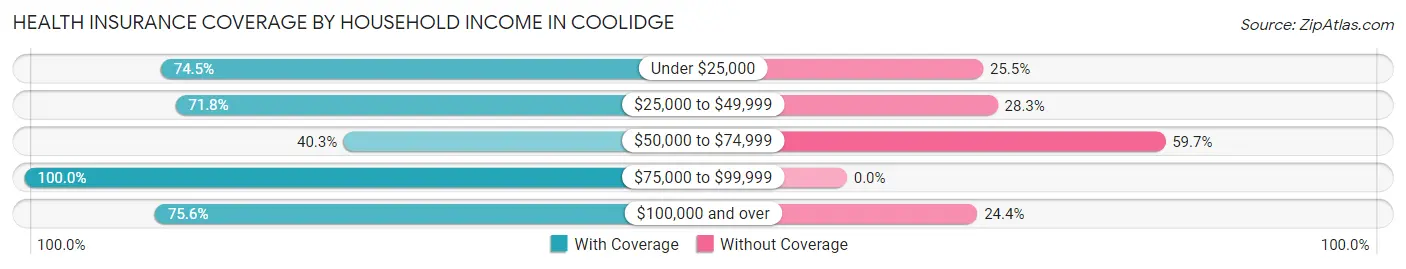
| Household Income | With Coverage | Without Coverage |
| Under $25,000 | 108 (74.5%) | 37 (25.5%) |
| $25,000 to $49,999 | 259 (71.8%) | 102 (28.2%) |
| $50,000 to $74,999 | 48 (40.3%) | 71 (59.7%) |
| $75,000 to $99,999 | 105 (100.0%) | 0 (0.0%) |
| $100,000 and over | 34 (75.6%) | 11 (24.4%) |
Public vs Private Health Insurance Coverage by Age in Coolidge
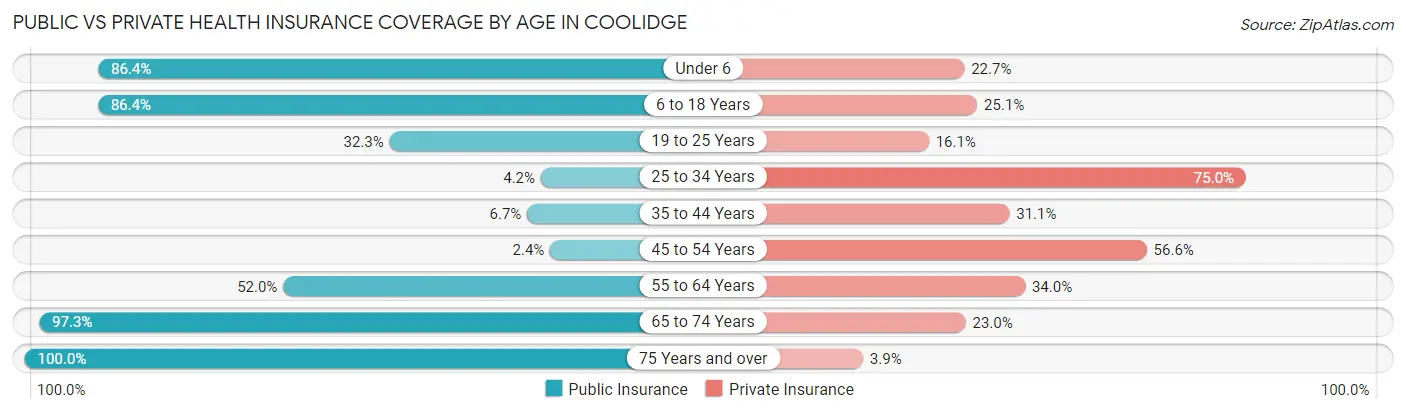
| Age Bracket | Public Insurance | Private Insurance |
| Under 6 | 19 (86.4%) | 5 (22.7%) |
| 6 to 18 Years | 172 (86.4%) | 50 (25.1%) |
| 19 to 25 Years | 10 (32.3%) | 5 (16.1%) |
| 25 to 34 Years | 1 (4.2%) | 18 (75.0%) |
| 35 to 44 Years | 8 (6.7%) | 37 (31.1%) |
| 45 to 54 Years | 5 (2.4%) | 116 (56.6%) |
| 55 to 64 Years | 26 (52.0%) | 17 (34.0%) |
| 65 to 74 Years | 72 (97.3%) | 17 (23.0%) |
| 75 Years and over | 51 (100.0%) | 2 (3.9%) |
| Total | 364 (47.0%) | 267 (34.4%) |
Disability Status by Sex by Age in Coolidge
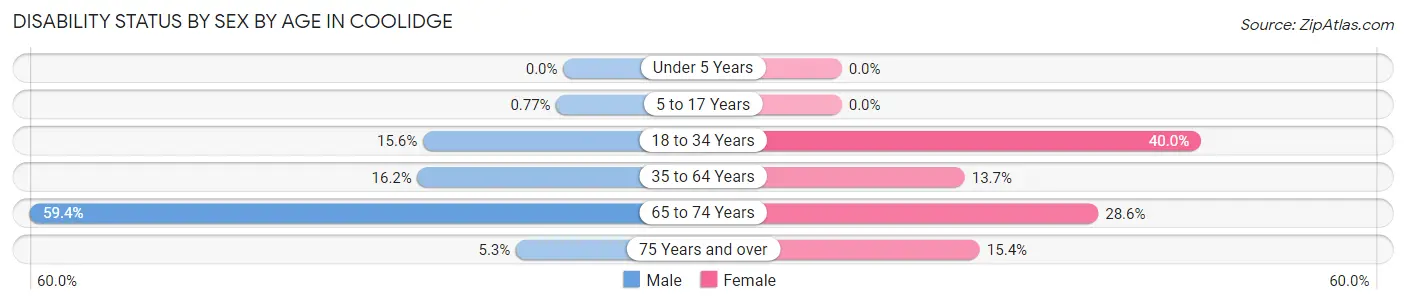
| Age Bracket | Male | Female |
| Under 5 Years | 0 (0.0%) | 0 (0.0%) |
| 5 to 17 Years | 1 (0.8%) | 0 (0.0%) |
| 18 to 34 Years | 5 (15.6%) | 12 (40.0%) |
| 35 to 64 Years | 37 (16.2%) | 20 (13.7%) |
| 65 to 74 Years | 19 (59.4%) | 12 (28.6%) |
| 75 Years and over | 2 (5.3%) | 2 (15.4%) |
Disability Class by Sex by Age in Coolidge
Disability Class: Hearing Difficulty
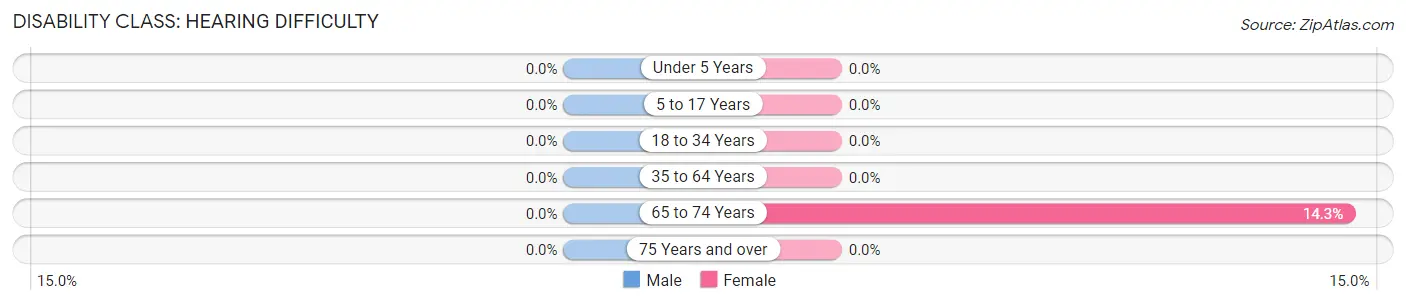
| Age Bracket | Male | Female |
| Under 5 Years | 0 (0.0%) | 0 (0.0%) |
| 5 to 17 Years | 0 (0.0%) | 0 (0.0%) |
| 18 to 34 Years | 0 (0.0%) | 0 (0.0%) |
| 35 to 64 Years | 0 (0.0%) | 0 (0.0%) |
| 65 to 74 Years | 0 (0.0%) | 6 (14.3%) |
| 75 Years and over | 0 (0.0%) | 0 (0.0%) |
Disability Class: Vision Difficulty
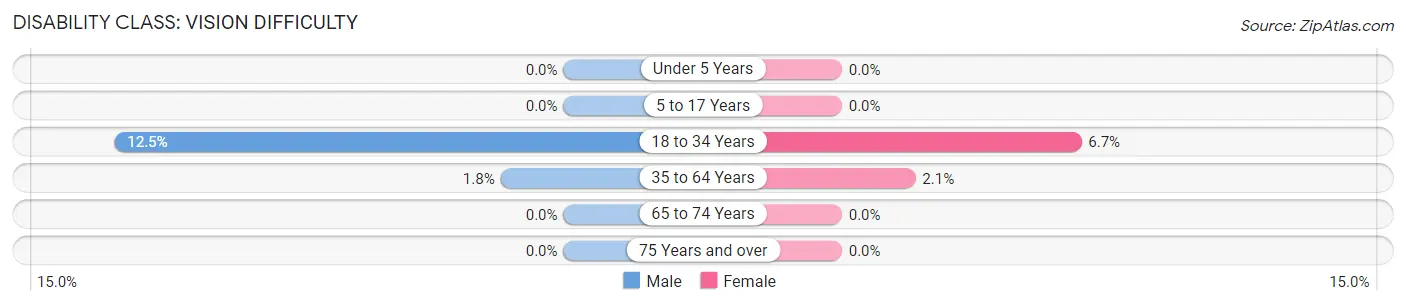
| Age Bracket | Male | Female |
| Under 5 Years | 0 (0.0%) | 0 (0.0%) |
| 5 to 17 Years | 0 (0.0%) | 0 (0.0%) |
| 18 to 34 Years | 4 (12.5%) | 2 (6.7%) |
| 35 to 64 Years | 4 (1.8%) | 3 (2.1%) |
| 65 to 74 Years | 0 (0.0%) | 0 (0.0%) |
| 75 Years and over | 0 (0.0%) | 0 (0.0%) |
Disability Class: Cognitive Difficulty
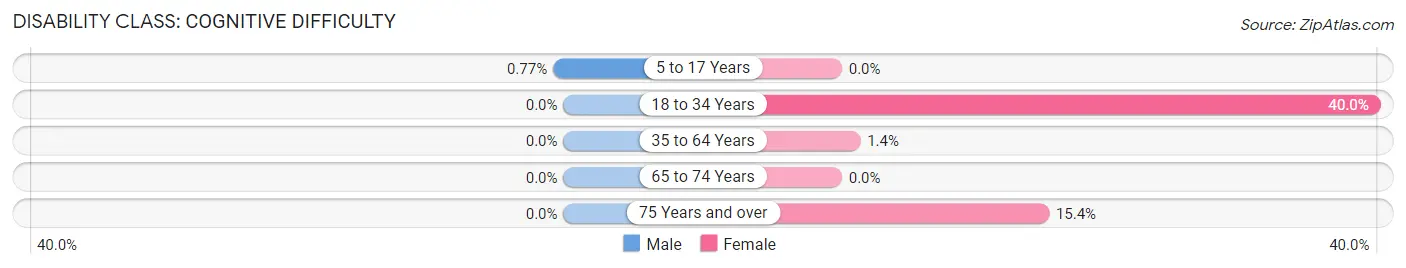
| Age Bracket | Male | Female |
| 5 to 17 Years | 1 (0.8%) | 0 (0.0%) |
| 18 to 34 Years | 0 (0.0%) | 12 (40.0%) |
| 35 to 64 Years | 0 (0.0%) | 2 (1.4%) |
| 65 to 74 Years | 0 (0.0%) | 0 (0.0%) |
| 75 Years and over | 0 (0.0%) | 2 (15.4%) |
Disability Class: Ambulatory Difficulty
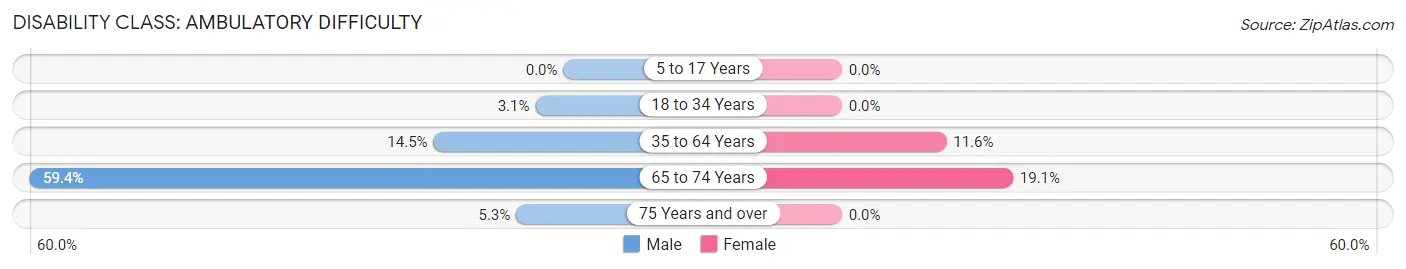
| Age Bracket | Male | Female |
| 5 to 17 Years | 0 (0.0%) | 0 (0.0%) |
| 18 to 34 Years | 1 (3.1%) | 0 (0.0%) |
| 35 to 64 Years | 33 (14.5%) | 17 (11.6%) |
| 65 to 74 Years | 19 (59.4%) | 8 (19.1%) |
| 75 Years and over | 2 (5.3%) | 0 (0.0%) |
Disability Class: Self-Care Difficulty
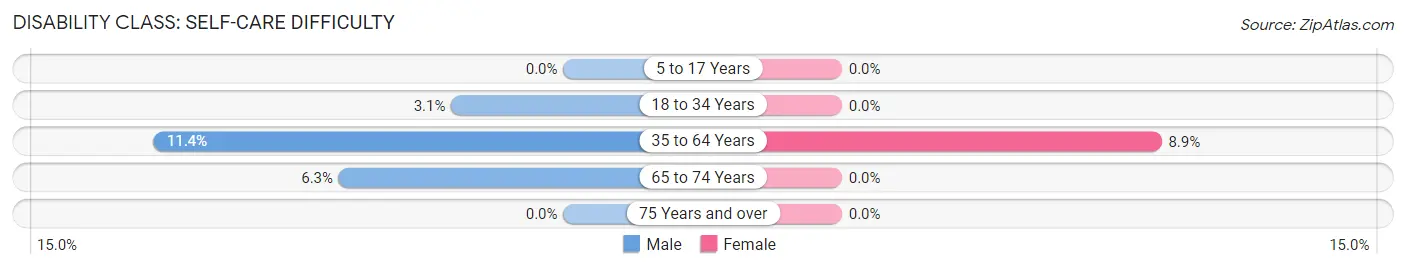
| Age Bracket | Male | Female |
| 5 to 17 Years | 0 (0.0%) | 0 (0.0%) |
| 18 to 34 Years | 1 (3.1%) | 0 (0.0%) |
| 35 to 64 Years | 26 (11.4%) | 13 (8.9%) |
| 65 to 74 Years | 2 (6.2%) | 0 (0.0%) |
| 75 Years and over | 0 (0.0%) | 0 (0.0%) |
Technology Access in Coolidge
Computing Device Access in Coolidge
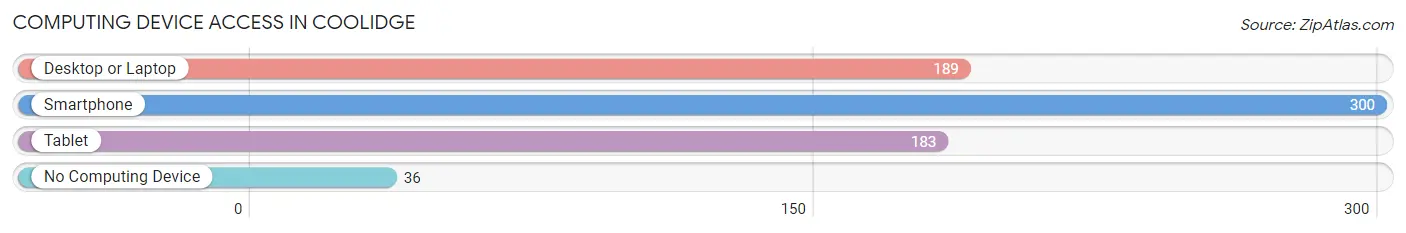
| Device Type | # Households | % Households |
| Desktop or Laptop | 189 | 53.5% |
| Smartphone | 300 | 85.0% |
| Tablet | 183 | 51.8% |
| No Computing Device | 36 | 10.2% |
| Total | 353 | 100.0% |
Internet Access in Coolidge
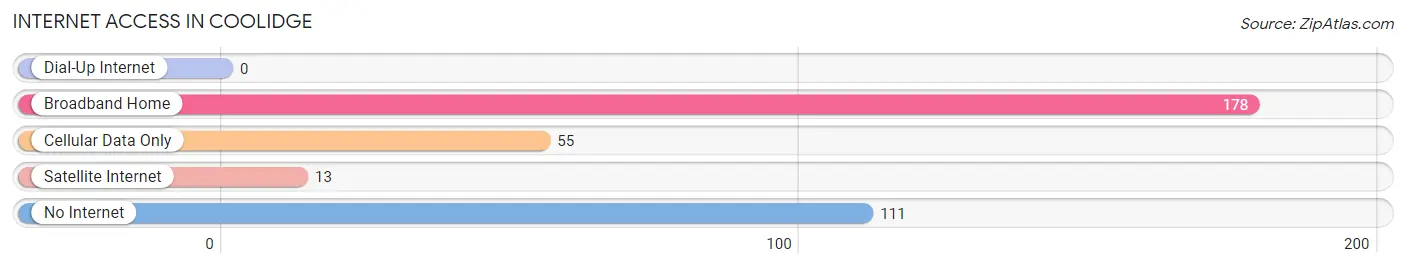
| Internet Type | # Households | % Households |
| Dial-Up Internet | 0 | 0.0% |
| Broadband Home | 178 | 50.4% |
| Cellular Data Only | 55 | 15.6% |
| Satellite Internet | 13 | 3.7% |
| No Internet | 111 | 31.4% |
| Total | 353 | 100.0% |
Coolidge Summary
History
The small town of Coolidge, Georgia is located in Thomas County, in the southwestern part of the state. It was founded in 1891 by the Reverend J.W. Coolidge, a Methodist minister from South Carolina. The town was named after him, and he was the first postmaster of the town.
The town was originally a farming community, and the main crops were cotton, corn, and peanuts. The town also had a sawmill, a gristmill, and a cotton gin. In the early 1900s, the town began to grow and develop, and the first bank was established in 1906.
In the 1920s, the town began to experience a period of growth and prosperity. The railroad came to town, and the town became a major shipping center for the surrounding area. The town also had a number of businesses, including a hotel, a movie theater, and a variety of stores.
In the 1950s, the town began to decline, as the railroad stopped running and the businesses began to close. The town was also affected by the Great Depression, and many of the residents moved away.
In the 1970s, the town began to experience a revival, as new businesses opened and the population began to grow. The town also began to attract tourists, as it was located near the Okefenokee Swamp and the St. Marys River.
Geography
Coolidge is located in Thomas County, in the southwestern part of the state. It is situated on the banks of the Okefenokee Swamp, and is surrounded by pine forests and wetlands. The town is located about 30 miles from the Georgia-Florida border.
The town is located at an elevation of about 200 feet above sea level. The climate is humid subtropical, with hot summers and mild winters. The average annual temperature is around 70 degrees Fahrenheit.
Economy
The economy of Coolidge is largely based on agriculture and tourism. The town is home to a number of farms, which produce cotton, corn, peanuts, and other crops. The town is also home to a number of businesses, including restaurants, stores, and hotels.
The town is also a popular tourist destination, as it is located near the Okefenokee Swamp and the St. Marys River. The town is home to a number of attractions, including the Okefenokee National Wildlife Refuge, the Stephen C. Foster State Park, and the Okefenokee Heritage Center.
Demographics
As of the 2010 census, the population of Coolidge was 1,845. The racial makeup of the town was 79.3% White, 17.2% African American, 0.7% Native American, 0.3% Asian, 0.1% Pacific Islander, and 2.4% from other races. The median household income was $30,938, and the median family income was $37,813. The per capita income was $15,945.
Common Questions
What is the Total Population of Coolidge?
Total Population of Coolidge is 775.
What is the Total Male Population of Coolidge?
Total Male Population of Coolidge is 475.
What is the Total Female Population of Coolidge?
Total Female Population of Coolidge is 300.
What is the Ratio of Males per 100 Females in Coolidge?
There are 158.33 Males per 100 Females in Coolidge.
What is the Ratio of Females per 100 Males in Coolidge?
There are 63.16 Females per 100 Males in Coolidge.
What is the Median Population Age in Coolidge?
Median Population Age in Coolidge is 41.1 Years.
What is the Average Family Size in Coolidge
Average Family Size in Coolidge is 3.0 People.
What is the Average Household Size in Coolidge
Average Household Size in Coolidge is 2.2 People.
What is Per Capita Income in Coolidge?
Per Capita income in Coolidge is $22,077.
What is the Median Family Income in Coolidge?
Median Family Income in Coolidge is $38,939.
What is the Median Household income in Coolidge?
Median Household Income in Coolidge is $38,750.
What is Income or Wage Gap in Coolidge?
Income or Wage Gap in Coolidge is 62.5%.
Women in Coolidge earn 37.5 cents for every dollar earned by a man.
What is Family Income Deficit in Coolidge?
Family Income Deficit in Coolidge is $7,778.
Families that are below poverty line in Coolidge earn $7,778 less on average than the poverty threshold level.
What is Inequality or Gini Index in Coolidge?
Inequality or Gini Index in Coolidge is 0.37.
How Large is the Labor Force in Coolidge?
There are 392 People in the Labor Forcein in Coolidge.
What is the Percentage of People in the Labor Force in Coolidge?
64.4% of People are in the Labor Force in Coolidge.