White County, GA
White County Map

White County Overview
28,165
TOTAL POPULATION
13,898
MALE POPULATION
14,267
FEMALE POPULATION
97.41
MALES / 100 FEMALES
102.66
FEMALES / 100 MALES
45.3
MEDIAN AGE
3.1
AVG FAMILY SIZE
2.7
AVG HOUSEHOLD SIZE
$32,311
PER CAPITA INCOME
$82,535
AVG FAMILY INCOME
$66,256
AVG HOUSEHOLD INCOME
34.7%
WAGE / INCOME GAP [ % ]
65.3¢/ $1
WAGE / INCOME GAP [ $ ]
$9,900
FAMILY INCOME DEFICIT
0.43
INEQUALITY / GINI INDEX
13,054
LABOR FORCE [ PEOPLE ]
55.6%
PERCENT IN LABOR FORCE
3.5%
UNEMPLOYMENT RATE
White County Area Codes
Race in White County
The most populous races in White County are White / Caucasian (25,727 | 91.3%), Two or more Races (1,092 | 3.9%), and Hispanic or Latino (965 | 3.4%).
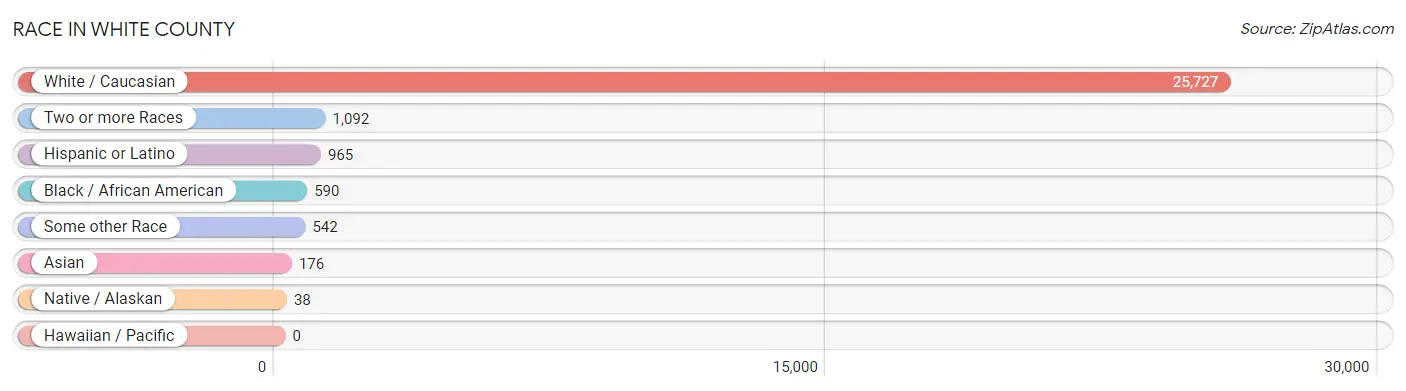
| Race | # Population | % Population |
| Asian | 176 | 0.6% |
| Black / African American | 590 | 2.1% |
| Hawaiian / Pacific | 0 | 0.0% |
| Hispanic or Latino | 965 | 3.4% |
| Native / Alaskan | 38 | 0.1% |
| White / Caucasian | 25,727 | 91.3% |
| Two or more Races | 1,092 | 3.9% |
| Some other Race | 542 | 1.9% |
| Total | 28,165 | 100.0% |
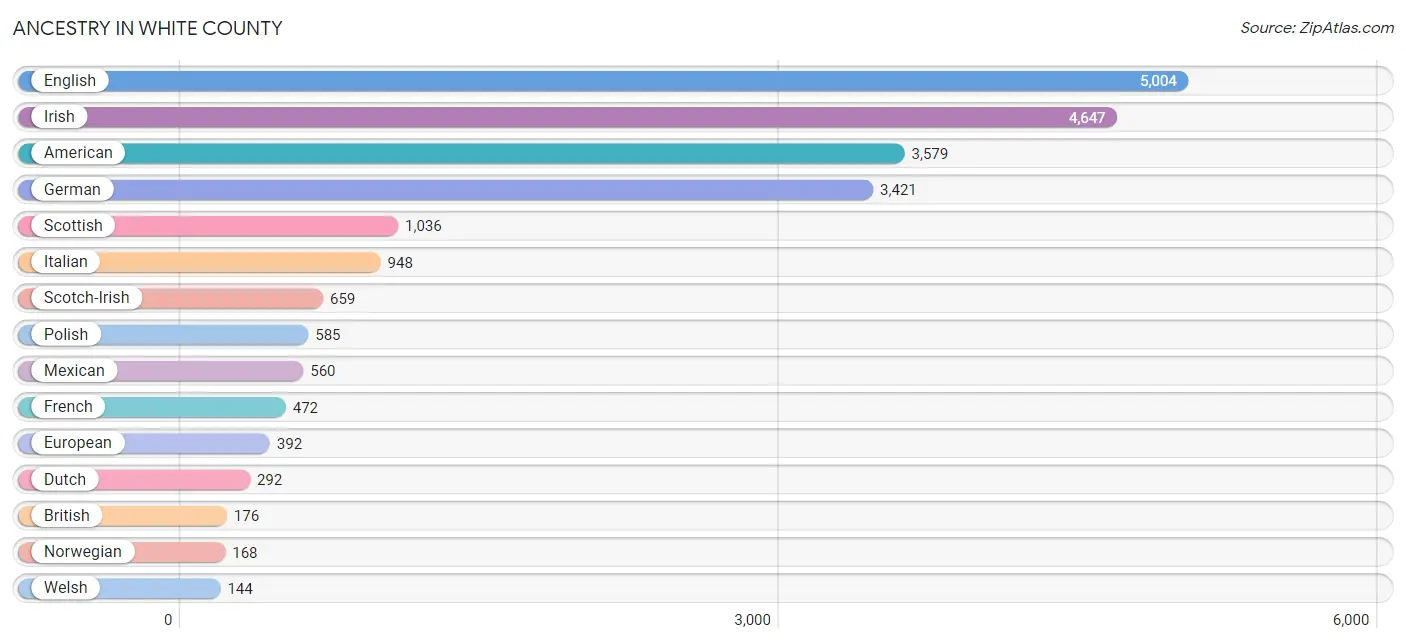
Ancestry in White County
The most populous ancestries reported in White County are English (5,004 | 17.8%), Irish (4,647 | 16.5%), American (3,579 | 12.7%), German (3,421 | 12.1%), and Scottish (1,036 | 3.7%), together accounting for 62.8% of all White County residents.
| Ancestry | # Population | % Population |
| African | 1 | 0.0% |
| Alsatian | 30 | 0.1% |
| American | 3,579 | 12.7% |
| Arab | 8 | 0.0% |
| Austrian | 74 | 0.3% |
| Blackfeet | 28 | 0.1% |
| British | 176 | 0.6% |
| Burmese | 2 | 0.0% |
| Canadian | 15 | 0.1% |
| Celtic | 14 | 0.1% |
| Central American | 1 | 0.0% |
| Central American Indian | 15 | 0.1% |
| Cherokee | 124 | 0.4% |
| Chickasaw | 2 | 0.0% |
| Choctaw | 15 | 0.1% |
| Colombian | 35 | 0.1% |
| Crow | 15 | 0.1% |
| Cuban | 85 | 0.3% |
| Czech | 86 | 0.3% |
| Czechoslovakian | 2 | 0.0% |
| Danish | 2 | 0.0% |
| Dutch | 292 | 1.0% |
| English | 5,004 | 17.8% |
| European | 392 | 1.4% |
| French | 472 | 1.7% |
| French Canadian | 98 | 0.4% |
| German | 3,421 | 12.1% |
| Greek | 45 | 0.2% |
| Haitian | 2 | 0.0% |
| Hungarian | 14 | 0.1% |
| Indian (Asian) | 3 | 0.0% |
| Irish | 4,647 | 16.5% |
| Iroquois | 5 | 0.0% |
| Italian | 948 | 3.4% |
| Korean | 65 | 0.2% |
| Lebanese | 1 | 0.0% |
| Lithuanian | 33 | 0.1% |
| Maltese | 8 | 0.0% |
| Mexican | 560 | 2.0% |
| Mexican American Indian | 2 | 0.0% |
| Nicaraguan | 1 | 0.0% |
| Northern European | 59 | 0.2% |
| Norwegian | 168 | 0.6% |
| Pennsylvania German | 25 | 0.1% |
| Peruvian | 98 | 0.4% |
| Polish | 585 | 2.1% |
| Portuguese | 7 | 0.0% |
| Puerto Rican | 128 | 0.4% |
| Romanian | 78 | 0.3% |
| Russian | 28 | 0.1% |
| Scandinavian | 125 | 0.4% |
| Scotch-Irish | 659 | 2.3% |
| Scottish | 1,036 | 3.7% |
| Sioux | 3 | 0.0% |
| Slovak | 12 | 0.0% |
| South American | 133 | 0.5% |
| Spaniard | 11 | 0.0% |
| Spanish | 47 | 0.2% |
| Sri Lankan | 83 | 0.3% |
| Subsaharan African | 2 | 0.0% |
| Swedish | 128 | 0.4% |
| Swiss | 55 | 0.2% |
| Thai | 65 | 0.2% |
| Ukrainian | 73 | 0.3% |
| Welsh | 144 | 0.5% | View All 65 Rows |
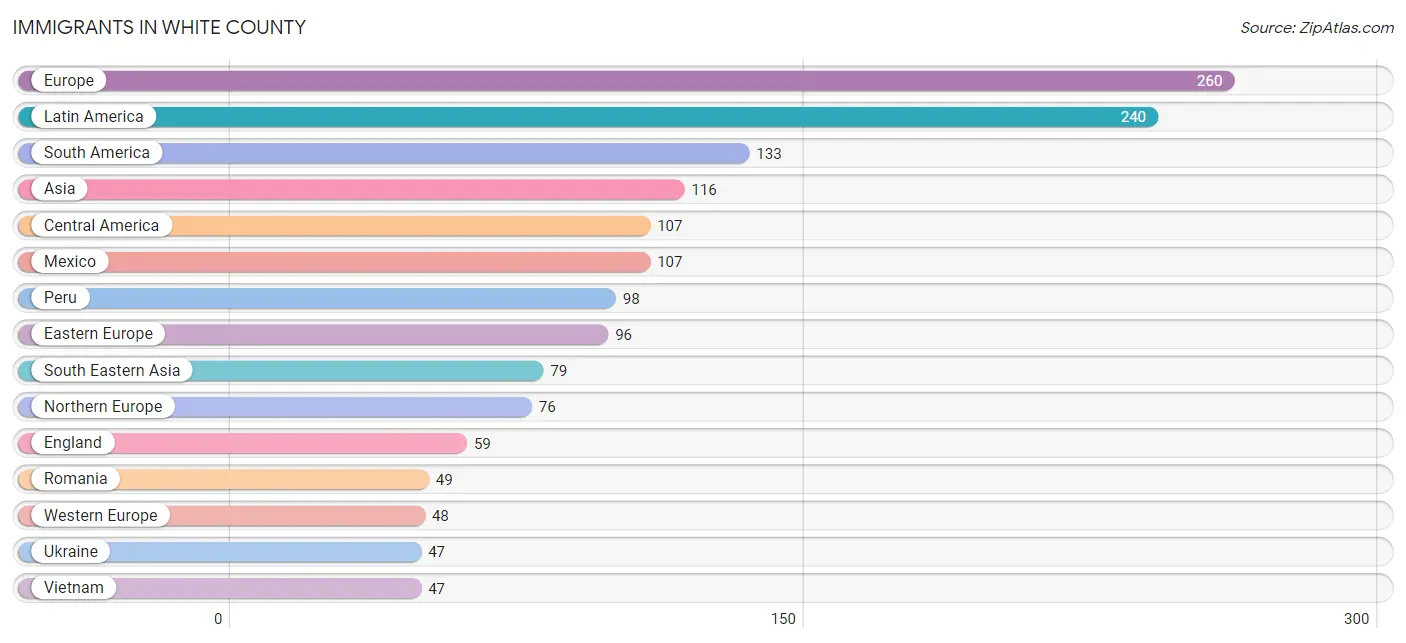
Immigrants in White County
The most numerous immigrant groups reported in White County came from Europe (260 | 0.9%), Latin America (240 | 0.9%), South America (133 | 0.5%), Asia (116 | 0.4%), and Central America (107 | 0.4%), together accounting for 3.0% of all White County residents.
| Immigration Origin | # Population | % Population |
| Asia | 116 | 0.4% |
| Canada | 18 | 0.1% |
| Central America | 107 | 0.4% |
| China | 3 | 0.0% |
| Colombia | 35 | 0.1% |
| Eastern Asia | 5 | 0.0% |
| Eastern Europe | 96 | 0.3% |
| England | 59 | 0.2% |
| Europe | 260 | 0.9% |
| Germany | 40 | 0.1% |
| India | 8 | 0.0% |
| Italy | 40 | 0.1% |
| Korea | 2 | 0.0% |
| Latin America | 240 | 0.9% |
| Mexico | 107 | 0.4% |
| Netherlands | 8 | 0.0% |
| Northern Europe | 76 | 0.3% |
| Pakistan | 17 | 0.1% |
| Peru | 98 | 0.4% |
| Philippines | 32 | 0.1% |
| Romania | 49 | 0.2% |
| South America | 133 | 0.5% |
| South Central Asia | 25 | 0.1% |
| South Eastern Asia | 79 | 0.3% |
| Southern Europe | 40 | 0.1% |
| Sweden | 13 | 0.1% |
| Ukraine | 47 | 0.2% |
| Vietnam | 47 | 0.2% |
| Western Europe | 48 | 0.2% | View All 29 Rows |
Sex and Age in White County
Sex and Age in White County
The most populous age groups in White County are 55 to 59 Years (1,102 | 7.9%) for men and 55 to 59 Years (1,188 | 8.3%) for women.
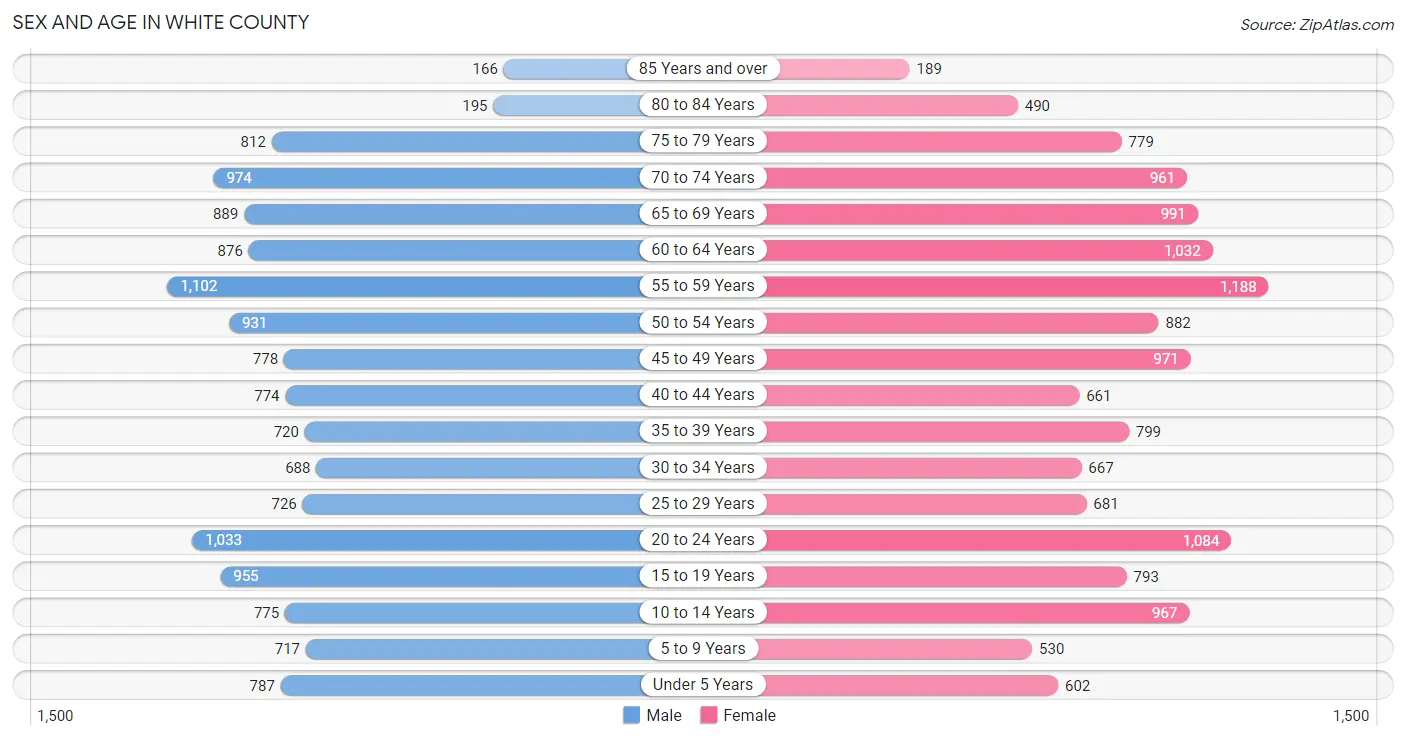
| Age Bracket | Male | Female |
| Under 5 Years | 787 (5.7%) | 602 (4.2%) |
| 5 to 9 Years | 717 (5.2%) | 530 (3.7%) |
| 10 to 14 Years | 775 (5.6%) | 967 (6.8%) |
| 15 to 19 Years | 955 (6.9%) | 793 (5.6%) |
| 20 to 24 Years | 1,033 (7.4%) | 1,084 (7.6%) |
| 25 to 29 Years | 726 (5.2%) | 681 (4.8%) |
| 30 to 34 Years | 688 (5.0%) | 667 (4.7%) |
| 35 to 39 Years | 720 (5.2%) | 799 (5.6%) |
| 40 to 44 Years | 774 (5.6%) | 661 (4.6%) |
| 45 to 49 Years | 778 (5.6%) | 971 (6.8%) |
| 50 to 54 Years | 931 (6.7%) | 882 (6.2%) |
| 55 to 59 Years | 1,102 (7.9%) | 1,188 (8.3%) |
| 60 to 64 Years | 876 (6.3%) | 1,032 (7.2%) |
| 65 to 69 Years | 889 (6.4%) | 991 (7.0%) |
| 70 to 74 Years | 974 (7.0%) | 961 (6.7%) |
| 75 to 79 Years | 812 (5.8%) | 779 (5.5%) |
| 80 to 84 Years | 195 (1.4%) | 490 (3.4%) |
| 85 Years and over | 166 (1.2%) | 189 (1.3%) |
| Total | 13,898 (100.0%) | 14,267 (100.0%) |
Families and Households in White County
Median Family Size in White County
The median family size in White County is 3.06 persons per family, with married-couple families (6,295 | 81.9%) accounting for the largest median family size of 3.08 persons per family. On the other hand, single female/mother families (1,185 | 15.4%) represent the smallest median family size with 2.91 persons per family.

| Family Type | # Families | Family Size |
| Married-Couple | 6,295 (81.9%) | 3.08 |
| Single Male/Father | 207 (2.7%) | 3.00 |
| Single Female/Mother | 1,185 (15.4%) | 2.91 |
| Total Families | 7,687 (100.0%) | 3.06 |
Median Household Size in White County
The median household size in White County is 2.68 persons per household, with single male/father households (207 | 2.0%) accounting for the largest median household size of 3.35 persons per household. non-family households (2,657 | 25.7%) represent the smallest median household size with 1.40 persons per household.
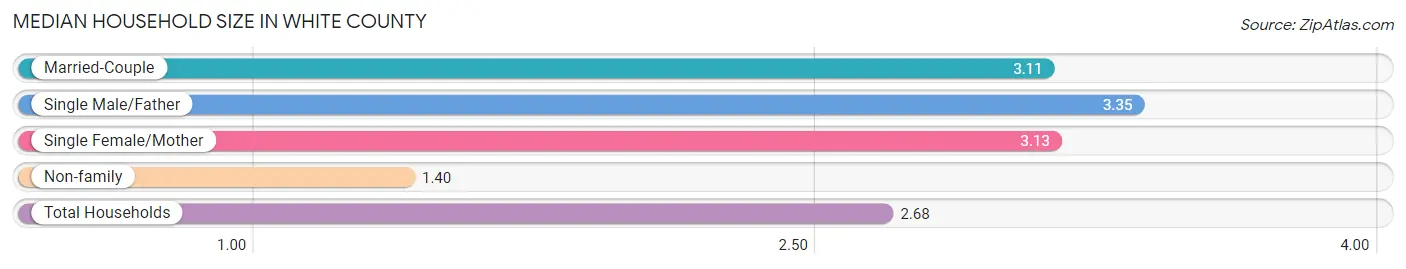
| Household Type | # Households | Household Size |
| Married-Couple | 6,295 (60.9%) | 3.11 |
| Single Male/Father | 207 (2.0%) | 3.35 |
| Single Female/Mother | 1,185 (11.5%) | 3.13 |
| Non-family | 2,657 (25.7%) | 1.40 |
| Total Households | 10,344 (100.0%) | 2.68 |
Household Size by Marriage Status in White County
Out of a total of 10,344 households in White County, 7,687 (74.3%) are family households, while 2,657 (25.7%) are nonfamily households. The most numerous type of family households are 2-person households, comprising 4,205, and the most common type of nonfamily households are 1-person households, comprising 2,162.

| Household Size | Family Households | Nonfamily Households |
| 1-Person Households | - | 2,162 (20.9%) |
| 2-Person Households | 4,205 (40.6%) | 403 (3.9%) |
| 3-Person Households | 1,373 (13.3%) | 5 (0.1%) |
| 4-Person Households | 1,322 (12.8%) | 0 (0.0%) |
| 5-Person Households | 356 (3.4%) | 21 (0.2%) |
| 6-Person Households | 287 (2.8%) | 66 (0.6%) |
| 7+ Person Households | 144 (1.4%) | 0 (0.0%) |
| Total | 7,687 (74.3%) | 2,657 (25.7%) |
Female Fertility in White County
Fertility by Age in White County
Average fertility rate in White County is 89.0 births per 1,000 women. Women in the age bracket of 20 to 34 years have the highest fertility rate with 176.0 births per 1,000 women. Women in the age bracket of 20 to 34 years acount for 81.5% of all women with births.
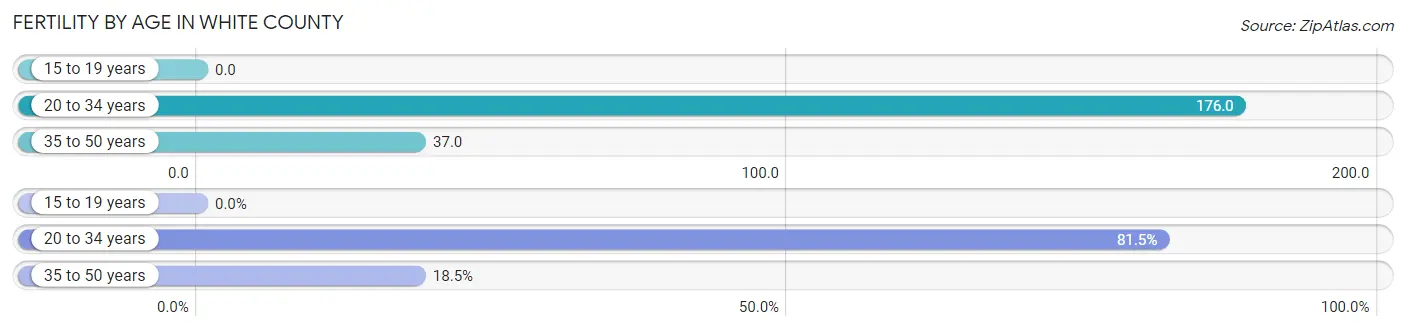
| Age Bracket | Women with Births | Births / 1,000 Women |
| 15 to 19 years | 0 (0.0%) | 0.0 |
| 20 to 34 years | 428 (81.5%) | 176.0 |
| 35 to 50 years | 97 (18.5%) | 37.0 |
| Total | 525 (100.0%) | 89.0 |
Fertility by Age by Marriage Status in White County
62.9% of women with births (525) in White County are married. The highest percentage of unmarried women with births falls into 35 to 50 years age bracket with 40.2% of them unmarried at the time of birth, while the lowest percentage of unmarried women with births belong to 20 to 34 years age bracket with 36.5% of them unmarried.

| Age Bracket | Married | Unmarried |
| 15 to 19 years | 0 (0.0%) | 0 (0.0%) |
| 20 to 34 years | 272 (63.5%) | 156 (36.4%) |
| 35 to 50 years | 58 (59.8%) | 39 (40.2%) |
| Total | 330 (62.9%) | 195 (37.1%) |
Fertility by Education in White County
Average fertility rate in White County is 89.0 births per 1,000 women. Women with the education attainment of less than high school have the highest fertility rate of 146.0 births per 1,000 women, while women with the education attainment of graduate degree have the lowest fertility at 17.0 births per 1,000 women. Women with the education attainment of college or associate's degree represent 29.3% of all women with births.
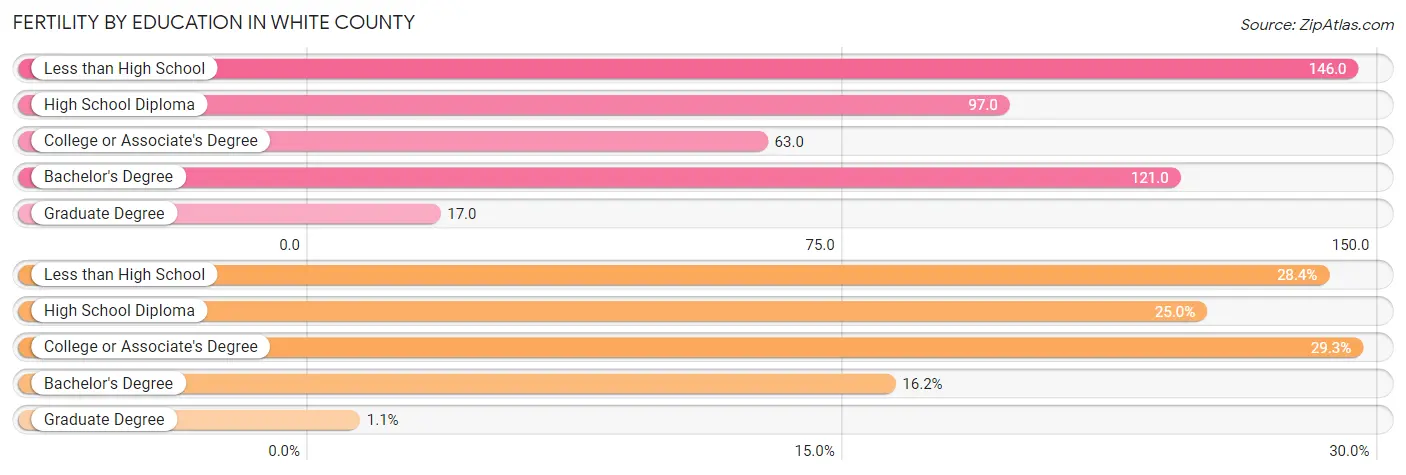
| Educational Attainment | Women with Births | Births / 1,000 Women |
| Less than High School | 149 (28.4%) | 146.0 |
| High School Diploma | 131 (24.9%) | 97.0 |
| College or Associate's Degree | 154 (29.3%) | 63.0 |
| Bachelor's Degree | 85 (16.2%) | 121.0 |
| Graduate Degree | 6 (1.1%) | 17.0 |
| Total | 525 (100.0%) | 89.0 |
Fertility by Education by Marriage Status in White County
37.1% of women with births in White County are unmarried. Women with the educational attainment of bachelor's degree are most likely to be married with 97.7% of them married at childbirth, while women with the educational attainment of graduate degree are least likely to be married with 100.0% of them unmarried at childbirth.
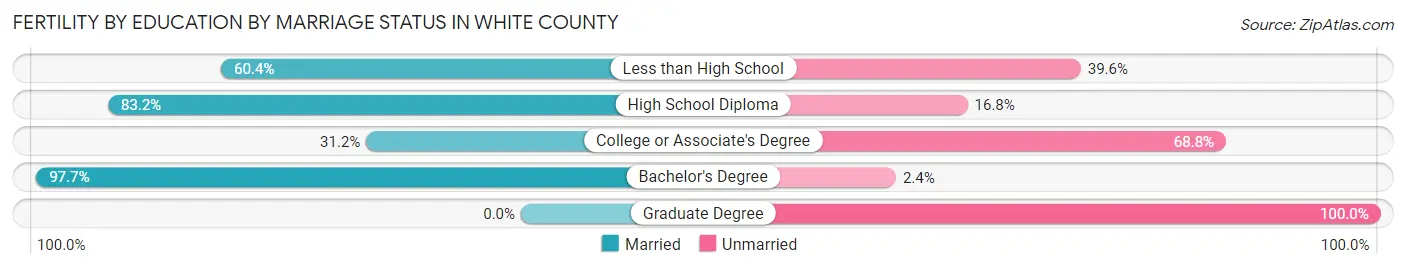
| Educational Attainment | Married | Unmarried |
| Less than High School | 90 (60.4%) | 59 (39.6%) |
| High School Diploma | 109 (83.2%) | 22 (16.8%) |
| College or Associate's Degree | 48 (31.2%) | 106 (68.8%) |
| Bachelor's Degree | 83 (97.7%) | 2 (2.4%) |
| Graduate Degree | 0 (0.0%) | 6 (100.0%) |
| Total | 330 (62.9%) | 195 (37.1%) |
Income in White County
Income Overview in White County
Per Capita Income in White County is $32,311, while median incomes of families and households are $82,535 and $66,256 respectively.
| Characteristic | Number | Measure |
| Per Capita Income | 28,165 | $32,311 |
| Median Family Income | 7,687 | $82,535 |
| Mean Family Income | 7,687 | $93,450 |
| Median Household Income | 10,344 | $66,256 |
| Mean Household Income | 10,344 | $83,004 |
| Income Deficit | 7,687 | $9,900 |
| Wage / Income Gap (%) | 28,165 | 34.72% |
| Wage / Income Gap ($) | 28,165 | 65.28¢ per $1 |
| Gini / Inequality Index | 28,165 | 0.43 |
Earnings by Sex in White County
Average Earnings in White County are $32,186, $39,912 for men and $26,056 for women, a difference of 34.7%.
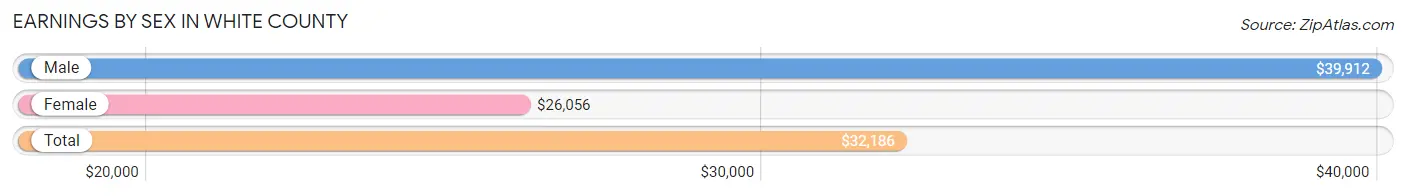
| Sex | Number | Average Earnings |
| Male | 7,599 (53.2%) | $39,912 |
| Female | 6,685 (46.8%) | $26,056 |
| Total | 14,284 (100.0%) | $32,186 |
Earnings by Sex by Income Bracket in White County
The most common earnings brackets in White County are $75,000 to $99,999 for men (1,098 | 14.4%) and $5,000 to $7,499 for women (737 | 11.0%).

| Income | Male | Female |
| $2,499 or less | 752 (9.9%) | 463 (6.9%) |
| $2,500 to $4,999 | 284 (3.7%) | 475 (7.1%) |
| $5,000 to $7,499 | 104 (1.4%) | 737 (11.0%) |
| $7,500 to $9,999 | 161 (2.1%) | 92 (1.4%) |
| $10,000 to $12,499 | 308 (4.1%) | 137 (2.1%) |
| $12,500 to $14,999 | 324 (4.3%) | 298 (4.5%) |
| $15,000 to $17,499 | 141 (1.9%) | 359 (5.4%) |
| $17,500 to $19,999 | 202 (2.7%) | 151 (2.3%) |
| $20,000 to $22,499 | 140 (1.8%) | 175 (2.6%) |
| $22,500 to $24,999 | 236 (3.1%) | 262 (3.9%) |
| $25,000 to $29,999 | 444 (5.8%) | 681 (10.2%) |
| $30,000 to $34,999 | 281 (3.7%) | 452 (6.8%) |
| $35,000 to $39,999 | 436 (5.7%) | 334 (5.0%) |
| $40,000 to $44,999 | 440 (5.8%) | 476 (7.1%) |
| $45,000 to $49,999 | 380 (5.0%) | 251 (3.7%) |
| $50,000 to $54,999 | 185 (2.4%) | 177 (2.6%) |
| $55,000 to $64,999 | 681 (9.0%) | 352 (5.3%) |
| $65,000 to $74,999 | 341 (4.5%) | 237 (3.5%) |
| $75,000 to $99,999 | 1,098 (14.4%) | 379 (5.7%) |
| $100,000+ | 661 (8.7%) | 197 (2.9%) |
| Total | 7,599 (100.0%) | 6,685 (100.0%) |
Earnings by Sex by Educational Attainment in White County
Average earnings in White County are $46,190 for men and $31,604 for women, a difference of 31.6%. Men with an educational attainment of graduate degree enjoy the highest average annual earnings of $77,885, while those with high school diploma education earn the least with $39,783. Women with an educational attainment of graduate degree earn the most with the average annual earnings of $51,458, while those with high school diploma education have the smallest earnings of $27,387.
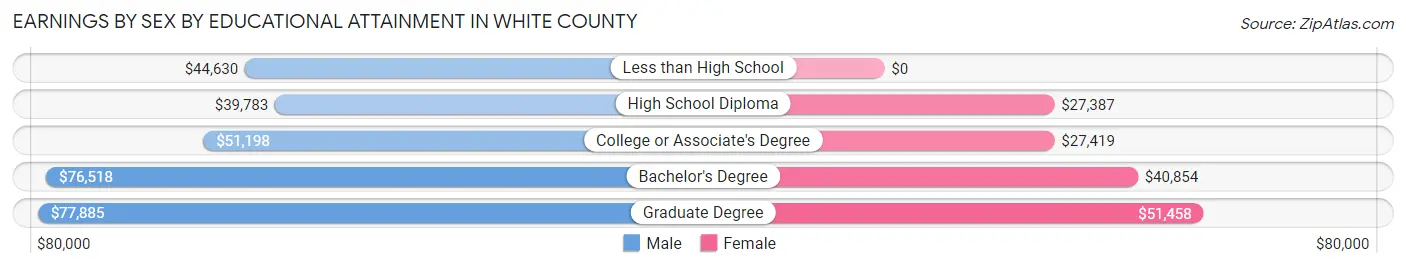
| Educational Attainment | Male Income | Female Income |
| Less than High School | $44,630 | $0 |
| High School Diploma | $39,783 | $27,387 |
| College or Associate's Degree | $51,198 | $27,419 |
| Bachelor's Degree | $76,518 | $40,854 |
| Graduate Degree | $77,885 | $51,458 |
| Total | $46,190 | $31,604 |
Family Income in White County
Family Income Brackets in White County
According to the White County family income data, there are 1,791 families falling into the $75,000 to $99,999 income range, which is the most common income bracket and makes up 23.3% of all families. Conversely, the $10,000 to $14,999 income bracket is the least frequent group with only 85 families (1.1%) belonging to this category.
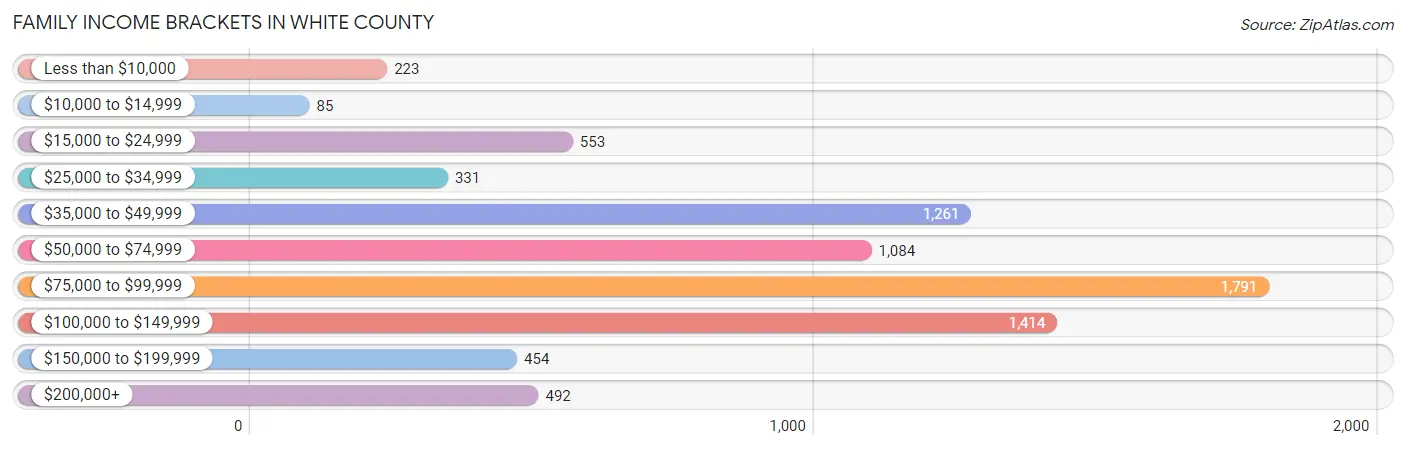
| Income Bracket | # Families | % Families |
| Less than $10,000 | 223 | 2.9% |
| $10,000 to $14,999 | 85 | 1.1% |
| $15,000 to $24,999 | 553 | 7.2% |
| $25,000 to $34,999 | 331 | 4.3% |
| $35,000 to $49,999 | 1,261 | 16.4% |
| $50,000 to $74,999 | 1,084 | 14.1% |
| $75,000 to $99,999 | 1,791 | 23.3% |
| $100,000 to $149,999 | 1,414 | 18.4% |
| $150,000 to $199,999 | 454 | 5.9% |
| $200,000+ | 492 | 6.4% |
Family Income by Famaliy Size in White County
7+ person families (129 | 1.7%) account for the highest median family income in White County with $169,494 per family, while 2-person families (4,288 | 55.8%) have the highest median income of $38,968 per family member.

| Income Bracket | # Families | Median Income |
| 2-Person Families | 4,288 (55.8%) | $77,935 |
| 3-Person Families | 1,520 (19.8%) | $75,909 |
| 4-Person Families | 1,116 (14.5%) | $91,455 |
| 5-Person Families | 417 (5.4%) | $93,487 |
| 6-Person Families | 217 (2.8%) | $0 |
| 7+ Person Families | 129 (1.7%) | $169,494 |
| Total | 7,687 (100.0%) | $82,535 |
Family Income by Number of Earners in White County
The median family income in White County is $82,535, with families comprising 3+ earners (641) having the highest median family income of $98,609, while families with no earners (1,579) have the lowest median family income of $58,458, accounting for 8.3% and 20.5% of families, respectively.
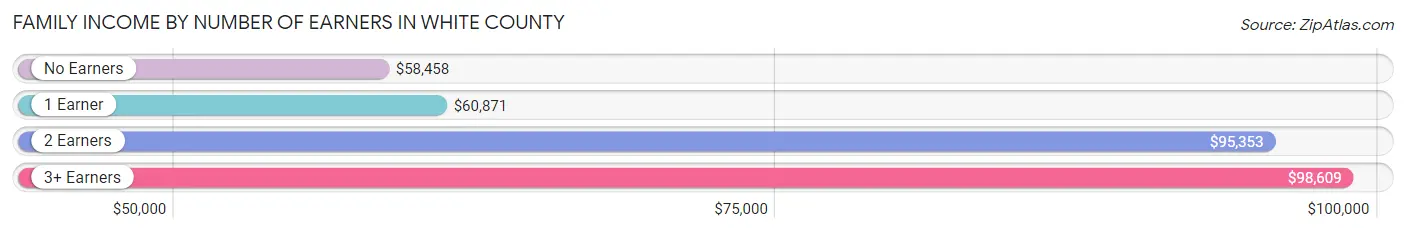
| Number of Earners | # Families | Median Income |
| No Earners | 1,579 (20.5%) | $58,458 |
| 1 Earner | 2,473 (32.2%) | $60,871 |
| 2 Earners | 2,994 (39.0%) | $95,353 |
| 3+ Earners | 641 (8.3%) | $98,609 |
| Total | 7,687 (100.0%) | $82,535 |
Household Income in White County
Household Income Brackets in White County
With 1,903 households falling in the category, the $75,000 to $99,999 income range is the most frequent in White County, accounting for 18.4% of all households. In contrast, only 248 households (2.4%) fall into the $10,000 to $14,999 income bracket, making it the least populous group.
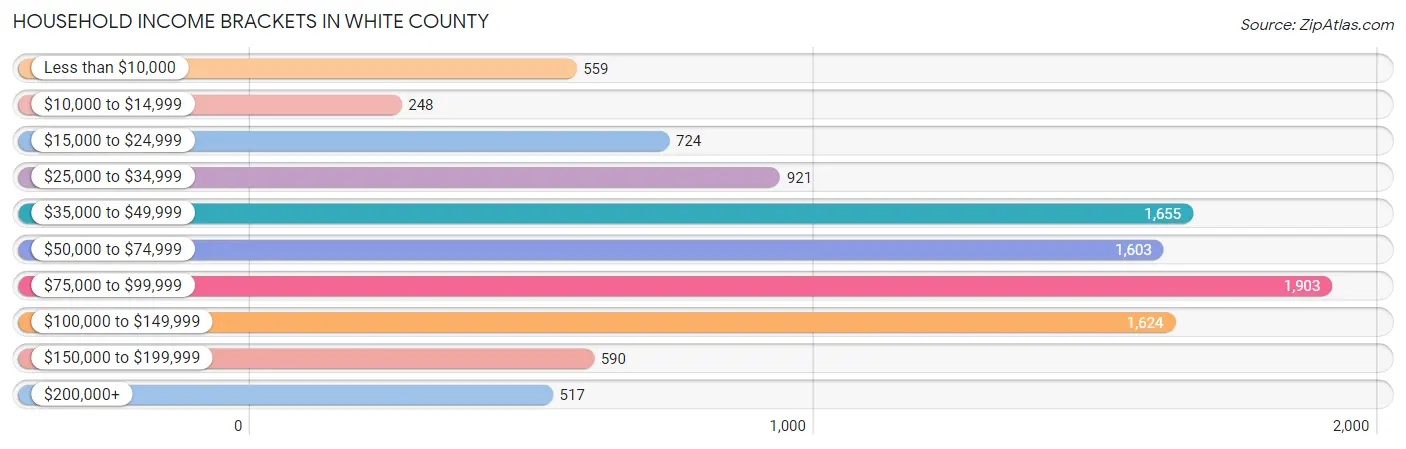
| Income Bracket | # Households | % Households |
| Less than $10,000 | 559 | 5.4% |
| $10,000 to $14,999 | 248 | 2.4% |
| $15,000 to $24,999 | 724 | 7.0% |
| $25,000 to $34,999 | 921 | 8.9% |
| $35,000 to $49,999 | 1,655 | 16.0% |
| $50,000 to $74,999 | 1,603 | 15.5% |
| $75,000 to $99,999 | 1,903 | 18.4% |
| $100,000 to $149,999 | 1,624 | 15.7% |
| $150,000 to $199,999 | 590 | 5.7% |
| $200,000+ | 517 | 5.0% |
Household Income by Householder Age in White County
The median household income in White County is $66,256, with the highest median household income of $81,134 found in the 45 to 64 years age bracket for the primary householder. A total of 3,992 households (38.6%) fall into this category. Meanwhile, the 15 to 24 years age bracket for the primary householder has the lowest median household income of $35,986, with 294 households (2.8%) in this group.
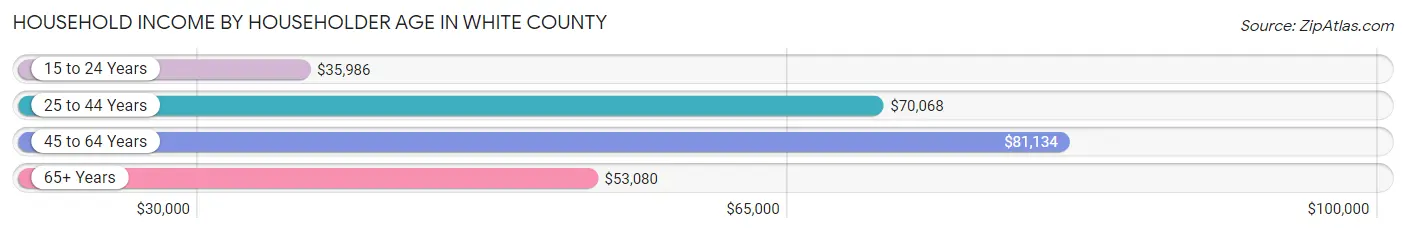
| Income Bracket | # Households | Median Income |
| 15 to 24 Years | 294 (2.8%) | $35,986 |
| 25 to 44 Years | 2,410 (23.3%) | $70,068 |
| 45 to 64 Years | 3,992 (38.6%) | $81,134 |
| 65+ Years | 3,648 (35.3%) | $53,080 |
| Total | 10,344 (100.0%) | $66,256 |
Poverty in White County
Income Below Poverty by Sex and Age in White County
With 11.0% poverty level for males and 14.9% for females among the residents of White County, 16 and 17 year old males and 6 to 11 year old females are the most vulnerable to poverty, with 114 males (31.1%) and 149 females (37.4%) in their respective age groups living below the poverty level.
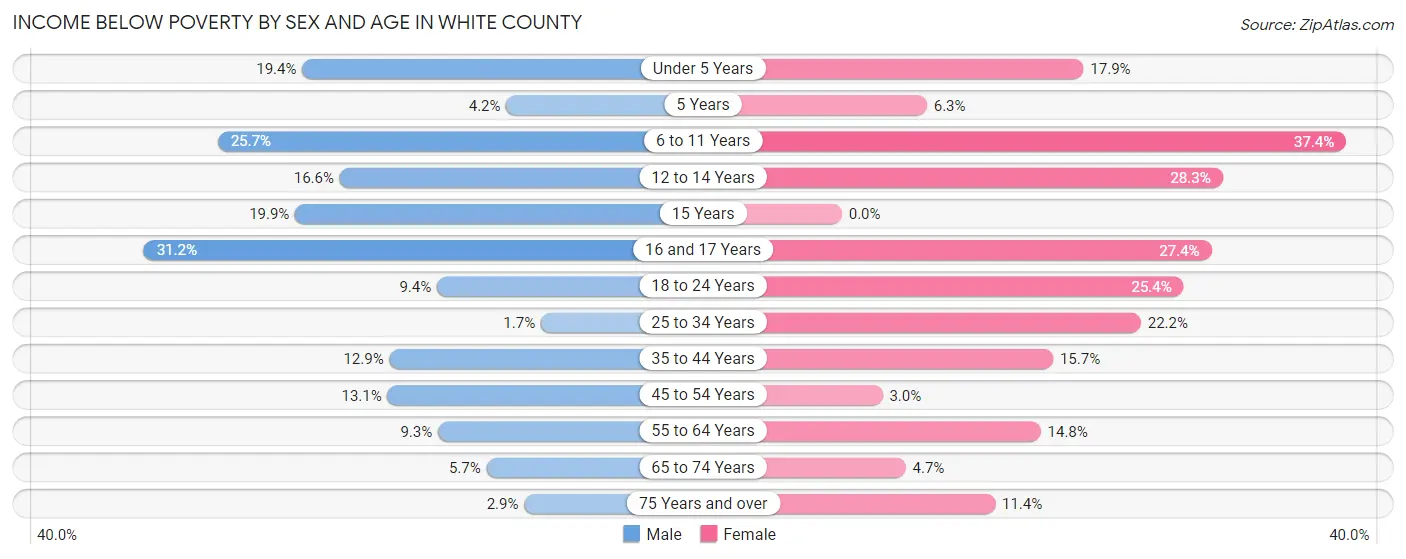
| Age Bracket | Male | Female |
| Under 5 Years | 118 (19.4%) | 108 (17.9%) |
| 5 Years | 3 (4.2%) | 14 (6.3%) |
| 6 to 11 Years | 244 (25.7%) | 149 (37.4%) |
| 12 to 14 Years | 78 (16.6%) | 230 (28.3%) |
| 15 Years | 44 (19.9%) | 0 (0.0%) |
| 16 and 17 Years | 114 (31.1%) | 107 (27.4%) |
| 18 to 24 Years | 120 (9.4%) | 310 (25.4%) |
| 25 to 34 Years | 23 (1.7%) | 297 (22.2%) |
| 35 to 44 Years | 192 (12.9%) | 229 (15.7%) |
| 45 to 54 Years | 222 (13.1%) | 56 (3.0%) |
| 55 to 64 Years | 184 (9.3%) | 326 (14.8%) |
| 65 to 74 Years | 103 (5.7%) | 92 (4.7%) |
| 75 Years and over | 34 (2.9%) | 164 (11.4%) |
| Total | 1,479 (11.0%) | 2,082 (14.9%) |
Income Above Poverty by Sex and Age in White County
According to the poverty statistics in White County, males aged 25 to 34 years and females aged 15 years are the age groups that are most secure financially, with 98.3% of males and 100.0% of females in these age groups living above the poverty line.
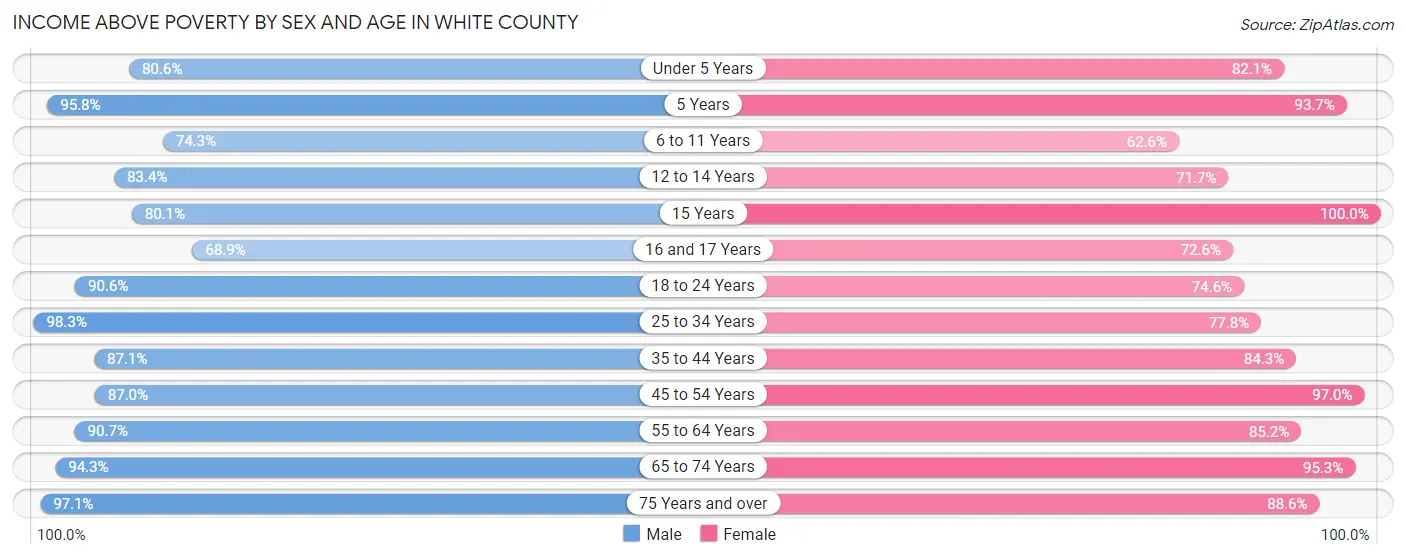
| Age Bracket | Male | Female |
| Under 5 Years | 491 (80.6%) | 494 (82.1%) |
| 5 Years | 68 (95.8%) | 208 (93.7%) |
| 6 to 11 Years | 707 (74.3%) | 249 (62.6%) |
| 12 to 14 Years | 392 (83.4%) | 584 (71.7%) |
| 15 Years | 177 (80.1%) | 83 (100.0%) |
| 16 and 17 Years | 252 (68.9%) | 283 (72.6%) |
| 18 to 24 Years | 1,159 (90.6%) | 912 (74.6%) |
| 25 to 34 Years | 1,363 (98.3%) | 1,041 (77.8%) |
| 35 to 44 Years | 1,295 (87.1%) | 1,231 (84.3%) |
| 45 to 54 Years | 1,479 (87.0%) | 1,797 (97.0%) |
| 55 to 64 Years | 1,794 (90.7%) | 1,883 (85.2%) |
| 65 to 74 Years | 1,704 (94.3%) | 1,849 (95.3%) |
| 75 Years and over | 1,139 (97.1%) | 1,277 (88.6%) |
| Total | 12,020 (89.0%) | 11,891 (85.1%) |
Income Below Poverty Among Married-Couple Families in White County
The poverty statistics for married-couple families in White County show that 7.4% or 468 of the total 6,295 families live below the poverty line. Families with 3 or 4 children have the highest poverty rate of 29.6%, comprising of 139 families. On the other hand, families with 5 or more children have the lowest poverty rate of 0.0%, which includes 0 families.

| Children | Above Poverty | Below Poverty |
| No Children | 4,193 (94.1%) | 265 (5.9%) |
| 1 or 2 Children | 1,277 (95.2%) | 64 (4.8%) |
| 3 or 4 Children | 330 (70.4%) | 139 (29.6%) |
| 5 or more Children | 27 (100.0%) | 0 (0.0%) |
| Total | 5,827 (92.6%) | 468 (7.4%) |
Income Below Poverty Among Single-Parent Households in White County
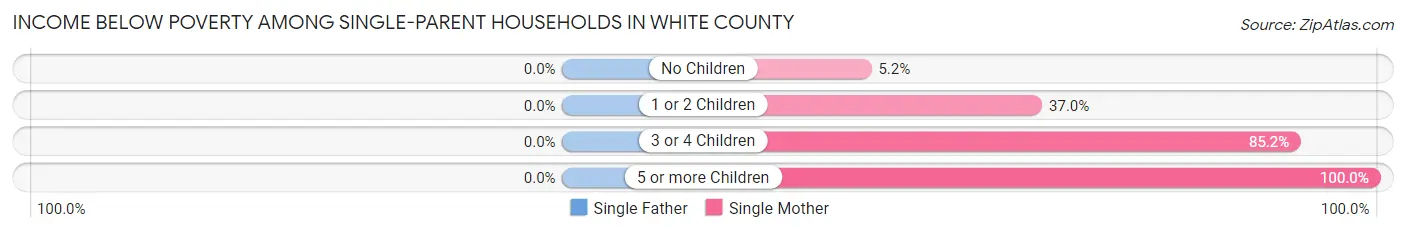
| Children | Single Father | Single Mother |
| No Children | 0 (0.0%) | 27 (5.2%) |
| 1 or 2 Children | 0 (0.0%) | 214 (37.0%) |
| 3 or 4 Children | 0 (0.0%) | 69 (85.2%) |
| 5 or more Children | 0 (0.0%) | 3 (100.0%) |
| Total | 0 (0.0%) | 313 (26.4%) |
Income Below Poverty Among Married-Couple vs Single-Parent Households in White County
The poverty data for White County shows that 468 of the married-couple family households (7.4%) and 313 of the single-parent households (22.5%) are living below the poverty level. Within the married-couple family households, those with 3 or 4 children have the highest poverty rate, with 139 households (29.6%) falling below the poverty line. Among the single-parent households, those with 5 or more children have the highest poverty rate, with 3 household (100.0%) living below poverty.

| Children | Married-Couple Families | Single-Parent Households |
| No Children | 265 (5.9%) | 27 (4.4%) |
| 1 or 2 Children | 64 (4.8%) | 214 (31.2%) |
| 3 or 4 Children | 139 (29.6%) | 69 (82.1%) |
| 5 or more Children | 0 (0.0%) | 3 (100.0%) |
| Total | 468 (7.4%) | 313 (22.5%) |
Employment Characteristics in White County
Employment by Class of Employer in White County
Among the 12,478 employed individuals in White County, private company employees (7,932 | 63.6%), local government employees (1,256 | 10.1%), and self-employed (not incorporated) (1,030 | 8.3%) make up the most common classes of employment.
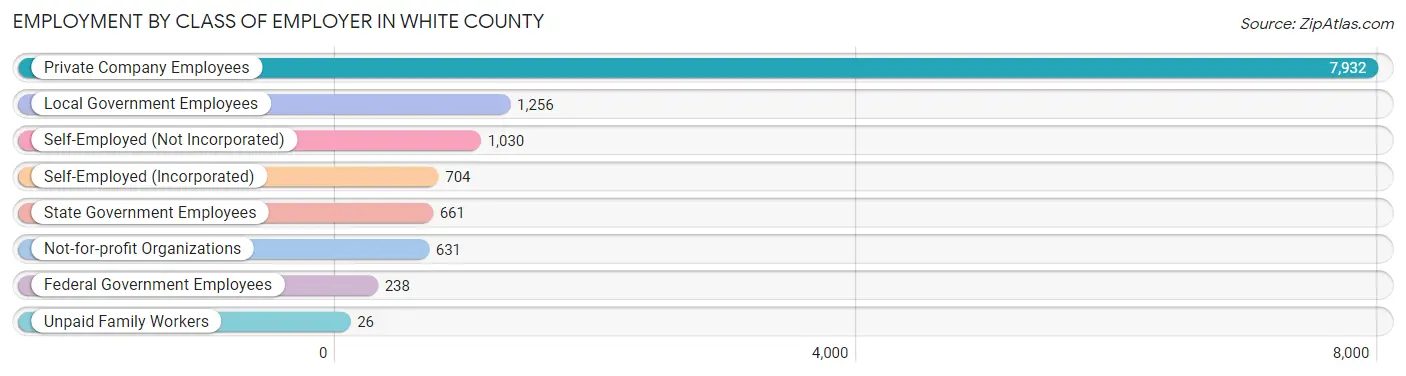
| Employer Class | # Employees | % Employees |
| Private Company Employees | 7,932 | 63.6% |
| Self-Employed (Incorporated) | 704 | 5.6% |
| Self-Employed (Not Incorporated) | 1,030 | 8.3% |
| Not-for-profit Organizations | 631 | 5.1% |
| Local Government Employees | 1,256 | 10.1% |
| State Government Employees | 661 | 5.3% |
| Federal Government Employees | 238 | 1.9% |
| Unpaid Family Workers | 26 | 0.2% |
| Total | 12,478 | 100.0% |
Employment Status by Age in White County
According to the labor force statistics for White County, out of the total population over 16 years of age (23,479), 55.6% or 13,054 individuals are in the labor force, with 3.5% or 457 of them unemployed. The age group with the highest labor force participation rate is 35 to 44 years, with 81.1% or 2,396 individuals in the labor force. Within the labor force, the 16 to 19 years age range has the highest percentage of unemployed individuals, with 29.0% or 204 of them being unemployed.

| Age Bracket | In Labor Force | Unemployed |
| 16 to 19 Years | 704 (48.9%) | 204 (29.0%) |
| 20 to 24 Years | 1,672 (79.0%) | 62 (3.7%) |
| 25 to 29 Years | 1,137 (80.8%) | 0 (0.0%) |
| 30 to 34 Years | 893 (65.9%) | 0 (0.0%) |
| 35 to 44 Years | 2,396 (81.1%) | 86 (3.6%) |
| 45 to 54 Years | 2,696 (75.7%) | 35 (1.3%) |
| 55 to 59 Years | 1,667 (72.8%) | 20 (1.2%) |
| 60 to 64 Years | 994 (52.1%) | 13 (1.3%) |
| 65 to 74 Years | 774 (20.3%) | 35 (4.5%) |
| 75 Years and over | 134 (5.1%) | 0 (0.0%) |
| Total | 13,054 (55.6%) | 457 (3.5%) |
Employment Status by Educational Attainment in White County
According to labor force statistics for White County, 72.6% of individuals (9,784) out of the total population between 25 and 64 years of age (13,476) are in the labor force, with 1.6% or 157 of them being unemployed. The group with the highest labor force participation rate are those with the educational attainment of bachelor's degree or higher, with 80.7% or 2,302 individuals in the labor force. Within the labor force, individuals with less than high school education have the highest percentage of unemployment, with 6.7% or 73 of them being unemployed.

| Educational Attainment | In Labor Force | Unemployed |
| Less than High School | 1,088 (58.1%) | 125 (6.7%) |
| High School Diploma | 3,069 (75.6%) | 45 (1.1%) |
| College / Associate Degree | 3,322 (70.8%) | 52 (1.1%) |
| Bachelor's Degree or higher | 2,302 (80.7%) | 11 (0.4%) |
| Total | 9,784 (72.6%) | 216 (1.6%) |
Employment Occupations by Sex in White County
Management, Business, Science and Arts Occupations
The most common Management, Business, Science and Arts occupations in White County are Community & Social Service (1,387 | 11.0%), Health Diagnosing & Treating (1,085 | 8.6%), Management (963 | 7.6%), Education Instruction & Library (756 | 6.0%), and Health Technologists (604 | 4.8%).

Management, Business, Science and Arts Occupations by Sex
Within the Management, Business, Science and Arts occupations in White County, the most male-oriented occupations are Life, Physical & Social Science (93.5%), Architecture & Engineering (89.2%), and Computers, Engineering & Science (72.6%), while the most female-oriented occupations are Health Technologists (93.9%), Education, Arts & Media (70.5%), and Health Diagnosing & Treating (62.2%).
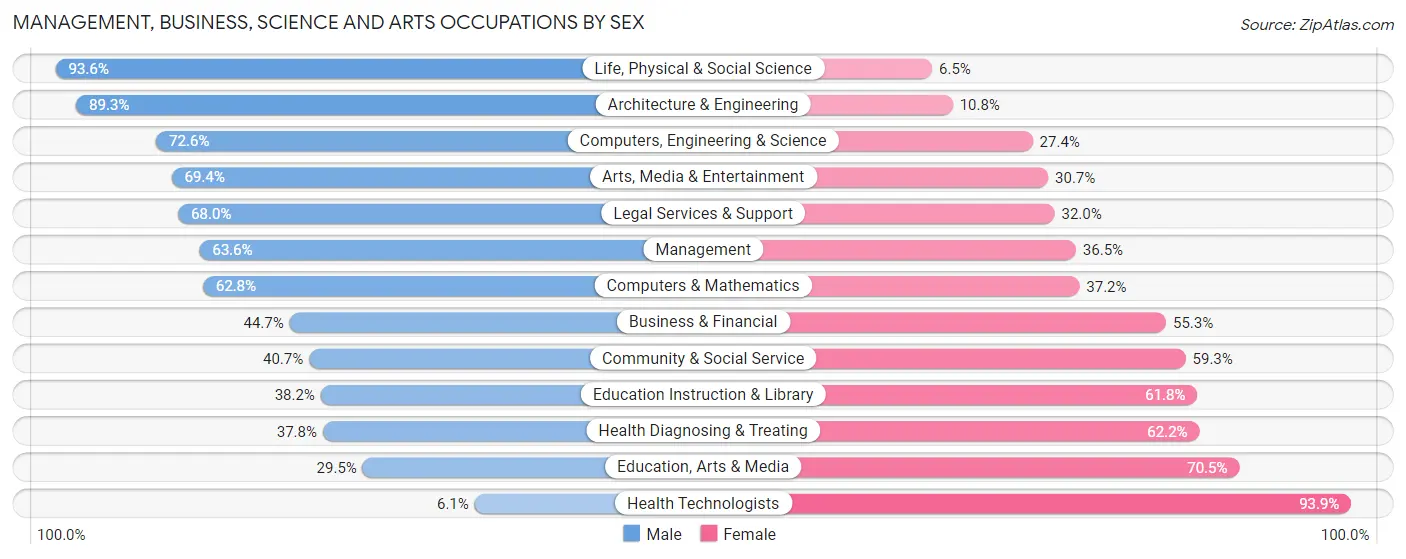
| Occupation | Male | Female |
| Management | 612 (63.5%) | 351 (36.4%) |
| Business & Financial | 187 (44.7%) | 231 (55.3%) |
| Computers, Engineering & Science | 254 (72.6%) | 96 (27.4%) |
| Computers & Mathematics | 142 (62.8%) | 84 (37.2%) |
| Architecture & Engineering | 83 (89.2%) | 10 (10.7%) |
| Life, Physical & Social Science | 29 (93.5%) | 2 (6.5%) |
| Community & Social Service | 564 (40.7%) | 823 (59.3%) |
| Education, Arts & Media | 120 (29.5%) | 287 (70.5%) |
| Legal Services & Support | 17 (68.0%) | 8 (32.0%) |
| Education Instruction & Library | 289 (38.2%) | 467 (61.8%) |
| Arts, Media & Entertainment | 138 (69.4%) | 61 (30.6%) |
| Health Diagnosing & Treating | 410 (37.8%) | 675 (62.2%) |
| Health Technologists | 37 (6.1%) | 567 (93.9%) |
| Total (Category) | 2,027 (48.2%) | 2,176 (51.8%) |
| Total (Overall) | 6,804 (54.0%) | 5,794 (46.0%) |
Services Occupations
The most common Services occupations in White County are Food Preparation & Serving (961 | 7.6%), Cleaning & Maintenance (533 | 4.2%), Security & Protection (406 | 3.2%), Healthcare Support (272 | 2.2%), and Law Enforcement (217 | 1.7%).
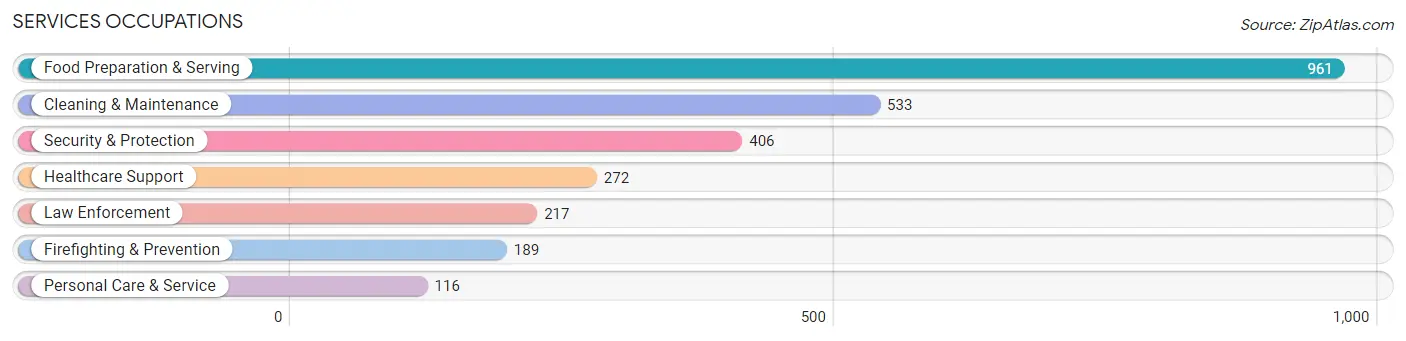
Services Occupations by Sex
Within the Services occupations in White County, the most male-oriented occupations are Firefighting & Prevention (95.8%), Security & Protection (94.1%), and Law Enforcement (92.6%), while the most female-oriented occupations are Healthcare Support (95.6%), Personal Care & Service (87.9%), and Food Preparation & Serving (46.3%).
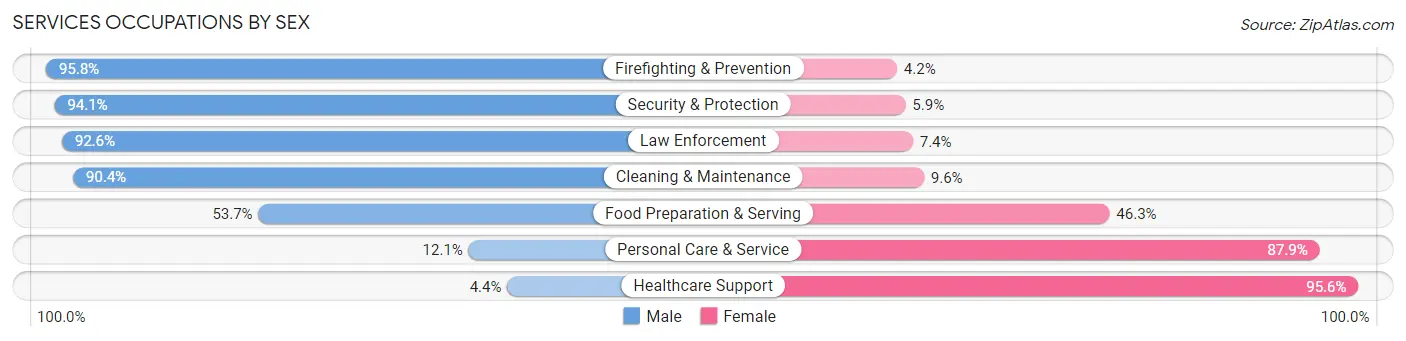
| Occupation | Male | Female |
| Healthcare Support | 12 (4.4%) | 260 (95.6%) |
| Security & Protection | 382 (94.1%) | 24 (5.9%) |
| Firefighting & Prevention | 181 (95.8%) | 8 (4.2%) |
| Law Enforcement | 201 (92.6%) | 16 (7.4%) |
| Food Preparation & Serving | 516 (53.7%) | 445 (46.3%) |
| Cleaning & Maintenance | 482 (90.4%) | 51 (9.6%) |
| Personal Care & Service | 14 (12.1%) | 102 (87.9%) |
| Total (Category) | 1,406 (61.5%) | 882 (38.6%) |
| Total (Overall) | 6,804 (54.0%) | 5,794 (46.0%) |
Sales and Office Occupations
The most common Sales and Office occupations in White County are Sales & Related (1,490 | 11.8%), and Office & Administration (1,456 | 11.6%).

Sales and Office Occupations by Sex
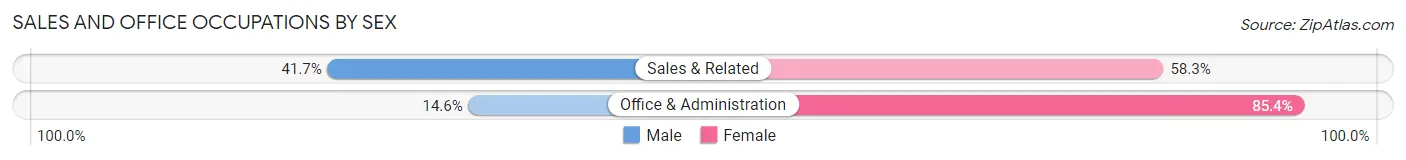
| Occupation | Male | Female |
| Sales & Related | 622 (41.7%) | 868 (58.3%) |
| Office & Administration | 213 (14.6%) | 1,243 (85.4%) |
| Total (Category) | 835 (28.3%) | 2,111 (71.7%) |
| Total (Overall) | 6,804 (54.0%) | 5,794 (46.0%) |
Natural Resources, Construction and Maintenance Occupations
The most common Natural Resources, Construction and Maintenance occupations in White County are Installation, Maintenance & Repair (956 | 7.6%), Construction & Extraction (518 | 4.1%), and Farming, Fishing & Forestry (24 | 0.2%).
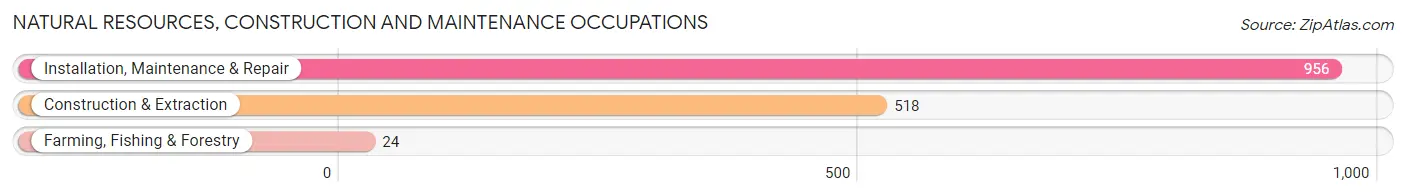
Natural Resources, Construction and Maintenance Occupations by Sex

| Occupation | Male | Female |
| Farming, Fishing & Forestry | 22 (91.7%) | 2 (8.3%) |
| Construction & Extraction | 518 (100.0%) | 0 (0.0%) |
| Installation, Maintenance & Repair | 935 (97.8%) | 21 (2.2%) |
| Total (Category) | 1,475 (98.5%) | 23 (1.5%) |
| Total (Overall) | 6,804 (54.0%) | 5,794 (46.0%) |
Production, Transportation and Moving Occupations
The most common Production, Transportation and Moving occupations in White County are Production (764 | 6.1%), Transportation (550 | 4.4%), and Material Moving (349 | 2.8%).

Production, Transportation and Moving Occupations by Sex
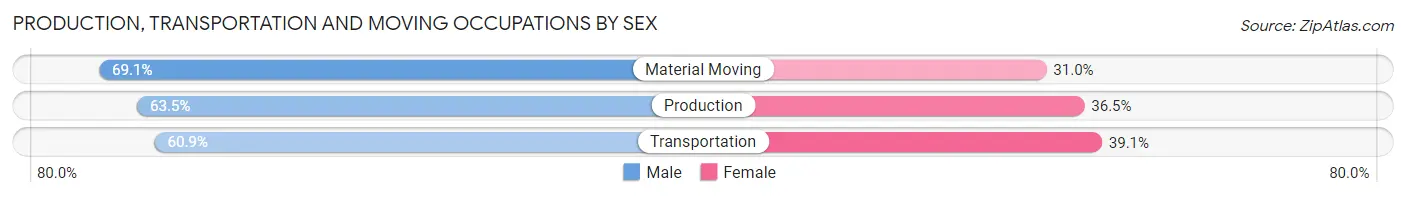
| Occupation | Male | Female |
| Production | 485 (63.5%) | 279 (36.5%) |
| Transportation | 335 (60.9%) | 215 (39.1%) |
| Material Moving | 241 (69.1%) | 108 (30.9%) |
| Total (Category) | 1,061 (63.8%) | 602 (36.2%) |
| Total (Overall) | 6,804 (54.0%) | 5,794 (46.0%) |
Employment Industries by Sex in White County
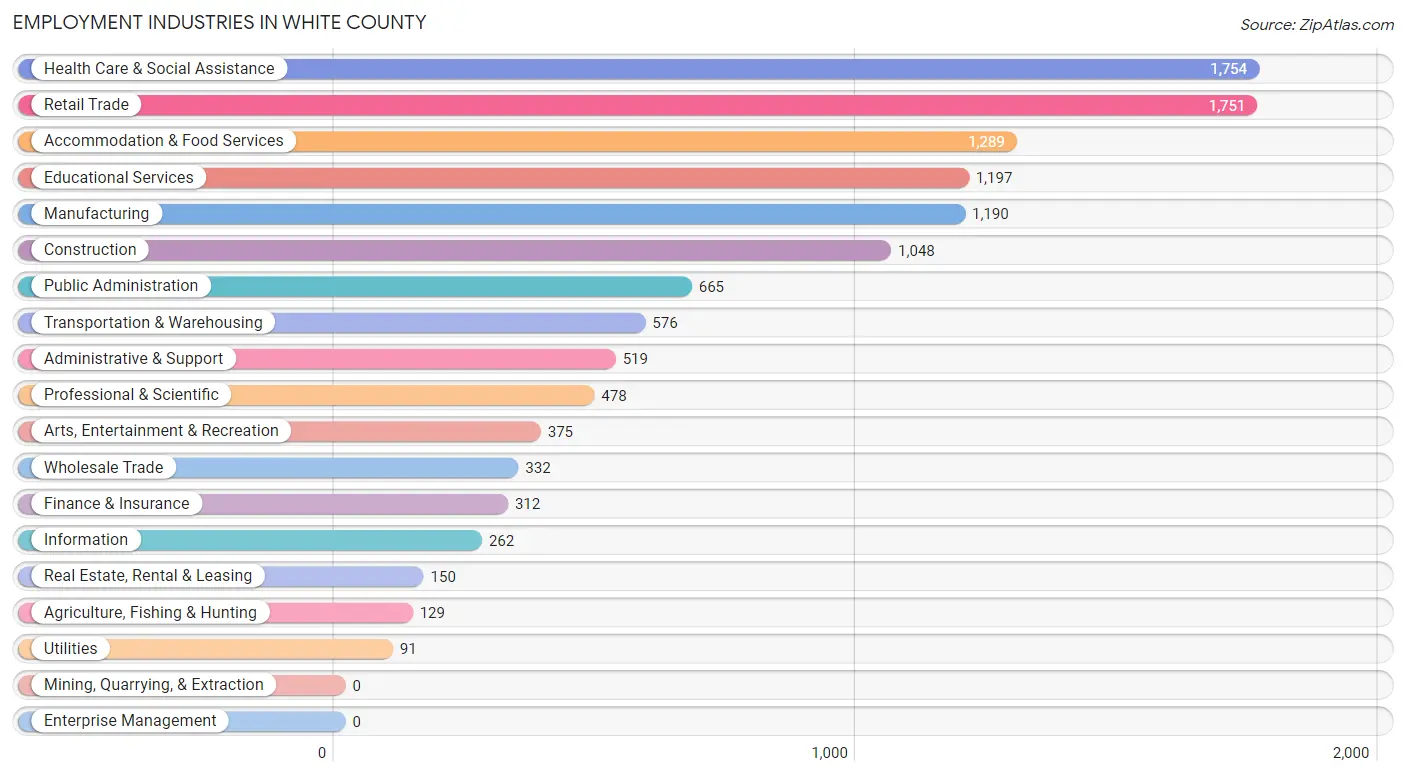
Employment Industries in White County
The major employment industries in White County include Health Care & Social Assistance (1,754 | 13.9%), Retail Trade (1,751 | 13.9%), Accommodation & Food Services (1,289 | 10.2%), Educational Services (1,197 | 9.5%), and Manufacturing (1,190 | 9.5%).
Employment Industries by Sex in White County
The White County industries that see more men than women are Utilities (100.0%), Construction (94.0%), and Agriculture, Fishing & Hunting (89.1%), whereas the industries that tend to have a higher number of women are Accommodation & Food Services (66.5%), Health Care & Social Assistance (66.2%), and Real Estate, Rental & Leasing (64.7%).
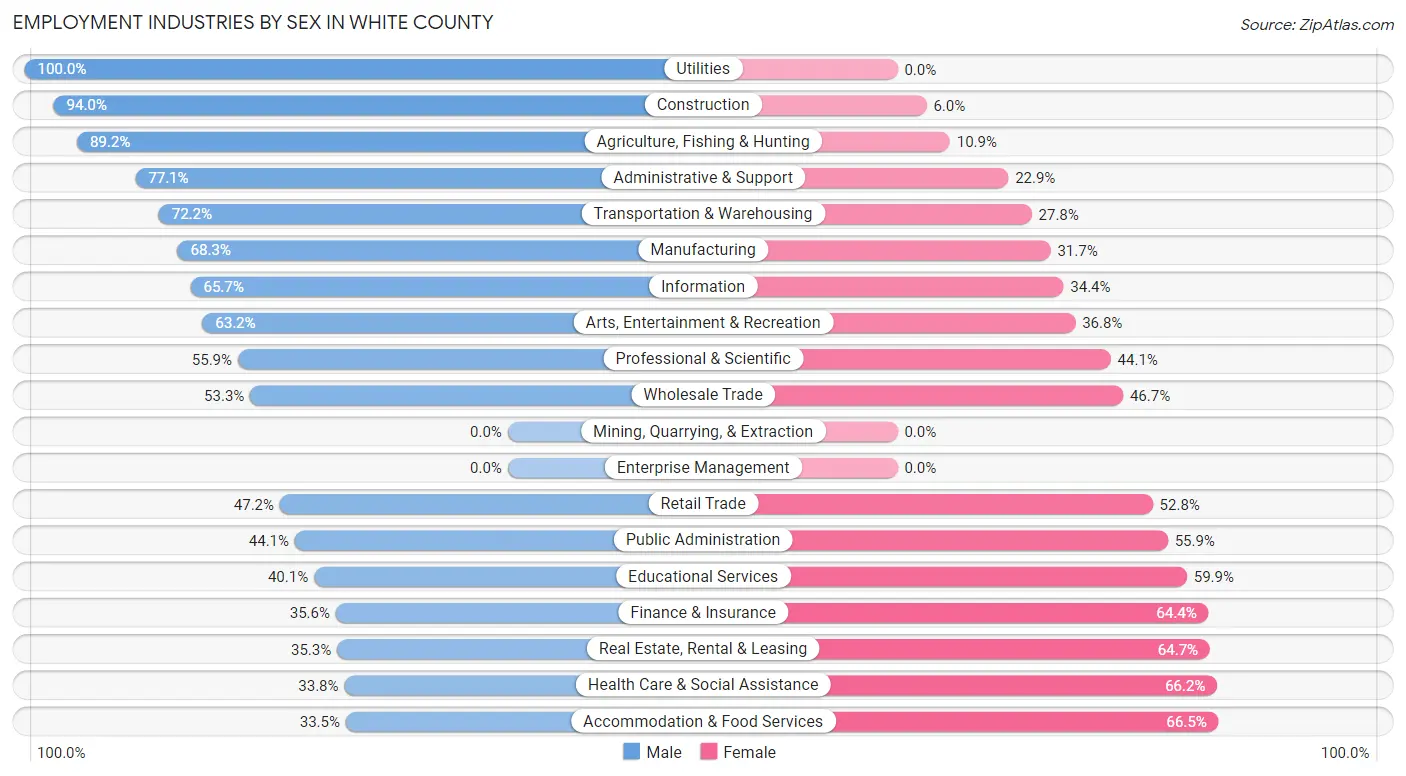
| Industry | Male | Female |
| Agriculture, Fishing & Hunting | 115 (89.1%) | 14 (10.8%) |
| Mining, Quarrying, & Extraction | 0 (0.0%) | 0 (0.0%) |
| Construction | 985 (94.0%) | 63 (6.0%) |
| Manufacturing | 813 (68.3%) | 377 (31.7%) |
| Wholesale Trade | 177 (53.3%) | 155 (46.7%) |
| Retail Trade | 826 (47.2%) | 925 (52.8%) |
| Transportation & Warehousing | 416 (72.2%) | 160 (27.8%) |
| Utilities | 91 (100.0%) | 0 (0.0%) |
| Information | 172 (65.6%) | 90 (34.4%) |
| Finance & Insurance | 111 (35.6%) | 201 (64.4%) |
| Real Estate, Rental & Leasing | 53 (35.3%) | 97 (64.7%) |
| Professional & Scientific | 267 (55.9%) | 211 (44.1%) |
| Enterprise Management | 0 (0.0%) | 0 (0.0%) |
| Administrative & Support | 400 (77.1%) | 119 (22.9%) |
| Educational Services | 480 (40.1%) | 717 (59.9%) |
| Health Care & Social Assistance | 593 (33.8%) | 1,161 (66.2%) |
| Arts, Entertainment & Recreation | 237 (63.2%) | 138 (36.8%) |
| Accommodation & Food Services | 432 (33.5%) | 857 (66.5%) |
| Public Administration | 293 (44.1%) | 372 (55.9%) |
| Total | 6,804 (54.0%) | 5,794 (46.0%) |
Education in White County
School Enrollment in White County
The most common levels of schooling among the 5,948 students in White County are high school (1,523 | 25.6%), middle school (1,516 | 25.5%), and college / undergraduate (1,364 | 22.9%).
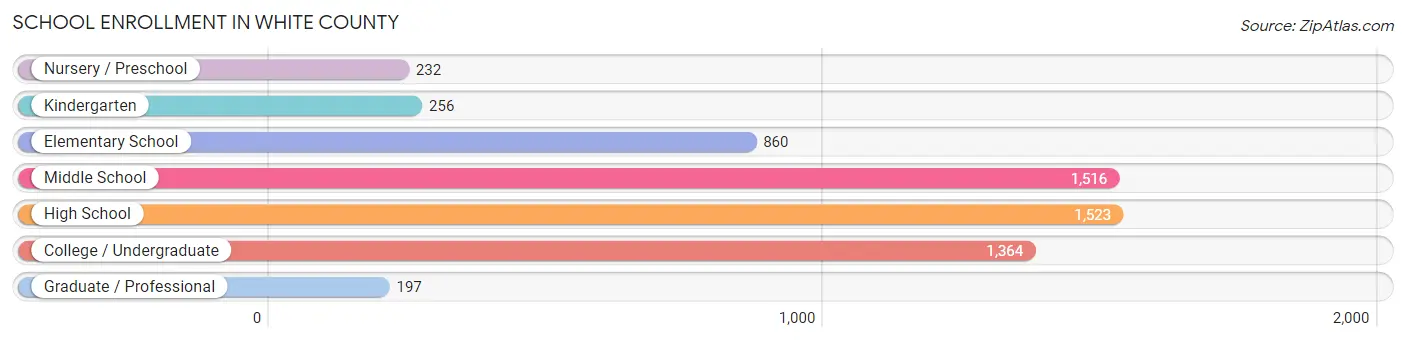
| School Level | # Students | % Students |
| Nursery / Preschool | 232 | 3.9% |
| Kindergarten | 256 | 4.3% |
| Elementary School | 860 | 14.5% |
| Middle School | 1,516 | 25.5% |
| High School | 1,523 | 25.6% |
| College / Undergraduate | 1,364 | 22.9% |
| Graduate / Professional | 197 | 3.3% |
| Total | 5,948 | 100.0% |
School Enrollment by Age by Funding Source in White County
Out of a total of 5,948 students who are enrolled in schools in White County, 874 (14.7%) attend a private institution, while the remaining 5,074 (85.3%) are enrolled in public schools. The age group of 35 years and over has the highest likelihood of being enrolled in private schools, with 167 (40.5% in the age bracket) enrolled. Conversely, the age group of 3 to 4 year olds has the lowest likelihood of being enrolled in a private school, with 102 (100.0% in the age bracket) attending a public institution.
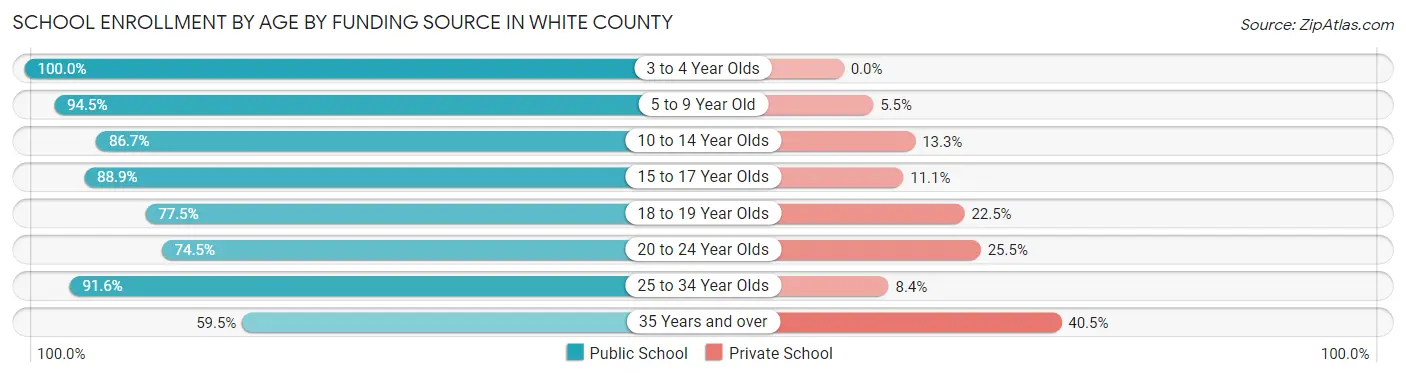
| Age Bracket | Public School | Private School |
| 3 to 4 Year Olds | 102 (100.0%) | 0 (0.0%) |
| 5 to 9 Year Old | 1,117 (94.5%) | 65 (5.5%) |
| 10 to 14 Year Olds | 1,510 (86.7%) | 232 (13.3%) |
| 15 to 17 Year Olds | 945 (88.9%) | 118 (11.1%) |
| 18 to 19 Year Olds | 458 (77.5%) | 133 (22.5%) |
| 20 to 24 Year Olds | 388 (74.5%) | 133 (25.5%) |
| 25 to 34 Year Olds | 307 (91.6%) | 28 (8.4%) |
| 35 Years and over | 245 (59.5%) | 167 (40.5%) |
| Total | 5,074 (85.3%) | 874 (14.7%) |
Educational Attainment by Field of Study in White County
Education (989 | 20.7%), business (959 | 20.0%), arts & humanities (509 | 10.6%), science & technology (434 | 9.1%), and engineering (374 | 7.8%) are the most common fields of study among 4,788 individuals in White County who have obtained a bachelor's degree or higher.
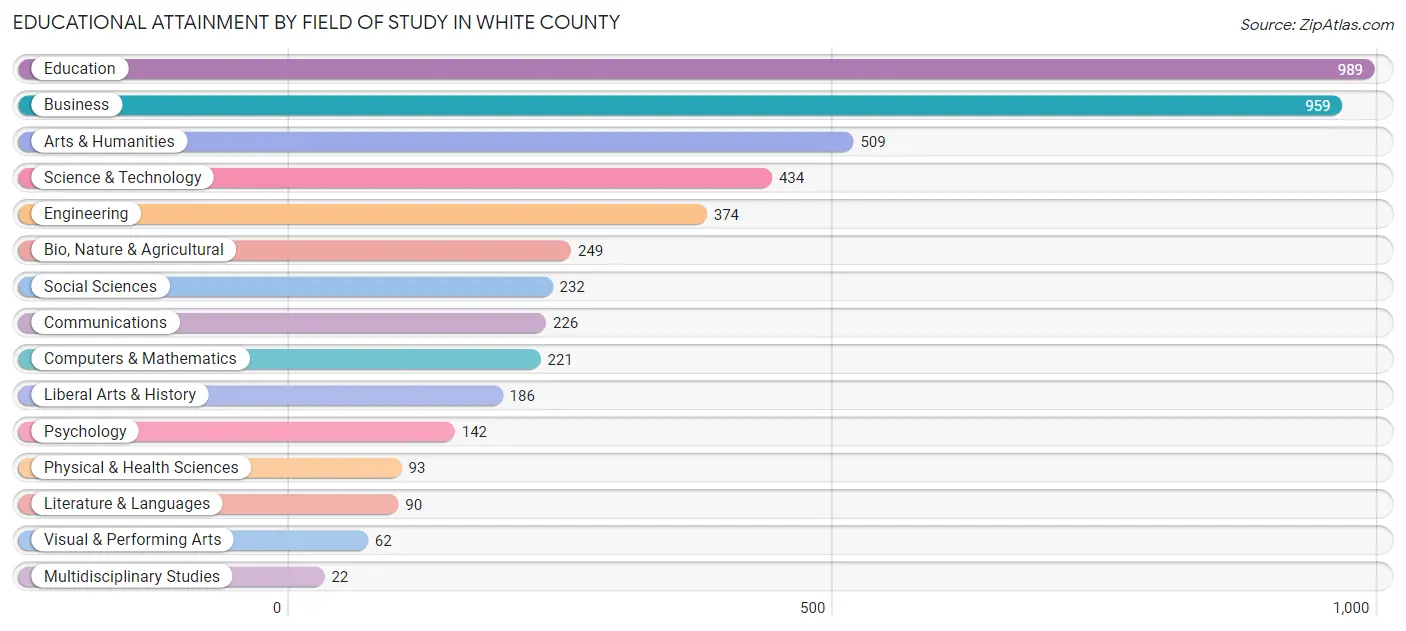
| Field of Study | # Graduates | % Graduates |
| Computers & Mathematics | 221 | 4.6% |
| Bio, Nature & Agricultural | 249 | 5.2% |
| Physical & Health Sciences | 93 | 1.9% |
| Psychology | 142 | 3.0% |
| Social Sciences | 232 | 4.9% |
| Engineering | 374 | 7.8% |
| Multidisciplinary Studies | 22 | 0.5% |
| Science & Technology | 434 | 9.1% |
| Business | 959 | 20.0% |
| Education | 989 | 20.7% |
| Literature & Languages | 90 | 1.9% |
| Liberal Arts & History | 186 | 3.9% |
| Visual & Performing Arts | 62 | 1.3% |
| Communications | 226 | 4.7% |
| Arts & Humanities | 509 | 10.6% |
| Total | 4,788 | 100.0% |
Transportation & Commute in White County
Vehicle Availability by Sex in White County
The most prevalent vehicle ownership categories in White County are males with 2 vehicles (2,278, accounting for 33.9%) and females with 2 vehicles (1,947, making up 40.1%).
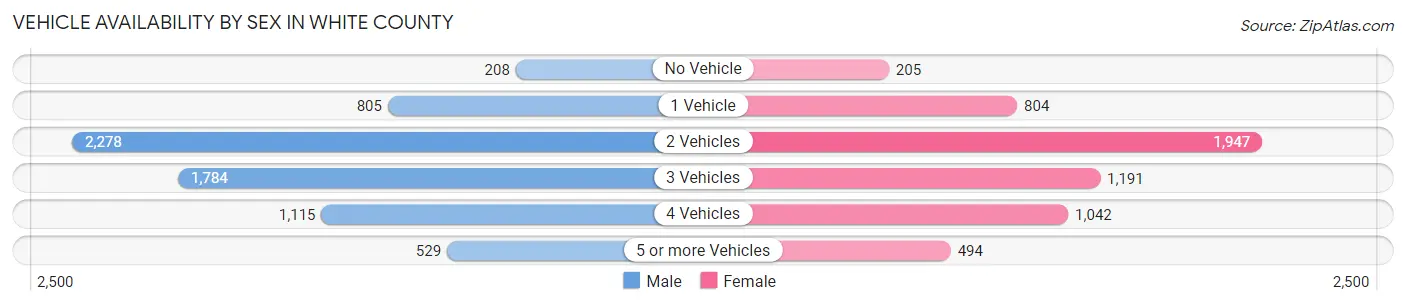
| Vehicles Available | Male | Female |
| No Vehicle | 208 (3.1%) | 205 (3.6%) |
| 1 Vehicle | 805 (12.0%) | 804 (14.1%) |
| 2 Vehicles | 2,278 (33.9%) | 1,947 (34.3%) |
| 3 Vehicles | 1,784 (26.6%) | 1,191 (21.0%) |
| 4 Vehicles | 1,115 (16.6%) | 1,042 (18.3%) |
| 5 or more Vehicles | 529 (7.9%) | 494 (8.7%) |
| Total | 6,719 (100.0%) | 5,683 (100.0%) |
Commute Time in White County
The most frequently occuring commute durations in White County are 10 to 14 minutes (1,763 commuters, 15.7%), 15 to 19 minutes (1,529 commuters, 13.6%), and 5 to 9 minutes (1,111 commuters, 9.9%).
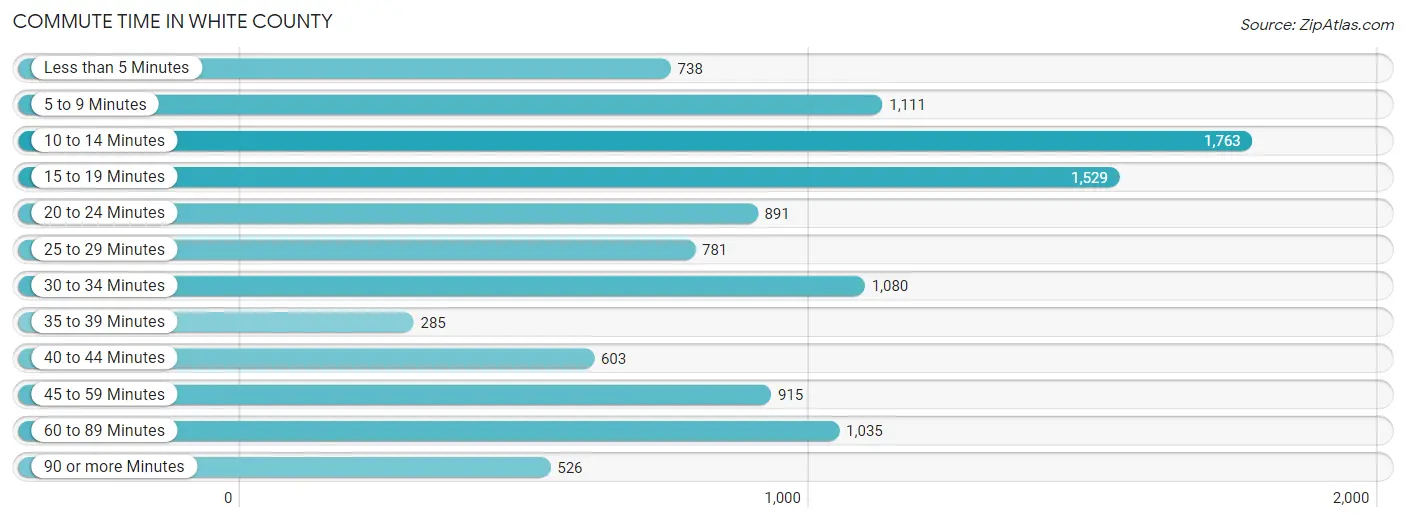
| Commute Time | # Commuters | % Commuters |
| Less than 5 Minutes | 738 | 6.6% |
| 5 to 9 Minutes | 1,111 | 9.9% |
| 10 to 14 Minutes | 1,763 | 15.7% |
| 15 to 19 Minutes | 1,529 | 13.6% |
| 20 to 24 Minutes | 891 | 7.9% |
| 25 to 29 Minutes | 781 | 6.9% |
| 30 to 34 Minutes | 1,080 | 9.6% |
| 35 to 39 Minutes | 285 | 2.5% |
| 40 to 44 Minutes | 603 | 5.4% |
| 45 to 59 Minutes | 915 | 8.1% |
| 60 to 89 Minutes | 1,035 | 9.2% |
| 90 or more Minutes | 526 | 4.7% |
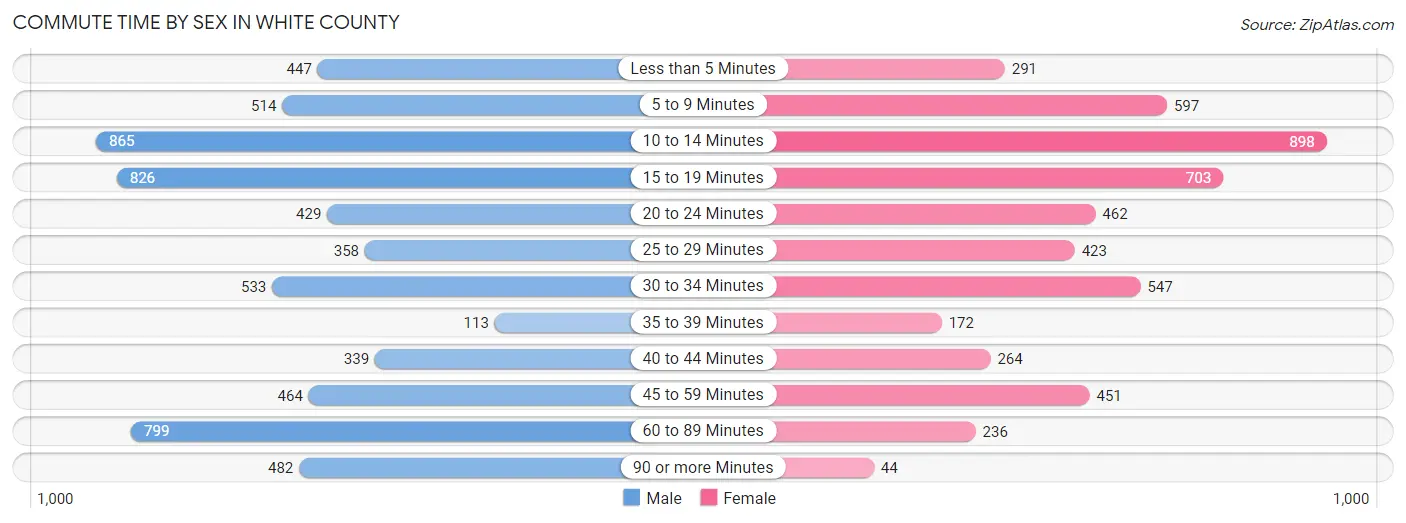
Commute Time by Sex in White County
The most common commute times in White County are 10 to 14 minutes (865 commuters, 14.0%) for males and 10 to 14 minutes (898 commuters, 17.6%) for females.
| Commute Time | Male | Female |
| Less than 5 Minutes | 447 (7.2%) | 291 (5.7%) |
| 5 to 9 Minutes | 514 (8.3%) | 597 (11.7%) |
| 10 to 14 Minutes | 865 (14.0%) | 898 (17.6%) |
| 15 to 19 Minutes | 826 (13.4%) | 703 (13.8%) |
| 20 to 24 Minutes | 429 (7.0%) | 462 (9.1%) |
| 25 to 29 Minutes | 358 (5.8%) | 423 (8.3%) |
| 30 to 34 Minutes | 533 (8.6%) | 547 (10.7%) |
| 35 to 39 Minutes | 113 (1.8%) | 172 (3.4%) |
| 40 to 44 Minutes | 339 (5.5%) | 264 (5.2%) |
| 45 to 59 Minutes | 464 (7.5%) | 451 (8.9%) |
| 60 to 89 Minutes | 799 (13.0%) | 236 (4.6%) |
| 90 or more Minutes | 482 (7.8%) | 44 (0.9%) |
Time of Departure to Work by Sex in White County
The most frequent times of departure to work in White County are 12:00 PM to 3:59 PM (819, 13.3%) for males and 6:30 AM to 6:59 AM (744, 14.6%) for females.
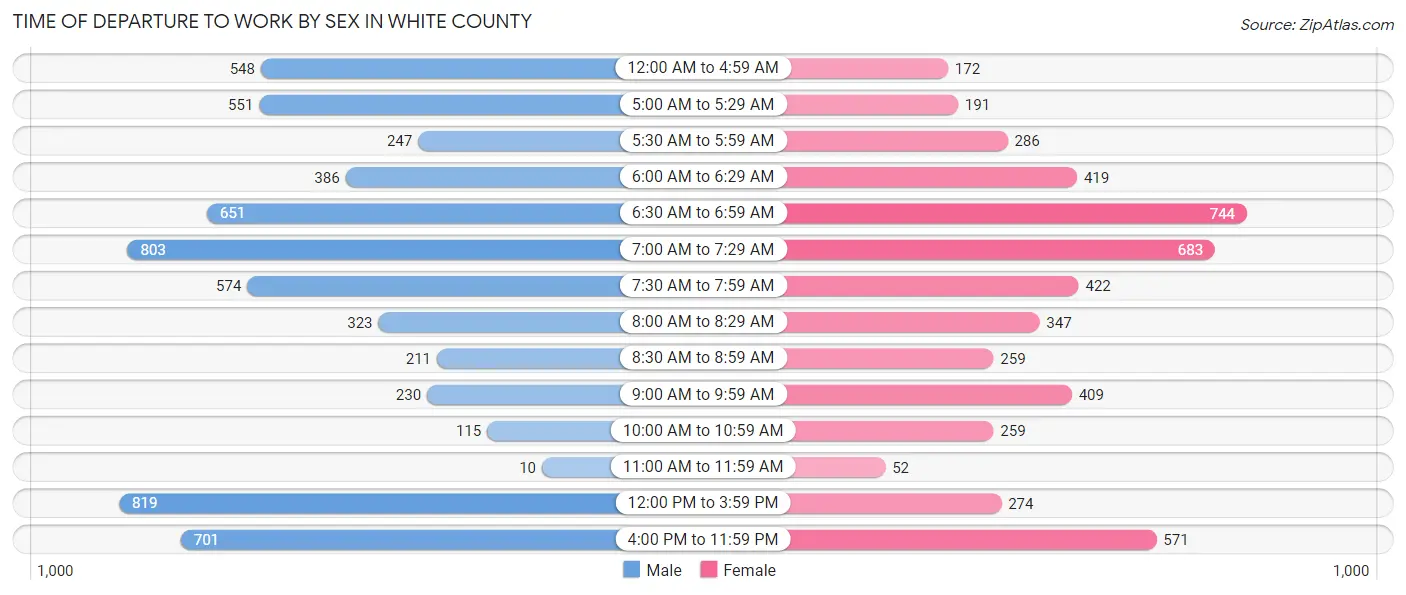
| Time of Departure | Male | Female |
| 12:00 AM to 4:59 AM | 548 (8.9%) | 172 (3.4%) |
| 5:00 AM to 5:29 AM | 551 (8.9%) | 191 (3.7%) |
| 5:30 AM to 5:59 AM | 247 (4.0%) | 286 (5.6%) |
| 6:00 AM to 6:29 AM | 386 (6.3%) | 419 (8.2%) |
| 6:30 AM to 6:59 AM | 651 (10.5%) | 744 (14.6%) |
| 7:00 AM to 7:29 AM | 803 (13.0%) | 683 (13.4%) |
| 7:30 AM to 7:59 AM | 574 (9.3%) | 422 (8.3%) |
| 8:00 AM to 8:29 AM | 323 (5.2%) | 347 (6.8%) |
| 8:30 AM to 8:59 AM | 211 (3.4%) | 259 (5.1%) |
| 9:00 AM to 9:59 AM | 230 (3.7%) | 409 (8.0%) |
| 10:00 AM to 10:59 AM | 115 (1.9%) | 259 (5.1%) |
| 11:00 AM to 11:59 AM | 10 (0.2%) | 52 (1.0%) |
| 12:00 PM to 3:59 PM | 819 (13.3%) | 274 (5.4%) |
| 4:00 PM to 11:59 PM | 701 (11.4%) | 571 (11.2%) |
| Total | 6,169 (100.0%) | 5,088 (100.0%) |
Housing Occupancy in White County
Occupancy by Ownership in White County
Of the total 10,344 dwellings in White County, owner-occupied units account for 7,819 (75.6%), while renter-occupied units make up 2,525 (24.4%).

| Occupancy | # Housing Units | % Housing Units |
| Owner Occupied Housing Units | 7,819 | 75.6% |
| Renter-Occupied Housing Units | 2,525 | 24.4% |
| Total Occupied Housing Units | 10,344 | 100.0% |
Occupancy by Household Size in White County

| Household Size | # Housing Units | % Housing Units |
| 1-Person Household | 2,162 | 20.9% |
| 2-Person Household | 4,608 | 44.6% |
| 3-Person Household | 1,378 | 13.3% |
| 4+ Person Household | 2,196 | 21.2% |
| Total Housing Units | 10,344 | 100.0% |
Occupancy by Ownership by Household Size in White County
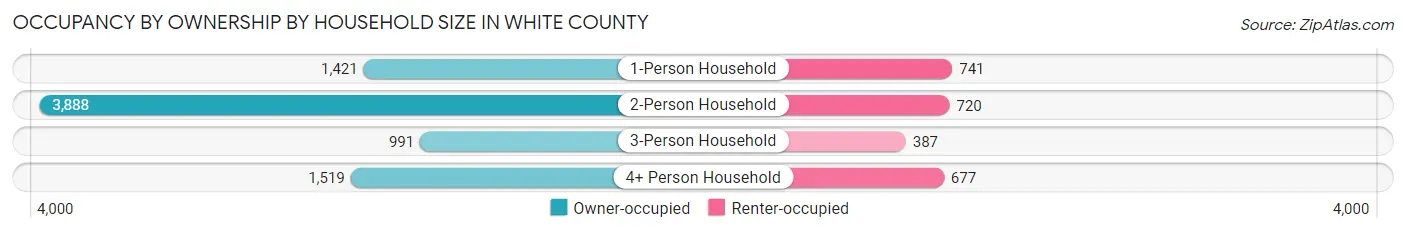
| Household Size | Owner-occupied | Renter-occupied |
| 1-Person Household | 1,421 (65.7%) | 741 (34.3%) |
| 2-Person Household | 3,888 (84.4%) | 720 (15.6%) |
| 3-Person Household | 991 (71.9%) | 387 (28.1%) |
| 4+ Person Household | 1,519 (69.2%) | 677 (30.8%) |
| Total Housing Units | 7,819 (75.6%) | 2,525 (24.4%) |
Occupancy by Educational Attainment in White County

| Household Size | Owner-occupied | Renter-occupied |
| Less than High School | 793 (67.7%) | 379 (32.3%) |
| High School Diploma | 2,114 (70.4%) | 890 (29.6%) |
| College/Associate Degree | 2,499 (74.5%) | 856 (25.5%) |
| Bachelor's Degree or higher | 2,413 (85.8%) | 400 (14.2%) |
Occupancy by Age of Householder in White County

| Age Bracket | # Households | % Households |
| Under 35 Years | 1,265 | 12.2% |
| 35 to 44 Years | 1,439 | 13.9% |
| 45 to 54 Years | 1,748 | 16.9% |
| 55 to 64 Years | 2,244 | 21.7% |
| 65 to 74 Years | 2,042 | 19.7% |
| 75 to 84 Years | 1,367 | 13.2% |
| 85 Years and Over | 239 | 2.3% |
| Total | 10,344 | 100.0% |
Housing Finances in White County
Median Income by Occupancy in White County
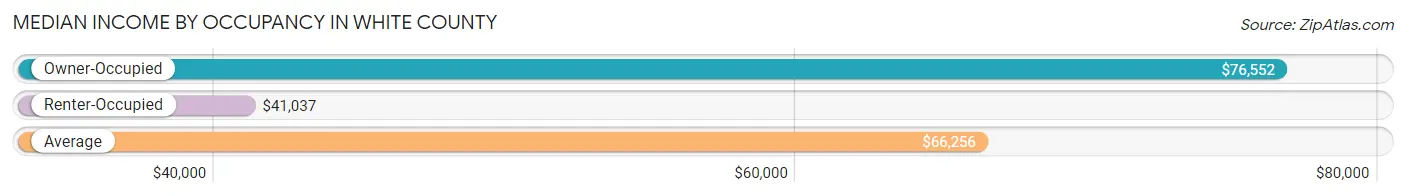
| Occupancy Type | # Households | Median Income |
| Owner-Occupied | 7,819 (75.6%) | $76,552 |
| Renter-Occupied | 2,525 (24.4%) | $41,037 |
| Average | 10,344 (100.0%) | $66,256 |
Occupancy by Householder Income Bracket in White County
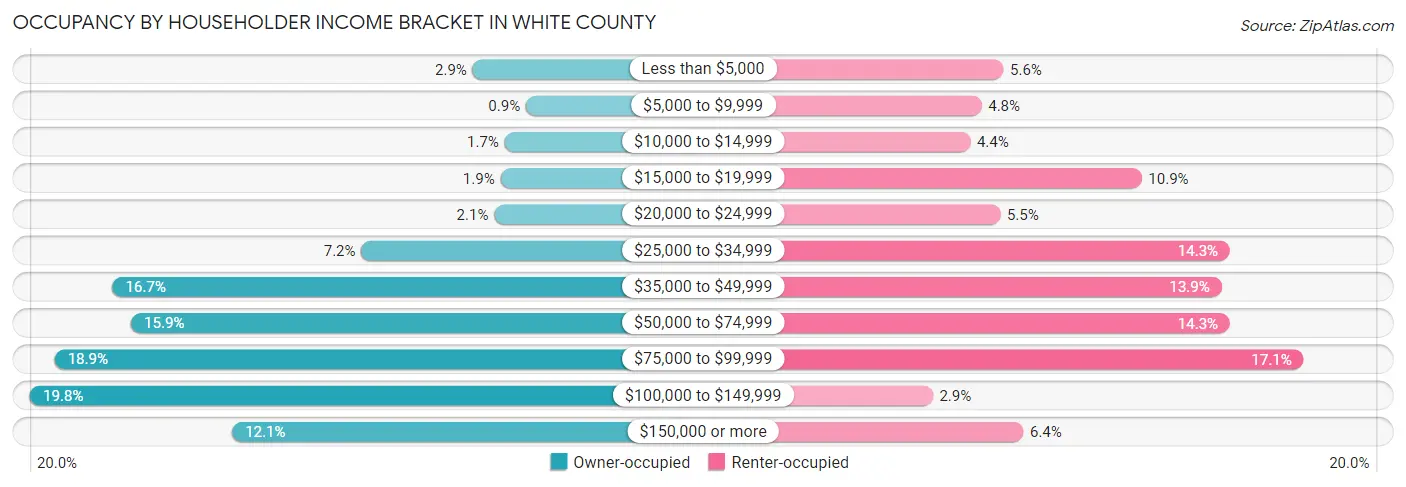
| Income Bracket | Owner-occupied | Renter-occupied |
| Less than $5,000 | 229 (2.9%) | 142 (5.6%) |
| $5,000 to $9,999 | 70 (0.9%) | 121 (4.8%) |
| $10,000 to $14,999 | 134 (1.7%) | 110 (4.4%) |
| $15,000 to $19,999 | 146 (1.9%) | 275 (10.9%) |
| $20,000 to $24,999 | 165 (2.1%) | 139 (5.5%) |
| $25,000 to $34,999 | 561 (7.2%) | 360 (14.3%) |
| $35,000 to $49,999 | 1,302 (16.7%) | 352 (13.9%) |
| $50,000 to $74,999 | 1,246 (15.9%) | 360 (14.3%) |
| $75,000 to $99,999 | 1,474 (18.9%) | 431 (17.1%) |
| $100,000 to $149,999 | 1,547 (19.8%) | 74 (2.9%) |
| $150,000 or more | 945 (12.1%) | 161 (6.4%) |
| Total | 7,819 (100.0%) | 2,525 (100.0%) |
Monthly Housing Cost Tiers in White County
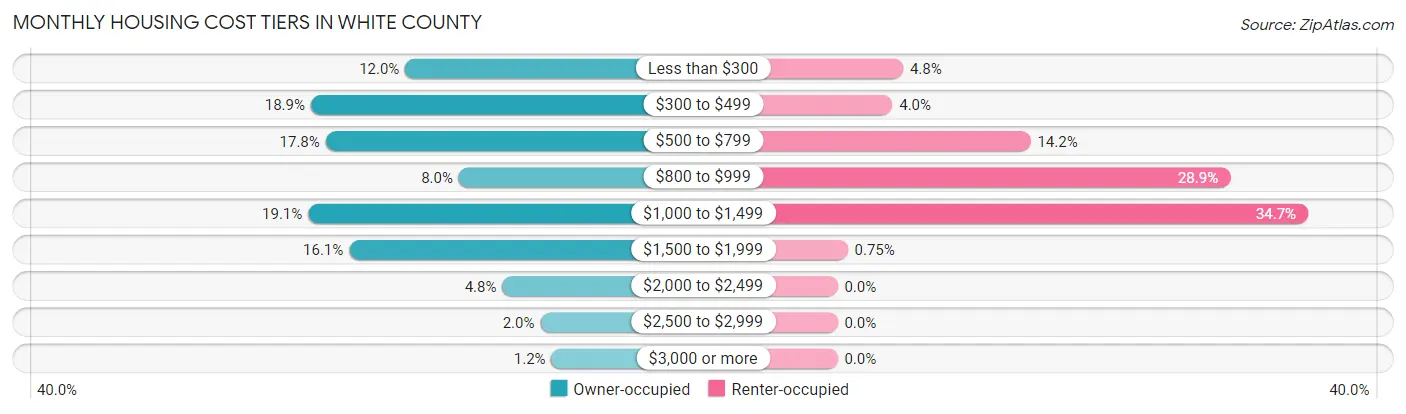
| Monthly Cost | Owner-occupied | Renter-occupied |
| Less than $300 | 936 (12.0%) | 122 (4.8%) |
| $300 to $499 | 1,479 (18.9%) | 102 (4.0%) |
| $500 to $799 | 1,394 (17.8%) | 359 (14.2%) |
| $800 to $999 | 627 (8.0%) | 730 (28.9%) |
| $1,000 to $1,499 | 1,495 (19.1%) | 875 (34.6%) |
| $1,500 to $1,999 | 1,259 (16.1%) | 19 (0.7%) |
| $2,000 to $2,499 | 377 (4.8%) | 0 (0.0%) |
| $2,500 to $2,999 | 158 (2.0%) | 0 (0.0%) |
| $3,000 or more | 94 (1.2%) | 0 (0.0%) |
| Total | 7,819 (100.0%) | 2,525 (100.0%) |
Physical Housing Characteristics in White County
Housing Structures in White County
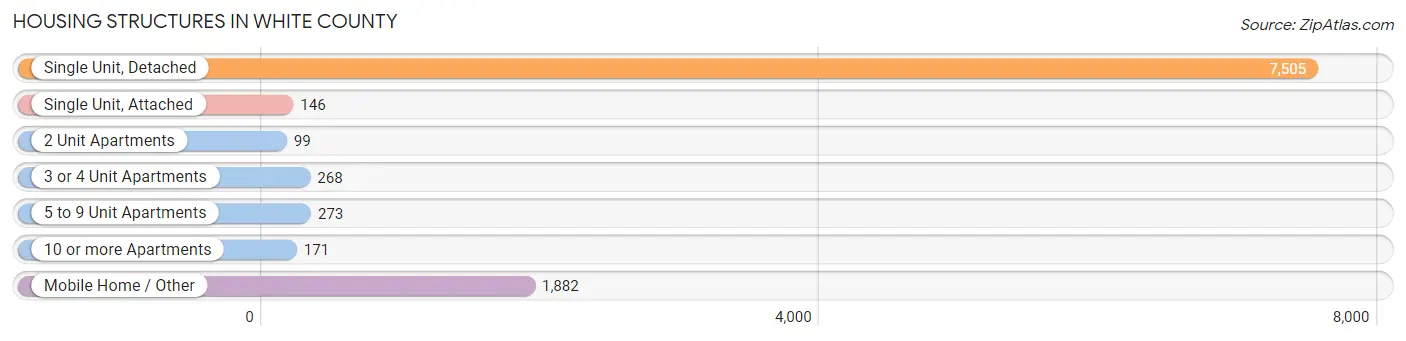
| Structure Type | # Housing Units | % Housing Units |
| Single Unit, Detached | 7,505 | 72.6% |
| Single Unit, Attached | 146 | 1.4% |
| 2 Unit Apartments | 99 | 1.0% |
| 3 or 4 Unit Apartments | 268 | 2.6% |
| 5 to 9 Unit Apartments | 273 | 2.6% |
| 10 or more Apartments | 171 | 1.7% |
| Mobile Home / Other | 1,882 | 18.2% |
| Total | 10,344 | 100.0% |
Housing Structures by Occupancy in White County
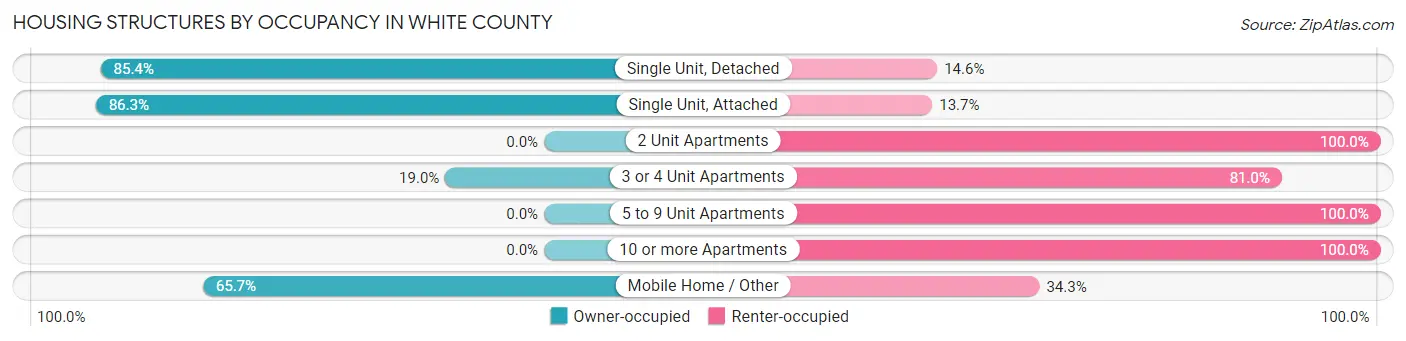
| Structure Type | Owner-occupied | Renter-occupied |
| Single Unit, Detached | 6,406 (85.4%) | 1,099 (14.6%) |
| Single Unit, Attached | 126 (86.3%) | 20 (13.7%) |
| 2 Unit Apartments | 0 (0.0%) | 99 (100.0%) |
| 3 or 4 Unit Apartments | 51 (19.0%) | 217 (81.0%) |
| 5 to 9 Unit Apartments | 0 (0.0%) | 273 (100.0%) |
| 10 or more Apartments | 0 (0.0%) | 171 (100.0%) |
| Mobile Home / Other | 1,236 (65.7%) | 646 (34.3%) |
| Total | 7,819 (75.6%) | 2,525 (24.4%) |
Housing Structures by Number of Rooms in White County

| Number of Rooms | Owner-occupied | Renter-occupied |
| 1 Room | 99 (1.3%) | 81 (3.2%) |
| 2 or 3 Rooms | 421 (5.4%) | 350 (13.9%) |
| 4 or 5 Rooms | 2,687 (34.4%) | 1,440 (57.0%) |
| 6 or 7 Rooms | 2,494 (31.9%) | 396 (15.7%) |
| 8 or more Rooms | 2,118 (27.1%) | 258 (10.2%) |
| Total | 7,819 (100.0%) | 2,525 (100.0%) |
Housing Structure by Heating Type in White County
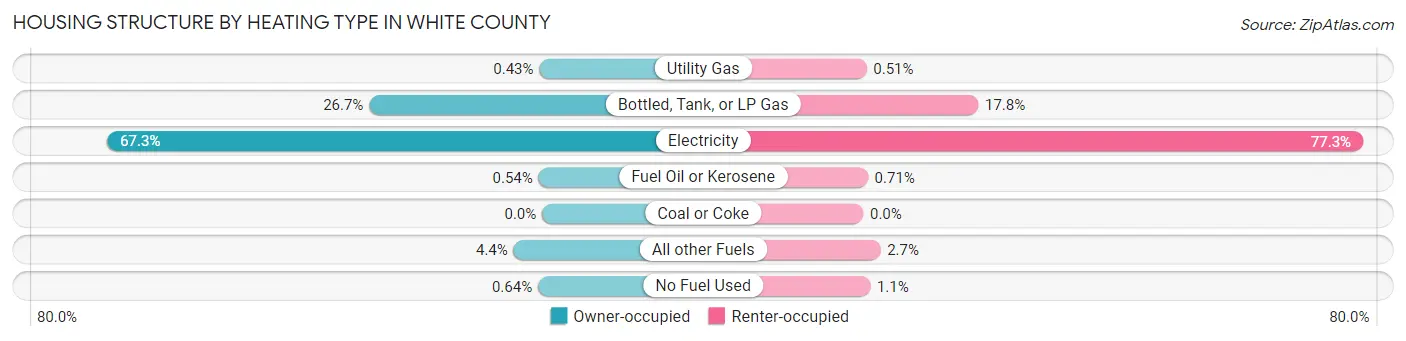
| Heating Type | Owner-occupied | Renter-occupied |
| Utility Gas | 34 (0.4%) | 13 (0.5%) |
| Bottled, Tank, or LP Gas | 2,090 (26.7%) | 449 (17.8%) |
| Electricity | 5,259 (67.3%) | 1,951 (77.3%) |
| Fuel Oil or Kerosene | 42 (0.5%) | 18 (0.7%) |
| Coal or Coke | 0 (0.0%) | 0 (0.0%) |
| All other Fuels | 344 (4.4%) | 67 (2.6%) |
| No Fuel Used | 50 (0.6%) | 27 (1.1%) |
| Total | 7,819 (100.0%) | 2,525 (100.0%) |
Household Vehicle Usage in White County

| Vehicles per Household | Owner-occupied | Renter-occupied |
| No Vehicle | 154 (2.0%) | 286 (11.3%) |
| 1 Vehicle | 1,888 (24.1%) | 1,013 (40.1%) |
| 2 Vehicles | 2,856 (36.5%) | 963 (38.1%) |
| 3 or more Vehicles | 2,921 (37.4%) | 263 (10.4%) |
| Total | 7,819 (100.0%) | 2,525 (100.0%) |
Real Estate & Mortgages in White County
Real Estate and Mortgage Overview in White County
| Characteristic | Without Mortgage | With Mortgage |
| Housing Units | 3,613 | 4,206 |
| Median Property Value | $223,900 | $236,600 |
| Median Household Income | $61,038 | $632 |
| Monthly Housing Costs | $407 | $94 |
| Real Estate Taxes | $1,240 | $73 |
Property Value by Mortgage Status in White County
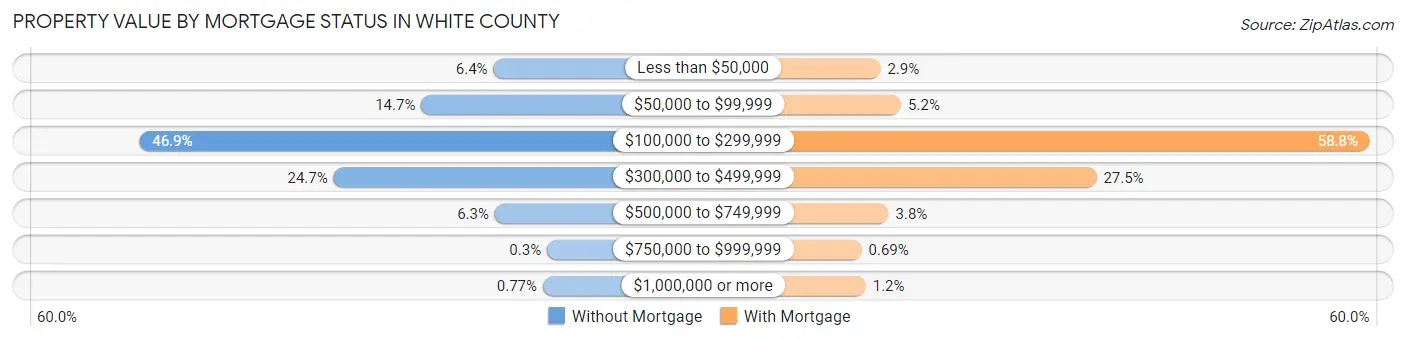
| Property Value | Without Mortgage | With Mortgage |
| Less than $50,000 | 232 (6.4%) | 120 (2.9%) |
| $50,000 to $99,999 | 530 (14.7%) | 219 (5.2%) |
| $100,000 to $299,999 | 1,694 (46.9%) | 2,472 (58.8%) |
| $300,000 to $499,999 | 892 (24.7%) | 1,158 (27.5%) |
| $500,000 to $749,999 | 226 (6.3%) | 159 (3.8%) |
| $750,000 to $999,999 | 11 (0.3%) | 29 (0.7%) |
| $1,000,000 or more | 28 (0.8%) | 49 (1.2%) |
| Total | 3,613 (100.0%) | 4,206 (100.0%) |
Household Income by Mortgage Status in White County

| Household Income | Without Mortgage | With Mortgage |
| Less than $10,000 | 214 (5.9%) | 83 (2.0%) |
| $10,000 to $24,999 | 302 (8.4%) | 85 (2.0%) |
| $25,000 to $34,999 | 396 (11.0%) | 143 (3.4%) |
| $35,000 to $49,999 | 646 (17.9%) | 165 (3.9%) |
| $50,000 to $74,999 | 565 (15.6%) | 656 (15.6%) |
| $75,000 to $99,999 | 598 (16.6%) | 681 (16.2%) |
| $100,000 to $149,999 | 579 (16.0%) | 876 (20.8%) |
| $150,000 or more | 313 (8.7%) | 968 (23.0%) |
| Total | 3,613 (100.0%) | 4,206 (100.0%) |
Property Value to Household Income Ratio in White County
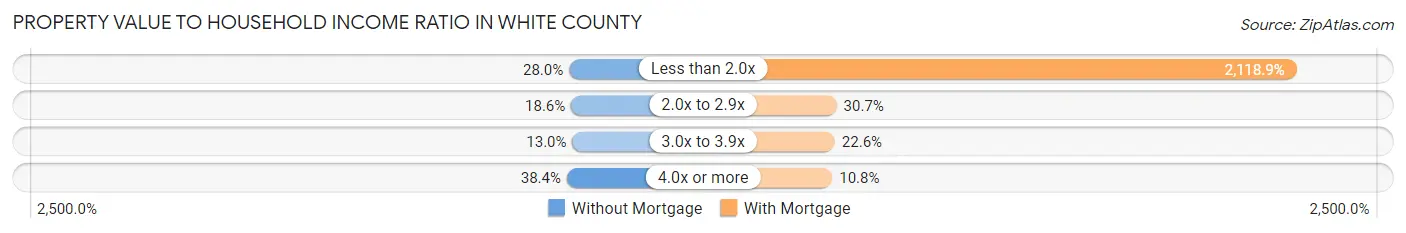
| Value-to-Income Ratio | Without Mortgage | With Mortgage |
| Less than 2.0x | 1,010 (28.0%) | 89,121 (2,118.9%) |
| 2.0x to 2.9x | 672 (18.6%) | 1,290 (30.7%) |
| 3.0x to 3.9x | 468 (13.0%) | 949 (22.6%) |
| 4.0x or more | 1,387 (38.4%) | 453 (10.8%) |
| Total | 3,613 (100.0%) | 4,206 (100.0%) |
Real Estate Taxes by Mortgage Status in White County

| Property Taxes | Without Mortgage | With Mortgage |
| Less than $800 | 1,136 (31.4%) | 0 (0.0%) |
| $800 to $1,499 | 755 (20.9%) | 658 (15.6%) |
| $800 to $1,499 | 1,428 (39.5%) | 1,015 (24.1%) |
| Total | 3,613 (100.0%) | 4,206 (100.0%) |
Health & Disability in White County
Health Insurance Coverage by Age in White County
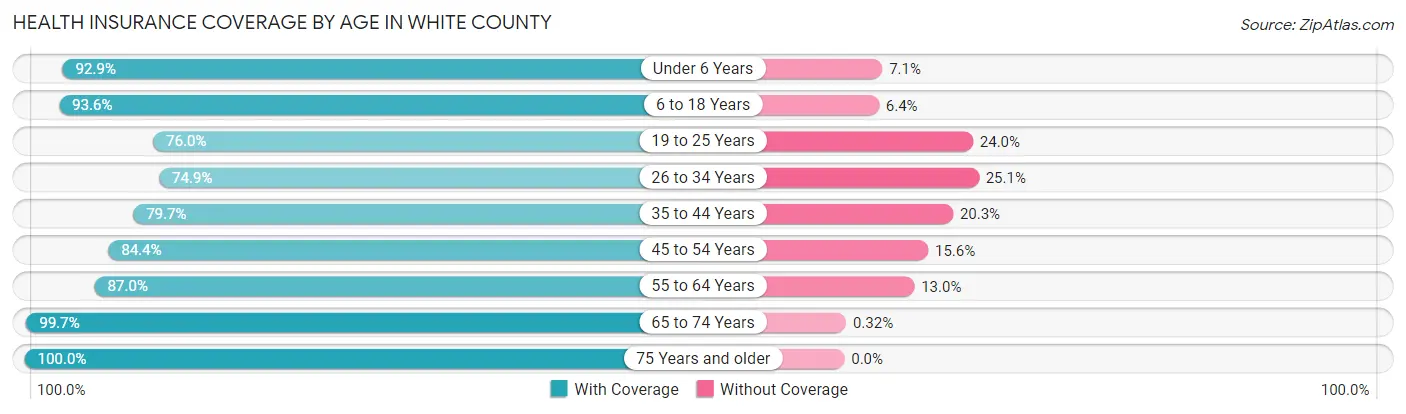
| Age Bracket | With Coverage | Without Coverage |
| Under 6 Years | 1,563 (92.9%) | 119 (7.1%) |
| 6 to 18 Years | 3,865 (93.6%) | 266 (6.4%) |
| 19 to 25 Years | 2,014 (76.0%) | 635 (24.0%) |
| 26 to 34 Years | 1,850 (74.9%) | 619 (25.1%) |
| 35 to 44 Years | 2,350 (79.7%) | 597 (20.3%) |
| 45 to 54 Years | 2,999 (84.4%) | 555 (15.6%) |
| 55 to 64 Years | 3,641 (87.0%) | 546 (13.0%) |
| 65 to 74 Years | 3,736 (99.7%) | 12 (0.3%) |
| 75 Years and older | 2,614 (100.0%) | 0 (0.0%) |
| Total | 24,632 (88.0%) | 3,349 (12.0%) |
Health Insurance Coverage by Citizenship Status in White County
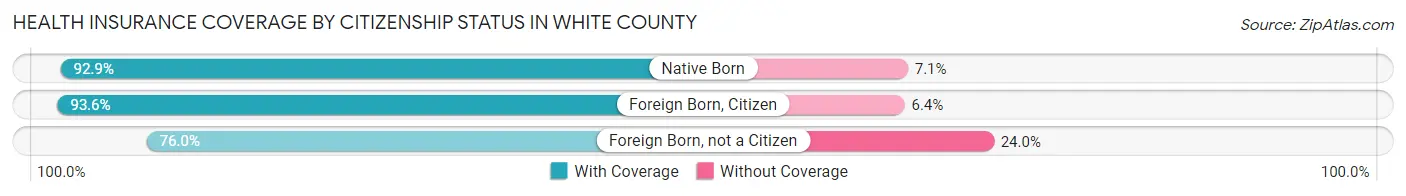
| Citizenship Status | With Coverage | Without Coverage |
| Native Born | 1,563 (92.9%) | 119 (7.1%) |
| Foreign Born, Citizen | 3,865 (93.6%) | 266 (6.4%) |
| Foreign Born, not a Citizen | 2,014 (76.0%) | 635 (24.0%) |
Health Insurance Coverage by Household Income in White County

| Household Income | With Coverage | Without Coverage |
| Under $25,000 | 2,751 (94.2%) | 169 (5.8%) |
| $25,000 to $49,999 | 4,799 (84.8%) | 863 (15.2%) |
| $50,000 to $74,999 | 3,889 (88.8%) | 492 (11.2%) |
| $75,000 to $99,999 | 4,496 (80.6%) | 1,083 (19.4%) |
| $100,000 and over | 8,432 (92.3%) | 703 (7.7%) |
Public vs Private Health Insurance Coverage by Age in White County

| Age Bracket | Public Insurance | Private Insurance |
| Under 6 | 867 (51.5%) | 893 (53.1%) |
| 6 to 18 Years | 1,668 (40.4%) | 2,635 (63.8%) |
| 19 to 25 Years | 302 (11.4%) | 1,852 (69.9%) |
| 25 to 34 Years | 416 (16.9%) | 1,516 (61.4%) |
| 35 to 44 Years | 455 (15.4%) | 2,057 (69.8%) |
| 45 to 54 Years | 525 (14.8%) | 2,573 (72.4%) |
| 55 to 64 Years | 813 (19.4%) | 2,910 (69.5%) |
| 65 to 74 Years | 3,633 (96.9%) | 2,502 (66.8%) |
| 75 Years and over | 2,604 (99.6%) | 1,704 (65.2%) |
| Total | 11,283 (40.3%) | 18,642 (66.6%) |
Disability Status by Sex by Age in White County

| Age Bracket | Male | Female |
| Under 5 Years | 0 (0.0%) | 43 (7.1%) |
| 5 to 17 Years | 58 (2.8%) | 197 (10.0%) |
| 18 to 34 Years | 225 (8.2%) | 266 (9.7%) |
| 35 to 64 Years | 678 (13.1%) | 840 (15.2%) |
| 65 to 74 Years | 548 (30.3%) | 553 (28.5%) |
| 75 Years and over | 427 (36.4%) | 714 (49.5%) |
Disability Class by Sex by Age in White County
Disability Class: Hearing Difficulty
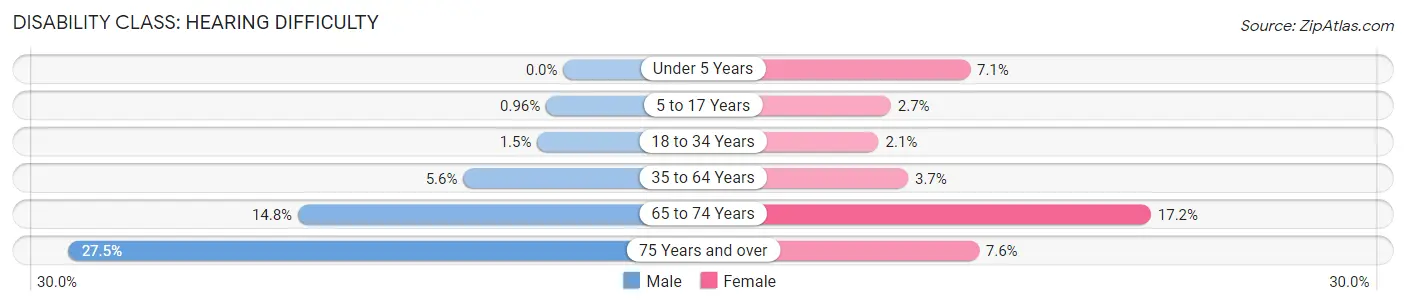
| Age Bracket | Male | Female |
| Under 5 Years | 0 (0.0%) | 43 (7.1%) |
| 5 to 17 Years | 20 (1.0%) | 54 (2.7%) |
| 18 to 34 Years | 40 (1.5%) | 56 (2.1%) |
| 35 to 64 Years | 288 (5.6%) | 204 (3.7%) |
| 65 to 74 Years | 267 (14.8%) | 334 (17.2%) |
| 75 Years and over | 323 (27.5%) | 110 (7.6%) |
Disability Class: Vision Difficulty
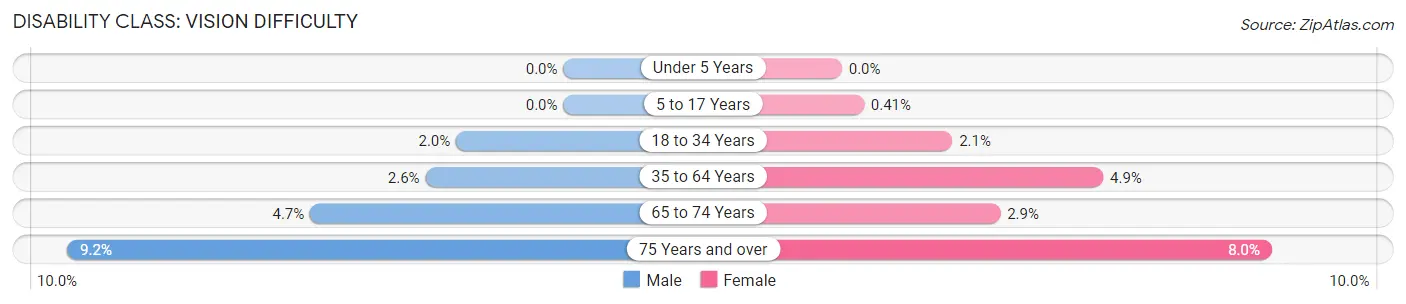
| Age Bracket | Male | Female |
| Under 5 Years | 0 (0.0%) | 0 (0.0%) |
| 5 to 17 Years | 0 (0.0%) | 8 (0.4%) |
| 18 to 34 Years | 55 (2.0%) | 56 (2.1%) |
| 35 to 64 Years | 132 (2.6%) | 268 (4.9%) |
| 65 to 74 Years | 85 (4.7%) | 57 (2.9%) |
| 75 Years and over | 108 (9.2%) | 115 (8.0%) |
Disability Class: Cognitive Difficulty

| Age Bracket | Male | Female |
| 5 to 17 Years | 48 (2.3%) | 70 (3.5%) |
| 18 to 34 Years | 166 (6.0%) | 121 (4.4%) |
| 35 to 64 Years | 250 (4.8%) | 144 (2.6%) |
| 65 to 74 Years | 64 (3.5%) | 126 (6.5%) |
| 75 Years and over | 22 (1.9%) | 240 (16.7%) |
Disability Class: Ambulatory Difficulty
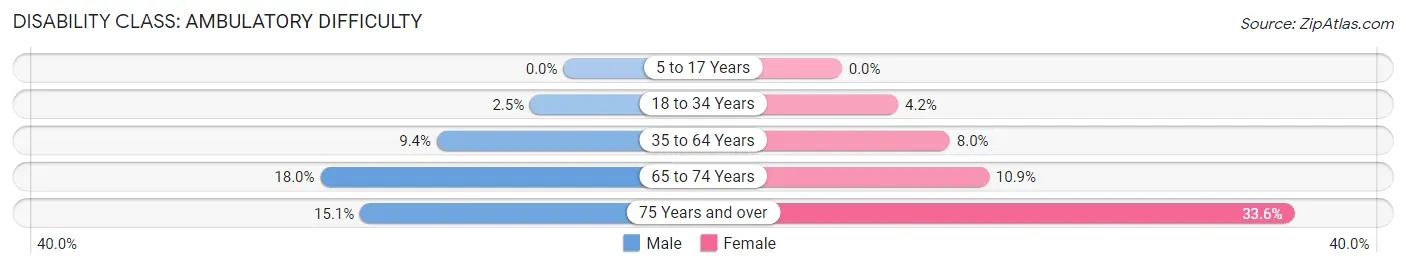
| Age Bracket | Male | Female |
| 5 to 17 Years | 0 (0.0%) | 0 (0.0%) |
| 18 to 34 Years | 68 (2.5%) | 114 (4.2%) |
| 35 to 64 Years | 485 (9.4%) | 443 (8.0%) |
| 65 to 74 Years | 326 (18.0%) | 212 (10.9%) |
| 75 Years and over | 177 (15.1%) | 484 (33.6%) |
Disability Class: Self-Care Difficulty
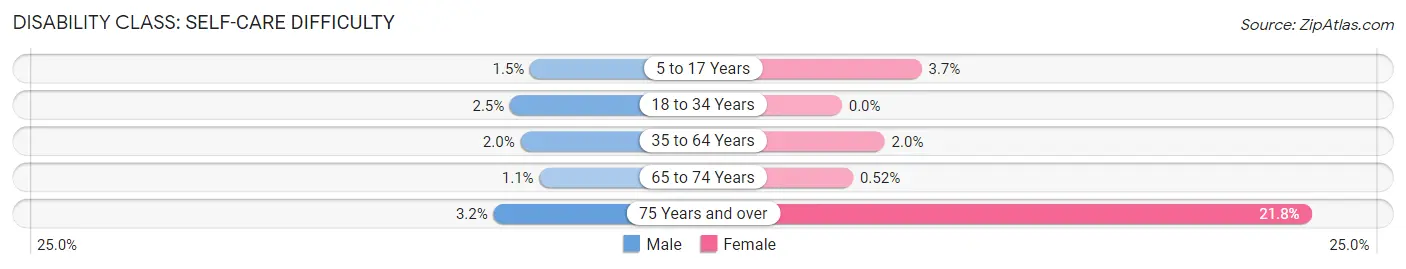
| Age Bracket | Male | Female |
| 5 to 17 Years | 32 (1.5%) | 73 (3.7%) |
| 18 to 34 Years | 68 (2.5%) | 0 (0.0%) |
| 35 to 64 Years | 103 (2.0%) | 110 (2.0%) |
| 65 to 74 Years | 20 (1.1%) | 10 (0.5%) |
| 75 Years and over | 38 (3.2%) | 314 (21.8%) |
Technology Access in White County
Computing Device Access in White County
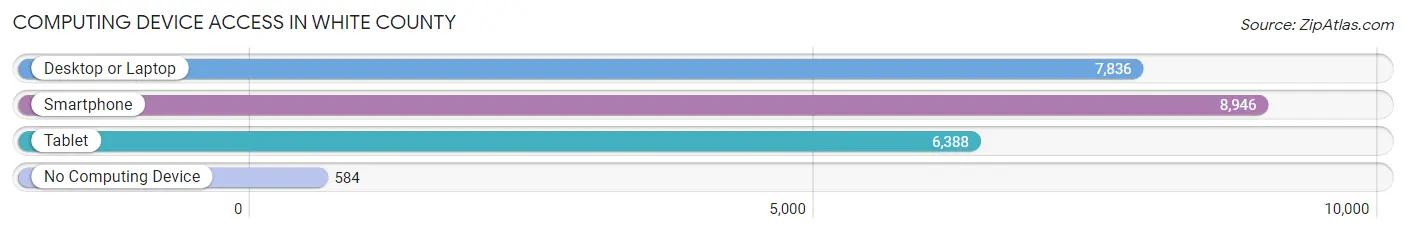
| Device Type | # Households | % Households |
| Desktop or Laptop | 7,836 | 75.7% |
| Smartphone | 8,946 | 86.5% |
| Tablet | 6,388 | 61.8% |
| No Computing Device | 584 | 5.7% |
| Total | 10,344 | 100.0% |
Internet Access in White County

| Internet Type | # Households | % Households |
| Dial-Up Internet | 32 | 0.3% |
| Broadband Home | 7,218 | 69.8% |
| Cellular Data Only | 922 | 8.9% |
| Satellite Internet | 1,057 | 10.2% |
| No Internet | 1,629 | 15.8% |
| Total | 10,344 | 100.0% |
White County Summary
White County is located in the north-central part of the state of Georgia, in the foothills of the Appalachian Mountains. It is bordered by Habersham, Lumpkin, Towns, Union, and Hall counties. The county seat is Cleveland, and the largest city is Helen. White County was created in 1857 from parts of Habersham and Hall counties.
Geography
White County covers an area of approximately 437 square miles. The terrain is mostly mountainous, with the highest point being Tray Mountain at 3,817 feet. The county is drained by the Chattahoochee River and its tributaries, including the Soque, Sautee, and Yahoola Creeks. The county is home to several state parks, including Unicoi State Park, Smithgall Woods State Park, and Vogel State Park.
Economy
White County’s economy is largely based on tourism, with the county’s many state parks and recreational areas drawing visitors from around the region. The county is also home to several manufacturing companies, including a carpet mill, a furniture factory, and a plastics plant. Agriculture is also an important part of the local economy, with the county’s farms producing corn, soybeans, hay, and other crops.
Demographics
As of the 2010 census, White County had a population of 27,144. The racial makeup of the county was 94.3% White, 2.3% Black or African American, 0.4% Native American, 0.7% Asian, 0.1% Pacific Islander, 1.2% from other races, and 1.1% from two or more races. Hispanic or Latino of any race were 3.2% of the population.
The median household income in White County was $41,845, and the median family income was $50,845. The per capita income was $21,845. About 11.2% of families and 14.2% of the population were below the poverty line, including 19.2% of those under age 18 and 11.2% of those age 65 or over.
Education
White County is served by the White County School District, which operates seven elementary schools, two middle schools, and two high schools. The county is also home to several private schools, including White County Christian Academy and White County Academy. The county is also home to Truett McConnell University, a private Christian university.
Conclusion
White County is a rural county located in the north-central part of Georgia. It is home to several state parks and recreational areas, as well as several manufacturing companies and farms. The county’s population is largely white, with a small percentage of other races. The county is served by the White County School District, as well as several private schools. White County is an important part of the state of Georgia, and its economy and population are likely to continue to grow in the future.
Common Questions
What is the Total Population of White County?
Total Population of White County is 28,165.
What is the Total Male Population of White County?
Total Male Population of White County is 13,898.
What is the Total Female Population of White County?
Total Female Population of White County is 14,267.
What is the Ratio of Males per 100 Females in White County?
There are 97.41 Males per 100 Females in White County.
What is the Ratio of Females per 100 Males in White County?
There are 102.66 Females per 100 Males in White County.
What is the Median Population Age in White County?
Median Population Age in White County is 45.3 Years.
What is the Average Family Size in White County
Average Family Size in White County is 3.1 People.
What is the Average Household Size in White County
Average Household Size in White County is 2.7 People.
What is Per Capita Income in White County?
Per Capita income in White County is $32,311.
What is the Median Family Income in White County?
Median Family Income in White County is $82,535.
What is the Median Household income in White County?
Median Household Income in White County is $66,256.
What is Income or Wage Gap in White County?
Income or Wage Gap in White County is 34.7%.
Women in White County earn 65.3 cents for every dollar earned by a man.
What is Family Income Deficit in White County?
Family Income Deficit in White County is $9,900.
Families that are below poverty line in White County earn $9,900 less on average than the poverty threshold level.
What is Inequality or Gini Index in White County?
Inequality or Gini Index in White County is 0.43.
How Large is the Labor Force in White County?
There are 13,054 People in the Labor Forcein in White County.
What is the Percentage of People in the Labor Force in White County?
55.6% of People are in the Labor Force in White County.
What is the Unemployment Rate in White County?
Unemployment Rate in White County is 3.5%.