Warren County, GA
Warren County Map
Warren County Overview
5,197
TOTAL POPULATION
2,405
MALE POPULATION
2,792
FEMALE POPULATION
86.14
MALES / 100 FEMALES
116.09
FEMALES / 100 MALES
45.3
MEDIAN AGE
3.3
AVG FAMILY SIZE
2.6
AVG HOUSEHOLD SIZE
$24,249
PER CAPITA INCOME
$50,690
AVG FAMILY INCOME
$45,091
AVG HOUSEHOLD INCOME
4.8%
WAGE / INCOME GAP [ % ]
95.2¢/ $1
WAGE / INCOME GAP [ $ ]
0.46
INEQUALITY / GINI INDEX
2,222
LABOR FORCE [ PEOPLE ]
52.4%
PERCENT IN LABOR FORCE
9.0%
UNEMPLOYMENT RATE
Warren County Area Codes
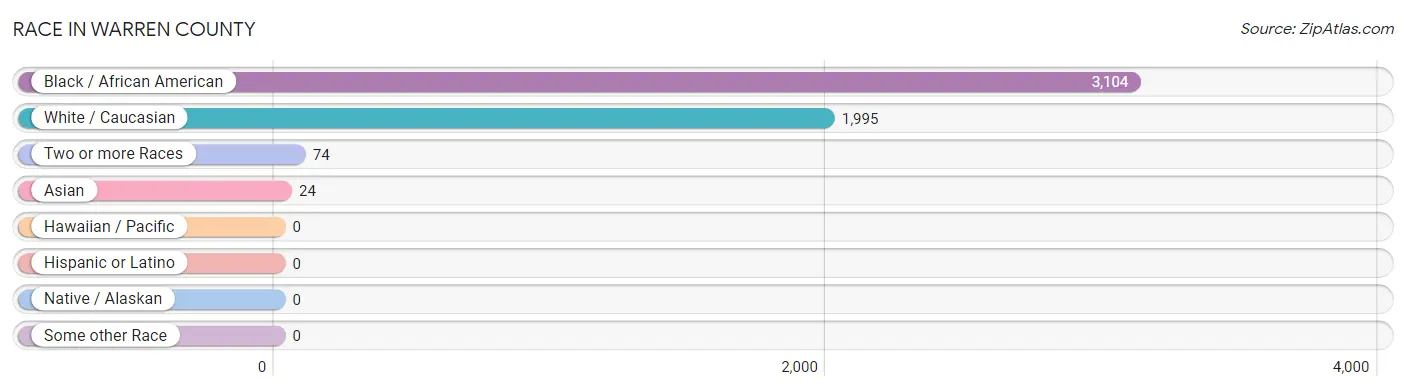
Race in Warren County
The most populous races in Warren County are Black / African American (3,104 | 59.7%), White / Caucasian (1,995 | 38.4%), and Two or more Races (74 | 1.4%).
| Race | # Population | % Population |
| Asian | 24 | 0.5% |
| Black / African American | 3,104 | 59.7% |
| Hawaiian / Pacific | 0 | 0.0% |
| Hispanic or Latino | 0 | 0.0% |
| Native / Alaskan | 0 | 0.0% |
| White / Caucasian | 1,995 | 38.4% |
| Two or more Races | 74 | 1.4% |
| Some other Race | 0 | 0.0% |
| Total | 5,197 | 100.0% |
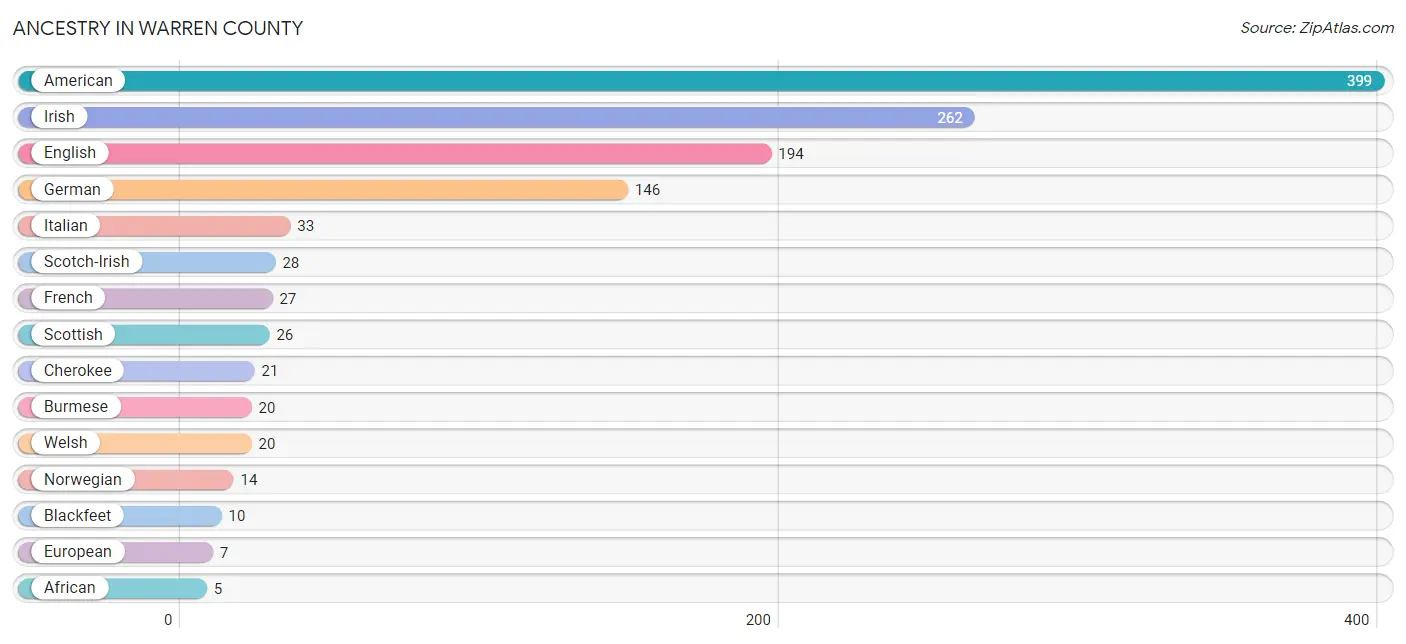
Ancestry in Warren County
The most populous ancestries reported in Warren County are American (399 | 7.7%), Irish (262 | 5.0%), English (194 | 3.7%), German (146 | 2.8%), and Italian (33 | 0.6%), together accounting for 19.9% of all Warren County residents.
| Ancestry | # Population | % Population |
| African | 5 | 0.1% |
| American | 399 | 7.7% |
| Austrian | 2 | 0.0% |
| Blackfeet | 10 | 0.2% |
| British | 4 | 0.1% |
| Burmese | 20 | 0.4% |
| Cherokee | 21 | 0.4% |
| English | 194 | 3.7% |
| European | 7 | 0.1% |
| French | 27 | 0.5% |
| German | 146 | 2.8% |
| Haitian | 2 | 0.0% |
| Irish | 262 | 5.0% |
| Italian | 33 | 0.6% |
| Jamaican | 5 | 0.1% |
| Norwegian | 14 | 0.3% |
| Scotch-Irish | 28 | 0.5% |
| Scottish | 26 | 0.5% |
| Subsaharan African | 5 | 0.1% |
| Thai | 4 | 0.1% |
| Welsh | 20 | 0.4% | View All 21 Rows |
Immigrants in Warren County
The most numerous immigrant groups reported in Warren County came from Asia (24 | 0.5%), Eastern Asia (20 | 0.4%), Korea (20 | 0.4%), Caribbean (7 | 0.1%), and Latin America (7 | 0.1%), together accounting for 1.5% of all Warren County residents.

| Immigration Origin | # Population | % Population |
| Asia | 24 | 0.5% |
| Caribbean | 7 | 0.1% |
| Eastern Asia | 20 | 0.4% |
| Europe | 1 | 0.0% |
| Germany | 1 | 0.0% |
| Haiti | 2 | 0.0% |
| India | 4 | 0.1% |
| Jamaica | 5 | 0.1% |
| Korea | 20 | 0.4% |
| Latin America | 7 | 0.1% |
| South Central Asia | 4 | 0.1% |
| Western Europe | 1 | 0.0% | View All 12 Rows |
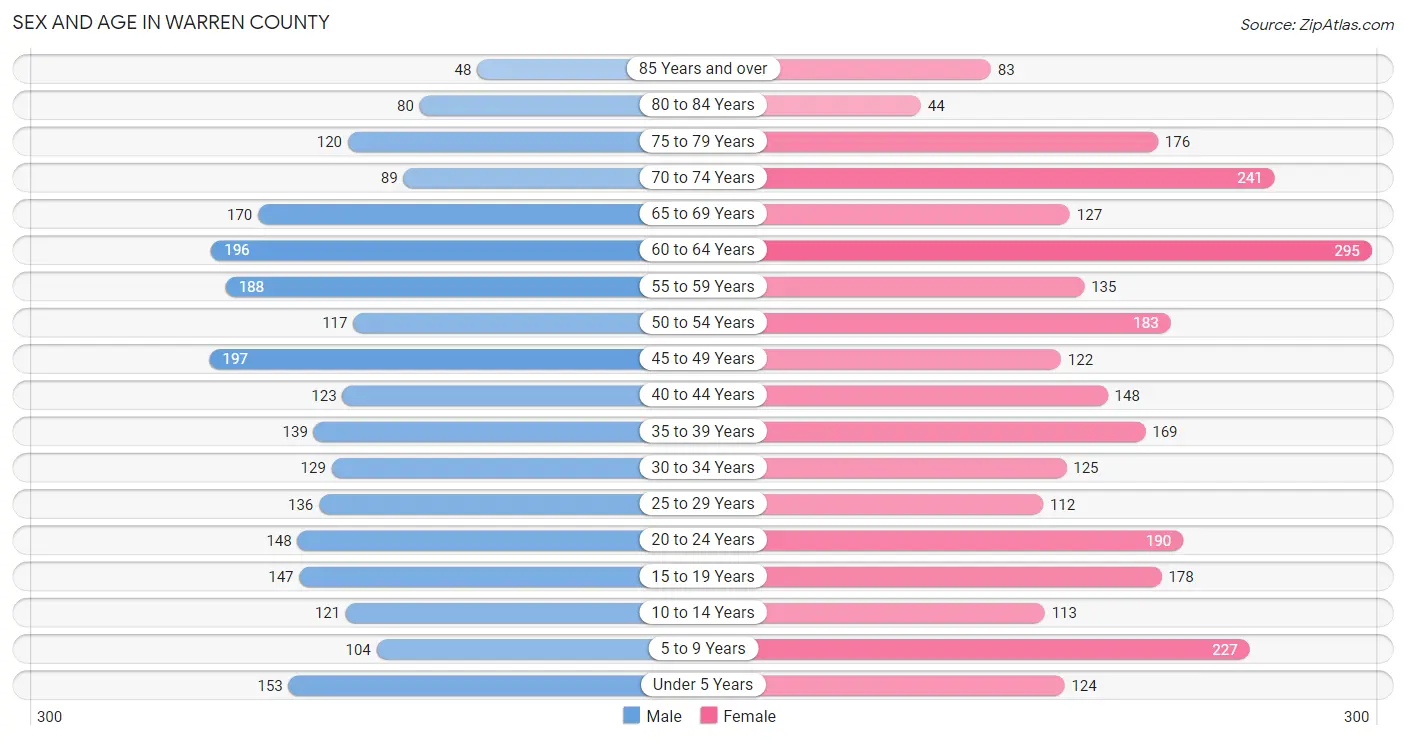
Sex and Age in Warren County
Sex and Age in Warren County
The most populous age groups in Warren County are 45 to 49 Years (197 | 8.2%) for men and 60 to 64 Years (295 | 10.6%) for women.
| Age Bracket | Male | Female |
| Under 5 Years | 153 (6.4%) | 124 (4.4%) |
| 5 to 9 Years | 104 (4.3%) | 227 (8.1%) |
| 10 to 14 Years | 121 (5.0%) | 113 (4.1%) |
| 15 to 19 Years | 147 (6.1%) | 178 (6.4%) |
| 20 to 24 Years | 148 (6.1%) | 190 (6.8%) |
| 25 to 29 Years | 136 (5.7%) | 112 (4.0%) |
| 30 to 34 Years | 129 (5.4%) | 125 (4.5%) |
| 35 to 39 Years | 139 (5.8%) | 169 (6.0%) |
| 40 to 44 Years | 123 (5.1%) | 148 (5.3%) |
| 45 to 49 Years | 197 (8.2%) | 122 (4.4%) |
| 50 to 54 Years | 117 (4.9%) | 183 (6.6%) |
| 55 to 59 Years | 188 (7.8%) | 135 (4.8%) |
| 60 to 64 Years | 196 (8.2%) | 295 (10.6%) |
| 65 to 69 Years | 170 (7.1%) | 127 (4.5%) |
| 70 to 74 Years | 89 (3.7%) | 241 (8.6%) |
| 75 to 79 Years | 120 (5.0%) | 176 (6.3%) |
| 80 to 84 Years | 80 (3.3%) | 44 (1.6%) |
| 85 Years and over | 48 (2.0%) | 83 (3.0%) |
| Total | 2,405 (100.0%) | 2,792 (100.0%) |
Families and Households in Warren County
Median Family Size in Warren County
The median family size in Warren County is 3.31 persons per family, with single female/mother families (429 | 33.6%) accounting for the largest median family size of 3.81 persons per family. On the other hand, single male/father families (134 | 10.5%) represent the smallest median family size with 2.34 persons per family.

| Family Type | # Families | Family Size |
| Married-Couple | 713 (55.9%) | 3.20 |
| Single Male/Father | 134 (10.5%) | 2.34 |
| Single Female/Mother | 429 (33.6%) | 3.81 |
| Total Families | 1,276 (100.0%) | 3.31 |
Median Household Size in Warren County
The median household size in Warren County is 2.63 persons per household, with single female/mother households (429 | 22.1%) accounting for the largest median household size of 3.86 persons per household. non-family households (669 | 34.4%) represent the smallest median household size with 1.17 persons per household.
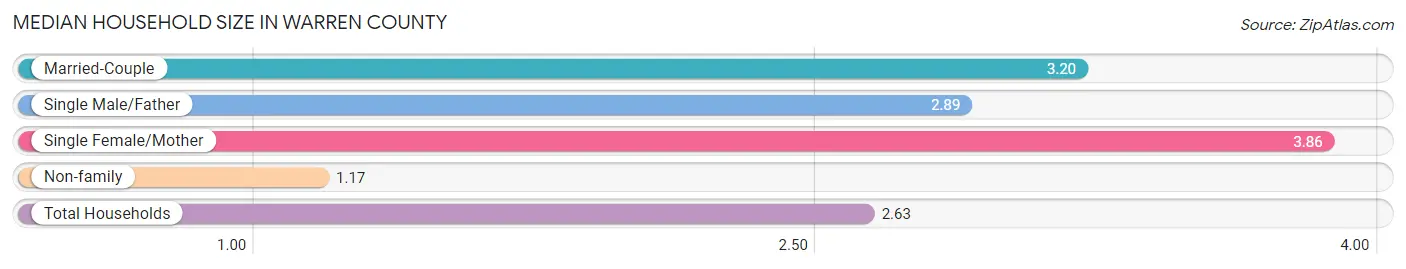
| Household Type | # Households | Household Size |
| Married-Couple | 713 (36.7%) | 3.20 |
| Single Male/Father | 134 (6.9%) | 2.89 |
| Single Female/Mother | 429 (22.1%) | 3.86 |
| Non-family | 669 (34.4%) | 1.17 |
| Total Households | 1,945 (100.0%) | 2.63 |
Household Size by Marriage Status in Warren County
Out of a total of 1,945 households in Warren County, 1,276 (65.6%) are family households, while 669 (34.4%) are nonfamily households. The most numerous type of family households are 2-person households, comprising 644, and the most common type of nonfamily households are 1-person households, comprising 596.
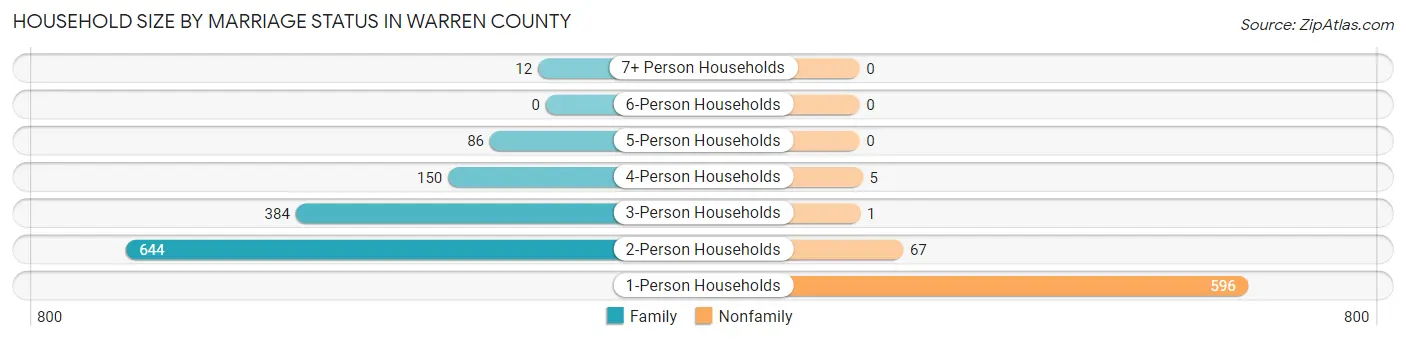
| Household Size | Family Households | Nonfamily Households |
| 1-Person Households | - | 596 (30.6%) |
| 2-Person Households | 644 (33.1%) | 67 (3.4%) |
| 3-Person Households | 384 (19.7%) | 1 (0.1%) |
| 4-Person Households | 150 (7.7%) | 5 (0.3%) |
| 5-Person Households | 86 (4.4%) | 0 (0.0%) |
| 6-Person Households | 0 (0.0%) | 0 (0.0%) |
| 7+ Person Households | 12 (0.6%) | 0 (0.0%) |
| Total | 1,276 (65.6%) | 669 (34.4%) |
Female Fertility in Warren County
Fertility by Age in Warren County
Average fertility rate in Warren County is 35.0 births per 1,000 women. Women in the age bracket of 20 to 34 years have the highest fertility rate with 47.0 births per 1,000 women. Women in the age bracket of 20 to 34 years acount for 52.6% of all women with births.

| Age Bracket | Women with Births | Births / 1,000 Women |
| 15 to 19 years | 0 (0.0%) | 0.0 |
| 20 to 34 years | 20 (52.6%) | 47.0 |
| 35 to 50 years | 18 (47.4%) | 37.0 |
| Total | 38 (100.0%) | 35.0 |
Fertility by Age by Marriage Status in Warren County
76.3% of women with births (38) in Warren County are married. The highest percentage of unmarried women with births falls into 20 to 34 years age bracket with 45.0% of them unmarried at the time of birth, while the lowest percentage of unmarried women with births belong to 35 to 50 years age bracket with 0.0% of them unmarried.
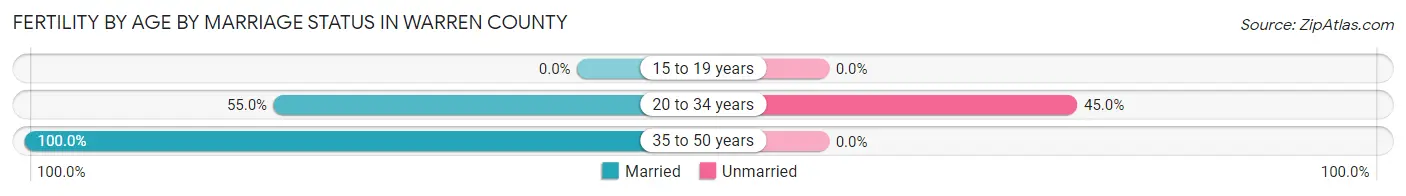
| Age Bracket | Married | Unmarried |
| 15 to 19 years | 0 (0.0%) | 0 (0.0%) |
| 20 to 34 years | 11 (55.0%) | 9 (45.0%) |
| 35 to 50 years | 18 (100.0%) | 0 (0.0%) |
| Total | 29 (76.3%) | 9 (23.7%) |
Fertility by Education in Warren County
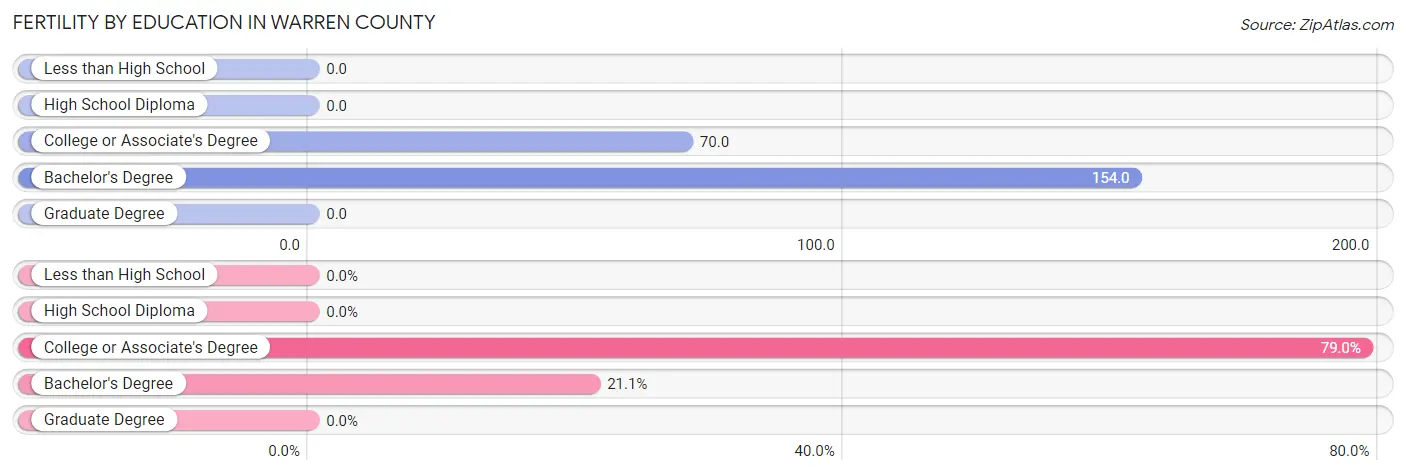
| Educational Attainment | Women with Births | Births / 1,000 Women |
| Less than High School | 0 (0.0%) | 0.0 |
| High School Diploma | 0 (0.0%) | 0.0 |
| College or Associate's Degree | 30 (78.9%) | 70.0 |
| Bachelor's Degree | 8 (21.0%) | 154.0 |
| Graduate Degree | 0 (0.0%) | 0.0 |
| Total | 38 (100.0%) | 35.0 |
Fertility by Education by Marriage Status in Warren County
23.7% of women with births in Warren County are unmarried. Women with the educational attainment of bachelor's degree are most likely to be married with 100.0% of them married at childbirth, while women with the educational attainment of college or associate's degree are least likely to be married with 30.0% of them unmarried at childbirth.
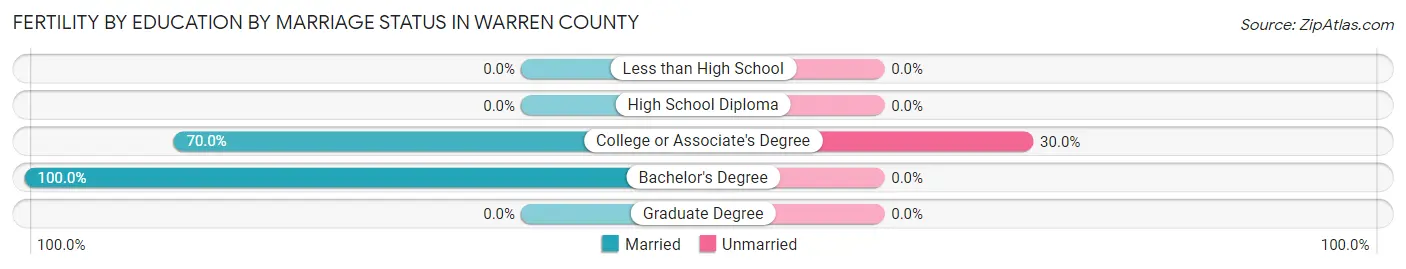
| Educational Attainment | Married | Unmarried |
| Less than High School | 0 (0.0%) | 0 (0.0%) |
| High School Diploma | 0 (0.0%) | 0 (0.0%) |
| College or Associate's Degree | 21 (70.0%) | 9 (30.0%) |
| Bachelor's Degree | 8 (100.0%) | 0 (0.0%) |
| Graduate Degree | 0 (0.0%) | 0 (0.0%) |
| Total | 29 (76.3%) | 9 (23.7%) |
Income in Warren County
Income Overview in Warren County
Per Capita Income in Warren County is $24,249, while median incomes of families and households are $50,690 and $45,091 respectively.
| Characteristic | Number | Measure |
| Per Capita Income | 5,197 | $24,249 |
| Median Family Income | 1,276 | $50,690 |
| Mean Family Income | 1,276 | $66,707 |
| Median Household Income | 1,945 | $45,091 |
| Mean Household Income | 1,945 | $57,899 |
| Income Deficit | 1,276 | $0 |
| Wage / Income Gap (%) | 5,197 | 4.76% |
| Wage / Income Gap ($) | 5,197 | 95.24¢ per $1 |
| Gini / Inequality Index | 5,197 | 0.46 |
Earnings by Sex in Warren County
Average Earnings in Warren County are $29,875, $30,661 for men and $29,201 for women, a difference of 4.8%.
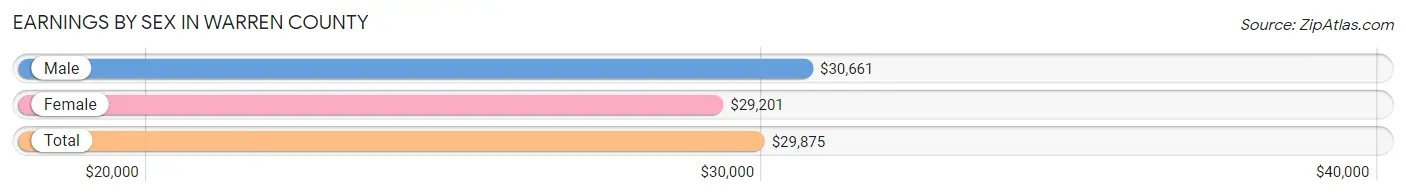
| Sex | Number | Average Earnings |
| Male | 1,213 (53.5%) | $30,661 |
| Female | 1,054 (46.5%) | $29,201 |
| Total | 2,267 (100.0%) | $29,875 |
Earnings by Sex by Income Bracket in Warren County
The most common earnings brackets in Warren County are $10,000 to $12,499 for men (168 | 13.9%) and $35,000 to $39,999 for women (117 | 11.1%).

| Income | Male | Female |
| $2,499 or less | 87 (7.2%) | 23 (2.2%) |
| $2,500 to $4,999 | 20 (1.7%) | 56 (5.3%) |
| $5,000 to $7,499 | 20 (1.7%) | 44 (4.2%) |
| $7,500 to $9,999 | 17 (1.4%) | 10 (0.9%) |
| $10,000 to $12,499 | 168 (13.9%) | 35 (3.3%) |
| $12,500 to $14,999 | 8 (0.7%) | 107 (10.2%) |
| $15,000 to $17,499 | 60 (5.0%) | 48 (4.5%) |
| $17,500 to $19,999 | 60 (5.0%) | 1 (0.1%) |
| $20,000 to $22,499 | 30 (2.5%) | 61 (5.8%) |
| $22,500 to $24,999 | 70 (5.8%) | 56 (5.3%) |
| $25,000 to $29,999 | 48 (4.0%) | 109 (10.3%) |
| $30,000 to $34,999 | 118 (9.7%) | 92 (8.7%) |
| $35,000 to $39,999 | 60 (5.0%) | 117 (11.1%) |
| $40,000 to $44,999 | 59 (4.9%) | 47 (4.5%) |
| $45,000 to $49,999 | 7 (0.6%) | 33 (3.1%) |
| $50,000 to $54,999 | 27 (2.2%) | 40 (3.8%) |
| $55,000 to $64,999 | 131 (10.8%) | 74 (7.0%) |
| $65,000 to $74,999 | 35 (2.9%) | 29 (2.8%) |
| $75,000 to $99,999 | 99 (8.2%) | 40 (3.8%) |
| $100,000+ | 89 (7.3%) | 32 (3.0%) |
| Total | 1,213 (100.0%) | 1,054 (100.0%) |
Earnings by Sex by Educational Attainment in Warren County
Average earnings in Warren County are $34,193 for men and $32,235 for women, a difference of 5.7%. Men with an educational attainment of bachelor's degree enjoy the highest average annual earnings of $85,208, while those with less than high school education earn the least with $25,292. Women with an educational attainment of graduate degree earn the most with the average annual earnings of $73,287, while those with less than high school education have the smallest earnings of $24,722.
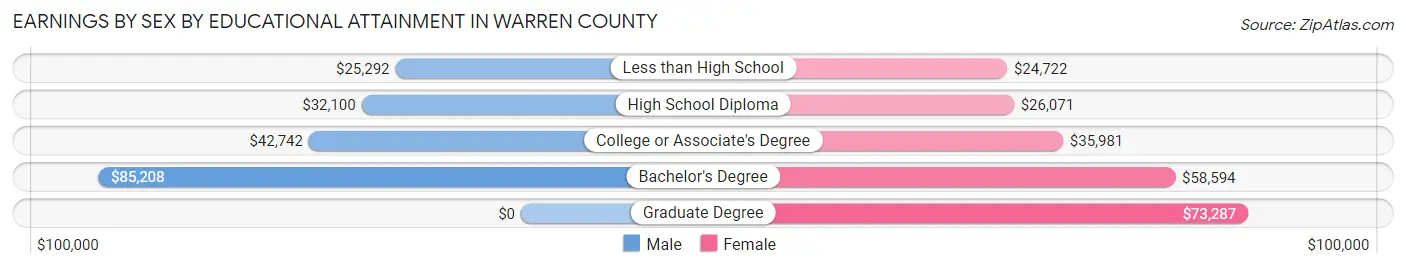
| Educational Attainment | Male Income | Female Income |
| Less than High School | $25,292 | $24,722 |
| High School Diploma | $32,100 | $26,071 |
| College or Associate's Degree | $42,742 | $35,981 |
| Bachelor's Degree | $85,208 | $58,594 |
| Graduate Degree | - | - |
| Total | $34,193 | $32,235 |
Family Income in Warren County
Family Income Brackets in Warren County
According to the Warren County family income data, there are 255 families falling into the $50,000 to $74,999 income range, which is the most common income bracket and makes up 20.0% of all families. Conversely, the $200,000+ income bracket is the least frequent group with only 32 families (2.5%) belonging to this category.
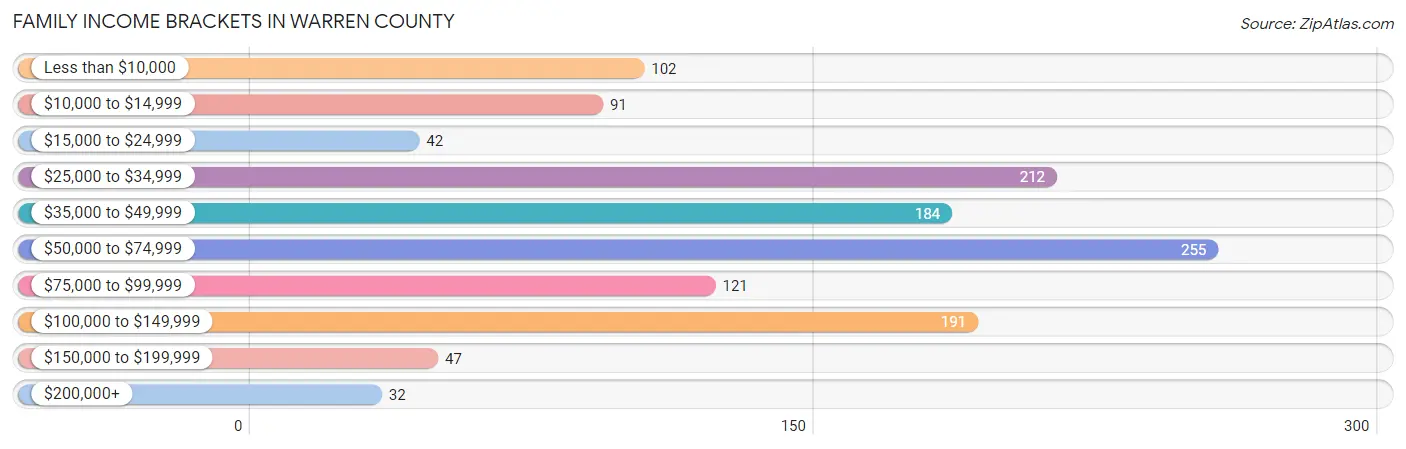
| Income Bracket | # Families | % Families |
| Less than $10,000 | 102 | 8.0% |
| $10,000 to $14,999 | 91 | 7.1% |
| $15,000 to $24,999 | 42 | 3.3% |
| $25,000 to $34,999 | 212 | 16.6% |
| $35,000 to $49,999 | 184 | 14.4% |
| $50,000 to $74,999 | 255 | 20.0% |
| $75,000 to $99,999 | 121 | 9.5% |
| $100,000 to $149,999 | 191 | 15.0% |
| $150,000 to $199,999 | 47 | 3.7% |
| $200,000+ | 32 | 2.5% |
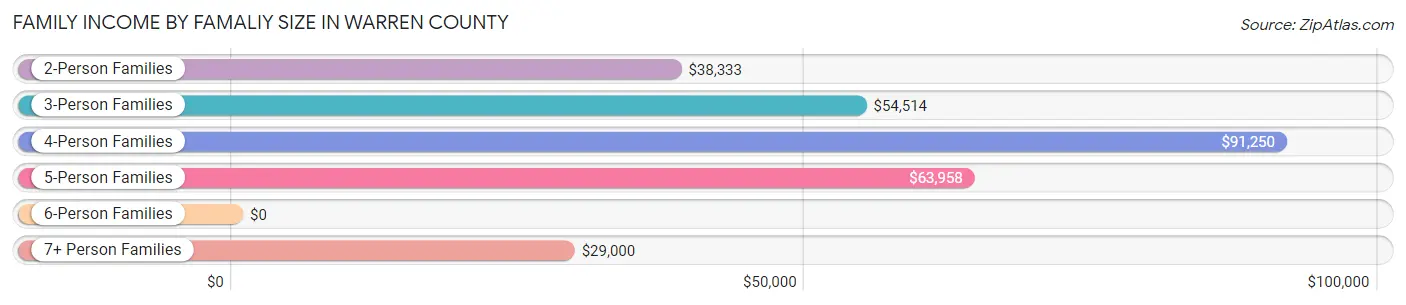
Family Income by Famaliy Size in Warren County
4-person families (137 | 10.7%) account for the highest median family income in Warren County with $91,250 per family, while 4-person families (137 | 10.7%) have the highest median income of $22,812 per family member.
| Income Bracket | # Families | Median Income |
| 2-Person Families | 718 (56.3%) | $38,333 |
| 3-Person Families | 323 (25.3%) | $54,514 |
| 4-Person Families | 137 (10.7%) | $91,250 |
| 5-Person Families | 86 (6.7%) | $63,958 |
| 6-Person Families | 0 (0.0%) | $0 |
| 7+ Person Families | 12 (0.9%) | $29,000 |
| Total | 1,276 (100.0%) | $50,690 |
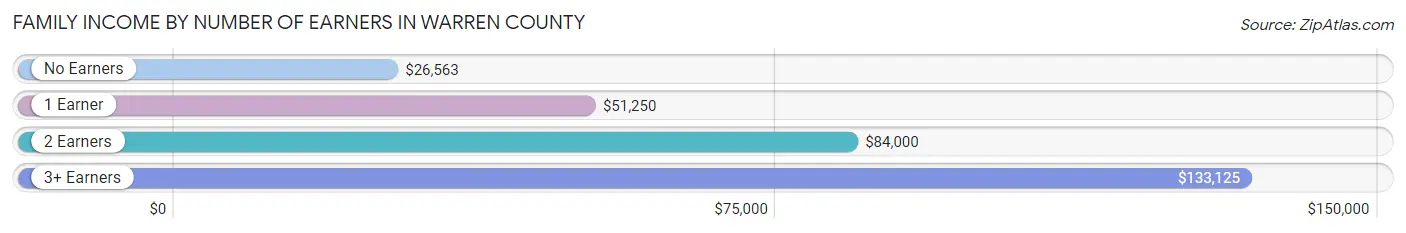
Family Income by Number of Earners in Warren County
The median family income in Warren County is $50,690, with families comprising 3+ earners (82) having the highest median family income of $133,125, while families with no earners (321) have the lowest median family income of $26,563, accounting for 6.4% and 25.2% of families, respectively.
| Number of Earners | # Families | Median Income |
| No Earners | 321 (25.2%) | $26,563 |
| 1 Earner | 523 (41.0%) | $51,250 |
| 2 Earners | 350 (27.4%) | $84,000 |
| 3+ Earners | 82 (6.4%) | $133,125 |
| Total | 1,276 (100.0%) | $50,690 |
Household Income in Warren County
Household Income Brackets in Warren County
With 393 households falling in the category, the $50,000 to $74,999 income range is the most frequent in Warren County, accounting for 20.2% of all households. In contrast, only 41 households (2.1%) fall into the $200,000+ income bracket, making it the least populous group.

| Income Bracket | # Households | % Households |
| Less than $10,000 | 179 | 9.2% |
| $10,000 to $14,999 | 175 | 9.0% |
| $15,000 to $24,999 | 126 | 6.5% |
| $25,000 to $34,999 | 303 | 15.6% |
| $35,000 to $49,999 | 336 | 17.3% |
| $50,000 to $74,999 | 393 | 20.2% |
| $75,000 to $99,999 | 140 | 7.2% |
| $100,000 to $149,999 | 204 | 10.5% |
| $150,000 to $199,999 | 47 | 2.4% |
| $200,000+ | 41 | 2.1% |
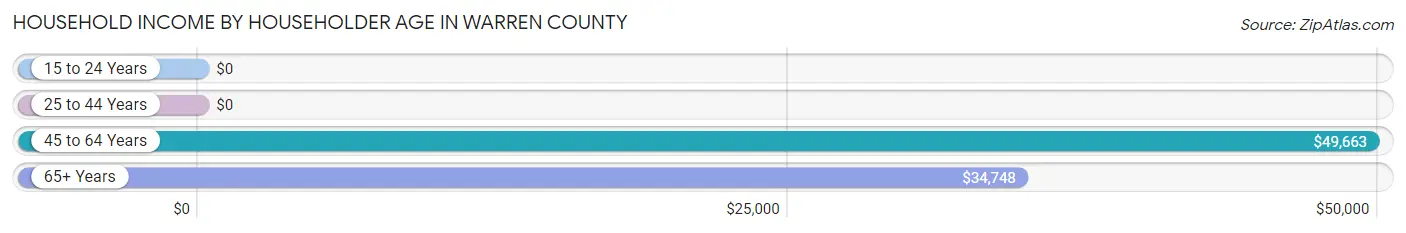
Household Income by Householder Age in Warren County
The median household income in Warren County is $45,091, with the highest median household income of $49,663 found in the 45 to 64 years age bracket for the primary householder. A total of 803 households (41.3%) fall into this category. Meanwhile, the 15 to 24 years age bracket for the primary householder has the lowest median household income of $0, with 3 households (0.2%) in this group.
| Income Bracket | # Households | Median Income |
| 15 to 24 Years | 3 (0.2%) | $0 |
| 25 to 44 Years | 410 (21.1%) | $0 |
| 45 to 64 Years | 803 (41.3%) | $49,663 |
| 65+ Years | 729 (37.5%) | $34,748 |
| Total | 1,945 (100.0%) | $45,091 |
Poverty in Warren County
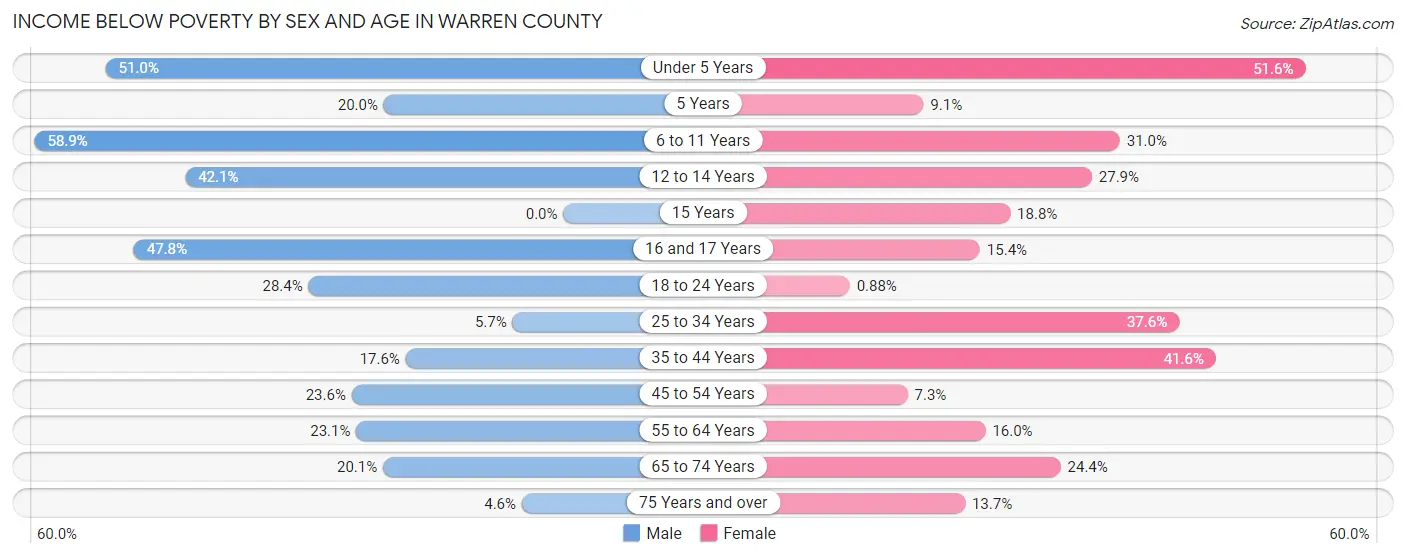
Income Below Poverty by Sex and Age in Warren County
With 23.2% poverty level for males and 22.7% for females among the residents of Warren County, 6 to 11 year old males and under 5 year old females are the most vulnerable to poverty, with 96 males (58.9%) and 64 females (51.6%) in their respective age groups living below the poverty level.
| Age Bracket | Male | Female |
| Under 5 Years | 78 (51.0%) | 64 (51.6%) |
| 5 Years | 4 (20.0%) | 2 (9.1%) |
| 6 to 11 Years | 96 (58.9%) | 74 (31.0%) |
| 12 to 14 Years | 16 (42.1%) | 22 (27.9%) |
| 15 Years | 0 (0.0%) | 12 (18.8%) |
| 16 and 17 Years | 11 (47.8%) | 12 (15.4%) |
| 18 to 24 Years | 63 (28.4%) | 2 (0.9%) |
| 25 to 34 Years | 15 (5.7%) | 89 (37.6%) |
| 35 to 44 Years | 46 (17.6%) | 132 (41.6%) |
| 45 to 54 Years | 74 (23.6%) | 22 (7.3%) |
| 55 to 64 Years | 86 (23.1%) | 68 (16.0%) |
| 65 to 74 Years | 51 (20.1%) | 87 (24.4%) |
| 75 Years and over | 11 (4.6%) | 38 (13.7%) |
| Total | 551 (23.2%) | 624 (22.7%) |
Income Above Poverty by Sex and Age in Warren County
According to the poverty statistics in Warren County, males aged 15 years and females aged 18 to 24 years are the age groups that are most secure financially, with 100.0% of males and 99.1% of females in these age groups living above the poverty line.
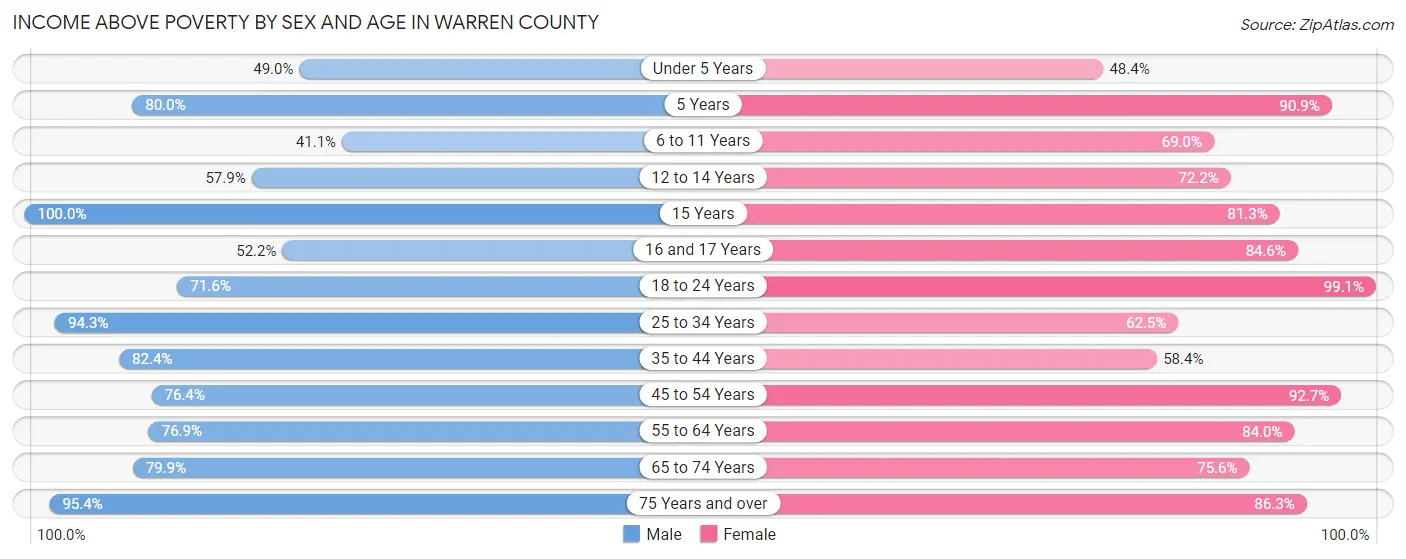
| Age Bracket | Male | Female |
| Under 5 Years | 75 (49.0%) | 60 (48.4%) |
| 5 Years | 16 (80.0%) | 20 (90.9%) |
| 6 to 11 Years | 67 (41.1%) | 165 (69.0%) |
| 12 to 14 Years | 22 (57.9%) | 57 (72.2%) |
| 15 Years | 50 (100.0%) | 52 (81.2%) |
| 16 and 17 Years | 12 (52.2%) | 66 (84.6%) |
| 18 to 24 Years | 159 (71.6%) | 224 (99.1%) |
| 25 to 34 Years | 250 (94.3%) | 148 (62.5%) |
| 35 to 44 Years | 216 (82.4%) | 185 (58.4%) |
| 45 to 54 Years | 240 (76.4%) | 278 (92.7%) |
| 55 to 64 Years | 287 (76.9%) | 357 (84.0%) |
| 65 to 74 Years | 203 (79.9%) | 270 (75.6%) |
| 75 Years and over | 227 (95.4%) | 239 (86.3%) |
| Total | 1,824 (76.8%) | 2,121 (77.3%) |
Income Below Poverty Among Married-Couple Families in Warren County
The poverty statistics for married-couple families in Warren County show that 3.6% or 26 of the total 713 families live below the poverty line. Families with 5 or more children have the highest poverty rate of 100.0%, comprising of 4 families. On the other hand, families with 3 or 4 children have the lowest poverty rate of 0.0%, which includes 0 families.

| Children | Above Poverty | Below Poverty |
| No Children | 489 (96.5%) | 18 (3.5%) |
| 1 or 2 Children | 187 (97.9%) | 4 (2.1%) |
| 3 or 4 Children | 11 (100.0%) | 0 (0.0%) |
| 5 or more Children | 0 (0.0%) | 4 (100.0%) |
| Total | 687 (96.4%) | 26 (3.6%) |
Income Below Poverty Among Single-Parent Households in Warren County
According to the poverty data in Warren County, 17.9% or 24 single-father households and 43.1% or 185 single-mother households are living below the poverty line. Among single-father households, those with no children have the highest poverty rate, with 18 households (22.5%) experiencing poverty. Likewise, among single-mother households, those with 5 or more children have the highest poverty rate, with 6 households (100.0%) falling below the poverty line.
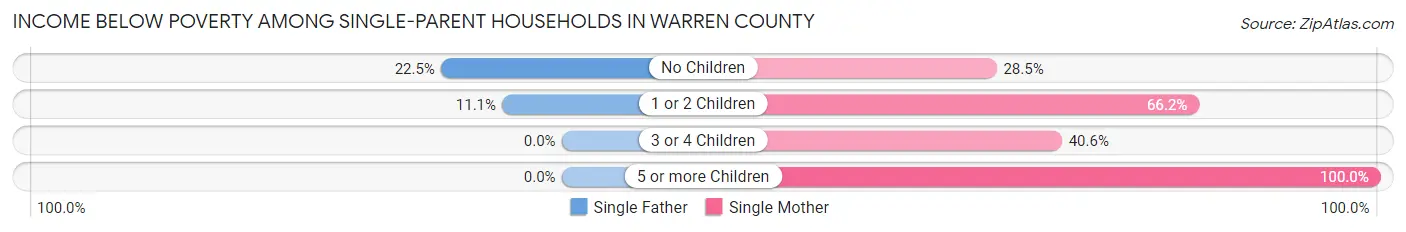
| Children | Single Father | Single Mother |
| No Children | 18 (22.5%) | 70 (28.5%) |
| 1 or 2 Children | 6 (11.1%) | 96 (66.2%) |
| 3 or 4 Children | 0 (0.0%) | 13 (40.6%) |
| 5 or more Children | 0 (0.0%) | 6 (100.0%) |
| Total | 24 (17.9%) | 185 (43.1%) |
Income Below Poverty Among Married-Couple vs Single-Parent Households in Warren County
The poverty data for Warren County shows that 26 of the married-couple family households (3.6%) and 209 of the single-parent households (37.1%) are living below the poverty level. Within the married-couple family households, those with 5 or more children have the highest poverty rate, with 4 households (100.0%) falling below the poverty line. Among the single-parent households, those with 5 or more children have the highest poverty rate, with 6 household (100.0%) living below poverty.
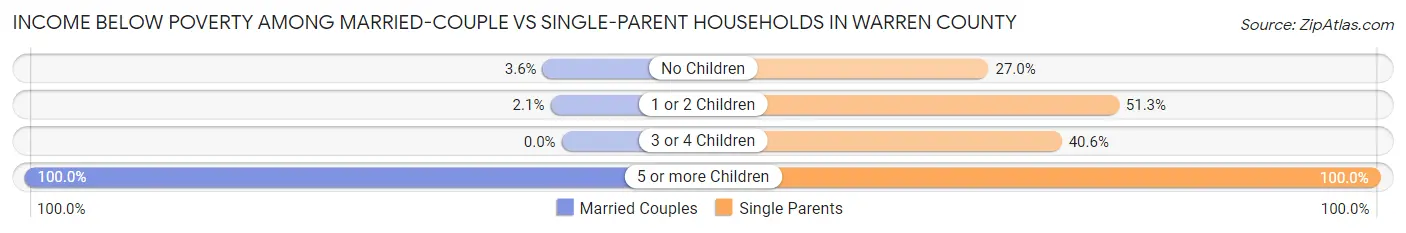
| Children | Married-Couple Families | Single-Parent Households |
| No Children | 18 (3.5%) | 88 (27.0%) |
| 1 or 2 Children | 4 (2.1%) | 102 (51.3%) |
| 3 or 4 Children | 0 (0.0%) | 13 (40.6%) |
| 5 or more Children | 4 (100.0%) | 6 (100.0%) |
| Total | 26 (3.6%) | 209 (37.1%) |
Employment Characteristics in Warren County
Employment by Class of Employer in Warren County
Among the 1,993 employed individuals in Warren County, private company employees (1,444 | 72.5%), state government employees (211 | 10.6%), and local government employees (107 | 5.4%) make up the most common classes of employment.
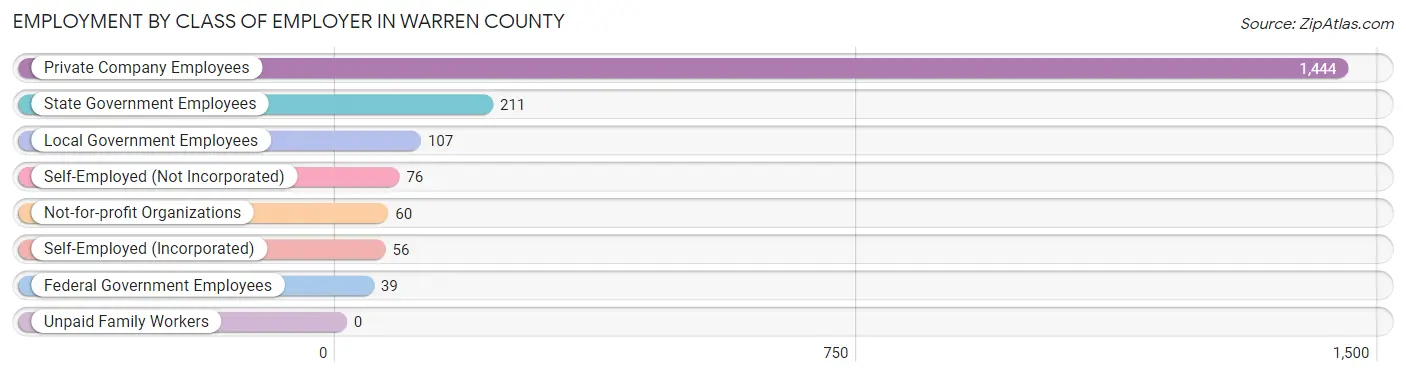
| Employer Class | # Employees | % Employees |
| Private Company Employees | 1,444 | 72.5% |
| Self-Employed (Incorporated) | 56 | 2.8% |
| Self-Employed (Not Incorporated) | 76 | 3.8% |
| Not-for-profit Organizations | 60 | 3.0% |
| Local Government Employees | 107 | 5.4% |
| State Government Employees | 211 | 10.6% |
| Federal Government Employees | 39 | 2.0% |
| Unpaid Family Workers | 0 | 0.0% |
| Total | 1,993 | 100.0% |
Employment Status by Age in Warren County
According to the labor force statistics for Warren County, out of the total population over 16 years of age (4,241), 52.4% or 2,222 individuals are in the labor force, with 9.0% or 200 of them unemployed. The age group with the highest labor force participation rate is 25 to 29 years, with 93.1% or 231 individuals in the labor force. Within the labor force, the 35 to 44 years age range has the highest percentage of unemployed individuals, with 23.1% or 102 of them being unemployed.
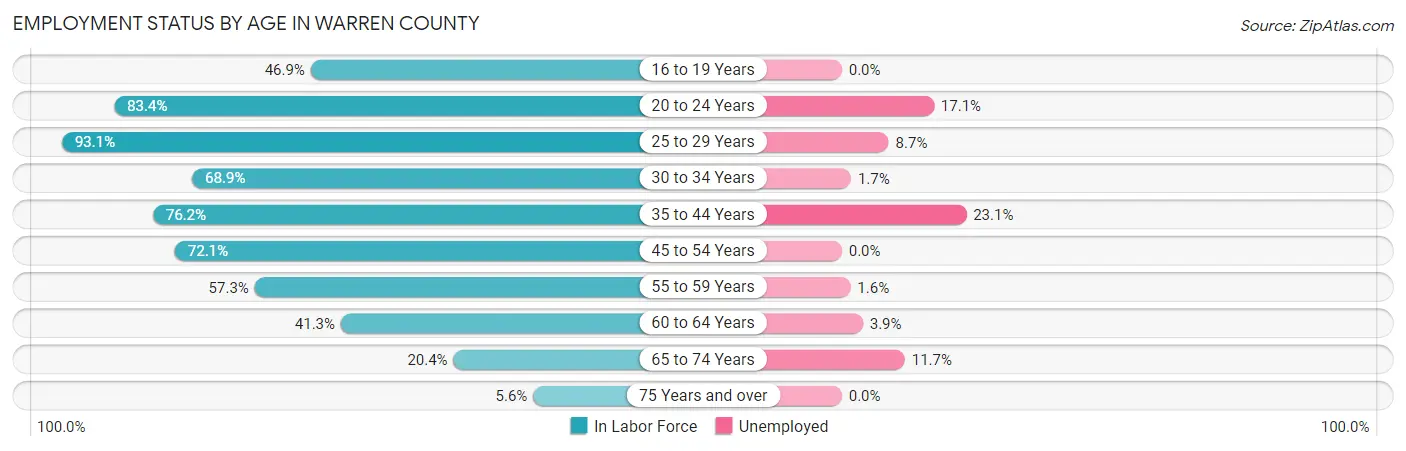
| Age Bracket | In Labor Force | Unemployed |
| 16 to 19 Years | 99 (46.9%) | 0 (0.0%) |
| 20 to 24 Years | 282 (83.4%) | 48 (17.1%) |
| 25 to 29 Years | 231 (93.1%) | 20 (8.7%) |
| 30 to 34 Years | 175 (68.9%) | 3 (1.7%) |
| 35 to 44 Years | 441 (76.2%) | 102 (23.1%) |
| 45 to 54 Years | 446 (72.1%) | 0 (0.0%) |
| 55 to 59 Years | 185 (57.3%) | 3 (1.6%) |
| 60 to 64 Years | 203 (41.3%) | 8 (3.9%) |
| 65 to 74 Years | 128 (20.4%) | 15 (11.7%) |
| 75 Years and over | 31 (5.6%) | 0 (0.0%) |
| Total | 2,222 (52.4%) | 200 (9.0%) |
Employment Status by Educational Attainment in Warren County
According to labor force statistics for Warren County, 66.9% of individuals (1,682) out of the total population between 25 and 64 years of age (2,514) are in the labor force, with 8.1% or 136 of them being unemployed. The group with the highest labor force participation rate are those with the educational attainment of bachelor's degree or higher, with 85.6% or 225 individuals in the labor force. Within the labor force, individuals with high school diploma education have the highest percentage of unemployment, with 12.4% or 84 of them being unemployed.
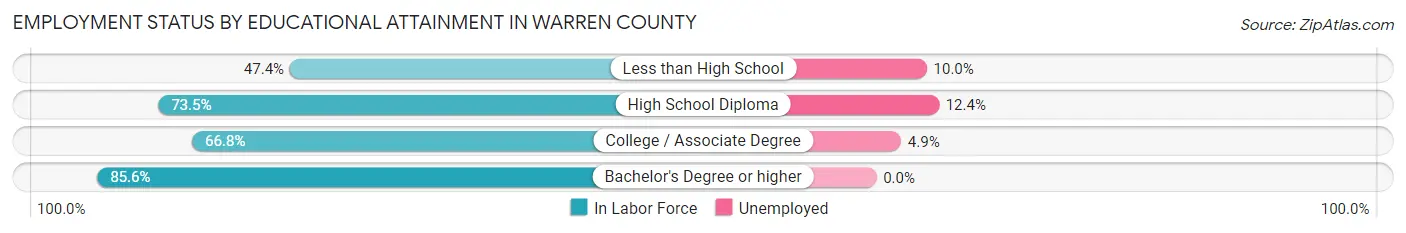
| Educational Attainment | In Labor Force | Unemployed |
| Less than High School | 269 (47.4%) | 57 (10.0%) |
| High School Diploma | 679 (73.5%) | 115 (12.4%) |
| College / Associate Degree | 508 (66.8%) | 37 (4.9%) |
| Bachelor's Degree or higher | 225 (85.6%) | 0 (0.0%) |
| Total | 1,682 (66.9%) | 204 (8.1%) |
Employment Occupations by Sex in Warren County
Management, Business, Science and Arts Occupations
The most common Management, Business, Science and Arts occupations in Warren County are Community & Social Service (167 | 8.3%), Management (146 | 7.2%), Education Instruction & Library (113 | 5.6%), Computers, Engineering & Science (91 | 4.5%), and Architecture & Engineering (52 | 2.6%).
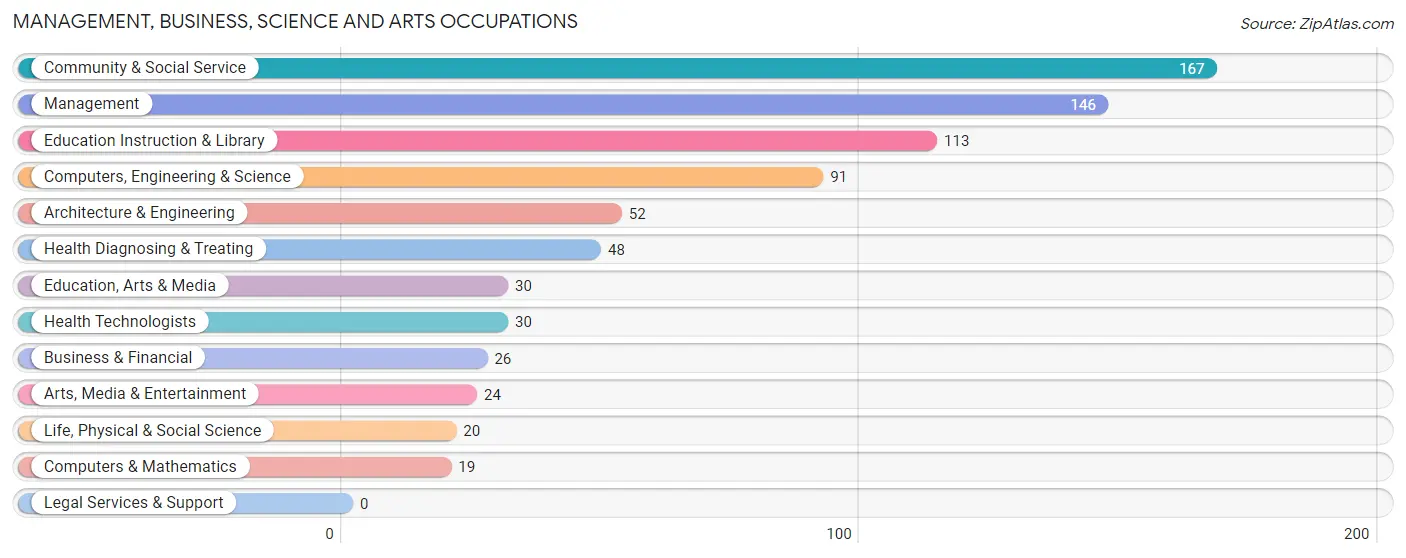
Management, Business, Science and Arts Occupations by Sex
Within the Management, Business, Science and Arts occupations in Warren County, the most male-oriented occupations are Architecture & Engineering (100.0%), Computers, Engineering & Science (70.3%), and Management (65.7%), while the most female-oriented occupations are Business & Financial (100.0%), Life, Physical & Social Science (100.0%), and Education, Arts & Media (100.0%).

| Occupation | Male | Female |
| Management | 96 (65.7%) | 50 (34.3%) |
| Business & Financial | 0 (0.0%) | 26 (100.0%) |
| Computers, Engineering & Science | 64 (70.3%) | 27 (29.7%) |
| Computers & Mathematics | 12 (63.2%) | 7 (36.8%) |
| Architecture & Engineering | 52 (100.0%) | 0 (0.0%) |
| Life, Physical & Social Science | 0 (0.0%) | 20 (100.0%) |
| Community & Social Service | 7 (4.2%) | 160 (95.8%) |
| Education, Arts & Media | 0 (0.0%) | 30 (100.0%) |
| Legal Services & Support | 0 (0.0%) | 0 (0.0%) |
| Education Instruction & Library | 7 (6.2%) | 106 (93.8%) |
| Arts, Media & Entertainment | 0 (0.0%) | 24 (100.0%) |
| Health Diagnosing & Treating | 3 (6.2%) | 45 (93.8%) |
| Health Technologists | 3 (10.0%) | 27 (90.0%) |
| Total (Category) | 170 (35.6%) | 308 (64.4%) |
| Total (Overall) | 1,068 (52.9%) | 952 (47.1%) |
Services Occupations
The most common Services occupations in Warren County are Healthcare Support (126 | 6.2%), Food Preparation & Serving (106 | 5.2%), Cleaning & Maintenance (85 | 4.2%), Security & Protection (74 | 3.7%), and Law Enforcement (74 | 3.7%).
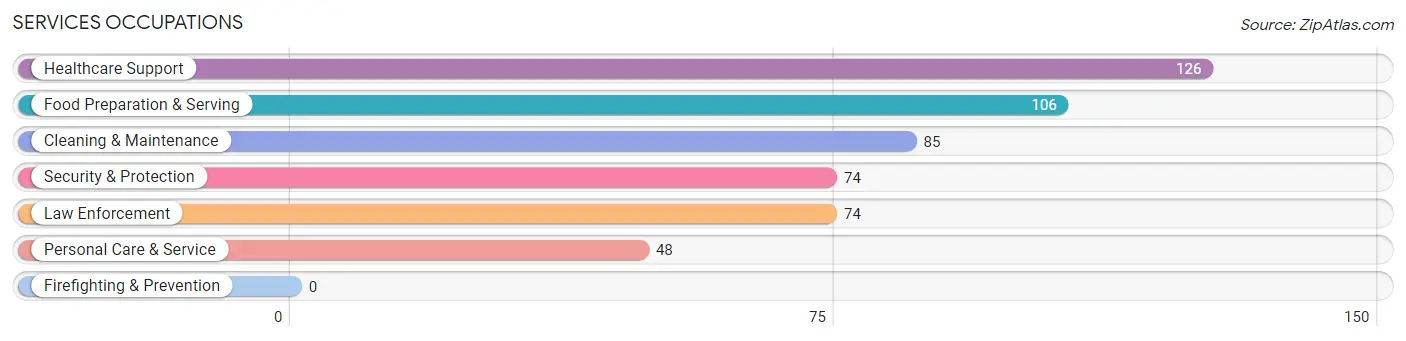
Services Occupations by Sex
Within the Services occupations in Warren County, the most male-oriented occupations are Personal Care & Service (89.6%), Cleaning & Maintenance (85.9%), and Food Preparation & Serving (59.4%), while the most female-oriented occupations are Healthcare Support (100.0%), Security & Protection (64.9%), and Law Enforcement (64.9%).
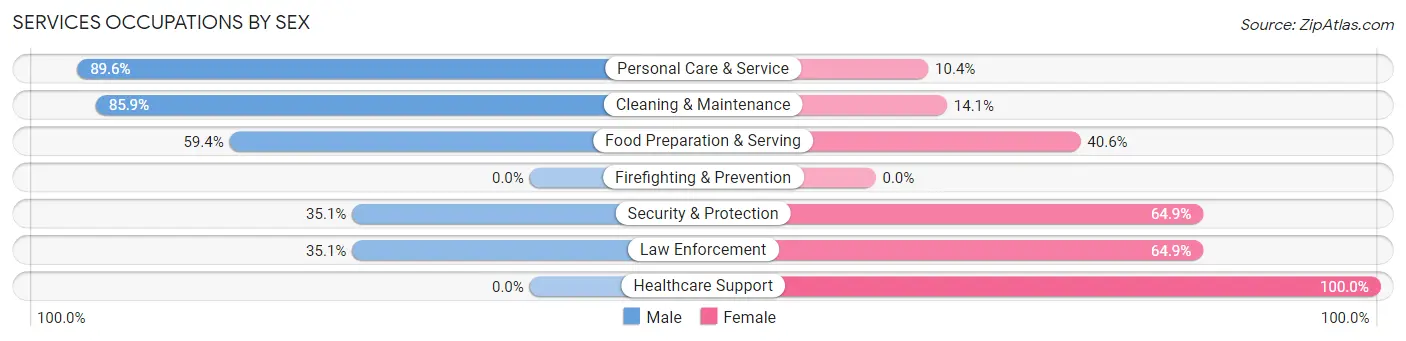
| Occupation | Male | Female |
| Healthcare Support | 0 (0.0%) | 126 (100.0%) |
| Security & Protection | 26 (35.1%) | 48 (64.9%) |
| Firefighting & Prevention | 0 (0.0%) | 0 (0.0%) |
| Law Enforcement | 26 (35.1%) | 48 (64.9%) |
| Food Preparation & Serving | 63 (59.4%) | 43 (40.6%) |
| Cleaning & Maintenance | 73 (85.9%) | 12 (14.1%) |
| Personal Care & Service | 43 (89.6%) | 5 (10.4%) |
| Total (Category) | 205 (46.7%) | 234 (53.3%) |
| Total (Overall) | 1,068 (52.9%) | 952 (47.1%) |
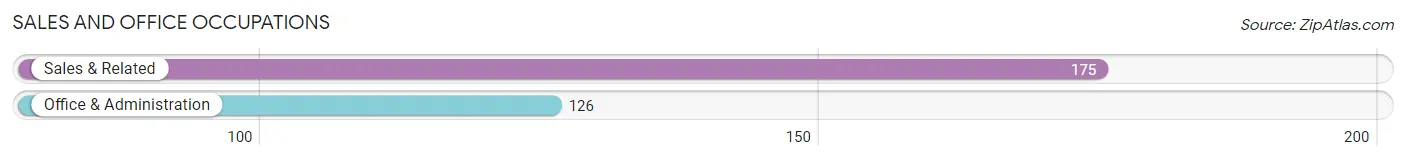
Sales and Office Occupations
The most common Sales and Office occupations in Warren County are Sales & Related (175 | 8.7%), and Office & Administration (126 | 6.2%).
Sales and Office Occupations by Sex
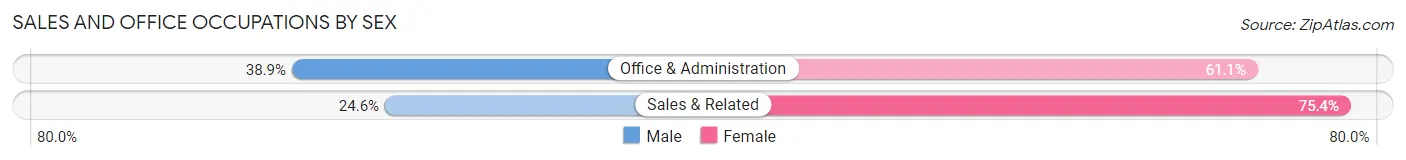
| Occupation | Male | Female |
| Sales & Related | 43 (24.6%) | 132 (75.4%) |
| Office & Administration | 49 (38.9%) | 77 (61.1%) |
| Total (Category) | 92 (30.6%) | 209 (69.4%) |
| Total (Overall) | 1,068 (52.9%) | 952 (47.1%) |
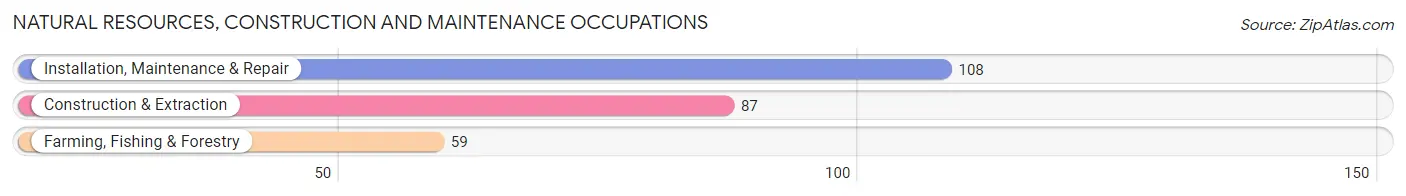
Natural Resources, Construction and Maintenance Occupations
The most common Natural Resources, Construction and Maintenance occupations in Warren County are Installation, Maintenance & Repair (108 | 5.3%), Construction & Extraction (87 | 4.3%), and Farming, Fishing & Forestry (59 | 2.9%).
Natural Resources, Construction and Maintenance Occupations by Sex
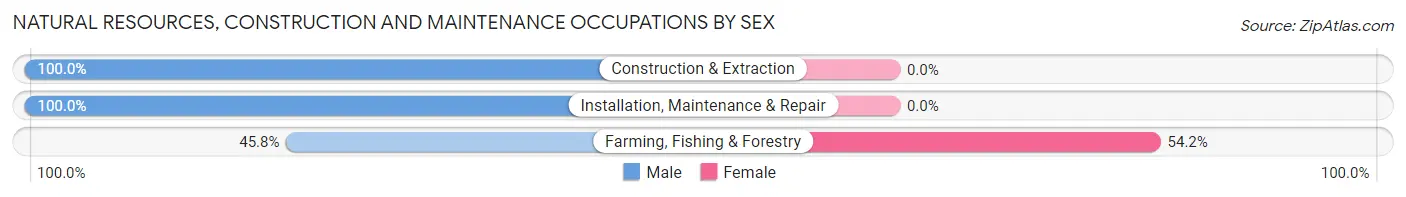
| Occupation | Male | Female |
| Farming, Fishing & Forestry | 27 (45.8%) | 32 (54.2%) |
| Construction & Extraction | 87 (100.0%) | 0 (0.0%) |
| Installation, Maintenance & Repair | 108 (100.0%) | 0 (0.0%) |
| Total (Category) | 222 (87.4%) | 32 (12.6%) |
| Total (Overall) | 1,068 (52.9%) | 952 (47.1%) |
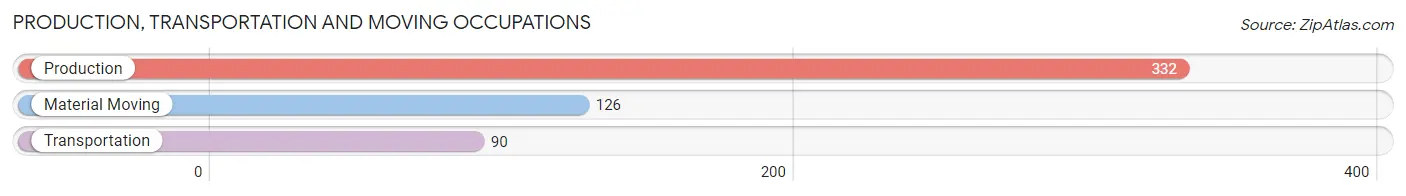
Production, Transportation and Moving Occupations
The most common Production, Transportation and Moving occupations in Warren County are Production (332 | 16.4%), Material Moving (126 | 6.2%), and Transportation (90 | 4.5%).
Production, Transportation and Moving Occupations by Sex
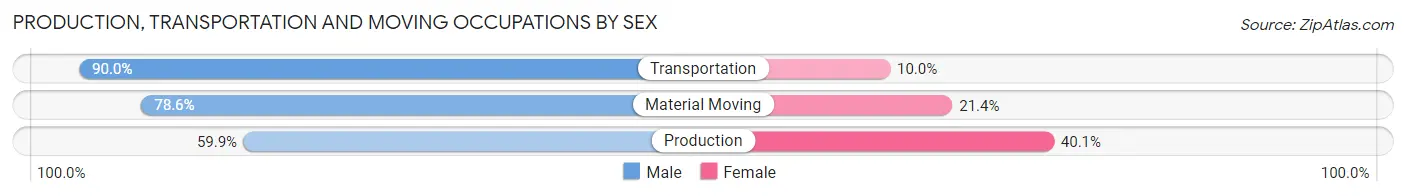
| Occupation | Male | Female |
| Production | 199 (59.9%) | 133 (40.1%) |
| Transportation | 81 (90.0%) | 9 (10.0%) |
| Material Moving | 99 (78.6%) | 27 (21.4%) |
| Total (Category) | 379 (69.2%) | 169 (30.8%) |
| Total (Overall) | 1,068 (52.9%) | 952 (47.1%) |
Employment Industries by Sex in Warren County
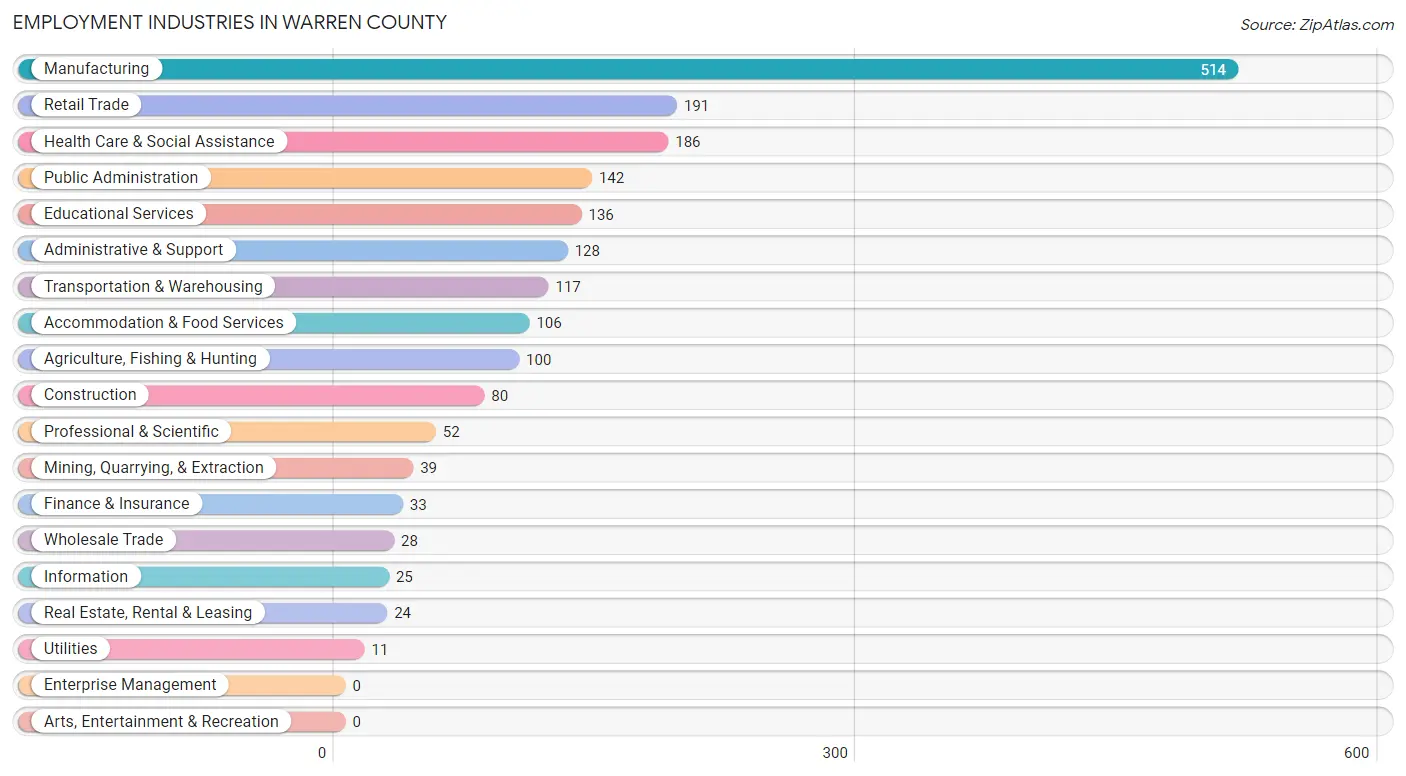
Employment Industries in Warren County
The major employment industries in Warren County include Manufacturing (514 | 25.5%), Retail Trade (191 | 9.5%), Health Care & Social Assistance (186 | 9.2%), Public Administration (142 | 7.0%), and Educational Services (136 | 6.7%).
Employment Industries by Sex in Warren County
The Warren County industries that see more men than women are Mining, Quarrying, & Extraction (100.0%), Wholesale Trade (100.0%), and Utilities (100.0%), whereas the industries that tend to have a higher number of women are Information (100.0%), Health Care & Social Assistance (98.4%), and Educational Services (92.6%).
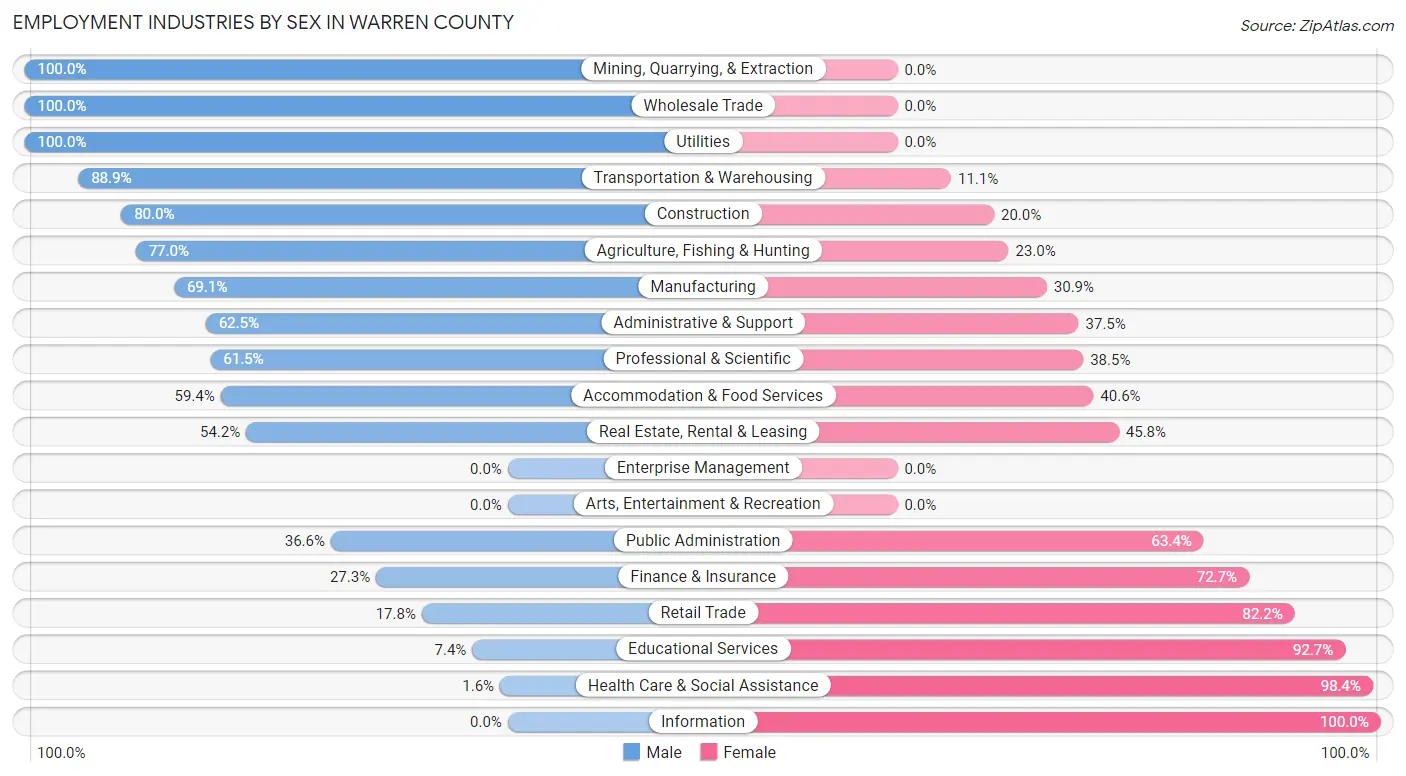
| Industry | Male | Female |
| Agriculture, Fishing & Hunting | 77 (77.0%) | 23 (23.0%) |
| Mining, Quarrying, & Extraction | 39 (100.0%) | 0 (0.0%) |
| Construction | 64 (80.0%) | 16 (20.0%) |
| Manufacturing | 355 (69.1%) | 159 (30.9%) |
| Wholesale Trade | 28 (100.0%) | 0 (0.0%) |
| Retail Trade | 34 (17.8%) | 157 (82.2%) |
| Transportation & Warehousing | 104 (88.9%) | 13 (11.1%) |
| Utilities | 11 (100.0%) | 0 (0.0%) |
| Information | 0 (0.0%) | 25 (100.0%) |
| Finance & Insurance | 9 (27.3%) | 24 (72.7%) |
| Real Estate, Rental & Leasing | 13 (54.2%) | 11 (45.8%) |
| Professional & Scientific | 32 (61.5%) | 20 (38.5%) |
| Enterprise Management | 0 (0.0%) | 0 (0.0%) |
| Administrative & Support | 80 (62.5%) | 48 (37.5%) |
| Educational Services | 10 (7.3%) | 126 (92.6%) |
| Health Care & Social Assistance | 3 (1.6%) | 183 (98.4%) |
| Arts, Entertainment & Recreation | 0 (0.0%) | 0 (0.0%) |
| Accommodation & Food Services | 63 (59.4%) | 43 (40.6%) |
| Public Administration | 52 (36.6%) | 90 (63.4%) |
| Total | 1,068 (52.9%) | 952 (47.1%) |
Education in Warren County
School Enrollment in Warren County
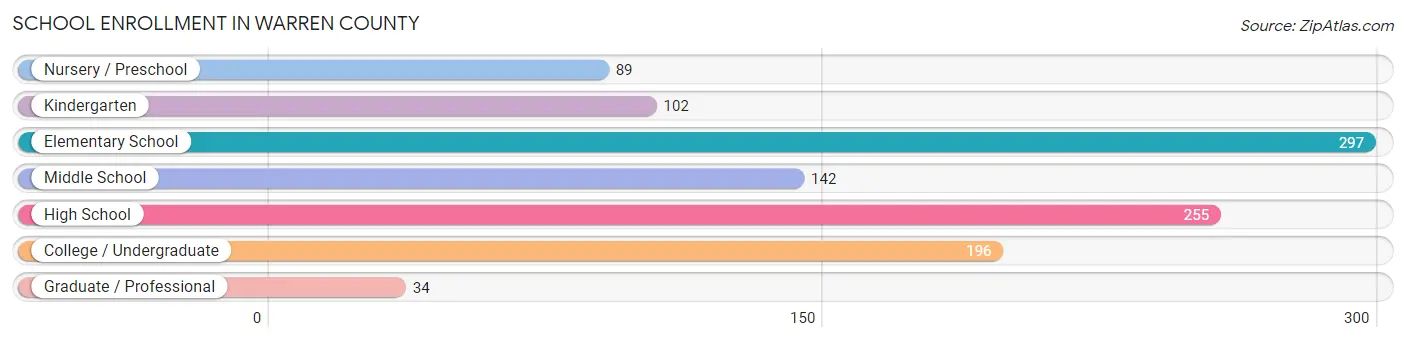
The most common levels of schooling among the 1,115 students in Warren County are elementary school (297 | 26.6%), high school (255 | 22.9%), and college / undergraduate (196 | 17.6%).
| School Level | # Students | % Students |
| Nursery / Preschool | 89 | 8.0% |
| Kindergarten | 102 | 9.1% |
| Elementary School | 297 | 26.6% |
| Middle School | 142 | 12.7% |
| High School | 255 | 22.9% |
| College / Undergraduate | 196 | 17.6% |
| Graduate / Professional | 34 | 3.0% |
| Total | 1,115 | 100.0% |
School Enrollment by Age by Funding Source in Warren County
Out of a total of 1,115 students who are enrolled in schools in Warren County, 212 (19.0%) attend a private institution, while the remaining 903 (81.0%) are enrolled in public schools. The age group of 15 to 17 year olds has the highest likelihood of being enrolled in private schools, with 79 (38.0% in the age bracket) enrolled. Conversely, the age group of 3 to 4 year olds has the lowest likelihood of being enrolled in a private school, with 89 (100.0% in the age bracket) attending a public institution.
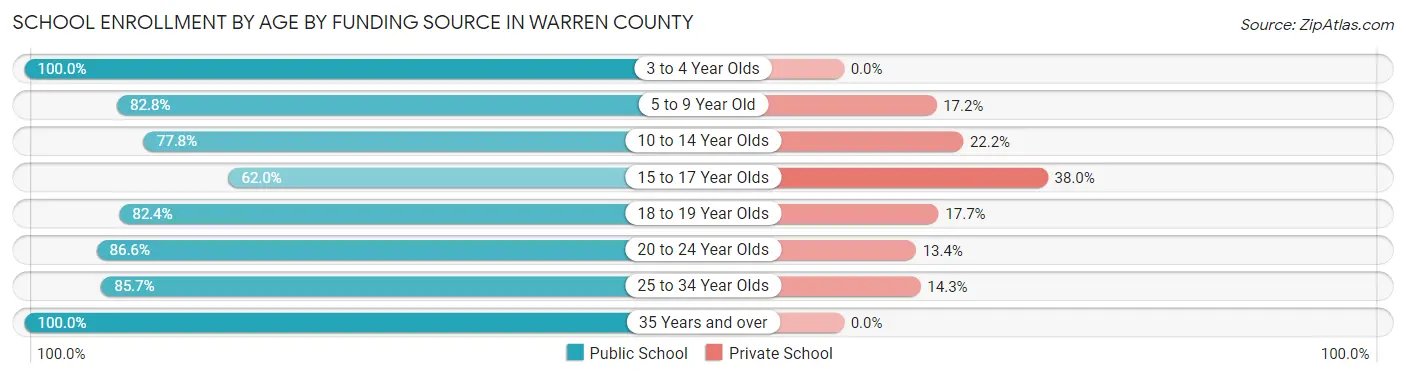
| Age Bracket | Public School | Private School |
| 3 to 4 Year Olds | 89 (100.0%) | 0 (0.0%) |
| 5 to 9 Year Old | 269 (82.8%) | 56 (17.2%) |
| 10 to 14 Year Olds | 182 (77.8%) | 52 (22.2%) |
| 15 to 17 Year Olds | 129 (62.0%) | 79 (38.0%) |
| 18 to 19 Year Olds | 14 (82.4%) | 3 (17.6%) |
| 20 to 24 Year Olds | 129 (86.6%) | 20 (13.4%) |
| 25 to 34 Year Olds | 12 (85.7%) | 2 (14.3%) |
| 35 Years and over | 79 (100.0%) | 0 (0.0%) |
| Total | 903 (81.0%) | 212 (19.0%) |
Educational Attainment by Field of Study in Warren County
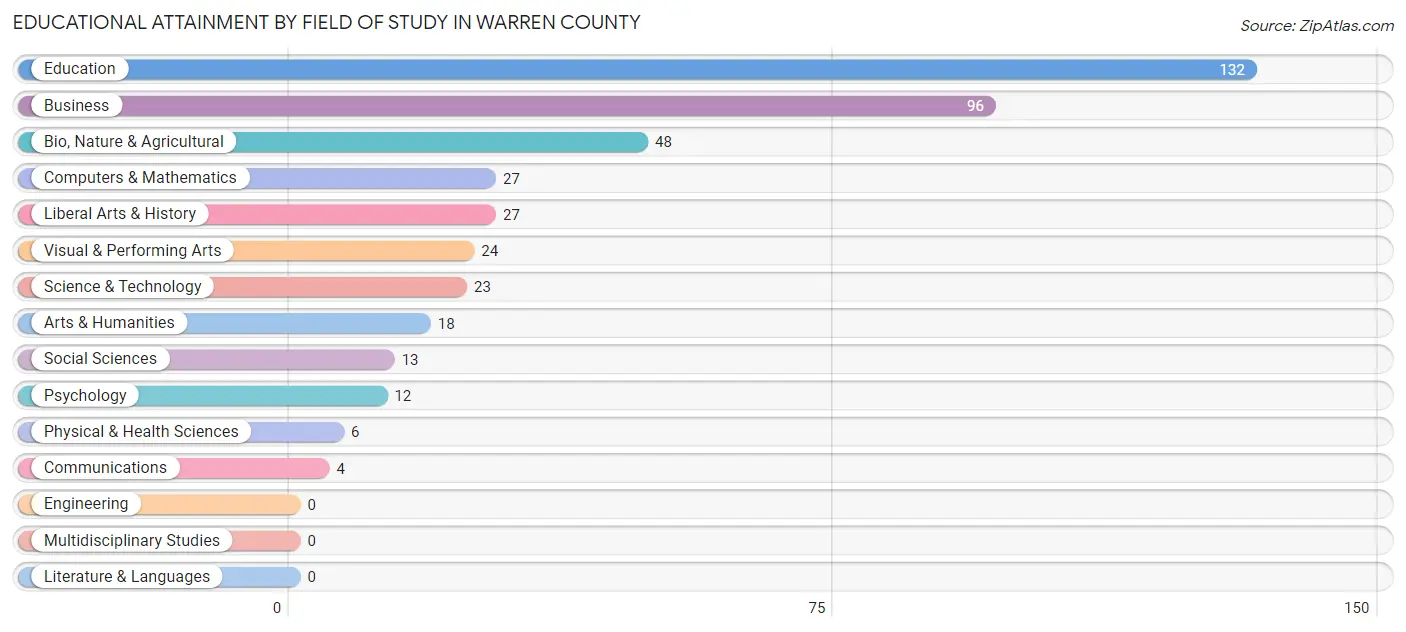
Education (132 | 30.7%), business (96 | 22.3%), bio, nature & agricultural (48 | 11.2%), computers & mathematics (27 | 6.3%), and liberal arts & history (27 | 6.3%) are the most common fields of study among 430 individuals in Warren County who have obtained a bachelor's degree or higher.
| Field of Study | # Graduates | % Graduates |
| Computers & Mathematics | 27 | 6.3% |
| Bio, Nature & Agricultural | 48 | 11.2% |
| Physical & Health Sciences | 6 | 1.4% |
| Psychology | 12 | 2.8% |
| Social Sciences | 13 | 3.0% |
| Engineering | 0 | 0.0% |
| Multidisciplinary Studies | 0 | 0.0% |
| Science & Technology | 23 | 5.3% |
| Business | 96 | 22.3% |
| Education | 132 | 30.7% |
| Literature & Languages | 0 | 0.0% |
| Liberal Arts & History | 27 | 6.3% |
| Visual & Performing Arts | 24 | 5.6% |
| Communications | 4 | 0.9% |
| Arts & Humanities | 18 | 4.2% |
| Total | 430 | 100.0% |
Transportation & Commute in Warren County
Vehicle Availability by Sex in Warren County
The most prevalent vehicle ownership categories in Warren County are males with 2 vehicles (336, accounting for 31.7%) and females with 2 vehicles (358, making up 36.2%).

| Vehicles Available | Male | Female |
| No Vehicle | 103 (9.7%) | 16 (1.7%) |
| 1 Vehicle | 179 (16.9%) | 173 (18.6%) |
| 2 Vehicles | 336 (31.7%) | 358 (38.6%) |
| 3 Vehicles | 185 (17.5%) | 137 (14.8%) |
| 4 Vehicles | 60 (5.7%) | 73 (7.9%) |
| 5 or more Vehicles | 196 (18.5%) | 171 (18.4%) |
| Total | 1,059 (100.0%) | 928 (100.0%) |
Commute Time in Warren County
The most frequently occuring commute durations in Warren County are 15 to 19 minutes (514 commuters, 26.4%), 10 to 14 minutes (285 commuters, 14.6%), and 30 to 34 minutes (249 commuters, 12.8%).

| Commute Time | # Commuters | % Commuters |
| Less than 5 Minutes | 89 | 4.6% |
| 5 to 9 Minutes | 126 | 6.5% |
| 10 to 14 Minutes | 285 | 14.6% |
| 15 to 19 Minutes | 514 | 26.4% |
| 20 to 24 Minutes | 143 | 7.3% |
| 25 to 29 Minutes | 45 | 2.3% |
| 30 to 34 Minutes | 249 | 12.8% |
| 35 to 39 Minutes | 123 | 6.3% |
| 40 to 44 Minutes | 54 | 2.8% |
| 45 to 59 Minutes | 80 | 4.1% |
| 60 to 89 Minutes | 172 | 8.8% |
| 90 or more Minutes | 69 | 3.5% |
Commute Time by Sex in Warren County
The most common commute times in Warren County are 15 to 19 minutes (267 commuters, 26.0%) for males and 15 to 19 minutes (247 commuters, 26.9%) for females.
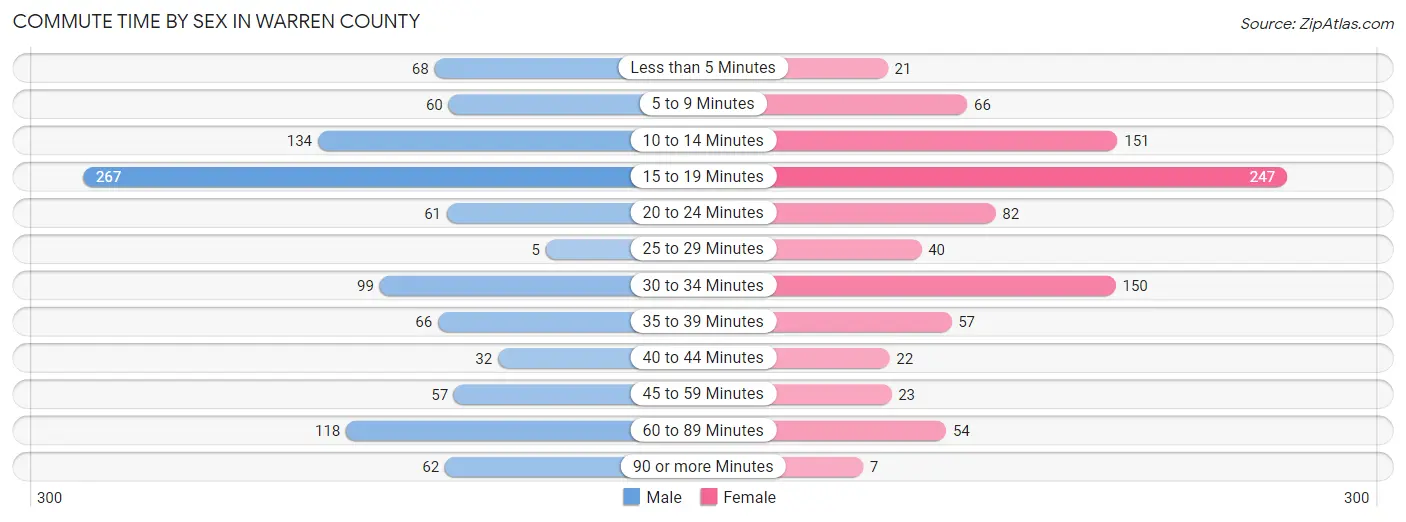
| Commute Time | Male | Female |
| Less than 5 Minutes | 68 (6.6%) | 21 (2.3%) |
| 5 to 9 Minutes | 60 (5.8%) | 66 (7.2%) |
| 10 to 14 Minutes | 134 (13.0%) | 151 (16.4%) |
| 15 to 19 Minutes | 267 (26.0%) | 247 (26.9%) |
| 20 to 24 Minutes | 61 (5.9%) | 82 (8.9%) |
| 25 to 29 Minutes | 5 (0.5%) | 40 (4.3%) |
| 30 to 34 Minutes | 99 (9.6%) | 150 (16.3%) |
| 35 to 39 Minutes | 66 (6.4%) | 57 (6.2%) |
| 40 to 44 Minutes | 32 (3.1%) | 22 (2.4%) |
| 45 to 59 Minutes | 57 (5.5%) | 23 (2.5%) |
| 60 to 89 Minutes | 118 (11.5%) | 54 (5.9%) |
| 90 or more Minutes | 62 (6.0%) | 7 (0.8%) |
Time of Departure to Work by Sex in Warren County
The most frequent times of departure to work in Warren County are 6:30 AM to 6:59 AM (259, 25.2%) for males and 7:30 AM to 7:59 AM (318, 34.6%) for females.
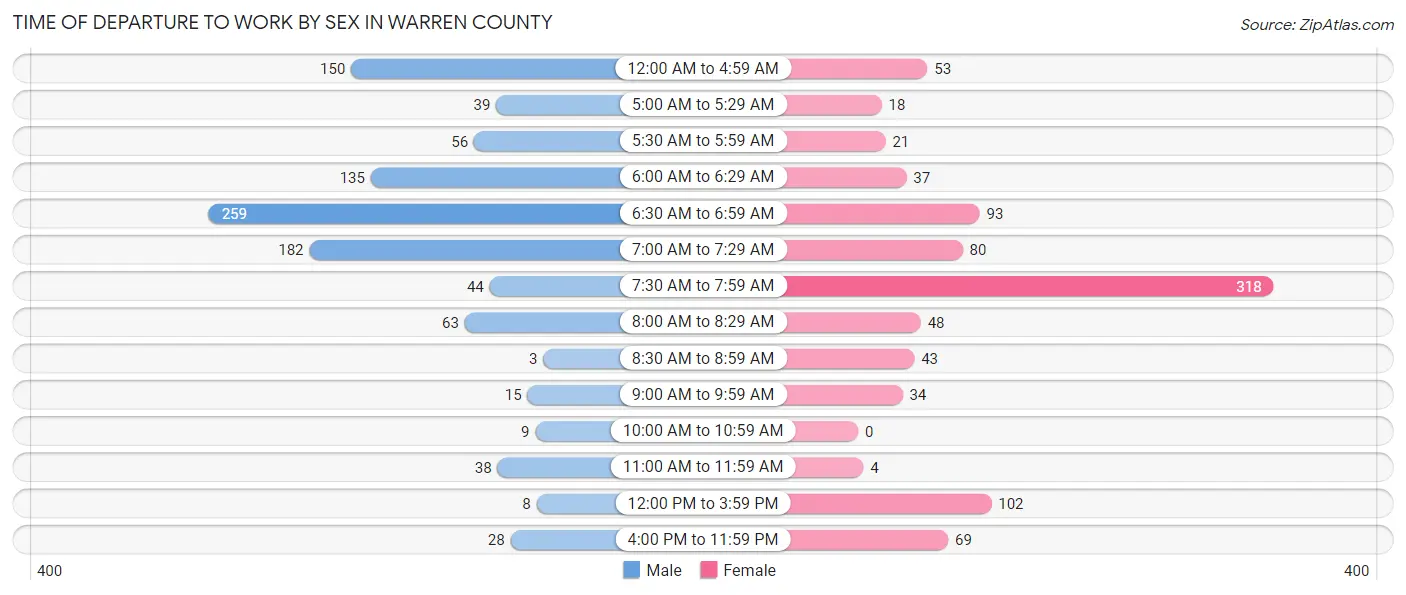
| Time of Departure | Male | Female |
| 12:00 AM to 4:59 AM | 150 (14.6%) | 53 (5.8%) |
| 5:00 AM to 5:29 AM | 39 (3.8%) | 18 (2.0%) |
| 5:30 AM to 5:59 AM | 56 (5.4%) | 21 (2.3%) |
| 6:00 AM to 6:29 AM | 135 (13.1%) | 37 (4.0%) |
| 6:30 AM to 6:59 AM | 259 (25.2%) | 93 (10.1%) |
| 7:00 AM to 7:29 AM | 182 (17.7%) | 80 (8.7%) |
| 7:30 AM to 7:59 AM | 44 (4.3%) | 318 (34.6%) |
| 8:00 AM to 8:29 AM | 63 (6.1%) | 48 (5.2%) |
| 8:30 AM to 8:59 AM | 3 (0.3%) | 43 (4.7%) |
| 9:00 AM to 9:59 AM | 15 (1.5%) | 34 (3.7%) |
| 10:00 AM to 10:59 AM | 9 (0.9%) | 0 (0.0%) |
| 11:00 AM to 11:59 AM | 38 (3.7%) | 4 (0.4%) |
| 12:00 PM to 3:59 PM | 8 (0.8%) | 102 (11.1%) |
| 4:00 PM to 11:59 PM | 28 (2.7%) | 69 (7.5%) |
| Total | 1,029 (100.0%) | 920 (100.0%) |
Housing Occupancy in Warren County
Occupancy by Ownership in Warren County
Of the total 1,945 dwellings in Warren County, owner-occupied units account for 1,393 (71.6%), while renter-occupied units make up 552 (28.4%).
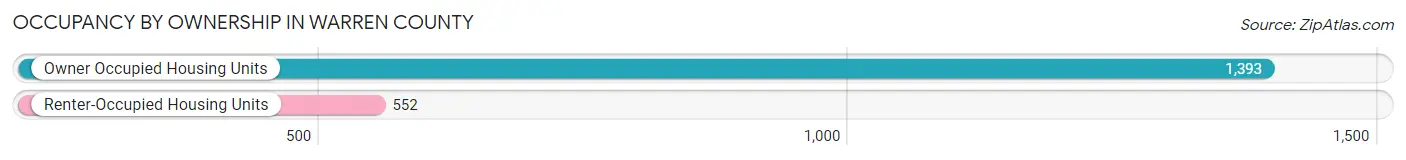
| Occupancy | # Housing Units | % Housing Units |
| Owner Occupied Housing Units | 1,393 | 71.6% |
| Renter-Occupied Housing Units | 552 | 28.4% |
| Total Occupied Housing Units | 1,945 | 100.0% |
Occupancy by Household Size in Warren County

| Household Size | # Housing Units | % Housing Units |
| 1-Person Household | 596 | 30.6% |
| 2-Person Household | 711 | 36.6% |
| 3-Person Household | 385 | 19.8% |
| 4+ Person Household | 253 | 13.0% |
| Total Housing Units | 1,945 | 100.0% |
Occupancy by Ownership by Household Size in Warren County
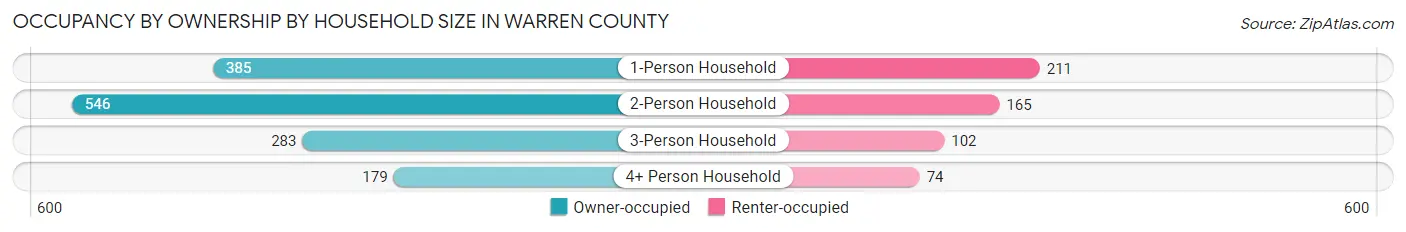
| Household Size | Owner-occupied | Renter-occupied |
| 1-Person Household | 385 (64.6%) | 211 (35.4%) |
| 2-Person Household | 546 (76.8%) | 165 (23.2%) |
| 3-Person Household | 283 (73.5%) | 102 (26.5%) |
| 4+ Person Household | 179 (70.8%) | 74 (29.2%) |
| Total Housing Units | 1,393 (71.6%) | 552 (28.4%) |
Occupancy by Educational Attainment in Warren County
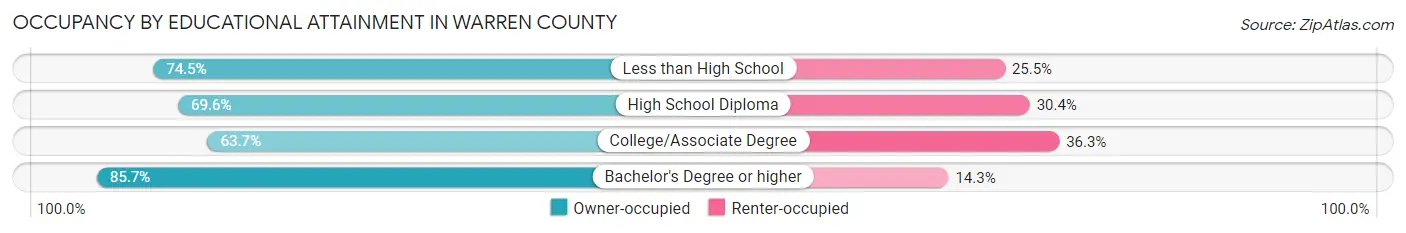
| Household Size | Owner-occupied | Renter-occupied |
| Less than High School | 388 (74.5%) | 133 (25.5%) |
| High School Diploma | 489 (69.6%) | 214 (30.4%) |
| College/Associate Degree | 295 (63.7%) | 168 (36.3%) |
| Bachelor's Degree or higher | 221 (85.7%) | 37 (14.3%) |
Occupancy by Age of Householder in Warren County

| Age Bracket | # Households | % Households |
| Under 35 Years | 187 | 9.6% |
| 35 to 44 Years | 226 | 11.6% |
| 45 to 54 Years | 351 | 18.0% |
| 55 to 64 Years | 452 | 23.2% |
| 65 to 74 Years | 393 | 20.2% |
| 75 to 84 Years | 243 | 12.5% |
| 85 Years and Over | 93 | 4.8% |
| Total | 1,945 | 100.0% |
Housing Finances in Warren County
Median Income by Occupancy in Warren County
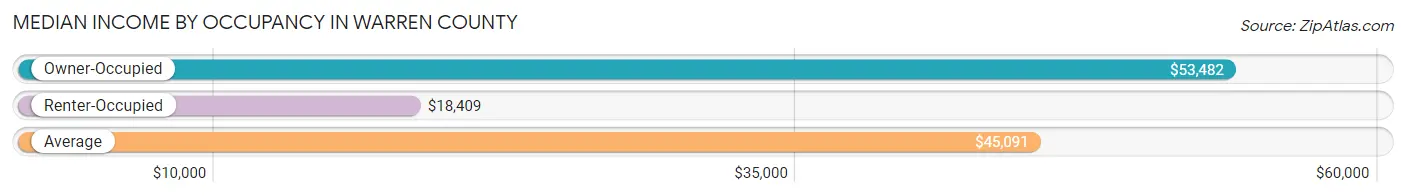
| Occupancy Type | # Households | Median Income |
| Owner-Occupied | 1,393 (71.6%) | $53,482 |
| Renter-Occupied | 552 (28.4%) | $18,409 |
| Average | 1,945 (100.0%) | $45,091 |
Occupancy by Householder Income Bracket in Warren County

| Income Bracket | Owner-occupied | Renter-occupied |
| Less than $5,000 | 2 (0.1%) | 139 (25.2%) |
| $5,000 to $9,999 | 24 (1.7%) | 13 (2.4%) |
| $10,000 to $14,999 | 66 (4.7%) | 109 (19.8%) |
| $15,000 to $19,999 | 63 (4.5%) | 22 (4.0%) |
| $20,000 to $24,999 | 26 (1.9%) | 15 (2.7%) |
| $25,000 to $34,999 | 263 (18.9%) | 40 (7.2%) |
| $35,000 to $49,999 | 221 (15.9%) | 115 (20.8%) |
| $50,000 to $74,999 | 337 (24.2%) | 56 (10.1%) |
| $75,000 to $99,999 | 114 (8.2%) | 27 (4.9%) |
| $100,000 to $149,999 | 189 (13.6%) | 16 (2.9%) |
| $150,000 or more | 88 (6.3%) | 0 (0.0%) |
| Total | 1,393 (100.0%) | 552 (100.0%) |
Monthly Housing Cost Tiers in Warren County
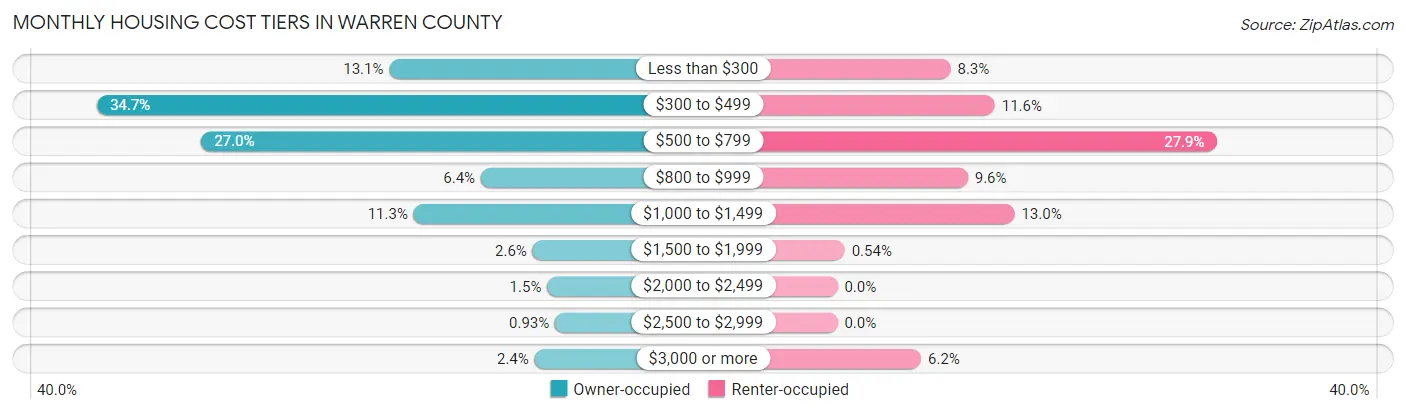
| Monthly Cost | Owner-occupied | Renter-occupied |
| Less than $300 | 183 (13.1%) | 46 (8.3%) |
| $300 to $499 | 483 (34.7%) | 64 (11.6%) |
| $500 to $799 | 376 (27.0%) | 154 (27.9%) |
| $800 to $999 | 89 (6.4%) | 53 (9.6%) |
| $1,000 to $1,499 | 158 (11.3%) | 72 (13.0%) |
| $1,500 to $1,999 | 36 (2.6%) | 3 (0.5%) |
| $2,000 to $2,499 | 21 (1.5%) | 0 (0.0%) |
| $2,500 to $2,999 | 13 (0.9%) | 0 (0.0%) |
| $3,000 or more | 34 (2.4%) | 34 (6.2%) |
| Total | 1,393 (100.0%) | 552 (100.0%) |
Physical Housing Characteristics in Warren County
Housing Structures in Warren County
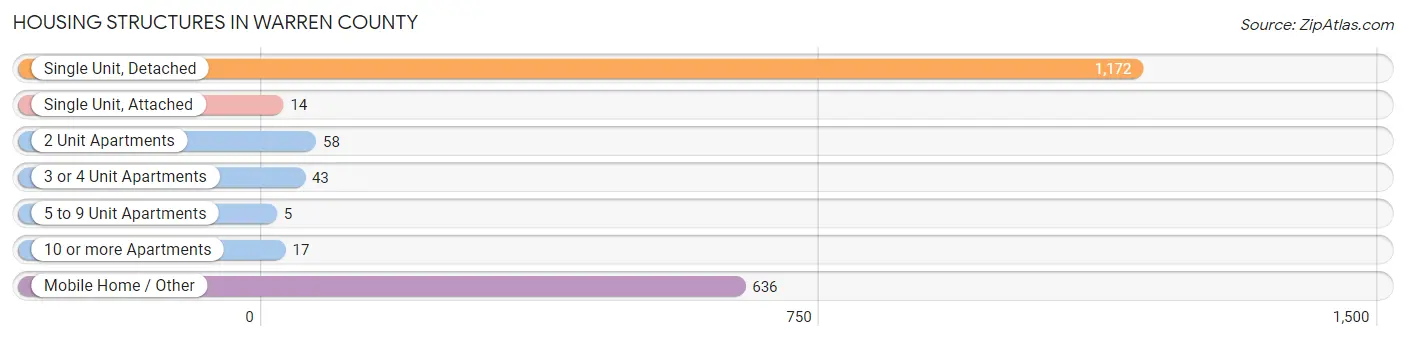
| Structure Type | # Housing Units | % Housing Units |
| Single Unit, Detached | 1,172 | 60.3% |
| Single Unit, Attached | 14 | 0.7% |
| 2 Unit Apartments | 58 | 3.0% |
| 3 or 4 Unit Apartments | 43 | 2.2% |
| 5 to 9 Unit Apartments | 5 | 0.3% |
| 10 or more Apartments | 17 | 0.9% |
| Mobile Home / Other | 636 | 32.7% |
| Total | 1,945 | 100.0% |
Housing Structures by Occupancy in Warren County
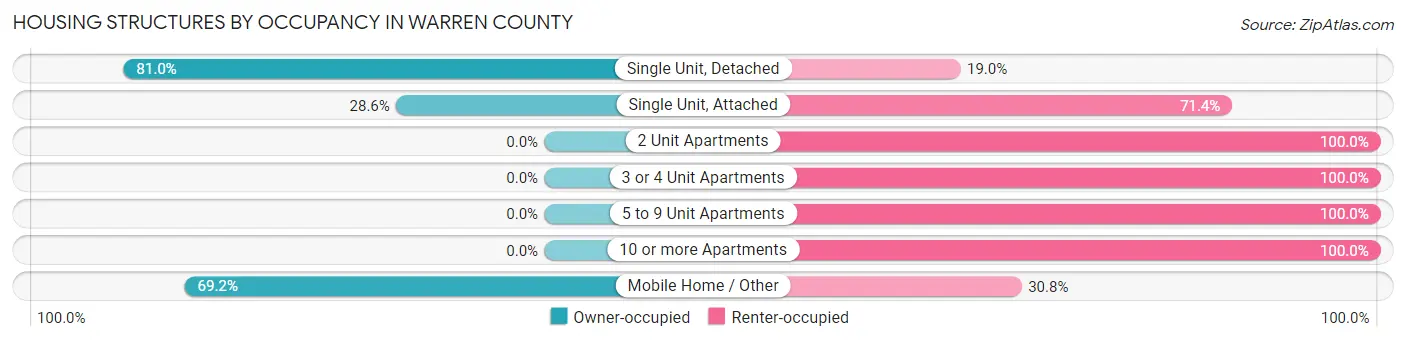
| Structure Type | Owner-occupied | Renter-occupied |
| Single Unit, Detached | 949 (81.0%) | 223 (19.0%) |
| Single Unit, Attached | 4 (28.6%) | 10 (71.4%) |
| 2 Unit Apartments | 0 (0.0%) | 58 (100.0%) |
| 3 or 4 Unit Apartments | 0 (0.0%) | 43 (100.0%) |
| 5 to 9 Unit Apartments | 0 (0.0%) | 5 (100.0%) |
| 10 or more Apartments | 0 (0.0%) | 17 (100.0%) |
| Mobile Home / Other | 440 (69.2%) | 196 (30.8%) |
| Total | 1,393 (71.6%) | 552 (28.4%) |
Housing Structures by Number of Rooms in Warren County
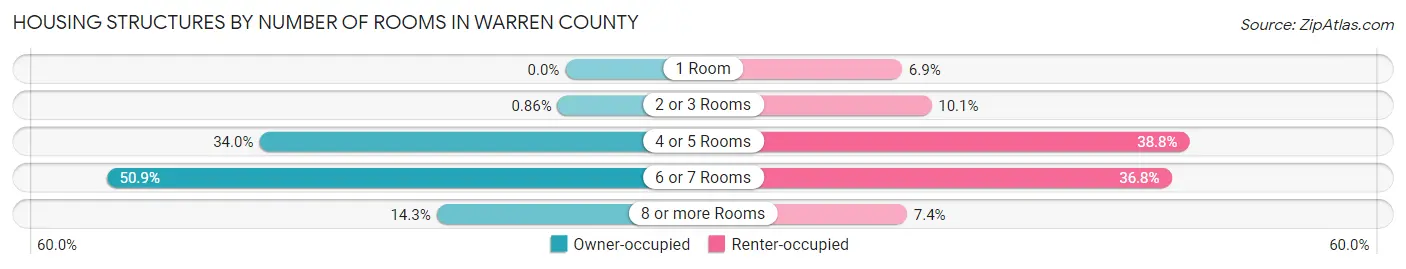
| Number of Rooms | Owner-occupied | Renter-occupied |
| 1 Room | 0 (0.0%) | 38 (6.9%) |
| 2 or 3 Rooms | 12 (0.9%) | 56 (10.1%) |
| 4 or 5 Rooms | 473 (34.0%) | 214 (38.8%) |
| 6 or 7 Rooms | 709 (50.9%) | 203 (36.8%) |
| 8 or more Rooms | 199 (14.3%) | 41 (7.4%) |
| Total | 1,393 (100.0%) | 552 (100.0%) |
Housing Structure by Heating Type in Warren County
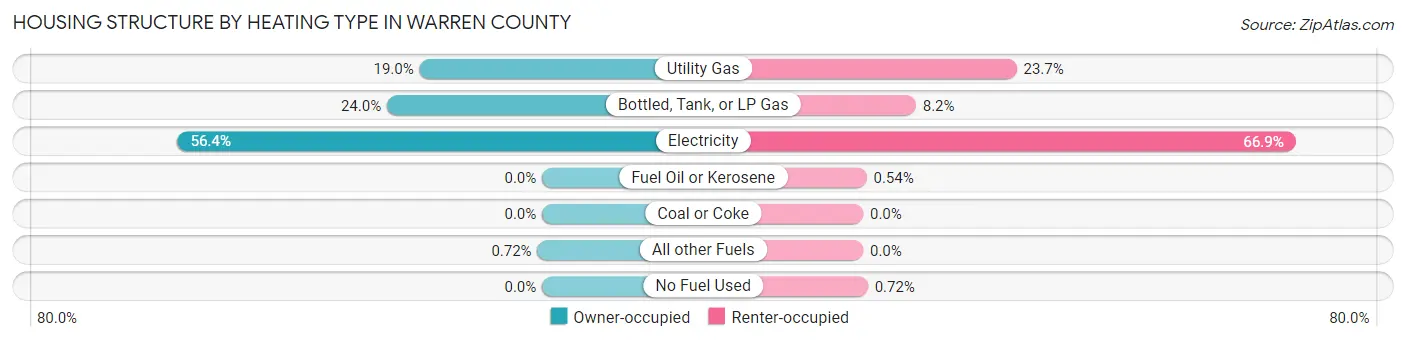
| Heating Type | Owner-occupied | Renter-occupied |
| Utility Gas | 264 (19.0%) | 131 (23.7%) |
| Bottled, Tank, or LP Gas | 334 (24.0%) | 45 (8.2%) |
| Electricity | 785 (56.4%) | 369 (66.8%) |
| Fuel Oil or Kerosene | 0 (0.0%) | 3 (0.5%) |
| Coal or Coke | 0 (0.0%) | 0 (0.0%) |
| All other Fuels | 10 (0.7%) | 0 (0.0%) |
| No Fuel Used | 0 (0.0%) | 4 (0.7%) |
| Total | 1,393 (100.0%) | 552 (100.0%) |
Household Vehicle Usage in Warren County
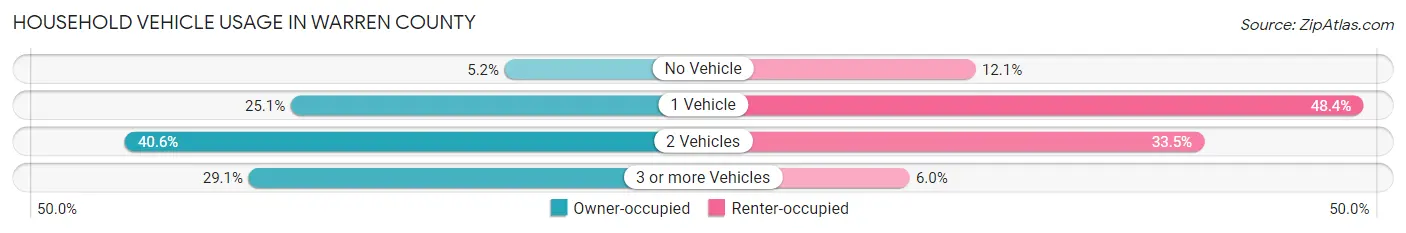
| Vehicles per Household | Owner-occupied | Renter-occupied |
| No Vehicle | 72 (5.2%) | 67 (12.1%) |
| 1 Vehicle | 350 (25.1%) | 267 (48.4%) |
| 2 Vehicles | 566 (40.6%) | 185 (33.5%) |
| 3 or more Vehicles | 405 (29.1%) | 33 (6.0%) |
| Total | 1,393 (100.0%) | 552 (100.0%) |
Real Estate & Mortgages in Warren County
Real Estate and Mortgage Overview in Warren County
| Characteristic | Without Mortgage | With Mortgage |
| Housing Units | 1,034 | 359 |
| Median Property Value | $80,000 | $92,100 |
| Median Household Income | $49,107 | $45 |
| Monthly Housing Costs | $399 | $34 |
| Real Estate Taxes | $739 | $18 |
Property Value by Mortgage Status in Warren County
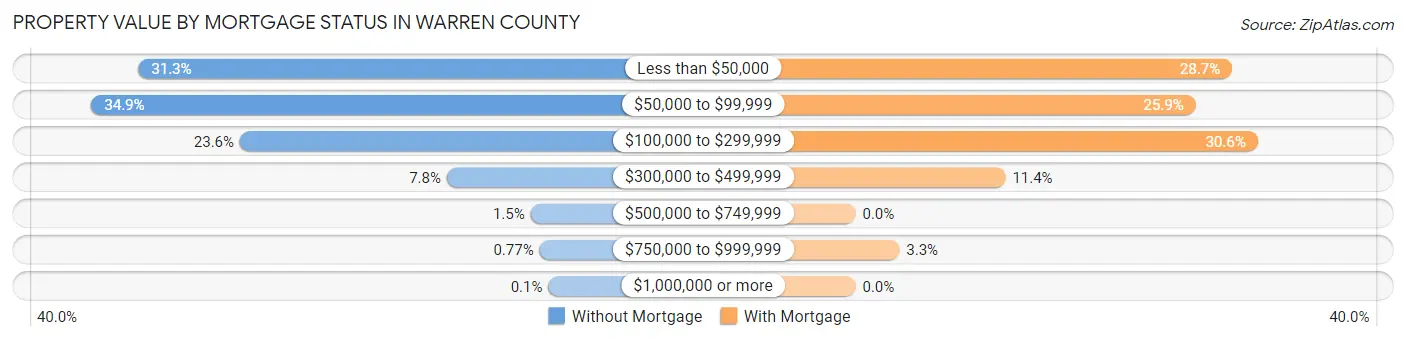
| Property Value | Without Mortgage | With Mortgage |
| Less than $50,000 | 324 (31.3%) | 103 (28.7%) |
| $50,000 to $99,999 | 361 (34.9%) | 93 (25.9%) |
| $100,000 to $299,999 | 244 (23.6%) | 110 (30.6%) |
| $300,000 to $499,999 | 81 (7.8%) | 41 (11.4%) |
| $500,000 to $749,999 | 15 (1.5%) | 0 (0.0%) |
| $750,000 to $999,999 | 8 (0.8%) | 12 (3.3%) |
| $1,000,000 or more | 1 (0.1%) | 0 (0.0%) |
| Total | 1,034 (100.0%) | 359 (100.0%) |
Household Income by Mortgage Status in Warren County
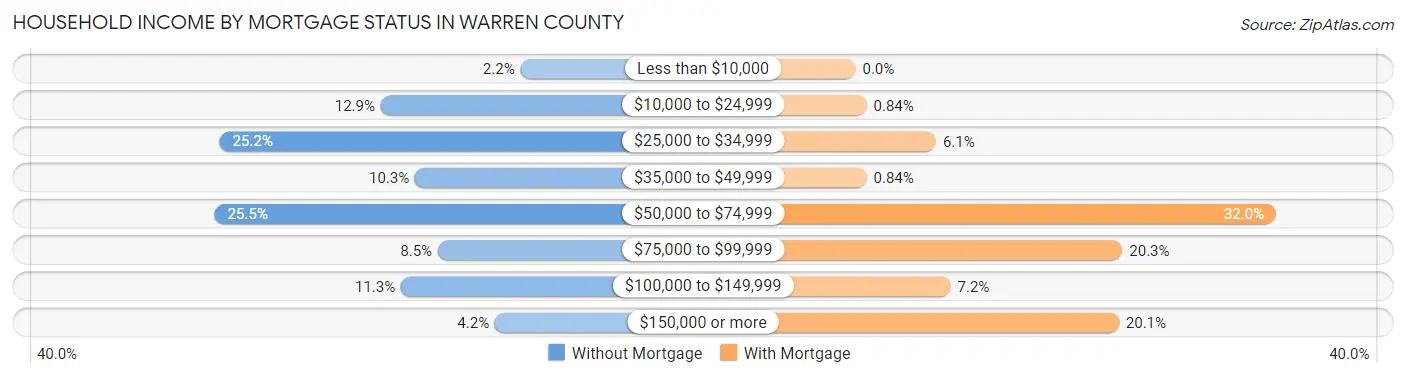
| Household Income | Without Mortgage | With Mortgage |
| Less than $10,000 | 23 (2.2%) | 0 (0.0%) |
| $10,000 to $24,999 | 133 (12.9%) | 3 (0.8%) |
| $25,000 to $34,999 | 260 (25.2%) | 22 (6.1%) |
| $35,000 to $49,999 | 106 (10.2%) | 3 (0.8%) |
| $50,000 to $74,999 | 264 (25.5%) | 115 (32.0%) |
| $75,000 to $99,999 | 88 (8.5%) | 73 (20.3%) |
| $100,000 to $149,999 | 117 (11.3%) | 26 (7.2%) |
| $150,000 or more | 43 (4.2%) | 72 (20.1%) |
| Total | 1,034 (100.0%) | 359 (100.0%) |
Property Value to Household Income Ratio in Warren County

| Value-to-Income Ratio | Without Mortgage | With Mortgage |
| Less than 2.0x | 570 (55.1%) | 59,112 (16,465.7%) |
| 2.0x to 2.9x | 227 (22.0%) | 215 (59.9%) |
| 3.0x to 3.9x | 25 (2.4%) | 73 (20.3%) |
| 4.0x or more | 212 (20.5%) | 14 (3.9%) |
| Total | 1,034 (100.0%) | 359 (100.0%) |
Real Estate Taxes by Mortgage Status in Warren County

| Property Taxes | Without Mortgage | With Mortgage |
| Less than $800 | 489 (47.3%) | 2 (0.6%) |
| $800 to $1,499 | 273 (26.4%) | 140 (39.0%) |
| $800 to $1,499 | 148 (14.3%) | 75 (20.9%) |
| Total | 1,034 (100.0%) | 359 (100.0%) |
Health & Disability in Warren County
Health Insurance Coverage by Age in Warren County
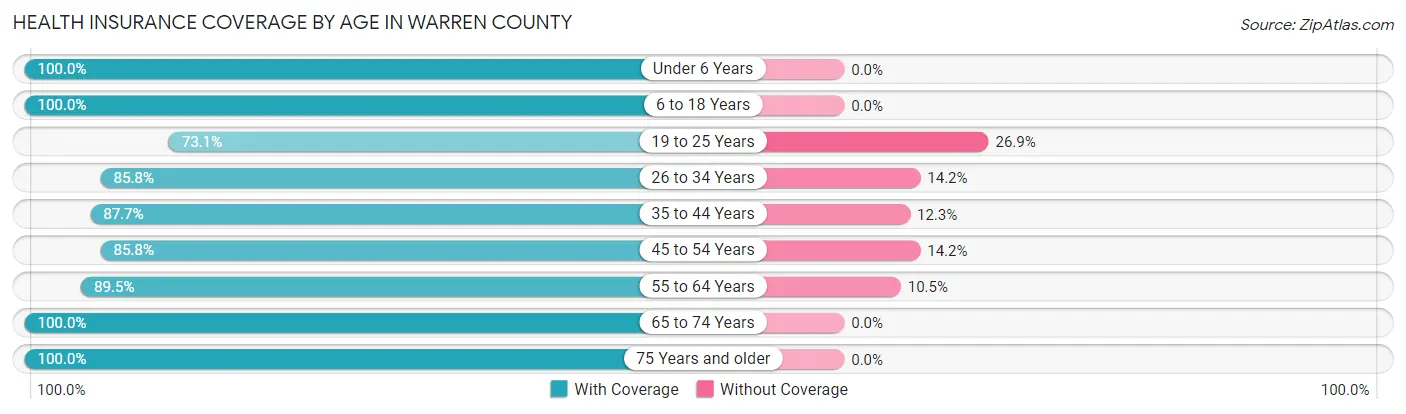
| Age Bracket | With Coverage | Without Coverage |
| Under 6 Years | 319 (100.0%) | 0 (0.0%) |
| 6 to 18 Years | 752 (100.0%) | 0 (0.0%) |
| 19 to 25 Years | 394 (73.1%) | 145 (26.9%) |
| 26 to 34 Years | 339 (85.8%) | 56 (14.2%) |
| 35 to 44 Years | 508 (87.7%) | 71 (12.3%) |
| 45 to 54 Years | 527 (85.8%) | 87 (14.2%) |
| 55 to 64 Years | 714 (89.5%) | 84 (10.5%) |
| 65 to 74 Years | 611 (100.0%) | 0 (0.0%) |
| 75 Years and older | 515 (100.0%) | 0 (0.0%) |
| Total | 4,679 (91.3%) | 443 (8.6%) |
Health Insurance Coverage by Citizenship Status in Warren County

| Citizenship Status | With Coverage | Without Coverage |
| Native Born | 319 (100.0%) | 0 (0.0%) |
| Foreign Born, Citizen | 752 (100.0%) | 0 (0.0%) |
| Foreign Born, not a Citizen | 394 (73.1%) | 145 (26.9%) |
Health Insurance Coverage by Household Income in Warren County
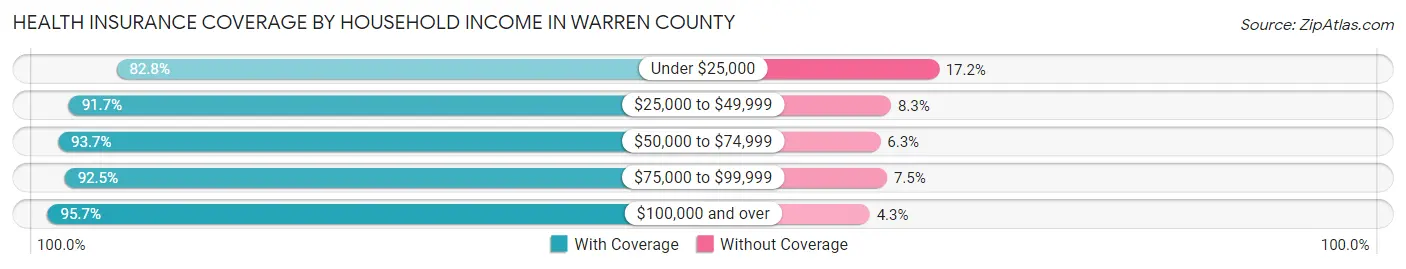
| Household Income | With Coverage | Without Coverage |
| Under $25,000 | 793 (82.8%) | 165 (17.2%) |
| $25,000 to $49,999 | 1,417 (91.7%) | 128 (8.3%) |
| $50,000 to $74,999 | 1,000 (93.7%) | 67 (6.3%) |
| $75,000 to $99,999 | 430 (92.5%) | 35 (7.5%) |
| $100,000 and over | 1,025 (95.7%) | 46 (4.3%) |
Public vs Private Health Insurance Coverage by Age in Warren County
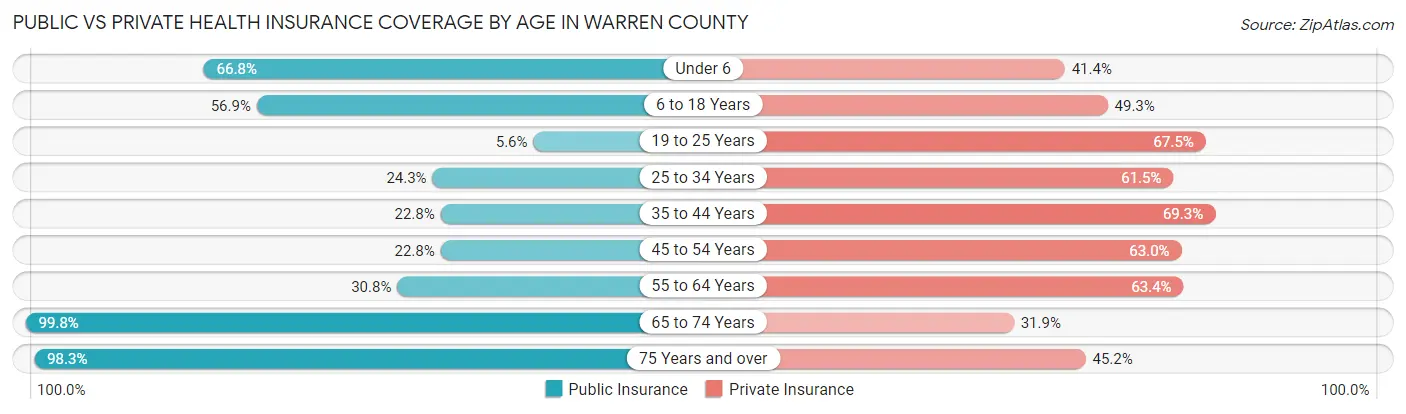
| Age Bracket | Public Insurance | Private Insurance |
| Under 6 | 213 (66.8%) | 132 (41.4%) |
| 6 to 18 Years | 428 (56.9%) | 371 (49.3%) |
| 19 to 25 Years | 30 (5.6%) | 364 (67.5%) |
| 25 to 34 Years | 96 (24.3%) | 243 (61.5%) |
| 35 to 44 Years | 132 (22.8%) | 401 (69.3%) |
| 45 to 54 Years | 140 (22.8%) | 387 (63.0%) |
| 55 to 64 Years | 246 (30.8%) | 506 (63.4%) |
| 65 to 74 Years | 610 (99.8%) | 195 (31.9%) |
| 75 Years and over | 506 (98.3%) | 233 (45.2%) |
| Total | 2,401 (46.9%) | 2,832 (55.3%) |
Disability Status by Sex by Age in Warren County

| Age Bracket | Male | Female |
| Under 5 Years | 0 (0.0%) | 0 (0.0%) |
| 5 to 17 Years | 36 (12.1%) | 9 (1.9%) |
| 18 to 34 Years | 69 (14.2%) | 20 (4.3%) |
| 35 to 64 Years | 137 (14.4%) | 318 (30.5%) |
| 65 to 74 Years | 104 (40.9%) | 63 (17.6%) |
| 75 Years and over | 76 (31.9%) | 100 (36.1%) |
Disability Class by Sex by Age in Warren County
Disability Class: Hearing Difficulty

| Age Bracket | Male | Female |
| Under 5 Years | 0 (0.0%) | 0 (0.0%) |
| 5 to 17 Years | 0 (0.0%) | 0 (0.0%) |
| 18 to 34 Years | 42 (8.6%) | 0 (0.0%) |
| 35 to 64 Years | 18 (1.9%) | 28 (2.7%) |
| 65 to 74 Years | 20 (7.9%) | 1 (0.3%) |
| 75 Years and over | 53 (22.3%) | 20 (7.2%) |
Disability Class: Vision Difficulty

| Age Bracket | Male | Female |
| Under 5 Years | 0 (0.0%) | 0 (0.0%) |
| 5 to 17 Years | 5 (1.7%) | 9 (1.9%) |
| 18 to 34 Years | 39 (8.0%) | 0 (0.0%) |
| 35 to 64 Years | 9 (0.9%) | 19 (1.8%) |
| 65 to 74 Years | 54 (21.3%) | 10 (2.8%) |
| 75 Years and over | 22 (9.2%) | 2 (0.7%) |
Disability Class: Cognitive Difficulty
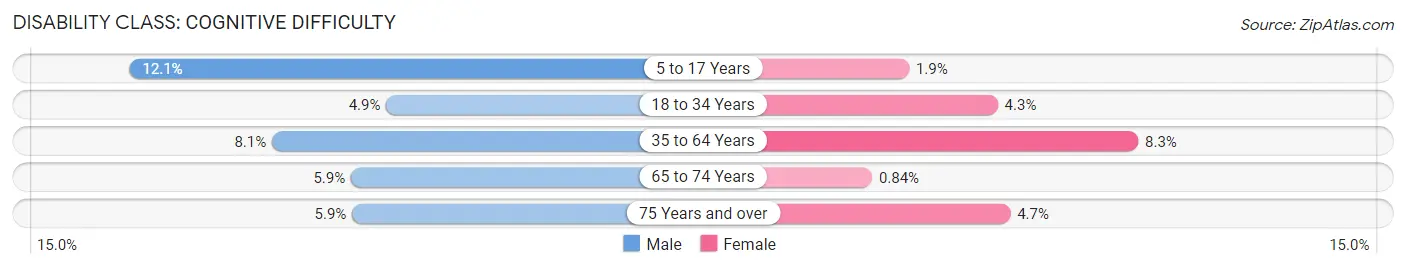
| Age Bracket | Male | Female |
| 5 to 17 Years | 36 (12.1%) | 9 (1.9%) |
| 18 to 34 Years | 24 (4.9%) | 20 (4.3%) |
| 35 to 64 Years | 77 (8.1%) | 86 (8.3%) |
| 65 to 74 Years | 15 (5.9%) | 3 (0.8%) |
| 75 Years and over | 14 (5.9%) | 13 (4.7%) |
Disability Class: Ambulatory Difficulty

| Age Bracket | Male | Female |
| 5 to 17 Years | 0 (0.0%) | 9 (1.9%) |
| 18 to 34 Years | 17 (3.5%) | 0 (0.0%) |
| 35 to 64 Years | 64 (6.7%) | 171 (16.4%) |
| 65 to 74 Years | 96 (37.8%) | 40 (11.2%) |
| 75 Years and over | 62 (26.1%) | 64 (23.1%) |
Disability Class: Self-Care Difficulty
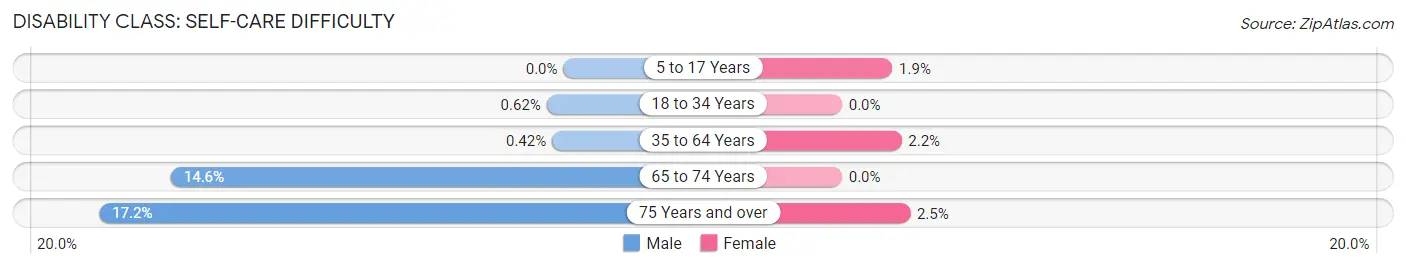
| Age Bracket | Male | Female |
| 5 to 17 Years | 0 (0.0%) | 9 (1.9%) |
| 18 to 34 Years | 3 (0.6%) | 0 (0.0%) |
| 35 to 64 Years | 4 (0.4%) | 23 (2.2%) |
| 65 to 74 Years | 37 (14.6%) | 0 (0.0%) |
| 75 Years and over | 41 (17.2%) | 7 (2.5%) |
Technology Access in Warren County
Computing Device Access in Warren County
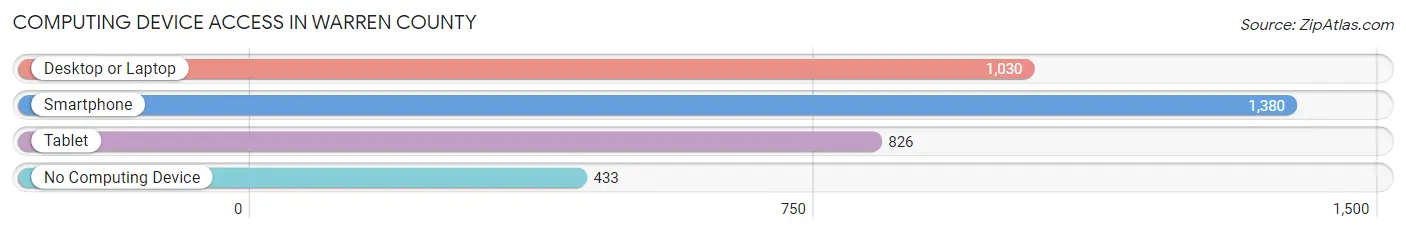
| Device Type | # Households | % Households |
| Desktop or Laptop | 1,030 | 53.0% |
| Smartphone | 1,380 | 71.0% |
| Tablet | 826 | 42.5% |
| No Computing Device | 433 | 22.3% |
| Total | 1,945 | 100.0% |
Internet Access in Warren County
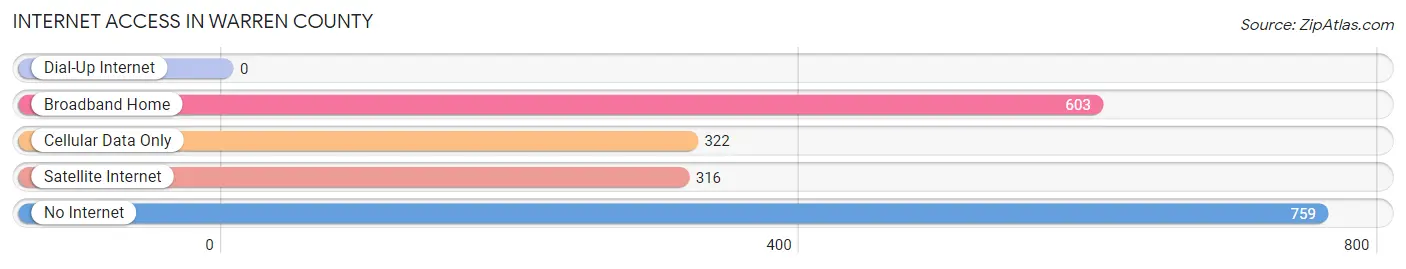
| Internet Type | # Households | % Households |
| Dial-Up Internet | 0 | 0.0% |
| Broadband Home | 603 | 31.0% |
| Cellular Data Only | 322 | 16.6% |
| Satellite Internet | 316 | 16.3% |
| No Internet | 759 | 39.0% |
| Total | 1,945 | 100.0% |
Warren County Summary
Warren County is a county located in the state of Georgia, United States. It is part of the Augusta-Richmond County Metropolitan Statistical Area. As of the 2010 census, the population was 5,834, making it the second-least populous county in Georgia. The county seat is Warrenton.
Geography
Warren County is located in east-central Georgia, approximately 50 miles east of Atlanta. It is bordered by McDuffie County to the north, Glascock County to the east, Jefferson County to the south, and Wilkes County to the west. The county has a total area of 246 square miles, of which 246 square miles is land and 0.2 square miles (0.1%) is water.
The county is located in the Piedmont region of Georgia, with rolling hills and sandy soils. The Ogeechee River forms the western boundary of the county, and the Little River forms the eastern boundary.
History
Warren County was created in 1793 from parts of Wilkes and Richmond counties. It was named for General Joseph Warren, a hero of the American Revolution.
The county was home to several Native American tribes, including the Creek, Cherokee, and Chickasaw. The first European settlers arrived in the late 1700s, and the county was officially organized in 1793.
The county seat of Warrenton was established in 1797. The town was named for General Joseph Warren, a hero of the American Revolution.
In the early 1800s, the county was home to several cotton plantations. The county was also home to several prominent families, including the Telfairs, the Gibsons, and the Hardys.
Economy
The economy of Warren County is largely based on agriculture. The county is home to several large farms, which produce cotton, corn, soybeans, and other crops. The county is also home to several timber companies, which harvest pine and hardwood trees.
The county is home to several small businesses, including restaurants, retail stores, and service providers. The county is also home to several manufacturing companies, which produce a variety of products, including furniture, textiles, and paper products.
Demographics
As of the 2010 census, there were 5,834 people, 2,093 households, and 1,521 families residing in the county. The population density was 24 people per square mile (9/km2). There were 2,521 housing units at an average density of 10 per square mile (4/km2). The racial makeup of the county was 57.2% White, 39.2% Black or African American, 0.3% Native American, 0.3% Asian, 0.1% Pacific Islander, 1.7% from other races, and 1.4% from two or more races. 2.7% of the population were Hispanic or Latino of any race.
The median income for a household in the county was $30,938, and the median income for a family was $37,917. Males had a median income of $30,938 versus $21,917 for females. The per capita income for the county was $14,945. About 17.2% of families and 20.7% of the population were below the poverty line, including 28.2% of those under age 18 and 16.2% of those age 65 or over.
Conclusion
Warren County is a rural county located in east-central Georgia. It is home to several large farms, timber companies, and small businesses. The county has a population of 5,834, with a median household income of $30,938. The county is largely agricultural, with cotton, corn, soybeans, and other crops being produced. The county is also home to several manufacturing companies, which produce a variety of products.
Common Questions
What is the Total Population of Warren County?
Total Population of Warren County is 5,197.
What is the Total Male Population of Warren County?
Total Male Population of Warren County is 2,405.
What is the Total Female Population of Warren County?
Total Female Population of Warren County is 2,792.
What is the Ratio of Males per 100 Females in Warren County?
There are 86.14 Males per 100 Females in Warren County.
What is the Ratio of Females per 100 Males in Warren County?
There are 116.09 Females per 100 Males in Warren County.
What is the Median Population Age in Warren County?
Median Population Age in Warren County is 45.3 Years.
What is the Average Family Size in Warren County
Average Family Size in Warren County is 3.3 People.
What is the Average Household Size in Warren County
Average Household Size in Warren County is 2.6 People.
What is Per Capita Income in Warren County?
Per Capita income in Warren County is $24,249.
What is the Median Family Income in Warren County?
Median Family Income in Warren County is $50,690.
What is the Median Household income in Warren County?
Median Household Income in Warren County is $45,091.
What is Income or Wage Gap in Warren County?
Income or Wage Gap in Warren County is 4.8%.
Women in Warren County earn 95.2 cents for every dollar earned by a man.
What is Inequality or Gini Index in Warren County?
Inequality or Gini Index in Warren County is 0.46.
How Large is the Labor Force in Warren County?
There are 2,222 People in the Labor Forcein in Warren County.
What is the Percentage of People in the Labor Force in Warren County?
52.4% of People are in the Labor Force in Warren County.
What is the Unemployment Rate in Warren County?
Unemployment Rate in Warren County is 9.0%.