Union County, GA
Union County Map
Union County Overview
24,880
TOTAL POPULATION
12,345
MALE POPULATION
12,535
FEMALE POPULATION
98.48
MALES / 100 FEMALES
101.54
FEMALES / 100 MALES
55.9
MEDIAN AGE
2.7
AVG FAMILY SIZE
2.3
AVG HOUSEHOLD SIZE
$37,709
PER CAPITA INCOME
$79,438
AVG FAMILY INCOME
$59,783
AVG HOUSEHOLD INCOME
18.4%
WAGE / INCOME GAP [ % ]
81.6¢/ $1
WAGE / INCOME GAP [ $ ]
0.48
INEQUALITY / GINI INDEX
10,010
LABOR FORCE [ PEOPLE ]
46.3%
PERCENT IN LABOR FORCE
2.7%
UNEMPLOYMENT RATE
Race in Union County
The most populous races in Union County are White / Caucasian (23,257 | 93.5%), Two or more Races (1,008 | 4.1%), and Hispanic or Latino (935 | 3.8%).

| Race | # Population | % Population |
| Asian | 59 | 0.2% |
| Black / African American | 166 | 0.7% |
| Hawaiian / Pacific | 0 | 0.0% |
| Hispanic or Latino | 935 | 3.8% |
| Native / Alaskan | 143 | 0.6% |
| White / Caucasian | 23,257 | 93.5% |
| Two or more Races | 1,008 | 4.1% |
| Some other Race | 247 | 1.0% |
| Total | 24,880 | 100.0% |
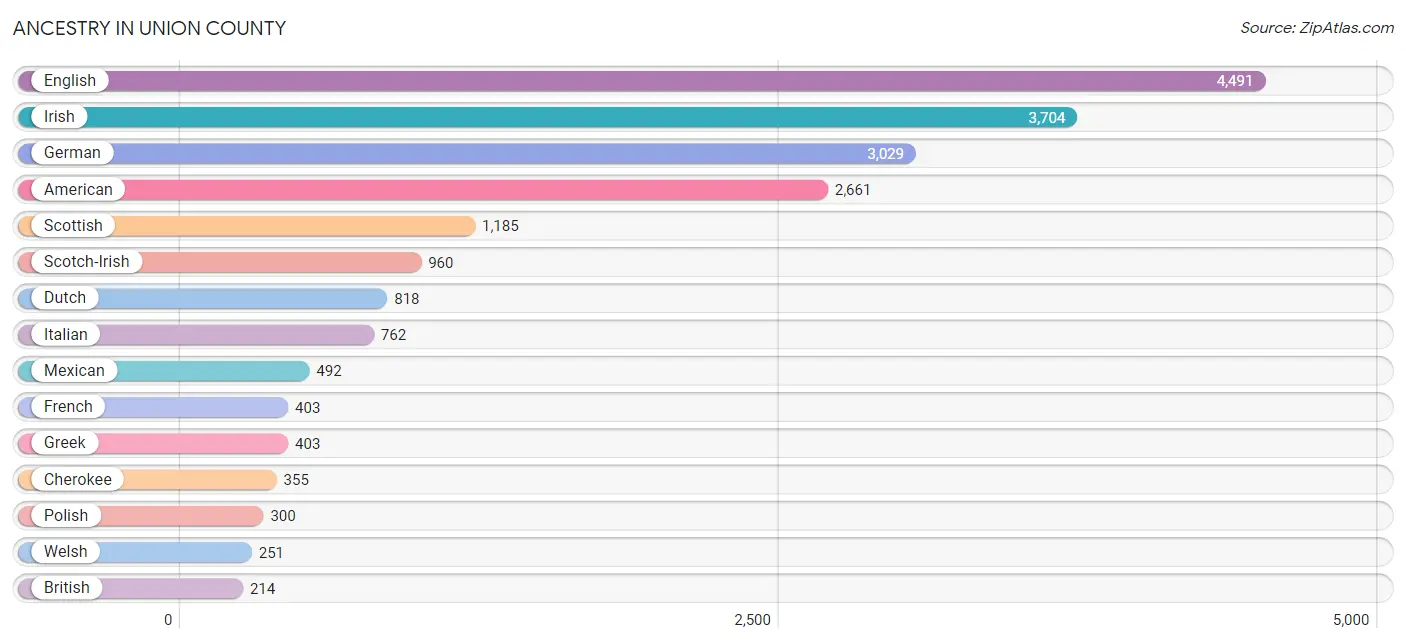
Ancestry in Union County
The most populous ancestries reported in Union County are English (4,491 | 18.0%), Irish (3,704 | 14.9%), German (3,029 | 12.2%), American (2,661 | 10.7%), and Scottish (1,185 | 4.8%), together accounting for 60.6% of all Union County residents.
| Ancestry | # Population | % Population |
| American | 2,661 | 10.7% |
| Arab | 54 | 0.2% |
| Austrian | 65 | 0.3% |
| Belgian | 58 | 0.2% |
| Bhutanese | 26 | 0.1% |
| British | 214 | 0.9% |
| Canadian | 53 | 0.2% |
| Central American | 134 | 0.5% |
| Central American Indian | 77 | 0.3% |
| Cherokee | 355 | 1.4% |
| Creek | 26 | 0.1% |
| Croatian | 36 | 0.1% |
| Cuban | 91 | 0.4% |
| Czech | 143 | 0.6% |
| Czechoslovakian | 7 | 0.0% |
| Danish | 94 | 0.4% |
| Dutch | 818 | 3.3% |
| Eastern European | 26 | 0.1% |
| English | 4,491 | 18.0% |
| European | 208 | 0.8% |
| Finnish | 17 | 0.1% |
| French | 403 | 1.6% |
| French American Indian | 7 | 0.0% |
| French Canadian | 56 | 0.2% |
| German | 3,029 | 12.2% |
| Greek | 403 | 1.6% |
| Guatemalan | 93 | 0.4% |
| Hungarian | 27 | 0.1% |
| Indian (Asian) | 35 | 0.1% |
| Irish | 3,704 | 14.9% |
| Italian | 762 | 3.1% |
| Korean | 79 | 0.3% |
| Lebanese | 24 | 0.1% |
| Lithuanian | 37 | 0.2% |
| Luxembourger | 14 | 0.1% |
| Mexican | 492 | 2.0% |
| Moroccan | 21 | 0.1% |
| Native Hawaiian | 37 | 0.2% |
| Navajo | 19 | 0.1% |
| Northern European | 39 | 0.2% |
| Norwegian | 187 | 0.7% |
| Pennsylvania German | 69 | 0.3% |
| Polish | 300 | 1.2% |
| Portuguese | 64 | 0.3% |
| Puerto Rican | 195 | 0.8% |
| Romanian | 18 | 0.1% |
| Russian | 113 | 0.4% |
| Salvadoran | 41 | 0.2% |
| Scandinavian | 113 | 0.4% |
| Scotch-Irish | 960 | 3.9% |
| Scottish | 1,185 | 4.8% |
| Serbian | 6 | 0.0% |
| Slovak | 45 | 0.2% |
| Slovene | 17 | 0.1% |
| Spaniard | 9 | 0.0% |
| Swedish | 114 | 0.5% |
| Swiss | 77 | 0.3% |
| Syrian | 9 | 0.0% |
| Thai | 37 | 0.2% |
| Ukrainian | 60 | 0.2% |
| Welsh | 251 | 1.0% |
| Yugoslavian | 30 | 0.1% | View All 62 Rows |
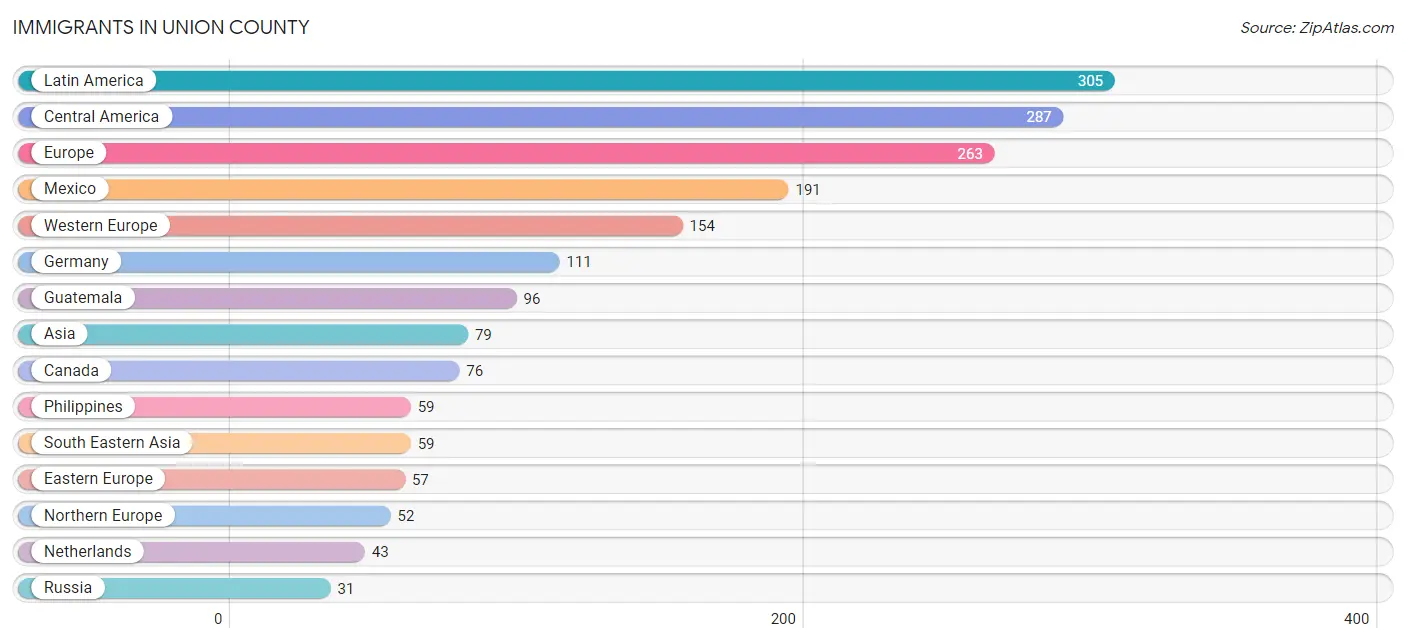
Immigrants in Union County
The most numerous immigrant groups reported in Union County came from Latin America (305 | 1.2%), Central America (287 | 1.1%), Europe (263 | 1.1%), Mexico (191 | 0.8%), and Western Europe (154 | 0.6%), together accounting for 4.8% of all Union County residents.
| Immigration Origin | # Population | % Population |
| Asia | 79 | 0.3% |
| Canada | 76 | 0.3% |
| Caribbean | 18 | 0.1% |
| Central America | 287 | 1.1% |
| Cuba | 18 | 0.1% |
| Eastern Europe | 57 | 0.2% |
| England | 29 | 0.1% |
| Europe | 263 | 1.1% |
| Germany | 111 | 0.4% |
| Guatemala | 96 | 0.4% |
| Ireland | 15 | 0.1% |
| Latin America | 305 | 1.2% |
| Mexico | 191 | 0.8% |
| Netherlands | 43 | 0.2% |
| Northern Europe | 52 | 0.2% |
| Pakistan | 20 | 0.1% |
| Philippines | 59 | 0.2% |
| Poland | 8 | 0.0% |
| Romania | 18 | 0.1% |
| Russia | 31 | 0.1% |
| South Central Asia | 20 | 0.1% |
| South Eastern Asia | 59 | 0.2% |
| Western Europe | 154 | 0.6% | View All 23 Rows |
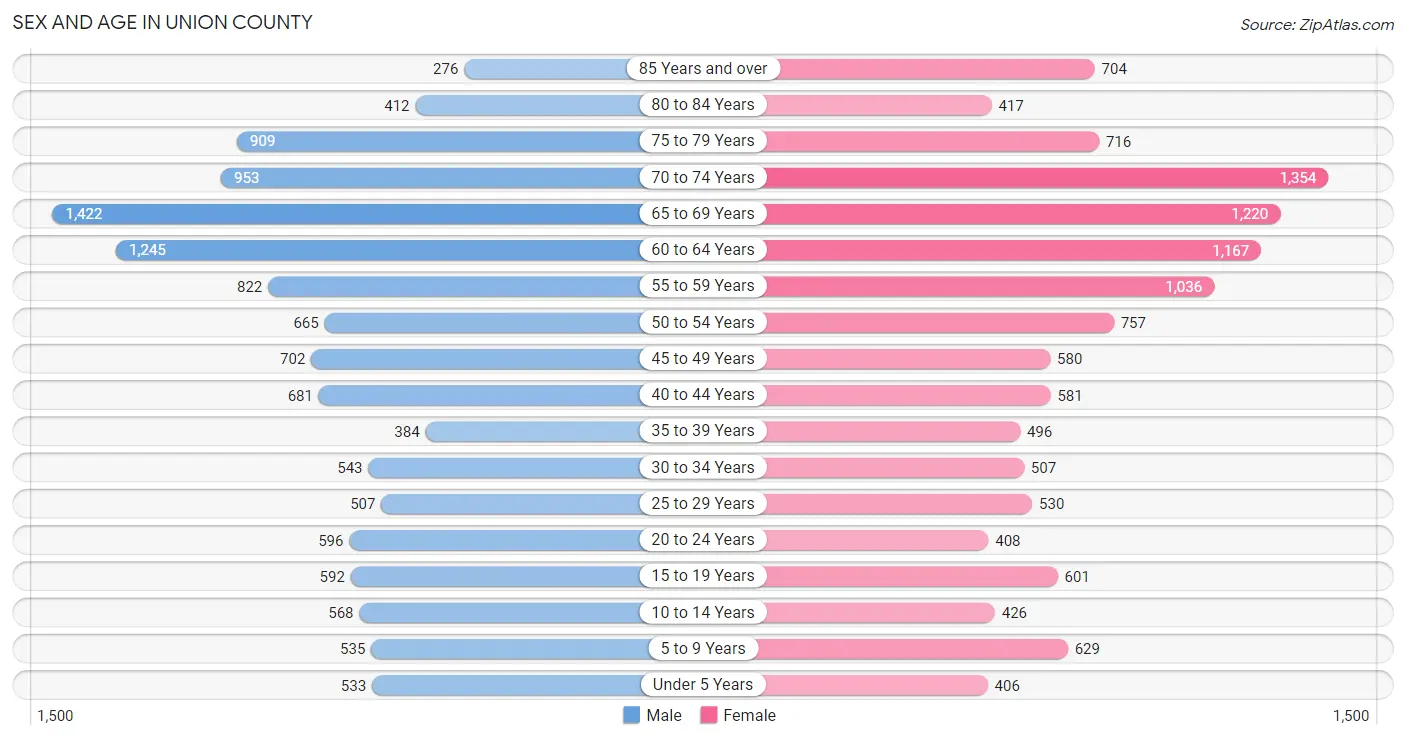
Sex and Age in Union County
Sex and Age in Union County
The most populous age groups in Union County are 65 to 69 Years (1,422 | 11.5%) for men and 70 to 74 Years (1,354 | 10.8%) for women.
| Age Bracket | Male | Female |
| Under 5 Years | 533 (4.3%) | 406 (3.2%) |
| 5 to 9 Years | 535 (4.3%) | 629 (5.0%) |
| 10 to 14 Years | 568 (4.6%) | 426 (3.4%) |
| 15 to 19 Years | 592 (4.8%) | 601 (4.8%) |
| 20 to 24 Years | 596 (4.8%) | 408 (3.3%) |
| 25 to 29 Years | 507 (4.1%) | 530 (4.2%) |
| 30 to 34 Years | 543 (4.4%) | 507 (4.0%) |
| 35 to 39 Years | 384 (3.1%) | 496 (4.0%) |
| 40 to 44 Years | 681 (5.5%) | 581 (4.6%) |
| 45 to 49 Years | 702 (5.7%) | 580 (4.6%) |
| 50 to 54 Years | 665 (5.4%) | 757 (6.0%) |
| 55 to 59 Years | 822 (6.7%) | 1,036 (8.3%) |
| 60 to 64 Years | 1,245 (10.1%) | 1,167 (9.3%) |
| 65 to 69 Years | 1,422 (11.5%) | 1,220 (9.7%) |
| 70 to 74 Years | 953 (7.7%) | 1,354 (10.8%) |
| 75 to 79 Years | 909 (7.4%) | 716 (5.7%) |
| 80 to 84 Years | 412 (3.3%) | 417 (3.3%) |
| 85 Years and over | 276 (2.2%) | 704 (5.6%) |
| Total | 12,345 (100.0%) | 12,535 (100.0%) |
Families and Households in Union County
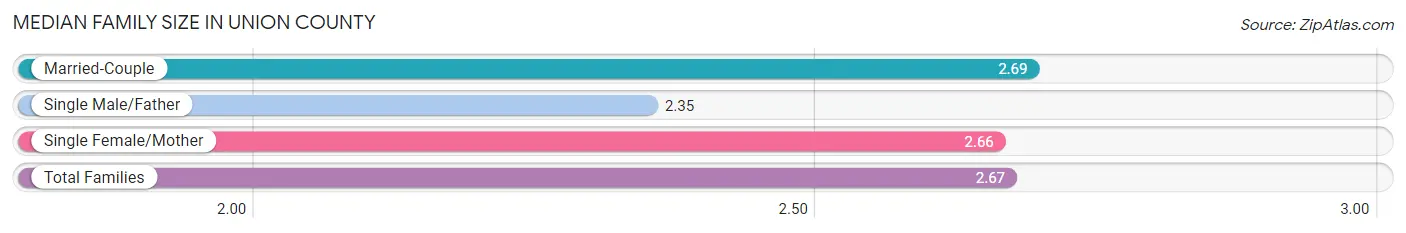
Median Family Size in Union County
The median family size in Union County is 2.67 persons per family, with married-couple families (6,358 | 86.3%) accounting for the largest median family size of 2.69 persons per family. On the other hand, single male/father families (435 | 5.9%) represent the smallest median family size with 2.35 persons per family.
| Family Type | # Families | Family Size |
| Married-Couple | 6,358 (86.3%) | 2.69 |
| Single Male/Father | 435 (5.9%) | 2.35 |
| Single Female/Mother | 572 (7.8%) | 2.66 |
| Total Families | 7,365 (100.0%) | 2.67 |
Median Household Size in Union County
The median household size in Union County is 2.26 persons per household, with single male/father households (435 | 4.0%) accounting for the largest median household size of 3.2 persons per household. non-family households (3,394 | 31.6%) represent the smallest median household size with 1.13 persons per household.

| Household Type | # Households | Household Size |
| Married-Couple | 6,358 (59.1%) | 2.72 |
| Single Male/Father | 435 (4.0%) | 3.20 |
| Single Female/Mother | 572 (5.3%) | 3.04 |
| Non-family | 3,394 (31.6%) | 1.13 |
| Total Households | 10,759 (100.0%) | 2.26 |
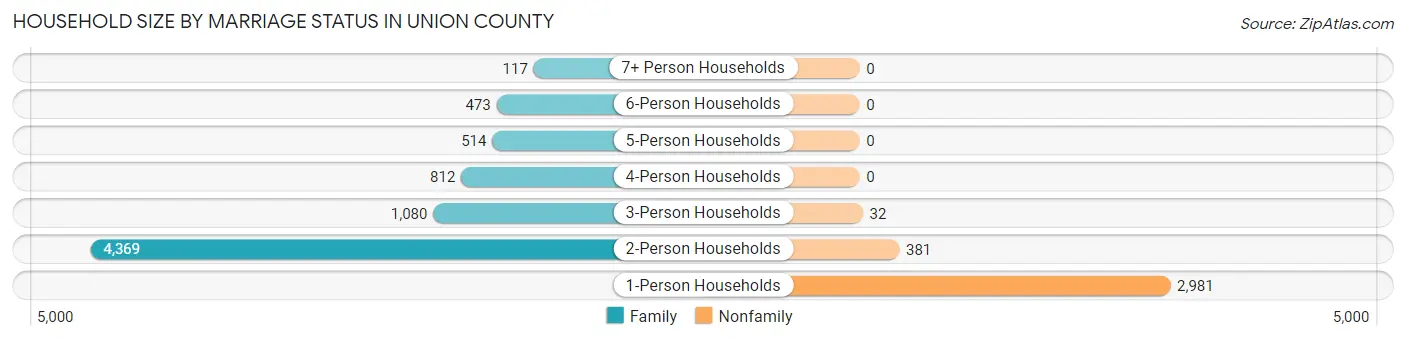
Household Size by Marriage Status in Union County
Out of a total of 10,759 households in Union County, 7,365 (68.4%) are family households, while 3,394 (31.6%) are nonfamily households. The most numerous type of family households are 2-person households, comprising 4,369, and the most common type of nonfamily households are 1-person households, comprising 2,981.
| Household Size | Family Households | Nonfamily Households |
| 1-Person Households | - | 2,981 (27.7%) |
| 2-Person Households | 4,369 (40.6%) | 381 (3.5%) |
| 3-Person Households | 1,080 (10.0%) | 32 (0.3%) |
| 4-Person Households | 812 (7.5%) | 0 (0.0%) |
| 5-Person Households | 514 (4.8%) | 0 (0.0%) |
| 6-Person Households | 473 (4.4%) | 0 (0.0%) |
| 7+ Person Households | 117 (1.1%) | 0 (0.0%) |
| Total | 7,365 (68.4%) | 3,394 (31.6%) |
Female Fertility in Union County
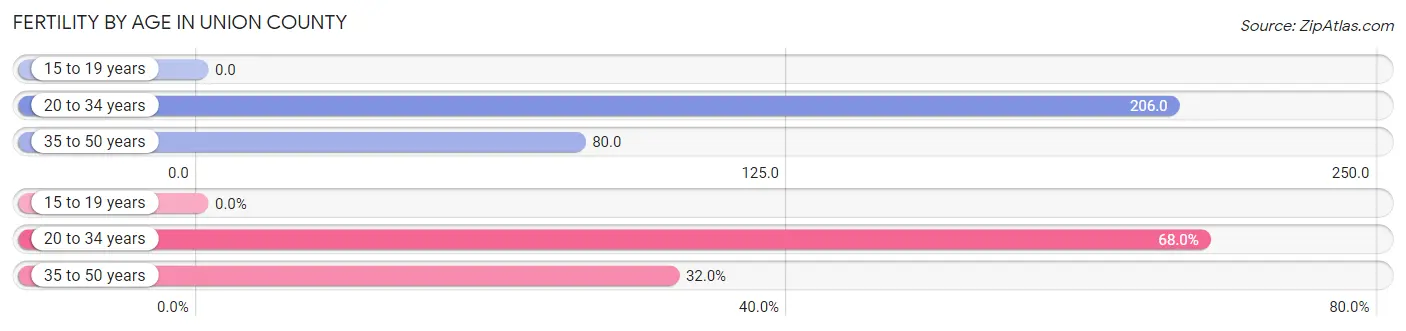
Fertility by Age in Union County
Average fertility rate in Union County is 115.0 births per 1,000 women. Women in the age bracket of 20 to 34 years have the highest fertility rate with 206.0 births per 1,000 women. Women in the age bracket of 20 to 34 years acount for 68.0% of all women with births.
| Age Bracket | Women with Births | Births / 1,000 Women |
| 15 to 19 years | 0 (0.0%) | 0.0 |
| 20 to 34 years | 298 (68.0%) | 206.0 |
| 35 to 50 years | 140 (32.0%) | 80.0 |
| Total | 438 (100.0%) | 115.0 |
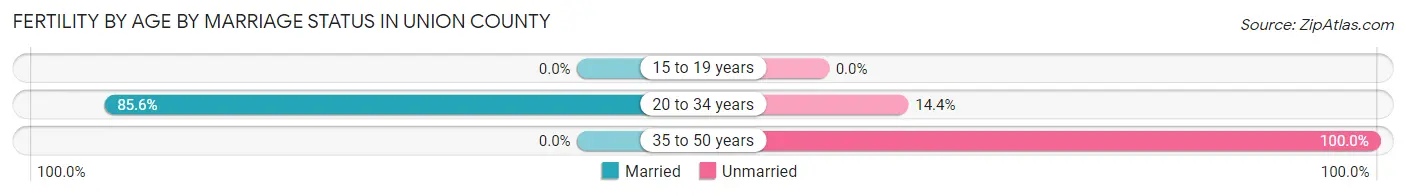
Fertility by Age by Marriage Status in Union County
58.2% of women with births (438) in Union County are married. The highest percentage of unmarried women with births falls into 35 to 50 years age bracket with 100.0% of them unmarried at the time of birth, while the lowest percentage of unmarried women with births belong to 20 to 34 years age bracket with 14.4% of them unmarried.
| Age Bracket | Married | Unmarried |
| 15 to 19 years | 0 (0.0%) | 0 (0.0%) |
| 20 to 34 years | 255 (85.6%) | 43 (14.4%) |
| 35 to 50 years | 0 (0.0%) | 140 (100.0%) |
| Total | 255 (58.2%) | 183 (41.8%) |
Fertility by Education in Union County
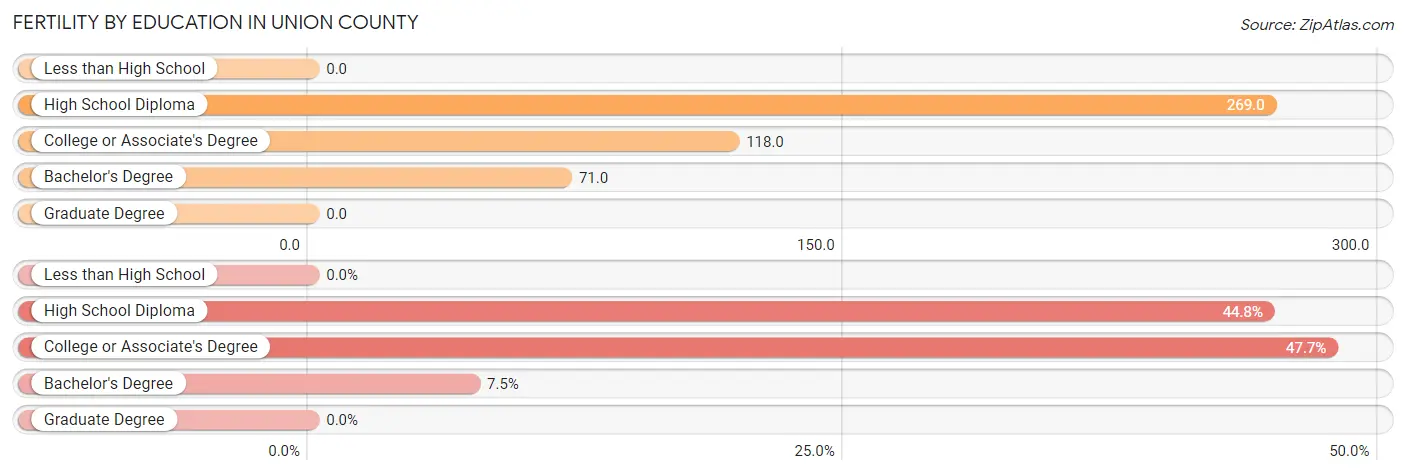
| Educational Attainment | Women with Births | Births / 1,000 Women |
| Less than High School | 0 (0.0%) | 0.0 |
| High School Diploma | 196 (44.8%) | 269.0 |
| College or Associate's Degree | 209 (47.7%) | 118.0 |
| Bachelor's Degree | 33 (7.5%) | 71.0 |
| Graduate Degree | 0 (0.0%) | 0.0 |
| Total | 438 (100.0%) | 115.0 |
Fertility by Education by Marriage Status in Union County
41.8% of women with births in Union County are unmarried. Women with the educational attainment of bachelor's degree are most likely to be married with 100.0% of them married at childbirth, while women with the educational attainment of high school diploma are least likely to be married with 80.6% of them unmarried at childbirth.
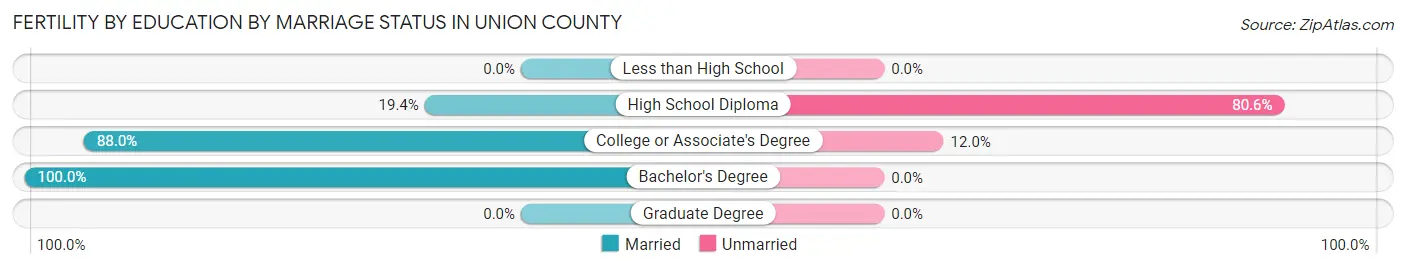
| Educational Attainment | Married | Unmarried |
| Less than High School | 0 (0.0%) | 0 (0.0%) |
| High School Diploma | 38 (19.4%) | 158 (80.6%) |
| College or Associate's Degree | 184 (88.0%) | 25 (12.0%) |
| Bachelor's Degree | 33 (100.0%) | 0 (0.0%) |
| Graduate Degree | 0 (0.0%) | 0 (0.0%) |
| Total | 255 (58.2%) | 183 (41.8%) |
Income in Union County
Income Overview in Union County
Per Capita Income in Union County is $37,709, while median incomes of families and households are $79,438 and $59,783 respectively.
| Characteristic | Number | Measure |
| Per Capita Income | 24,880 | $37,709 |
| Median Family Income | 7,365 | $79,438 |
| Mean Family Income | 7,365 | $105,438 |
| Median Household Income | 10,759 | $59,783 |
| Mean Household Income | 10,759 | $87,591 |
| Income Deficit | 7,365 | $0 |
| Wage / Income Gap (%) | 24,880 | 18.41% |
| Wage / Income Gap ($) | 24,880 | 81.59¢ per $1 |
| Gini / Inequality Index | 24,880 | 0.48 |
Earnings by Sex in Union County
Average Earnings in Union County are $33,305, $36,412 for men and $29,708 for women, a difference of 18.4%.

| Sex | Number | Average Earnings |
| Male | 6,073 (54.8%) | $36,412 |
| Female | 5,004 (45.2%) | $29,708 |
| Total | 11,077 (100.0%) | $33,305 |
Earnings by Sex by Income Bracket in Union County
The most common earnings brackets in Union County are $100,000+ for men (804 | 13.2%) and $25,000 to $29,999 for women (436 | 8.7%).
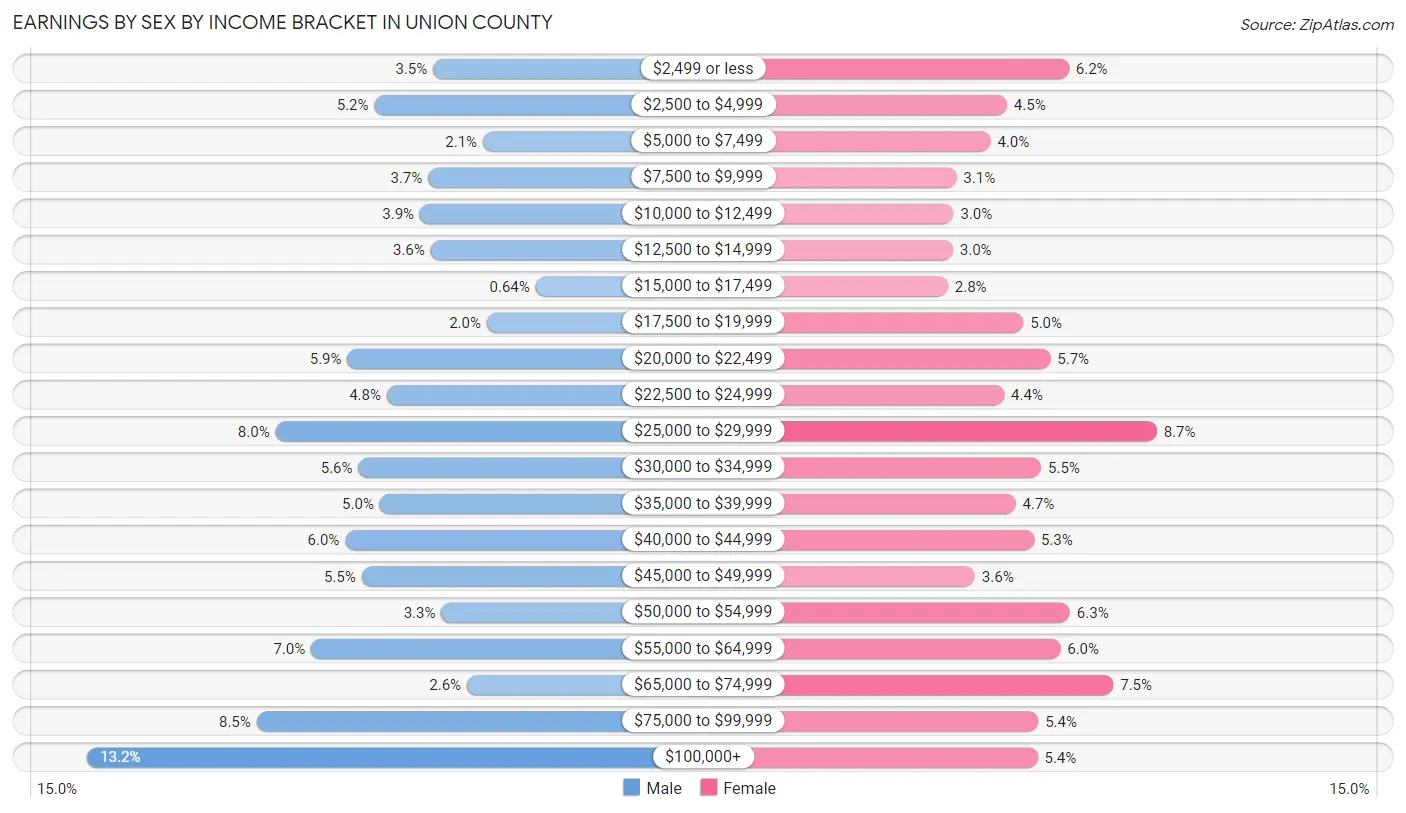
| Income | Male | Female |
| $2,499 or less | 214 (3.5%) | 312 (6.2%) |
| $2,500 to $4,999 | 314 (5.2%) | 225 (4.5%) |
| $5,000 to $7,499 | 129 (2.1%) | 202 (4.0%) |
| $7,500 to $9,999 | 222 (3.7%) | 154 (3.1%) |
| $10,000 to $12,499 | 236 (3.9%) | 150 (3.0%) |
| $12,500 to $14,999 | 218 (3.6%) | 149 (3.0%) |
| $15,000 to $17,499 | 39 (0.6%) | 142 (2.8%) |
| $17,500 to $19,999 | 122 (2.0%) | 248 (5.0%) |
| $20,000 to $22,499 | 360 (5.9%) | 286 (5.7%) |
| $22,500 to $24,999 | 293 (4.8%) | 221 (4.4%) |
| $25,000 to $29,999 | 483 (8.0%) | 436 (8.7%) |
| $30,000 to $34,999 | 341 (5.6%) | 273 (5.5%) |
| $35,000 to $39,999 | 305 (5.0%) | 237 (4.7%) |
| $40,000 to $44,999 | 364 (6.0%) | 263 (5.3%) |
| $45,000 to $49,999 | 336 (5.5%) | 180 (3.6%) |
| $50,000 to $54,999 | 200 (3.3%) | 314 (6.3%) |
| $55,000 to $64,999 | 422 (7.0%) | 300 (6.0%) |
| $65,000 to $74,999 | 156 (2.6%) | 375 (7.5%) |
| $75,000 to $99,999 | 515 (8.5%) | 269 (5.4%) |
| $100,000+ | 804 (13.2%) | 268 (5.4%) |
| Total | 6,073 (100.0%) | 5,004 (100.0%) |
Earnings by Sex by Educational Attainment in Union County
Average earnings in Union County are $40,863 for men and $33,848 for women, a difference of 17.2%. Men with an educational attainment of graduate degree enjoy the highest average annual earnings of $66,406, while those with high school diploma education earn the least with $34,334. Women with an educational attainment of bachelor's degree earn the most with the average annual earnings of $56,811, while those with less than high school education have the smallest earnings of $23,529.

| Educational Attainment | Male Income | Female Income |
| Less than High School | $49,856 | $23,529 |
| High School Diploma | $34,334 | $25,789 |
| College or Associate's Degree | $37,351 | $29,304 |
| Bachelor's Degree | $60,556 | $56,811 |
| Graduate Degree | $66,406 | $55,714 |
| Total | $40,863 | $33,848 |
Family Income in Union County
Family Income Brackets in Union County
According to the Union County family income data, there are 1,466 families falling into the $50,000 to $74,999 income range, which is the most common income bracket and makes up 19.9% of all families. Conversely, the $10,000 to $14,999 income bracket is the least frequent group with only 88 families (1.2%) belonging to this category.
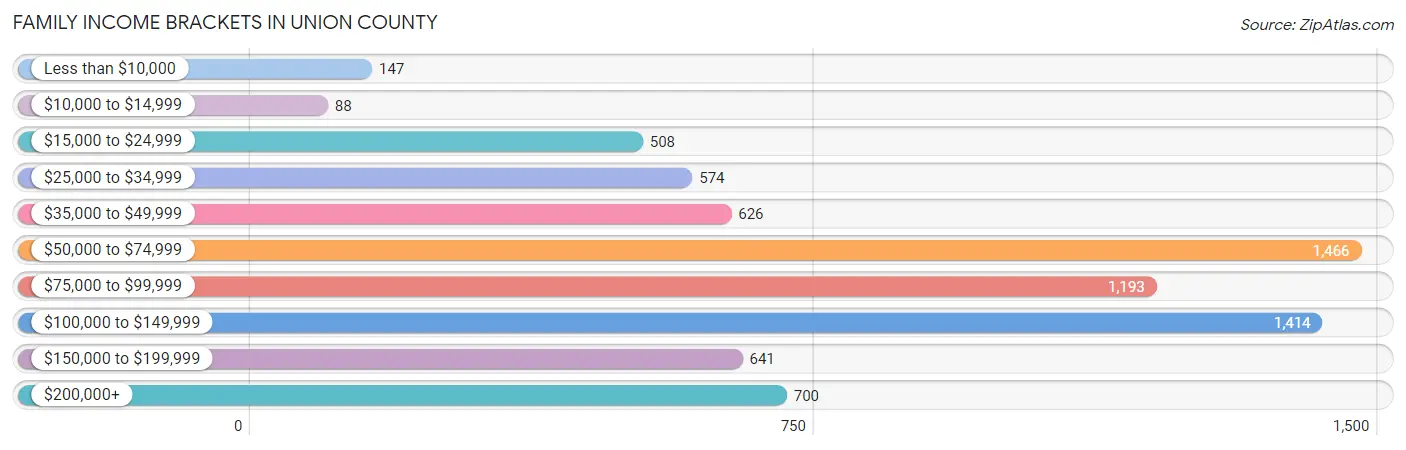
| Income Bracket | # Families | % Families |
| Less than $10,000 | 147 | 2.0% |
| $10,000 to $14,999 | 88 | 1.2% |
| $15,000 to $24,999 | 508 | 6.9% |
| $25,000 to $34,999 | 574 | 7.8% |
| $35,000 to $49,999 | 626 | 8.5% |
| $50,000 to $74,999 | 1,466 | 19.9% |
| $75,000 to $99,999 | 1,193 | 16.2% |
| $100,000 to $149,999 | 1,414 | 19.2% |
| $150,000 to $199,999 | 641 | 8.7% |
| $200,000+ | 700 | 9.5% |
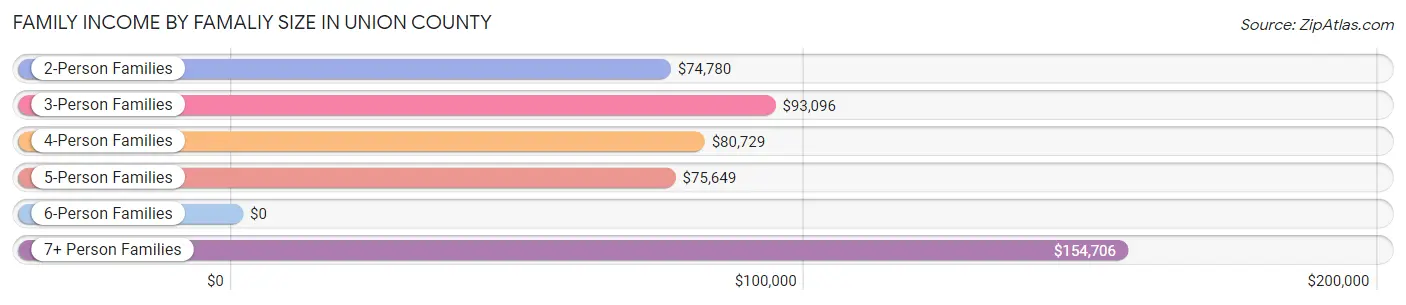
Family Income by Famaliy Size in Union County
7+ person families (80 | 1.1%) account for the highest median family income in Union County with $154,706 per family, while 2-person families (4,482 | 60.9%) have the highest median income of $37,390 per family member.
| Income Bracket | # Families | Median Income |
| 2-Person Families | 4,482 (60.9%) | $74,780 |
| 3-Person Families | 1,081 (14.7%) | $93,096 |
| 4-Person Families | 928 (12.6%) | $80,729 |
| 5-Person Families | 545 (7.4%) | $75,649 |
| 6-Person Families | 249 (3.4%) | $0 |
| 7+ Person Families | 80 (1.1%) | $154,706 |
| Total | 7,365 (100.0%) | $79,438 |
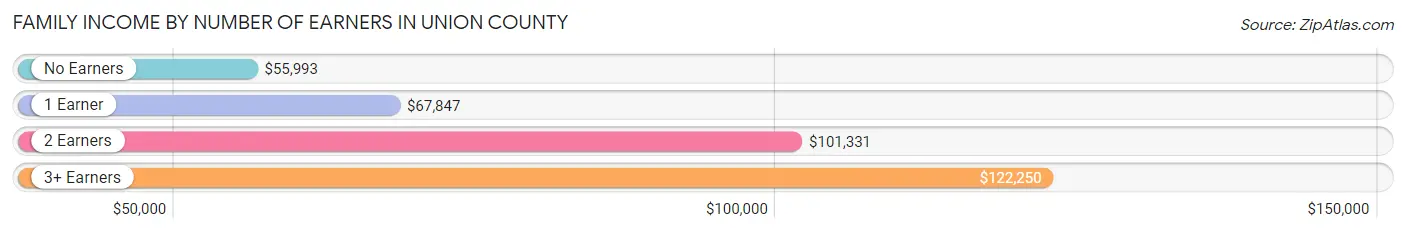
Family Income by Number of Earners in Union County
The median family income in Union County is $79,438, with families comprising 3+ earners (901) having the highest median family income of $122,250, while families with no earners (2,194) have the lowest median family income of $55,993, accounting for 12.2% and 29.8% of families, respectively.
| Number of Earners | # Families | Median Income |
| No Earners | 2,194 (29.8%) | $55,993 |
| 1 Earner | 2,041 (27.7%) | $67,847 |
| 2 Earners | 2,229 (30.3%) | $101,331 |
| 3+ Earners | 901 (12.2%) | $122,250 |
| Total | 7,365 (100.0%) | $79,438 |
Household Income in Union County
Household Income Brackets in Union County
With 1,980 households falling in the category, the $50,000 to $74,999 income range is the most frequent in Union County, accounting for 18.4% of all households. In contrast, only 323 households (3.0%) fall into the $10,000 to $14,999 income bracket, making it the least populous group.

| Income Bracket | # Households | % Households |
| Less than $10,000 | 430 | 4.0% |
| $10,000 to $14,999 | 323 | 3.0% |
| $15,000 to $24,999 | 1,323 | 12.3% |
| $25,000 to $34,999 | 1,033 | 9.6% |
| $35,000 to $49,999 | 1,302 | 12.1% |
| $50,000 to $74,999 | 1,980 | 18.4% |
| $75,000 to $99,999 | 1,345 | 12.5% |
| $100,000 to $149,999 | 1,517 | 14.1% |
| $150,000 to $199,999 | 710 | 6.6% |
| $200,000+ | 785 | 7.3% |
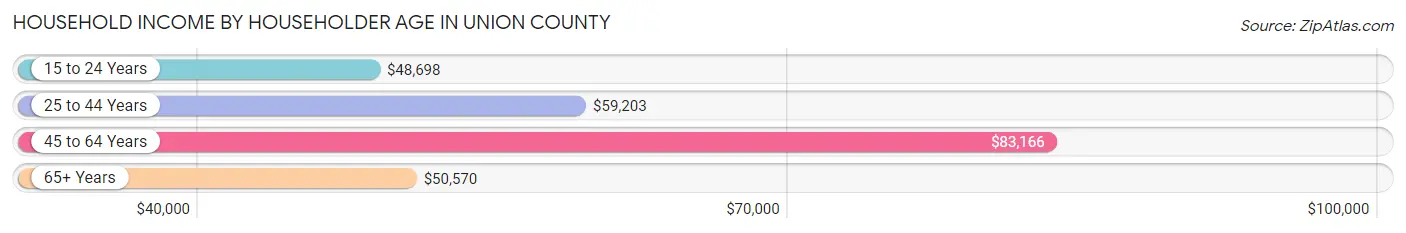
Household Income by Householder Age in Union County
The median household income in Union County is $59,783, with the highest median household income of $83,166 found in the 45 to 64 years age bracket for the primary householder. A total of 3,607 households (33.5%) fall into this category. Meanwhile, the 15 to 24 years age bracket for the primary householder has the lowest median household income of $48,698, with 282 households (2.6%) in this group.
| Income Bracket | # Households | Median Income |
| 15 to 24 Years | 282 (2.6%) | $48,698 |
| 25 to 44 Years | 1,692 (15.7%) | $59,203 |
| 45 to 64 Years | 3,607 (33.5%) | $83,166 |
| 65+ Years | 5,178 (48.1%) | $50,570 |
| Total | 10,759 (100.0%) | $59,783 |
Poverty in Union County
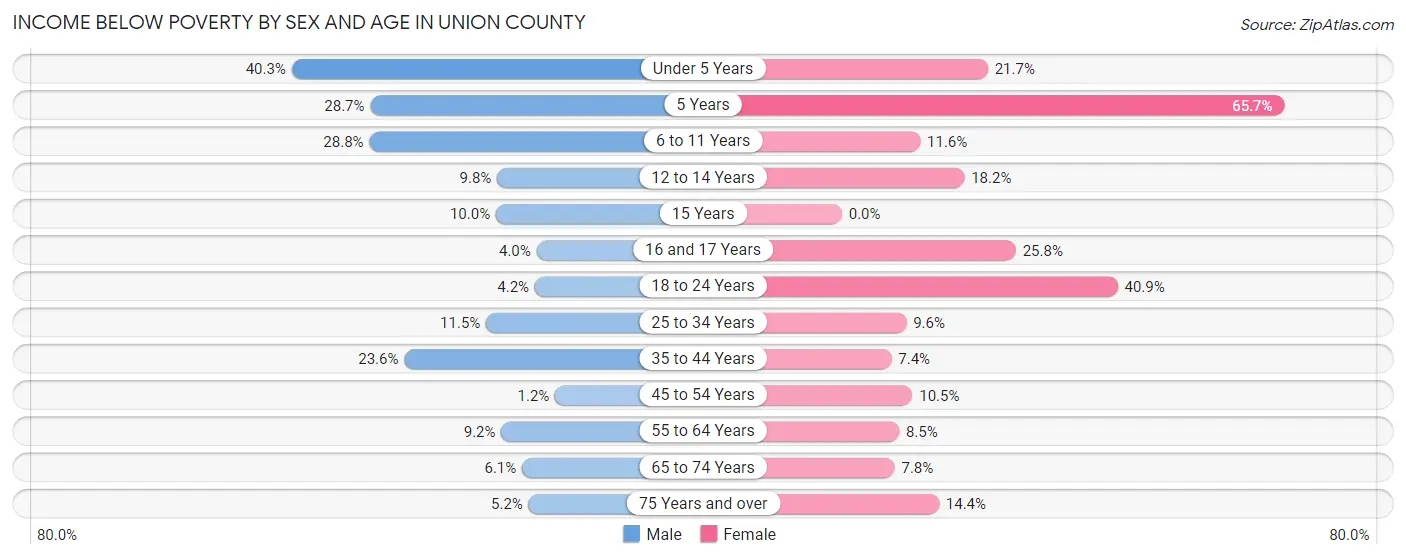
Income Below Poverty by Sex and Age in Union County
With 10.8% poverty level for males and 12.5% for females among the residents of Union County, under 5 year old males and 5 year old females are the most vulnerable to poverty, with 215 males (40.3%) and 46 females (65.7%) in their respective age groups living below the poverty level.
| Age Bracket | Male | Female |
| Under 5 Years | 215 (40.3%) | 88 (21.7%) |
| 5 Years | 45 (28.7%) | 46 (65.7%) |
| 6 to 11 Years | 199 (28.8%) | 94 (11.6%) |
| 12 to 14 Years | 23 (9.8%) | 32 (18.2%) |
| 15 Years | 8 (10.0%) | 0 (0.0%) |
| 16 and 17 Years | 11 (4.0%) | 62 (25.8%) |
| 18 to 24 Years | 34 (4.2%) | 280 (40.9%) |
| 25 to 34 Years | 114 (11.5%) | 99 (9.6%) |
| 35 to 44 Years | 222 (23.6%) | 79 (7.4%) |
| 45 to 54 Years | 16 (1.2%) | 140 (10.5%) |
| 55 to 64 Years | 188 (9.2%) | 187 (8.5%) |
| 65 to 74 Years | 142 (6.1%) | 200 (7.8%) |
| 75 Years and over | 80 (5.1%) | 241 (14.4%) |
| Total | 1,297 (10.8%) | 1,548 (12.5%) |
Income Above Poverty by Sex and Age in Union County
According to the poverty statistics in Union County, males aged 45 to 54 years and females aged 15 years are the age groups that are most secure financially, with 98.8% of males and 100.0% of females in these age groups living above the poverty line.

| Age Bracket | Male | Female |
| Under 5 Years | 318 (59.7%) | 318 (78.3%) |
| 5 Years | 112 (71.3%) | 24 (34.3%) |
| 6 to 11 Years | 492 (71.2%) | 714 (88.4%) |
| 12 to 14 Years | 211 (90.2%) | 144 (81.8%) |
| 15 Years | 72 (90.0%) | 83 (100.0%) |
| 16 and 17 Years | 266 (96.0%) | 178 (74.2%) |
| 18 to 24 Years | 772 (95.8%) | 404 (59.1%) |
| 25 to 34 Years | 881 (88.5%) | 937 (90.4%) |
| 35 to 44 Years | 718 (76.4%) | 994 (92.6%) |
| 45 to 54 Years | 1,308 (98.8%) | 1,197 (89.5%) |
| 55 to 64 Years | 1,855 (90.8%) | 2,016 (91.5%) |
| 65 to 74 Years | 2,177 (93.9%) | 2,353 (92.2%) |
| 75 Years and over | 1,474 (94.9%) | 1,432 (85.6%) |
| Total | 10,656 (89.1%) | 10,794 (87.5%) |
Income Below Poverty Among Married-Couple Families in Union County
The poverty statistics for married-couple families in Union County show that 3.3% or 211 of the total 6,358 families live below the poverty line. Families with 3 or 4 children have the highest poverty rate of 6.5%, comprising of 30 families. On the other hand, families with 5 or more children have the lowest poverty rate of 0.0%, which includes 0 families.
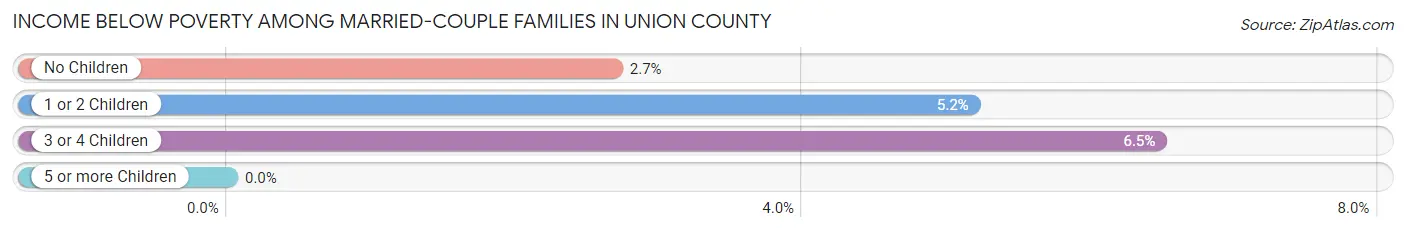
| Children | Above Poverty | Below Poverty |
| No Children | 4,765 (97.3%) | 131 (2.7%) |
| 1 or 2 Children | 918 (94.8%) | 50 (5.2%) |
| 3 or 4 Children | 434 (93.5%) | 30 (6.5%) |
| 5 or more Children | 30 (100.0%) | 0 (0.0%) |
| Total | 6,147 (96.7%) | 211 (3.3%) |
Income Below Poverty Among Single-Parent Households in Union County
According to the poverty data in Union County, 39.3% or 171 single-father households and 34.1% or 195 single-mother households are living below the poverty line. Among single-father households, those with 3 or 4 children have the highest poverty rate, with 159 households (94.1%) experiencing poverty. Likewise, among single-mother households, those with 3 or 4 children have the highest poverty rate, with 53 households (75.7%) falling below the poverty line.

| Children | Single Father | Single Mother |
| No Children | 0 (0.0%) | 4 (1.9%) |
| 1 or 2 Children | 12 (14.3%) | 138 (46.5%) |
| 3 or 4 Children | 159 (94.1%) | 53 (75.7%) |
| 5 or more Children | 0 (0.0%) | 0 (0.0%) |
| Total | 171 (39.3%) | 195 (34.1%) |
Income Below Poverty Among Married-Couple vs Single-Parent Households in Union County
The poverty data for Union County shows that 211 of the married-couple family households (3.3%) and 366 of the single-parent households (36.3%) are living below the poverty level. Within the married-couple family households, those with 3 or 4 children have the highest poverty rate, with 30 households (6.5%) falling below the poverty line. Among the single-parent households, those with 3 or 4 children have the highest poverty rate, with 212 household (88.7%) living below poverty.
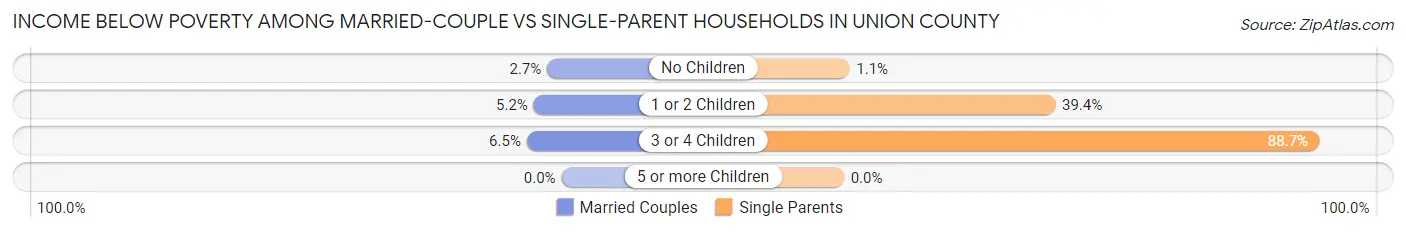
| Children | Married-Couple Families | Single-Parent Households |
| No Children | 131 (2.7%) | 4 (1.1%) |
| 1 or 2 Children | 50 (5.2%) | 150 (39.4%) |
| 3 or 4 Children | 30 (6.5%) | 212 (88.7%) |
| 5 or more Children | 0 (0.0%) | 0 (0.0%) |
| Total | 211 (3.3%) | 366 (36.3%) |
Employment Characteristics in Union County
Employment by Class of Employer in Union County
Among the 9,400 employed individuals in Union County, private company employees (5,749 | 61.2%), self-employed (not incorporated) (1,080 | 11.5%), and not-for-profit organizations (847 | 9.0%) make up the most common classes of employment.
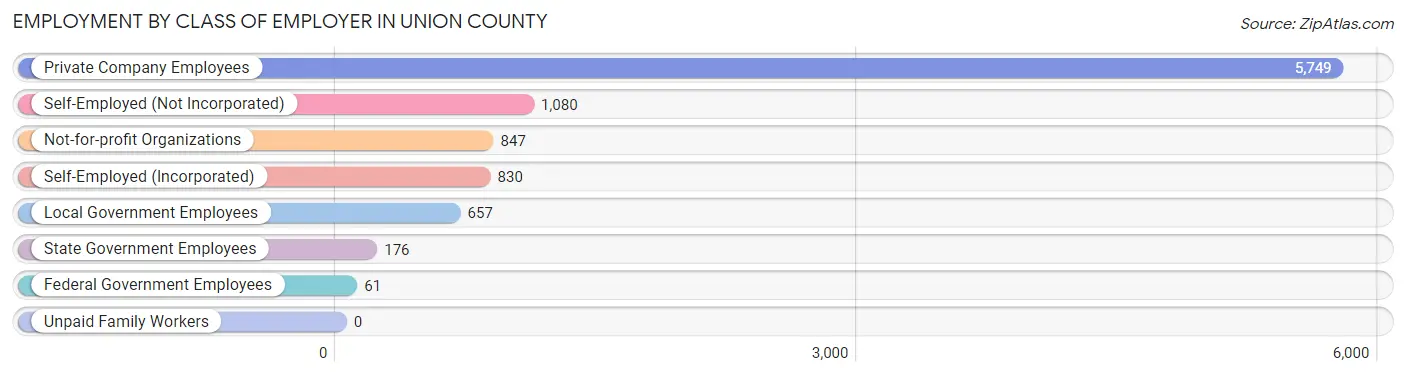
| Employer Class | # Employees | % Employees |
| Private Company Employees | 5,749 | 61.2% |
| Self-Employed (Incorporated) | 830 | 8.8% |
| Self-Employed (Not Incorporated) | 1,080 | 11.5% |
| Not-for-profit Organizations | 847 | 9.0% |
| Local Government Employees | 657 | 7.0% |
| State Government Employees | 176 | 1.9% |
| Federal Government Employees | 61 | 0.6% |
| Unpaid Family Workers | 0 | 0.0% |
| Total | 9,400 | 100.0% |
Employment Status by Age in Union County
According to the labor force statistics for Union County, out of the total population over 16 years of age (21,620), 46.3% or 10,010 individuals are in the labor force, with 2.7% or 270 of them unemployed. The age group with the highest labor force participation rate is 35 to 44 years, with 85.3% or 1,827 individuals in the labor force. Within the labor force, the 55 to 59 years age range has the highest percentage of unemployed individuals, with 7.8% or 90 of them being unemployed.
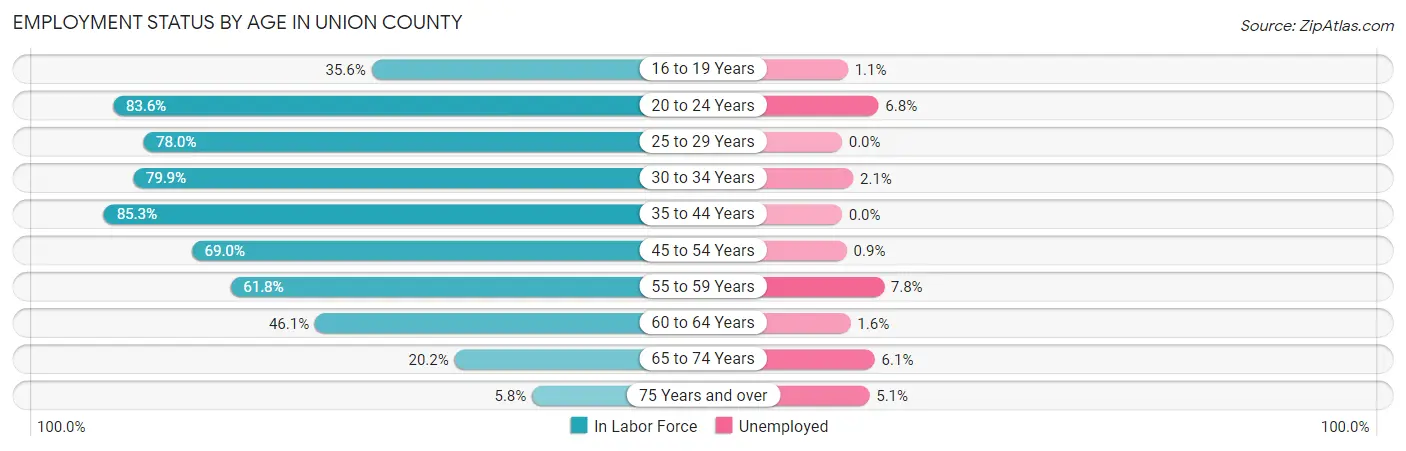
| Age Bracket | In Labor Force | Unemployed |
| 16 to 19 Years | 367 (35.6%) | 4 (1.1%) |
| 20 to 24 Years | 839 (83.6%) | 57 (6.8%) |
| 25 to 29 Years | 809 (78.0%) | 0 (0.0%) |
| 30 to 34 Years | 839 (79.9%) | 18 (2.1%) |
| 35 to 44 Years | 1,827 (85.3%) | 0 (0.0%) |
| 45 to 54 Years | 1,866 (69.0%) | 17 (0.9%) |
| 55 to 59 Years | 1,148 (61.8%) | 90 (7.8%) |
| 60 to 64 Years | 1,112 (46.1%) | 18 (1.6%) |
| 65 to 74 Years | 1,000 (20.2%) | 61 (6.1%) |
| 75 Years and over | 199 (5.8%) | 10 (5.1%) |
| Total | 10,010 (46.3%) | 270 (2.7%) |
Employment Status by Educational Attainment in Union County
According to labor force statistics for Union County, 67.9% of individuals (7,607) out of the total population between 25 and 64 years of age (11,203) are in the labor force, with 1.9% or 145 of them being unemployed. The group with the highest labor force participation rate are those with the educational attainment of high school diploma, with 74.0% or 2,577 individuals in the labor force. Within the labor force, individuals with high school diploma education have the highest percentage of unemployment, with 3.3% or 85 of them being unemployed.
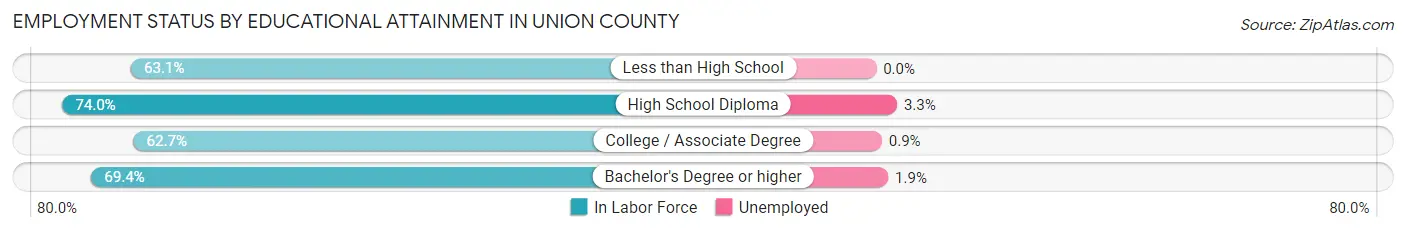
| Educational Attainment | In Labor Force | Unemployed |
| Less than High School | 936 (63.1%) | 0 (0.0%) |
| High School Diploma | 2,577 (74.0%) | 115 (3.3%) |
| College / Associate Degree | 2,221 (62.7%) | 32 (0.9%) |
| Bachelor's Degree or higher | 1,870 (69.4%) | 51 (1.9%) |
| Total | 7,607 (67.9%) | 213 (1.9%) |
Employment Occupations by Sex in Union County
Management, Business, Science and Arts Occupations
The most common Management, Business, Science and Arts occupations in Union County are Management (1,400 | 14.4%), Community & Social Service (903 | 9.3%), Health Diagnosing & Treating (624 | 6.4%), Education Instruction & Library (530 | 5.4%), and Health Technologists (384 | 4.0%).

Management, Business, Science and Arts Occupations by Sex
Within the Management, Business, Science and Arts occupations in Union County, the most male-oriented occupations are Architecture & Engineering (79.6%), Legal Services & Support (75.7%), and Education, Arts & Media (71.7%), while the most female-oriented occupations are Life, Physical & Social Science (80.6%), Health Technologists (74.5%), and Education Instruction & Library (73.6%).
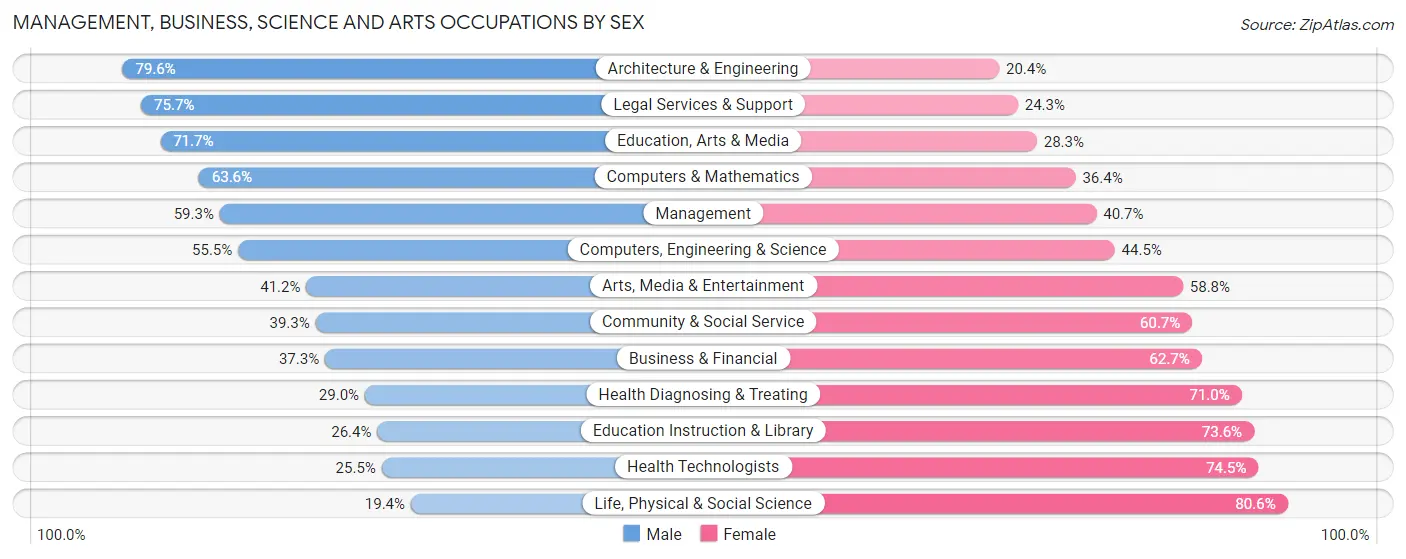
| Occupation | Male | Female |
| Management | 830 (59.3%) | 570 (40.7%) |
| Business & Financial | 90 (37.3%) | 151 (62.7%) |
| Computers, Engineering & Science | 203 (55.5%) | 163 (44.5%) |
| Computers & Mathematics | 105 (63.6%) | 60 (36.4%) |
| Architecture & Engineering | 78 (79.6%) | 20 (20.4%) |
| Life, Physical & Social Science | 20 (19.4%) | 83 (80.6%) |
| Community & Social Service | 355 (39.3%) | 548 (60.7%) |
| Education, Arts & Media | 114 (71.7%) | 45 (28.3%) |
| Legal Services & Support | 28 (75.7%) | 9 (24.3%) |
| Education Instruction & Library | 140 (26.4%) | 390 (73.6%) |
| Arts, Media & Entertainment | 73 (41.2%) | 104 (58.8%) |
| Health Diagnosing & Treating | 181 (29.0%) | 443 (71.0%) |
| Health Technologists | 98 (25.5%) | 286 (74.5%) |
| Total (Category) | 1,659 (46.9%) | 1,875 (53.1%) |
| Total (Overall) | 5,183 (53.3%) | 4,538 (46.7%) |
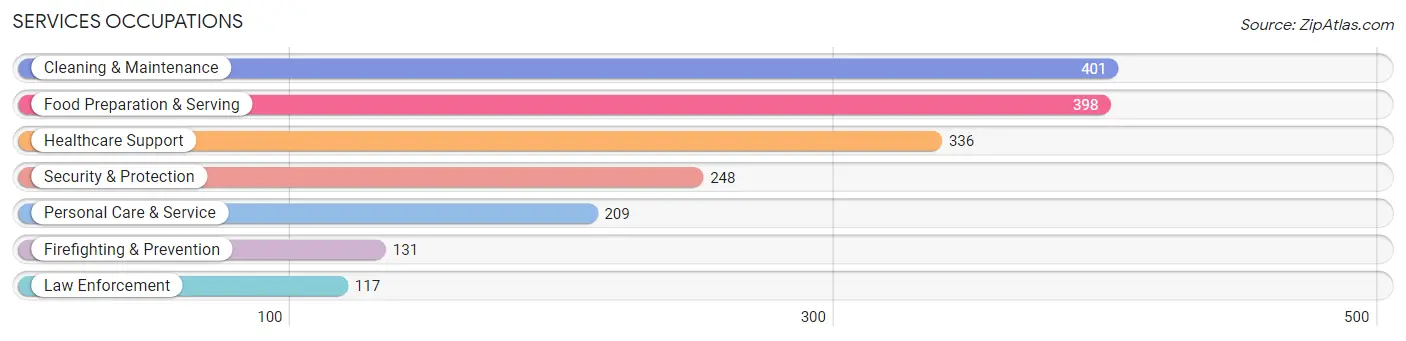
Services Occupations
The most common Services occupations in Union County are Cleaning & Maintenance (401 | 4.1%), Food Preparation & Serving (398 | 4.1%), Healthcare Support (336 | 3.5%), Security & Protection (248 | 2.5%), and Personal Care & Service (209 | 2.1%).
Services Occupations by Sex
Within the Services occupations in Union County, the most male-oriented occupations are Firefighting & Prevention (100.0%), Security & Protection (71.0%), and Cleaning & Maintenance (51.6%), while the most female-oriented occupations are Healthcare Support (95.8%), Personal Care & Service (92.8%), and Law Enforcement (61.5%).
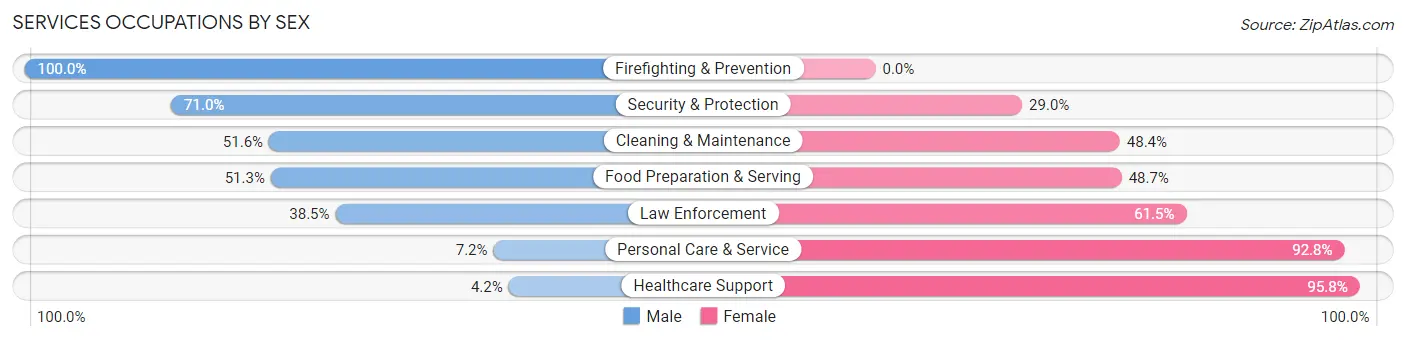
| Occupation | Male | Female |
| Healthcare Support | 14 (4.2%) | 322 (95.8%) |
| Security & Protection | 176 (71.0%) | 72 (29.0%) |
| Firefighting & Prevention | 131 (100.0%) | 0 (0.0%) |
| Law Enforcement | 45 (38.5%) | 72 (61.5%) |
| Food Preparation & Serving | 204 (51.3%) | 194 (48.7%) |
| Cleaning & Maintenance | 207 (51.6%) | 194 (48.4%) |
| Personal Care & Service | 15 (7.2%) | 194 (92.8%) |
| Total (Category) | 616 (38.7%) | 976 (61.3%) |
| Total (Overall) | 5,183 (53.3%) | 4,538 (46.7%) |
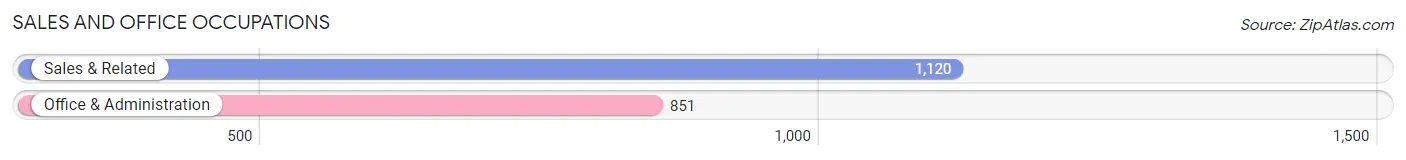
Sales and Office Occupations
The most common Sales and Office occupations in Union County are Sales & Related (1,120 | 11.5%), and Office & Administration (851 | 8.7%).
Sales and Office Occupations by Sex
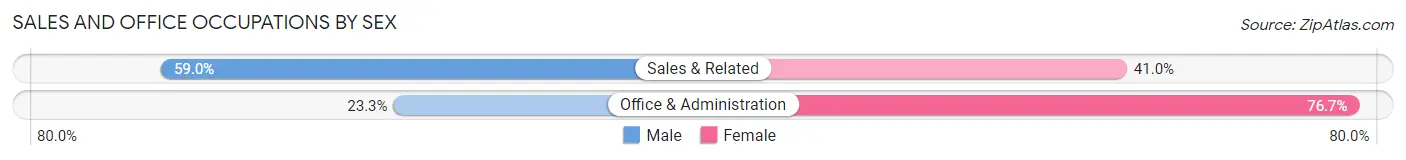
| Occupation | Male | Female |
| Sales & Related | 661 (59.0%) | 459 (41.0%) |
| Office & Administration | 198 (23.3%) | 653 (76.7%) |
| Total (Category) | 859 (43.6%) | 1,112 (56.4%) |
| Total (Overall) | 5,183 (53.3%) | 4,538 (46.7%) |
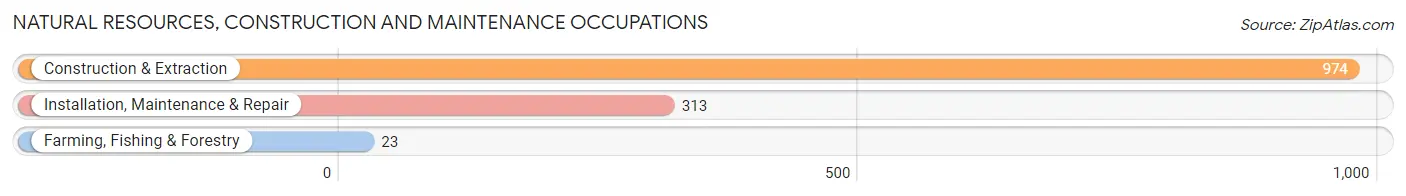
Natural Resources, Construction and Maintenance Occupations
The most common Natural Resources, Construction and Maintenance occupations in Union County are Construction & Extraction (974 | 10.0%), Installation, Maintenance & Repair (313 | 3.2%), and Farming, Fishing & Forestry (23 | 0.2%).
Natural Resources, Construction and Maintenance Occupations by Sex
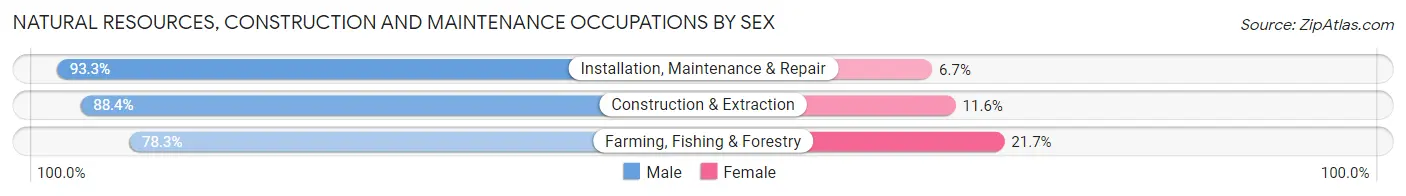
| Occupation | Male | Female |
| Farming, Fishing & Forestry | 18 (78.3%) | 5 (21.7%) |
| Construction & Extraction | 861 (88.4%) | 113 (11.6%) |
| Installation, Maintenance & Repair | 292 (93.3%) | 21 (6.7%) |
| Total (Category) | 1,171 (89.4%) | 139 (10.6%) |
| Total (Overall) | 5,183 (53.3%) | 4,538 (46.7%) |
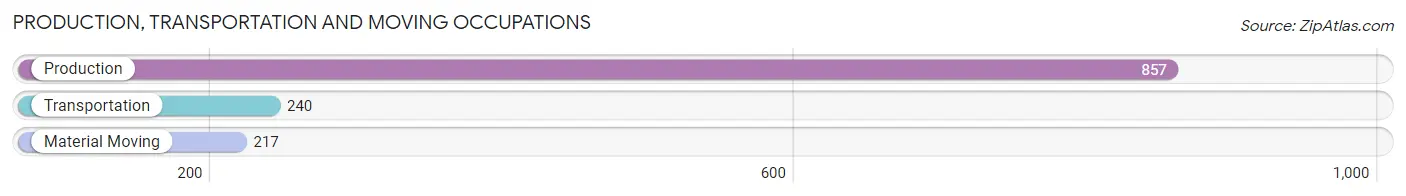
Production, Transportation and Moving Occupations
The most common Production, Transportation and Moving occupations in Union County are Production (857 | 8.8%), Transportation (240 | 2.5%), and Material Moving (217 | 2.2%).
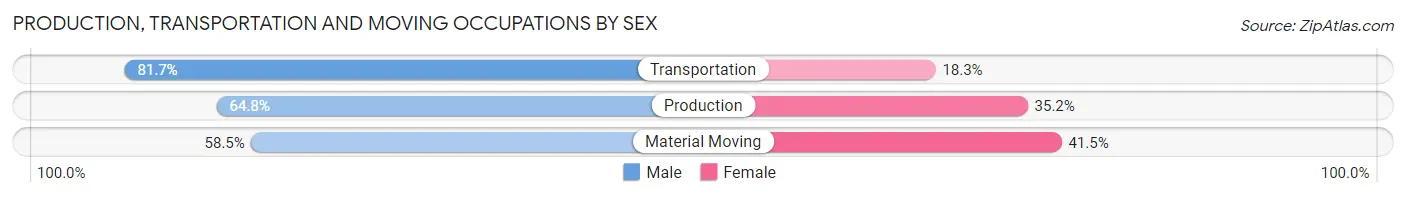
Production, Transportation and Moving Occupations by Sex
| Occupation | Male | Female |
| Production | 555 (64.8%) | 302 (35.2%) |
| Transportation | 196 (81.7%) | 44 (18.3%) |
| Material Moving | 127 (58.5%) | 90 (41.5%) |
| Total (Category) | 878 (66.8%) | 436 (33.2%) |
| Total (Overall) | 5,183 (53.3%) | 4,538 (46.7%) |
Employment Industries by Sex in Union County
Employment Industries in Union County
The major employment industries in Union County include Retail Trade (1,468 | 15.1%), Health Care & Social Assistance (1,439 | 14.8%), Construction (1,332 | 13.7%), Manufacturing (896 | 9.2%), and Accommodation & Food Services (733 | 7.5%).

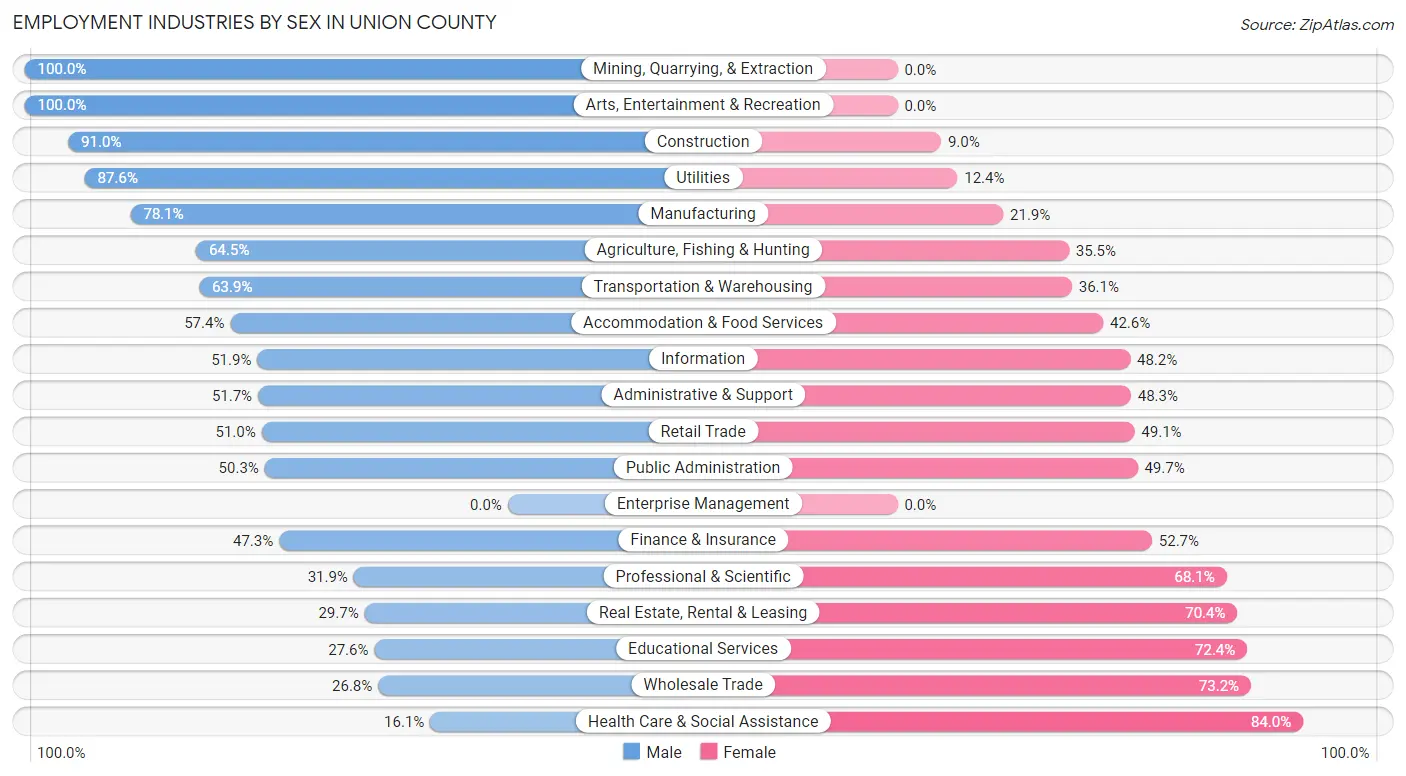
Employment Industries by Sex in Union County
The Union County industries that see more men than women are Mining, Quarrying, & Extraction (100.0%), Arts, Entertainment & Recreation (100.0%), and Construction (91.0%), whereas the industries that tend to have a higher number of women are Health Care & Social Assistance (84.0%), Wholesale Trade (73.2%), and Educational Services (72.4%).
| Industry | Male | Female |
| Agriculture, Fishing & Hunting | 80 (64.5%) | 44 (35.5%) |
| Mining, Quarrying, & Extraction | 15 (100.0%) | 0 (0.0%) |
| Construction | 1,212 (91.0%) | 120 (9.0%) |
| Manufacturing | 700 (78.1%) | 196 (21.9%) |
| Wholesale Trade | 44 (26.8%) | 120 (73.2%) |
| Retail Trade | 748 (50.9%) | 720 (49.0%) |
| Transportation & Warehousing | 154 (63.9%) | 87 (36.1%) |
| Utilities | 113 (87.6%) | 16 (12.4%) |
| Information | 56 (51.8%) | 52 (48.1%) |
| Finance & Insurance | 177 (47.3%) | 197 (52.7%) |
| Real Estate, Rental & Leasing | 59 (29.6%) | 140 (70.4%) |
| Professional & Scientific | 95 (31.9%) | 203 (68.1%) |
| Enterprise Management | 0 (0.0%) | 0 (0.0%) |
| Administrative & Support | 259 (51.7%) | 242 (48.3%) |
| Educational Services | 195 (27.6%) | 511 (72.4%) |
| Health Care & Social Assistance | 231 (16.1%) | 1,208 (84.0%) |
| Arts, Entertainment & Recreation | 39 (100.0%) | 0 (0.0%) |
| Accommodation & Food Services | 421 (57.4%) | 312 (42.6%) |
| Public Administration | 161 (50.3%) | 159 (49.7%) |
| Total | 5,183 (53.3%) | 4,538 (46.7%) |
Education in Union County
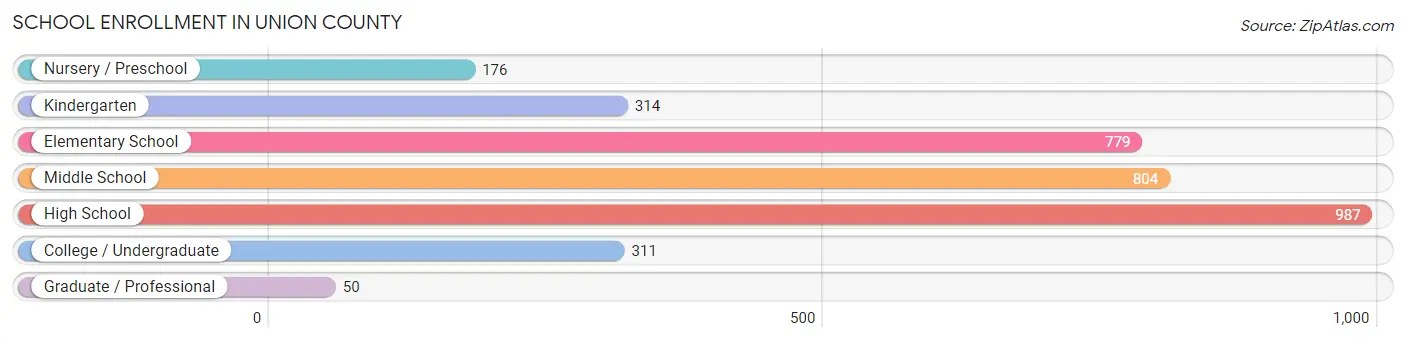
School Enrollment in Union County
The most common levels of schooling among the 3,421 students in Union County are high school (987 | 28.8%), middle school (804 | 23.5%), and elementary school (779 | 22.8%).
| School Level | # Students | % Students |
| Nursery / Preschool | 176 | 5.1% |
| Kindergarten | 314 | 9.2% |
| Elementary School | 779 | 22.8% |
| Middle School | 804 | 23.5% |
| High School | 987 | 28.8% |
| College / Undergraduate | 311 | 9.1% |
| Graduate / Professional | 50 | 1.5% |
| Total | 3,421 | 100.0% |
School Enrollment by Age by Funding Source in Union County
Out of a total of 3,421 students who are enrolled in schools in Union County, 424 (12.4%) attend a private institution, while the remaining 2,997 (87.6%) are enrolled in public schools. The age group of 25 to 34 year olds has the highest likelihood of being enrolled in private schools, with 12 (60.0% in the age bracket) enrolled. Conversely, the age group of 3 to 4 year olds has the lowest likelihood of being enrolled in a private school, with 134 (95.7% in the age bracket) attending a public institution.
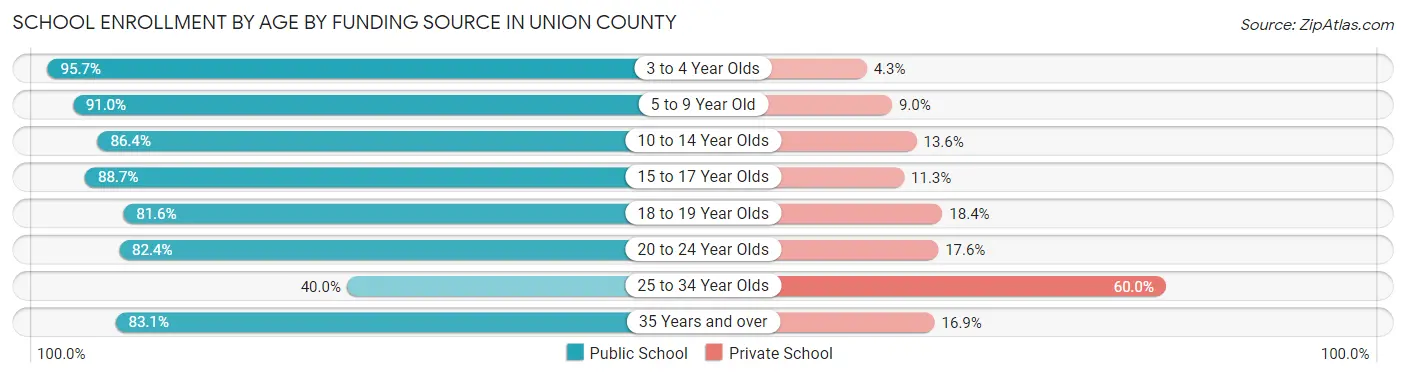
| Age Bracket | Public School | Private School |
| 3 to 4 Year Olds | 134 (95.7%) | 6 (4.3%) |
| 5 to 9 Year Old | 960 (91.0%) | 95 (9.0%) |
| 10 to 14 Year Olds | 770 (86.4%) | 121 (13.6%) |
| 15 to 17 Year Olds | 607 (88.7%) | 77 (11.3%) |
| 18 to 19 Year Olds | 284 (81.6%) | 64 (18.4%) |
| 20 to 24 Year Olds | 131 (82.4%) | 28 (17.6%) |
| 25 to 34 Year Olds | 8 (40.0%) | 12 (60.0%) |
| 35 Years and over | 103 (83.1%) | 21 (16.9%) |
| Total | 2,997 (87.6%) | 424 (12.4%) |
Educational Attainment by Field of Study in Union County
Business (1,108 | 21.0%), education (1,027 | 19.5%), science & technology (575 | 10.9%), liberal arts & history (443 | 8.4%), and psychology (337 | 6.4%) are the most common fields of study among 5,268 individuals in Union County who have obtained a bachelor's degree or higher.

| Field of Study | # Graduates | % Graduates |
| Computers & Mathematics | 188 | 3.6% |
| Bio, Nature & Agricultural | 250 | 4.8% |
| Physical & Health Sciences | 105 | 2.0% |
| Psychology | 337 | 6.4% |
| Social Sciences | 292 | 5.5% |
| Engineering | 182 | 3.5% |
| Multidisciplinary Studies | 23 | 0.4% |
| Science & Technology | 575 | 10.9% |
| Business | 1,108 | 21.0% |
| Education | 1,027 | 19.5% |
| Literature & Languages | 211 | 4.0% |
| Liberal Arts & History | 443 | 8.4% |
| Visual & Performing Arts | 144 | 2.7% |
| Communications | 123 | 2.3% |
| Arts & Humanities | 260 | 4.9% |
| Total | 5,268 | 100.0% |
Transportation & Commute in Union County
Vehicle Availability by Sex in Union County
The most prevalent vehicle ownership categories in Union County are males with 2 vehicles (1,404, accounting for 27.9%) and females with 2 vehicles (1,524, making up 32.1%).
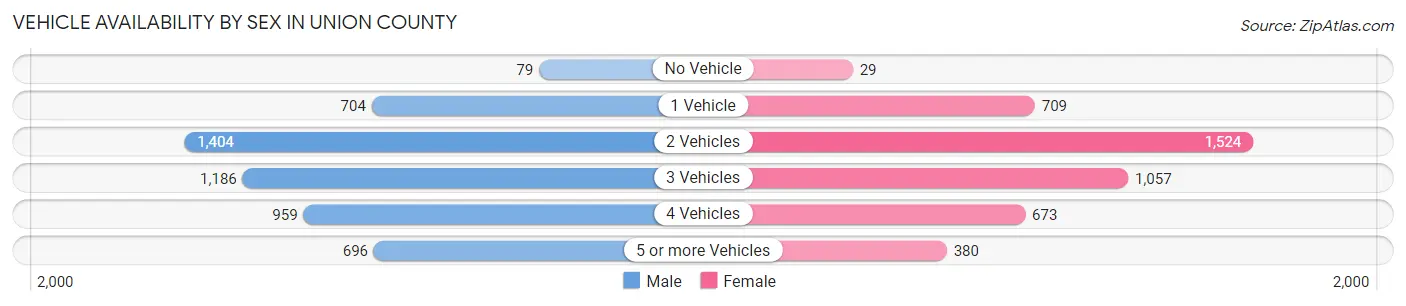
| Vehicles Available | Male | Female |
| No Vehicle | 79 (1.6%) | 29 (0.7%) |
| 1 Vehicle | 704 (14.0%) | 709 (16.2%) |
| 2 Vehicles | 1,404 (27.9%) | 1,524 (34.9%) |
| 3 Vehicles | 1,186 (23.6%) | 1,057 (24.2%) |
| 4 Vehicles | 959 (19.1%) | 673 (15.4%) |
| 5 or more Vehicles | 696 (13.8%) | 380 (8.7%) |
| Total | 5,028 (100.0%) | 4,372 (100.0%) |
Commute Time in Union County
The most frequently occuring commute durations in Union County are 15 to 19 minutes (2,254 commuters, 26.0%), 10 to 14 minutes (1,760 commuters, 20.3%), and 30 to 34 minutes (1,169 commuters, 13.5%).
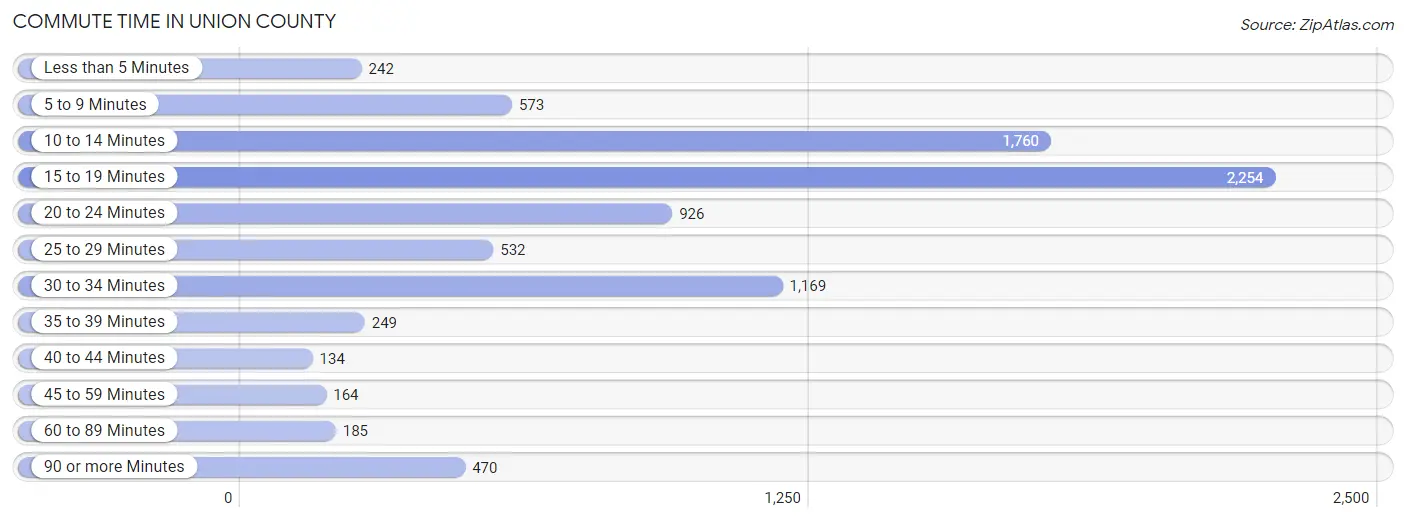
| Commute Time | # Commuters | % Commuters |
| Less than 5 Minutes | 242 | 2.8% |
| 5 to 9 Minutes | 573 | 6.6% |
| 10 to 14 Minutes | 1,760 | 20.3% |
| 15 to 19 Minutes | 2,254 | 26.0% |
| 20 to 24 Minutes | 926 | 10.7% |
| 25 to 29 Minutes | 532 | 6.1% |
| 30 to 34 Minutes | 1,169 | 13.5% |
| 35 to 39 Minutes | 249 | 2.9% |
| 40 to 44 Minutes | 134 | 1.5% |
| 45 to 59 Minutes | 164 | 1.9% |
| 60 to 89 Minutes | 185 | 2.1% |
| 90 or more Minutes | 470 | 5.4% |
Commute Time by Sex in Union County
The most common commute times in Union County are 15 to 19 minutes (1,095 commuters, 23.4%) for males and 15 to 19 minutes (1,159 commuters, 29.2%) for females.

| Commute Time | Male | Female |
| Less than 5 Minutes | 181 (3.9%) | 61 (1.5%) |
| 5 to 9 Minutes | 320 (6.8%) | 253 (6.4%) |
| 10 to 14 Minutes | 970 (20.7%) | 790 (19.9%) |
| 15 to 19 Minutes | 1,095 (23.4%) | 1,159 (29.2%) |
| 20 to 24 Minutes | 446 (9.5%) | 480 (12.1%) |
| 25 to 29 Minutes | 230 (4.9%) | 302 (7.6%) |
| 30 to 34 Minutes | 765 (16.3%) | 404 (10.2%) |
| 35 to 39 Minutes | 50 (1.1%) | 199 (5.0%) |
| 40 to 44 Minutes | 76 (1.6%) | 58 (1.5%) |
| 45 to 59 Minutes | 60 (1.3%) | 104 (2.6%) |
| 60 to 89 Minutes | 108 (2.3%) | 77 (1.9%) |
| 90 or more Minutes | 383 (8.2%) | 87 (2.2%) |
Time of Departure to Work by Sex in Union County
The most frequent times of departure to work in Union County are 7:00 AM to 7:29 AM (919, 19.6%) for males and 7:00 AM to 7:29 AM (676, 17.0%) for females.
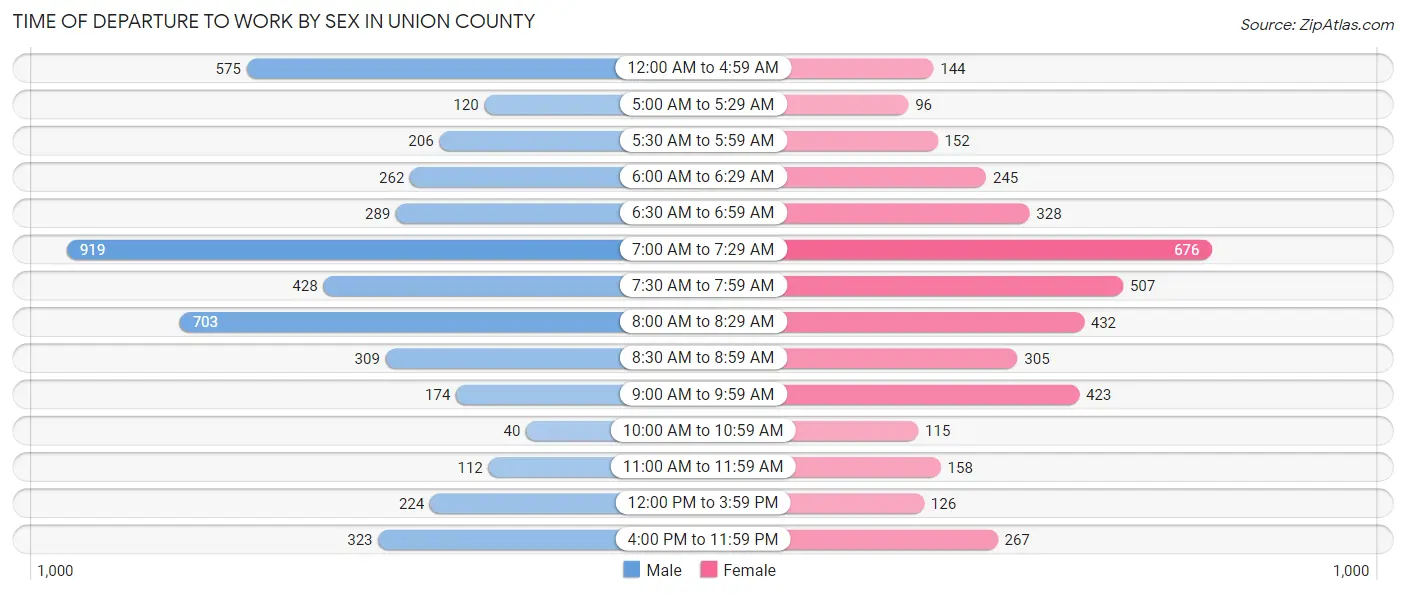
| Time of Departure | Male | Female |
| 12:00 AM to 4:59 AM | 575 (12.3%) | 144 (3.6%) |
| 5:00 AM to 5:29 AM | 120 (2.6%) | 96 (2.4%) |
| 5:30 AM to 5:59 AM | 206 (4.4%) | 152 (3.8%) |
| 6:00 AM to 6:29 AM | 262 (5.6%) | 245 (6.2%) |
| 6:30 AM to 6:59 AM | 289 (6.2%) | 328 (8.3%) |
| 7:00 AM to 7:29 AM | 919 (19.6%) | 676 (17.0%) |
| 7:30 AM to 7:59 AM | 428 (9.1%) | 507 (12.8%) |
| 8:00 AM to 8:29 AM | 703 (15.0%) | 432 (10.9%) |
| 8:30 AM to 8:59 AM | 309 (6.6%) | 305 (7.7%) |
| 9:00 AM to 9:59 AM | 174 (3.7%) | 423 (10.6%) |
| 10:00 AM to 10:59 AM | 40 (0.9%) | 115 (2.9%) |
| 11:00 AM to 11:59 AM | 112 (2.4%) | 158 (4.0%) |
| 12:00 PM to 3:59 PM | 224 (4.8%) | 126 (3.2%) |
| 4:00 PM to 11:59 PM | 323 (6.9%) | 267 (6.7%) |
| Total | 4,684 (100.0%) | 3,974 (100.0%) |
Housing Occupancy in Union County
Occupancy by Ownership in Union County
Of the total 10,759 dwellings in Union County, owner-occupied units account for 8,755 (81.4%), while renter-occupied units make up 2,004 (18.6%).
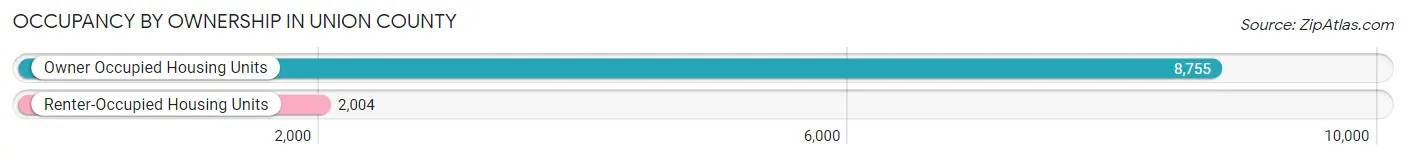
| Occupancy | # Housing Units | % Housing Units |
| Owner Occupied Housing Units | 8,755 | 81.4% |
| Renter-Occupied Housing Units | 2,004 | 18.6% |
| Total Occupied Housing Units | 10,759 | 100.0% |
Occupancy by Household Size in Union County
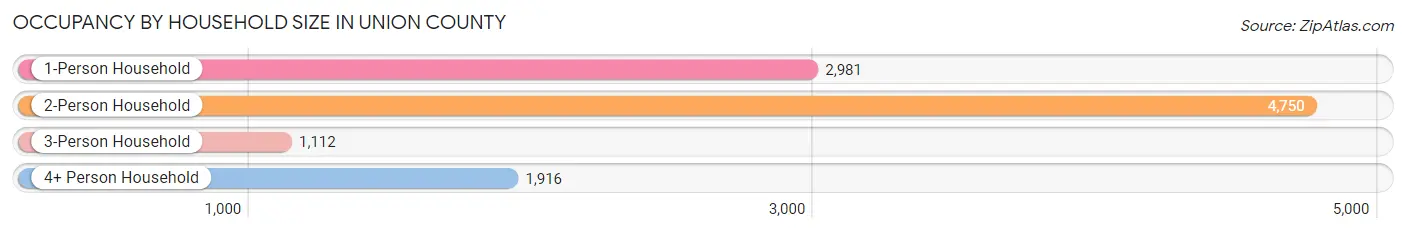
| Household Size | # Housing Units | % Housing Units |
| 1-Person Household | 2,981 | 27.7% |
| 2-Person Household | 4,750 | 44.2% |
| 3-Person Household | 1,112 | 10.3% |
| 4+ Person Household | 1,916 | 17.8% |
| Total Housing Units | 10,759 | 100.0% |
Occupancy by Ownership by Household Size in Union County
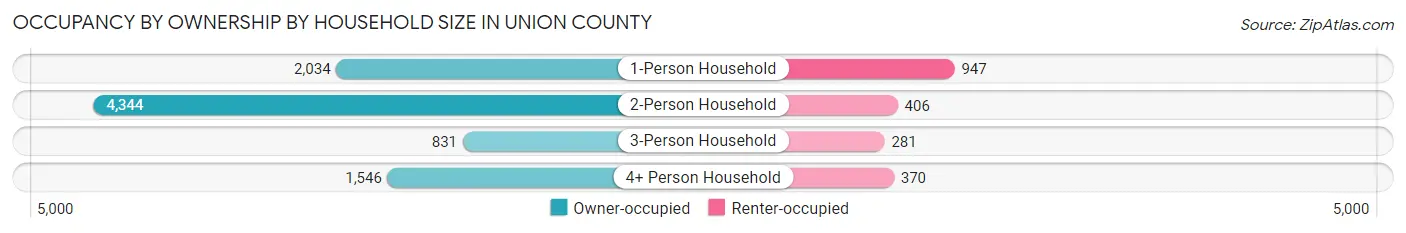
| Household Size | Owner-occupied | Renter-occupied |
| 1-Person Household | 2,034 (68.2%) | 947 (31.8%) |
| 2-Person Household | 4,344 (91.4%) | 406 (8.6%) |
| 3-Person Household | 831 (74.7%) | 281 (25.3%) |
| 4+ Person Household | 1,546 (80.7%) | 370 (19.3%) |
| Total Housing Units | 8,755 (81.4%) | 2,004 (18.6%) |
Occupancy by Educational Attainment in Union County

| Household Size | Owner-occupied | Renter-occupied |
| Less than High School | 891 (71.2%) | 360 (28.8%) |
| High School Diploma | 2,512 (83.4%) | 500 (16.6%) |
| College/Associate Degree | 2,934 (83.5%) | 582 (16.6%) |
| Bachelor's Degree or higher | 2,418 (81.1%) | 562 (18.9%) |
Occupancy by Age of Householder in Union County
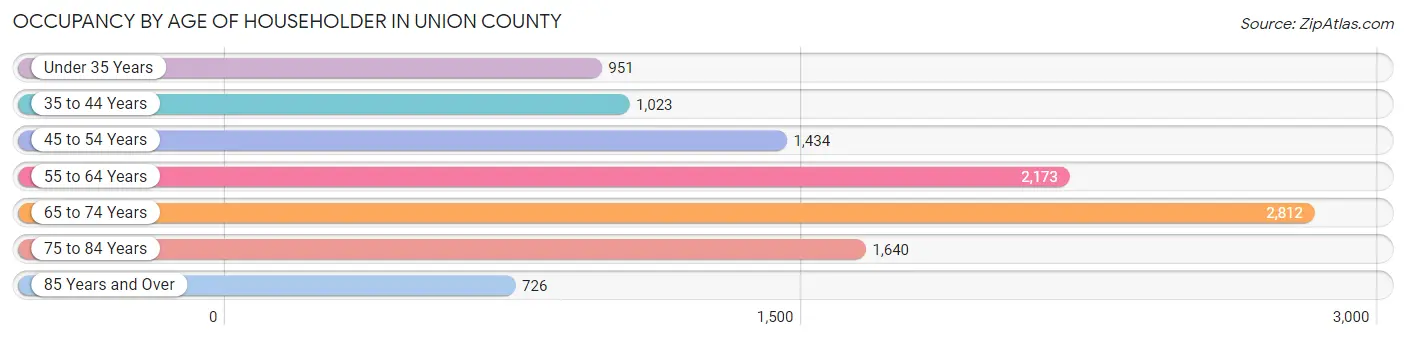
| Age Bracket | # Households | % Households |
| Under 35 Years | 951 | 8.8% |
| 35 to 44 Years | 1,023 | 9.5% |
| 45 to 54 Years | 1,434 | 13.3% |
| 55 to 64 Years | 2,173 | 20.2% |
| 65 to 74 Years | 2,812 | 26.1% |
| 75 to 84 Years | 1,640 | 15.2% |
| 85 Years and Over | 726 | 6.8% |
| Total | 10,759 | 100.0% |
Housing Finances in Union County
Median Income by Occupancy in Union County
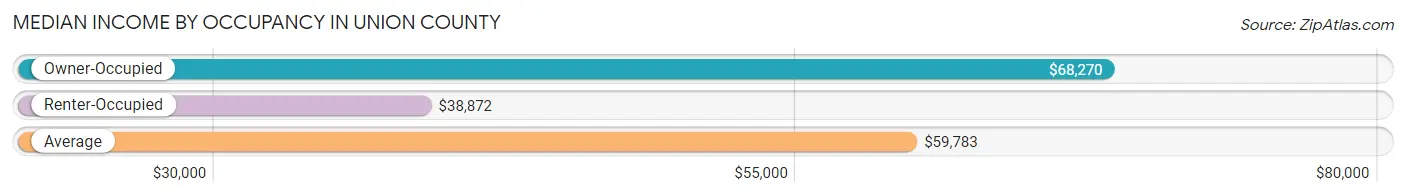
| Occupancy Type | # Households | Median Income |
| Owner-Occupied | 8,755 (81.4%) | $68,270 |
| Renter-Occupied | 2,004 (18.6%) | $38,872 |
| Average | 10,759 (100.0%) | $59,783 |
Occupancy by Householder Income Bracket in Union County
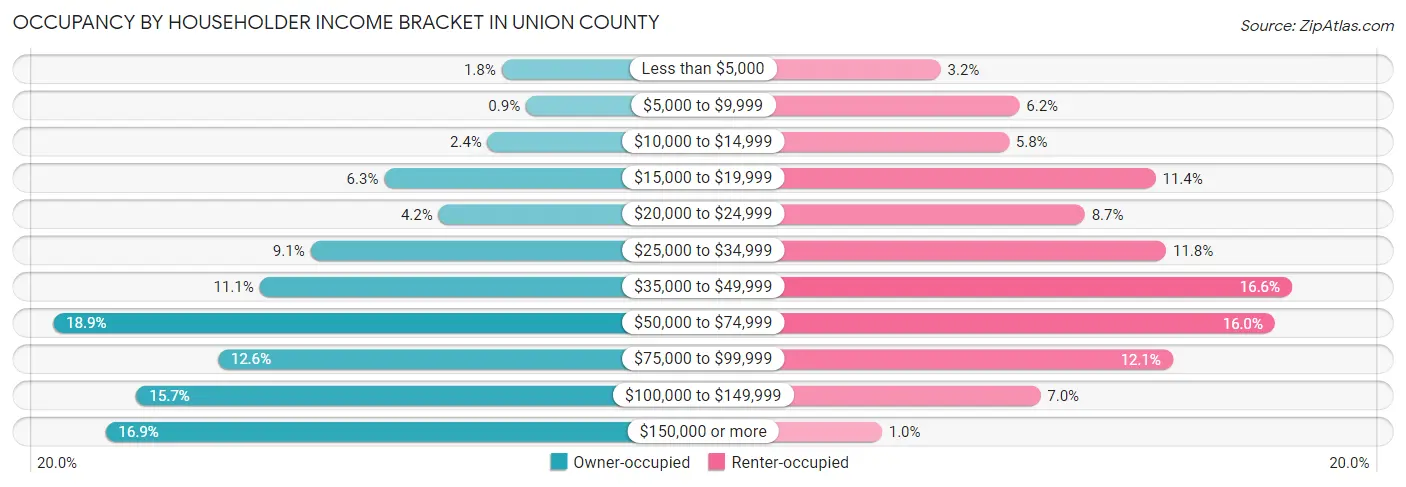
| Income Bracket | Owner-occupied | Renter-occupied |
| Less than $5,000 | 160 (1.8%) | 65 (3.2%) |
| $5,000 to $9,999 | 79 (0.9%) | 125 (6.2%) |
| $10,000 to $14,999 | 207 (2.4%) | 117 (5.8%) |
| $15,000 to $19,999 | 552 (6.3%) | 229 (11.4%) |
| $20,000 to $24,999 | 370 (4.2%) | 175 (8.7%) |
| $25,000 to $34,999 | 798 (9.1%) | 237 (11.8%) |
| $35,000 to $49,999 | 967 (11.1%) | 333 (16.6%) |
| $50,000 to $74,999 | 1,656 (18.9%) | 320 (16.0%) |
| $75,000 to $99,999 | 1,107 (12.6%) | 242 (12.1%) |
| $100,000 to $149,999 | 1,378 (15.7%) | 141 (7.0%) |
| $150,000 or more | 1,481 (16.9%) | 20 (1.0%) |
| Total | 8,755 (100.0%) | 2,004 (100.0%) |
Monthly Housing Cost Tiers in Union County
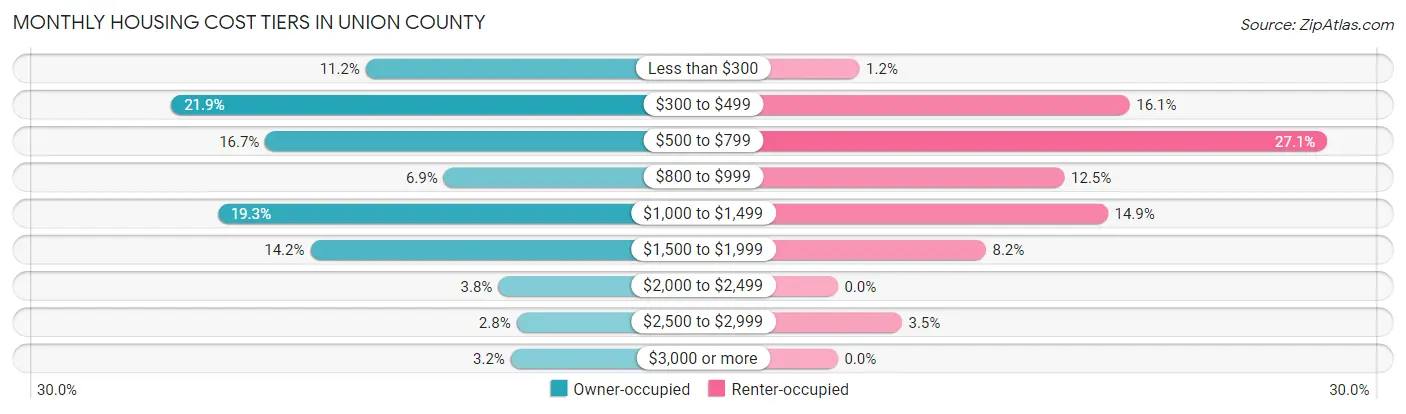
| Monthly Cost | Owner-occupied | Renter-occupied |
| Less than $300 | 977 (11.2%) | 24 (1.2%) |
| $300 to $499 | 1,917 (21.9%) | 323 (16.1%) |
| $500 to $799 | 1,463 (16.7%) | 542 (27.1%) |
| $800 to $999 | 601 (6.9%) | 251 (12.5%) |
| $1,000 to $1,499 | 1,692 (19.3%) | 299 (14.9%) |
| $1,500 to $1,999 | 1,245 (14.2%) | 164 (8.2%) |
| $2,000 to $2,499 | 336 (3.8%) | 0 (0.0%) |
| $2,500 to $2,999 | 248 (2.8%) | 71 (3.5%) |
| $3,000 or more | 276 (3.2%) | 0 (0.0%) |
| Total | 8,755 (100.0%) | 2,004 (100.0%) |
Physical Housing Characteristics in Union County
Housing Structures in Union County
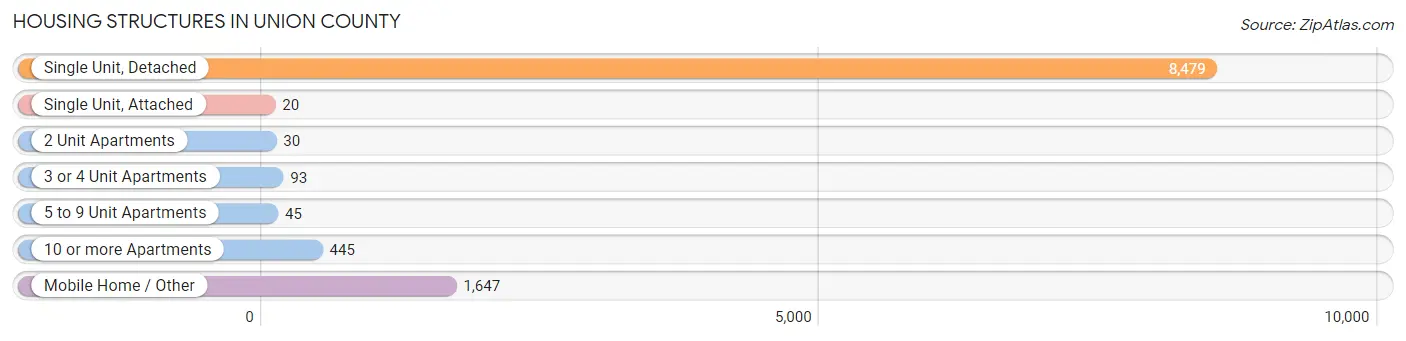
| Structure Type | # Housing Units | % Housing Units |
| Single Unit, Detached | 8,479 | 78.8% |
| Single Unit, Attached | 20 | 0.2% |
| 2 Unit Apartments | 30 | 0.3% |
| 3 or 4 Unit Apartments | 93 | 0.9% |
| 5 to 9 Unit Apartments | 45 | 0.4% |
| 10 or more Apartments | 445 | 4.1% |
| Mobile Home / Other | 1,647 | 15.3% |
| Total | 10,759 | 100.0% |
Housing Structures by Occupancy in Union County

| Structure Type | Owner-occupied | Renter-occupied |
| Single Unit, Detached | 7,499 (88.4%) | 980 (11.6%) |
| Single Unit, Attached | 20 (100.0%) | 0 (0.0%) |
| 2 Unit Apartments | 6 (20.0%) | 24 (80.0%) |
| 3 or 4 Unit Apartments | 1 (1.1%) | 92 (98.9%) |
| 5 to 9 Unit Apartments | 0 (0.0%) | 45 (100.0%) |
| 10 or more Apartments | 0 (0.0%) | 445 (100.0%) |
| Mobile Home / Other | 1,229 (74.6%) | 418 (25.4%) |
| Total | 8,755 (81.4%) | 2,004 (18.6%) |
Housing Structures by Number of Rooms in Union County
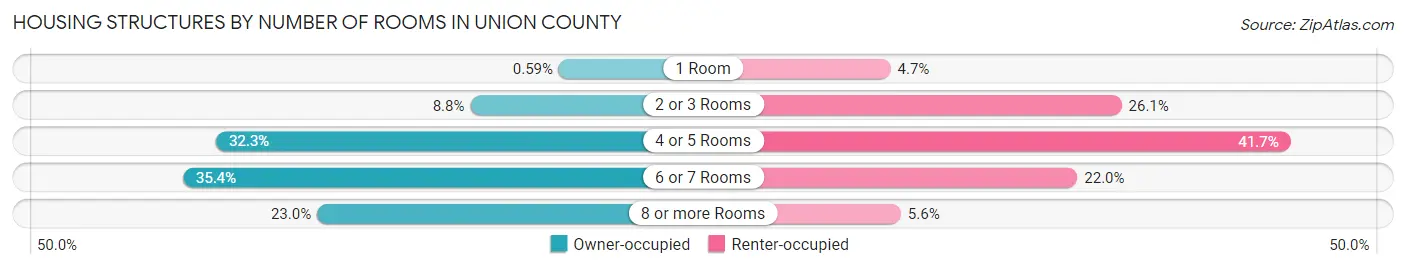
| Number of Rooms | Owner-occupied | Renter-occupied |
| 1 Room | 52 (0.6%) | 94 (4.7%) |
| 2 or 3 Rooms | 769 (8.8%) | 522 (26.1%) |
| 4 or 5 Rooms | 2,828 (32.3%) | 835 (41.7%) |
| 6 or 7 Rooms | 3,096 (35.4%) | 440 (22.0%) |
| 8 or more Rooms | 2,010 (23.0%) | 113 (5.6%) |
| Total | 8,755 (100.0%) | 2,004 (100.0%) |
Housing Structure by Heating Type in Union County
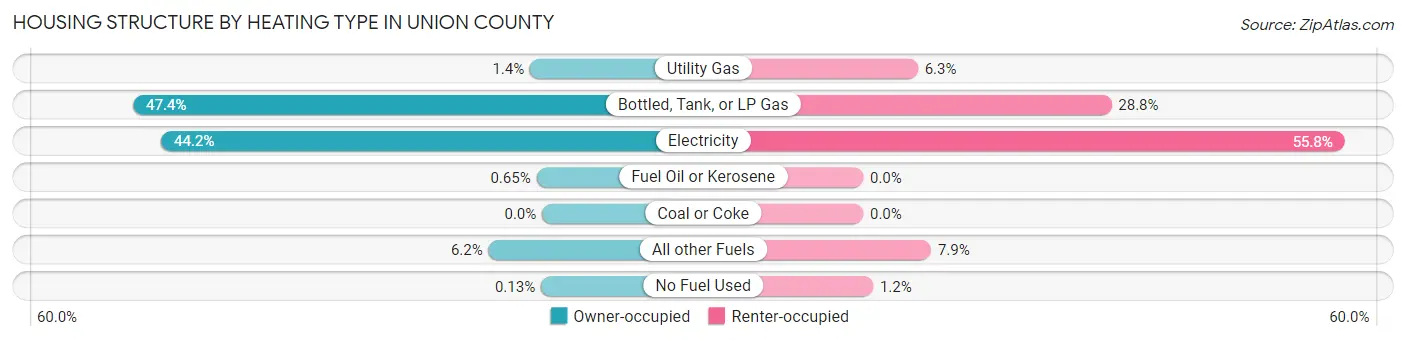
| Heating Type | Owner-occupied | Renter-occupied |
| Utility Gas | 123 (1.4%) | 127 (6.3%) |
| Bottled, Tank, or LP Gas | 4,152 (47.4%) | 577 (28.8%) |
| Electricity | 3,868 (44.2%) | 1,119 (55.8%) |
| Fuel Oil or Kerosene | 57 (0.6%) | 0 (0.0%) |
| Coal or Coke | 0 (0.0%) | 0 (0.0%) |
| All other Fuels | 544 (6.2%) | 158 (7.9%) |
| No Fuel Used | 11 (0.1%) | 23 (1.1%) |
| Total | 8,755 (100.0%) | 2,004 (100.0%) |
Household Vehicle Usage in Union County
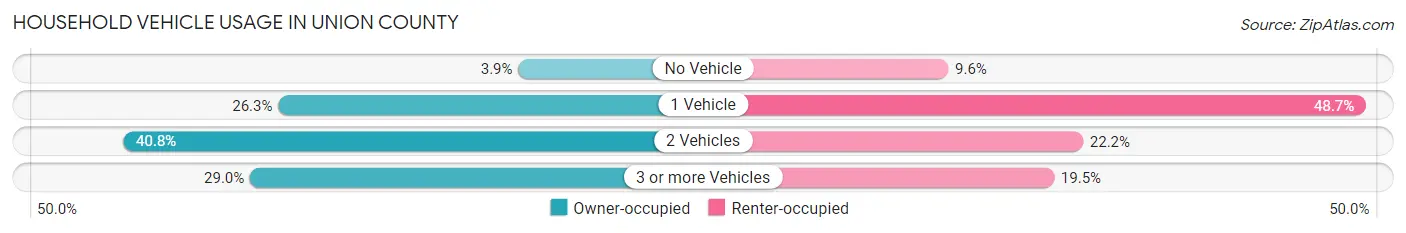
| Vehicles per Household | Owner-occupied | Renter-occupied |
| No Vehicle | 342 (3.9%) | 193 (9.6%) |
| 1 Vehicle | 2,304 (26.3%) | 975 (48.6%) |
| 2 Vehicles | 3,574 (40.8%) | 445 (22.2%) |
| 3 or more Vehicles | 2,535 (28.9%) | 391 (19.5%) |
| Total | 8,755 (100.0%) | 2,004 (100.0%) |
Real Estate & Mortgages in Union County
Real Estate and Mortgage Overview in Union County
| Characteristic | Without Mortgage | With Mortgage |
| Housing Units | 4,505 | 4,250 |
| Median Property Value | $218,100 | $278,400 |
| Median Household Income | $58,887 | $1,000 |
| Monthly Housing Costs | $432 | $276 |
| Real Estate Taxes | $1,220 | $289 |
Property Value by Mortgage Status in Union County
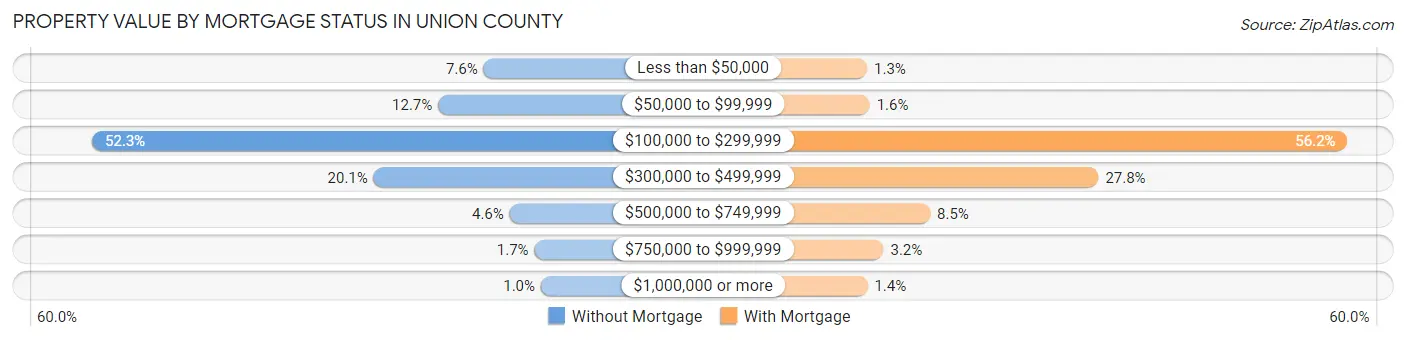
| Property Value | Without Mortgage | With Mortgage |
| Less than $50,000 | 340 (7.5%) | 56 (1.3%) |
| $50,000 to $99,999 | 574 (12.7%) | 69 (1.6%) |
| $100,000 to $299,999 | 2,356 (52.3%) | 2,389 (56.2%) |
| $300,000 to $499,999 | 906 (20.1%) | 1,180 (27.8%) |
| $500,000 to $749,999 | 206 (4.6%) | 362 (8.5%) |
| $750,000 to $999,999 | 78 (1.7%) | 136 (3.2%) |
| $1,000,000 or more | 45 (1.0%) | 58 (1.4%) |
| Total | 4,505 (100.0%) | 4,250 (100.0%) |
Household Income by Mortgage Status in Union County

| Household Income | Without Mortgage | With Mortgage |
| Less than $10,000 | 180 (4.0%) | 77 (1.8%) |
| $10,000 to $24,999 | 729 (16.2%) | 59 (1.4%) |
| $25,000 to $34,999 | 491 (10.9%) | 400 (9.4%) |
| $35,000 to $49,999 | 487 (10.8%) | 307 (7.2%) |
| $50,000 to $74,999 | 850 (18.9%) | 480 (11.3%) |
| $75,000 to $99,999 | 568 (12.6%) | 806 (19.0%) |
| $100,000 to $149,999 | 719 (16.0%) | 539 (12.7%) |
| $150,000 or more | 481 (10.7%) | 659 (15.5%) |
| Total | 4,505 (100.0%) | 4,250 (100.0%) |
Property Value to Household Income Ratio in Union County
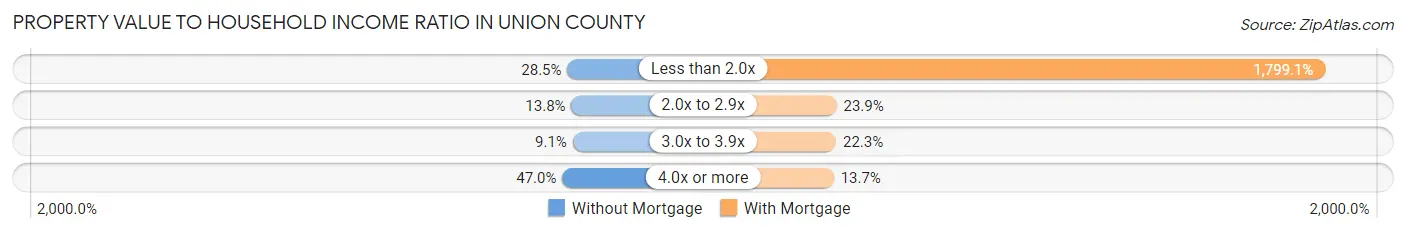
| Value-to-Income Ratio | Without Mortgage | With Mortgage |
| Less than 2.0x | 1,285 (28.5%) | 76,460 (1,799.1%) |
| 2.0x to 2.9x | 622 (13.8%) | 1,017 (23.9%) |
| 3.0x to 3.9x | 411 (9.1%) | 946 (22.3%) |
| 4.0x or more | 2,115 (46.9%) | 581 (13.7%) |
| Total | 4,505 (100.0%) | 4,250 (100.0%) |
Real Estate Taxes by Mortgage Status in Union County
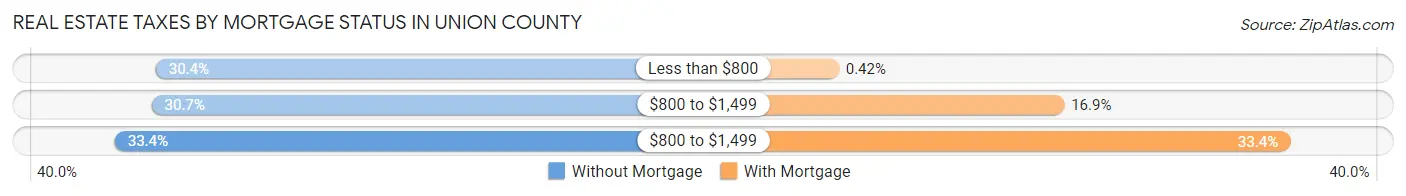
| Property Taxes | Without Mortgage | With Mortgage |
| Less than $800 | 1,370 (30.4%) | 18 (0.4%) |
| $800 to $1,499 | 1,384 (30.7%) | 718 (16.9%) |
| $800 to $1,499 | 1,505 (33.4%) | 1,419 (33.4%) |
| Total | 4,505 (100.0%) | 4,250 (100.0%) |
Health & Disability in Union County
Health Insurance Coverage by Age in Union County

| Age Bracket | With Coverage | Without Coverage |
| Under 6 Years | 978 (83.9%) | 188 (16.1%) |
| 6 to 18 Years | 2,682 (89.9%) | 301 (10.1%) |
| 19 to 25 Years | 966 (80.8%) | 230 (19.2%) |
| 26 to 34 Years | 1,613 (82.7%) | 338 (17.3%) |
| 35 to 44 Years | 1,398 (69.8%) | 605 (30.2%) |
| 45 to 54 Years | 2,217 (83.3%) | 444 (16.7%) |
| 55 to 64 Years | 3,602 (84.8%) | 644 (15.2%) |
| 65 to 74 Years | 4,854 (99.6%) | 18 (0.4%) |
| 75 Years and older | 3,216 (99.7%) | 11 (0.3%) |
| Total | 21,526 (88.6%) | 2,779 (11.4%) |
Health Insurance Coverage by Citizenship Status in Union County
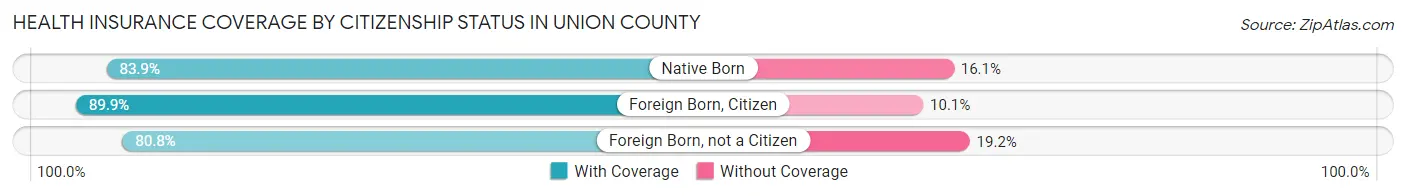
| Citizenship Status | With Coverage | Without Coverage |
| Native Born | 978 (83.9%) | 188 (16.1%) |
| Foreign Born, Citizen | 2,682 (89.9%) | 301 (10.1%) |
| Foreign Born, not a Citizen | 966 (80.8%) | 230 (19.2%) |
Health Insurance Coverage by Household Income in Union County

| Household Income | With Coverage | Without Coverage |
| Under $25,000 | 2,520 (88.7%) | 322 (11.3%) |
| $25,000 to $49,999 | 3,881 (78.7%) | 1,047 (21.2%) |
| $50,000 to $74,999 | 3,946 (86.4%) | 624 (13.7%) |
| $75,000 to $99,999 | 3,228 (93.8%) | 214 (6.2%) |
| $100,000 and over | 7,925 (93.3%) | 568 (6.7%) |
Public vs Private Health Insurance Coverage by Age in Union County
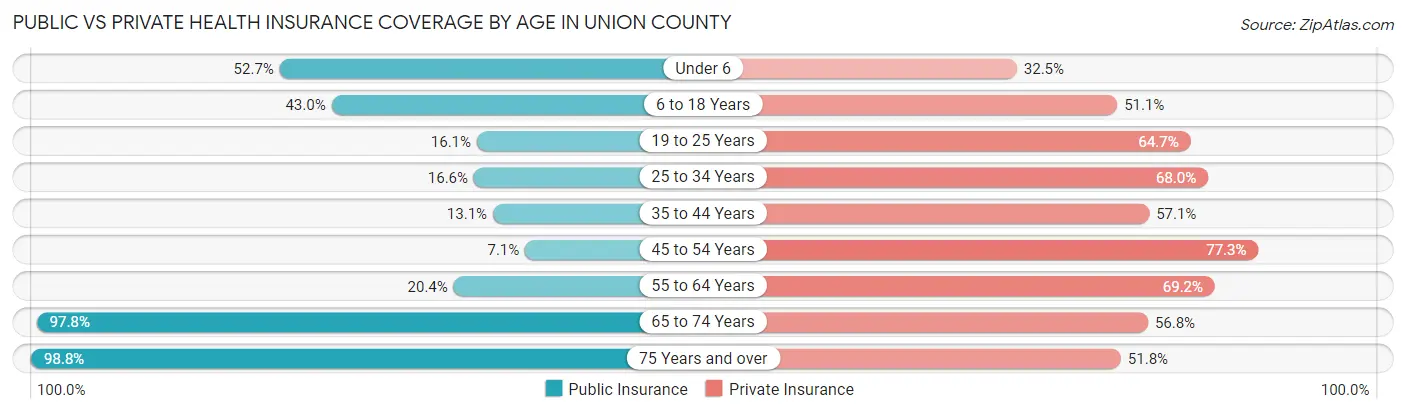
| Age Bracket | Public Insurance | Private Insurance |
| Under 6 | 614 (52.7%) | 379 (32.5%) |
| 6 to 18 Years | 1,284 (43.0%) | 1,525 (51.1%) |
| 19 to 25 Years | 192 (16.1%) | 774 (64.7%) |
| 25 to 34 Years | 324 (16.6%) | 1,326 (68.0%) |
| 35 to 44 Years | 262 (13.1%) | 1,143 (57.1%) |
| 45 to 54 Years | 189 (7.1%) | 2,057 (77.3%) |
| 55 to 64 Years | 865 (20.4%) | 2,940 (69.2%) |
| 65 to 74 Years | 4,763 (97.8%) | 2,769 (56.8%) |
| 75 Years and over | 3,189 (98.8%) | 1,672 (51.8%) |
| Total | 11,682 (48.1%) | 14,585 (60.0%) |
Disability Status by Sex by Age in Union County
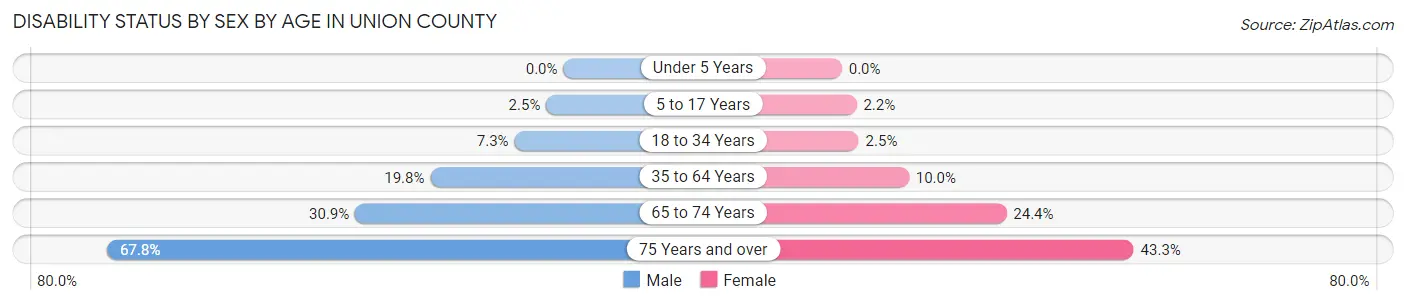
| Age Bracket | Male | Female |
| Under 5 Years | 0 (0.0%) | 0 (0.0%) |
| 5 to 17 Years | 37 (2.5%) | 30 (2.2%) |
| 18 to 34 Years | 131 (7.3%) | 43 (2.5%) |
| 35 to 64 Years | 849 (19.8%) | 459 (10.0%) |
| 65 to 74 Years | 717 (30.9%) | 624 (24.4%) |
| 75 Years and over | 1,053 (67.8%) | 725 (43.3%) |
Disability Class by Sex by Age in Union County
Disability Class: Hearing Difficulty
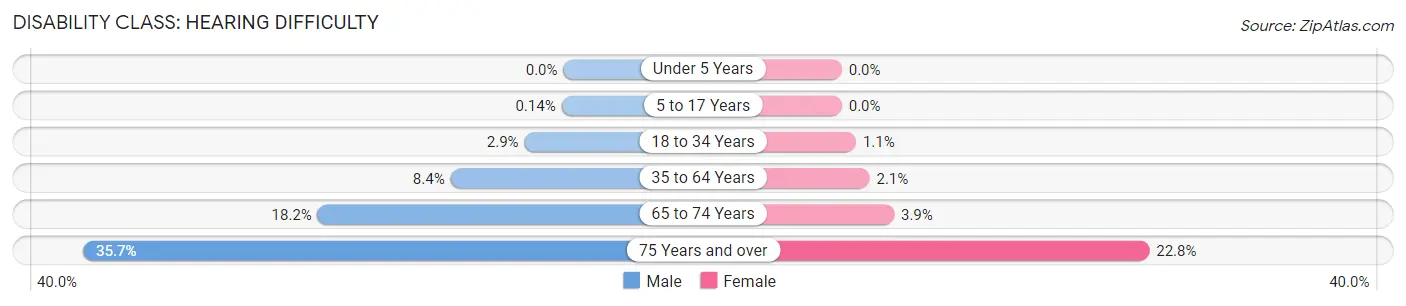
| Age Bracket | Male | Female |
| Under 5 Years | 0 (0.0%) | 0 (0.0%) |
| 5 to 17 Years | 2 (0.1%) | 0 (0.0%) |
| 18 to 34 Years | 52 (2.9%) | 18 (1.1%) |
| 35 to 64 Years | 360 (8.4%) | 95 (2.1%) |
| 65 to 74 Years | 423 (18.2%) | 99 (3.9%) |
| 75 Years and over | 554 (35.6%) | 382 (22.8%) |
Disability Class: Vision Difficulty
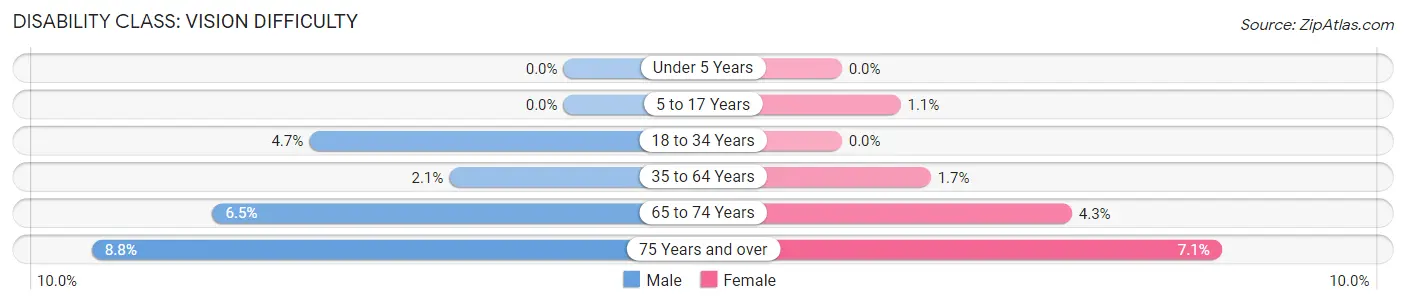
| Age Bracket | Male | Female |
| Under 5 Years | 0 (0.0%) | 0 (0.0%) |
| 5 to 17 Years | 0 (0.0%) | 15 (1.1%) |
| 18 to 34 Years | 85 (4.7%) | 0 (0.0%) |
| 35 to 64 Years | 91 (2.1%) | 76 (1.7%) |
| 65 to 74 Years | 151 (6.5%) | 109 (4.3%) |
| 75 Years and over | 136 (8.7%) | 118 (7.0%) |
Disability Class: Cognitive Difficulty

| Age Bracket | Male | Female |
| 5 to 17 Years | 30 (2.1%) | 16 (1.2%) |
| 18 to 34 Years | 131 (7.3%) | 25 (1.5%) |
| 35 to 64 Years | 160 (3.7%) | 162 (3.5%) |
| 65 to 74 Years | 118 (5.1%) | 73 (2.9%) |
| 75 Years and over | 210 (13.5%) | 102 (6.1%) |
Disability Class: Ambulatory Difficulty
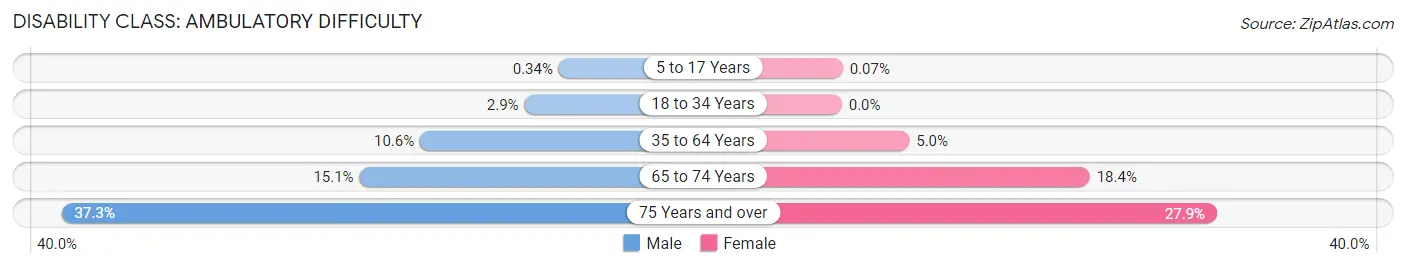
| Age Bracket | Male | Female |
| 5 to 17 Years | 5 (0.3%) | 1 (0.1%) |
| 18 to 34 Years | 52 (2.9%) | 0 (0.0%) |
| 35 to 64 Years | 457 (10.6%) | 231 (5.0%) |
| 65 to 74 Years | 351 (15.1%) | 470 (18.4%) |
| 75 Years and over | 579 (37.3%) | 466 (27.9%) |
Disability Class: Self-Care Difficulty
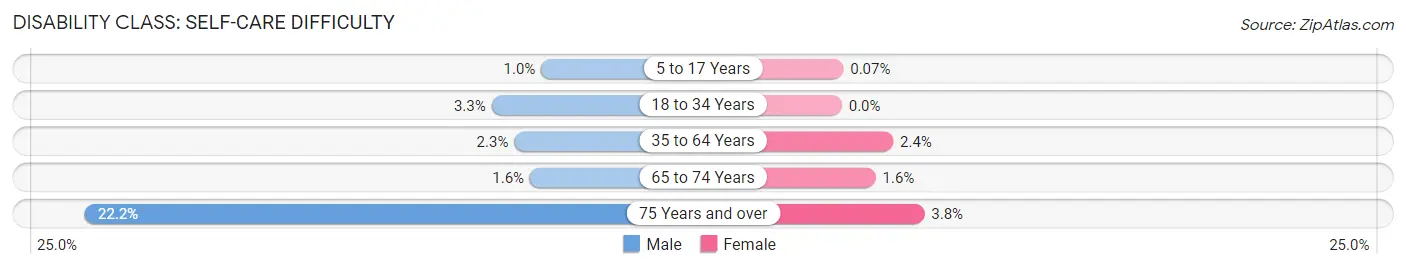
| Age Bracket | Male | Female |
| 5 to 17 Years | 15 (1.0%) | 1 (0.1%) |
| 18 to 34 Years | 60 (3.3%) | 0 (0.0%) |
| 35 to 64 Years | 98 (2.3%) | 110 (2.4%) |
| 65 to 74 Years | 36 (1.5%) | 40 (1.6%) |
| 75 Years and over | 345 (22.2%) | 64 (3.8%) |
Technology Access in Union County
Computing Device Access in Union County
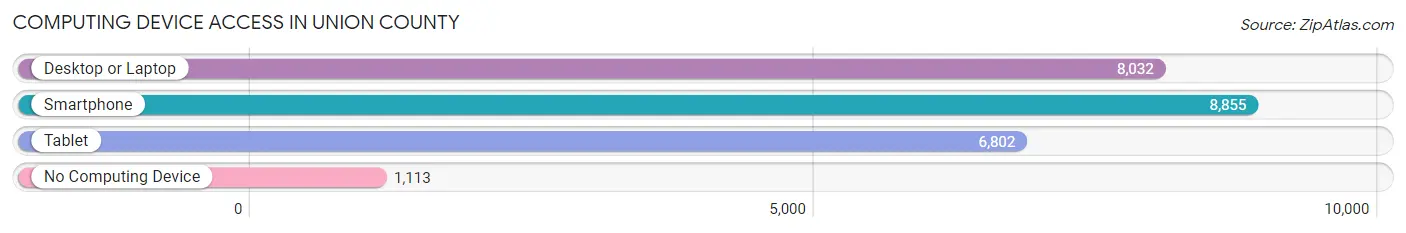
| Device Type | # Households | % Households |
| Desktop or Laptop | 8,032 | 74.7% |
| Smartphone | 8,855 | 82.3% |
| Tablet | 6,802 | 63.2% |
| No Computing Device | 1,113 | 10.3% |
| Total | 10,759 | 100.0% |
Internet Access in Union County
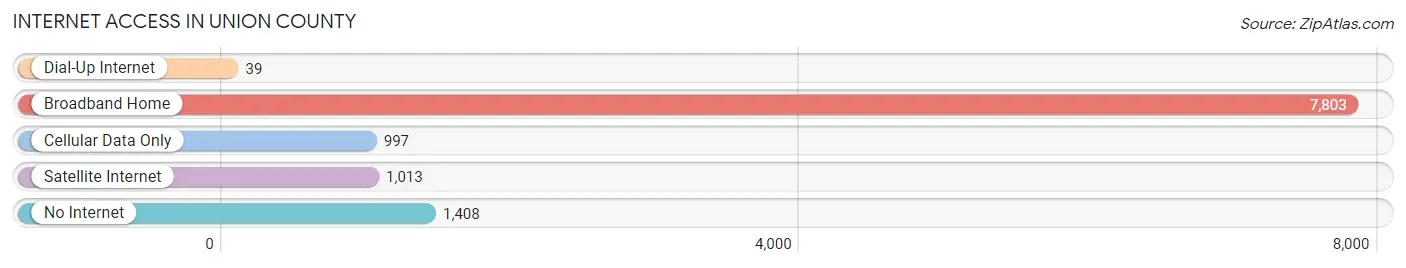
| Internet Type | # Households | % Households |
| Dial-Up Internet | 39 | 0.4% |
| Broadband Home | 7,803 | 72.5% |
| Cellular Data Only | 997 | 9.3% |
| Satellite Internet | 1,013 | 9.4% |
| No Internet | 1,408 | 13.1% |
| Total | 10,759 | 100.0% |
Union County Summary
Introduction
Union County is located in the northern part of the state of Georgia, in the foothills of the Appalachian Mountains. It is bordered by Towns County to the north, Lumpkin County to the east, White County to the south, and Fannin County to the west. The county seat is Blairsville, and the county has a population of approximately 23,000 people.
History
Union County was created in 1832 from parts of Cherokee, Lumpkin, and White counties. It was named for the union of the three counties. The county was originally part of the Cherokee Nation, and the area was home to many Cherokee villages. The county was also home to the first gold rush in the United States, which began in 1828.
The county was home to many Confederate soldiers during the Civil War, and the county was the site of several battles. After the war, the county was home to many freed slaves, who established churches and schools.
Geography
Union County is located in the northern part of the state of Georgia, in the foothills of the Appalachian Mountains. The county is mostly mountainous, with the highest point being Brasstown Bald, which is 4,784 feet above sea level. The county is home to many rivers and streams, including the Nottely River, the Hemptown Creek, and the Toccoa River.
The county is home to many state parks and forests, including Vogel State Park, Chattahoochee National Forest, and Brasstown Bald. The county is also home to many lakes, including Lake Nottely, Lake Chatuge, and Lake Seed.
Economy
Union County has a diverse economy, with the largest industries being tourism, manufacturing, and agriculture. The county is home to many tourist attractions, including Vogel State Park, Brasstown Bald, and the Nottely River. The county is also home to many manufacturing companies, including a carpet mill, a furniture factory, and a paper mill.
Agriculture is also an important part of the county’s economy, with the main crops being corn, soybeans, and hay. The county is also home to many livestock farms, including cattle, sheep, and poultry.
Demographics
As of the 2010 census, the population of Union County was 23,356. The racial makeup of the county was 95.3% White, 1.7% Black or African American, 0.4% Native American, 0.3% Asian, 0.1% Pacific Islander, 1.2% from other races, and 1.1% from two or more races. Hispanic or Latino of any race were 3.2% of the population.
The median income for a household in the county was $35,945, and the median income for a family was $41,945. The per capita income for the county was $19,845. About 14.2% of families and 17.7% of the population were below the poverty line, including 25.2% of those under age 18 and 11.2% of those age 65 or over.
Conclusion
Union County is a diverse county located in the northern part of the state of Georgia. It is home to many tourist attractions, manufacturing companies, and agricultural operations. The county has a population of approximately 23,000 people, and the median income for a household is $35,945. Union County is a great place to live, work, and visit.
Common Questions
What is the Total Population of Union County?
Total Population of Union County is 24,880.
What is the Total Male Population of Union County?
Total Male Population of Union County is 12,345.
What is the Total Female Population of Union County?
Total Female Population of Union County is 12,535.
What is the Ratio of Males per 100 Females in Union County?
There are 98.48 Males per 100 Females in Union County.
What is the Ratio of Females per 100 Males in Union County?
There are 101.54 Females per 100 Males in Union County.
What is the Median Population Age in Union County?
Median Population Age in Union County is 55.9 Years.
What is the Average Family Size in Union County
Average Family Size in Union County is 2.7 People.
What is the Average Household Size in Union County
Average Household Size in Union County is 2.3 People.
What is Per Capita Income in Union County?
Per Capita income in Union County is $37,709.
What is the Median Family Income in Union County?
Median Family Income in Union County is $79,438.
What is the Median Household income in Union County?
Median Household Income in Union County is $59,783.
What is Income or Wage Gap in Union County?
Income or Wage Gap in Union County is 18.4%.
Women in Union County earn 81.6 cents for every dollar earned by a man.
What is Inequality or Gini Index in Union County?
Inequality or Gini Index in Union County is 0.48.
How Large is the Labor Force in Union County?
There are 10,010 People in the Labor Forcein in Union County.
What is the Percentage of People in the Labor Force in Union County?
46.3% of People are in the Labor Force in Union County.
What is the Unemployment Rate in Union County?
Unemployment Rate in Union County is 2.7%.