Seminole County, GA
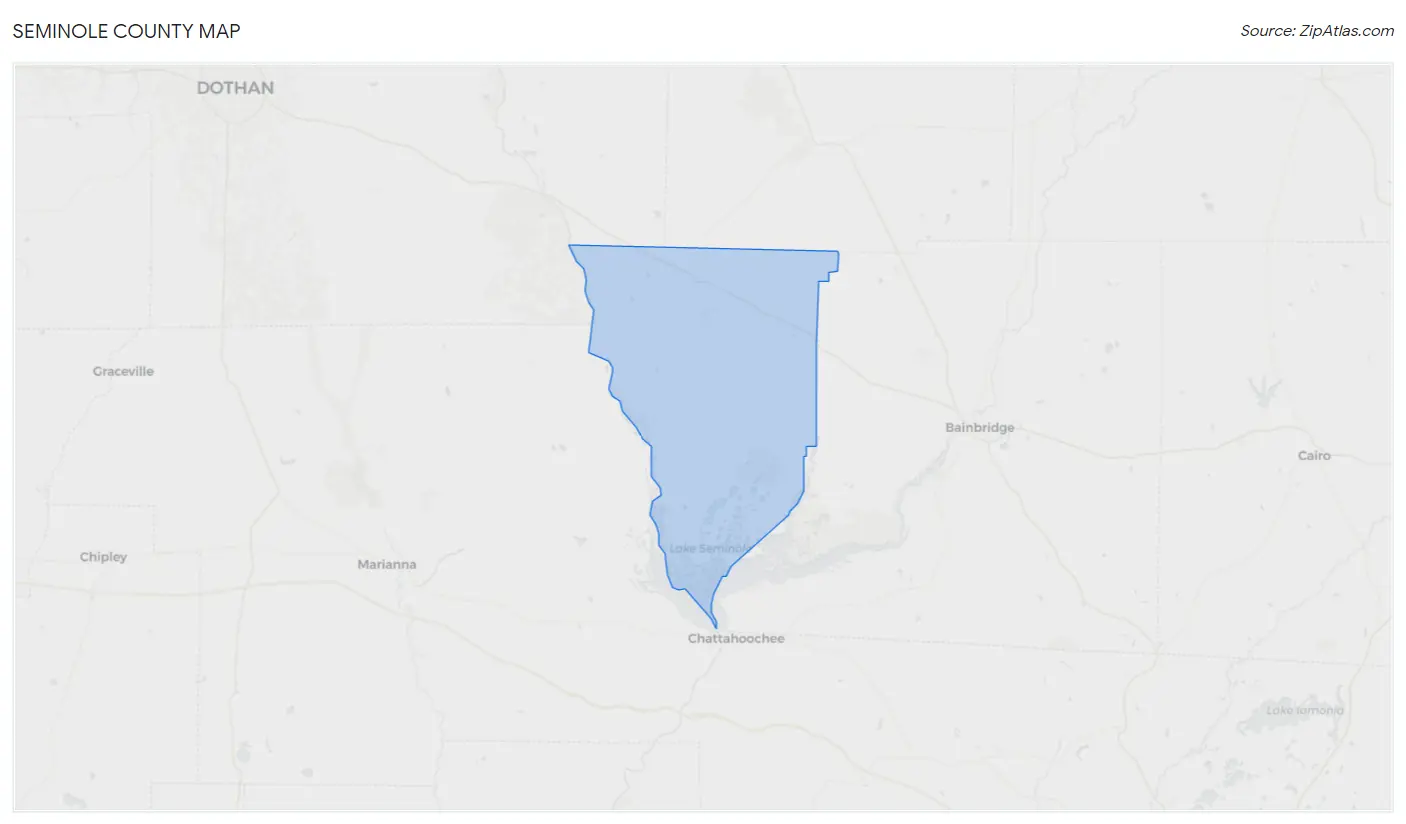
Seminole County Map
Seminole County Overview
9,117
TOTAL POPULATION
4,425
MALE POPULATION
4,692
FEMALE POPULATION
94.31
MALES / 100 FEMALES
106.03
FEMALES / 100 MALES
45.0
MEDIAN AGE
3.1
AVG FAMILY SIZE
2.5
AVG HOUSEHOLD SIZE
$36,184
PER CAPITA INCOME
$60,408
AVG FAMILY INCOME
$46,063
AVG HOUSEHOLD INCOME
28.1%
WAGE / INCOME GAP [ % ]
71.9¢/ $1
WAGE / INCOME GAP [ $ ]
$10,162
FAMILY INCOME DEFICIT
0.55
INEQUALITY / GINI INDEX
3,507
LABOR FORCE [ PEOPLE ]
46.8%
PERCENT IN LABOR FORCE
5.8%
UNEMPLOYMENT RATE
Seminole County Area Codes
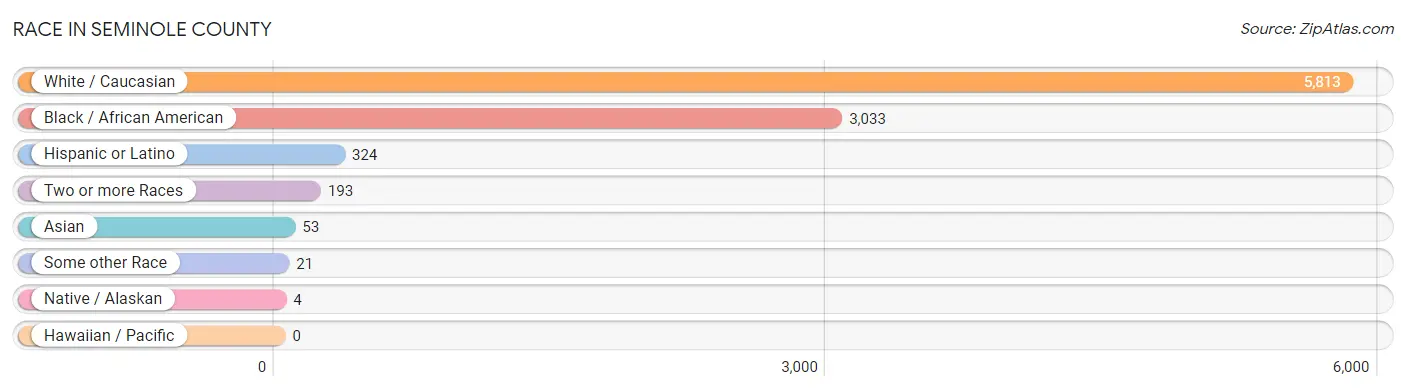
Race in Seminole County
The most populous races in Seminole County are White / Caucasian (5,813 | 63.8%), Black / African American (3,033 | 33.3%), and Hispanic or Latino (324 | 3.5%).
| Race | # Population | % Population |
| Asian | 53 | 0.6% |
| Black / African American | 3,033 | 33.3% |
| Hawaiian / Pacific | 0 | 0.0% |
| Hispanic or Latino | 324 | 3.5% |
| Native / Alaskan | 4 | 0.0% |
| White / Caucasian | 5,813 | 63.8% |
| Two or more Races | 193 | 2.1% |
| Some other Race | 21 | 0.2% |
| Total | 9,117 | 100.0% |
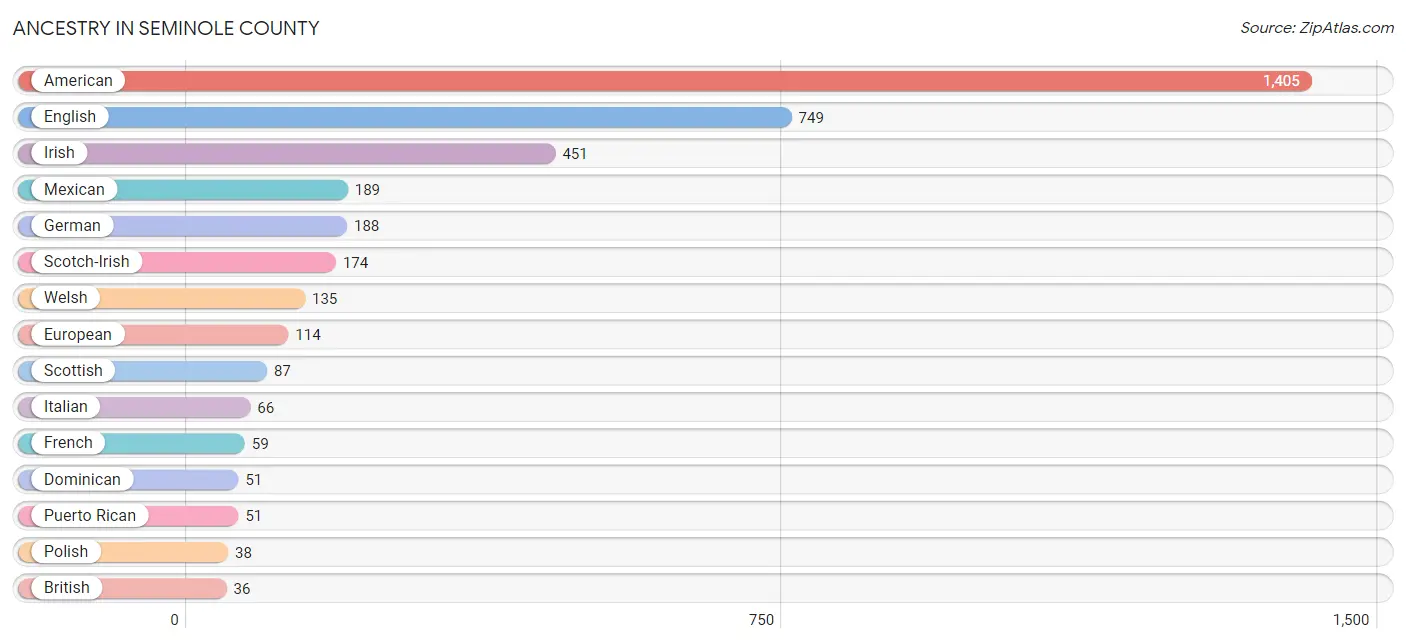
Ancestry in Seminole County
The most populous ancestries reported in Seminole County are American (1,405 | 15.4%), English (749 | 8.2%), Irish (451 | 5.0%), Mexican (189 | 2.1%), and German (188 | 2.1%), together accounting for 32.7% of all Seminole County residents.
| Ancestry | # Population | % Population |
| African | 31 | 0.3% |
| American | 1,405 | 15.4% |
| Austrian | 24 | 0.3% |
| British | 36 | 0.4% |
| Cherokee | 9 | 0.1% |
| Creek | 2 | 0.0% |
| Dominican | 51 | 0.6% |
| Dutch | 20 | 0.2% |
| English | 749 | 8.2% |
| European | 114 | 1.3% |
| French | 59 | 0.6% |
| French Canadian | 9 | 0.1% |
| German | 188 | 2.1% |
| Greek | 34 | 0.4% |
| Indian (Asian) | 1 | 0.0% |
| Irish | 451 | 5.0% |
| Italian | 66 | 0.7% |
| Korean | 9 | 0.1% |
| Lithuanian | 2 | 0.0% |
| Mexican | 189 | 2.1% |
| Northern European | 12 | 0.1% |
| Norwegian | 16 | 0.2% |
| Polish | 38 | 0.4% |
| Puerto Rican | 51 | 0.6% |
| Russian | 8 | 0.1% |
| Scandinavian | 12 | 0.1% |
| Scotch-Irish | 174 | 1.9% |
| Scottish | 87 | 0.9% |
| Seminole | 4 | 0.0% |
| Spanish | 33 | 0.4% |
| Sri Lankan | 25 | 0.3% |
| Subsaharan African | 31 | 0.3% |
| Swiss | 2 | 0.0% |
| Thai | 18 | 0.2% |
| Welsh | 135 | 1.5% | View All 35 Rows |
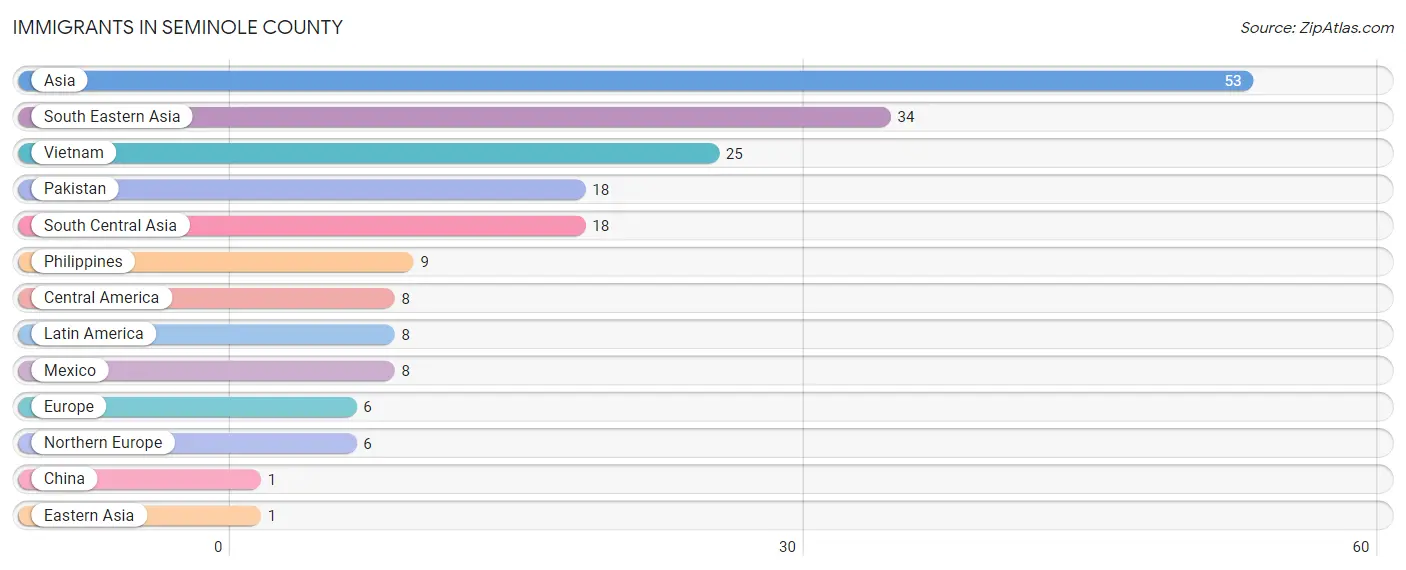
Immigrants in Seminole County
The most numerous immigrant groups reported in Seminole County came from Asia (53 | 0.6%), South Eastern Asia (34 | 0.4%), Vietnam (25 | 0.3%), Pakistan (18 | 0.2%), and South Central Asia (18 | 0.2%), together accounting for 1.6% of all Seminole County residents.
| Immigration Origin | # Population | % Population |
| Asia | 53 | 0.6% |
| Central America | 8 | 0.1% |
| China | 1 | 0.0% |
| Eastern Asia | 1 | 0.0% |
| Europe | 6 | 0.1% |
| Latin America | 8 | 0.1% |
| Mexico | 8 | 0.1% |
| Northern Europe | 6 | 0.1% |
| Pakistan | 18 | 0.2% |
| Philippines | 9 | 0.1% |
| South Central Asia | 18 | 0.2% |
| South Eastern Asia | 34 | 0.4% |
| Vietnam | 25 | 0.3% | View All 13 Rows |
Sex and Age in Seminole County
Sex and Age in Seminole County
The most populous age groups in Seminole County are 55 to 59 Years (376 | 8.5%) for men and 40 to 44 Years (473 | 10.1%) for women.

| Age Bracket | Male | Female |
| Under 5 Years | 247 (5.6%) | 144 (3.1%) |
| 5 to 9 Years | 292 (6.6%) | 143 (3.0%) |
| 10 to 14 Years | 326 (7.4%) | 327 (7.0%) |
| 15 to 19 Years | 229 (5.2%) | 223 (4.8%) |
| 20 to 24 Years | 224 (5.1%) | 264 (5.6%) |
| 25 to 29 Years | 337 (7.6%) | 277 (5.9%) |
| 30 to 34 Years | 196 (4.4%) | 183 (3.9%) |
| 35 to 39 Years | 222 (5.0%) | 196 (4.2%) |
| 40 to 44 Years | 259 (5.9%) | 473 (10.1%) |
| 45 to 49 Years | 192 (4.3%) | 214 (4.6%) |
| 50 to 54 Years | 321 (7.2%) | 282 (6.0%) |
| 55 to 59 Years | 376 (8.5%) | 405 (8.6%) |
| 60 to 64 Years | 239 (5.4%) | 355 (7.6%) |
| 65 to 69 Years | 370 (8.4%) | 415 (8.8%) |
| 70 to 74 Years | 265 (6.0%) | 213 (4.5%) |
| 75 to 79 Years | 180 (4.1%) | 356 (7.6%) |
| 80 to 84 Years | 104 (2.4%) | 109 (2.3%) |
| 85 Years and over | 46 (1.0%) | 113 (2.4%) |
| Total | 4,425 (100.0%) | 4,692 (100.0%) |
Families and Households in Seminole County
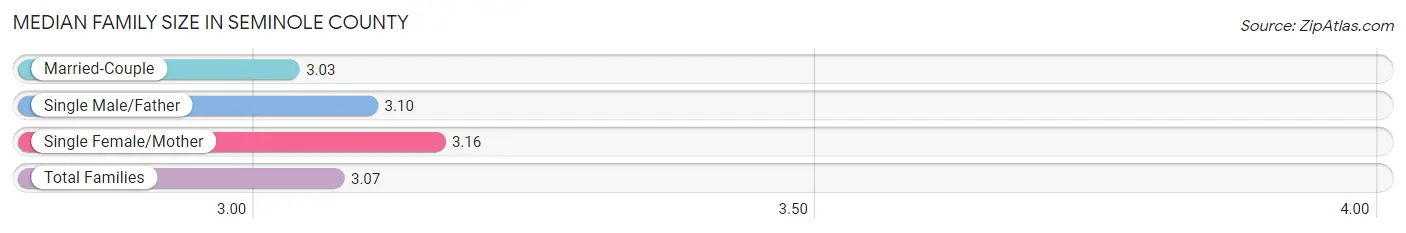
Median Family Size in Seminole County
The median family size in Seminole County is 3.07 persons per family, with single female/mother families (560 | 23.9%) accounting for the largest median family size of 3.16 persons per family. On the other hand, married-couple families (1,494 | 63.7%) represent the smallest median family size with 3.03 persons per family.
| Family Type | # Families | Family Size |
| Married-Couple | 1,494 (63.7%) | 3.03 |
| Single Male/Father | 291 (12.4%) | 3.10 |
| Single Female/Mother | 560 (23.9%) | 3.16 |
| Total Families | 2,345 (100.0%) | 3.07 |
Median Household Size in Seminole County
The median household size in Seminole County is 2.46 persons per household, with single male/father households (291 | 8.0%) accounting for the largest median household size of 3.36 persons per household. non-family households (1,308 | 35.8%) represent the smallest median household size with 1.11 persons per household.

| Household Type | # Households | Household Size |
| Married-Couple | 1,494 (40.9%) | 3.14 |
| Single Male/Father | 291 (8.0%) | 3.36 |
| Single Female/Mother | 560 (15.3%) | 3.36 |
| Non-family | 1,308 (35.8%) | 1.11 |
| Total Households | 3,653 (100.0%) | 2.46 |
Household Size by Marriage Status in Seminole County
Out of a total of 3,653 households in Seminole County, 2,345 (64.2%) are family households, while 1,308 (35.8%) are nonfamily households. The most numerous type of family households are 2-person households, comprising 1,105, and the most common type of nonfamily households are 1-person households, comprising 1,134.

| Household Size | Family Households | Nonfamily Households |
| 1-Person Households | - | 1,134 (31.0%) |
| 2-Person Households | 1,105 (30.2%) | 174 (4.8%) |
| 3-Person Households | 611 (16.7%) | 0 (0.0%) |
| 4-Person Households | 513 (14.0%) | 0 (0.0%) |
| 5-Person Households | 58 (1.6%) | 0 (0.0%) |
| 6-Person Households | 38 (1.0%) | 0 (0.0%) |
| 7+ Person Households | 20 (0.5%) | 0 (0.0%) |
| Total | 2,345 (64.2%) | 1,308 (35.8%) |
Female Fertility in Seminole County
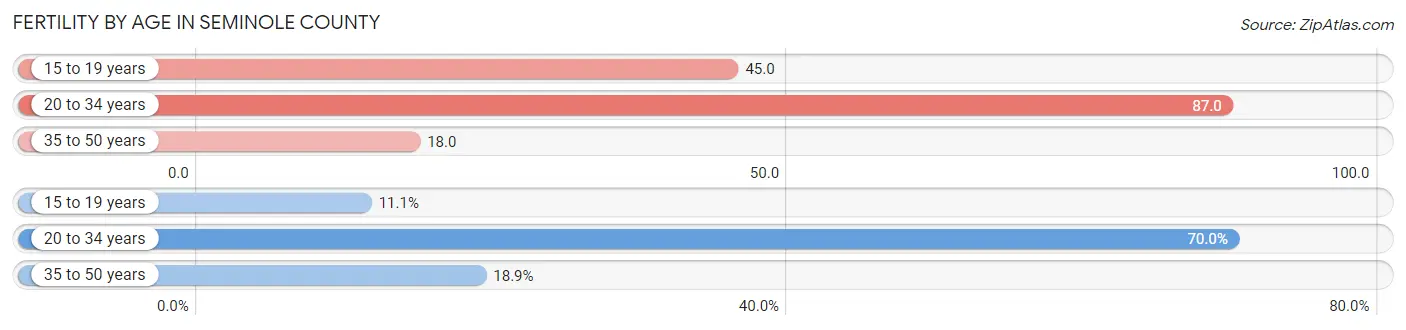
Fertility by Age in Seminole County
Average fertility rate in Seminole County is 48.0 births per 1,000 women. Women in the age bracket of 20 to 34 years have the highest fertility rate with 87.0 births per 1,000 women. Women in the age bracket of 20 to 34 years acount for 70.0% of all women with births.
| Age Bracket | Women with Births | Births / 1,000 Women |
| 15 to 19 years | 10 (11.1%) | 45.0 |
| 20 to 34 years | 63 (70.0%) | 87.0 |
| 35 to 50 years | 17 (18.9%) | 18.0 |
| Total | 90 (100.0%) | 48.0 |
Fertility by Age by Marriage Status in Seminole County
72.2% of women with births (90) in Seminole County are married. The highest percentage of unmarried women with births falls into 15 to 19 years age bracket with 100.0% of them unmarried at the time of birth, while the lowest percentage of unmarried women with births belong to 35 to 50 years age bracket with 0.0% of them unmarried.

| Age Bracket | Married | Unmarried |
| 15 to 19 years | 0 (0.0%) | 10 (100.0%) |
| 20 to 34 years | 48 (76.2%) | 15 (23.8%) |
| 35 to 50 years | 17 (100.0%) | 0 (0.0%) |
| Total | 65 (72.2%) | 25 (27.8%) |
Fertility by Education in Seminole County

| Educational Attainment | Women with Births | Births / 1,000 Women |
| Less than High School | 10 (11.1%) | 26.0 |
| High School Diploma | 22 (24.4%) | 36.0 |
| College or Associate's Degree | 52 (57.8%) | 76.0 |
| Bachelor's Degree | 6 (6.7%) | 45.0 |
| Graduate Degree | 0 (0.0%) | 0.0 |
| Total | 90 (100.0%) | 48.0 |
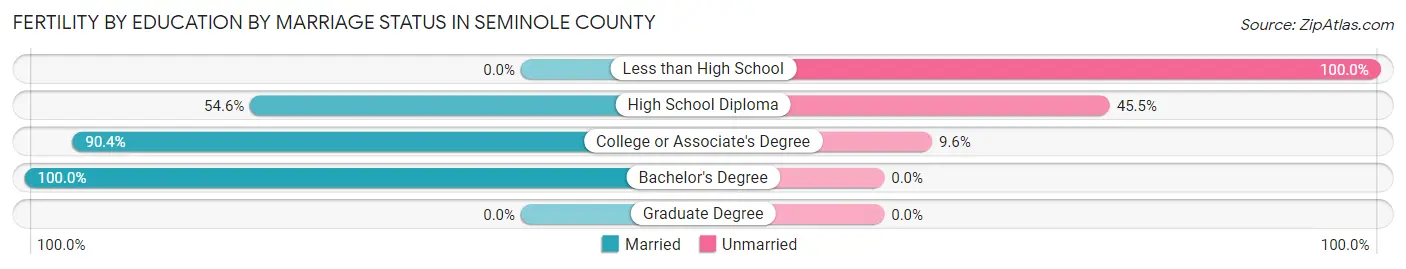
Fertility by Education by Marriage Status in Seminole County
27.8% of women with births in Seminole County are unmarried. Women with the educational attainment of bachelor's degree are most likely to be married with 100.0% of them married at childbirth, while women with the educational attainment of less than high school are least likely to be married with 100.0% of them unmarried at childbirth.
| Educational Attainment | Married | Unmarried |
| Less than High School | 0 (0.0%) | 10 (100.0%) |
| High School Diploma | 12 (54.5%) | 10 (45.5%) |
| College or Associate's Degree | 47 (90.4%) | 5 (9.6%) |
| Bachelor's Degree | 6 (100.0%) | 0 (0.0%) |
| Graduate Degree | 0 (0.0%) | 0 (0.0%) |
| Total | 65 (72.2%) | 25 (27.8%) |
Income in Seminole County
Income Overview in Seminole County
Per Capita Income in Seminole County is $36,184, while median incomes of families and households are $60,408 and $46,063 respectively.
| Characteristic | Number | Measure |
| Per Capita Income | 9,117 | $36,184 |
| Median Family Income | 2,345 | $60,408 |
| Mean Family Income | 2,345 | $92,945 |
| Median Household Income | 3,653 | $46,063 |
| Mean Household Income | 3,653 | $76,257 |
| Income Deficit | 2,345 | $10,162 |
| Wage / Income Gap (%) | 9,117 | 28.07% |
| Wage / Income Gap ($) | 9,117 | 71.93¢ per $1 |
| Gini / Inequality Index | 9,117 | 0.55 |
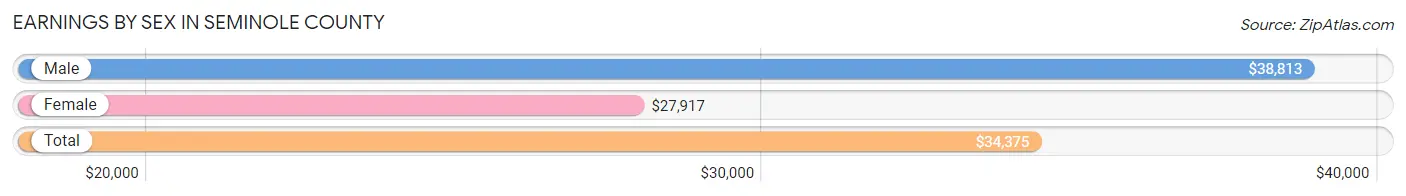
Earnings by Sex in Seminole County
Average Earnings in Seminole County are $34,375, $38,813 for men and $27,917 for women, a difference of 28.1%.
| Sex | Number | Average Earnings |
| Male | 1,923 (53.3%) | $38,813 |
| Female | 1,686 (46.7%) | $27,917 |
| Total | 3,609 (100.0%) | $34,375 |
Earnings by Sex by Income Bracket in Seminole County
The most common earnings brackets in Seminole County are $30,000 to $34,999 for men (268 | 13.9%) and $25,000 to $29,999 for women (292 | 17.3%).
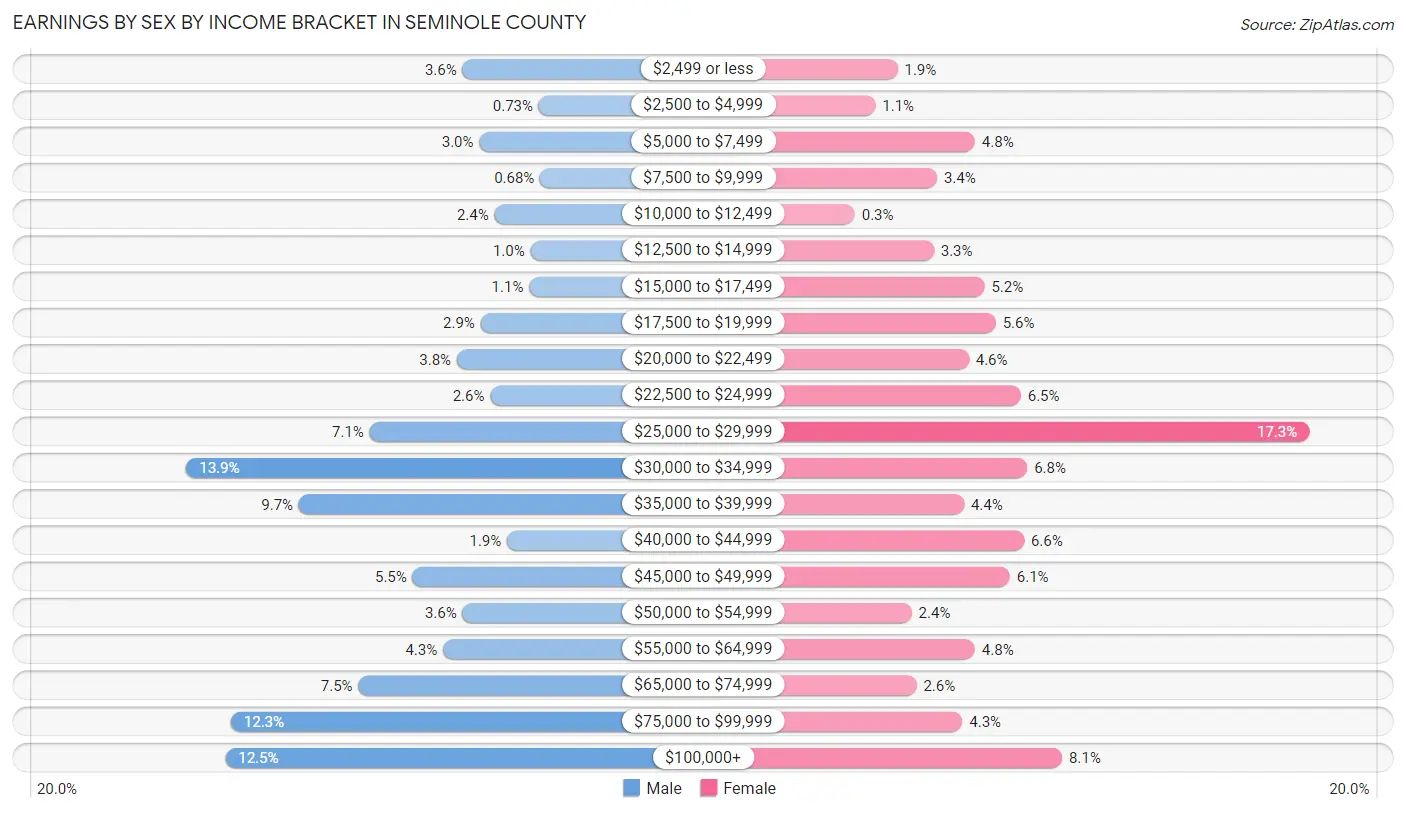
| Income | Male | Female |
| $2,499 or less | 69 (3.6%) | 32 (1.9%) |
| $2,500 to $4,999 | 14 (0.7%) | 18 (1.1%) |
| $5,000 to $7,499 | 57 (3.0%) | 81 (4.8%) |
| $7,500 to $9,999 | 13 (0.7%) | 57 (3.4%) |
| $10,000 to $12,499 | 46 (2.4%) | 5 (0.3%) |
| $12,500 to $14,999 | 20 (1.0%) | 55 (3.3%) |
| $15,000 to $17,499 | 21 (1.1%) | 87 (5.2%) |
| $17,500 to $19,999 | 56 (2.9%) | 94 (5.6%) |
| $20,000 to $22,499 | 73 (3.8%) | 77 (4.6%) |
| $22,500 to $24,999 | 49 (2.5%) | 110 (6.5%) |
| $25,000 to $29,999 | 136 (7.1%) | 292 (17.3%) |
| $30,000 to $34,999 | 268 (13.9%) | 114 (6.8%) |
| $35,000 to $39,999 | 187 (9.7%) | 74 (4.4%) |
| $40,000 to $44,999 | 37 (1.9%) | 112 (6.6%) |
| $45,000 to $49,999 | 105 (5.5%) | 103 (6.1%) |
| $50,000 to $54,999 | 69 (3.6%) | 41 (2.4%) |
| $55,000 to $64,999 | 83 (4.3%) | 81 (4.8%) |
| $65,000 to $74,999 | 144 (7.5%) | 44 (2.6%) |
| $75,000 to $99,999 | 236 (12.3%) | 73 (4.3%) |
| $100,000+ | 240 (12.5%) | 136 (8.1%) |
| Total | 1,923 (100.0%) | 1,686 (100.0%) |
Earnings by Sex by Educational Attainment in Seminole County
Average earnings in Seminole County are $47,125 for men and $29,487 for women, a difference of 37.4%. Men with an educational attainment of graduate degree enjoy the highest average annual earnings of $86,818, while those with less than high school education earn the least with $27,480. Women with an educational attainment of graduate degree earn the most with the average annual earnings of $60,500, while those with less than high school education have the smallest earnings of $9,063.
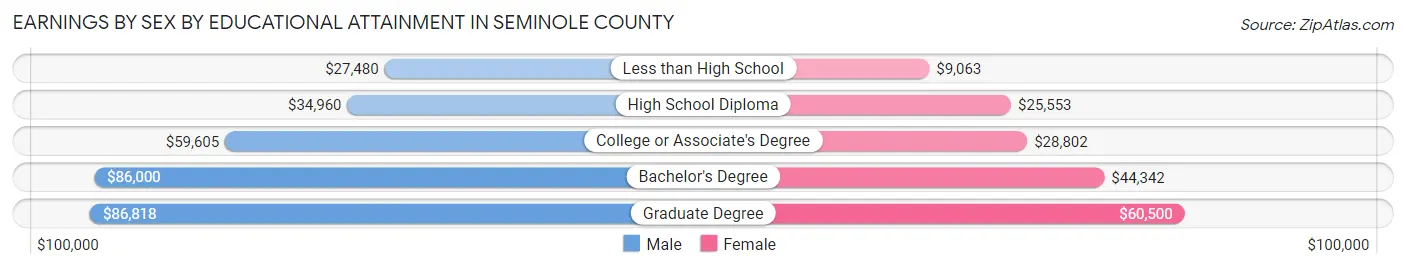
| Educational Attainment | Male Income | Female Income |
| Less than High School | $27,480 | $9,063 |
| High School Diploma | $34,960 | $25,553 |
| College or Associate's Degree | $59,605 | $28,802 |
| Bachelor's Degree | $86,000 | $44,342 |
| Graduate Degree | $86,818 | $60,500 |
| Total | $47,125 | $29,487 |
Family Income in Seminole County
Family Income Brackets in Seminole County
According to the Seminole County family income data, there are 406 families falling into the $100,000 to $149,999 income range, which is the most common income bracket and makes up 17.3% of all families. Conversely, the $200,000+ income bracket is the least frequent group with only 87 families (3.7%) belonging to this category.

| Income Bracket | # Families | % Families |
| Less than $10,000 | 152 | 6.5% |
| $10,000 to $14,999 | 113 | 4.8% |
| $15,000 to $24,999 | 171 | 7.3% |
| $25,000 to $34,999 | 220 | 9.4% |
| $35,000 to $49,999 | 368 | 15.7% |
| $50,000 to $74,999 | 396 | 16.9% |
| $75,000 to $99,999 | 270 | 11.5% |
| $100,000 to $149,999 | 406 | 17.3% |
| $150,000 to $199,999 | 164 | 7.0% |
| $200,000+ | 87 | 3.7% |
Family Income by Famaliy Size in Seminole County
6-person families (48 | 2.1%) account for the highest median family income in Seminole County with $135,431 per family, while 5-person families (42 | 1.8%) have the highest median income of $27,077 per family member.
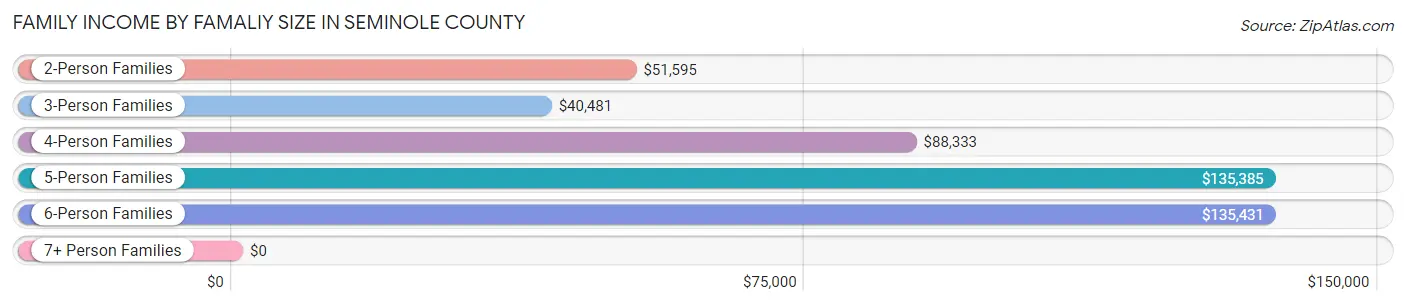
| Income Bracket | # Families | Median Income |
| 2-Person Families | 1,264 (53.9%) | $51,595 |
| 3-Person Families | 525 (22.4%) | $40,481 |
| 4-Person Families | 456 (19.5%) | $88,333 |
| 5-Person Families | 42 (1.8%) | $135,385 |
| 6-Person Families | 48 (2.1%) | $135,431 |
| 7+ Person Families | 10 (0.4%) | $0 |
| Total | 2,345 (100.0%) | $60,408 |
Family Income by Number of Earners in Seminole County
The median family income in Seminole County is $60,408, with families comprising 3+ earners (100) having the highest median family income of $140,250, while families with no earners (554) have the lowest median family income of $17,721, accounting for 4.3% and 23.6% of families, respectively.
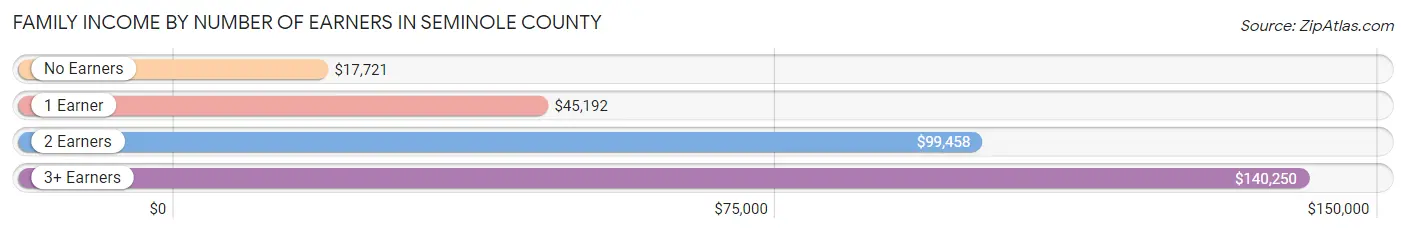
| Number of Earners | # Families | Median Income |
| No Earners | 554 (23.6%) | $17,721 |
| 1 Earner | 998 (42.6%) | $45,192 |
| 2 Earners | 693 (29.5%) | $99,458 |
| 3+ Earners | 100 (4.3%) | $140,250 |
| Total | 2,345 (100.0%) | $60,408 |
Household Income in Seminole County
Household Income Brackets in Seminole County
With 544 households falling in the category, the $50,000 to $74,999 income range is the most frequent in Seminole County, accounting for 14.9% of all households. In contrast, only 132 households (3.6%) fall into the $200,000+ income bracket, making it the least populous group.

| Income Bracket | # Households | % Households |
| Less than $10,000 | 318 | 8.7% |
| $10,000 to $14,999 | 332 | 9.1% |
| $15,000 to $24,999 | 362 | 9.9% |
| $25,000 to $34,999 | 420 | 11.5% |
| $35,000 to $49,999 | 530 | 14.5% |
| $50,000 to $74,999 | 544 | 14.9% |
| $75,000 to $99,999 | 369 | 10.1% |
| $100,000 to $149,999 | 424 | 11.6% |
| $150,000 to $199,999 | 223 | 6.1% |
| $200,000+ | 132 | 3.6% |
Household Income by Householder Age in Seminole County
The median household income in Seminole County is $46,063, with the highest median household income of $125,185 found in the 15 to 24 years age bracket for the primary householder. A total of 50 households (1.4%) fall into this category. Meanwhile, the 45 to 64 years age bracket for the primary householder has the lowest median household income of $35,833, with 1,376 households (37.7%) in this group.
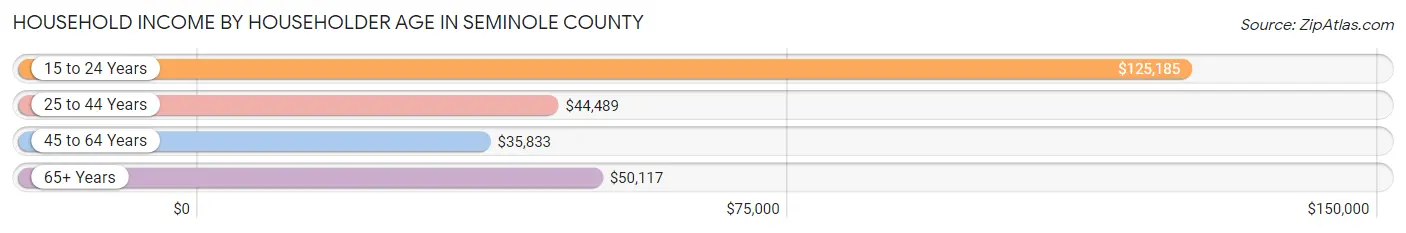
| Income Bracket | # Households | Median Income |
| 15 to 24 Years | 50 (1.4%) | $125,185 |
| 25 to 44 Years | 891 (24.4%) | $44,489 |
| 45 to 64 Years | 1,376 (37.7%) | $35,833 |
| 65+ Years | 1,336 (36.6%) | $50,117 |
| Total | 3,653 (100.0%) | $46,063 |
Poverty in Seminole County
Income Below Poverty by Sex and Age in Seminole County
With 15.8% poverty level for males and 26.0% for females among the residents of Seminole County, 12 to 14 year old males and 18 to 24 year old females are the most vulnerable to poverty, with 71 males (31.7%) and 125 females (42.5%) in their respective age groups living below the poverty level.
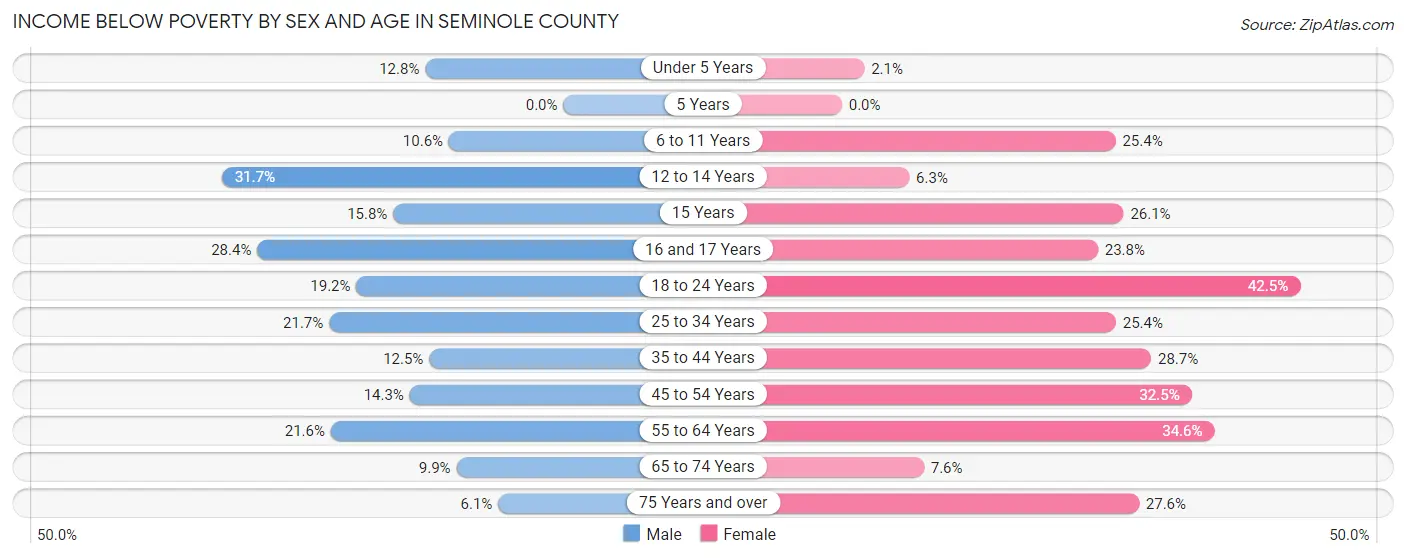
| Age Bracket | Male | Female |
| Under 5 Years | 30 (12.8%) | 3 (2.1%) |
| 5 Years | 0 (0.0%) | 0 (0.0%) |
| 6 to 11 Years | 36 (10.6%) | 95 (25.4%) |
| 12 to 14 Years | 71 (31.7%) | 6 (6.2%) |
| 15 Years | 9 (15.8%) | 23 (26.1%) |
| 16 and 17 Years | 25 (28.4%) | 24 (23.8%) |
| 18 to 24 Years | 58 (19.2%) | 125 (42.5%) |
| 25 to 34 Years | 115 (21.7%) | 117 (25.4%) |
| 35 to 44 Years | 57 (12.4%) | 192 (28.7%) |
| 45 to 54 Years | 73 (14.3%) | 160 (32.5%) |
| 55 to 64 Years | 131 (21.6%) | 261 (34.6%) |
| 65 to 74 Years | 63 (9.9%) | 47 (7.6%) |
| 75 Years and over | 19 (6.0%) | 150 (27.6%) |
| Total | 687 (15.8%) | 1,203 (26.0%) |
Income Above Poverty by Sex and Age in Seminole County
According to the poverty statistics in Seminole County, males aged 5 years and females aged under 5 years are the age groups that are most secure financially, with 100.0% of males and 97.9% of females in these age groups living above the poverty line.
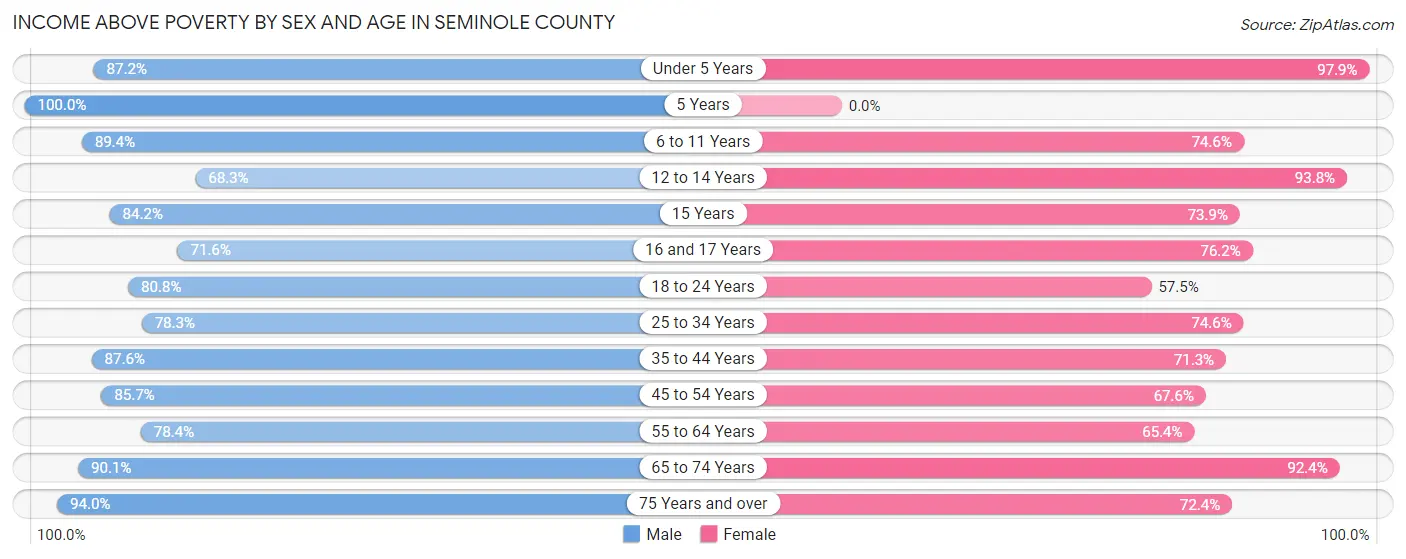
| Age Bracket | Male | Female |
| Under 5 Years | 204 (87.2%) | 141 (97.9%) |
| 5 Years | 55 (100.0%) | 0 (0.0%) |
| 6 to 11 Years | 303 (89.4%) | 279 (74.6%) |
| 12 to 14 Years | 153 (68.3%) | 90 (93.8%) |
| 15 Years | 48 (84.2%) | 65 (73.9%) |
| 16 and 17 Years | 63 (71.6%) | 77 (76.2%) |
| 18 to 24 Years | 244 (80.8%) | 169 (57.5%) |
| 25 to 34 Years | 414 (78.3%) | 343 (74.6%) |
| 35 to 44 Years | 401 (87.5%) | 477 (71.3%) |
| 45 to 54 Years | 439 (85.7%) | 333 (67.5%) |
| 55 to 64 Years | 476 (78.4%) | 494 (65.4%) |
| 65 to 74 Years | 572 (90.1%) | 571 (92.4%) |
| 75 Years and over | 295 (94.0%) | 394 (72.4%) |
| Total | 3,667 (84.2%) | 3,433 (74.1%) |
Income Below Poverty Among Married-Couple Families in Seminole County
The poverty statistics for married-couple families in Seminole County show that 8.1% or 121 of the total 1,494 families live below the poverty line. Families with no children have the highest poverty rate of 9.8%, comprising of 103 families. On the other hand, families with 3 or 4 children have the lowest poverty rate of 0.0%, which includes 0 families.
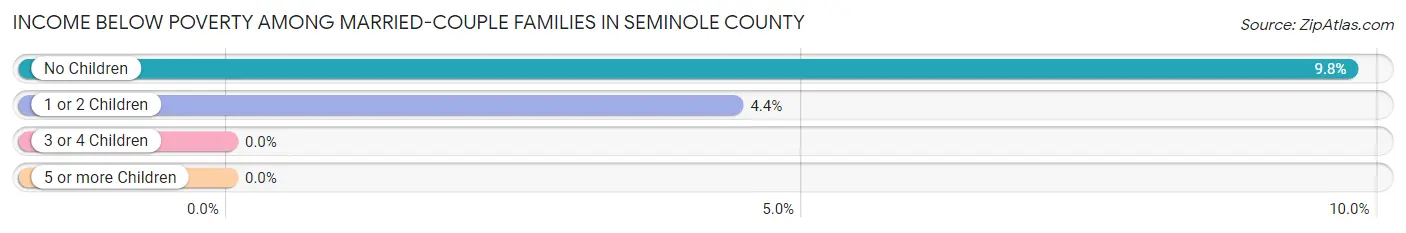
| Children | Above Poverty | Below Poverty |
| No Children | 953 (90.2%) | 103 (9.8%) |
| 1 or 2 Children | 391 (95.6%) | 18 (4.4%) |
| 3 or 4 Children | 29 (100.0%) | 0 (0.0%) |
| 5 or more Children | 0 (0.0%) | 0 (0.0%) |
| Total | 1,373 (91.9%) | 121 (8.1%) |
Income Below Poverty Among Single-Parent Households in Seminole County
According to the poverty data in Seminole County, 13.1% or 38 single-father households and 39.6% or 222 single-mother households are living below the poverty line. Among single-father households, those with 1 or 2 children have the highest poverty rate, with 20 households (15.1%) experiencing poverty. Likewise, among single-mother households, those with 1 or 2 children have the highest poverty rate, with 145 households (46.3%) falling below the poverty line.
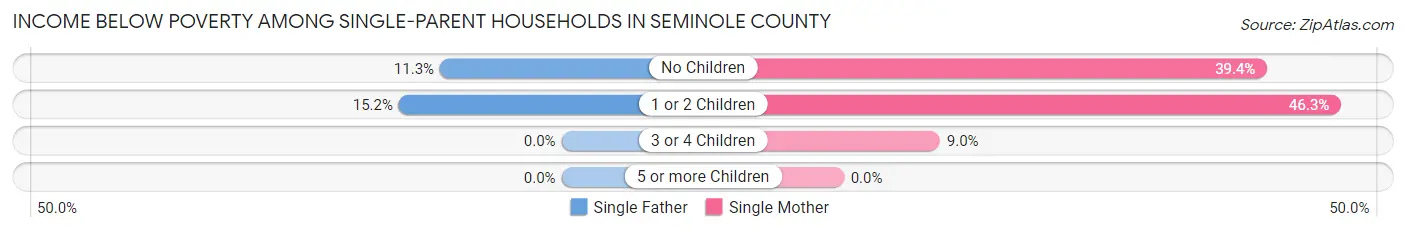
| Children | Single Father | Single Mother |
| No Children | 18 (11.3%) | 71 (39.4%) |
| 1 or 2 Children | 20 (15.1%) | 145 (46.3%) |
| 3 or 4 Children | 0 (0.0%) | 6 (9.0%) |
| 5 or more Children | 0 (0.0%) | 0 (0.0%) |
| Total | 38 (13.1%) | 222 (39.6%) |
Income Below Poverty Among Married-Couple vs Single-Parent Households in Seminole County
The poverty data for Seminole County shows that 121 of the married-couple family households (8.1%) and 260 of the single-parent households (30.5%) are living below the poverty level. Within the married-couple family households, those with no children have the highest poverty rate, with 103 households (9.8%) falling below the poverty line. Among the single-parent households, those with 1 or 2 children have the highest poverty rate, with 165 household (37.1%) living below poverty.
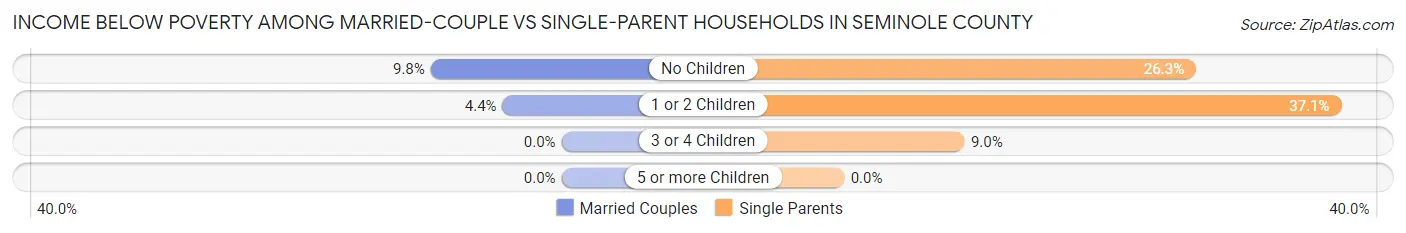
| Children | Married-Couple Families | Single-Parent Households |
| No Children | 103 (9.8%) | 89 (26.3%) |
| 1 or 2 Children | 18 (4.4%) | 165 (37.1%) |
| 3 or 4 Children | 0 (0.0%) | 6 (9.0%) |
| 5 or more Children | 0 (0.0%) | 0 (0.0%) |
| Total | 121 (8.1%) | 260 (30.5%) |
Employment Characteristics in Seminole County
Employment by Class of Employer in Seminole County
Among the 3,239 employed individuals in Seminole County, private company employees (1,827 | 56.4%), local government employees (448 | 13.8%), and self-employed (not incorporated) (319 | 9.9%) make up the most common classes of employment.
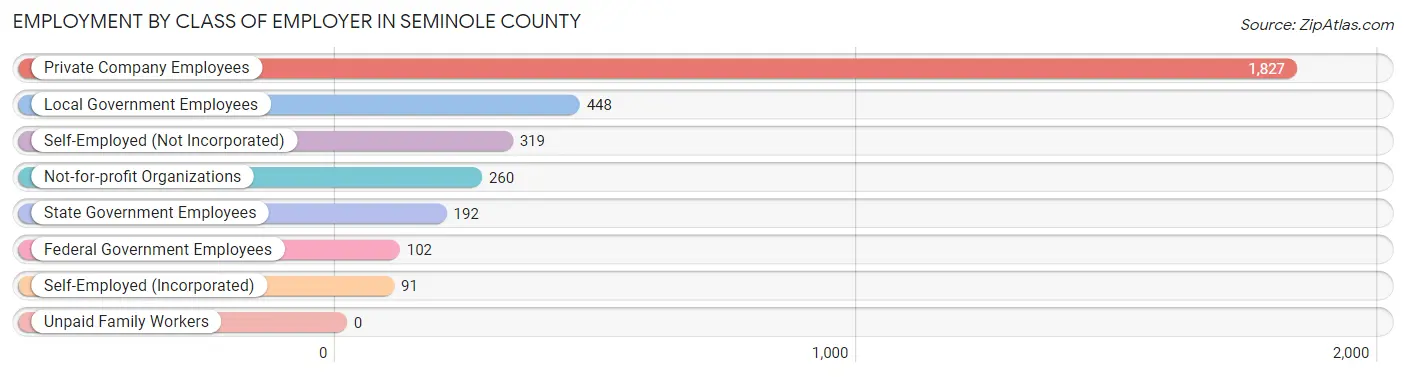
| Employer Class | # Employees | % Employees |
| Private Company Employees | 1,827 | 56.4% |
| Self-Employed (Incorporated) | 91 | 2.8% |
| Self-Employed (Not Incorporated) | 319 | 9.9% |
| Not-for-profit Organizations | 260 | 8.0% |
| Local Government Employees | 448 | 13.8% |
| State Government Employees | 192 | 5.9% |
| Federal Government Employees | 102 | 3.2% |
| Unpaid Family Workers | 0 | 0.0% |
| Total | 3,239 | 100.0% |
Employment Status by Age in Seminole County
According to the labor force statistics for Seminole County, out of the total population over 16 years of age (7,493), 46.8% or 3,507 individuals are in the labor force, with 5.8% or 203 of them unemployed. The age group with the highest labor force participation rate is 30 to 34 years, with 92.6% or 351 individuals in the labor force. Within the labor force, the 16 to 19 years age range has the highest percentage of unemployed individuals, with 51.7% or 31 of them being unemployed.
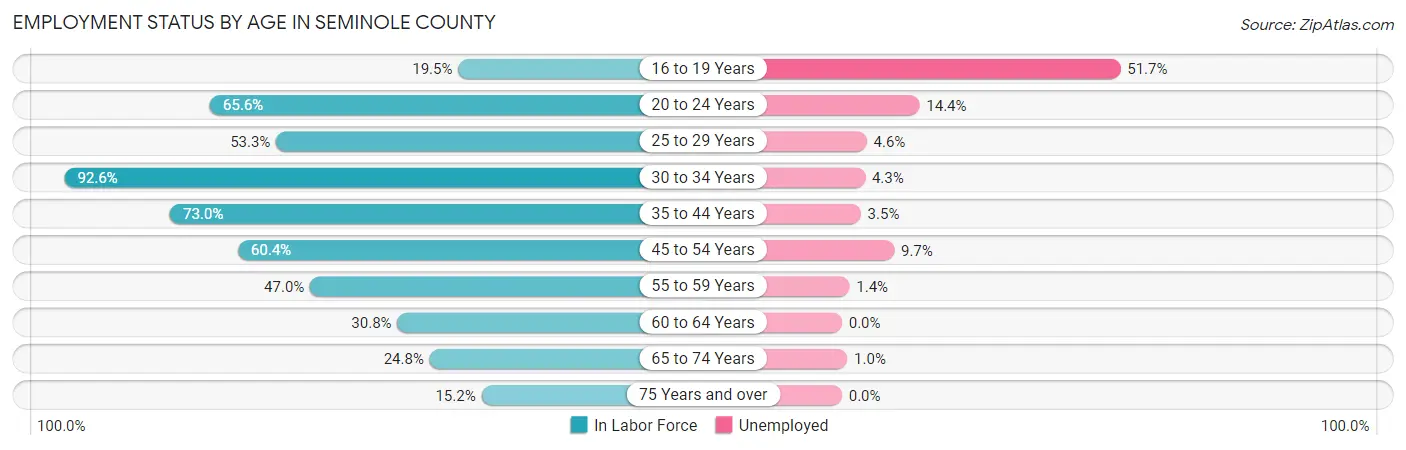
| Age Bracket | In Labor Force | Unemployed |
| 16 to 19 Years | 60 (19.5%) | 31 (51.7%) |
| 20 to 24 Years | 320 (65.6%) | 46 (14.4%) |
| 25 to 29 Years | 327 (53.3%) | 15 (4.6%) |
| 30 to 34 Years | 351 (92.6%) | 15 (4.3%) |
| 35 to 44 Years | 840 (73.0%) | 29 (3.5%) |
| 45 to 54 Years | 609 (60.4%) | 59 (9.7%) |
| 55 to 59 Years | 367 (47.0%) | 5 (1.4%) |
| 60 to 64 Years | 183 (30.8%) | 0 (0.0%) |
| 65 to 74 Years | 313 (24.8%) | 3 (1.0%) |
| 75 Years and over | 138 (15.2%) | 0 (0.0%) |
| Total | 3,507 (46.8%) | 203 (5.8%) |
Employment Status by Educational Attainment in Seminole County
According to labor force statistics for Seminole County, 59.1% of individuals (2,675) out of the total population between 25 and 64 years of age (4,527) are in the labor force, with 4.6% or 123 of them being unemployed. The group with the highest labor force participation rate are those with the educational attainment of bachelor's degree or higher, with 76.8% or 519 individuals in the labor force. Within the labor force, individuals with less than high school education have the highest percentage of unemployment, with 13.2% or 21 of them being unemployed.
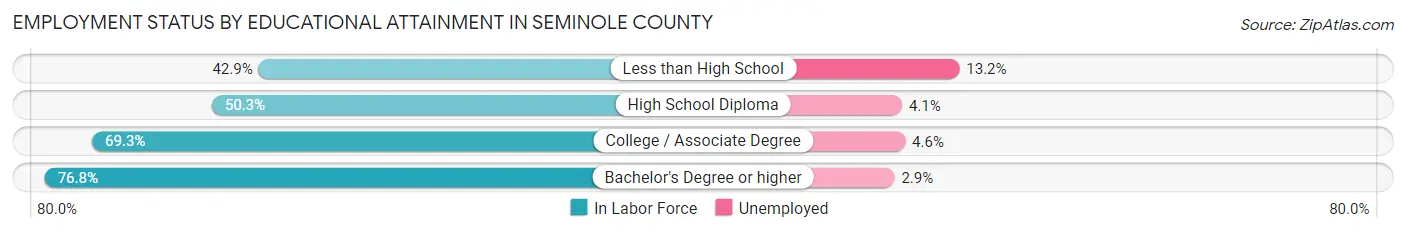
| Educational Attainment | In Labor Force | Unemployed |
| Less than High School | 159 (42.9%) | 49 (13.2%) |
| High School Diploma | 1,091 (50.3%) | 89 (4.1%) |
| College / Associate Degree | 909 (69.3%) | 60 (4.6%) |
| Bachelor's Degree or higher | 519 (76.8%) | 20 (2.9%) |
| Total | 2,675 (59.1%) | 208 (4.6%) |
Employment Occupations by Sex in Seminole County
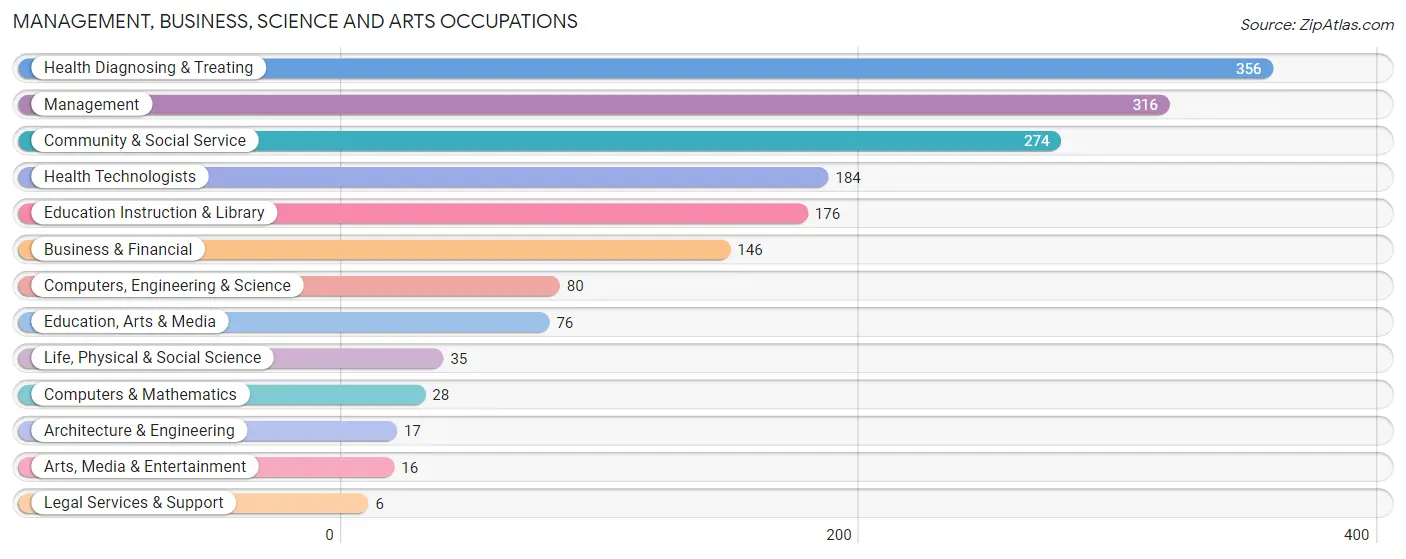
Management, Business, Science and Arts Occupations
The most common Management, Business, Science and Arts occupations in Seminole County are Health Diagnosing & Treating (356 | 10.8%), Management (316 | 9.6%), Community & Social Service (274 | 8.3%), Health Technologists (184 | 5.6%), and Education Instruction & Library (176 | 5.3%).
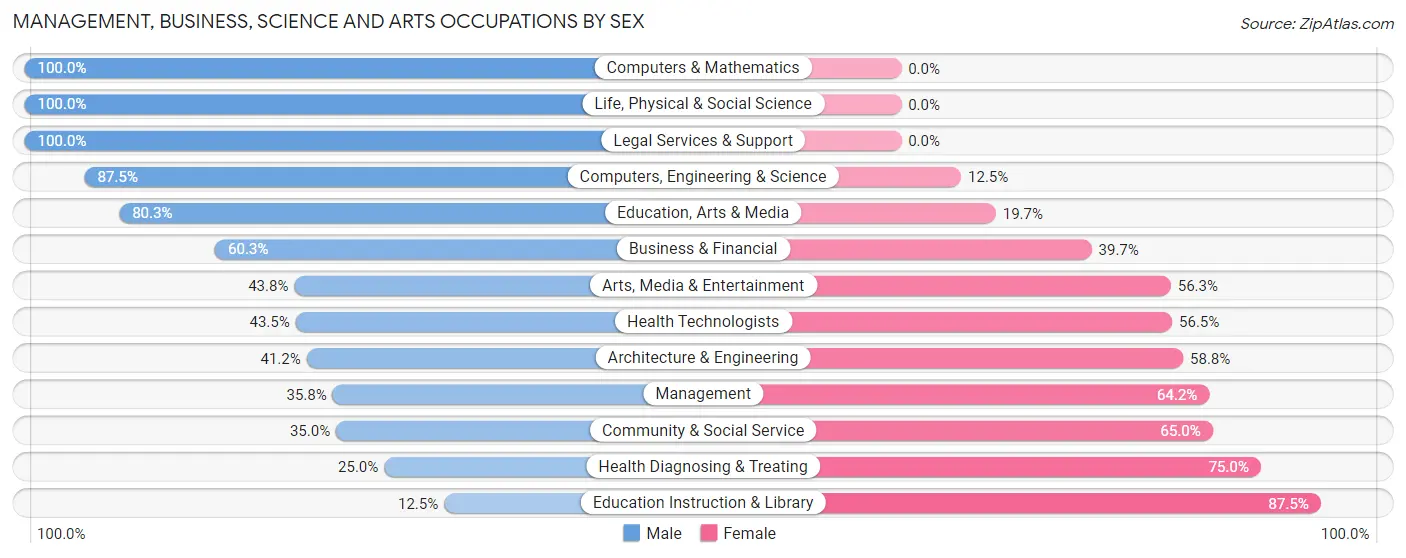
Management, Business, Science and Arts Occupations by Sex
Within the Management, Business, Science and Arts occupations in Seminole County, the most male-oriented occupations are Computers & Mathematics (100.0%), Life, Physical & Social Science (100.0%), and Legal Services & Support (100.0%), while the most female-oriented occupations are Education Instruction & Library (87.5%), Health Diagnosing & Treating (75.0%), and Community & Social Service (65.0%).
| Occupation | Male | Female |
| Management | 113 (35.8%) | 203 (64.2%) |
| Business & Financial | 88 (60.3%) | 58 (39.7%) |
| Computers, Engineering & Science | 70 (87.5%) | 10 (12.5%) |
| Computers & Mathematics | 28 (100.0%) | 0 (0.0%) |
| Architecture & Engineering | 7 (41.2%) | 10 (58.8%) |
| Life, Physical & Social Science | 35 (100.0%) | 0 (0.0%) |
| Community & Social Service | 96 (35.0%) | 178 (65.0%) |
| Education, Arts & Media | 61 (80.3%) | 15 (19.7%) |
| Legal Services & Support | 6 (100.0%) | 0 (0.0%) |
| Education Instruction & Library | 22 (12.5%) | 154 (87.5%) |
| Arts, Media & Entertainment | 7 (43.8%) | 9 (56.2%) |
| Health Diagnosing & Treating | 89 (25.0%) | 267 (75.0%) |
| Health Technologists | 80 (43.5%) | 104 (56.5%) |
| Total (Category) | 456 (38.9%) | 716 (61.1%) |
| Total (Overall) | 1,733 (52.4%) | 1,571 (47.5%) |
Services Occupations
The most common Services occupations in Seminole County are Healthcare Support (171 | 5.2%), Food Preparation & Serving (155 | 4.7%), Personal Care & Service (104 | 3.2%), Security & Protection (83 | 2.5%), and Cleaning & Maintenance (62 | 1.9%).

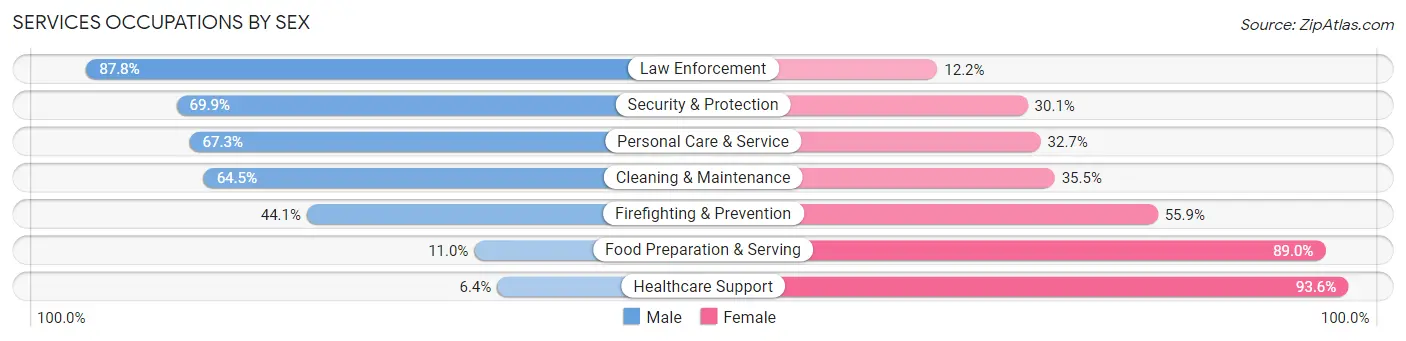
Services Occupations by Sex
Within the Services occupations in Seminole County, the most male-oriented occupations are Law Enforcement (87.8%), Security & Protection (69.9%), and Personal Care & Service (67.3%), while the most female-oriented occupations are Healthcare Support (93.6%), Food Preparation & Serving (89.0%), and Firefighting & Prevention (55.9%).
| Occupation | Male | Female |
| Healthcare Support | 11 (6.4%) | 160 (93.6%) |
| Security & Protection | 58 (69.9%) | 25 (30.1%) |
| Firefighting & Prevention | 15 (44.1%) | 19 (55.9%) |
| Law Enforcement | 43 (87.8%) | 6 (12.2%) |
| Food Preparation & Serving | 17 (11.0%) | 138 (89.0%) |
| Cleaning & Maintenance | 40 (64.5%) | 22 (35.5%) |
| Personal Care & Service | 70 (67.3%) | 34 (32.7%) |
| Total (Category) | 196 (34.1%) | 379 (65.9%) |
| Total (Overall) | 1,733 (52.4%) | 1,571 (47.5%) |
Sales and Office Occupations
The most common Sales and Office occupations in Seminole County are Office & Administration (281 | 8.5%), and Sales & Related (190 | 5.8%).

Sales and Office Occupations by Sex
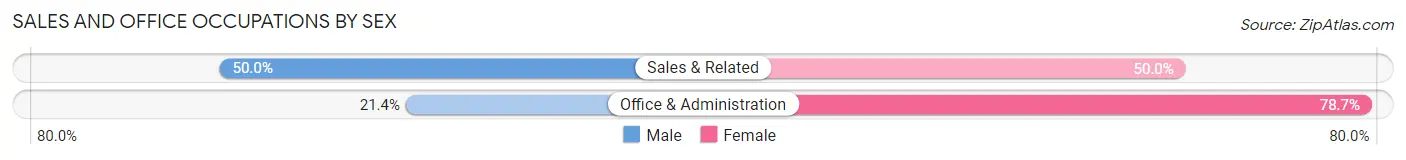
| Occupation | Male | Female |
| Sales & Related | 95 (50.0%) | 95 (50.0%) |
| Office & Administration | 60 (21.3%) | 221 (78.6%) |
| Total (Category) | 155 (32.9%) | 316 (67.1%) |
| Total (Overall) | 1,733 (52.4%) | 1,571 (47.5%) |
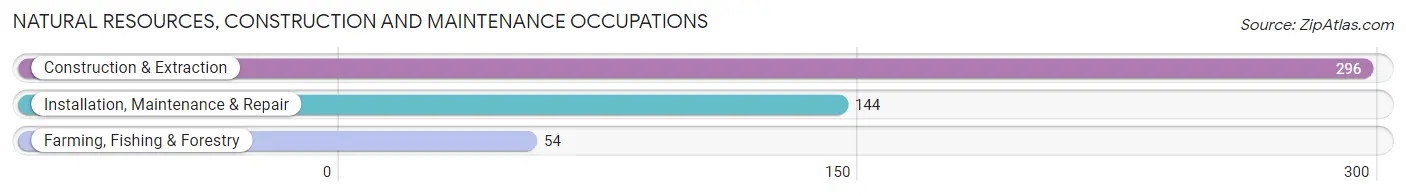
Natural Resources, Construction and Maintenance Occupations
The most common Natural Resources, Construction and Maintenance occupations in Seminole County are Construction & Extraction (296 | 9.0%), Installation, Maintenance & Repair (144 | 4.4%), and Farming, Fishing & Forestry (54 | 1.6%).
Natural Resources, Construction and Maintenance Occupations by Sex
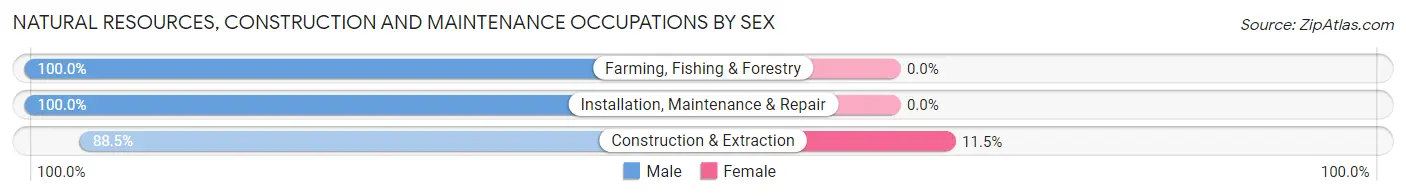
| Occupation | Male | Female |
| Farming, Fishing & Forestry | 54 (100.0%) | 0 (0.0%) |
| Construction & Extraction | 262 (88.5%) | 34 (11.5%) |
| Installation, Maintenance & Repair | 144 (100.0%) | 0 (0.0%) |
| Total (Category) | 460 (93.1%) | 34 (6.9%) |
| Total (Overall) | 1,733 (52.4%) | 1,571 (47.5%) |
Production, Transportation and Moving Occupations
The most common Production, Transportation and Moving occupations in Seminole County are Material Moving (256 | 7.7%), Production (240 | 7.3%), and Transportation (96 | 2.9%).

Production, Transportation and Moving Occupations by Sex
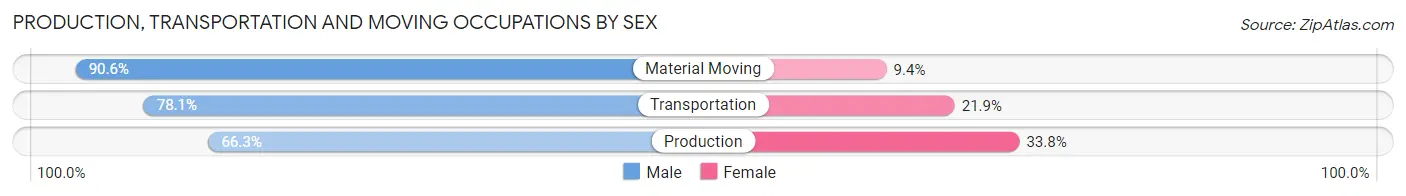
| Occupation | Male | Female |
| Production | 159 (66.2%) | 81 (33.8%) |
| Transportation | 75 (78.1%) | 21 (21.9%) |
| Material Moving | 232 (90.6%) | 24 (9.4%) |
| Total (Category) | 466 (78.7%) | 126 (21.3%) |
| Total (Overall) | 1,733 (52.4%) | 1,571 (47.5%) |
Employment Industries by Sex in Seminole County
Employment Industries in Seminole County
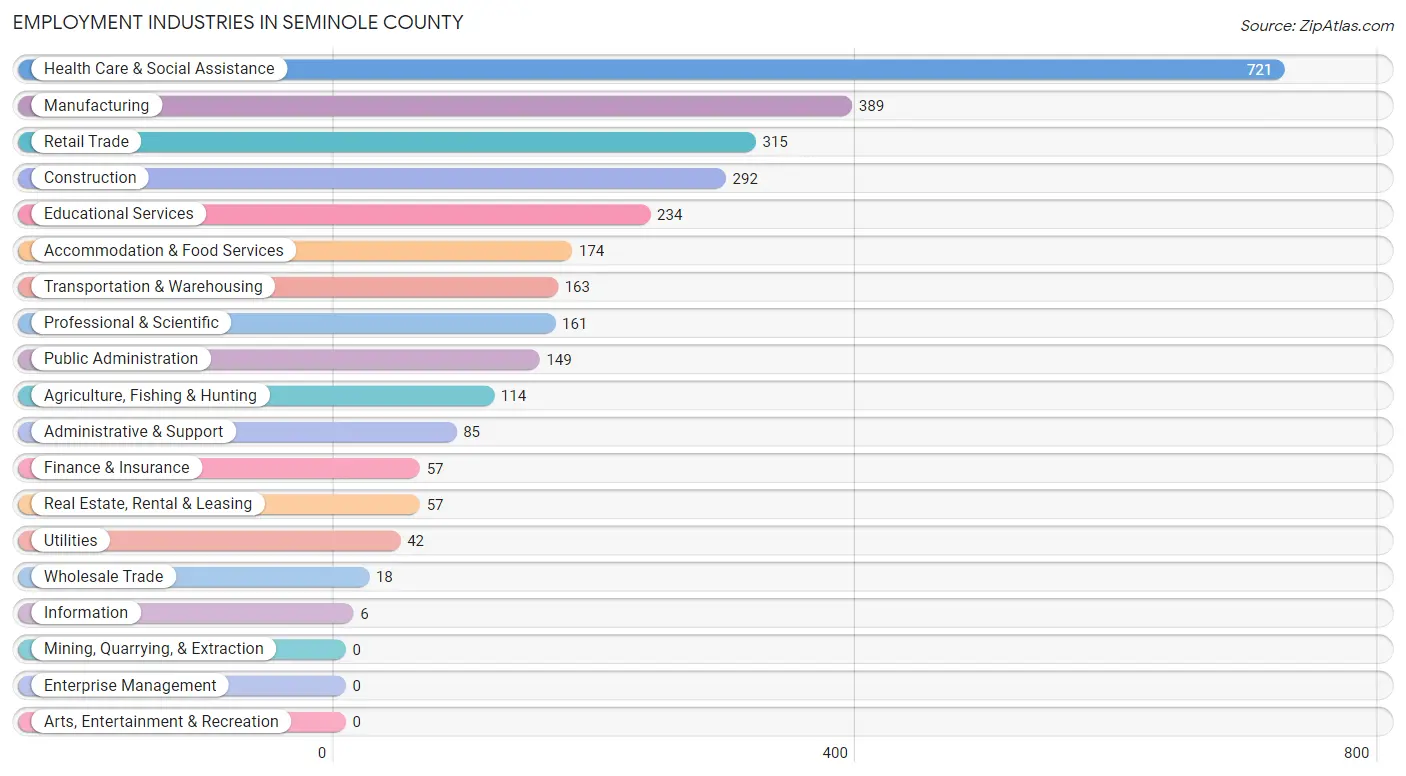
The major employment industries in Seminole County include Health Care & Social Assistance (721 | 21.8%), Manufacturing (389 | 11.8%), Retail Trade (315 | 9.5%), Construction (292 | 8.8%), and Educational Services (234 | 7.1%).
Employment Industries by Sex in Seminole County
The Seminole County industries that see more men than women are Wholesale Trade (100.0%), Information (100.0%), and Agriculture, Fishing & Hunting (93.9%), whereas the industries that tend to have a higher number of women are Accommodation & Food Services (88.5%), Educational Services (81.6%), and Finance & Insurance (78.9%).

| Industry | Male | Female |
| Agriculture, Fishing & Hunting | 107 (93.9%) | 7 (6.1%) |
| Mining, Quarrying, & Extraction | 0 (0.0%) | 0 (0.0%) |
| Construction | 273 (93.5%) | 19 (6.5%) |
| Manufacturing | 248 (63.7%) | 141 (36.2%) |
| Wholesale Trade | 18 (100.0%) | 0 (0.0%) |
| Retail Trade | 214 (67.9%) | 101 (32.1%) |
| Transportation & Warehousing | 78 (47.8%) | 85 (52.1%) |
| Utilities | 36 (85.7%) | 6 (14.3%) |
| Information | 6 (100.0%) | 0 (0.0%) |
| Finance & Insurance | 12 (21.0%) | 45 (78.9%) |
| Real Estate, Rental & Leasing | 53 (93.0%) | 4 (7.0%) |
| Professional & Scientific | 86 (53.4%) | 75 (46.6%) |
| Enterprise Management | 0 (0.0%) | 0 (0.0%) |
| Administrative & Support | 55 (64.7%) | 30 (35.3%) |
| Educational Services | 43 (18.4%) | 191 (81.6%) |
| Health Care & Social Assistance | 167 (23.2%) | 554 (76.8%) |
| Arts, Entertainment & Recreation | 0 (0.0%) | 0 (0.0%) |
| Accommodation & Food Services | 20 (11.5%) | 154 (88.5%) |
| Public Administration | 63 (42.3%) | 86 (57.7%) |
| Total | 1,733 (52.4%) | 1,571 (47.5%) |
Education in Seminole County
School Enrollment in Seminole County
The most common levels of schooling among the 1,753 students in Seminole County are elementary school (471 | 26.9%), high school (455 | 26.0%), and middle school (406 | 23.2%).
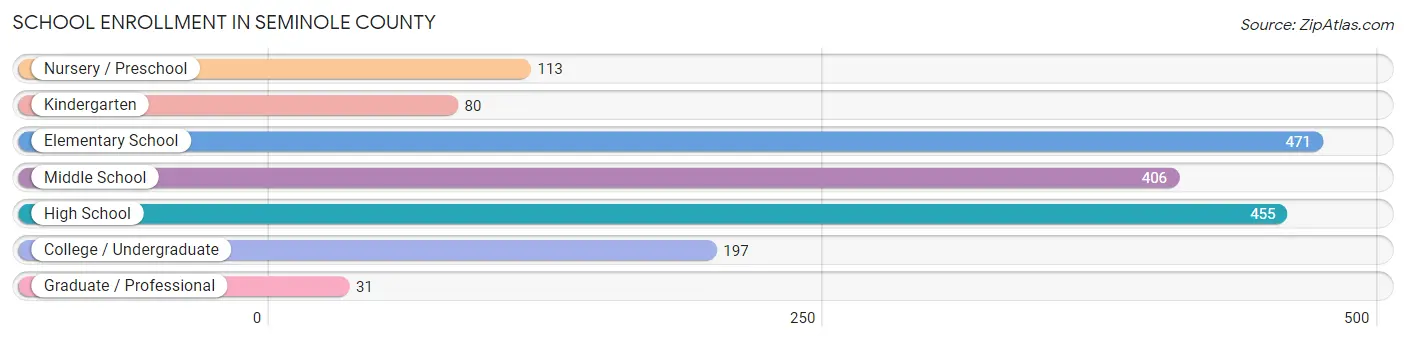
| School Level | # Students | % Students |
| Nursery / Preschool | 113 | 6.5% |
| Kindergarten | 80 | 4.6% |
| Elementary School | 471 | 26.9% |
| Middle School | 406 | 23.2% |
| High School | 455 | 26.0% |
| College / Undergraduate | 197 | 11.2% |
| Graduate / Professional | 31 | 1.8% |
| Total | 1,753 | 100.0% |
School Enrollment by Age by Funding Source in Seminole County
Out of a total of 1,753 students who are enrolled in schools in Seminole County, 144 (8.2%) attend a private institution, while the remaining 1,609 (91.8%) are enrolled in public schools. The age group of 35 years and over has the highest likelihood of being enrolled in private schools, with 36 (28.8% in the age bracket) enrolled. Conversely, the age group of 18 to 19 year olds has the lowest likelihood of being enrolled in a private school, with 71 (100.0% in the age bracket) attending a public institution.
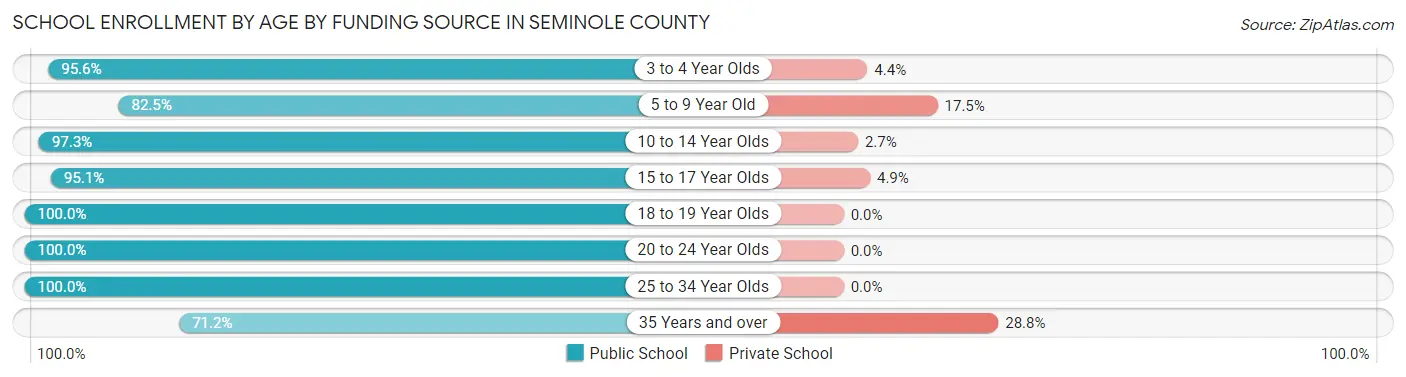
| Age Bracket | Public School | Private School |
| 3 to 4 Year Olds | 108 (95.6%) | 5 (4.4%) |
| 5 to 9 Year Old | 330 (82.5%) | 70 (17.5%) |
| 10 to 14 Year Olds | 583 (97.3%) | 16 (2.7%) |
| 15 to 17 Year Olds | 310 (95.1%) | 16 (4.9%) |
| 18 to 19 Year Olds | 71 (100.0%) | 0 (0.0%) |
| 20 to 24 Year Olds | 97 (100.0%) | 0 (0.0%) |
| 25 to 34 Year Olds | 22 (100.0%) | 0 (0.0%) |
| 35 Years and over | 89 (71.2%) | 36 (28.8%) |
| Total | 1,609 (91.8%) | 144 (8.2%) |
Educational Attainment by Field of Study in Seminole County
Science & technology (243 | 21.1%), education (218 | 19.0%), business (166 | 14.4%), liberal arts & history (94 | 8.2%), and communications (94 | 8.2%) are the most common fields of study among 1,149 individuals in Seminole County who have obtained a bachelor's degree or higher.
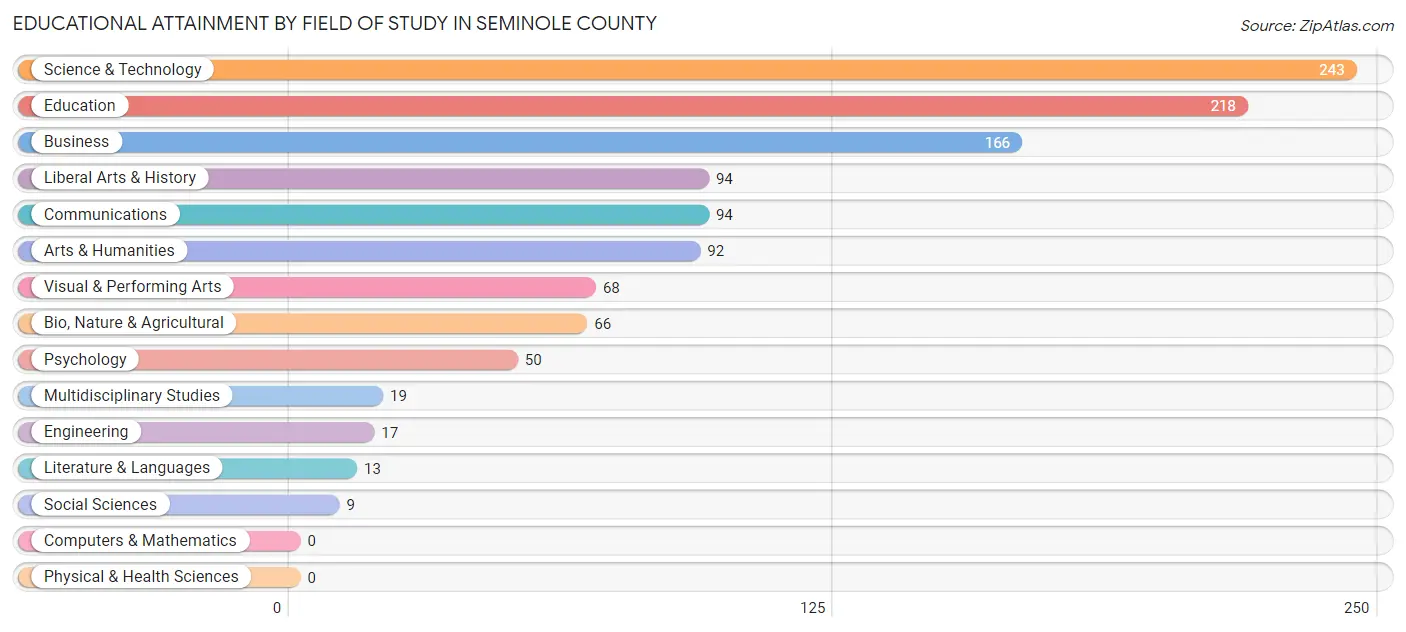
| Field of Study | # Graduates | % Graduates |
| Computers & Mathematics | 0 | 0.0% |
| Bio, Nature & Agricultural | 66 | 5.7% |
| Physical & Health Sciences | 0 | 0.0% |
| Psychology | 50 | 4.3% |
| Social Sciences | 9 | 0.8% |
| Engineering | 17 | 1.5% |
| Multidisciplinary Studies | 19 | 1.7% |
| Science & Technology | 243 | 21.1% |
| Business | 166 | 14.4% |
| Education | 218 | 19.0% |
| Literature & Languages | 13 | 1.1% |
| Liberal Arts & History | 94 | 8.2% |
| Visual & Performing Arts | 68 | 5.9% |
| Communications | 94 | 8.2% |
| Arts & Humanities | 92 | 8.0% |
| Total | 1,149 | 100.0% |
Transportation & Commute in Seminole County
Vehicle Availability by Sex in Seminole County
The most prevalent vehicle ownership categories in Seminole County are males with 2 vehicles (574, accounting for 33.7%) and females with 2 vehicles (550, making up 37.4%).
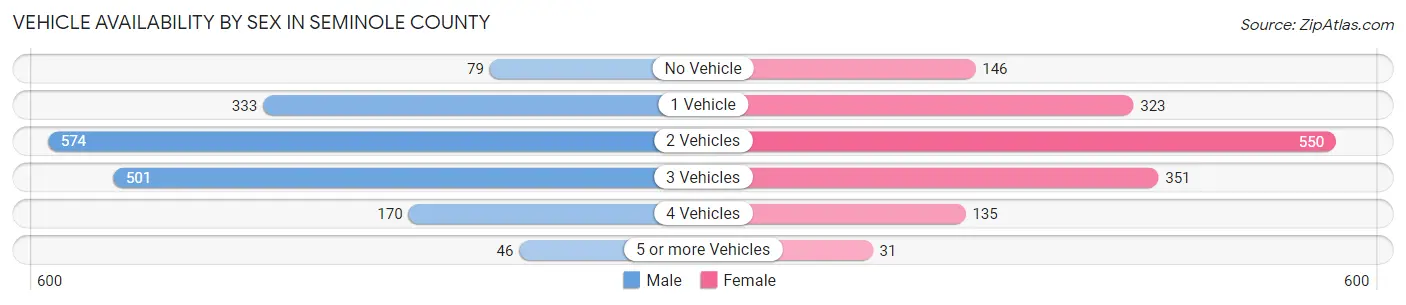
| Vehicles Available | Male | Female |
| No Vehicle | 79 (4.6%) | 146 (9.5%) |
| 1 Vehicle | 333 (19.6%) | 323 (21.0%) |
| 2 Vehicles | 574 (33.7%) | 550 (35.8%) |
| 3 Vehicles | 501 (29.4%) | 351 (22.9%) |
| 4 Vehicles | 170 (10.0%) | 135 (8.8%) |
| 5 or more Vehicles | 46 (2.7%) | 31 (2.0%) |
| Total | 1,703 (100.0%) | 1,536 (100.0%) |
Commute Time in Seminole County
The most frequently occuring commute durations in Seminole County are 5 to 9 minutes (567 commuters, 17.7%), 10 to 14 minutes (494 commuters, 15.4%), and 20 to 24 minutes (421 commuters, 13.1%).
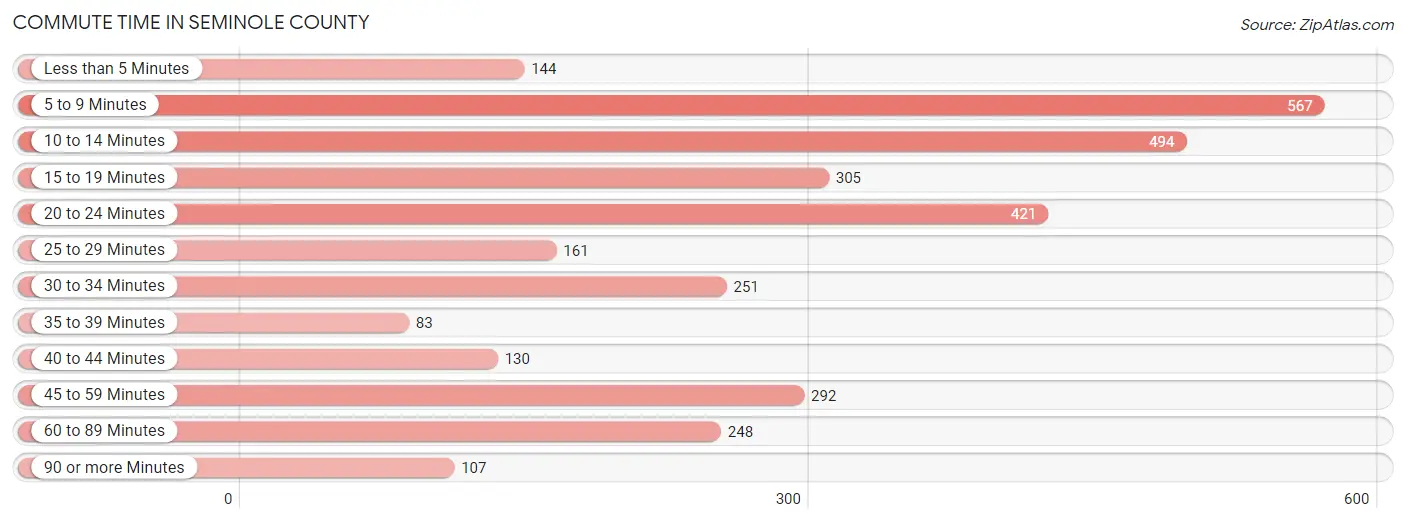
| Commute Time | # Commuters | % Commuters |
| Less than 5 Minutes | 144 | 4.5% |
| 5 to 9 Minutes | 567 | 17.7% |
| 10 to 14 Minutes | 494 | 15.4% |
| 15 to 19 Minutes | 305 | 9.5% |
| 20 to 24 Minutes | 421 | 13.1% |
| 25 to 29 Minutes | 161 | 5.0% |
| 30 to 34 Minutes | 251 | 7.8% |
| 35 to 39 Minutes | 83 | 2.6% |
| 40 to 44 Minutes | 130 | 4.1% |
| 45 to 59 Minutes | 292 | 9.1% |
| 60 to 89 Minutes | 248 | 7.7% |
| 90 or more Minutes | 107 | 3.3% |
Commute Time by Sex in Seminole County
The most common commute times in Seminole County are 10 to 14 minutes (313 commuters, 18.7%) for males and 5 to 9 minutes (362 commuters, 23.7%) for females.
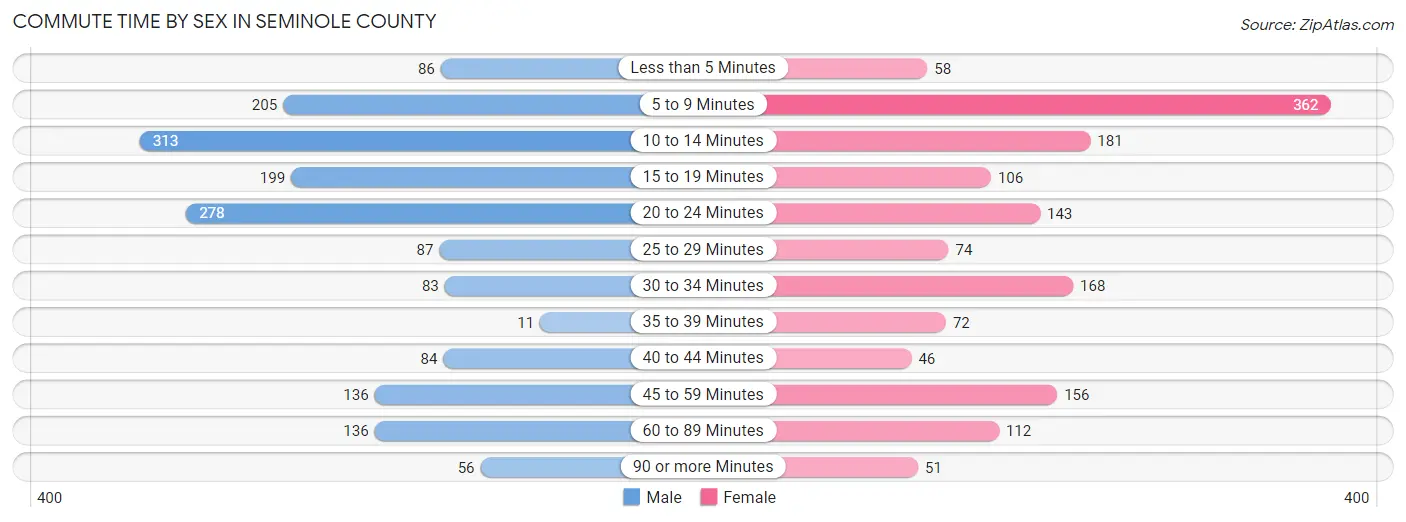
| Commute Time | Male | Female |
| Less than 5 Minutes | 86 (5.1%) | 58 (3.8%) |
| 5 to 9 Minutes | 205 (12.2%) | 362 (23.7%) |
| 10 to 14 Minutes | 313 (18.7%) | 181 (11.8%) |
| 15 to 19 Minutes | 199 (11.9%) | 106 (6.9%) |
| 20 to 24 Minutes | 278 (16.6%) | 143 (9.3%) |
| 25 to 29 Minutes | 87 (5.2%) | 74 (4.8%) |
| 30 to 34 Minutes | 83 (5.0%) | 168 (11.0%) |
| 35 to 39 Minutes | 11 (0.7%) | 72 (4.7%) |
| 40 to 44 Minutes | 84 (5.0%) | 46 (3.0%) |
| 45 to 59 Minutes | 136 (8.1%) | 156 (10.2%) |
| 60 to 89 Minutes | 136 (8.1%) | 112 (7.3%) |
| 90 or more Minutes | 56 (3.4%) | 51 (3.3%) |
Time of Departure to Work by Sex in Seminole County
The most frequent times of departure to work in Seminole County are 8:00 AM to 8:29 AM (307, 18.3%) for males and 7:30 AM to 7:59 AM (406, 26.6%) for females.
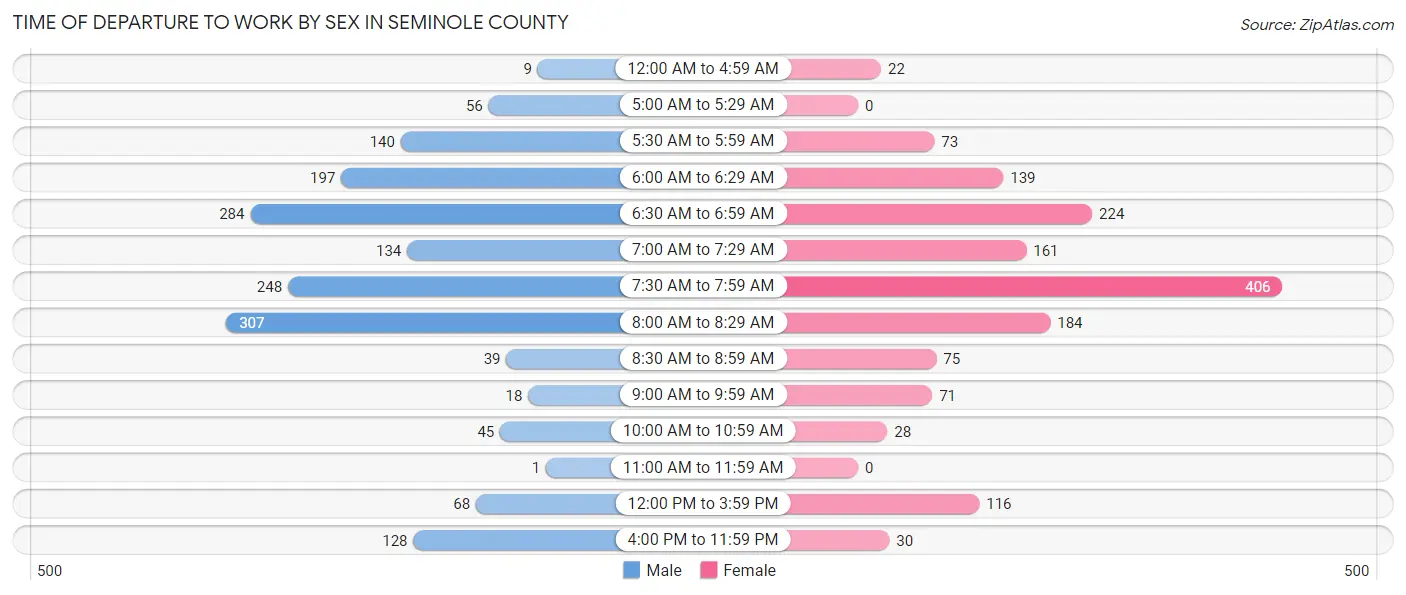
| Time of Departure | Male | Female |
| 12:00 AM to 4:59 AM | 9 (0.5%) | 22 (1.4%) |
| 5:00 AM to 5:29 AM | 56 (3.4%) | 0 (0.0%) |
| 5:30 AM to 5:59 AM | 140 (8.4%) | 73 (4.8%) |
| 6:00 AM to 6:29 AM | 197 (11.8%) | 139 (9.1%) |
| 6:30 AM to 6:59 AM | 284 (17.0%) | 224 (14.6%) |
| 7:00 AM to 7:29 AM | 134 (8.0%) | 161 (10.5%) |
| 7:30 AM to 7:59 AM | 248 (14.8%) | 406 (26.6%) |
| 8:00 AM to 8:29 AM | 307 (18.3%) | 184 (12.0%) |
| 8:30 AM to 8:59 AM | 39 (2.3%) | 75 (4.9%) |
| 9:00 AM to 9:59 AM | 18 (1.1%) | 71 (4.6%) |
| 10:00 AM to 10:59 AM | 45 (2.7%) | 28 (1.8%) |
| 11:00 AM to 11:59 AM | 1 (0.1%) | 0 (0.0%) |
| 12:00 PM to 3:59 PM | 68 (4.1%) | 116 (7.6%) |
| 4:00 PM to 11:59 PM | 128 (7.6%) | 30 (2.0%) |
| Total | 1,674 (100.0%) | 1,529 (100.0%) |
Housing Occupancy in Seminole County
Occupancy by Ownership in Seminole County
Of the total 3,653 dwellings in Seminole County, owner-occupied units account for 2,699 (73.9%), while renter-occupied units make up 954 (26.1%).
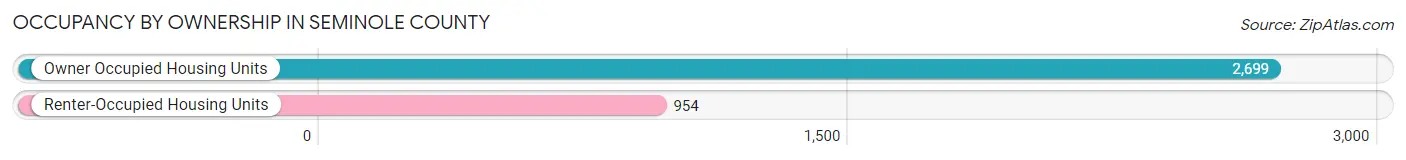
| Occupancy | # Housing Units | % Housing Units |
| Owner Occupied Housing Units | 2,699 | 73.9% |
| Renter-Occupied Housing Units | 954 | 26.1% |
| Total Occupied Housing Units | 3,653 | 100.0% |
Occupancy by Household Size in Seminole County

| Household Size | # Housing Units | % Housing Units |
| 1-Person Household | 1,134 | 31.0% |
| 2-Person Household | 1,279 | 35.0% |
| 3-Person Household | 611 | 16.7% |
| 4+ Person Household | 629 | 17.2% |
| Total Housing Units | 3,653 | 100.0% |
Occupancy by Ownership by Household Size in Seminole County

| Household Size | Owner-occupied | Renter-occupied |
| 1-Person Household | 842 (74.3%) | 292 (25.8%) |
| 2-Person Household | 932 (72.9%) | 347 (27.1%) |
| 3-Person Household | 492 (80.5%) | 119 (19.5%) |
| 4+ Person Household | 433 (68.8%) | 196 (31.2%) |
| Total Housing Units | 2,699 (73.9%) | 954 (26.1%) |
Occupancy by Educational Attainment in Seminole County

| Household Size | Owner-occupied | Renter-occupied |
| Less than High School | 315 (71.0%) | 129 (29.0%) |
| High School Diploma | 896 (71.9%) | 351 (28.1%) |
| College/Associate Degree | 927 (73.5%) | 334 (26.5%) |
| Bachelor's Degree or higher | 561 (80.0%) | 140 (20.0%) |
Occupancy by Age of Householder in Seminole County
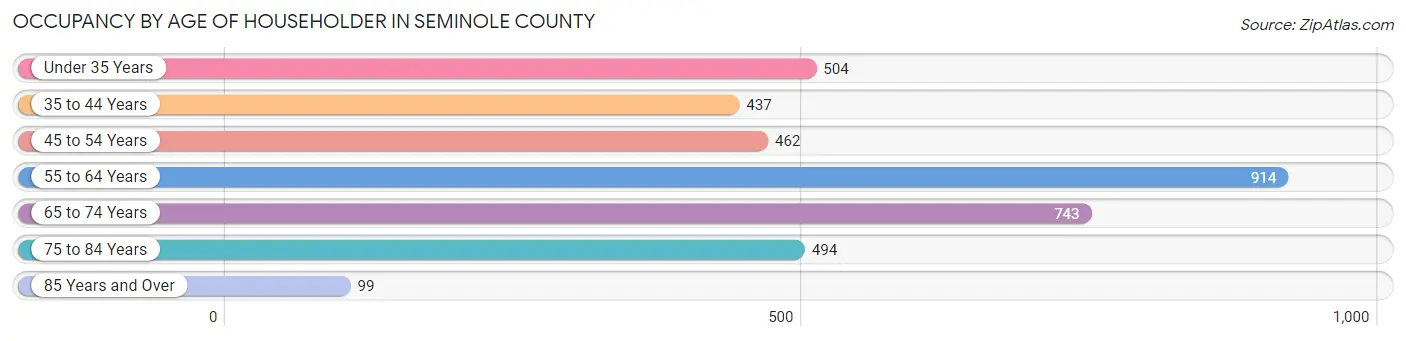
| Age Bracket | # Households | % Households |
| Under 35 Years | 504 | 13.8% |
| 35 to 44 Years | 437 | 12.0% |
| 45 to 54 Years | 462 | 12.7% |
| 55 to 64 Years | 914 | 25.0% |
| 65 to 74 Years | 743 | 20.3% |
| 75 to 84 Years | 494 | 13.5% |
| 85 Years and Over | 99 | 2.7% |
| Total | 3,653 | 100.0% |
Housing Finances in Seminole County
Median Income by Occupancy in Seminole County
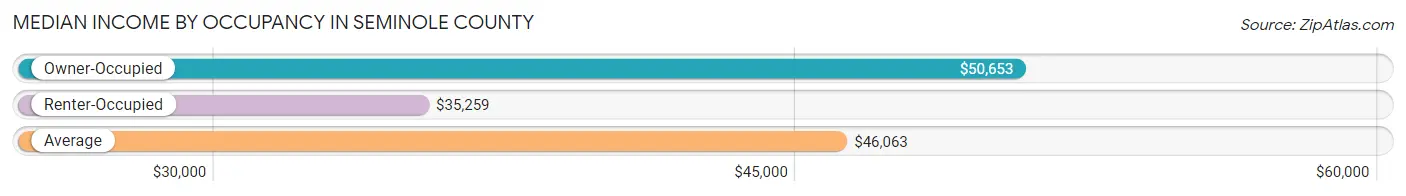
| Occupancy Type | # Households | Median Income |
| Owner-Occupied | 2,699 (73.9%) | $50,653 |
| Renter-Occupied | 954 (26.1%) | $35,259 |
| Average | 3,653 (100.0%) | $46,063 |
Occupancy by Householder Income Bracket in Seminole County
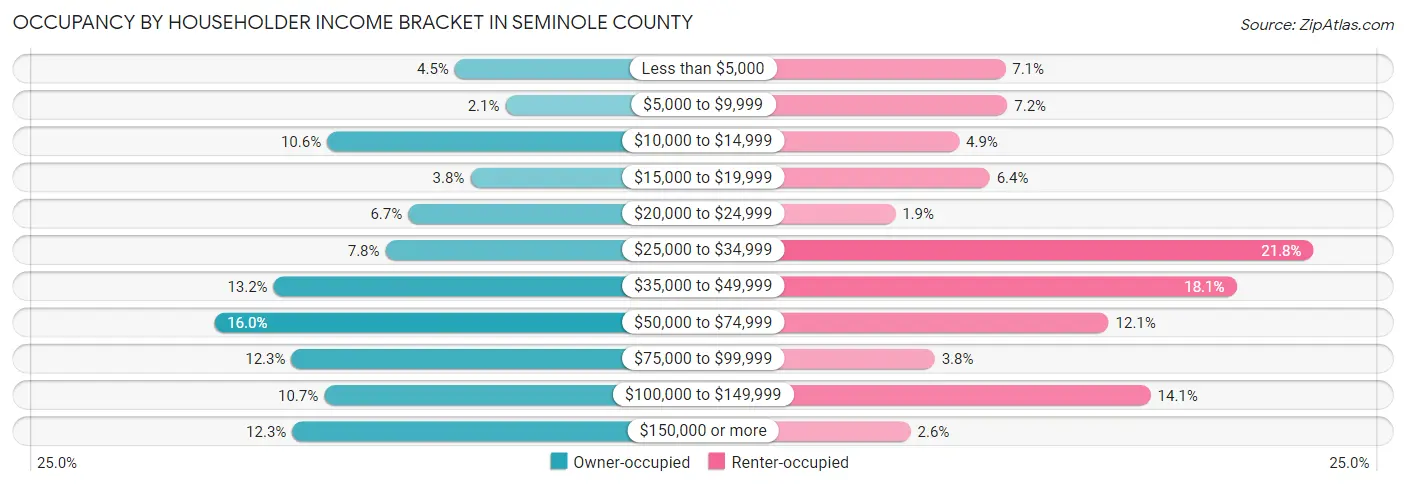
| Income Bracket | Owner-occupied | Renter-occupied |
| Less than $5,000 | 122 (4.5%) | 68 (7.1%) |
| $5,000 to $9,999 | 57 (2.1%) | 69 (7.2%) |
| $10,000 to $14,999 | 286 (10.6%) | 47 (4.9%) |
| $15,000 to $19,999 | 102 (3.8%) | 61 (6.4%) |
| $20,000 to $24,999 | 182 (6.7%) | 18 (1.9%) |
| $25,000 to $34,999 | 211 (7.8%) | 208 (21.8%) |
| $35,000 to $49,999 | 355 (13.2%) | 173 (18.1%) |
| $50,000 to $74,999 | 431 (16.0%) | 115 (12.0%) |
| $75,000 to $99,999 | 332 (12.3%) | 36 (3.8%) |
| $100,000 to $149,999 | 290 (10.7%) | 134 (14.1%) |
| $150,000 or more | 331 (12.3%) | 25 (2.6%) |
| Total | 2,699 (100.0%) | 954 (100.0%) |
Monthly Housing Cost Tiers in Seminole County

| Monthly Cost | Owner-occupied | Renter-occupied |
| Less than $300 | 455 (16.9%) | 3 (0.3%) |
| $300 to $499 | 676 (25.1%) | 36 (3.8%) |
| $500 to $799 | 558 (20.7%) | 320 (33.5%) |
| $800 to $999 | 193 (7.1%) | 315 (33.0%) |
| $1,000 to $1,499 | 599 (22.2%) | 85 (8.9%) |
| $1,500 to $1,999 | 174 (6.5%) | 0 (0.0%) |
| $2,000 to $2,499 | 21 (0.8%) | 0 (0.0%) |
| $2,500 to $2,999 | 0 (0.0%) | 0 (0.0%) |
| $3,000 or more | 23 (0.9%) | 0 (0.0%) |
| Total | 2,699 (100.0%) | 954 (100.0%) |
Physical Housing Characteristics in Seminole County
Housing Structures in Seminole County
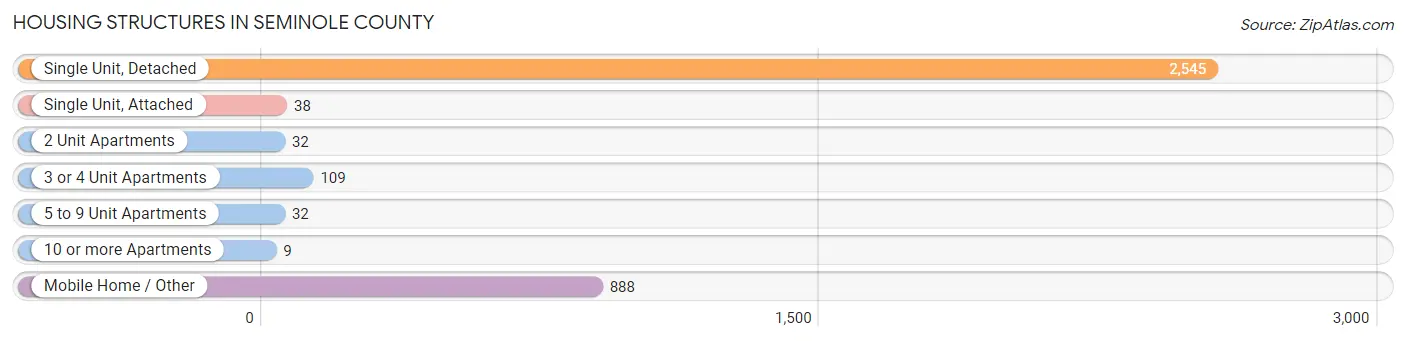
| Structure Type | # Housing Units | % Housing Units |
| Single Unit, Detached | 2,545 | 69.7% |
| Single Unit, Attached | 38 | 1.0% |
| 2 Unit Apartments | 32 | 0.9% |
| 3 or 4 Unit Apartments | 109 | 3.0% |
| 5 to 9 Unit Apartments | 32 | 0.9% |
| 10 or more Apartments | 9 | 0.3% |
| Mobile Home / Other | 888 | 24.3% |
| Total | 3,653 | 100.0% |
Housing Structures by Occupancy in Seminole County

| Structure Type | Owner-occupied | Renter-occupied |
| Single Unit, Detached | 1,899 (74.6%) | 646 (25.4%) |
| Single Unit, Attached | 1 (2.6%) | 37 (97.4%) |
| 2 Unit Apartments | 0 (0.0%) | 32 (100.0%) |
| 3 or 4 Unit Apartments | 21 (19.3%) | 88 (80.7%) |
| 5 to 9 Unit Apartments | 0 (0.0%) | 32 (100.0%) |
| 10 or more Apartments | 9 (100.0%) | 0 (0.0%) |
| Mobile Home / Other | 769 (86.6%) | 119 (13.4%) |
| Total | 2,699 (73.9%) | 954 (26.1%) |
Housing Structures by Number of Rooms in Seminole County
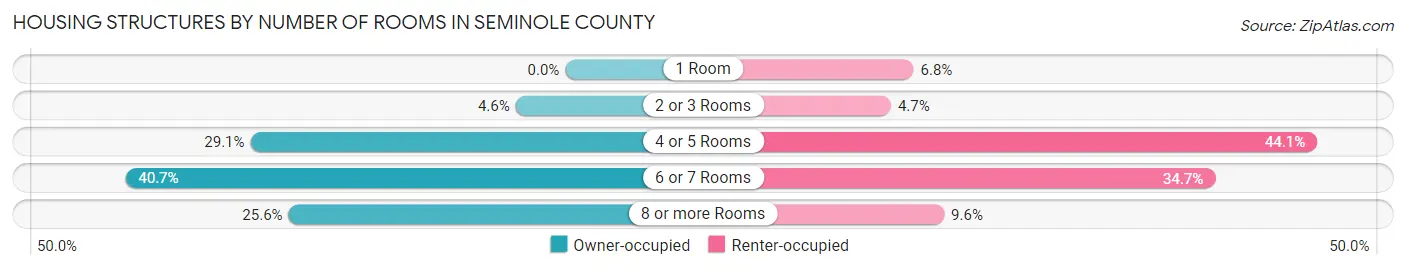
| Number of Rooms | Owner-occupied | Renter-occupied |
| 1 Room | 0 (0.0%) | 65 (6.8%) |
| 2 or 3 Rooms | 124 (4.6%) | 45 (4.7%) |
| 4 or 5 Rooms | 786 (29.1%) | 421 (44.1%) |
| 6 or 7 Rooms | 1,098 (40.7%) | 331 (34.7%) |
| 8 or more Rooms | 691 (25.6%) | 92 (9.6%) |
| Total | 2,699 (100.0%) | 954 (100.0%) |
Housing Structure by Heating Type in Seminole County
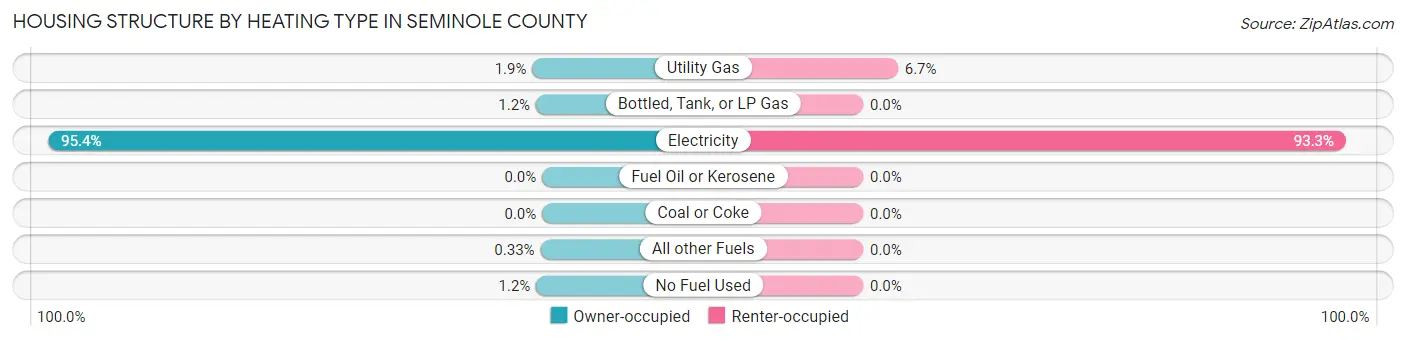
| Heating Type | Owner-occupied | Renter-occupied |
| Utility Gas | 51 (1.9%) | 64 (6.7%) |
| Bottled, Tank, or LP Gas | 32 (1.2%) | 0 (0.0%) |
| Electricity | 2,576 (95.4%) | 890 (93.3%) |
| Fuel Oil or Kerosene | 0 (0.0%) | 0 (0.0%) |
| Coal or Coke | 0 (0.0%) | 0 (0.0%) |
| All other Fuels | 9 (0.3%) | 0 (0.0%) |
| No Fuel Used | 31 (1.1%) | 0 (0.0%) |
| Total | 2,699 (100.0%) | 954 (100.0%) |
Household Vehicle Usage in Seminole County
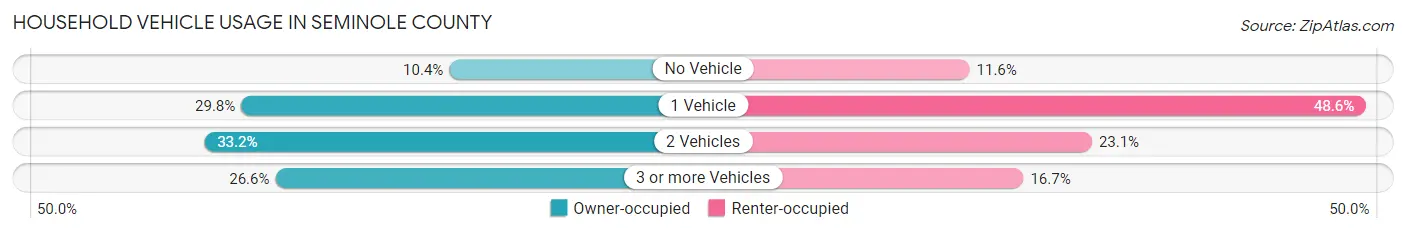
| Vehicles per Household | Owner-occupied | Renter-occupied |
| No Vehicle | 280 (10.4%) | 111 (11.6%) |
| 1 Vehicle | 804 (29.8%) | 464 (48.6%) |
| 2 Vehicles | 897 (33.2%) | 220 (23.1%) |
| 3 or more Vehicles | 718 (26.6%) | 159 (16.7%) |
| Total | 2,699 (100.0%) | 954 (100.0%) |
Real Estate & Mortgages in Seminole County
Real Estate and Mortgage Overview in Seminole County
| Characteristic | Without Mortgage | With Mortgage |
| Housing Units | 1,555 | 1,144 |
| Median Property Value | $103,400 | $116,400 |
| Median Household Income | $41,699 | $198 |
| Monthly Housing Costs | $413 | $23 |
| Real Estate Taxes | $1,090 | $15 |
Property Value by Mortgage Status in Seminole County
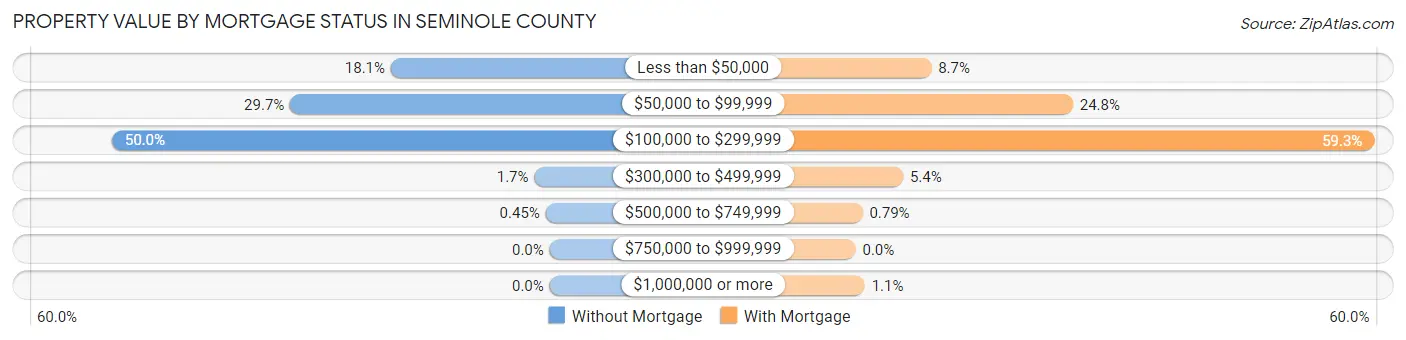
| Property Value | Without Mortgage | With Mortgage |
| Less than $50,000 | 282 (18.1%) | 99 (8.6%) |
| $50,000 to $99,999 | 461 (29.6%) | 284 (24.8%) |
| $100,000 to $299,999 | 778 (50.0%) | 678 (59.3%) |
| $300,000 to $499,999 | 27 (1.7%) | 62 (5.4%) |
| $500,000 to $749,999 | 7 (0.4%) | 9 (0.8%) |
| $750,000 to $999,999 | 0 (0.0%) | 0 (0.0%) |
| $1,000,000 or more | 0 (0.0%) | 12 (1.1%) |
| Total | 1,555 (100.0%) | 1,144 (100.0%) |
Household Income by Mortgage Status in Seminole County
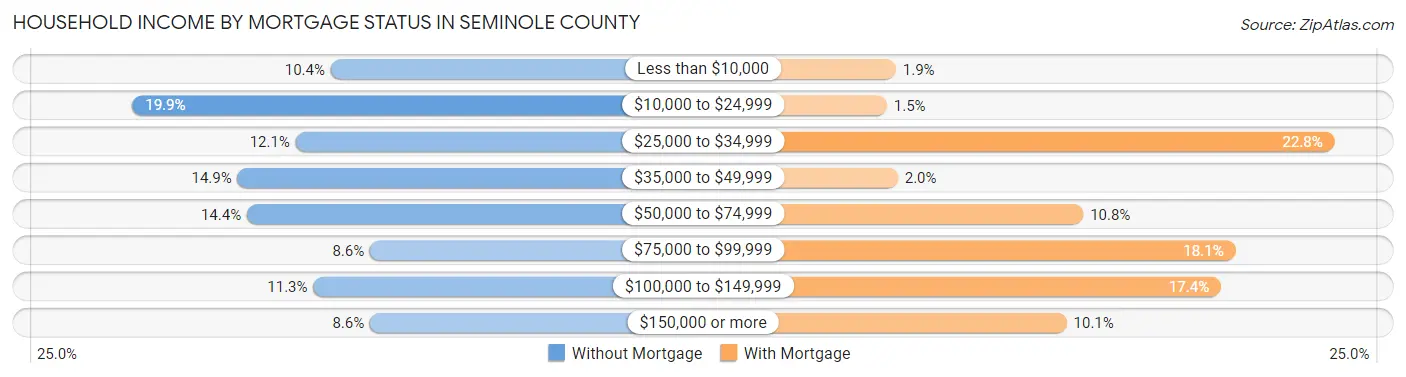
| Household Income | Without Mortgage | With Mortgage |
| Less than $10,000 | 162 (10.4%) | 22 (1.9%) |
| $10,000 to $24,999 | 309 (19.9%) | 17 (1.5%) |
| $25,000 to $34,999 | 188 (12.1%) | 261 (22.8%) |
| $35,000 to $49,999 | 231 (14.9%) | 23 (2.0%) |
| $50,000 to $74,999 | 224 (14.4%) | 124 (10.8%) |
| $75,000 to $99,999 | 133 (8.6%) | 207 (18.1%) |
| $100,000 to $149,999 | 175 (11.3%) | 199 (17.4%) |
| $150,000 or more | 133 (8.6%) | 115 (10.1%) |
| Total | 1,555 (100.0%) | 1,144 (100.0%) |
Property Value to Household Income Ratio in Seminole County

| Value-to-Income Ratio | Without Mortgage | With Mortgage |
| Less than 2.0x | 675 (43.4%) | 67,419 (5,893.3%) |
| 2.0x to 2.9x | 262 (16.9%) | 551 (48.2%) |
| 3.0x to 3.9x | 118 (7.6%) | 134 (11.7%) |
| 4.0x or more | 466 (30.0%) | 113 (9.9%) |
| Total | 1,555 (100.0%) | 1,144 (100.0%) |
Real Estate Taxes by Mortgage Status in Seminole County
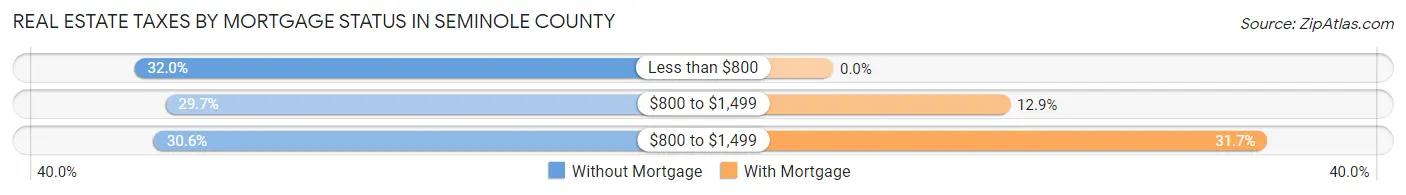
| Property Taxes | Without Mortgage | With Mortgage |
| Less than $800 | 497 (32.0%) | 0 (0.0%) |
| $800 to $1,499 | 462 (29.7%) | 148 (12.9%) |
| $800 to $1,499 | 475 (30.5%) | 363 (31.7%) |
| Total | 1,555 (100.0%) | 1,144 (100.0%) |
Health & Disability in Seminole County
Health Insurance Coverage by Age in Seminole County

| Age Bracket | With Coverage | Without Coverage |
| Under 6 Years | 438 (98.2%) | 8 (1.8%) |
| 6 to 18 Years | 1,320 (90.9%) | 132 (9.1%) |
| 19 to 25 Years | 281 (46.8%) | 320 (53.2%) |
| 26 to 34 Years | 455 (50.6%) | 444 (49.4%) |
| 35 to 44 Years | 906 (80.4%) | 221 (19.6%) |
| 45 to 54 Years | 668 (66.5%) | 337 (33.5%) |
| 55 to 64 Years | 1,171 (86.0%) | 191 (14.0%) |
| 65 to 74 Years | 1,253 (100.0%) | 0 (0.0%) |
| 75 Years and older | 858 (100.0%) | 0 (0.0%) |
| Total | 7,350 (81.6%) | 1,653 (18.4%) |
Health Insurance Coverage by Citizenship Status in Seminole County

| Citizenship Status | With Coverage | Without Coverage |
| Native Born | 438 (98.2%) | 8 (1.8%) |
| Foreign Born, Citizen | 1,320 (90.9%) | 132 (9.1%) |
| Foreign Born, not a Citizen | 281 (46.8%) | 320 (53.2%) |
Health Insurance Coverage by Household Income in Seminole County
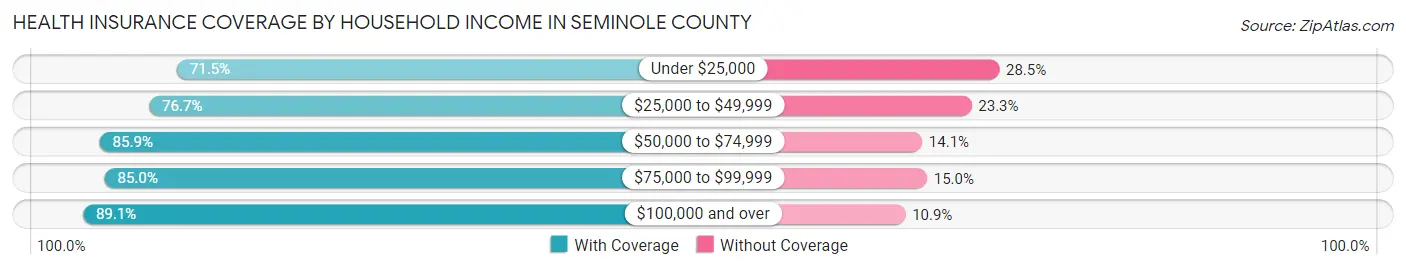
| Household Income | With Coverage | Without Coverage |
| Under $25,000 | 1,328 (71.5%) | 530 (28.5%) |
| $25,000 to $49,999 | 1,547 (76.7%) | 471 (23.3%) |
| $50,000 to $74,999 | 1,264 (85.9%) | 207 (14.1%) |
| $75,000 to $99,999 | 953 (85.0%) | 168 (15.0%) |
| $100,000 and over | 2,254 (89.1%) | 277 (10.9%) |
Public vs Private Health Insurance Coverage by Age in Seminole County
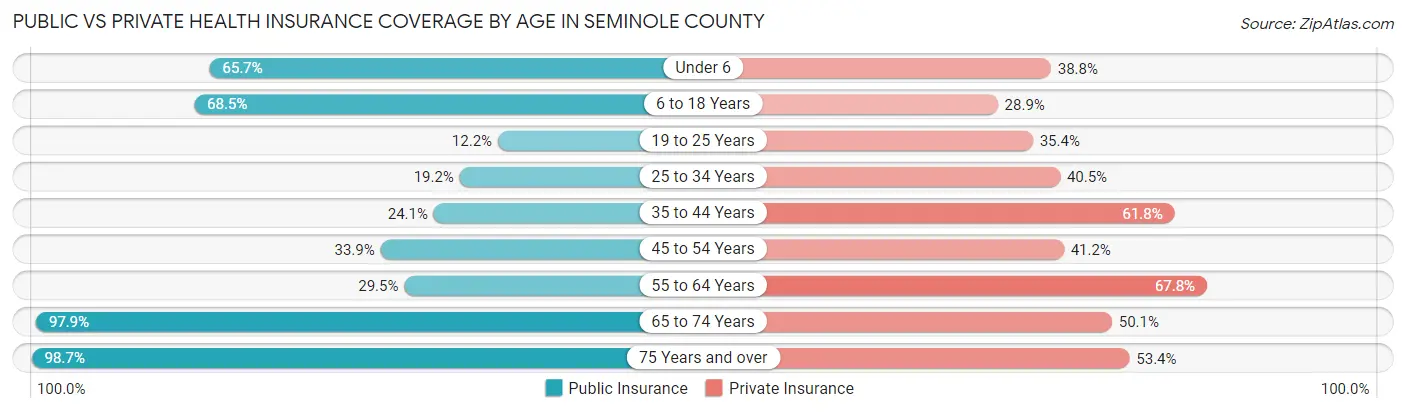
| Age Bracket | Public Insurance | Private Insurance |
| Under 6 | 293 (65.7%) | 173 (38.8%) |
| 6 to 18 Years | 995 (68.5%) | 420 (28.9%) |
| 19 to 25 Years | 73 (12.1%) | 213 (35.4%) |
| 25 to 34 Years | 173 (19.2%) | 364 (40.5%) |
| 35 to 44 Years | 271 (24.0%) | 696 (61.8%) |
| 45 to 54 Years | 341 (33.9%) | 414 (41.2%) |
| 55 to 64 Years | 402 (29.5%) | 923 (67.8%) |
| 65 to 74 Years | 1,227 (97.9%) | 628 (50.1%) |
| 75 Years and over | 847 (98.7%) | 458 (53.4%) |
| Total | 4,622 (51.3%) | 4,289 (47.6%) |
Disability Status by Sex by Age in Seminole County
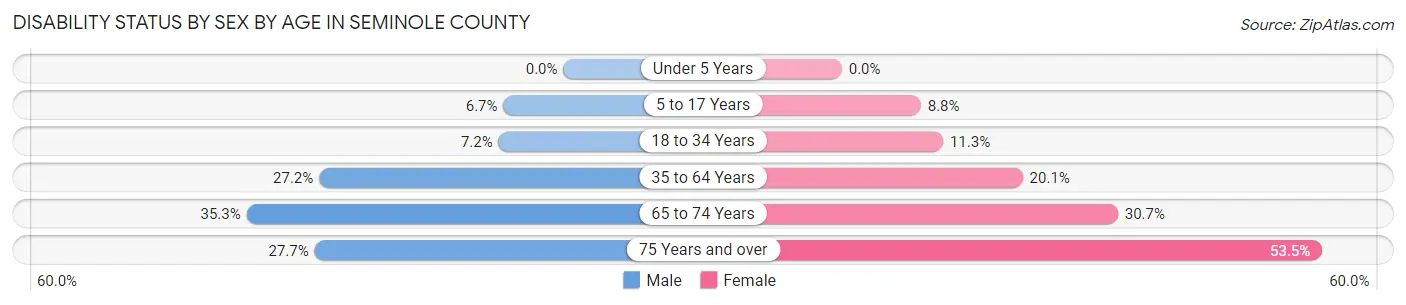
| Age Bracket | Male | Female |
| Under 5 Years | 0 (0.0%) | 0 (0.0%) |
| 5 to 17 Years | 51 (6.7%) | 58 (8.8%) |
| 18 to 34 Years | 60 (7.2%) | 85 (11.3%) |
| 35 to 64 Years | 429 (27.2%) | 386 (20.1%) |
| 65 to 74 Years | 224 (35.3%) | 190 (30.7%) |
| 75 Years and over | 87 (27.7%) | 291 (53.5%) |
Disability Class by Sex by Age in Seminole County
Disability Class: Hearing Difficulty
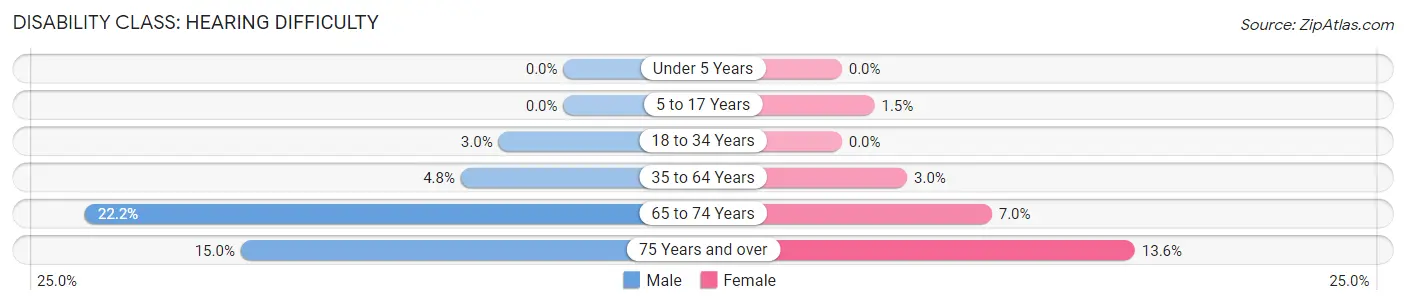
| Age Bracket | Male | Female |
| Under 5 Years | 0 (0.0%) | 0 (0.0%) |
| 5 to 17 Years | 0 (0.0%) | 10 (1.5%) |
| 18 to 34 Years | 25 (3.0%) | 0 (0.0%) |
| 35 to 64 Years | 75 (4.8%) | 58 (3.0%) |
| 65 to 74 Years | 141 (22.2%) | 43 (7.0%) |
| 75 Years and over | 47 (15.0%) | 74 (13.6%) |
Disability Class: Vision Difficulty
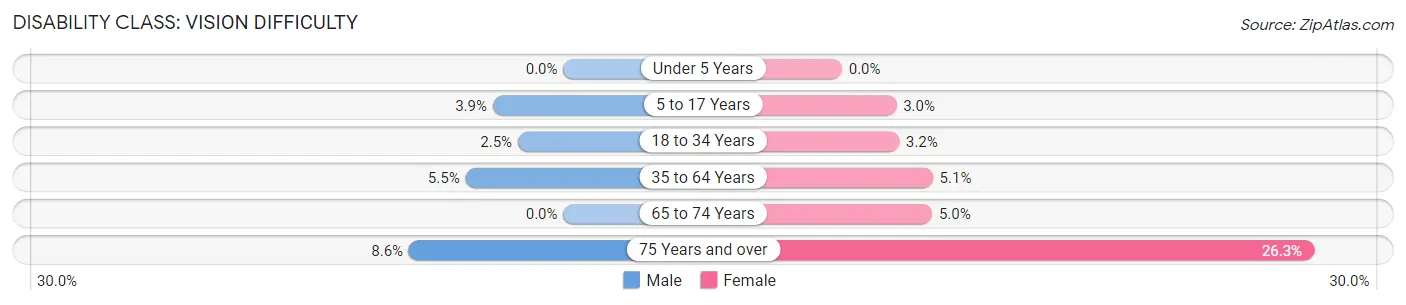
| Age Bracket | Male | Female |
| Under 5 Years | 0 (0.0%) | 0 (0.0%) |
| 5 to 17 Years | 30 (3.9%) | 20 (3.0%) |
| 18 to 34 Years | 21 (2.5%) | 24 (3.2%) |
| 35 to 64 Years | 86 (5.4%) | 97 (5.1%) |
| 65 to 74 Years | 0 (0.0%) | 31 (5.0%) |
| 75 Years and over | 27 (8.6%) | 143 (26.3%) |
Disability Class: Cognitive Difficulty

| Age Bracket | Male | Female |
| 5 to 17 Years | 21 (2.8%) | 52 (7.9%) |
| 18 to 34 Years | 35 (4.2%) | 31 (4.1%) |
| 35 to 64 Years | 153 (9.7%) | 183 (9.6%) |
| 65 to 74 Years | 54 (8.5%) | 66 (10.7%) |
| 75 Years and over | 2 (0.6%) | 36 (6.6%) |
Disability Class: Ambulatory Difficulty
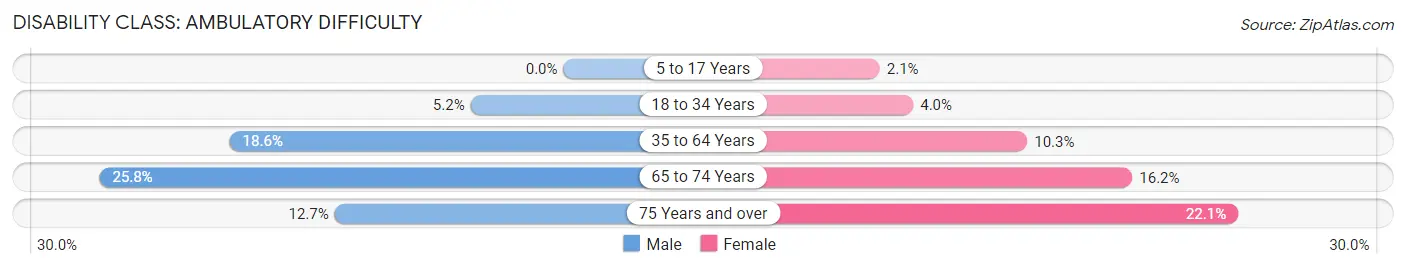
| Age Bracket | Male | Female |
| 5 to 17 Years | 0 (0.0%) | 14 (2.1%) |
| 18 to 34 Years | 43 (5.2%) | 30 (4.0%) |
| 35 to 64 Years | 293 (18.6%) | 198 (10.3%) |
| 65 to 74 Years | 164 (25.8%) | 100 (16.2%) |
| 75 Years and over | 40 (12.7%) | 120 (22.1%) |
Disability Class: Self-Care Difficulty
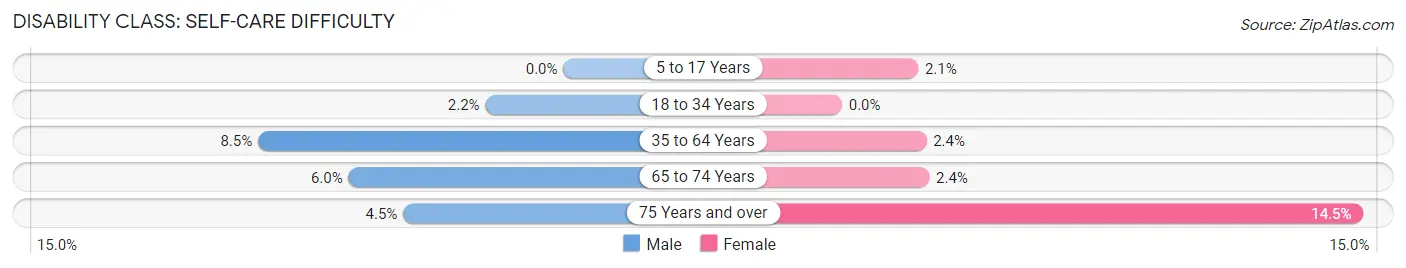
| Age Bracket | Male | Female |
| 5 to 17 Years | 0 (0.0%) | 14 (2.1%) |
| 18 to 34 Years | 18 (2.2%) | 0 (0.0%) |
| 35 to 64 Years | 134 (8.5%) | 45 (2.4%) |
| 65 to 74 Years | 38 (6.0%) | 15 (2.4%) |
| 75 Years and over | 14 (4.5%) | 79 (14.5%) |
Technology Access in Seminole County
Computing Device Access in Seminole County
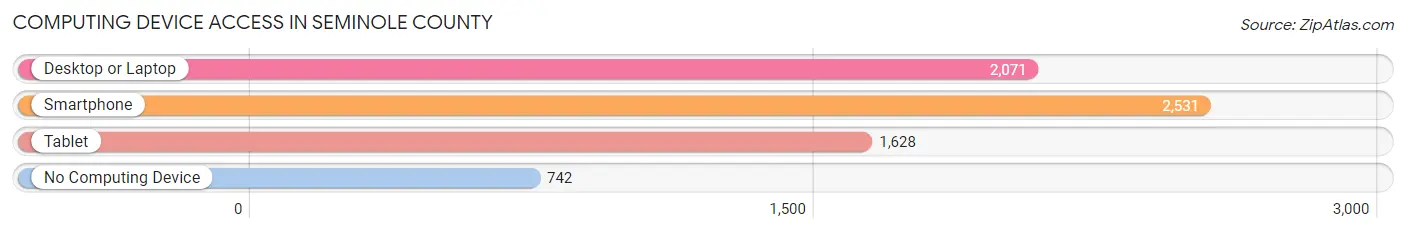
| Device Type | # Households | % Households |
| Desktop or Laptop | 2,071 | 56.7% |
| Smartphone | 2,531 | 69.3% |
| Tablet | 1,628 | 44.6% |
| No Computing Device | 742 | 20.3% |
| Total | 3,653 | 100.0% |
Internet Access in Seminole County

| Internet Type | # Households | % Households |
| Dial-Up Internet | 23 | 0.6% |
| Broadband Home | 1,572 | 43.0% |
| Cellular Data Only | 534 | 14.6% |
| Satellite Internet | 445 | 12.2% |
| No Internet | 1,160 | 31.8% |
| Total | 3,653 | 100.0% |
Seminole County Summary
Seminole County is located in the southwestern corner of the state of Georgia, and is bordered by the states of Alabama and Florida. It is part of the Albany metropolitan statistical area, and is the smallest county in the state. The county seat is Donalsonville, and the population was 8,945 at the 2010 census.
History
Seminole County was created in 1920 from parts of Decatur and Early counties. It was named for the Seminole Indians, who had been living in the area since the early 1800s. The county was originally part of the Creek Nation, and the Seminoles were part of the Creek Confederacy. The county was created to provide a local government for the Seminole Indians, and to provide services to the local population.
Geography
Seminole County is located in the southwestern corner of the state of Georgia, and is bordered by the states of Alabama and Florida. It is part of the Albany metropolitan statistical area, and is the smallest county in the state. The county has a total area of 441 square miles, of which 439 square miles is land and 2.2 square miles is water. The county is mostly flat, with some rolling hills in the northern part of the county. The Flint River runs through the county, and there are several small lakes and ponds.
Economy
The economy of Seminole County is largely based on agriculture. The county is home to several large farms, and the main crops grown are cotton, peanuts, corn, and soybeans. The county also has a large timber industry, and there are several sawmills in the area. The county is also home to several manufacturing companies, including a paper mill and a furniture factory.
Demographics
As of the 2010 census, there were 8,945 people, 3,521 households, and 2,521 families residing in the county. The population density was 20.4 people per square mile. The racial makeup of the county was 68.3% White, 28.2% African American, 0.3% Native American, 0.4% Asian, 0.1% Pacific Islander, 0.7% from other races, and 1.9% from two or more races. Hispanic or Latino of any race were 2.2% of the population.
The median income for a household in the county was $30,945, and the median income for a family was $37,945. The per capita income for the county was $15,945. About 18.3% of families and 22.2% of the population were below the poverty line, including 28.2% of those under age 18 and 16.2% of those age 65 or over.
Common Questions
What is the Total Population of Seminole County?
Total Population of Seminole County is 9,117.
What is the Total Male Population of Seminole County?
Total Male Population of Seminole County is 4,425.
What is the Total Female Population of Seminole County?
Total Female Population of Seminole County is 4,692.
What is the Ratio of Males per 100 Females in Seminole County?
There are 94.31 Males per 100 Females in Seminole County.
What is the Ratio of Females per 100 Males in Seminole County?
There are 106.03 Females per 100 Males in Seminole County.
What is the Median Population Age in Seminole County?
Median Population Age in Seminole County is 45.0 Years.
What is the Average Family Size in Seminole County
Average Family Size in Seminole County is 3.1 People.
What is the Average Household Size in Seminole County
Average Household Size in Seminole County is 2.5 People.
What is Per Capita Income in Seminole County?
Per Capita income in Seminole County is $36,184.
What is the Median Family Income in Seminole County?
Median Family Income in Seminole County is $60,408.
What is the Median Household income in Seminole County?
Median Household Income in Seminole County is $46,063.
What is Income or Wage Gap in Seminole County?
Income or Wage Gap in Seminole County is 28.1%.
Women in Seminole County earn 71.9 cents for every dollar earned by a man.
What is Family Income Deficit in Seminole County?
Family Income Deficit in Seminole County is $10,162.
Families that are below poverty line in Seminole County earn $10,162 less on average than the poverty threshold level.
What is Inequality or Gini Index in Seminole County?
Inequality or Gini Index in Seminole County is 0.55.
How Large is the Labor Force in Seminole County?
There are 3,507 People in the Labor Forcein in Seminole County.
What is the Percentage of People in the Labor Force in Seminole County?
46.8% of People are in the Labor Force in Seminole County.
What is the Unemployment Rate in Seminole County?
Unemployment Rate in Seminole County is 5.8%.