Screven County, GA
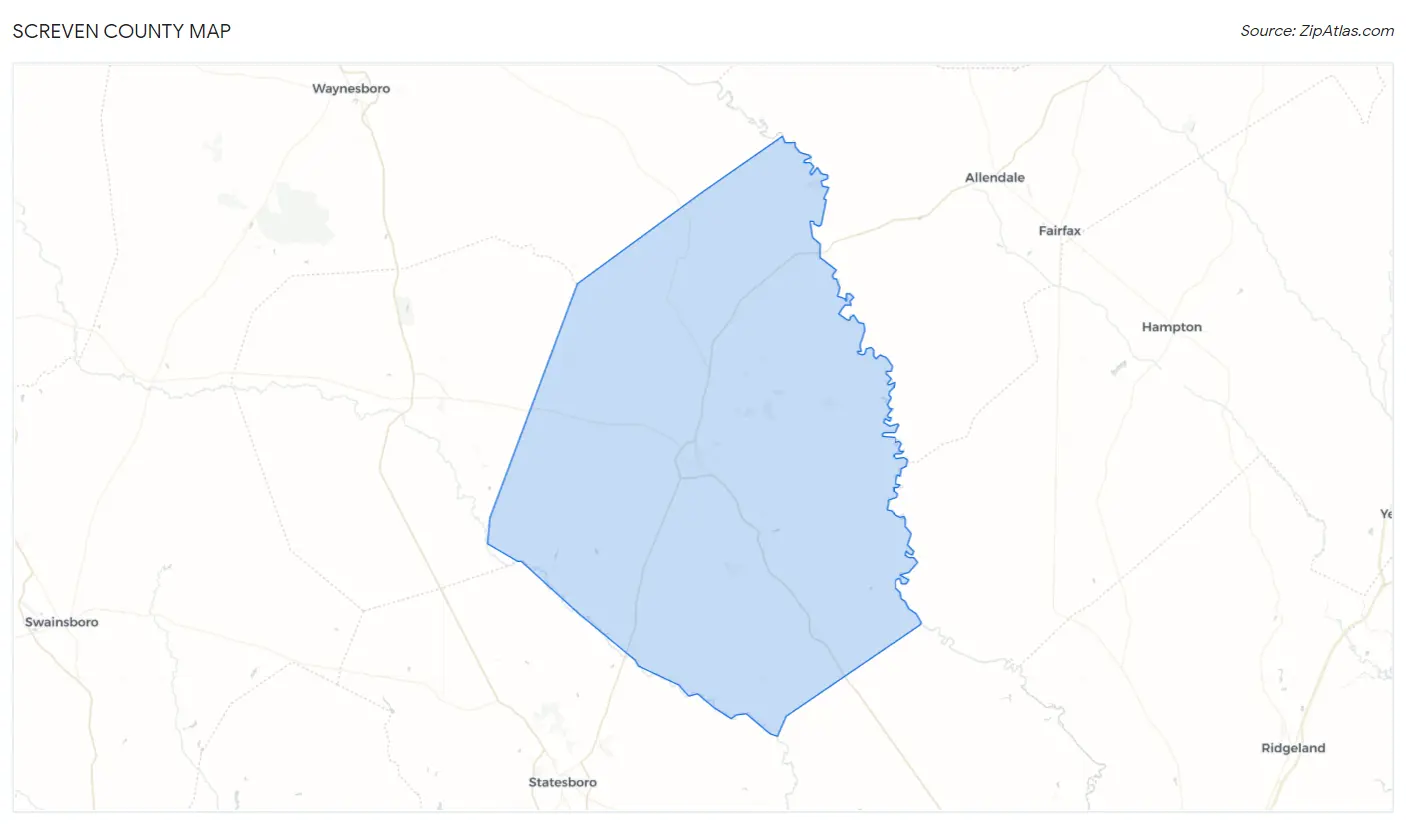
Screven County Map
Screven County Overview
14,026
TOTAL POPULATION
6,742
MALE POPULATION
7,284
FEMALE POPULATION
92.56
MALES / 100 FEMALES
108.04
FEMALES / 100 MALES
41.9
MEDIAN AGE
3.6
AVG FAMILY SIZE
2.9
AVG HOUSEHOLD SIZE
$28,356
PER CAPITA INCOME
$70,292
AVG FAMILY INCOME
$49,941
AVG HOUSEHOLD INCOME
28.9%
WAGE / INCOME GAP [ % ]
71.1¢/ $1
WAGE / INCOME GAP [ $ ]
0.48
INEQUALITY / GINI INDEX
6,402
LABOR FORCE [ PEOPLE ]
56.4%
PERCENT IN LABOR FORCE
7.2%
UNEMPLOYMENT RATE
Screven County Area Codes
Race in Screven County
The most populous races in Screven County are White / Caucasian (7,938 | 56.6%), Black / African American (5,629 | 40.1%), and Hispanic or Latino (365 | 2.6%).
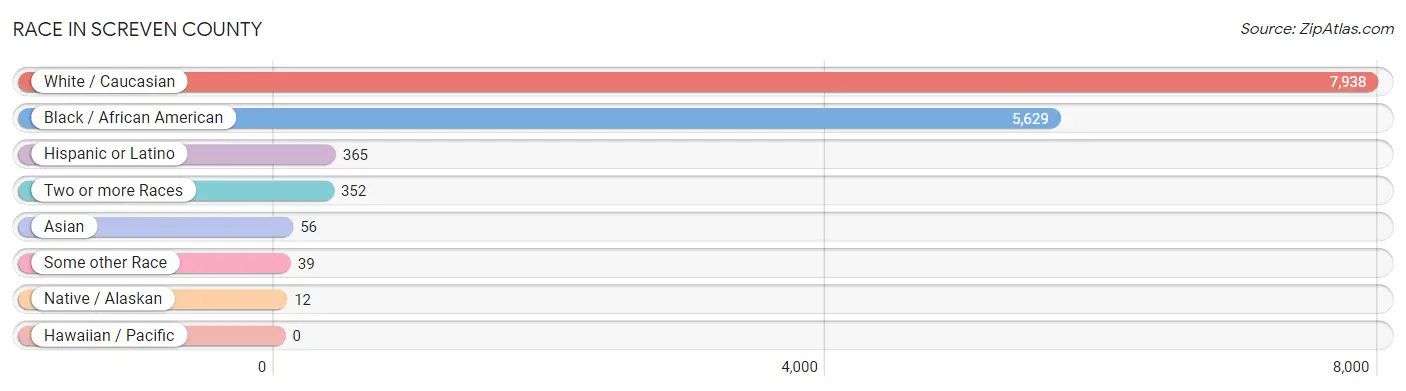
| Race | # Population | % Population |
| Asian | 56 | 0.4% |
| Black / African American | 5,629 | 40.1% |
| Hawaiian / Pacific | 0 | 0.0% |
| Hispanic or Latino | 365 | 2.6% |
| Native / Alaskan | 12 | 0.1% |
| White / Caucasian | 7,938 | 56.6% |
| Two or more Races | 352 | 2.5% |
| Some other Race | 39 | 0.3% |
| Total | 14,026 | 100.0% |
Ancestry in Screven County
The most populous ancestries reported in Screven County are English (1,015 | 7.2%), American (984 | 7.0%), Irish (914 | 6.5%), German (547 | 3.9%), and European (383 | 2.7%), together accounting for 27.4% of all Screven County residents.
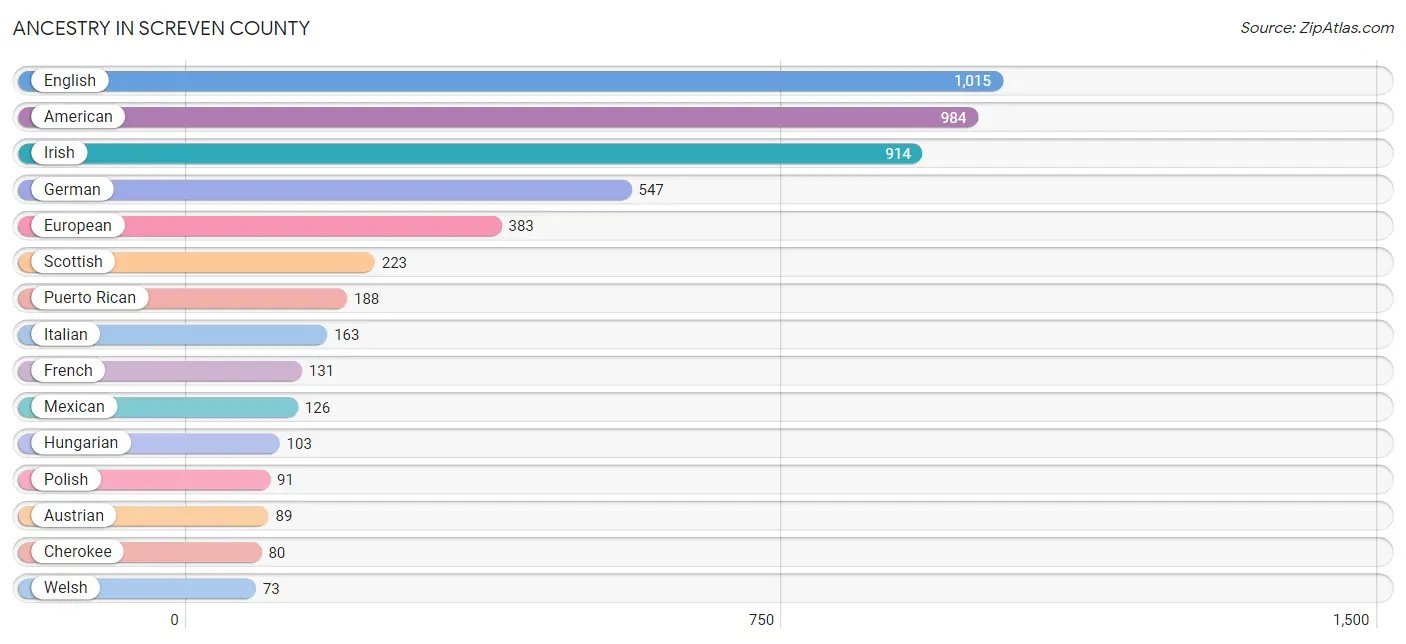
| Ancestry | # Population | % Population |
| American | 984 | 7.0% |
| Austrian | 89 | 0.6% |
| Blackfeet | 7 | 0.1% |
| British | 62 | 0.4% |
| Central American | 21 | 0.2% |
| Cherokee | 80 | 0.6% |
| Croatian | 4 | 0.0% |
| Czechoslovakian | 5 | 0.0% |
| Dutch | 20 | 0.1% |
| Eastern European | 8 | 0.1% |
| English | 1,015 | 7.2% |
| European | 383 | 2.7% |
| French | 131 | 0.9% |
| French Canadian | 32 | 0.2% |
| German | 547 | 3.9% |
| Guatemalan | 6 | 0.0% |
| Honduran | 6 | 0.0% |
| Hungarian | 103 | 0.7% |
| Indian (Asian) | 56 | 0.4% |
| Irish | 914 | 6.5% |
| Iroquois | 2 | 0.0% |
| Italian | 163 | 1.2% |
| Jamaican | 9 | 0.1% |
| Lithuanian | 7 | 0.1% |
| Luxembourger | 7 | 0.1% |
| Mexican | 126 | 0.9% |
| Norwegian | 2 | 0.0% |
| Panamanian | 9 | 0.1% |
| Polish | 91 | 0.6% |
| Portuguese | 19 | 0.1% |
| Puerto Rican | 188 | 1.3% |
| Scandinavian | 4 | 0.0% |
| Scotch-Irish | 23 | 0.2% |
| Scottish | 223 | 1.6% |
| Slovak | 9 | 0.1% |
| Spaniard | 1 | 0.0% |
| Spanish | 18 | 0.1% |
| Subsaharan African | 3 | 0.0% |
| Swedish | 5 | 0.0% |
| Turkish | 2 | 0.0% |
| Welsh | 73 | 0.5% | View All 41 Rows |
Immigrants in Screven County
The most numerous immigrant groups reported in Screven County came from Latin America (100 | 0.7%), Central America (80 | 0.6%), Mexico (71 | 0.5%), Asia (47 | 0.3%), and China (47 | 0.3%), together accounting for 2.5% of all Screven County residents.
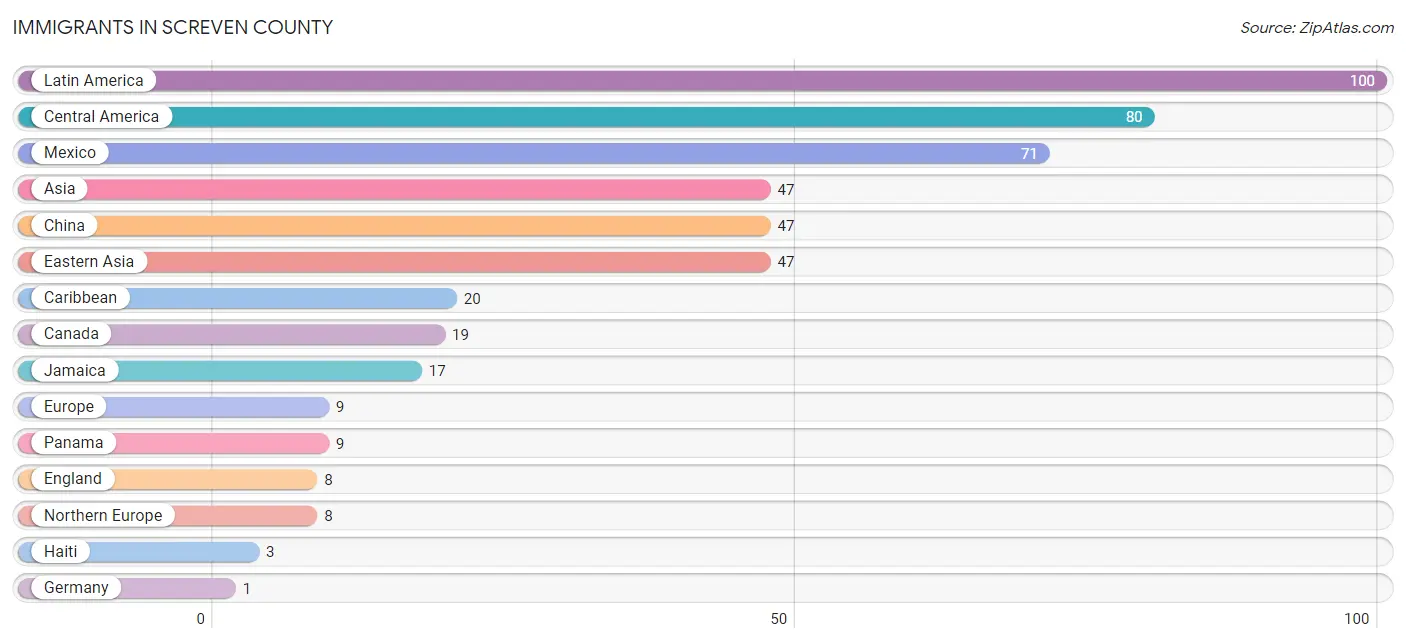
| Immigration Origin | # Population | % Population |
| Asia | 47 | 0.3% |
| Canada | 19 | 0.1% |
| Caribbean | 20 | 0.1% |
| Central America | 80 | 0.6% |
| China | 47 | 0.3% |
| Eastern Asia | 47 | 0.3% |
| England | 8 | 0.1% |
| Europe | 9 | 0.1% |
| Germany | 1 | 0.0% |
| Haiti | 3 | 0.0% |
| Jamaica | 17 | 0.1% |
| Latin America | 100 | 0.7% |
| Mexico | 71 | 0.5% |
| Northern Europe | 8 | 0.1% |
| Panama | 9 | 0.1% |
| Western Europe | 1 | 0.0% | View All 16 Rows |
Sex and Age in Screven County
Sex and Age in Screven County
The most populous age groups in Screven County are 35 to 39 Years (620 | 9.2%) for men and 55 to 59 Years (719 | 9.9%) for women.
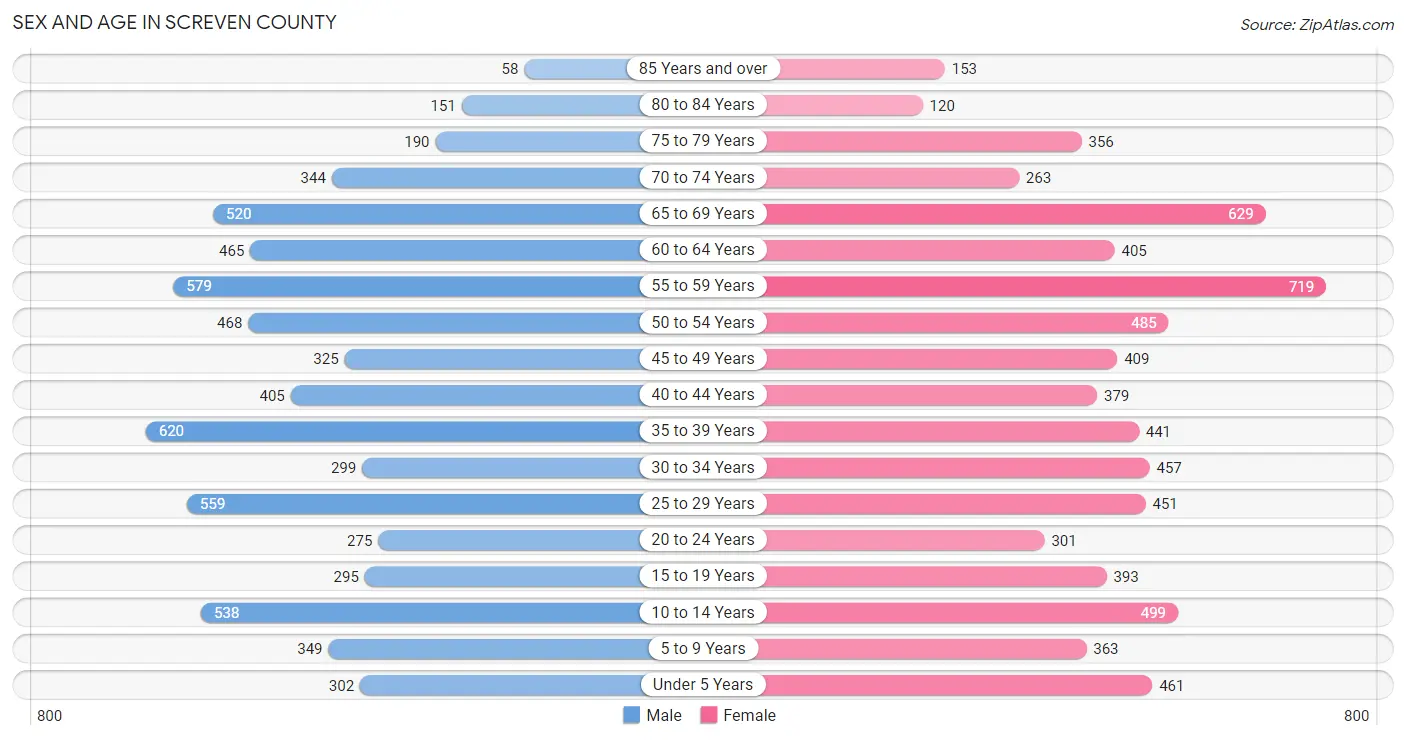
| Age Bracket | Male | Female |
| Under 5 Years | 302 (4.5%) | 461 (6.3%) |
| 5 to 9 Years | 349 (5.2%) | 363 (5.0%) |
| 10 to 14 Years | 538 (8.0%) | 499 (6.9%) |
| 15 to 19 Years | 295 (4.4%) | 393 (5.4%) |
| 20 to 24 Years | 275 (4.1%) | 301 (4.1%) |
| 25 to 29 Years | 559 (8.3%) | 451 (6.2%) |
| 30 to 34 Years | 299 (4.4%) | 457 (6.3%) |
| 35 to 39 Years | 620 (9.2%) | 441 (6.0%) |
| 40 to 44 Years | 405 (6.0%) | 379 (5.2%) |
| 45 to 49 Years | 325 (4.8%) | 409 (5.6%) |
| 50 to 54 Years | 468 (6.9%) | 485 (6.7%) |
| 55 to 59 Years | 579 (8.6%) | 719 (9.9%) |
| 60 to 64 Years | 465 (6.9%) | 405 (5.6%) |
| 65 to 69 Years | 520 (7.7%) | 629 (8.6%) |
| 70 to 74 Years | 344 (5.1%) | 263 (3.6%) |
| 75 to 79 Years | 190 (2.8%) | 356 (4.9%) |
| 80 to 84 Years | 151 (2.2%) | 120 (1.7%) |
| 85 Years and over | 58 (0.9%) | 153 (2.1%) |
| Total | 6,742 (100.0%) | 7,284 (100.0%) |
Families and Households in Screven County
Median Family Size in Screven County
The median family size in Screven County is 3.62 persons per family, with single female/mother families (808 | 25.4%) accounting for the largest median family size of 4.54 persons per family. On the other hand, married-couple families (2,288 | 71.9%) represent the smallest median family size with 3.28 persons per family.
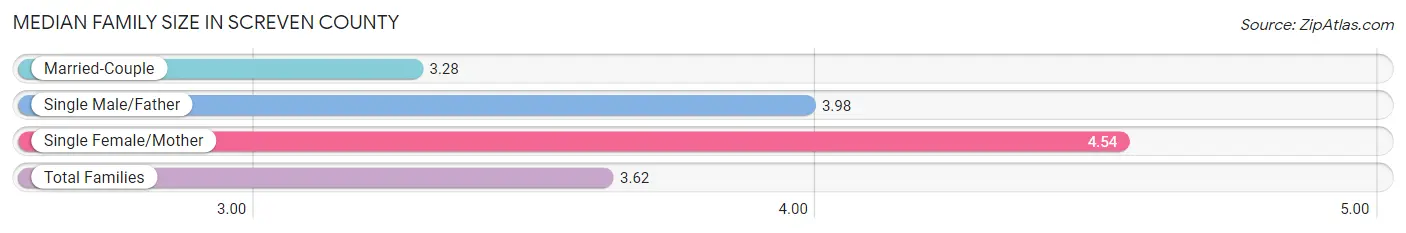
| Family Type | # Families | Family Size |
| Married-Couple | 2,288 (71.9%) | 3.28 |
| Single Male/Father | 85 (2.7%) | 3.98 |
| Single Female/Mother | 808 (25.4%) | 4.54 |
| Total Families | 3,181 (100.0%) | 3.62 |
Median Household Size in Screven County
The median household size in Screven County is 2.89 persons per household, with single female/mother households (808 | 17.1%) accounting for the largest median household size of 4.67 persons per household. non-family households (1,546 | 32.7%) represent the smallest median household size with 1.26 persons per household.

| Household Type | # Households | Household Size |
| Married-Couple | 2,288 (48.4%) | 3.32 |
| Single Male/Father | 85 (1.8%) | 4.20 |
| Single Female/Mother | 808 (17.1%) | 4.67 |
| Non-family | 1,546 (32.7%) | 1.26 |
| Total Households | 4,727 (100.0%) | 2.89 |
Household Size by Marriage Status in Screven County
Out of a total of 4,727 households in Screven County, 3,181 (67.3%) are family households, while 1,546 (32.7%) are nonfamily households. The most numerous type of family households are 2-person households, comprising 1,641, and the most common type of nonfamily households are 1-person households, comprising 1,420.
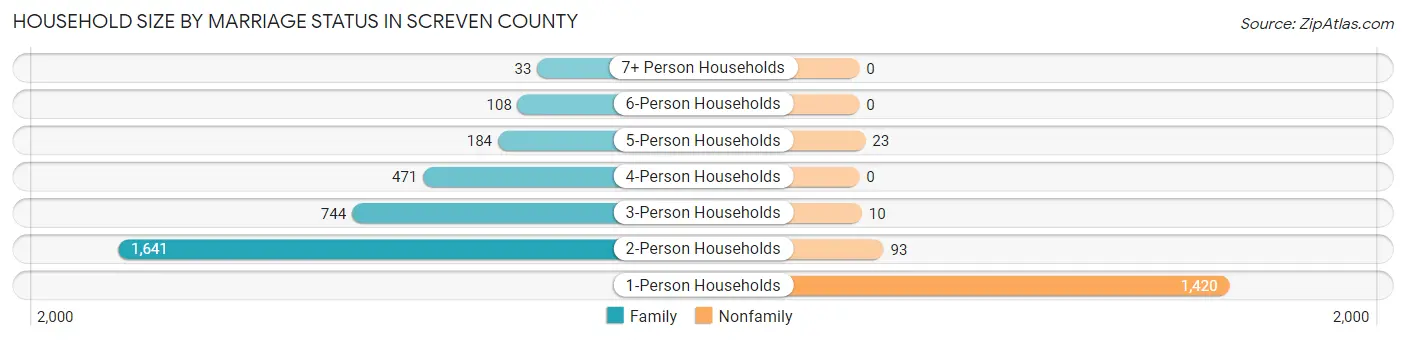
| Household Size | Family Households | Nonfamily Households |
| 1-Person Households | - | 1,420 (30.0%) |
| 2-Person Households | 1,641 (34.7%) | 93 (2.0%) |
| 3-Person Households | 744 (15.7%) | 10 (0.2%) |
| 4-Person Households | 471 (10.0%) | 0 (0.0%) |
| 5-Person Households | 184 (3.9%) | 23 (0.5%) |
| 6-Person Households | 108 (2.3%) | 0 (0.0%) |
| 7+ Person Households | 33 (0.7%) | 0 (0.0%) |
| Total | 3,181 (67.3%) | 1,546 (32.7%) |
Female Fertility in Screven County
Fertility by Age in Screven County
Average fertility rate in Screven County is 73.0 births per 1,000 women. Women in the age bracket of 20 to 34 years have the highest fertility rate with 141.0 births per 1,000 women. Women in the age bracket of 20 to 34 years acount for 80.3% of all women with births.

| Age Bracket | Women with Births | Births / 1,000 Women |
| 15 to 19 years | 0 (0.0%) | 0.0 |
| 20 to 34 years | 171 (80.3%) | 141.0 |
| 35 to 50 years | 42 (19.7%) | 32.0 |
| Total | 213 (100.0%) | 73.0 |
Fertility by Age by Marriage Status in Screven County
39.0% of women with births (213) in Screven County are married. The highest percentage of unmarried women with births falls into 20 to 34 years age bracket with 76.0% of them unmarried at the time of birth, while the lowest percentage of unmarried women with births belong to 35 to 50 years age bracket with 0.0% of them unmarried.

| Age Bracket | Married | Unmarried |
| 15 to 19 years | 0 (0.0%) | 0 (0.0%) |
| 20 to 34 years | 41 (24.0%) | 130 (76.0%) |
| 35 to 50 years | 42 (100.0%) | 0 (0.0%) |
| Total | 83 (39.0%) | 130 (61.0%) |
Fertility by Education in Screven County

| Educational Attainment | Women with Births | Births / 1,000 Women |
| Less than High School | 4 (1.9%) | 7.0 |
| High School Diploma | 82 (38.5%) | 111.0 |
| College or Associate's Degree | 84 (39.4%) | 78.0 |
| Bachelor's Degree | 43 (20.2%) | 128.0 |
| Graduate Degree | 0 (0.0%) | 0.0 |
| Total | 213 (100.0%) | 73.0 |
Fertility by Education by Marriage Status in Screven County
61.0% of women with births in Screven County are unmarried. Women with the educational attainment of bachelor's degree are most likely to be married with 100.0% of them married at childbirth, while women with the educational attainment of less than high school are least likely to be married with 100.0% of them unmarried at childbirth.
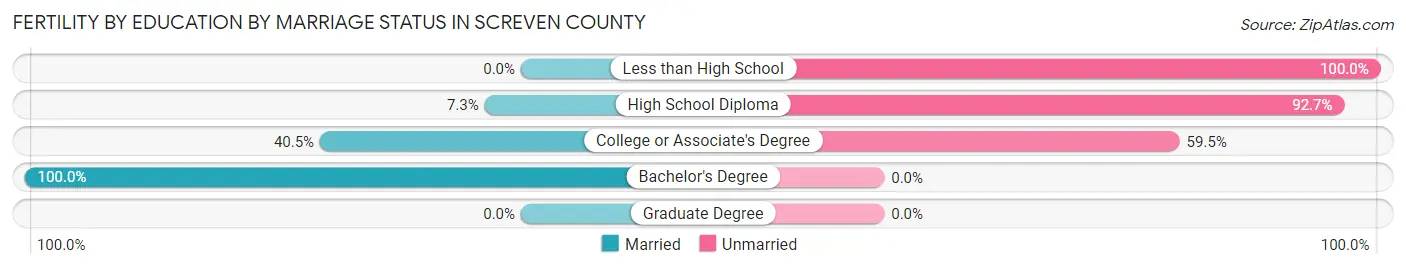
| Educational Attainment | Married | Unmarried |
| Less than High School | 0 (0.0%) | 4 (100.0%) |
| High School Diploma | 6 (7.3%) | 76 (92.7%) |
| College or Associate's Degree | 34 (40.5%) | 50 (59.5%) |
| Bachelor's Degree | 43 (100.0%) | 0 (0.0%) |
| Graduate Degree | 0 (0.0%) | 0 (0.0%) |
| Total | 83 (39.0%) | 130 (61.0%) |
Income in Screven County
Income Overview in Screven County
Per Capita Income in Screven County is $28,356, while median incomes of families and households are $70,292 and $49,941 respectively.
| Characteristic | Number | Measure |
| Per Capita Income | 14,026 | $28,356 |
| Median Family Income | 3,181 | $70,292 |
| Mean Family Income | 3,181 | $87,350 |
| Median Household Income | 4,727 | $49,941 |
| Mean Household Income | 4,727 | $73,243 |
| Income Deficit | 3,181 | $0 |
| Wage / Income Gap (%) | 14,026 | 28.94% |
| Wage / Income Gap ($) | 14,026 | 71.06¢ per $1 |
| Gini / Inequality Index | 14,026 | 0.48 |
Earnings by Sex in Screven County
Average Earnings in Screven County are $31,129, $38,228 for men and $27,166 for women, a difference of 28.9%.
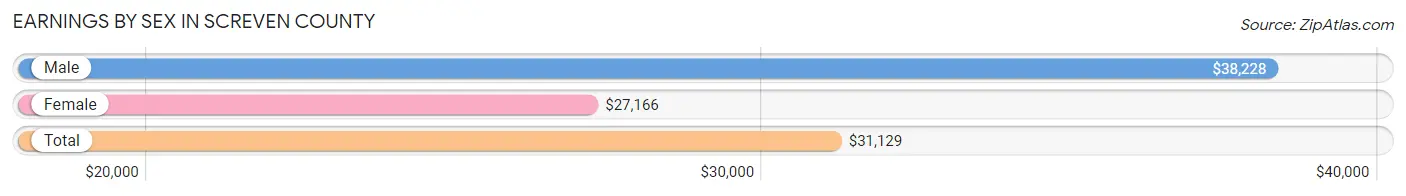
| Sex | Number | Average Earnings |
| Male | 3,170 (48.7%) | $38,228 |
| Female | 3,344 (51.3%) | $27,166 |
| Total | 6,514 (100.0%) | $31,129 |
Earnings by Sex by Income Bracket in Screven County
The most common earnings brackets in Screven County are $100,000+ for men (366 | 11.6%) and $30,000 to $34,999 for women (477 | 14.3%).
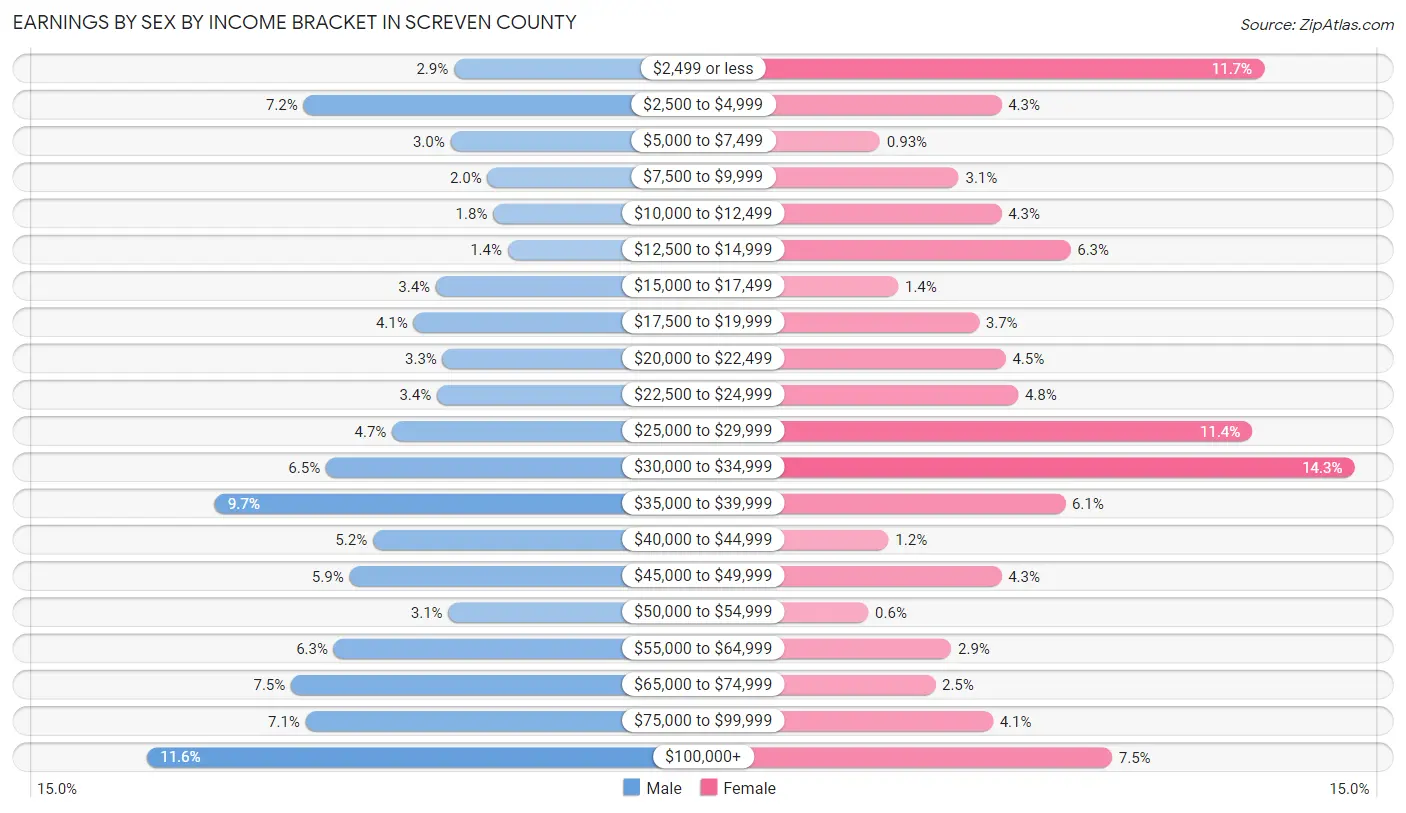
| Income | Male | Female |
| $2,499 or less | 93 (2.9%) | 392 (11.7%) |
| $2,500 to $4,999 | 227 (7.2%) | 145 (4.3%) |
| $5,000 to $7,499 | 96 (3.0%) | 31 (0.9%) |
| $7,500 to $9,999 | 63 (2.0%) | 105 (3.1%) |
| $10,000 to $12,499 | 58 (1.8%) | 145 (4.3%) |
| $12,500 to $14,999 | 45 (1.4%) | 210 (6.3%) |
| $15,000 to $17,499 | 109 (3.4%) | 48 (1.4%) |
| $17,500 to $19,999 | 129 (4.1%) | 124 (3.7%) |
| $20,000 to $22,499 | 103 (3.3%) | 149 (4.5%) |
| $22,500 to $24,999 | 108 (3.4%) | 161 (4.8%) |
| $25,000 to $29,999 | 148 (4.7%) | 381 (11.4%) |
| $30,000 to $34,999 | 207 (6.5%) | 477 (14.3%) |
| $35,000 to $39,999 | 306 (9.7%) | 205 (6.1%) |
| $40,000 to $44,999 | 165 (5.2%) | 39 (1.2%) |
| $45,000 to $49,999 | 186 (5.9%) | 145 (4.3%) |
| $50,000 to $54,999 | 98 (3.1%) | 20 (0.6%) |
| $55,000 to $64,999 | 200 (6.3%) | 98 (2.9%) |
| $65,000 to $74,999 | 238 (7.5%) | 83 (2.5%) |
| $75,000 to $99,999 | 225 (7.1%) | 137 (4.1%) |
| $100,000+ | 366 (11.6%) | 249 (7.4%) |
| Total | 3,170 (100.0%) | 3,344 (100.0%) |
Earnings by Sex by Educational Attainment in Screven County
Average earnings in Screven County are $40,602 for men and $27,806 for women, a difference of 31.5%. Men with an educational attainment of bachelor's degree enjoy the highest average annual earnings of $82,171, while those with high school diploma education earn the least with $37,209. Women with an educational attainment of graduate degree earn the most with the average annual earnings of $60,089, while those with less than high school education have the smallest earnings of $21,801.
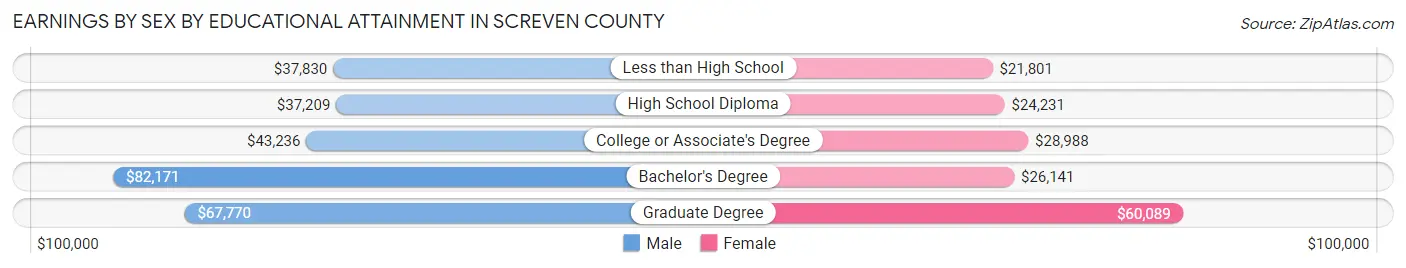
| Educational Attainment | Male Income | Female Income |
| Less than High School | $37,830 | $21,801 |
| High School Diploma | $37,209 | $24,231 |
| College or Associate's Degree | $43,236 | $28,988 |
| Bachelor's Degree | $82,171 | $26,141 |
| Graduate Degree | $67,770 | $60,089 |
| Total | $40,602 | $27,806 |
Family Income in Screven County
Family Income Brackets in Screven County
According to the Screven County family income data, there are 678 families falling into the $50,000 to $74,999 income range, which is the most common income bracket and makes up 21.3% of all families. Conversely, the $10,000 to $14,999 income bracket is the least frequent group with only 80 families (2.5%) belonging to this category.
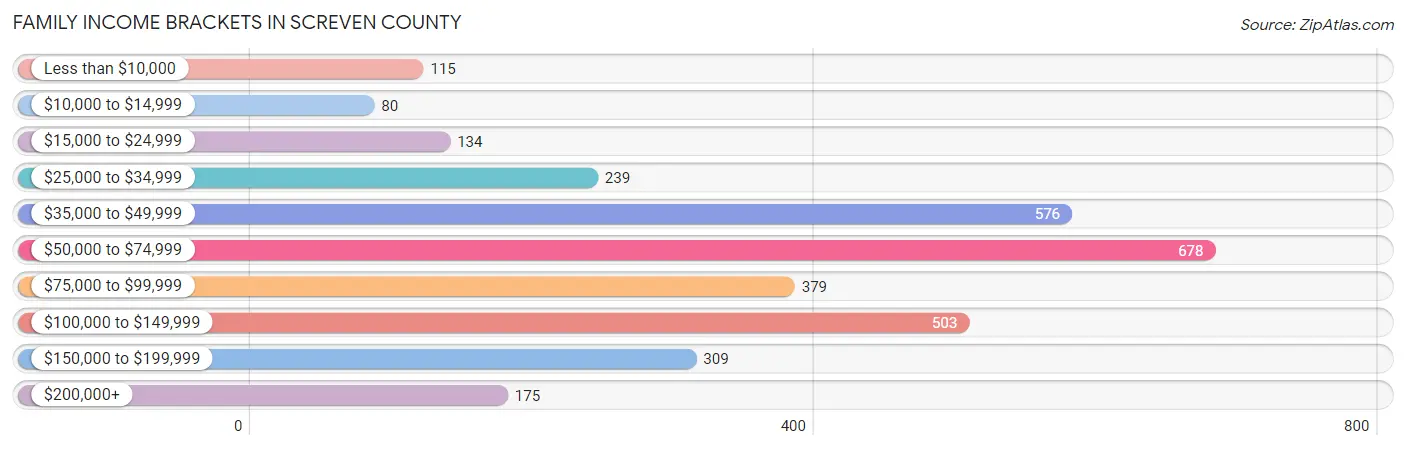
| Income Bracket | # Families | % Families |
| Less than $10,000 | 115 | 3.6% |
| $10,000 to $14,999 | 80 | 2.5% |
| $15,000 to $24,999 | 134 | 4.2% |
| $25,000 to $34,999 | 239 | 7.5% |
| $35,000 to $49,999 | 576 | 18.1% |
| $50,000 to $74,999 | 678 | 21.3% |
| $75,000 to $99,999 | 379 | 11.9% |
| $100,000 to $149,999 | 503 | 15.8% |
| $150,000 to $199,999 | 309 | 9.7% |
| $200,000+ | 175 | 5.5% |
Family Income by Famaliy Size in Screven County
4-person families (441 | 13.9%) account for the highest median family income in Screven County with $115,568 per family, while 2-person families (1,734 | 54.5%) have the highest median income of $31,146 per family member.

| Income Bracket | # Families | Median Income |
| 2-Person Families | 1,734 (54.5%) | $62,292 |
| 3-Person Families | 693 (21.8%) | $72,689 |
| 4-Person Families | 441 (13.9%) | $115,568 |
| 5-Person Families | 172 (5.4%) | $37,803 |
| 6-Person Families | 117 (3.7%) | $96,298 |
| 7+ Person Families | 24 (0.7%) | $0 |
| Total | 3,181 (100.0%) | $70,292 |
Family Income by Number of Earners in Screven County
The median family income in Screven County is $70,292, with families comprising 3+ earners (220) having the highest median family income of $97,404, while families with no earners (695) have the lowest median family income of $32,111, accounting for 6.9% and 21.8% of families, respectively.
| Number of Earners | # Families | Median Income |
| No Earners | 695 (21.8%) | $32,111 |
| 1 Earner | 940 (29.5%) | $64,028 |
| 2 Earners | 1,326 (41.7%) | $89,015 |
| 3+ Earners | 220 (6.9%) | $97,404 |
| Total | 3,181 (100.0%) | $70,292 |
Household Income in Screven County
Household Income Brackets in Screven County
With 808 households falling in the category, the $50,000 to $74,999 income range is the most frequent in Screven County, accounting for 17.1% of all households. In contrast, only 189 households (4.0%) fall into the $200,000+ income bracket, making it the least populous group.
| Income Bracket | # Households | % Households |
| Less than $10,000 | 303 | 6.4% |
| $10,000 to $14,999 | 293 | 6.2% |
| $15,000 to $24,999 | 539 | 11.4% |
| $25,000 to $34,999 | 511 | 10.8% |
| $35,000 to $49,999 | 719 | 15.2% |
| $50,000 to $74,999 | 808 | 17.1% |
| $75,000 to $99,999 | 440 | 9.3% |
| $100,000 to $149,999 | 619 | 13.1% |
| $150,000 to $199,999 | 307 | 6.5% |
| $200,000+ | 189 | 4.0% |
Household Income by Householder Age in Screven County
The median household income in Screven County is $49,941, with the highest median household income of $63,011 found in the 25 to 44 years age bracket for the primary householder. A total of 836 households (17.7%) fall into this category. Meanwhile, the 15 to 24 years age bracket for the primary householder has the lowest median household income of $31,719, with 150 households (3.2%) in this group.

| Income Bracket | # Households | Median Income |
| 15 to 24 Years | 150 (3.2%) | $31,719 |
| 25 to 44 Years | 836 (17.7%) | $63,011 |
| 45 to 64 Years | 2,075 (43.9%) | $62,371 |
| 65+ Years | 1,666 (35.2%) | $35,711 |
| Total | 4,727 (100.0%) | $49,941 |
Poverty in Screven County
Income Below Poverty by Sex and Age in Screven County
With 13.7% poverty level for males and 22.6% for females among the residents of Screven County, 5 year old males and 15 year old females are the most vulnerable to poverty, with 56 males (100.0%) and 64 females (66.0%) in their respective age groups living below the poverty level.

| Age Bracket | Male | Female |
| Under 5 Years | 105 (34.8%) | 239 (51.8%) |
| 5 Years | 56 (100.0%) | 11 (25.0%) |
| 6 to 11 Years | 141 (34.4%) | 242 (48.2%) |
| 12 to 14 Years | 61 (17.6%) | 82 (28.4%) |
| 15 Years | 9 (13.6%) | 64 (66.0%) |
| 16 and 17 Years | 7 (9.5%) | 2 (2.0%) |
| 18 to 24 Years | 29 (8.5%) | 110 (22.2%) |
| 25 to 34 Years | 62 (7.5%) | 316 (34.8%) |
| 35 to 44 Years | 89 (9.1%) | 61 (7.4%) |
| 45 to 54 Years | 89 (11.4%) | 75 (8.4%) |
| 55 to 64 Years | 164 (16.3%) | 163 (14.5%) |
| 65 to 74 Years | 50 (5.8%) | 208 (23.7%) |
| 75 Years and over | 19 (5.1%) | 57 (9.5%) |
| Total | 881 (13.7%) | 1,630 (22.6%) |
Income Above Poverty by Sex and Age in Screven County
According to the poverty statistics in Screven County, males aged 75 years and over and females aged 16 and 17 years are the age groups that are most secure financially, with 95.0% of males and 98.0% of females in these age groups living above the poverty line.
| Age Bracket | Male | Female |
| Under 5 Years | 197 (65.2%) | 222 (48.2%) |
| 5 Years | 0 (0.0%) | 33 (75.0%) |
| 6 to 11 Years | 269 (65.6%) | 260 (51.8%) |
| 12 to 14 Years | 286 (82.4%) | 207 (71.6%) |
| 15 Years | 57 (86.4%) | 33 (34.0%) |
| 16 and 17 Years | 67 (90.5%) | 100 (98.0%) |
| 18 to 24 Years | 311 (91.5%) | 385 (77.8%) |
| 25 to 34 Years | 761 (92.5%) | 592 (65.2%) |
| 35 to 44 Years | 890 (90.9%) | 759 (92.6%) |
| 45 to 54 Years | 692 (88.6%) | 819 (91.6%) |
| 55 to 64 Years | 841 (83.7%) | 961 (85.5%) |
| 65 to 74 Years | 812 (94.2%) | 669 (76.3%) |
| 75 Years and over | 357 (95.0%) | 541 (90.5%) |
| Total | 5,540 (86.3%) | 5,581 (77.4%) |
Income Below Poverty Among Married-Couple Families in Screven County
The poverty statistics for married-couple families in Screven County show that 4.0% or 92 of the total 2,288 families live below the poverty line. Families with 3 or 4 children have the highest poverty rate of 16.0%, comprising of 25 families. On the other hand, families with 1 or 2 children have the lowest poverty rate of 2.2%, which includes 12 families.
| Children | Above Poverty | Below Poverty |
| No Children | 1,501 (96.6%) | 53 (3.4%) |
| 1 or 2 Children | 542 (97.8%) | 12 (2.2%) |
| 3 or 4 Children | 131 (84.0%) | 25 (16.0%) |
| 5 or more Children | 22 (91.7%) | 2 (8.3%) |
| Total | 2,196 (96.0%) | 92 (4.0%) |
Income Below Poverty Among Single-Parent Households in Screven County
According to the poverty data in Screven County, 3.5% or 3 single-father households and 27.5% or 222 single-mother households are living below the poverty line. Among single-father households, those with 1 or 2 children have the highest poverty rate, with 3 households (5.9%) experiencing poverty. Likewise, among single-mother households, those with 3 or 4 children have the highest poverty rate, with 94 households (64.8%) falling below the poverty line.
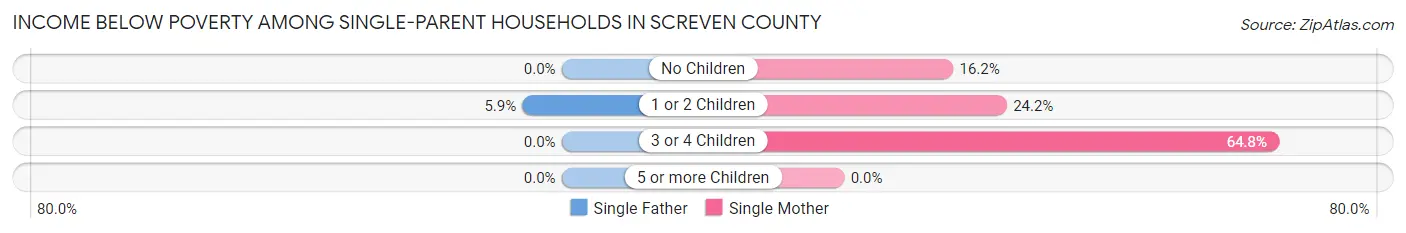
| Children | Single Father | Single Mother |
| No Children | 0 (0.0%) | 66 (16.2%) |
| 1 or 2 Children | 3 (5.9%) | 62 (24.2%) |
| 3 or 4 Children | 0 (0.0%) | 94 (64.8%) |
| 5 or more Children | 0 (0.0%) | 0 (0.0%) |
| Total | 3 (3.5%) | 222 (27.5%) |
Income Below Poverty Among Married-Couple vs Single-Parent Households in Screven County
The poverty data for Screven County shows that 92 of the married-couple family households (4.0%) and 225 of the single-parent households (25.2%) are living below the poverty level. Within the married-couple family households, those with 3 or 4 children have the highest poverty rate, with 25 households (16.0%) falling below the poverty line. Among the single-parent households, those with 3 or 4 children have the highest poverty rate, with 94 household (63.5%) living below poverty.
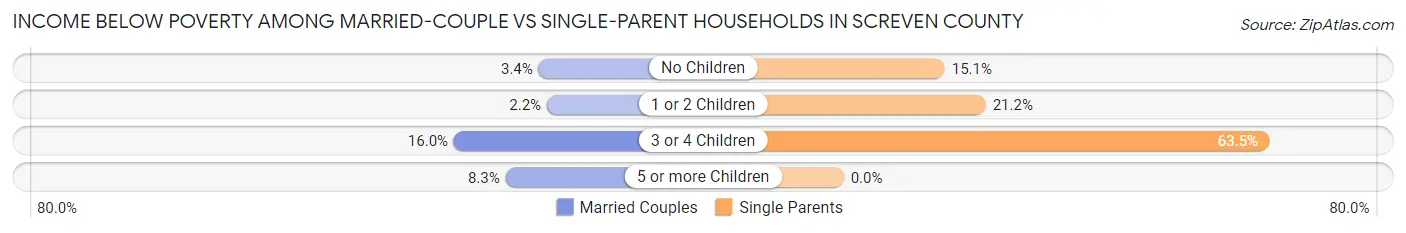
| Children | Married-Couple Families | Single-Parent Households |
| No Children | 53 (3.4%) | 66 (15.1%) |
| 1 or 2 Children | 12 (2.2%) | 65 (21.2%) |
| 3 or 4 Children | 25 (16.0%) | 94 (63.5%) |
| 5 or more Children | 2 (8.3%) | 0 (0.0%) |
| Total | 92 (4.0%) | 225 (25.2%) |
Employment Characteristics in Screven County
Employment by Class of Employer in Screven County
Among the 5,799 employed individuals in Screven County, private company employees (3,828 | 66.0%), self-employed (not incorporated) (434 | 7.5%), and state government employees (431 | 7.4%) make up the most common classes of employment.
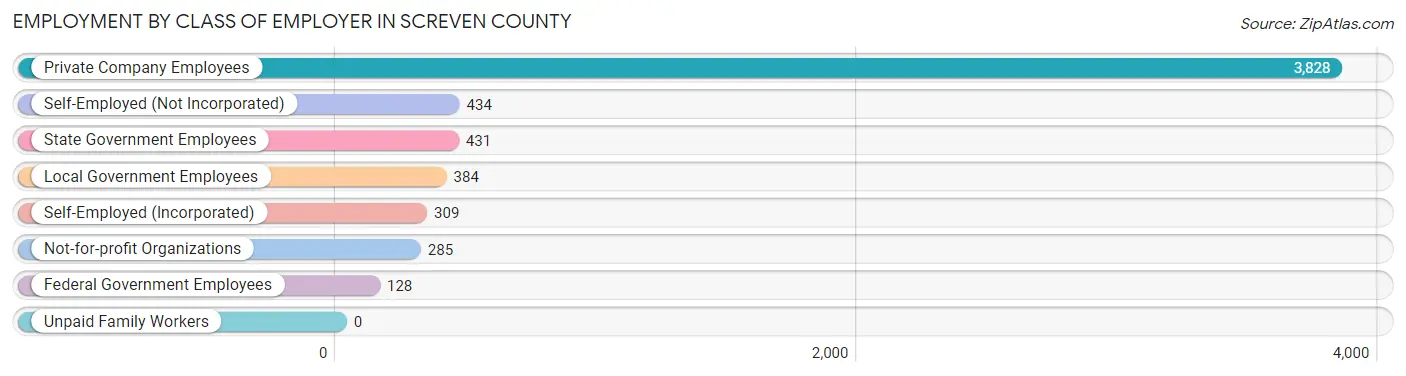
| Employer Class | # Employees | % Employees |
| Private Company Employees | 3,828 | 66.0% |
| Self-Employed (Incorporated) | 309 | 5.3% |
| Self-Employed (Not Incorporated) | 434 | 7.5% |
| Not-for-profit Organizations | 285 | 4.9% |
| Local Government Employees | 384 | 6.6% |
| State Government Employees | 431 | 7.4% |
| Federal Government Employees | 128 | 2.2% |
| Unpaid Family Workers | 0 | 0.0% |
| Total | 5,799 | 100.0% |
Employment Status by Age in Screven County
According to the labor force statistics for Screven County, out of the total population over 16 years of age (11,351), 56.4% or 6,402 individuals are in the labor force, with 7.2% or 461 of them unemployed. The age group with the highest labor force participation rate is 25 to 29 years, with 80.2% or 810 individuals in the labor force. Within the labor force, the 16 to 19 years age range has the highest percentage of unemployed individuals, with 49.4% or 129 of them being unemployed.
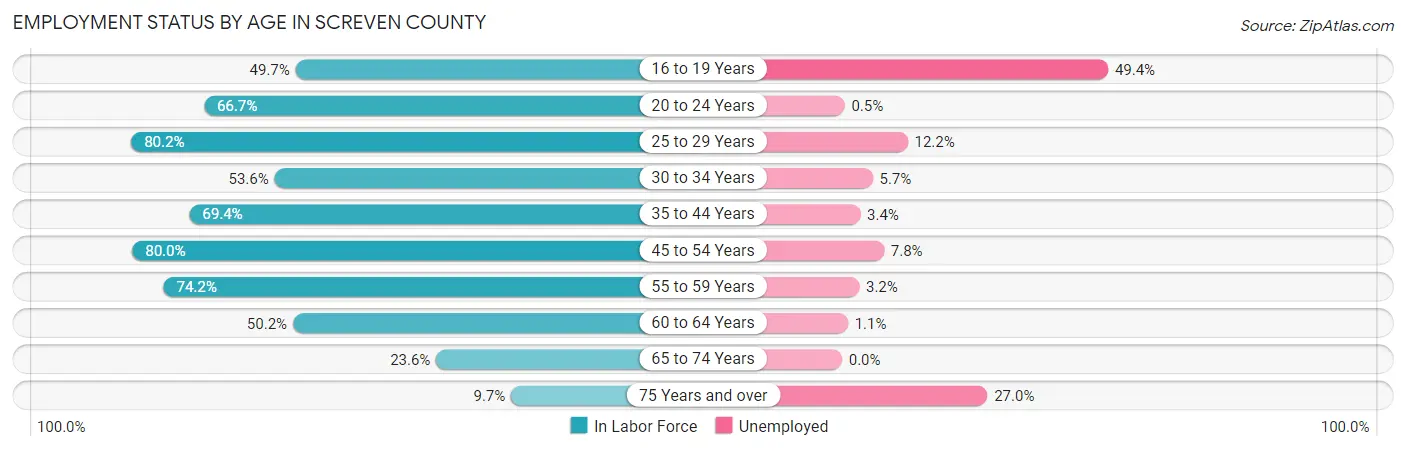
| Age Bracket | In Labor Force | Unemployed |
| 16 to 19 Years | 261 (49.7%) | 129 (49.4%) |
| 20 to 24 Years | 384 (66.7%) | 2 (0.5%) |
| 25 to 29 Years | 810 (80.2%) | 99 (12.2%) |
| 30 to 34 Years | 405 (53.6%) | 23 (5.7%) |
| 35 to 44 Years | 1,280 (69.4%) | 44 (3.4%) |
| 45 to 54 Years | 1,350 (80.0%) | 105 (7.8%) |
| 55 to 59 Years | 963 (74.2%) | 31 (3.2%) |
| 60 to 64 Years | 437 (50.2%) | 5 (1.1%) |
| 65 to 74 Years | 414 (23.6%) | 0 (0.0%) |
| 75 Years and over | 100 (9.7%) | 27 (27.0%) |
| Total | 6,402 (56.4%) | 461 (7.2%) |
Employment Status by Educational Attainment in Screven County
According to labor force statistics for Screven County, 70.2% of individuals (5,241) out of the total population between 25 and 64 years of age (7,466) are in the labor force, with 5.8% or 304 of them being unemployed. The group with the highest labor force participation rate are those with the educational attainment of college / associate degree, with 85.7% or 2,164 individuals in the labor force. Within the labor force, individuals with less than high school education have the highest percentage of unemployment, with 15.0% or 63 of them being unemployed.

| Educational Attainment | In Labor Force | Unemployed |
| Less than High School | 421 (42.4%) | 149 (15.0%) |
| High School Diploma | 1,711 (61.6%) | 94 (3.4%) |
| College / Associate Degree | 2,164 (85.7%) | 91 (3.6%) |
| Bachelor's Degree or higher | 948 (81.0%) | 128 (10.9%) |
| Total | 5,241 (70.2%) | 433 (5.8%) |
Employment Occupations by Sex in Screven County
Management, Business, Science and Arts Occupations
The most common Management, Business, Science and Arts occupations in Screven County are Management (485 | 8.2%), Community & Social Service (476 | 8.1%), Health Diagnosing & Treating (361 | 6.1%), Health Technologists (258 | 4.4%), and Computers, Engineering & Science (228 | 3.9%).

Management, Business, Science and Arts Occupations by Sex
Within the Management, Business, Science and Arts occupations in Screven County, the most male-oriented occupations are Arts, Media & Entertainment (100.0%), Computers & Mathematics (88.9%), and Life, Physical & Social Science (86.8%), while the most female-oriented occupations are Health Diagnosing & Treating (93.6%), Health Technologists (91.1%), and Education Instruction & Library (87.4%).
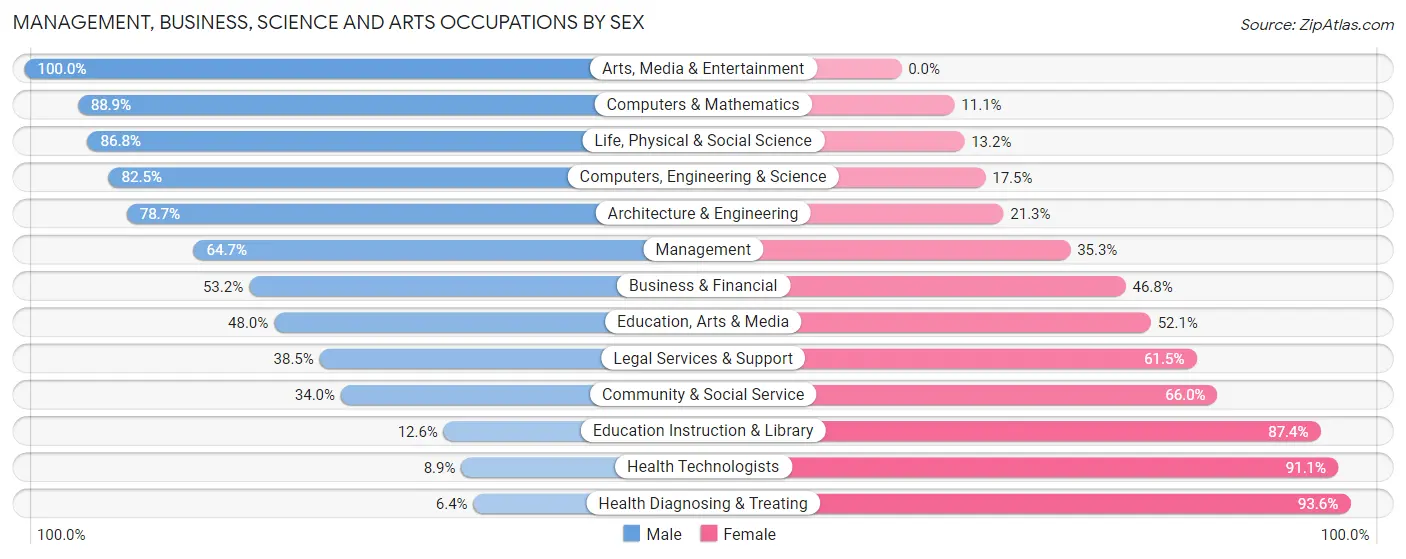
| Occupation | Male | Female |
| Management | 314 (64.7%) | 171 (35.3%) |
| Business & Financial | 25 (53.2%) | 22 (46.8%) |
| Computers, Engineering & Science | 188 (82.5%) | 40 (17.5%) |
| Computers & Mathematics | 48 (88.9%) | 6 (11.1%) |
| Architecture & Engineering | 107 (78.7%) | 29 (21.3%) |
| Life, Physical & Social Science | 33 (86.8%) | 5 (13.2%) |
| Community & Social Service | 162 (34.0%) | 314 (66.0%) |
| Education, Arts & Media | 105 (47.9%) | 114 (52.0%) |
| Legal Services & Support | 25 (38.5%) | 40 (61.5%) |
| Education Instruction & Library | 23 (12.6%) | 160 (87.4%) |
| Arts, Media & Entertainment | 9 (100.0%) | 0 (0.0%) |
| Health Diagnosing & Treating | 23 (6.4%) | 338 (93.6%) |
| Health Technologists | 23 (8.9%) | 235 (91.1%) |
| Total (Category) | 712 (44.6%) | 885 (55.4%) |
| Total (Overall) | 2,821 (47.9%) | 3,073 (52.1%) |
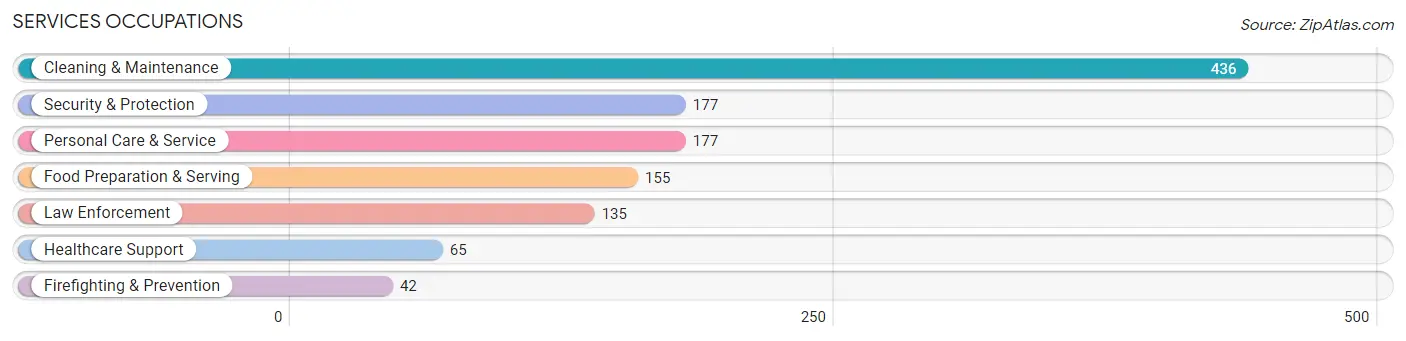
Services Occupations
The most common Services occupations in Screven County are Cleaning & Maintenance (436 | 7.4%), Security & Protection (177 | 3.0%), Personal Care & Service (177 | 3.0%), Food Preparation & Serving (155 | 2.6%), and Law Enforcement (135 | 2.3%).
Services Occupations by Sex
Within the Services occupations in Screven County, the most male-oriented occupations are Law Enforcement (87.4%), Security & Protection (74.0%), and Cleaning & Maintenance (38.1%), while the most female-oriented occupations are Healthcare Support (100.0%), Food Preparation & Serving (91.0%), and Personal Care & Service (85.9%).
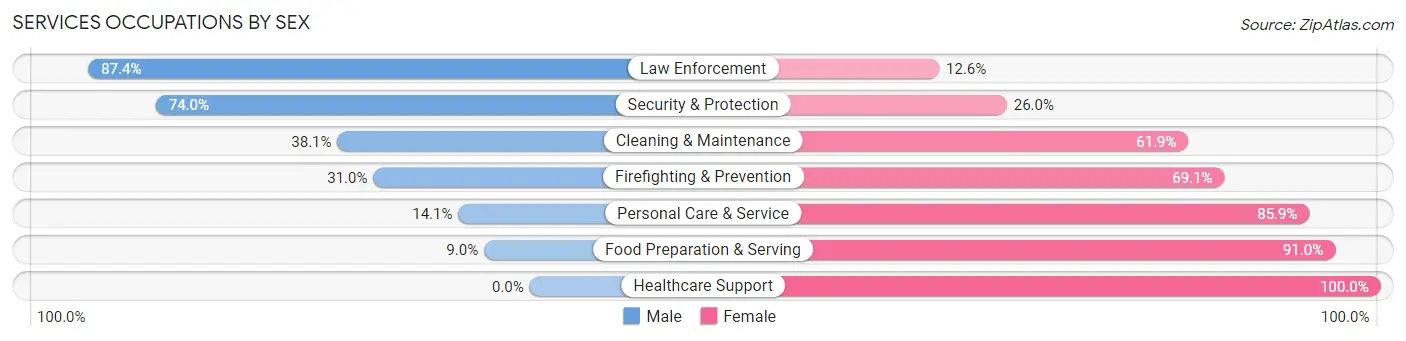
| Occupation | Male | Female |
| Healthcare Support | 0 (0.0%) | 65 (100.0%) |
| Security & Protection | 131 (74.0%) | 46 (26.0%) |
| Firefighting & Prevention | 13 (30.9%) | 29 (69.1%) |
| Law Enforcement | 118 (87.4%) | 17 (12.6%) |
| Food Preparation & Serving | 14 (9.0%) | 141 (91.0%) |
| Cleaning & Maintenance | 166 (38.1%) | 270 (61.9%) |
| Personal Care & Service | 25 (14.1%) | 152 (85.9%) |
| Total (Category) | 336 (33.3%) | 674 (66.7%) |
| Total (Overall) | 2,821 (47.9%) | 3,073 (52.1%) |
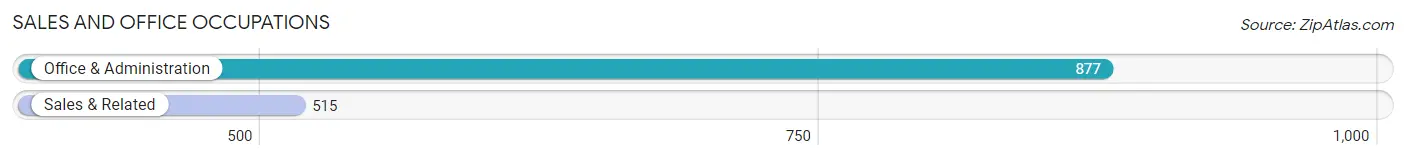
Sales and Office Occupations
The most common Sales and Office occupations in Screven County are Office & Administration (877 | 14.9%), and Sales & Related (515 | 8.7%).
Sales and Office Occupations by Sex
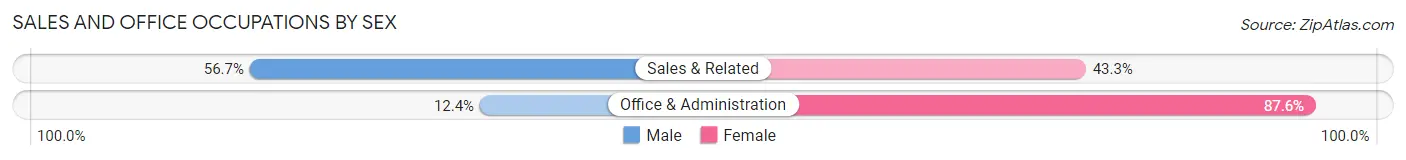
| Occupation | Male | Female |
| Sales & Related | 292 (56.7%) | 223 (43.3%) |
| Office & Administration | 109 (12.4%) | 768 (87.6%) |
| Total (Category) | 401 (28.8%) | 991 (71.2%) |
| Total (Overall) | 2,821 (47.9%) | 3,073 (52.1%) |
Natural Resources, Construction and Maintenance Occupations
The most common Natural Resources, Construction and Maintenance occupations in Screven County are Installation, Maintenance & Repair (338 | 5.7%), Construction & Extraction (260 | 4.4%), and Farming, Fishing & Forestry (207 | 3.5%).

Natural Resources, Construction and Maintenance Occupations by Sex
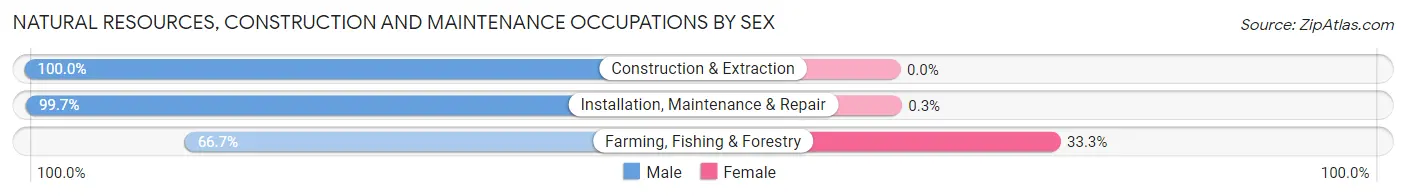
| Occupation | Male | Female |
| Farming, Fishing & Forestry | 138 (66.7%) | 69 (33.3%) |
| Construction & Extraction | 260 (100.0%) | 0 (0.0%) |
| Installation, Maintenance & Repair | 337 (99.7%) | 1 (0.3%) |
| Total (Category) | 735 (91.3%) | 70 (8.7%) |
| Total (Overall) | 2,821 (47.9%) | 3,073 (52.1%) |
Production, Transportation and Moving Occupations
The most common Production, Transportation and Moving occupations in Screven County are Production (500 | 8.5%), Material Moving (387 | 6.6%), and Transportation (203 | 3.4%).
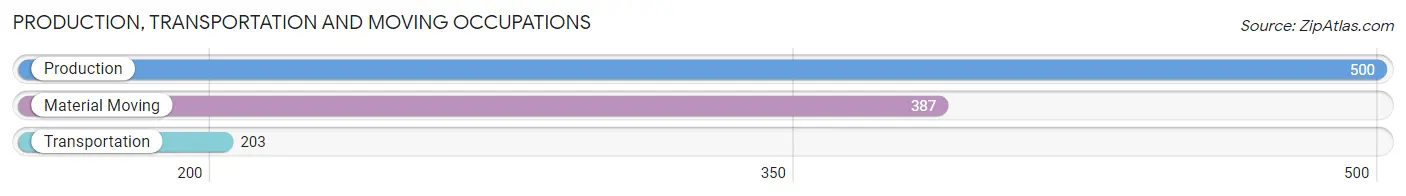
Production, Transportation and Moving Occupations by Sex
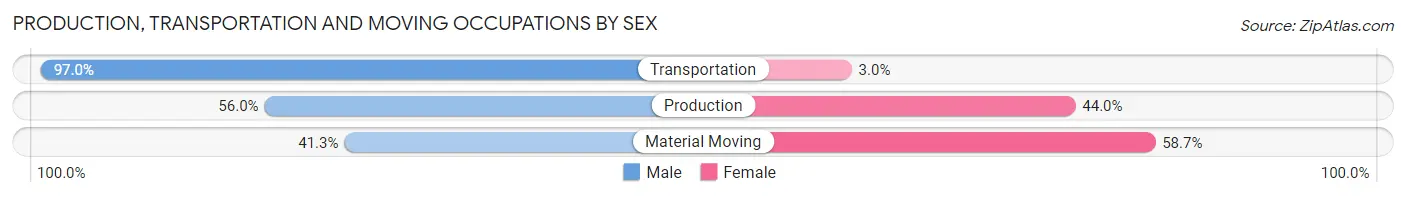
| Occupation | Male | Female |
| Production | 280 (56.0%) | 220 (44.0%) |
| Transportation | 197 (97.0%) | 6 (3.0%) |
| Material Moving | 160 (41.3%) | 227 (58.7%) |
| Total (Category) | 637 (58.4%) | 453 (41.6%) |
| Total (Overall) | 2,821 (47.9%) | 3,073 (52.1%) |
Employment Industries by Sex in Screven County
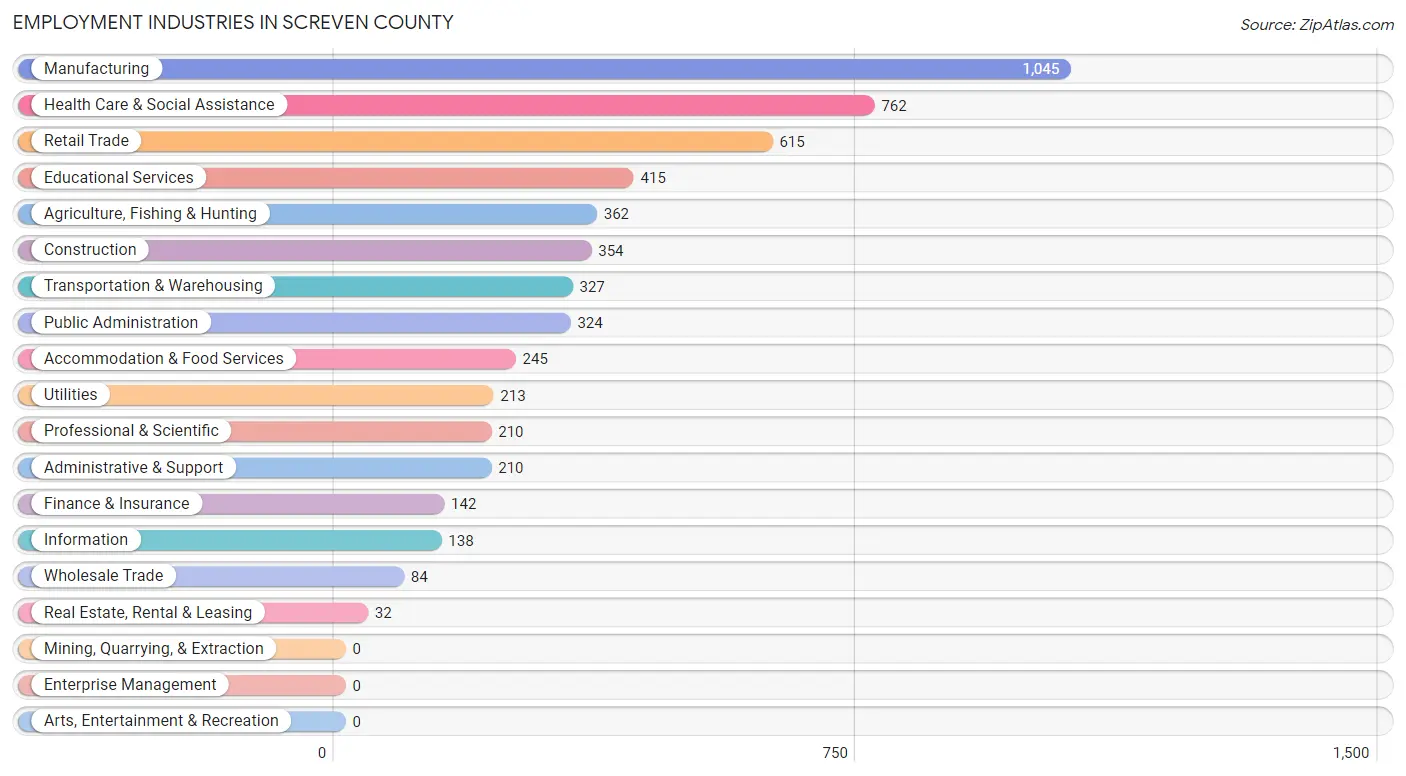
Employment Industries in Screven County
The major employment industries in Screven County include Manufacturing (1,045 | 17.7%), Health Care & Social Assistance (762 | 12.9%), Retail Trade (615 | 10.4%), Educational Services (415 | 7.0%), and Agriculture, Fishing & Hunting (362 | 6.1%).
Employment Industries by Sex in Screven County
The Screven County industries that see more men than women are Real Estate, Rental & Leasing (100.0%), Construction (92.1%), and Utilities (79.3%), whereas the industries that tend to have a higher number of women are Health Care & Social Assistance (94.5%), Accommodation & Food Services (82.5%), and Educational Services (81.0%).

| Industry | Male | Female |
| Agriculture, Fishing & Hunting | 263 (72.7%) | 99 (27.4%) |
| Mining, Quarrying, & Extraction | 0 (0.0%) | 0 (0.0%) |
| Construction | 326 (92.1%) | 28 (7.9%) |
| Manufacturing | 503 (48.1%) | 542 (51.9%) |
| Wholesale Trade | 55 (65.5%) | 29 (34.5%) |
| Retail Trade | 233 (37.9%) | 382 (62.1%) |
| Transportation & Warehousing | 200 (61.2%) | 127 (38.8%) |
| Utilities | 169 (79.3%) | 44 (20.7%) |
| Information | 108 (78.3%) | 30 (21.7%) |
| Finance & Insurance | 48 (33.8%) | 94 (66.2%) |
| Real Estate, Rental & Leasing | 32 (100.0%) | 0 (0.0%) |
| Professional & Scientific | 135 (64.3%) | 75 (35.7%) |
| Enterprise Management | 0 (0.0%) | 0 (0.0%) |
| Administrative & Support | 144 (68.6%) | 66 (31.4%) |
| Educational Services | 79 (19.0%) | 336 (81.0%) |
| Health Care & Social Assistance | 42 (5.5%) | 720 (94.5%) |
| Arts, Entertainment & Recreation | 0 (0.0%) | 0 (0.0%) |
| Accommodation & Food Services | 43 (17.5%) | 202 (82.5%) |
| Public Administration | 194 (59.9%) | 130 (40.1%) |
| Total | 2,821 (47.9%) | 3,073 (52.1%) |
Education in Screven County
School Enrollment in Screven County
The most common levels of schooling among the 2,726 students in Screven County are middle school (857 | 31.4%), high school (596 | 21.9%), and elementary school (573 | 21.0%).
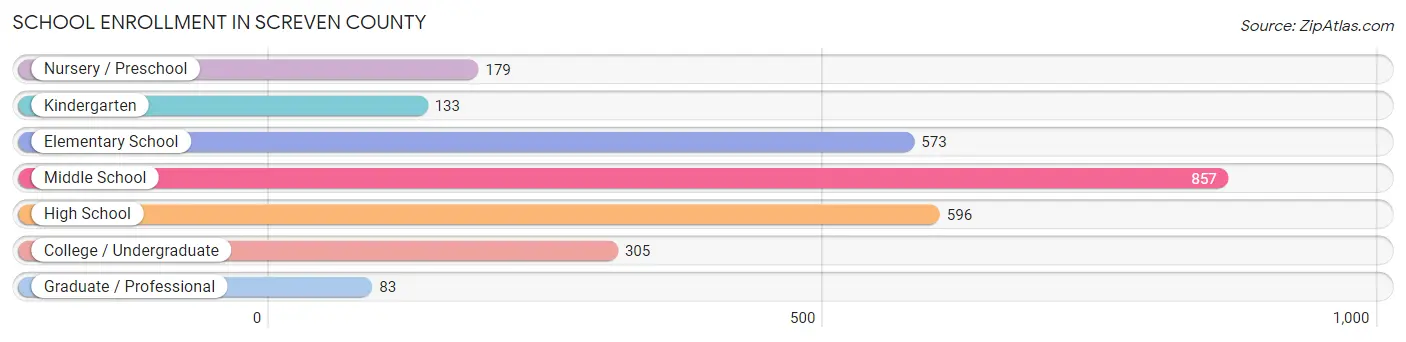
| School Level | # Students | % Students |
| Nursery / Preschool | 179 | 6.6% |
| Kindergarten | 133 | 4.9% |
| Elementary School | 573 | 21.0% |
| Middle School | 857 | 31.4% |
| High School | 596 | 21.9% |
| College / Undergraduate | 305 | 11.2% |
| Graduate / Professional | 83 | 3.0% |
| Total | 2,726 | 100.0% |
School Enrollment by Age by Funding Source in Screven County
Out of a total of 2,726 students who are enrolled in schools in Screven County, 414 (15.2%) attend a private institution, while the remaining 2,312 (84.8%) are enrolled in public schools. The age group of 25 to 34 year olds has the highest likelihood of being enrolled in private schools, with 42 (33.9% in the age bracket) enrolled. Conversely, the age group of 35 years and over has the lowest likelihood of being enrolled in a private school, with 100 (100.0% in the age bracket) attending a public institution.
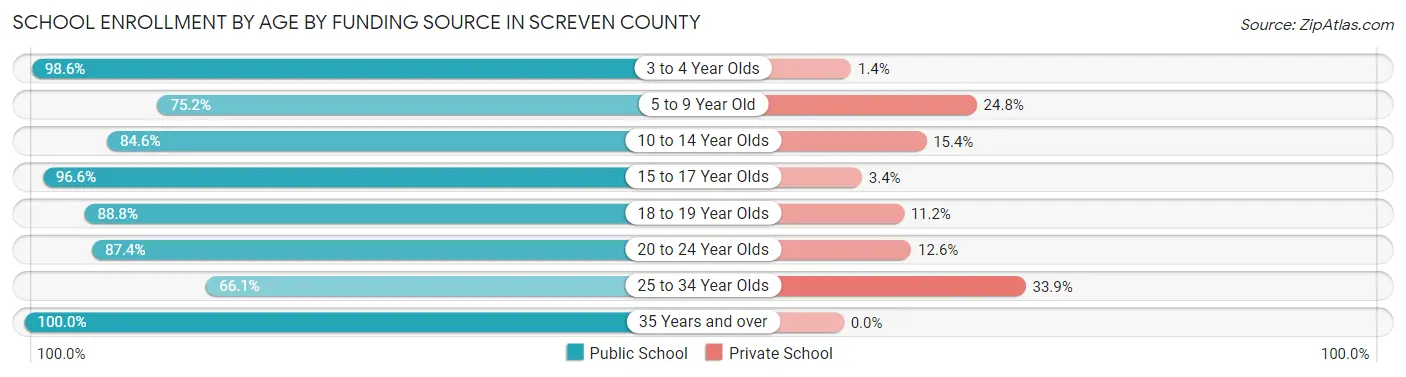
| Age Bracket | Public School | Private School |
| 3 to 4 Year Olds | 144 (98.6%) | 2 (1.4%) |
| 5 to 9 Year Old | 486 (75.2%) | 160 (24.8%) |
| 10 to 14 Year Olds | 870 (84.6%) | 158 (15.4%) |
| 15 to 17 Year Olds | 342 (96.6%) | 12 (3.4%) |
| 18 to 19 Year Olds | 143 (88.8%) | 18 (11.2%) |
| 20 to 24 Year Olds | 146 (87.4%) | 21 (12.6%) |
| 25 to 34 Year Olds | 82 (66.1%) | 42 (33.9%) |
| 35 Years and over | 100 (100.0%) | 0 (0.0%) |
| Total | 2,312 (84.8%) | 414 (15.2%) |
Educational Attainment by Field of Study in Screven County
Science & technology (337 | 19.6%), education (324 | 18.8%), business (253 | 14.7%), liberal arts & history (155 | 9.0%), and arts & humanities (142 | 8.2%) are the most common fields of study among 1,723 individuals in Screven County who have obtained a bachelor's degree or higher.
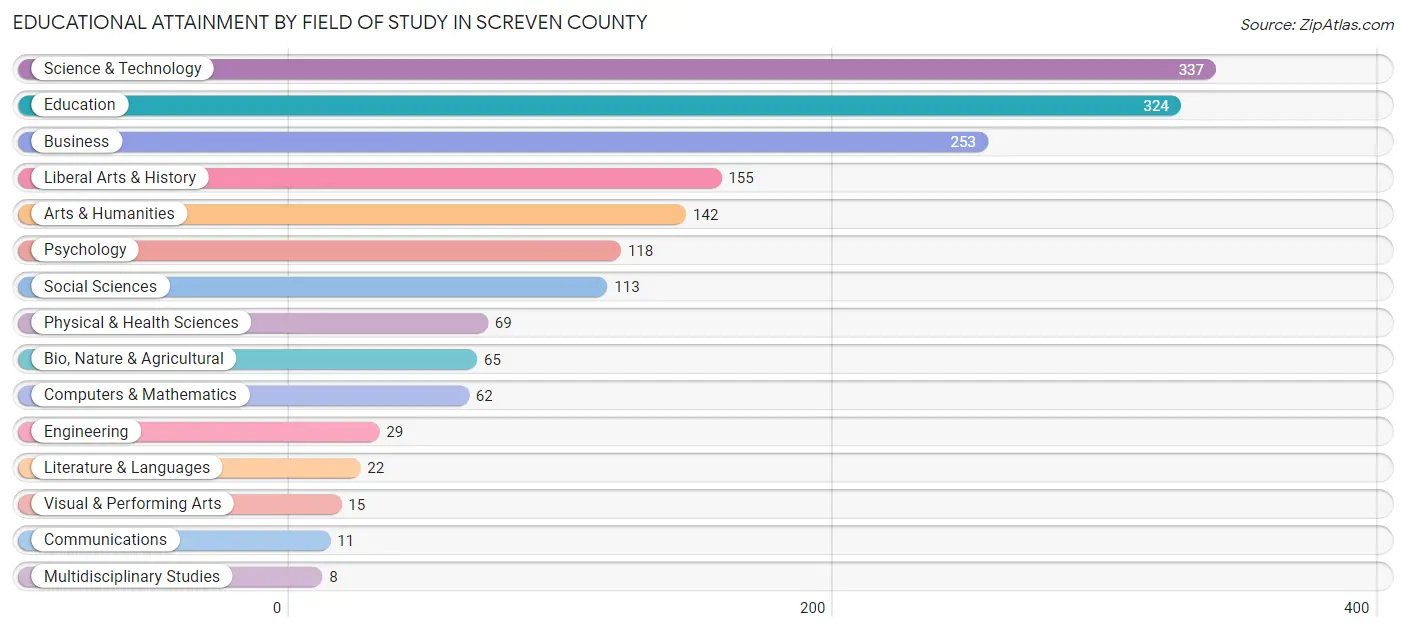
| Field of Study | # Graduates | % Graduates |
| Computers & Mathematics | 62 | 3.6% |
| Bio, Nature & Agricultural | 65 | 3.8% |
| Physical & Health Sciences | 69 | 4.0% |
| Psychology | 118 | 6.9% |
| Social Sciences | 113 | 6.6% |
| Engineering | 29 | 1.7% |
| Multidisciplinary Studies | 8 | 0.5% |
| Science & Technology | 337 | 19.6% |
| Business | 253 | 14.7% |
| Education | 324 | 18.8% |
| Literature & Languages | 22 | 1.3% |
| Liberal Arts & History | 155 | 9.0% |
| Visual & Performing Arts | 15 | 0.9% |
| Communications | 11 | 0.6% |
| Arts & Humanities | 142 | 8.2% |
| Total | 1,723 | 100.0% |
Transportation & Commute in Screven County
Vehicle Availability by Sex in Screven County
The most prevalent vehicle ownership categories in Screven County are males with 2 vehicles (933, accounting for 33.3%) and females with 2 vehicles (1,190, making up 31.4%).
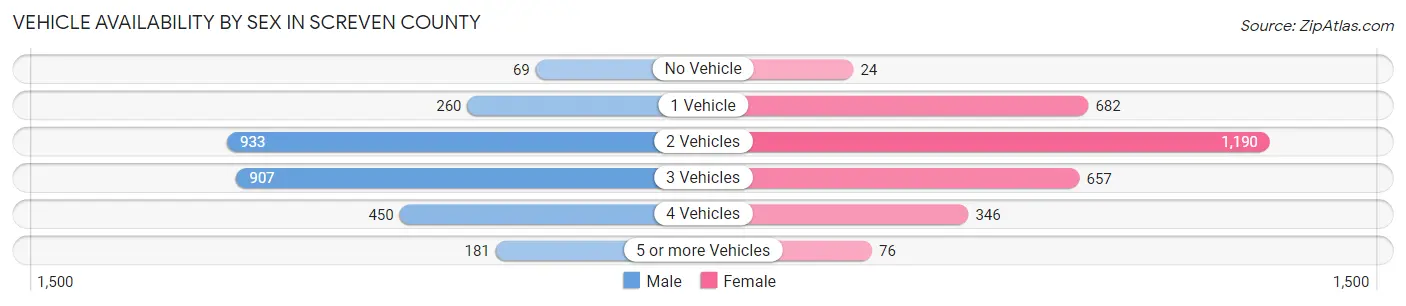
| Vehicles Available | Male | Female |
| No Vehicle | 69 (2.5%) | 24 (0.8%) |
| 1 Vehicle | 260 (9.3%) | 682 (22.9%) |
| 2 Vehicles | 933 (33.3%) | 1,190 (40.0%) |
| 3 Vehicles | 907 (32.4%) | 657 (22.1%) |
| 4 Vehicles | 450 (16.1%) | 346 (11.6%) |
| 5 or more Vehicles | 181 (6.5%) | 76 (2.5%) |
| Total | 2,800 (100.0%) | 2,975 (100.0%) |
Commute Time in Screven County
The most frequently occuring commute durations in Screven County are 5 to 9 minutes (875 commuters, 16.0%), 60 to 89 minutes (809 commuters, 14.7%), and 10 to 14 minutes (683 commuters, 12.4%).
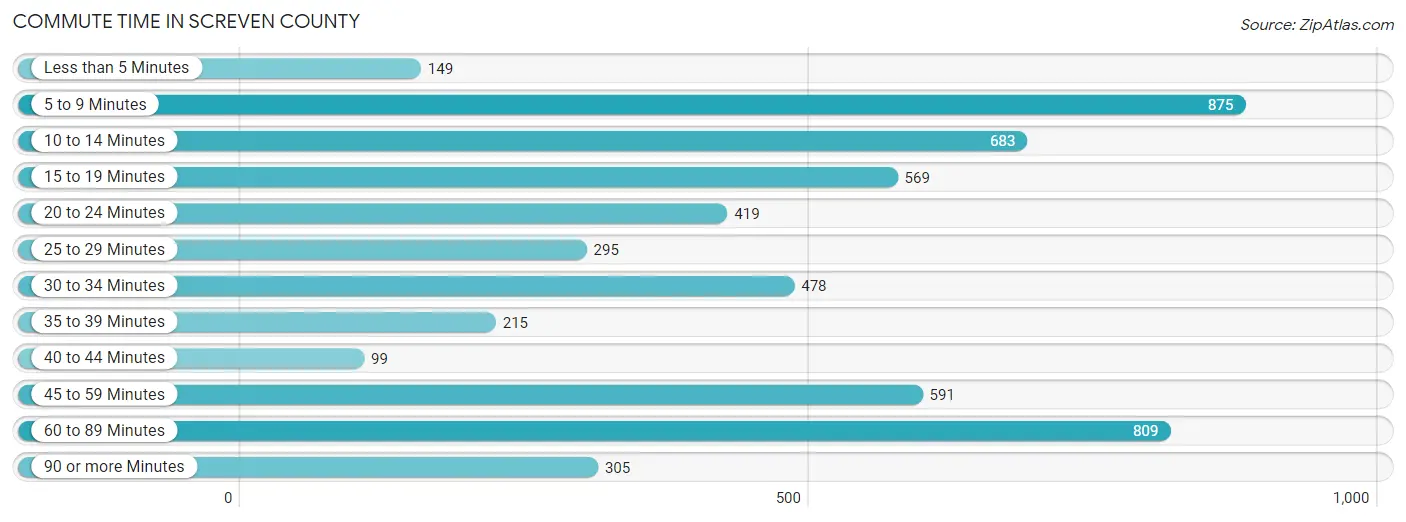
| Commute Time | # Commuters | % Commuters |
| Less than 5 Minutes | 149 | 2.7% |
| 5 to 9 Minutes | 875 | 16.0% |
| 10 to 14 Minutes | 683 | 12.4% |
| 15 to 19 Minutes | 569 | 10.4% |
| 20 to 24 Minutes | 419 | 7.6% |
| 25 to 29 Minutes | 295 | 5.4% |
| 30 to 34 Minutes | 478 | 8.7% |
| 35 to 39 Minutes | 215 | 3.9% |
| 40 to 44 Minutes | 99 | 1.8% |
| 45 to 59 Minutes | 591 | 10.8% |
| 60 to 89 Minutes | 809 | 14.7% |
| 90 or more Minutes | 305 | 5.6% |
Commute Time by Sex in Screven County
The most common commute times in Screven County are 60 to 89 minutes (477 commuters, 18.3%) for males and 5 to 9 minutes (480 commuters, 16.7%) for females.
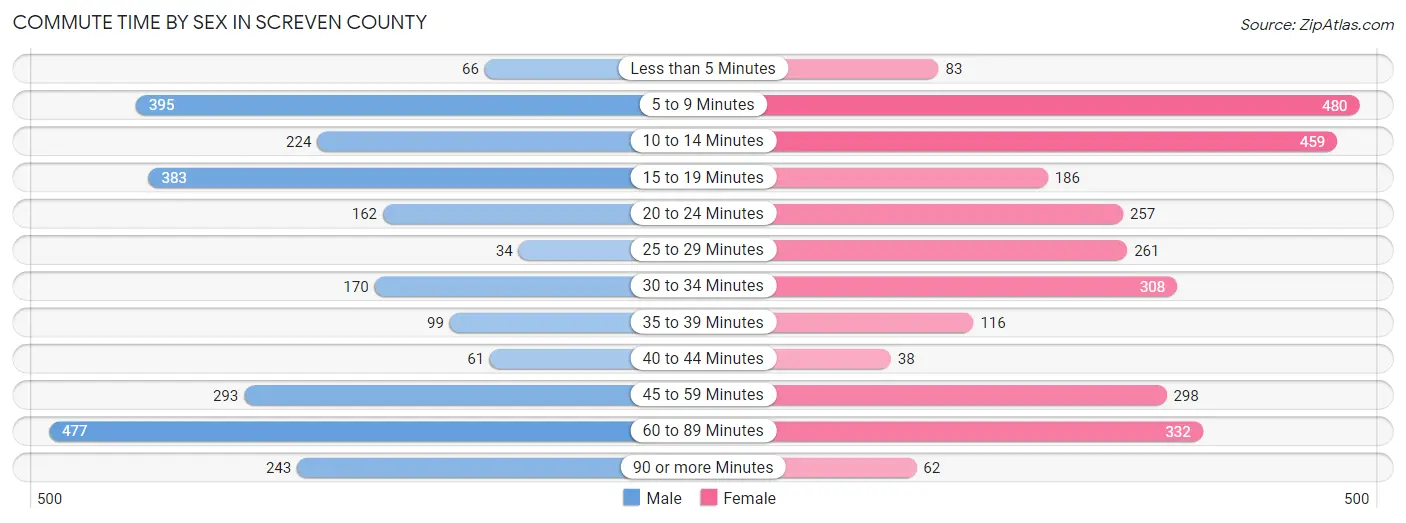
| Commute Time | Male | Female |
| Less than 5 Minutes | 66 (2.5%) | 83 (2.9%) |
| 5 to 9 Minutes | 395 (15.1%) | 480 (16.7%) |
| 10 to 14 Minutes | 224 (8.6%) | 459 (15.9%) |
| 15 to 19 Minutes | 383 (14.7%) | 186 (6.5%) |
| 20 to 24 Minutes | 162 (6.2%) | 257 (8.9%) |
| 25 to 29 Minutes | 34 (1.3%) | 261 (9.1%) |
| 30 to 34 Minutes | 170 (6.5%) | 308 (10.7%) |
| 35 to 39 Minutes | 99 (3.8%) | 116 (4.0%) |
| 40 to 44 Minutes | 61 (2.3%) | 38 (1.3%) |
| 45 to 59 Minutes | 293 (11.2%) | 298 (10.3%) |
| 60 to 89 Minutes | 477 (18.3%) | 332 (11.5%) |
| 90 or more Minutes | 243 (9.3%) | 62 (2.1%) |
Time of Departure to Work by Sex in Screven County
The most frequent times of departure to work in Screven County are 12:00 AM to 4:59 AM (387, 14.8%) for males and 7:00 AM to 7:29 AM (675, 23.4%) for females.
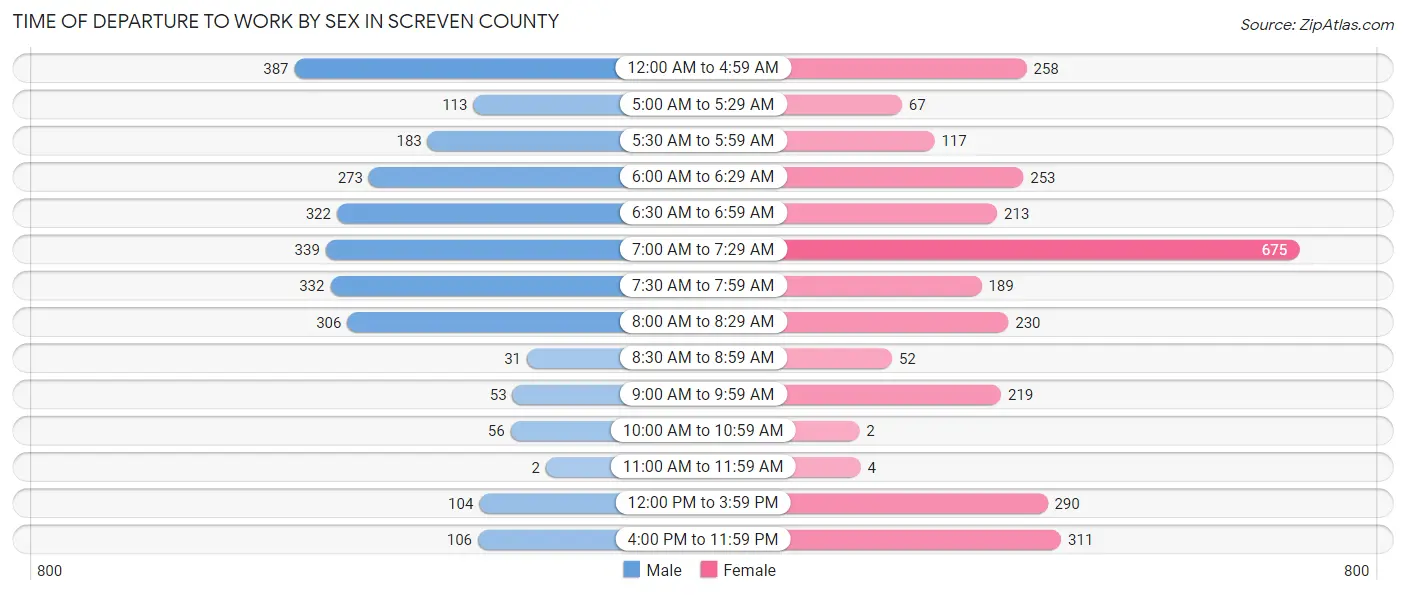
| Time of Departure | Male | Female |
| 12:00 AM to 4:59 AM | 387 (14.8%) | 258 (9.0%) |
| 5:00 AM to 5:29 AM | 113 (4.3%) | 67 (2.3%) |
| 5:30 AM to 5:59 AM | 183 (7.0%) | 117 (4.1%) |
| 6:00 AM to 6:29 AM | 273 (10.5%) | 253 (8.8%) |
| 6:30 AM to 6:59 AM | 322 (12.3%) | 213 (7.4%) |
| 7:00 AM to 7:29 AM | 339 (13.0%) | 675 (23.4%) |
| 7:30 AM to 7:59 AM | 332 (12.7%) | 189 (6.6%) |
| 8:00 AM to 8:29 AM | 306 (11.7%) | 230 (8.0%) |
| 8:30 AM to 8:59 AM | 31 (1.2%) | 52 (1.8%) |
| 9:00 AM to 9:59 AM | 53 (2.0%) | 219 (7.6%) |
| 10:00 AM to 10:59 AM | 56 (2.1%) | 2 (0.1%) |
| 11:00 AM to 11:59 AM | 2 (0.1%) | 4 (0.1%) |
| 12:00 PM to 3:59 PM | 104 (4.0%) | 290 (10.1%) |
| 4:00 PM to 11:59 PM | 106 (4.1%) | 311 (10.8%) |
| Total | 2,607 (100.0%) | 2,880 (100.0%) |
Housing Occupancy in Screven County
Occupancy by Ownership in Screven County
Of the total 4,727 dwellings in Screven County, owner-occupied units account for 3,506 (74.2%), while renter-occupied units make up 1,221 (25.8%).
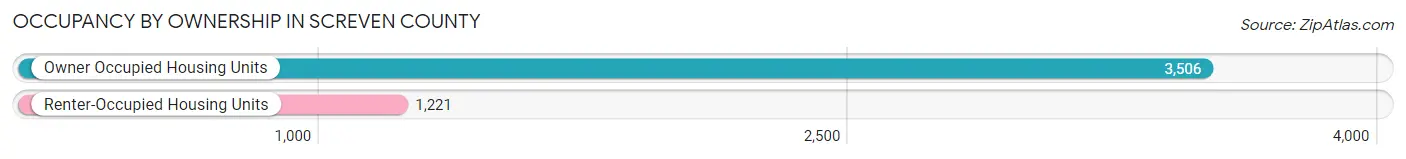
| Occupancy | # Housing Units | % Housing Units |
| Owner Occupied Housing Units | 3,506 | 74.2% |
| Renter-Occupied Housing Units | 1,221 | 25.8% |
| Total Occupied Housing Units | 4,727 | 100.0% |
Occupancy by Household Size in Screven County
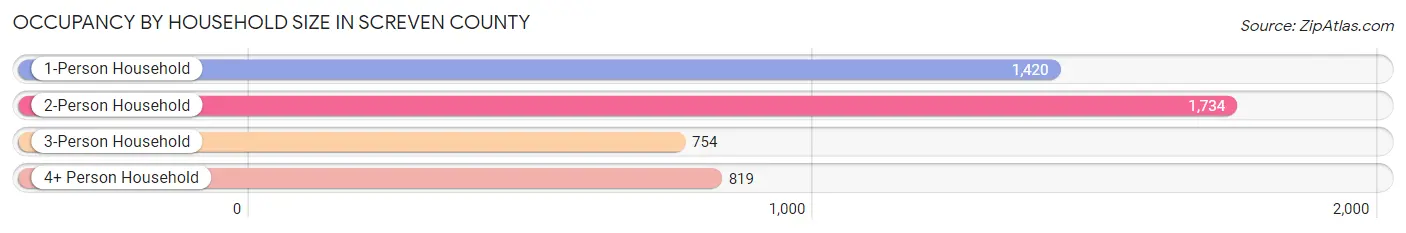
| Household Size | # Housing Units | % Housing Units |
| 1-Person Household | 1,420 | 30.0% |
| 2-Person Household | 1,734 | 36.7% |
| 3-Person Household | 754 | 16.0% |
| 4+ Person Household | 819 | 17.3% |
| Total Housing Units | 4,727 | 100.0% |
Occupancy by Ownership by Household Size in Screven County

| Household Size | Owner-occupied | Renter-occupied |
| 1-Person Household | 957 (67.4%) | 463 (32.6%) |
| 2-Person Household | 1,313 (75.7%) | 421 (24.3%) |
| 3-Person Household | 659 (87.4%) | 95 (12.6%) |
| 4+ Person Household | 577 (70.5%) | 242 (29.5%) |
| Total Housing Units | 3,506 (74.2%) | 1,221 (25.8%) |
Occupancy by Educational Attainment in Screven County
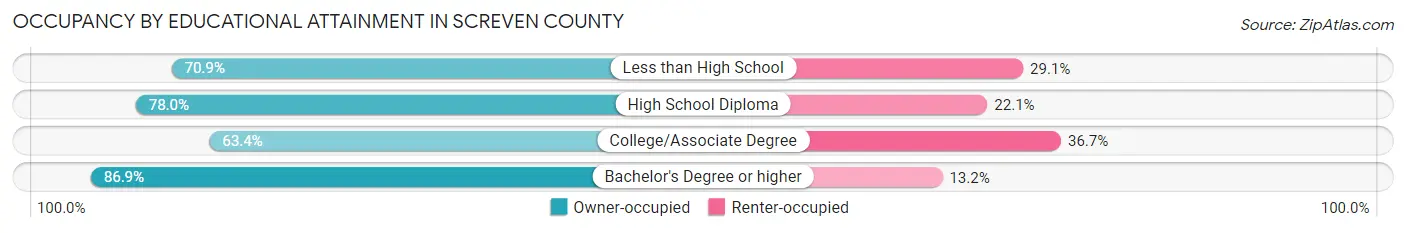
| Household Size | Owner-occupied | Renter-occupied |
| Less than High School | 445 (70.9%) | 183 (29.1%) |
| High School Diploma | 1,449 (77.9%) | 410 (22.1%) |
| College/Associate Degree | 899 (63.3%) | 520 (36.6%) |
| Bachelor's Degree or higher | 713 (86.9%) | 108 (13.2%) |
Occupancy by Age of Householder in Screven County
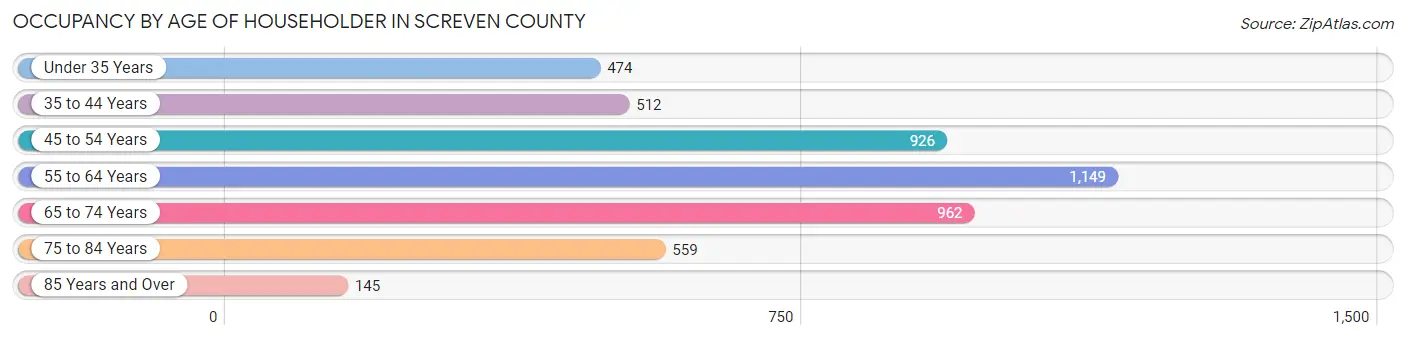
| Age Bracket | # Households | % Households |
| Under 35 Years | 474 | 10.0% |
| 35 to 44 Years | 512 | 10.8% |
| 45 to 54 Years | 926 | 19.6% |
| 55 to 64 Years | 1,149 | 24.3% |
| 65 to 74 Years | 962 | 20.3% |
| 75 to 84 Years | 559 | 11.8% |
| 85 Years and Over | 145 | 3.1% |
| Total | 4,727 | 100.0% |
Housing Finances in Screven County
Median Income by Occupancy in Screven County
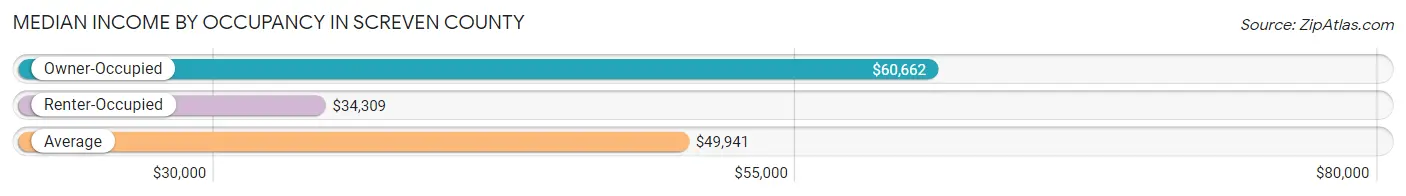
| Occupancy Type | # Households | Median Income |
| Owner-Occupied | 3,506 (74.2%) | $60,662 |
| Renter-Occupied | 1,221 (25.8%) | $34,309 |
| Average | 4,727 (100.0%) | $49,941 |
Occupancy by Householder Income Bracket in Screven County
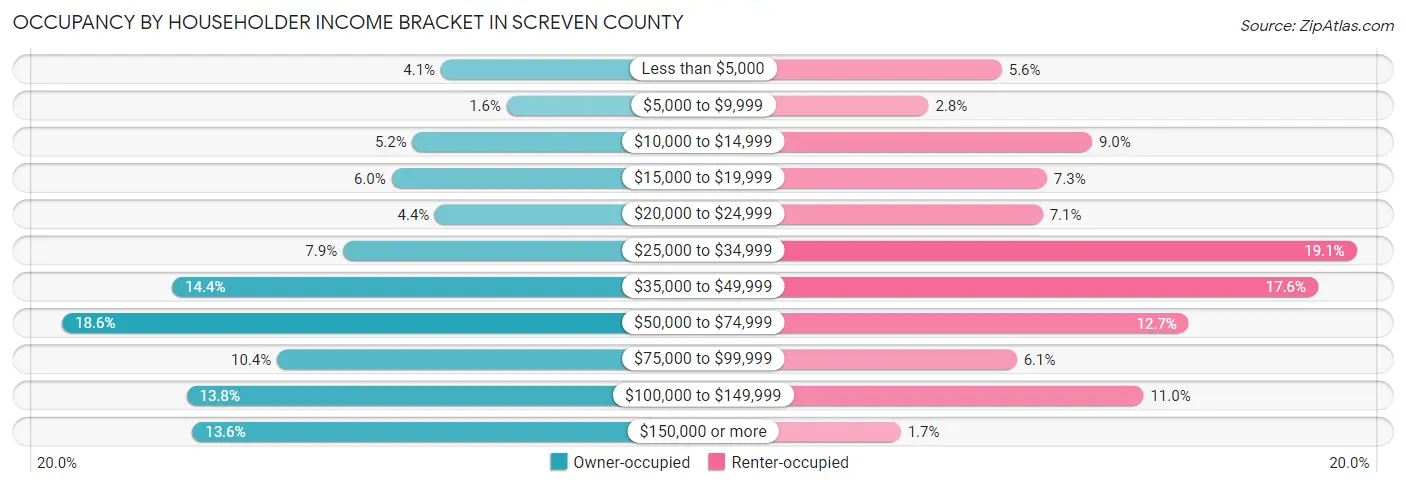
| Income Bracket | Owner-occupied | Renter-occupied |
| Less than $5,000 | 145 (4.1%) | 68 (5.6%) |
| $5,000 to $9,999 | 57 (1.6%) | 34 (2.8%) |
| $10,000 to $14,999 | 183 (5.2%) | 110 (9.0%) |
| $15,000 to $19,999 | 211 (6.0%) | 89 (7.3%) |
| $20,000 to $24,999 | 153 (4.4%) | 87 (7.1%) |
| $25,000 to $34,999 | 276 (7.9%) | 233 (19.1%) |
| $35,000 to $49,999 | 504 (14.4%) | 215 (17.6%) |
| $50,000 to $74,999 | 651 (18.6%) | 155 (12.7%) |
| $75,000 to $99,999 | 364 (10.4%) | 75 (6.1%) |
| $100,000 to $149,999 | 485 (13.8%) | 134 (11.0%) |
| $150,000 or more | 477 (13.6%) | 21 (1.7%) |
| Total | 3,506 (100.0%) | 1,221 (100.0%) |
Monthly Housing Cost Tiers in Screven County

| Monthly Cost | Owner-occupied | Renter-occupied |
| Less than $300 | 501 (14.3%) | 73 (6.0%) |
| $300 to $499 | 847 (24.2%) | 105 (8.6%) |
| $500 to $799 | 906 (25.8%) | 453 (37.1%) |
| $800 to $999 | 242 (6.9%) | 179 (14.7%) |
| $1,000 to $1,499 | 502 (14.3%) | 72 (5.9%) |
| $1,500 to $1,999 | 329 (9.4%) | 0 (0.0%) |
| $2,000 to $2,499 | 139 (4.0%) | 7 (0.6%) |
| $2,500 to $2,999 | 35 (1.0%) | 0 (0.0%) |
| $3,000 or more | 5 (0.1%) | 0 (0.0%) |
| Total | 3,506 (100.0%) | 1,221 (100.0%) |
Physical Housing Characteristics in Screven County
Housing Structures in Screven County
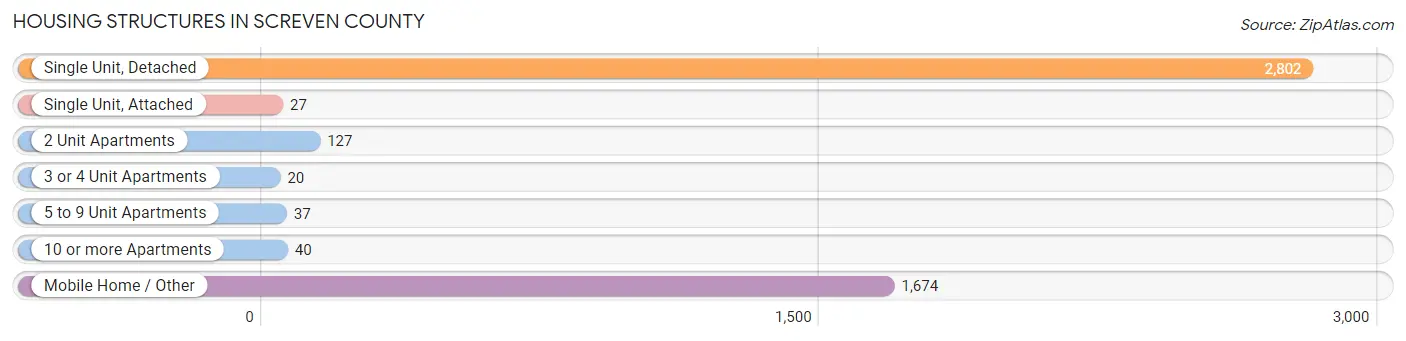
| Structure Type | # Housing Units | % Housing Units |
| Single Unit, Detached | 2,802 | 59.3% |
| Single Unit, Attached | 27 | 0.6% |
| 2 Unit Apartments | 127 | 2.7% |
| 3 or 4 Unit Apartments | 20 | 0.4% |
| 5 to 9 Unit Apartments | 37 | 0.8% |
| 10 or more Apartments | 40 | 0.9% |
| Mobile Home / Other | 1,674 | 35.4% |
| Total | 4,727 | 100.0% |
Housing Structures by Occupancy in Screven County

| Structure Type | Owner-occupied | Renter-occupied |
| Single Unit, Detached | 2,254 (80.4%) | 548 (19.6%) |
| Single Unit, Attached | 14 (51.8%) | 13 (48.1%) |
| 2 Unit Apartments | 0 (0.0%) | 127 (100.0%) |
| 3 or 4 Unit Apartments | 12 (60.0%) | 8 (40.0%) |
| 5 to 9 Unit Apartments | 0 (0.0%) | 37 (100.0%) |
| 10 or more Apartments | 0 (0.0%) | 40 (100.0%) |
| Mobile Home / Other | 1,226 (73.2%) | 448 (26.8%) |
| Total | 3,506 (74.2%) | 1,221 (25.8%) |
Housing Structures by Number of Rooms in Screven County
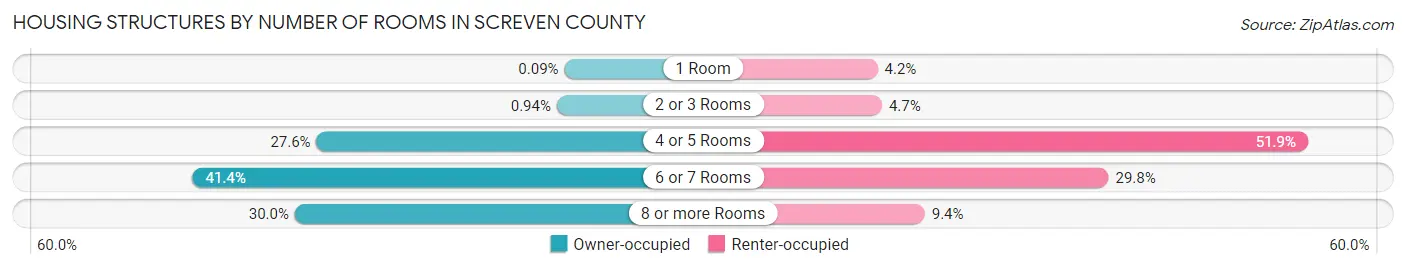
| Number of Rooms | Owner-occupied | Renter-occupied |
| 1 Room | 3 (0.1%) | 51 (4.2%) |
| 2 or 3 Rooms | 33 (0.9%) | 57 (4.7%) |
| 4 or 5 Rooms | 968 (27.6%) | 634 (51.9%) |
| 6 or 7 Rooms | 1,450 (41.4%) | 364 (29.8%) |
| 8 or more Rooms | 1,052 (30.0%) | 115 (9.4%) |
| Total | 3,506 (100.0%) | 1,221 (100.0%) |
Housing Structure by Heating Type in Screven County

| Heating Type | Owner-occupied | Renter-occupied |
| Utility Gas | 147 (4.2%) | 100 (8.2%) |
| Bottled, Tank, or LP Gas | 234 (6.7%) | 57 (4.7%) |
| Electricity | 3,054 (87.1%) | 1,038 (85.0%) |
| Fuel Oil or Kerosene | 18 (0.5%) | 0 (0.0%) |
| Coal or Coke | 0 (0.0%) | 0 (0.0%) |
| All other Fuels | 47 (1.3%) | 17 (1.4%) |
| No Fuel Used | 6 (0.2%) | 9 (0.7%) |
| Total | 3,506 (100.0%) | 1,221 (100.0%) |
Household Vehicle Usage in Screven County

| Vehicles per Household | Owner-occupied | Renter-occupied |
| No Vehicle | 163 (4.6%) | 94 (7.7%) |
| 1 Vehicle | 658 (18.8%) | 584 (47.8%) |
| 2 Vehicles | 1,422 (40.6%) | 437 (35.8%) |
| 3 or more Vehicles | 1,263 (36.0%) | 106 (8.7%) |
| Total | 3,506 (100.0%) | 1,221 (100.0%) |
Real Estate & Mortgages in Screven County
Real Estate and Mortgage Overview in Screven County
| Characteristic | Without Mortgage | With Mortgage |
| Housing Units | 2,054 | 1,452 |
| Median Property Value | $83,600 | $129,900 |
| Median Household Income | $45,000 | $341 |
| Monthly Housing Costs | $398 | $5 |
| Real Estate Taxes | $944 | $25 |
Property Value by Mortgage Status in Screven County

| Property Value | Without Mortgage | With Mortgage |
| Less than $50,000 | 736 (35.8%) | 122 (8.4%) |
| $50,000 to $99,999 | 386 (18.8%) | 401 (27.6%) |
| $100,000 to $299,999 | 692 (33.7%) | 710 (48.9%) |
| $300,000 to $499,999 | 228 (11.1%) | 165 (11.4%) |
| $500,000 to $749,999 | 12 (0.6%) | 21 (1.5%) |
| $750,000 to $999,999 | 0 (0.0%) | 33 (2.3%) |
| $1,000,000 or more | 0 (0.0%) | 0 (0.0%) |
| Total | 2,054 (100.0%) | 1,452 (100.0%) |
Household Income by Mortgage Status in Screven County
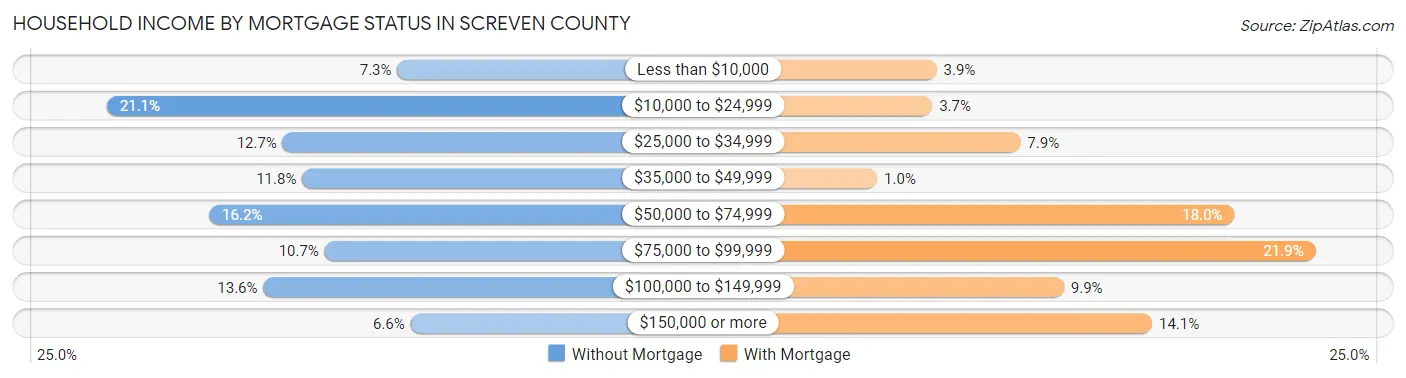
| Household Income | Without Mortgage | With Mortgage |
| Less than $10,000 | 149 (7.2%) | 56 (3.9%) |
| $10,000 to $24,999 | 433 (21.1%) | 53 (3.6%) |
| $25,000 to $34,999 | 261 (12.7%) | 114 (7.9%) |
| $35,000 to $49,999 | 242 (11.8%) | 15 (1.0%) |
| $50,000 to $74,999 | 333 (16.2%) | 262 (18.0%) |
| $75,000 to $99,999 | 220 (10.7%) | 318 (21.9%) |
| $100,000 to $149,999 | 280 (13.6%) | 144 (9.9%) |
| $150,000 or more | 136 (6.6%) | 205 (14.1%) |
| Total | 2,054 (100.0%) | 1,452 (100.0%) |
Property Value to Household Income Ratio in Screven County

| Value-to-Income Ratio | Without Mortgage | With Mortgage |
| Less than 2.0x | 1,020 (49.7%) | 71,989 (4,957.9%) |
| 2.0x to 2.9x | 339 (16.5%) | 851 (58.6%) |
| 3.0x to 3.9x | 200 (9.7%) | 277 (19.1%) |
| 4.0x or more | 459 (22.4%) | 136 (9.4%) |
| Total | 2,054 (100.0%) | 1,452 (100.0%) |
Real Estate Taxes by Mortgage Status in Screven County
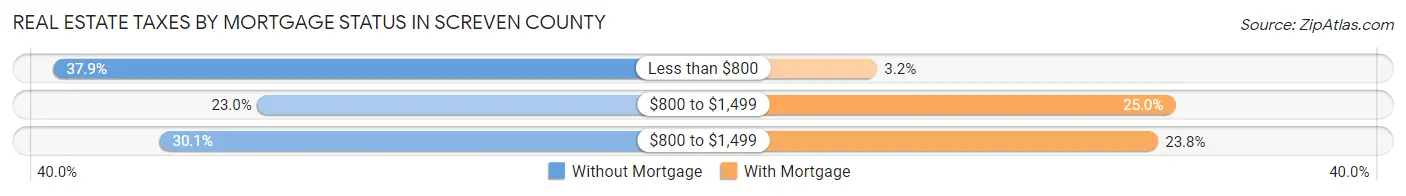
| Property Taxes | Without Mortgage | With Mortgage |
| Less than $800 | 778 (37.9%) | 47 (3.2%) |
| $800 to $1,499 | 472 (23.0%) | 363 (25.0%) |
| $800 to $1,499 | 619 (30.1%) | 345 (23.8%) |
| Total | 2,054 (100.0%) | 1,452 (100.0%) |
Health & Disability in Screven County
Health Insurance Coverage by Age in Screven County
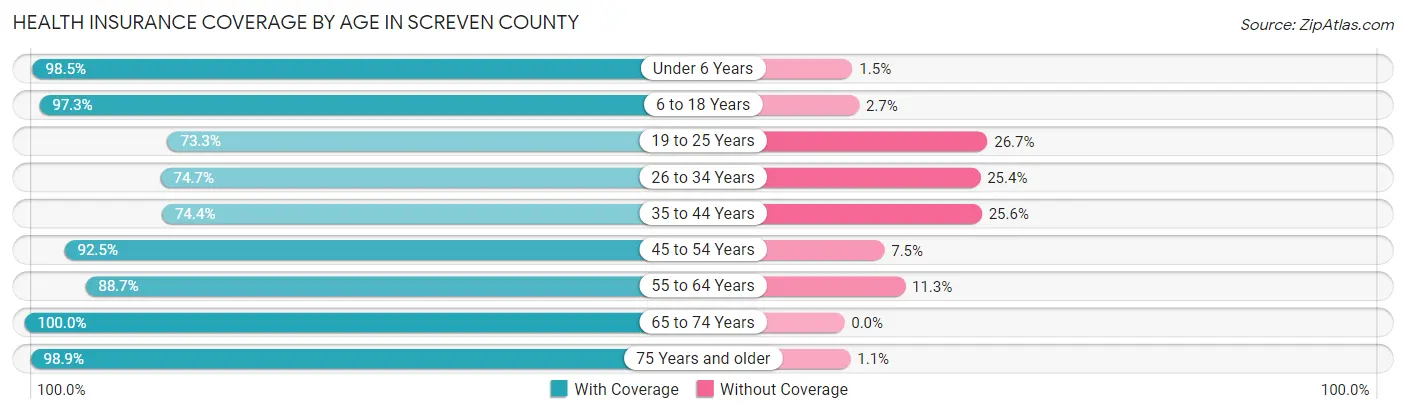
| Age Bracket | With Coverage | Without Coverage |
| Under 6 Years | 850 (98.5%) | 13 (1.5%) |
| 6 to 18 Years | 1,989 (97.3%) | 56 (2.7%) |
| 19 to 25 Years | 657 (73.3%) | 239 (26.7%) |
| 26 to 34 Years | 1,160 (74.7%) | 394 (25.4%) |
| 35 to 44 Years | 1,338 (74.4%) | 461 (25.6%) |
| 45 to 54 Years | 1,550 (92.5%) | 125 (7.5%) |
| 55 to 64 Years | 1,888 (88.7%) | 241 (11.3%) |
| 65 to 74 Years | 1,739 (100.0%) | 0 (0.0%) |
| 75 Years and older | 963 (98.9%) | 11 (1.1%) |
| Total | 12,134 (88.7%) | 1,540 (11.3%) |
Health Insurance Coverage by Citizenship Status in Screven County

| Citizenship Status | With Coverage | Without Coverage |
| Native Born | 850 (98.5%) | 13 (1.5%) |
| Foreign Born, Citizen | 1,989 (97.3%) | 56 (2.7%) |
| Foreign Born, not a Citizen | 657 (73.3%) | 239 (26.7%) |
Health Insurance Coverage by Household Income in Screven County
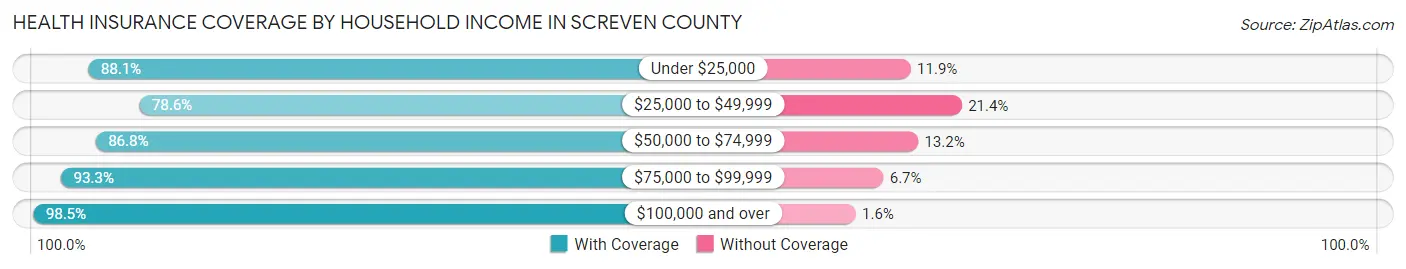
| Household Income | With Coverage | Without Coverage |
| Under $25,000 | 2,191 (88.1%) | 295 (11.9%) |
| $25,000 to $49,999 | 2,650 (78.6%) | 723 (21.4%) |
| $50,000 to $74,999 | 2,438 (86.8%) | 372 (13.2%) |
| $75,000 to $99,999 | 1,135 (93.3%) | 82 (6.7%) |
| $100,000 and over | 3,675 (98.5%) | 58 (1.5%) |
Public vs Private Health Insurance Coverage by Age in Screven County
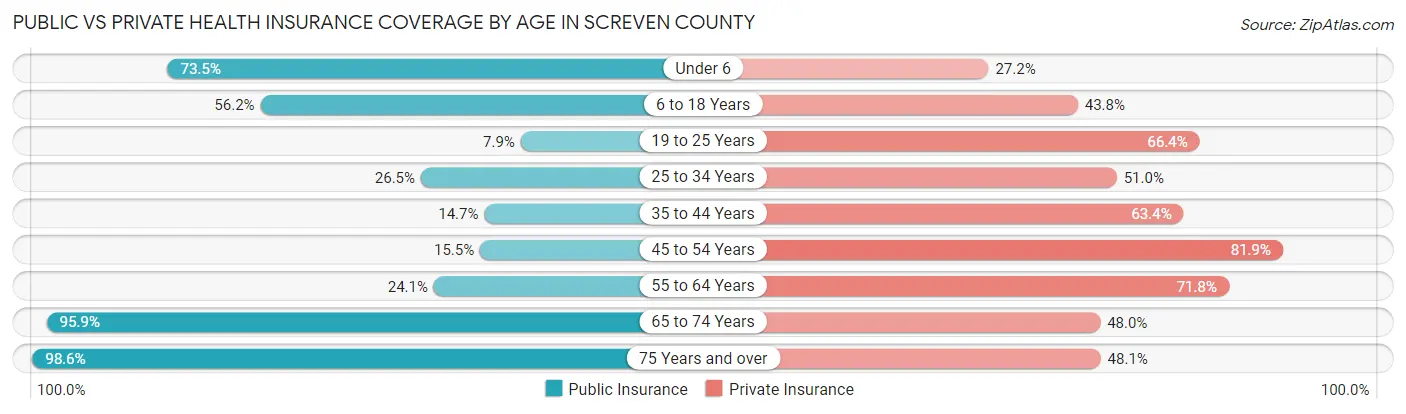
| Age Bracket | Public Insurance | Private Insurance |
| Under 6 | 634 (73.5%) | 235 (27.2%) |
| 6 to 18 Years | 1,150 (56.2%) | 896 (43.8%) |
| 19 to 25 Years | 71 (7.9%) | 595 (66.4%) |
| 25 to 34 Years | 411 (26.5%) | 793 (51.0%) |
| 35 to 44 Years | 264 (14.7%) | 1,141 (63.4%) |
| 45 to 54 Years | 259 (15.5%) | 1,371 (81.9%) |
| 55 to 64 Years | 512 (24.0%) | 1,529 (71.8%) |
| 65 to 74 Years | 1,668 (95.9%) | 834 (48.0%) |
| 75 Years and over | 960 (98.6%) | 468 (48.0%) |
| Total | 5,929 (43.4%) | 7,862 (57.5%) |
Disability Status by Sex by Age in Screven County
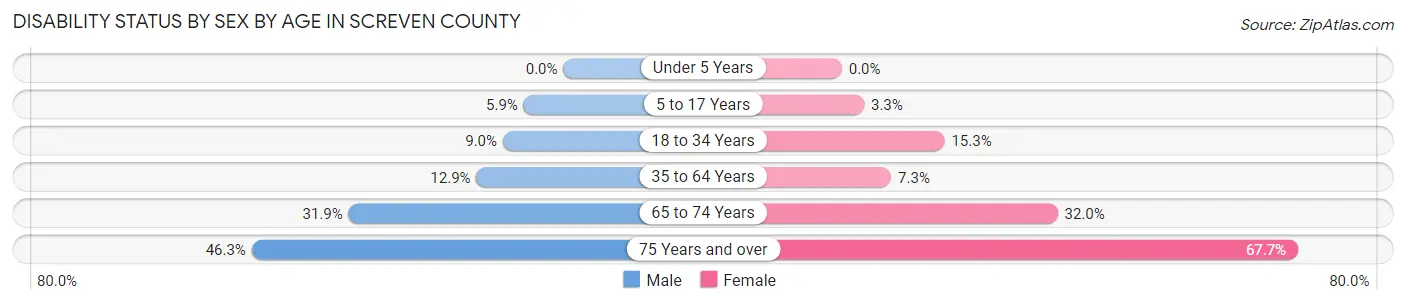
| Age Bracket | Male | Female |
| Under 5 Years | 0 (0.0%) | 0 (0.0%) |
| 5 to 17 Years | 60 (5.9%) | 35 (3.3%) |
| 18 to 34 Years | 100 (9.0%) | 214 (15.2%) |
| 35 to 64 Years | 357 (12.9%) | 208 (7.3%) |
| 65 to 74 Years | 275 (31.9%) | 281 (32.0%) |
| 75 Years and over | 174 (46.3%) | 405 (67.7%) |
Disability Class by Sex by Age in Screven County
Disability Class: Hearing Difficulty
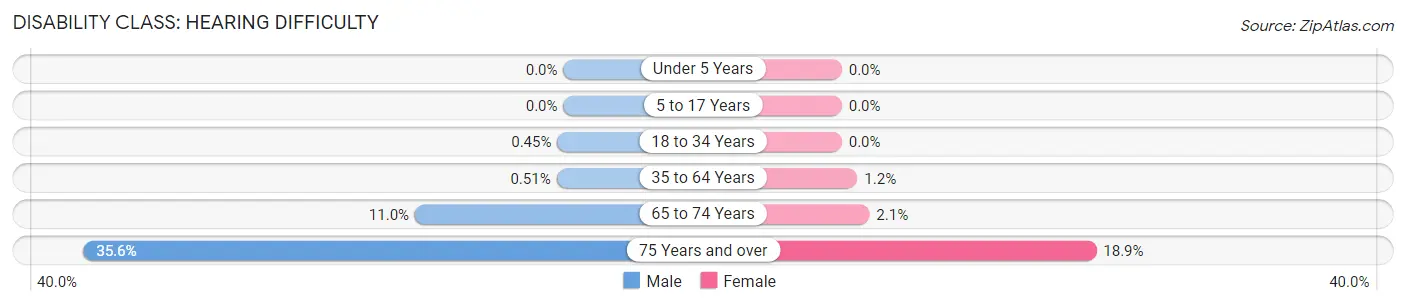
| Age Bracket | Male | Female |
| Under 5 Years | 0 (0.0%) | 0 (0.0%) |
| 5 to 17 Years | 0 (0.0%) | 0 (0.0%) |
| 18 to 34 Years | 5 (0.4%) | 0 (0.0%) |
| 35 to 64 Years | 14 (0.5%) | 33 (1.2%) |
| 65 to 74 Years | 95 (11.0%) | 18 (2.1%) |
| 75 Years and over | 134 (35.6%) | 113 (18.9%) |
Disability Class: Vision Difficulty
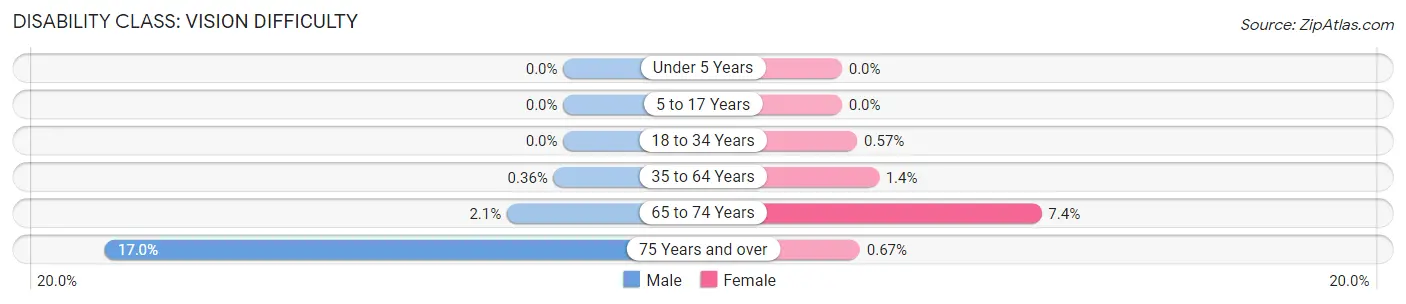
| Age Bracket | Male | Female |
| Under 5 Years | 0 (0.0%) | 0 (0.0%) |
| 5 to 17 Years | 0 (0.0%) | 0 (0.0%) |
| 18 to 34 Years | 0 (0.0%) | 8 (0.6%) |
| 35 to 64 Years | 10 (0.4%) | 39 (1.4%) |
| 65 to 74 Years | 18 (2.1%) | 65 (7.4%) |
| 75 Years and over | 64 (17.0%) | 4 (0.7%) |
Disability Class: Cognitive Difficulty
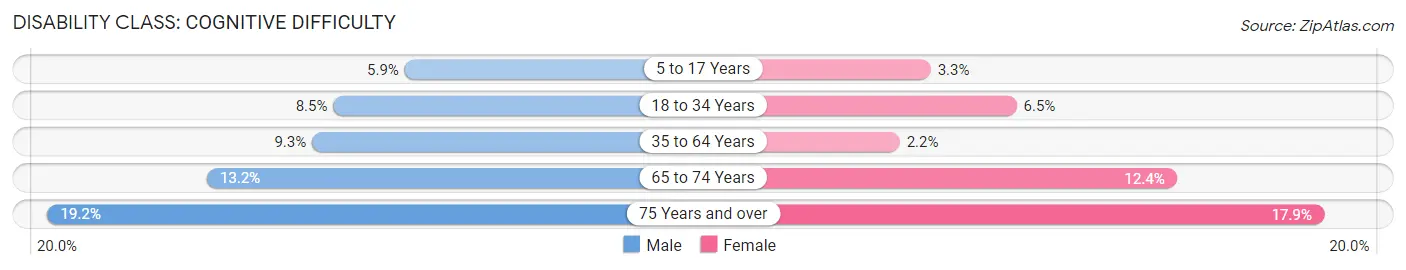
| Age Bracket | Male | Female |
| 5 to 17 Years | 60 (5.9%) | 35 (3.3%) |
| 18 to 34 Years | 95 (8.5%) | 91 (6.5%) |
| 35 to 64 Years | 258 (9.3%) | 61 (2.1%) |
| 65 to 74 Years | 114 (13.2%) | 109 (12.4%) |
| 75 Years and over | 72 (19.2%) | 107 (17.9%) |
Disability Class: Ambulatory Difficulty
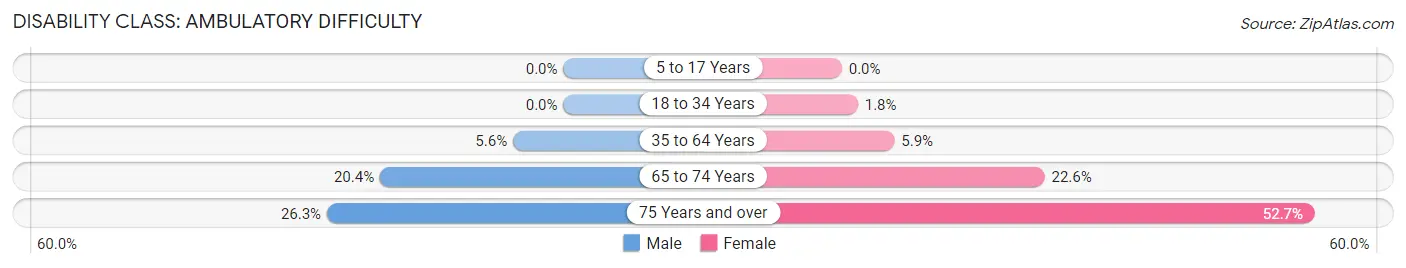
| Age Bracket | Male | Female |
| 5 to 17 Years | 0 (0.0%) | 0 (0.0%) |
| 18 to 34 Years | 0 (0.0%) | 25 (1.8%) |
| 35 to 64 Years | 155 (5.6%) | 166 (5.9%) |
| 65 to 74 Years | 176 (20.4%) | 198 (22.6%) |
| 75 Years and over | 99 (26.3%) | 315 (52.7%) |
Disability Class: Self-Care Difficulty
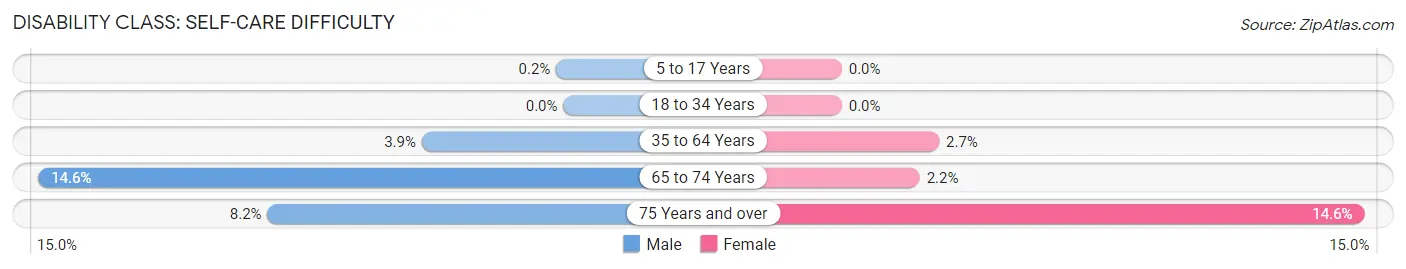
| Age Bracket | Male | Female |
| 5 to 17 Years | 2 (0.2%) | 0 (0.0%) |
| 18 to 34 Years | 0 (0.0%) | 0 (0.0%) |
| 35 to 64 Years | 109 (3.9%) | 77 (2.7%) |
| 65 to 74 Years | 126 (14.6%) | 19 (2.2%) |
| 75 Years and over | 31 (8.2%) | 87 (14.5%) |
Technology Access in Screven County
Computing Device Access in Screven County
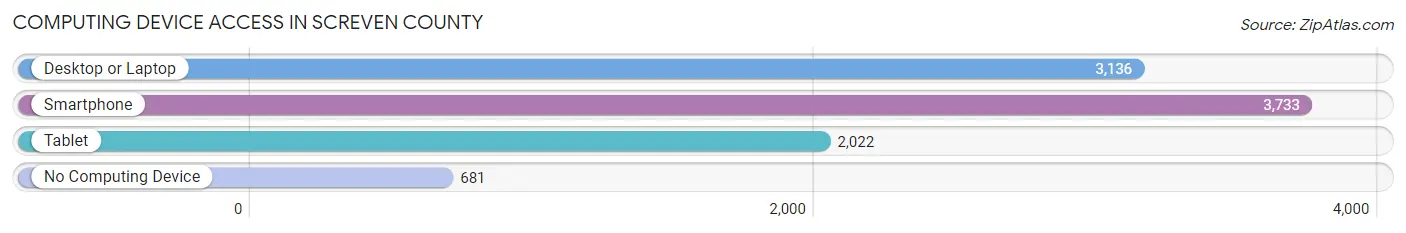
| Device Type | # Households | % Households |
| Desktop or Laptop | 3,136 | 66.3% |
| Smartphone | 3,733 | 79.0% |
| Tablet | 2,022 | 42.8% |
| No Computing Device | 681 | 14.4% |
| Total | 4,727 | 100.0% |
Internet Access in Screven County
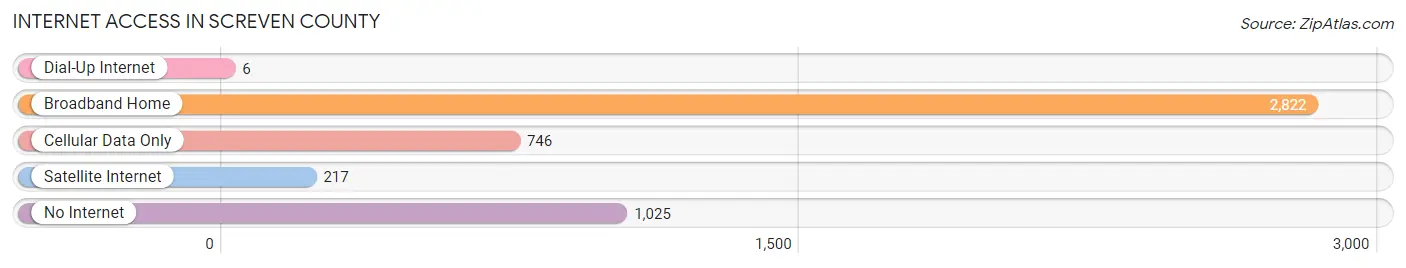
| Internet Type | # Households | % Households |
| Dial-Up Internet | 6 | 0.1% |
| Broadband Home | 2,822 | 59.7% |
| Cellular Data Only | 746 | 15.8% |
| Satellite Internet | 217 | 4.6% |
| No Internet | 1,025 | 21.7% |
| Total | 4,727 | 100.0% |
Screven County Summary
Screven County is located in the east-central part of the state of Georgia, in the United States. It is bordered by Burke, Jenkins, Effingham, Bulloch, and Emanuel counties. The county seat is Sylvania, and the county was created in 1793 from part of Burke County. The county is named for James Screven, an American Revolutionary War general.
Geography
Screven County covers an area of 545 square miles, of which 543 square miles is land and 2 square miles (0.4%) is water. The county is located in the Coastal Plain region of Georgia, and is characterized by rolling hills and flat plains. The Ogeechee River forms the western border of the county, and the Canoochee River forms the eastern border. The county is home to several small lakes, including Big Lake, Little Lake, and Lake Burton.
The majority of the county is located in the Ogeechee River sub-basin of the Savannah River basin. The western portion of the county is located in the Canoochee River sub-basin of the same basin.
Demographics
As of the 2010 United States Census, there were 14,593 people, 5,541 households, and 3,919 families residing in the county. The population density was 27.0 people per square mile. The racial makeup of the county was 68.2% White, 28.2% Black or African American, 0.3% Native American, 0.5% Asian, 0.1% Pacific Islander, 1.2% from other races, and 1.5% from two or more races. 2.7% of the population were Hispanic or Latino of any race.
The median income for a household in the county was $33,945, and the median income for a family was $41,945. The per capita income for the county was $17,845. About 17.2% of families and 21.2% of the population were below the poverty line, including 28.2% of those under age 18 and 17.2% of those age 65 or over.
Economy
The economy of Screven County is largely based on agriculture and forestry. The county is home to several large farms, and the timber industry is also an important part of the local economy. The county is also home to several manufacturing companies, including a paper mill and a furniture factory.
The county is served by two major highways, U.S. Route 301 and U.S. Route 25. The county is also served by the Savannah/Hilton Head International Airport, which is located in nearby Savannah.
Education
Screven County is served by the Screven County School District, which operates seven elementary schools, two middle schools, and two high schools. The county is also home to several private schools, including Sylvania Christian Academy and Screven County Academy.
Conclusion
Screven County is a rural county located in the east-central part of the state of Georgia. The county is characterized by rolling hills and flat plains, and is home to several small lakes. The economy of the county is largely based on agriculture and forestry, and the county is served by two major highways and the Savannah/Hilton Head International Airport. The county is served by the Screven County School District, which operates seven elementary schools, two middle schools, and two high schools.
Common Questions
What is the Total Population of Screven County?
Total Population of Screven County is 14,026.
What is the Total Male Population of Screven County?
Total Male Population of Screven County is 6,742.
What is the Total Female Population of Screven County?
Total Female Population of Screven County is 7,284.
What is the Ratio of Males per 100 Females in Screven County?
There are 92.56 Males per 100 Females in Screven County.
What is the Ratio of Females per 100 Males in Screven County?
There are 108.04 Females per 100 Males in Screven County.
What is the Median Population Age in Screven County?
Median Population Age in Screven County is 41.9 Years.
What is the Average Family Size in Screven County
Average Family Size in Screven County is 3.6 People.
What is the Average Household Size in Screven County
Average Household Size in Screven County is 2.9 People.
What is Per Capita Income in Screven County?
Per Capita income in Screven County is $28,356.
What is the Median Family Income in Screven County?
Median Family Income in Screven County is $70,292.
What is the Median Household income in Screven County?
Median Household Income in Screven County is $49,941.
What is Income or Wage Gap in Screven County?
Income or Wage Gap in Screven County is 28.9%.
Women in Screven County earn 71.1 cents for every dollar earned by a man.
What is Inequality or Gini Index in Screven County?
Inequality or Gini Index in Screven County is 0.48.
How Large is the Labor Force in Screven County?
There are 6,402 People in the Labor Forcein in Screven County.
What is the Percentage of People in the Labor Force in Screven County?
56.4% of People are in the Labor Force in Screven County.
What is the Unemployment Rate in Screven County?
Unemployment Rate in Screven County is 7.2%.