Pierce County, GA
Pierce County Map
Pierce County Overview
19,822
TOTAL POPULATION
9,942
MALE POPULATION
9,880
FEMALE POPULATION
100.63
MALES / 100 FEMALES
99.38
FEMALES / 100 MALES
39.8
MEDIAN AGE
3.2
AVG FAMILY SIZE
2.6
AVG HOUSEHOLD SIZE
$26,392
PER CAPITA INCOME
$65,653
AVG FAMILY INCOME
$54,861
AVG HOUSEHOLD INCOME
27.7%
WAGE / INCOME GAP [ % ]
72.3¢/ $1
WAGE / INCOME GAP [ $ ]
$7,251
FAMILY INCOME DEFICIT
0.44
INEQUALITY / GINI INDEX
8,717
LABOR FORCE [ PEOPLE ]
56.5%
PERCENT IN LABOR FORCE
2.3%
UNEMPLOYMENT RATE
Pierce County Area Codes
Race in Pierce County
The most populous races in Pierce County are White / Caucasian (16,954 | 85.5%), Black / African American (1,929 | 9.7%), and Hispanic or Latino (1,005 | 5.1%).

| Race | # Population | % Population |
| Asian | 0 | 0.0% |
| Black / African American | 1,929 | 9.7% |
| Hawaiian / Pacific | 0 | 0.0% |
| Hispanic or Latino | 1,005 | 5.1% |
| Native / Alaskan | 27 | 0.1% |
| White / Caucasian | 16,954 | 85.5% |
| Two or more Races | 504 | 2.5% |
| Some other Race | 408 | 2.1% |
| Total | 19,822 | 100.0% |
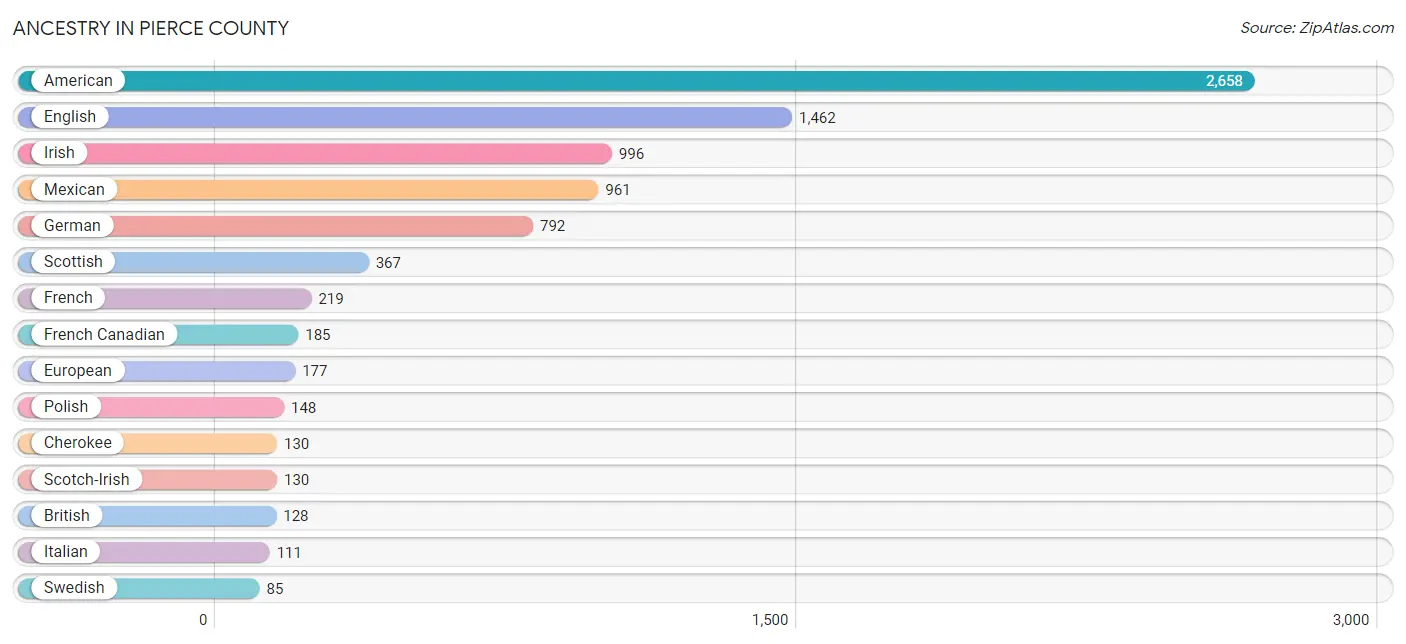
Ancestry in Pierce County
The most populous ancestries reported in Pierce County are American (2,658 | 13.4%), English (1,462 | 7.4%), Irish (996 | 5.0%), Mexican (961 | 4.9%), and German (792 | 4.0%), together accounting for 34.7% of all Pierce County residents.
| Ancestry | # Population | % Population |
| African | 23 | 0.1% |
| American | 2,658 | 13.4% |
| Arab | 18 | 0.1% |
| Austrian | 9 | 0.1% |
| British | 128 | 0.6% |
| Cherokee | 130 | 0.7% |
| Choctaw | 45 | 0.2% |
| Czech | 31 | 0.2% |
| Dutch | 43 | 0.2% |
| English | 1,462 | 7.4% |
| European | 177 | 0.9% |
| Finnish | 42 | 0.2% |
| French | 219 | 1.1% |
| French Canadian | 185 | 0.9% |
| German | 792 | 4.0% |
| Greek | 26 | 0.1% |
| Hungarian | 8 | 0.0% |
| Iraqi | 18 | 0.1% |
| Irish | 996 | 5.0% |
| Israeli | 3 | 0.0% |
| Italian | 111 | 0.6% |
| Jamaican | 23 | 0.1% |
| Mexican | 961 | 4.9% |
| Northern European | 5 | 0.0% |
| Norwegian | 15 | 0.1% |
| Polish | 148 | 0.7% |
| Potawatomi | 41 | 0.2% |
| Puerto Rican | 44 | 0.2% |
| Romanian | 6 | 0.0% |
| Scotch-Irish | 130 | 0.7% |
| Scottish | 367 | 1.8% |
| Slovak | 7 | 0.0% |
| Subsaharan African | 23 | 0.1% |
| Swedish | 85 | 0.4% |
| Thai | 15 | 0.1% |
| Welsh | 41 | 0.2% | View All 36 Rows |
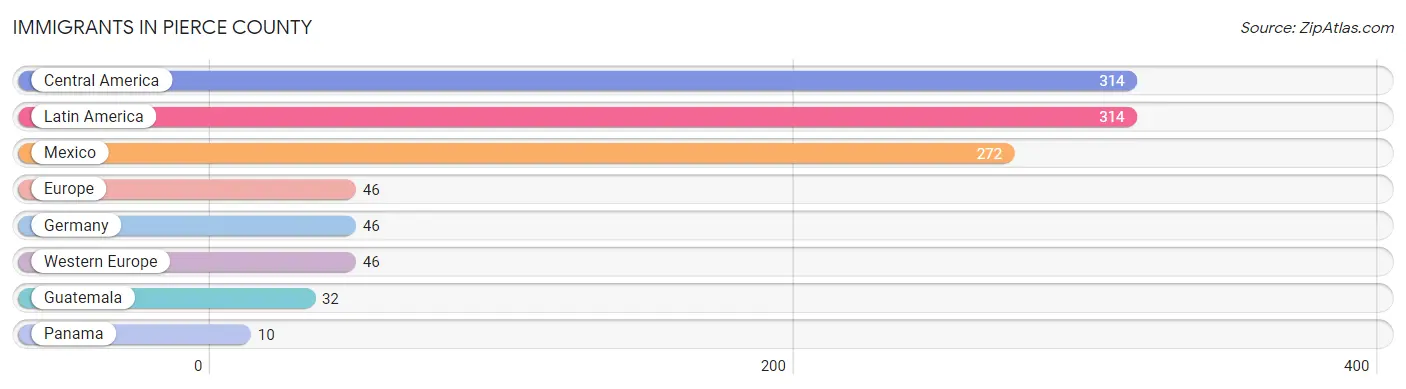
Immigrants in Pierce County
The most numerous immigrant groups reported in Pierce County came from Central America (314 | 1.6%), Latin America (314 | 1.6%), Mexico (272 | 1.4%), Europe (46 | 0.2%), and Germany (46 | 0.2%), together accounting for 5.0% of all Pierce County residents.
| Immigration Origin | # Population | % Population |
| Central America | 314 | 1.6% |
| Europe | 46 | 0.2% |
| Germany | 46 | 0.2% |
| Guatemala | 32 | 0.2% |
| Latin America | 314 | 1.6% |
| Mexico | 272 | 1.4% |
| Panama | 10 | 0.1% |
| Western Europe | 46 | 0.2% | View All 8 Rows |
Sex and Age in Pierce County
Sex and Age in Pierce County
The most populous age groups in Pierce County are 10 to 14 Years (962 | 9.7%) for men and 10 to 14 Years (759 | 7.7%) for women.

| Age Bracket | Male | Female |
| Under 5 Years | 638 (6.4%) | 624 (6.3%) |
| 5 to 9 Years | 600 (6.0%) | 526 (5.3%) |
| 10 to 14 Years | 962 (9.7%) | 759 (7.7%) |
| 15 to 19 Years | 681 (6.9%) | 589 (6.0%) |
| 20 to 24 Years | 588 (5.9%) | 608 (6.1%) |
| 25 to 29 Years | 515 (5.2%) | 627 (6.4%) |
| 30 to 34 Years | 497 (5.0%) | 542 (5.5%) |
| 35 to 39 Years | 594 (6.0%) | 623 (6.3%) |
| 40 to 44 Years | 501 (5.0%) | 685 (6.9%) |
| 45 to 49 Years | 768 (7.7%) | 622 (6.3%) |
| 50 to 54 Years | 821 (8.3%) | 620 (6.3%) |
| 55 to 59 Years | 543 (5.5%) | 637 (6.5%) |
| 60 to 64 Years | 652 (6.6%) | 601 (6.1%) |
| 65 to 69 Years | 467 (4.7%) | 583 (5.9%) |
| 70 to 74 Years | 490 (4.9%) | 417 (4.2%) |
| 75 to 79 Years | 291 (2.9%) | 445 (4.5%) |
| 80 to 84 Years | 251 (2.5%) | 269 (2.7%) |
| 85 Years and over | 83 (0.8%) | 103 (1.0%) |
| Total | 9,942 (100.0%) | 9,880 (100.0%) |
Families and Households in Pierce County
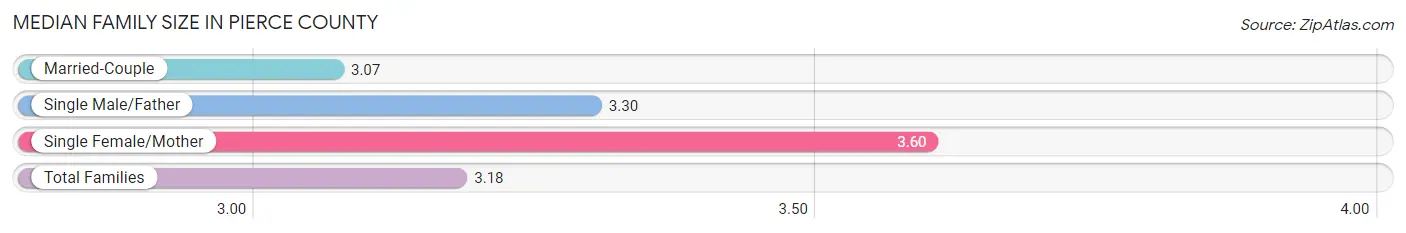
Median Family Size in Pierce County
The median family size in Pierce County is 3.18 persons per family, with single female/mother families (886 | 17.2%) accounting for the largest median family size of 3.6 persons per family. On the other hand, married-couple families (3,922 | 75.9%) represent the smallest median family size with 3.07 persons per family.
| Family Type | # Families | Family Size |
| Married-Couple | 3,922 (75.9%) | 3.07 |
| Single Male/Father | 358 (6.9%) | 3.30 |
| Single Female/Mother | 886 (17.2%) | 3.60 |
| Total Families | 5,166 (100.0%) | 3.18 |
Median Household Size in Pierce County
The median household size in Pierce County is 2.63 persons per household, with single male/father households (358 | 4.8%) accounting for the largest median household size of 3.83 persons per household. non-family households (2,294 | 30.7%) represent the smallest median household size with 1.18 persons per household.
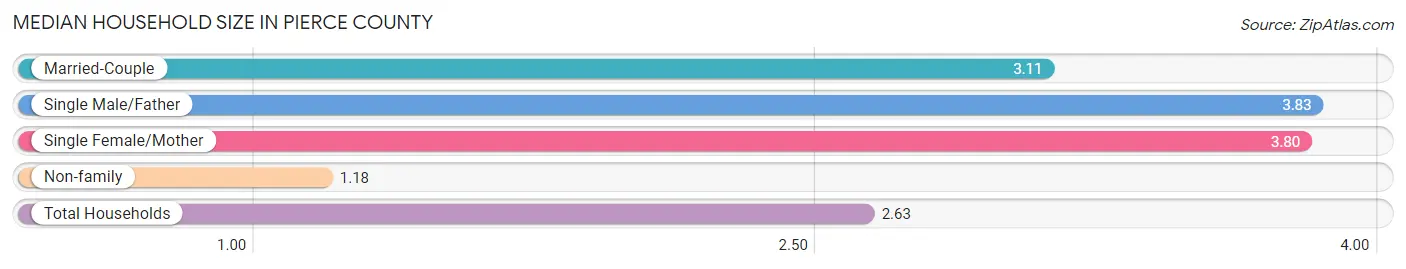
| Household Type | # Households | Household Size |
| Married-Couple | 3,922 (52.6%) | 3.11 |
| Single Male/Father | 358 (4.8%) | 3.83 |
| Single Female/Mother | 886 (11.9%) | 3.80 |
| Non-family | 2,294 (30.7%) | 1.18 |
| Total Households | 7,460 (100.0%) | 2.63 |
Household Size by Marriage Status in Pierce County
Out of a total of 7,460 households in Pierce County, 5,166 (69.3%) are family households, while 2,294 (30.7%) are nonfamily households. The most numerous type of family households are 2-person households, comprising 2,584, and the most common type of nonfamily households are 1-person households, comprising 1,969.

| Household Size | Family Households | Nonfamily Households |
| 1-Person Households | - | 1,969 (26.4%) |
| 2-Person Households | 2,584 (34.6%) | 267 (3.6%) |
| 3-Person Households | 786 (10.5%) | 58 (0.8%) |
| 4-Person Households | 932 (12.5%) | 0 (0.0%) |
| 5-Person Households | 461 (6.2%) | 0 (0.0%) |
| 6-Person Households | 358 (4.8%) | 0 (0.0%) |
| 7+ Person Households | 45 (0.6%) | 0 (0.0%) |
| Total | 5,166 (69.3%) | 2,294 (30.7%) |
Female Fertility in Pierce County
Fertility by Age in Pierce County
Average fertility rate in Pierce County is 55.0 births per 1,000 women. Women in the age bracket of 20 to 34 years have the highest fertility rate with 61.0 births per 1,000 women. Women in the age bracket of 20 to 34 years acount for 45.0% of all women with births.
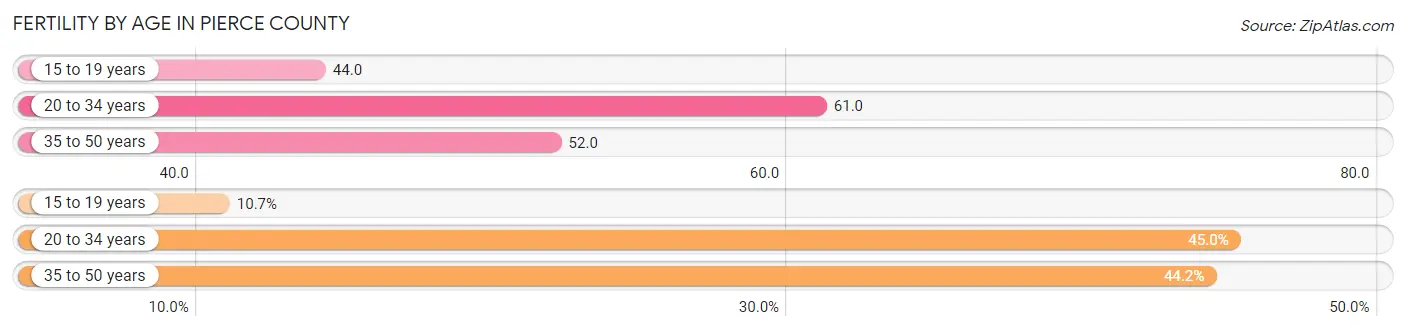
| Age Bracket | Women with Births | Births / 1,000 Women |
| 15 to 19 years | 26 (10.7%) | 44.0 |
| 20 to 34 years | 109 (45.0%) | 61.0 |
| 35 to 50 years | 107 (44.2%) | 52.0 |
| Total | 242 (100.0%) | 55.0 |
Fertility by Age by Marriage Status in Pierce County
53.7% of women with births (242) in Pierce County are married. The highest percentage of unmarried women with births falls into 15 to 19 years age bracket with 100.0% of them unmarried at the time of birth, while the lowest percentage of unmarried women with births belong to 20 to 34 years age bracket with 14.7% of them unmarried.
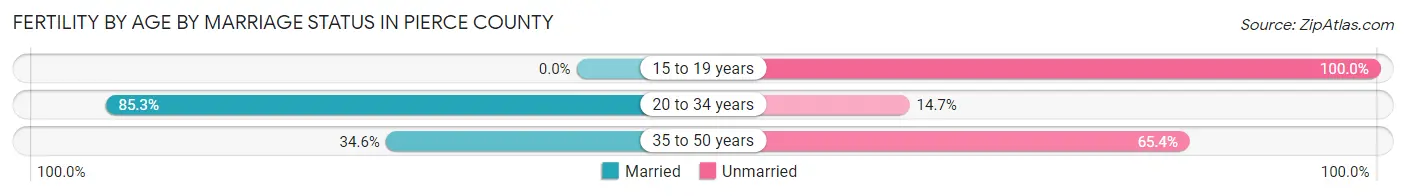
| Age Bracket | Married | Unmarried |
| 15 to 19 years | 0 (0.0%) | 26 (100.0%) |
| 20 to 34 years | 93 (85.3%) | 16 (14.7%) |
| 35 to 50 years | 37 (34.6%) | 70 (65.4%) |
| Total | 130 (53.7%) | 112 (46.3%) |
Fertility by Education in Pierce County
Average fertility rate in Pierce County is 55.0 births per 1,000 women. Women with the education attainment of less than high school have the highest fertility rate of 146.0 births per 1,000 women, while women with the education attainment of graduate degree have the lowest fertility at 5.0 births per 1,000 women. Women with the education attainment of less than high school represent 45.9% of all women with births.
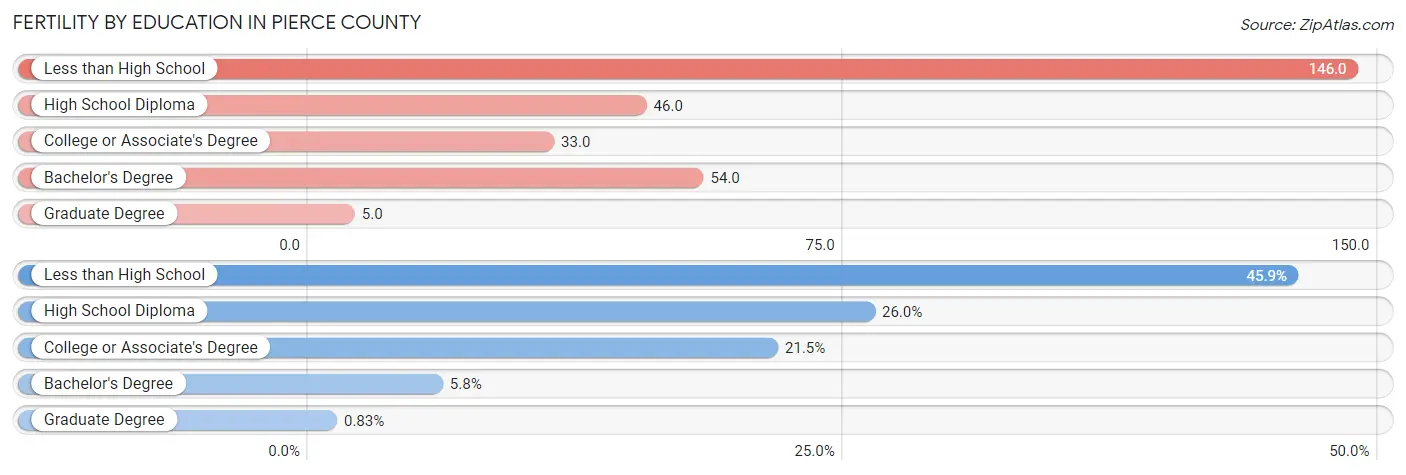
| Educational Attainment | Women with Births | Births / 1,000 Women |
| Less than High School | 111 (45.9%) | 146.0 |
| High School Diploma | 63 (26.0%) | 46.0 |
| College or Associate's Degree | 52 (21.5%) | 33.0 |
| Bachelor's Degree | 14 (5.8%) | 54.0 |
| Graduate Degree | 2 (0.8%) | 5.0 |
| Total | 242 (100.0%) | 55.0 |
Fertility by Education by Marriage Status in Pierce County
46.3% of women with births in Pierce County are unmarried. Women with the educational attainment of bachelor's degree are most likely to be married with 100.0% of them married at childbirth, while women with the educational attainment of less than high school are least likely to be married with 79.3% of them unmarried at childbirth.
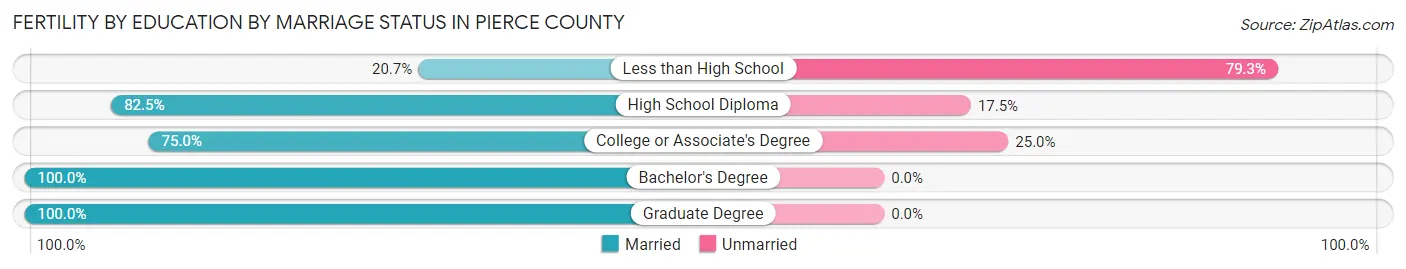
| Educational Attainment | Married | Unmarried |
| Less than High School | 23 (20.7%) | 88 (79.3%) |
| High School Diploma | 52 (82.5%) | 11 (17.5%) |
| College or Associate's Degree | 39 (75.0%) | 13 (25.0%) |
| Bachelor's Degree | 14 (100.0%) | 0 (0.0%) |
| Graduate Degree | 2 (100.0%) | 0 (0.0%) |
| Total | 130 (53.7%) | 112 (46.3%) |
Income in Pierce County
Income Overview in Pierce County
Per Capita Income in Pierce County is $26,392, while median incomes of families and households are $65,653 and $54,861 respectively.
| Characteristic | Number | Measure |
| Per Capita Income | 19,822 | $26,392 |
| Median Family Income | 5,166 | $65,653 |
| Mean Family Income | 5,166 | $82,068 |
| Median Household Income | 7,460 | $54,861 |
| Mean Household Income | 7,460 | $71,390 |
| Income Deficit | 5,166 | $7,251 |
| Wage / Income Gap (%) | 19,822 | 27.73% |
| Wage / Income Gap ($) | 19,822 | 72.27¢ per $1 |
| Gini / Inequality Index | 19,822 | 0.44 |
Earnings by Sex in Pierce County
Average Earnings in Pierce County are $32,557, $39,549 for men and $28,581 for women, a difference of 27.7%.

| Sex | Number | Average Earnings |
| Male | 4,907 (54.7%) | $39,549 |
| Female | 4,063 (45.3%) | $28,581 |
| Total | 8,970 (100.0%) | $32,557 |
Earnings by Sex by Income Bracket in Pierce County
The most common earnings brackets in Pierce County are $25,000 to $29,999 for men (474 | 9.7%) and $30,000 to $34,999 for women (470 | 11.6%).

| Income | Male | Female |
| $2,499 or less | 150 (3.1%) | 136 (3.4%) |
| $2,500 to $4,999 | 267 (5.4%) | 98 (2.4%) |
| $5,000 to $7,499 | 147 (3.0%) | 71 (1.8%) |
| $7,500 to $9,999 | 80 (1.6%) | 90 (2.2%) |
| $10,000 to $12,499 | 50 (1.0%) | 171 (4.2%) |
| $12,500 to $14,999 | 111 (2.3%) | 138 (3.4%) |
| $15,000 to $17,499 | 137 (2.8%) | 378 (9.3%) |
| $17,500 to $19,999 | 107 (2.2%) | 321 (7.9%) |
| $20,000 to $22,499 | 101 (2.1%) | 169 (4.2%) |
| $22,500 to $24,999 | 211 (4.3%) | 251 (6.2%) |
| $25,000 to $29,999 | 474 (9.7%) | 376 (9.2%) |
| $30,000 to $34,999 | 281 (5.7%) | 470 (11.6%) |
| $35,000 to $39,999 | 392 (8.0%) | 113 (2.8%) |
| $40,000 to $44,999 | 409 (8.3%) | 220 (5.4%) |
| $45,000 to $49,999 | 81 (1.7%) | 155 (3.8%) |
| $50,000 to $54,999 | 467 (9.5%) | 295 (7.3%) |
| $55,000 to $64,999 | 417 (8.5%) | 292 (7.2%) |
| $65,000 to $74,999 | 263 (5.4%) | 128 (3.2%) |
| $75,000 to $99,999 | 391 (8.0%) | 98 (2.4%) |
| $100,000+ | 371 (7.6%) | 93 (2.3%) |
| Total | 4,907 (100.0%) | 4,063 (100.0%) |
Earnings by Sex by Educational Attainment in Pierce County
Average earnings in Pierce County are $42,258 for men and $31,404 for women, a difference of 25.7%. Men with an educational attainment of graduate degree enjoy the highest average annual earnings of $65,568, while those with less than high school education earn the least with $27,026. Women with an educational attainment of graduate degree earn the most with the average annual earnings of $63,608, while those with less than high school education have the smallest earnings of $23,996.
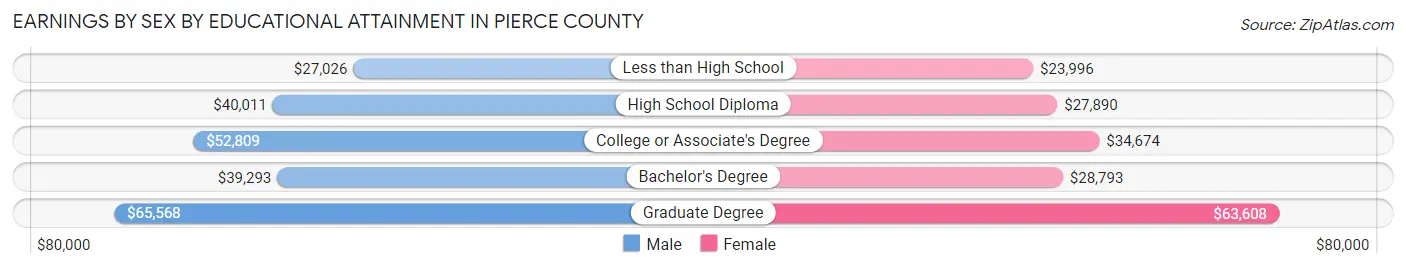
| Educational Attainment | Male Income | Female Income |
| Less than High School | $27,026 | $23,996 |
| High School Diploma | $40,011 | $27,890 |
| College or Associate's Degree | $52,809 | $34,674 |
| Bachelor's Degree | $39,293 | $28,793 |
| Graduate Degree | $65,568 | $63,608 |
| Total | $42,258 | $31,404 |
Family Income in Pierce County
Family Income Brackets in Pierce County
According to the Pierce County family income data, there are 971 families falling into the $75,000 to $99,999 income range, which is the most common income bracket and makes up 18.8% of all families. Conversely, the less than $10,000 income bracket is the least frequent group with only 62 families (1.2%) belonging to this category.
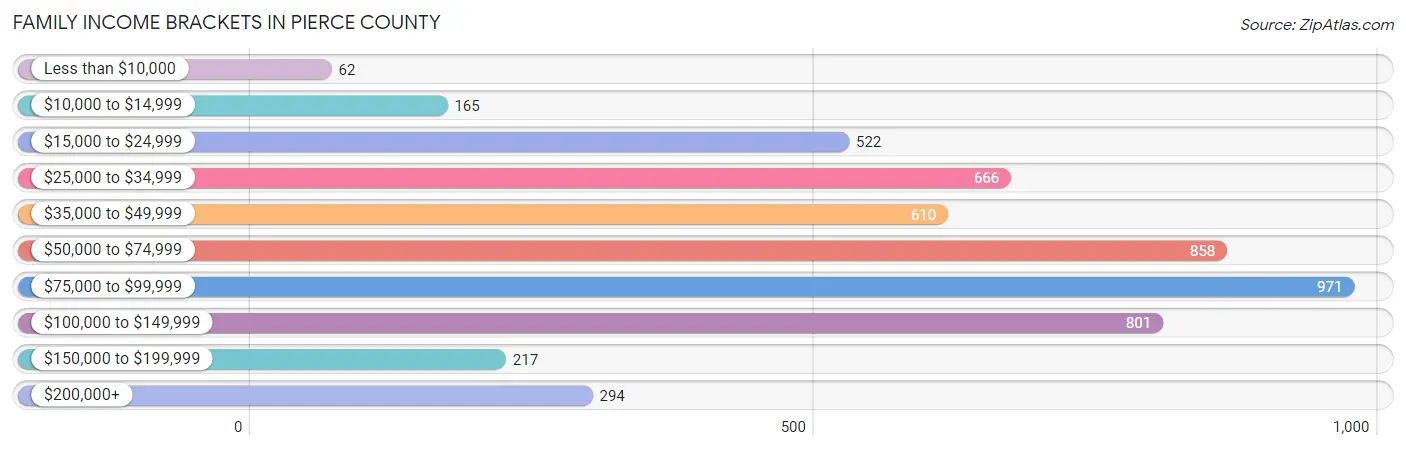
| Income Bracket | # Families | % Families |
| Less than $10,000 | 62 | 1.2% |
| $10,000 to $14,999 | 165 | 3.2% |
| $15,000 to $24,999 | 522 | 10.1% |
| $25,000 to $34,999 | 666 | 12.9% |
| $35,000 to $49,999 | 610 | 11.8% |
| $50,000 to $74,999 | 858 | 16.6% |
| $75,000 to $99,999 | 971 | 18.8% |
| $100,000 to $149,999 | 801 | 15.5% |
| $150,000 to $199,999 | 217 | 4.2% |
| $200,000+ | 294 | 5.7% |
Family Income by Famaliy Size in Pierce County
6-person families (258 | 5.0%) account for the highest median family income in Pierce County with $89,050 per family, while 3-person families (897 | 17.4%) have the highest median income of $27,470 per family member.
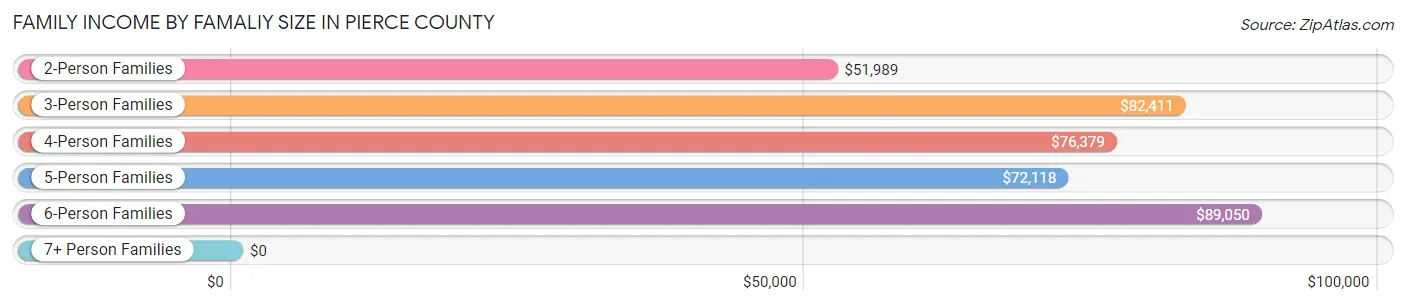
| Income Bracket | # Families | Median Income |
| 2-Person Families | 2,606 (50.4%) | $51,989 |
| 3-Person Families | 897 (17.4%) | $82,411 |
| 4-Person Families | 1,021 (19.8%) | $76,379 |
| 5-Person Families | 377 (7.3%) | $72,118 |
| 6-Person Families | 258 (5.0%) | $89,050 |
| 7+ Person Families | 7 (0.1%) | $0 |
| Total | 5,166 (100.0%) | $65,653 |
Family Income by Number of Earners in Pierce County
The median family income in Pierce County is $65,653, with families comprising 3+ earners (694) having the highest median family income of $93,782, while families with no earners (985) have the lowest median family income of $27,371, accounting for 13.4% and 19.1% of families, respectively.
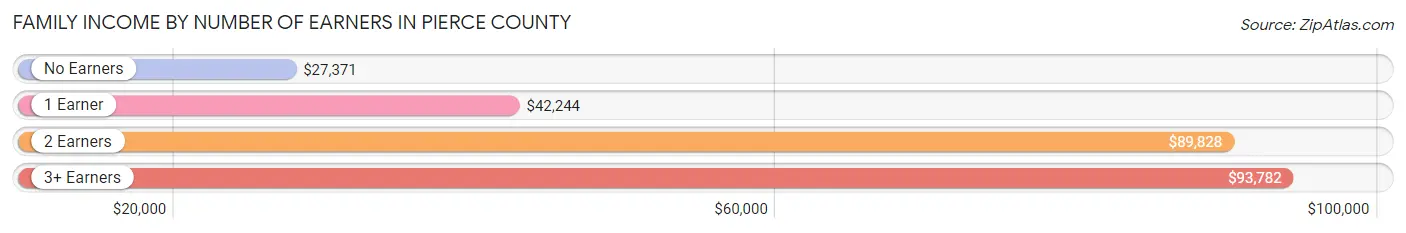
| Number of Earners | # Families | Median Income |
| No Earners | 985 (19.1%) | $27,371 |
| 1 Earner | 1,929 (37.3%) | $42,244 |
| 2 Earners | 1,558 (30.2%) | $89,828 |
| 3+ Earners | 694 (13.4%) | $93,782 |
| Total | 5,166 (100.0%) | $65,653 |
Household Income in Pierce County
Household Income Brackets in Pierce County
With 1,492 households falling in the category, the $50,000 to $74,999 income range is the most frequent in Pierce County, accounting for 20.0% of all households. In contrast, only 261 households (3.5%) fall into the less than $10,000 income bracket, making it the least populous group.
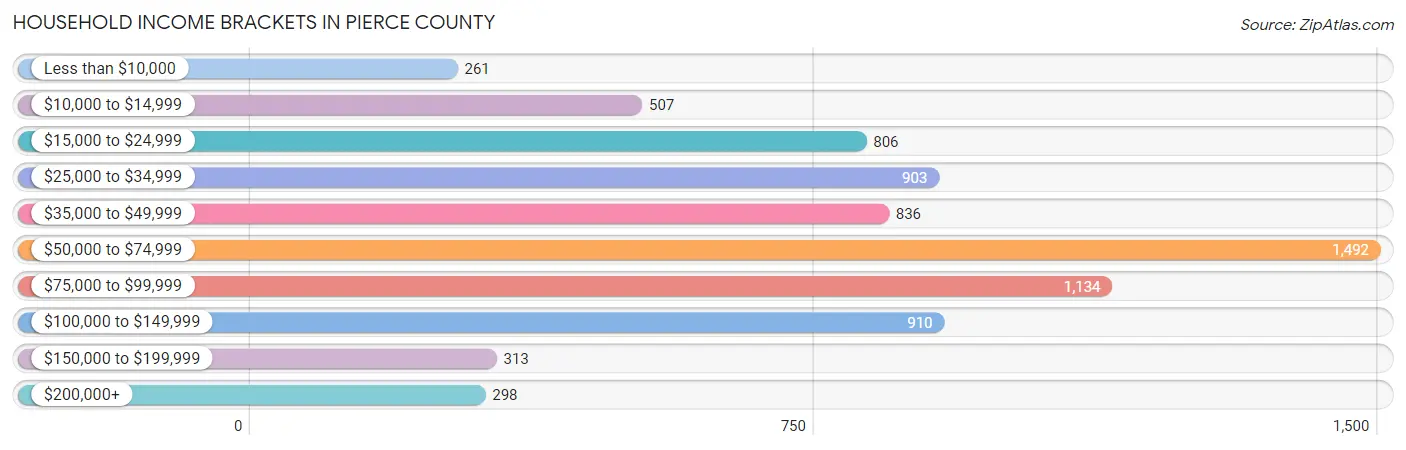
| Income Bracket | # Households | % Households |
| Less than $10,000 | 261 | 3.5% |
| $10,000 to $14,999 | 507 | 6.8% |
| $15,000 to $24,999 | 806 | 10.8% |
| $25,000 to $34,999 | 903 | 12.1% |
| $35,000 to $49,999 | 836 | 11.2% |
| $50,000 to $74,999 | 1,492 | 20.0% |
| $75,000 to $99,999 | 1,134 | 15.2% |
| $100,000 to $149,999 | 910 | 12.2% |
| $150,000 to $199,999 | 313 | 4.2% |
| $200,000+ | 298 | 4.0% |
Household Income by Householder Age in Pierce County
The median household income in Pierce County is $54,861, with the highest median household income of $75,967 found in the 25 to 44 years age bracket for the primary householder. A total of 2,147 households (28.8%) fall into this category. Meanwhile, the 15 to 24 years age bracket for the primary householder has the lowest median household income of $19,490, with 245 households (3.3%) in this group.

| Income Bracket | # Households | Median Income |
| 15 to 24 Years | 245 (3.3%) | $19,490 |
| 25 to 44 Years | 2,147 (28.8%) | $75,967 |
| 45 to 64 Years | 2,958 (39.7%) | $54,490 |
| 65+ Years | 2,110 (28.3%) | $40,261 |
| Total | 7,460 (100.0%) | $54,861 |
Poverty in Pierce County
Income Below Poverty by Sex and Age in Pierce County
With 14.7% poverty level for males and 15.8% for females among the residents of Pierce County, 12 to 14 year old males and 12 to 14 year old females are the most vulnerable to poverty, with 221 males (43.6%) and 183 females (30.0%) in their respective age groups living below the poverty level.
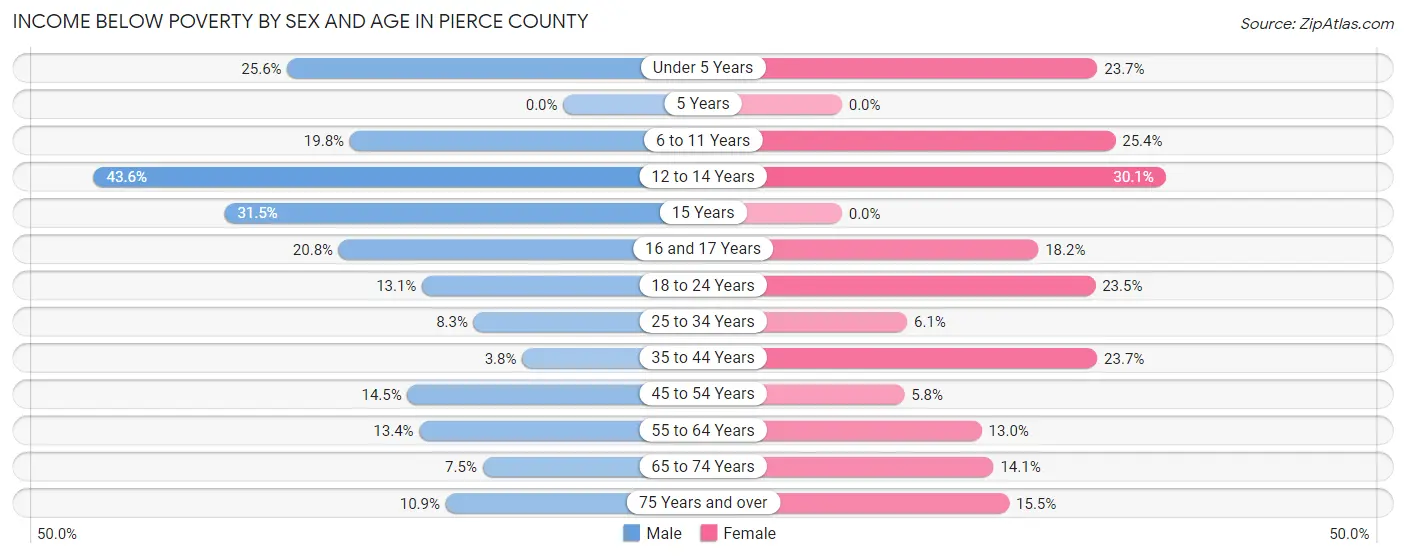
| Age Bracket | Male | Female |
| Under 5 Years | 158 (25.6%) | 139 (23.7%) |
| 5 Years | 0 (0.0%) | 0 (0.0%) |
| 6 to 11 Years | 209 (19.8%) | 116 (25.4%) |
| 12 to 14 Years | 221 (43.6%) | 183 (30.0%) |
| 15 Years | 39 (31.5%) | 0 (0.0%) |
| 16 and 17 Years | 60 (20.8%) | 37 (18.2%) |
| 18 to 24 Years | 112 (13.1%) | 195 (23.5%) |
| 25 to 34 Years | 82 (8.3%) | 70 (6.1%) |
| 35 to 44 Years | 41 (3.8%) | 310 (23.7%) |
| 45 to 54 Years | 229 (14.5%) | 71 (5.8%) |
| 55 to 64 Years | 159 (13.4%) | 159 (13.0%) |
| 65 to 74 Years | 70 (7.5%) | 140 (14.1%) |
| 75 Years and over | 67 (10.9%) | 125 (15.5%) |
| Total | 1,447 (14.7%) | 1,545 (15.8%) |
Income Above Poverty by Sex and Age in Pierce County
According to the poverty statistics in Pierce County, males aged 35 to 44 years and females aged 5 years are the age groups that are most secure financially, with 96.2% of males and 100.0% of females in these age groups living above the poverty line.
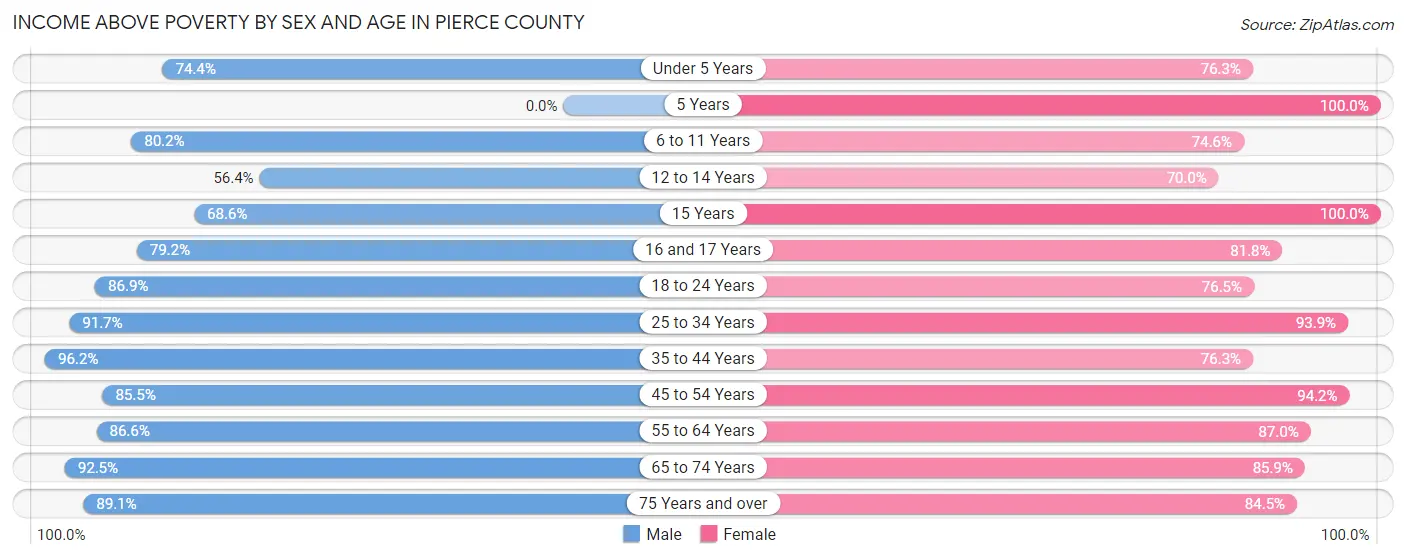
| Age Bracket | Male | Female |
| Under 5 Years | 459 (74.4%) | 447 (76.3%) |
| 5 Years | 0 (0.0%) | 219 (100.0%) |
| 6 to 11 Years | 846 (80.2%) | 341 (74.6%) |
| 12 to 14 Years | 286 (56.4%) | 426 (70.0%) |
| 15 Years | 85 (68.5%) | 160 (100.0%) |
| 16 and 17 Years | 228 (79.2%) | 166 (81.8%) |
| 18 to 24 Years | 743 (86.9%) | 634 (76.5%) |
| 25 to 34 Years | 905 (91.7%) | 1,086 (93.9%) |
| 35 to 44 Years | 1,035 (96.2%) | 998 (76.3%) |
| 45 to 54 Years | 1,355 (85.5%) | 1,153 (94.2%) |
| 55 to 64 Years | 1,031 (86.6%) | 1,066 (87.0%) |
| 65 to 74 Years | 866 (92.5%) | 854 (85.9%) |
| 75 Years and over | 547 (89.1%) | 680 (84.5%) |
| Total | 8,386 (85.3%) | 8,230 (84.2%) |
Income Below Poverty Among Married-Couple Families in Pierce County
The poverty statistics for married-couple families in Pierce County show that 2.4% or 92 of the total 3,922 families live below the poverty line. Families with 1 or 2 children have the highest poverty rate of 4.0%, comprising of 42 families. On the other hand, families with no children have the lowest poverty rate of 1.5%, which includes 39 families.
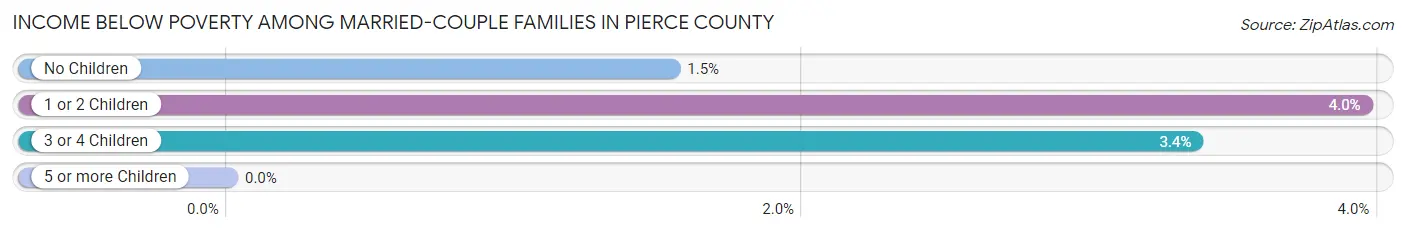
| Children | Above Poverty | Below Poverty |
| No Children | 2,494 (98.5%) | 39 (1.5%) |
| 1 or 2 Children | 1,020 (96.1%) | 42 (4.0%) |
| 3 or 4 Children | 316 (96.6%) | 11 (3.4%) |
| 5 or more Children | 0 (0.0%) | 0 (0.0%) |
| Total | 3,830 (97.7%) | 92 (2.4%) |
Income Below Poverty Among Single-Parent Households in Pierce County
According to the poverty data in Pierce County, 26.3% or 94 single-father households and 38.3% or 339 single-mother households are living below the poverty line. Among single-father households, those with no children have the highest poverty rate, with 27 households (57.5%) experiencing poverty. Likewise, among single-mother households, those with 3 or 4 children have the highest poverty rate, with 53 households (100.0%) falling below the poverty line.
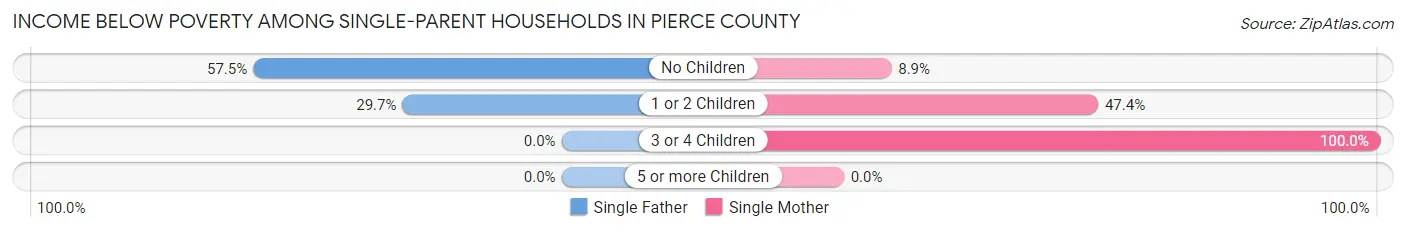
| Children | Single Father | Single Mother |
| No Children | 27 (57.5%) | 25 (8.9%) |
| 1 or 2 Children | 67 (29.6%) | 261 (47.4%) |
| 3 or 4 Children | 0 (0.0%) | 53 (100.0%) |
| 5 or more Children | 0 (0.0%) | 0 (0.0%) |
| Total | 94 (26.3%) | 339 (38.3%) |
Income Below Poverty Among Married-Couple vs Single-Parent Households in Pierce County
The poverty data for Pierce County shows that 92 of the married-couple family households (2.4%) and 433 of the single-parent households (34.8%) are living below the poverty level. Within the married-couple family households, those with 1 or 2 children have the highest poverty rate, with 42 households (4.0%) falling below the poverty line. Among the single-parent households, those with 1 or 2 children have the highest poverty rate, with 328 household (42.2%) living below poverty.
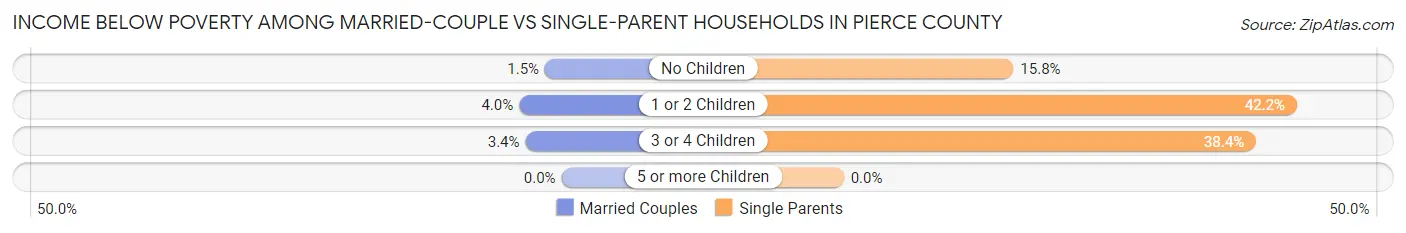
| Children | Married-Couple Families | Single-Parent Households |
| No Children | 39 (1.5%) | 52 (15.8%) |
| 1 or 2 Children | 42 (4.0%) | 328 (42.2%) |
| 3 or 4 Children | 11 (3.4%) | 53 (38.4%) |
| 5 or more Children | 0 (0.0%) | 0 (0.0%) |
| Total | 92 (2.4%) | 433 (34.8%) |
Employment Characteristics in Pierce County
Employment by Class of Employer in Pierce County
Among the 8,446 employed individuals in Pierce County, private company employees (5,856 | 69.3%), state government employees (596 | 7.1%), and local government employees (568 | 6.7%) make up the most common classes of employment.
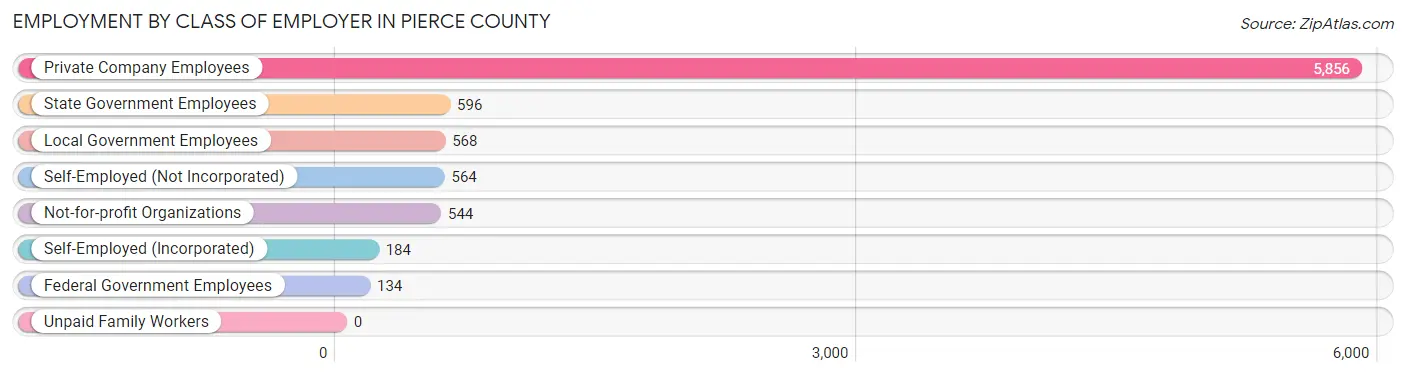
| Employer Class | # Employees | % Employees |
| Private Company Employees | 5,856 | 69.3% |
| Self-Employed (Incorporated) | 184 | 2.2% |
| Self-Employed (Not Incorporated) | 564 | 6.7% |
| Not-for-profit Organizations | 544 | 6.4% |
| Local Government Employees | 568 | 6.7% |
| State Government Employees | 596 | 7.1% |
| Federal Government Employees | 134 | 1.6% |
| Unpaid Family Workers | 0 | 0.0% |
| Total | 8,446 | 100.0% |
Employment Status by Age in Pierce County
According to the labor force statistics for Pierce County, out of the total population over 16 years of age (15,429), 56.5% or 8,717 individuals are in the labor force, with 2.3% or 200 of them unemployed. The age group with the highest labor force participation rate is 30 to 34 years, with 85.2% or 885 individuals in the labor force. Within the labor force, the 20 to 24 years age range has the highest percentage of unemployed individuals, with 5.6% or 53 of them being unemployed.

| Age Bracket | In Labor Force | Unemployed |
| 16 to 19 Years | 424 (43.0%) | 20 (4.7%) |
| 20 to 24 Years | 939 (78.5%) | 53 (5.6%) |
| 25 to 29 Years | 872 (76.4%) | 18 (2.1%) |
| 30 to 34 Years | 885 (85.2%) | 0 (0.0%) |
| 35 to 44 Years | 1,769 (73.6%) | 21 (1.2%) |
| 45 to 54 Years | 2,146 (75.8%) | 54 (2.5%) |
| 55 to 59 Years | 629 (53.3%) | 0 (0.0%) |
| 60 to 64 Years | 628 (50.1%) | 18 (2.9%) |
| 65 to 74 Years | 337 (17.2%) | 16 (4.7%) |
| 75 Years and over | 91 (6.3%) | 0 (0.0%) |
| Total | 8,717 (56.5%) | 200 (2.3%) |
Employment Status by Educational Attainment in Pierce County
According to labor force statistics for Pierce County, 70.3% of individuals (6,923) out of the total population between 25 and 64 years of age (9,848) are in the labor force, with 1.6% or 111 of them being unemployed. The group with the highest labor force participation rate are those with the educational attainment of bachelor's degree or higher, with 85.2% or 1,385 individuals in the labor force. Within the labor force, individuals with less than high school education have the highest percentage of unemployment, with 3.4% or 20 of them being unemployed.
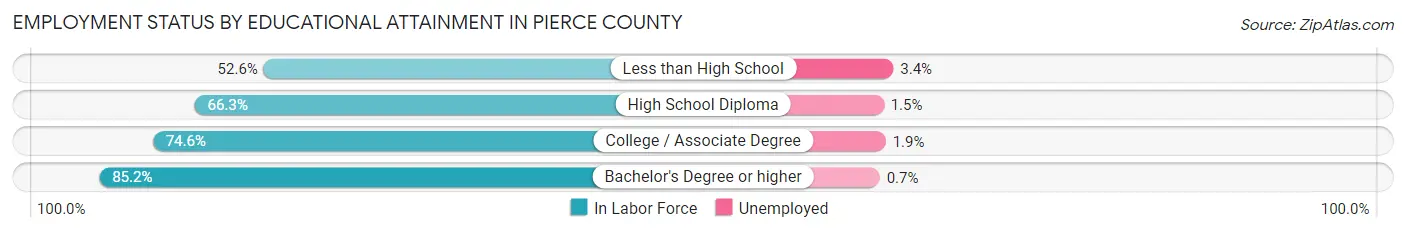
| Educational Attainment | In Labor Force | Unemployed |
| Less than High School | 588 (52.6%) | 38 (3.4%) |
| High School Diploma | 2,756 (66.3%) | 62 (1.5%) |
| College / Associate Degree | 2,199 (74.6%) | 56 (1.9%) |
| Bachelor's Degree or higher | 1,385 (85.2%) | 11 (0.7%) |
| Total | 6,923 (70.3%) | 158 (1.6%) |
Employment Occupations by Sex in Pierce County
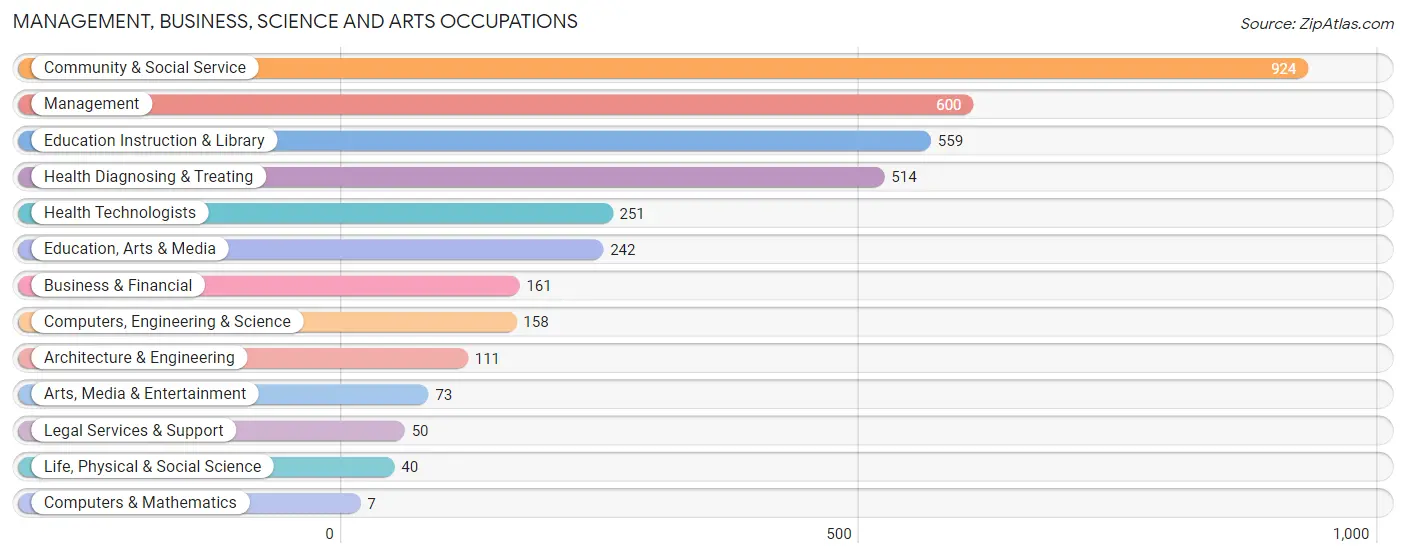
Management, Business, Science and Arts Occupations
The most common Management, Business, Science and Arts occupations in Pierce County are Community & Social Service (924 | 10.9%), Management (600 | 7.1%), Education Instruction & Library (559 | 6.6%), Health Diagnosing & Treating (514 | 6.1%), and Health Technologists (251 | 3.0%).
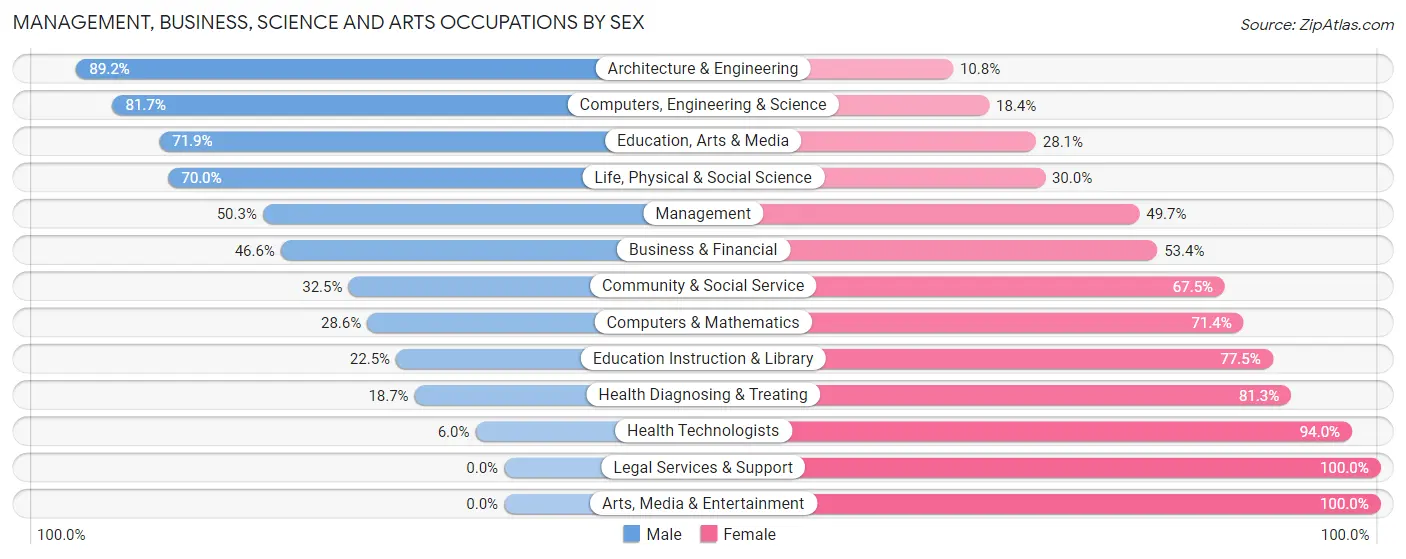
Management, Business, Science and Arts Occupations by Sex
Within the Management, Business, Science and Arts occupations in Pierce County, the most male-oriented occupations are Architecture & Engineering (89.2%), Computers, Engineering & Science (81.7%), and Education, Arts & Media (71.9%), while the most female-oriented occupations are Legal Services & Support (100.0%), Arts, Media & Entertainment (100.0%), and Health Technologists (94.0%).
| Occupation | Male | Female |
| Management | 302 (50.3%) | 298 (49.7%) |
| Business & Financial | 75 (46.6%) | 86 (53.4%) |
| Computers, Engineering & Science | 129 (81.7%) | 29 (18.3%) |
| Computers & Mathematics | 2 (28.6%) | 5 (71.4%) |
| Architecture & Engineering | 99 (89.2%) | 12 (10.8%) |
| Life, Physical & Social Science | 28 (70.0%) | 12 (30.0%) |
| Community & Social Service | 300 (32.5%) | 624 (67.5%) |
| Education, Arts & Media | 174 (71.9%) | 68 (28.1%) |
| Legal Services & Support | 0 (0.0%) | 50 (100.0%) |
| Education Instruction & Library | 126 (22.5%) | 433 (77.5%) |
| Arts, Media & Entertainment | 0 (0.0%) | 73 (100.0%) |
| Health Diagnosing & Treating | 96 (18.7%) | 418 (81.3%) |
| Health Technologists | 15 (6.0%) | 236 (94.0%) |
| Total (Category) | 902 (38.3%) | 1,455 (61.7%) |
| Total (Overall) | 4,673 (55.1%) | 3,801 (44.9%) |
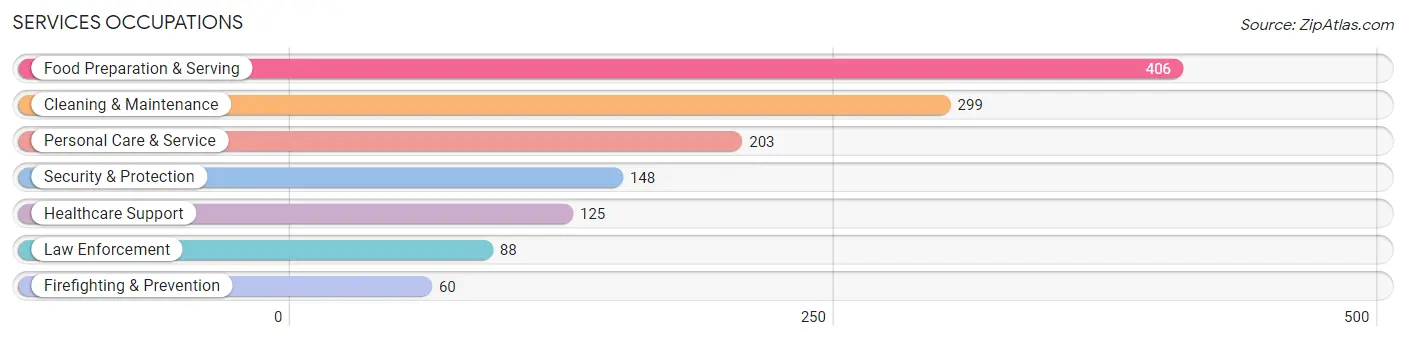
Services Occupations
The most common Services occupations in Pierce County are Food Preparation & Serving (406 | 4.8%), Cleaning & Maintenance (299 | 3.5%), Personal Care & Service (203 | 2.4%), Security & Protection (148 | 1.8%), and Healthcare Support (125 | 1.5%).
Services Occupations by Sex
Within the Services occupations in Pierce County, the most male-oriented occupations are Firefighting & Prevention (90.0%), Cleaning & Maintenance (75.6%), and Security & Protection (71.0%), while the most female-oriented occupations are Personal Care & Service (93.1%), Food Preparation & Serving (72.2%), and Healthcare Support (60.0%).
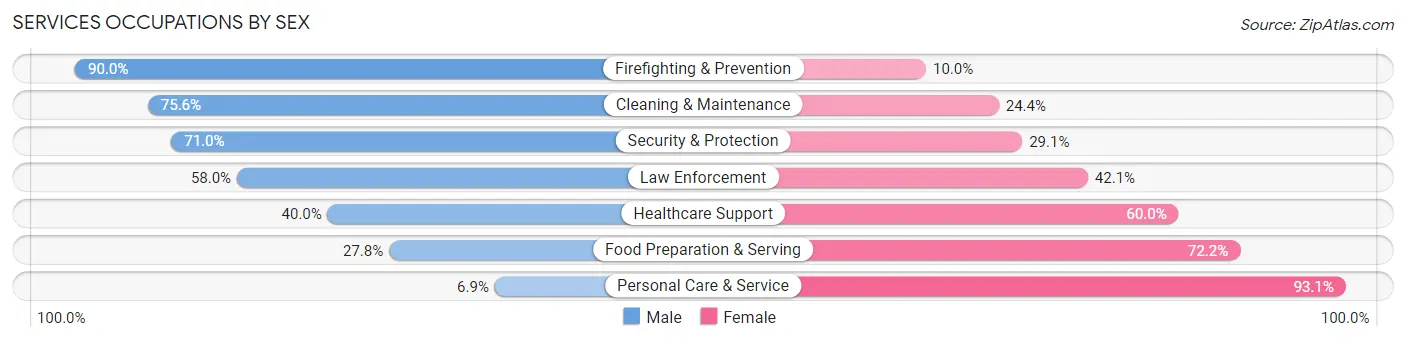
| Occupation | Male | Female |
| Healthcare Support | 50 (40.0%) | 75 (60.0%) |
| Security & Protection | 105 (71.0%) | 43 (29.0%) |
| Firefighting & Prevention | 54 (90.0%) | 6 (10.0%) |
| Law Enforcement | 51 (58.0%) | 37 (42.0%) |
| Food Preparation & Serving | 113 (27.8%) | 293 (72.2%) |
| Cleaning & Maintenance | 226 (75.6%) | 73 (24.4%) |
| Personal Care & Service | 14 (6.9%) | 189 (93.1%) |
| Total (Category) | 508 (43.0%) | 673 (57.0%) |
| Total (Overall) | 4,673 (55.1%) | 3,801 (44.9%) |
Sales and Office Occupations
The most common Sales and Office occupations in Pierce County are Office & Administration (1,327 | 15.7%), and Sales & Related (761 | 9.0%).

Sales and Office Occupations by Sex
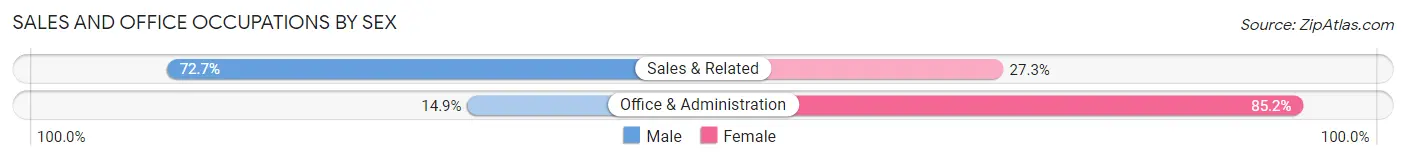
| Occupation | Male | Female |
| Sales & Related | 553 (72.7%) | 208 (27.3%) |
| Office & Administration | 197 (14.8%) | 1,130 (85.2%) |
| Total (Category) | 750 (35.9%) | 1,338 (64.1%) |
| Total (Overall) | 4,673 (55.1%) | 3,801 (44.9%) |
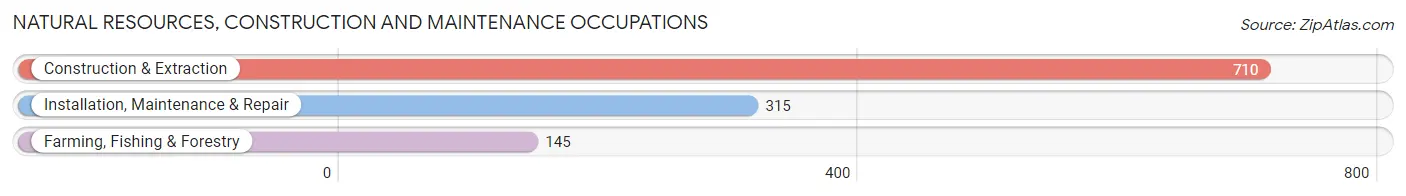
Natural Resources, Construction and Maintenance Occupations
The most common Natural Resources, Construction and Maintenance occupations in Pierce County are Construction & Extraction (710 | 8.4%), Installation, Maintenance & Repair (315 | 3.7%), and Farming, Fishing & Forestry (145 | 1.7%).
Natural Resources, Construction and Maintenance Occupations by Sex
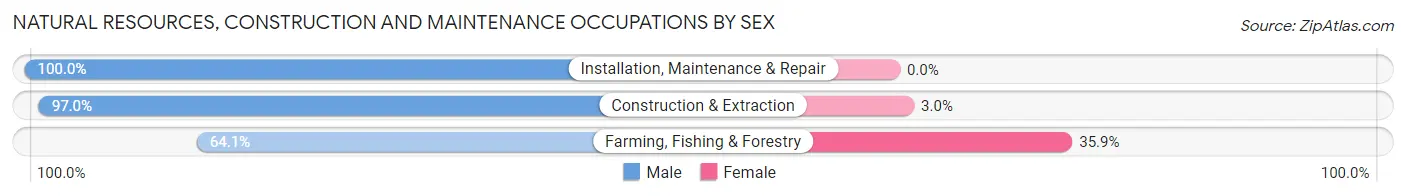
| Occupation | Male | Female |
| Farming, Fishing & Forestry | 93 (64.1%) | 52 (35.9%) |
| Construction & Extraction | 689 (97.0%) | 21 (3.0%) |
| Installation, Maintenance & Repair | 315 (100.0%) | 0 (0.0%) |
| Total (Category) | 1,097 (93.8%) | 73 (6.2%) |
| Total (Overall) | 4,673 (55.1%) | 3,801 (44.9%) |
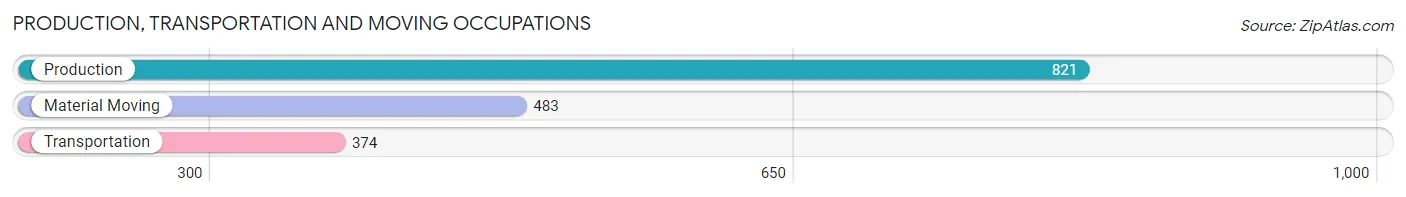
Production, Transportation and Moving Occupations
The most common Production, Transportation and Moving occupations in Pierce County are Production (821 | 9.7%), Material Moving (483 | 5.7%), and Transportation (374 | 4.4%).
Production, Transportation and Moving Occupations by Sex

| Occupation | Male | Female |
| Production | 623 (75.9%) | 198 (24.1%) |
| Transportation | 335 (89.6%) | 39 (10.4%) |
| Material Moving | 458 (94.8%) | 25 (5.2%) |
| Total (Category) | 1,416 (84.4%) | 262 (15.6%) |
| Total (Overall) | 4,673 (55.1%) | 3,801 (44.9%) |
Employment Industries by Sex in Pierce County
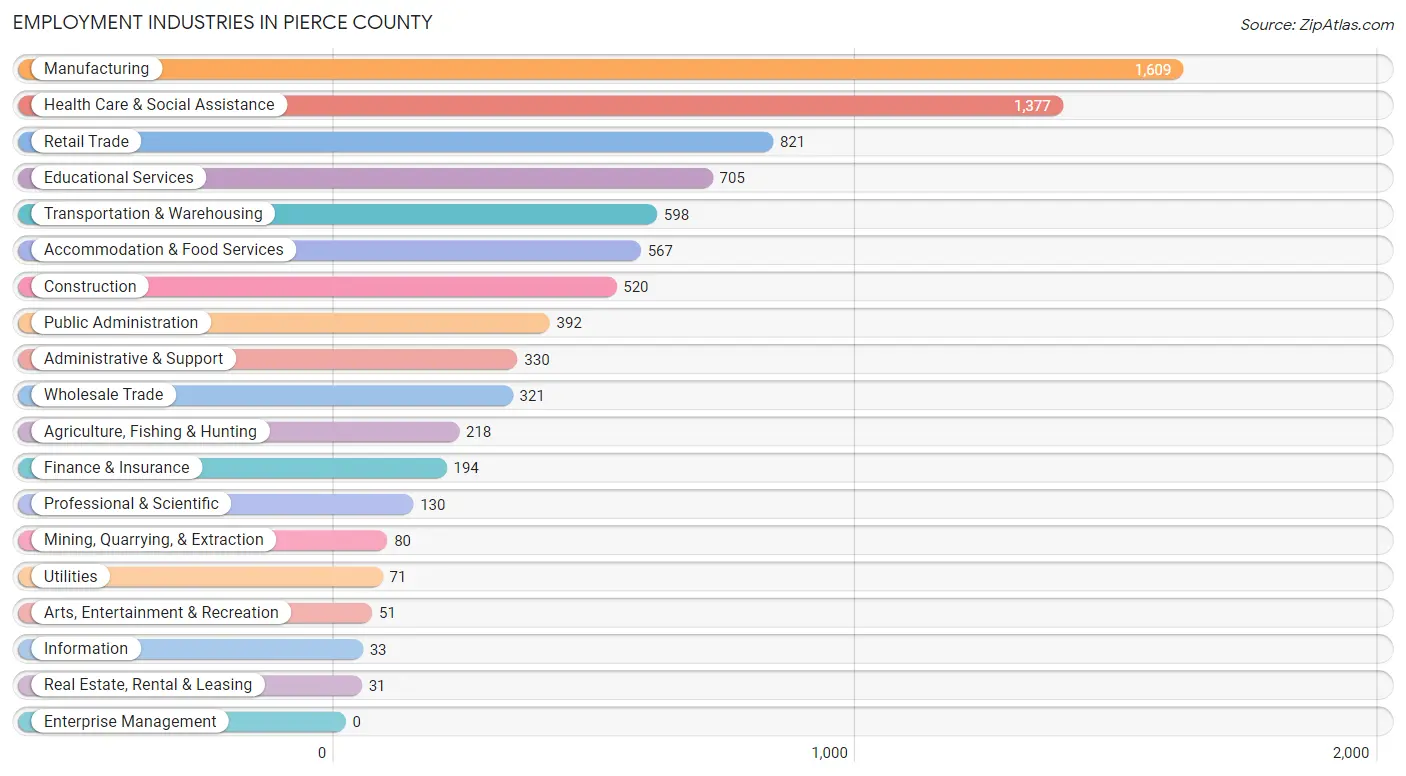
Employment Industries in Pierce County
The major employment industries in Pierce County include Manufacturing (1,609 | 19.0%), Health Care & Social Assistance (1,377 | 16.3%), Retail Trade (821 | 9.7%), Educational Services (705 | 8.3%), and Transportation & Warehousing (598 | 7.1%).
Employment Industries by Sex in Pierce County
The Pierce County industries that see more men than women are Utilities (100.0%), Arts, Entertainment & Recreation (100.0%), and Construction (94.8%), whereas the industries that tend to have a higher number of women are Health Care & Social Assistance (91.6%), Accommodation & Food Services (80.2%), and Finance & Insurance (76.3%).

| Industry | Male | Female |
| Agriculture, Fishing & Hunting | 119 (54.6%) | 99 (45.4%) |
| Mining, Quarrying, & Extraction | 57 (71.3%) | 23 (28.7%) |
| Construction | 493 (94.8%) | 27 (5.2%) |
| Manufacturing | 1,351 (84.0%) | 258 (16.0%) |
| Wholesale Trade | 275 (85.7%) | 46 (14.3%) |
| Retail Trade | 591 (72.0%) | 230 (28.0%) |
| Transportation & Warehousing | 479 (80.1%) | 119 (19.9%) |
| Utilities | 71 (100.0%) | 0 (0.0%) |
| Information | 26 (78.8%) | 7 (21.2%) |
| Finance & Insurance | 46 (23.7%) | 148 (76.3%) |
| Real Estate, Rental & Leasing | 9 (29.0%) | 22 (71.0%) |
| Professional & Scientific | 53 (40.8%) | 77 (59.2%) |
| Enterprise Management | 0 (0.0%) | 0 (0.0%) |
| Administrative & Support | 188 (57.0%) | 142 (43.0%) |
| Educational Services | 285 (40.4%) | 420 (59.6%) |
| Health Care & Social Assistance | 115 (8.4%) | 1,262 (91.6%) |
| Arts, Entertainment & Recreation | 51 (100.0%) | 0 (0.0%) |
| Accommodation & Food Services | 112 (19.8%) | 455 (80.2%) |
| Public Administration | 130 (33.2%) | 262 (66.8%) |
| Total | 4,673 (55.1%) | 3,801 (44.9%) |
Education in Pierce County
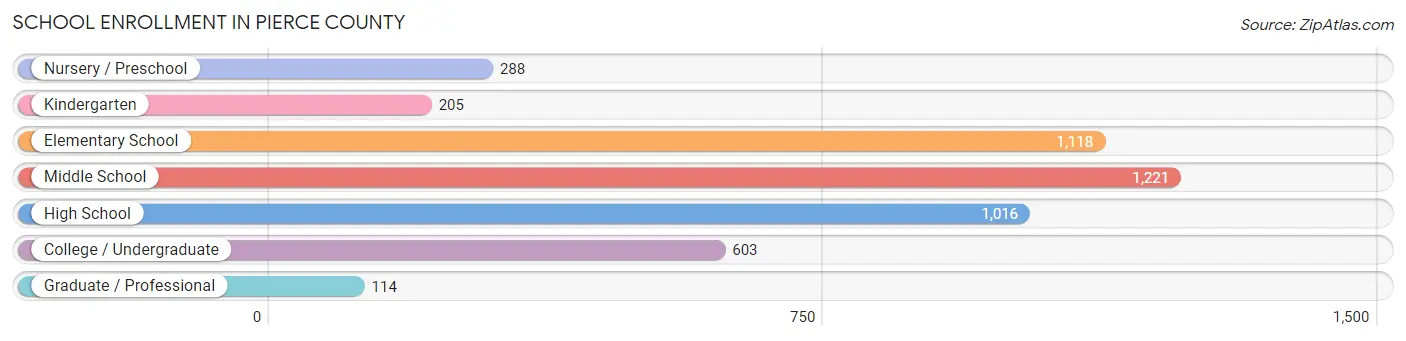
School Enrollment in Pierce County
The most common levels of schooling among the 4,565 students in Pierce County are middle school (1,221 | 26.8%), elementary school (1,118 | 24.5%), and high school (1,016 | 22.3%).
| School Level | # Students | % Students |
| Nursery / Preschool | 288 | 6.3% |
| Kindergarten | 205 | 4.5% |
| Elementary School | 1,118 | 24.5% |
| Middle School | 1,221 | 26.8% |
| High School | 1,016 | 22.3% |
| College / Undergraduate | 603 | 13.2% |
| Graduate / Professional | 114 | 2.5% |
| Total | 4,565 | 100.0% |
School Enrollment by Age by Funding Source in Pierce County
Out of a total of 4,565 students who are enrolled in schools in Pierce County, 283 (6.2%) attend a private institution, while the remaining 4,282 (93.8%) are enrolled in public schools. The age group of 20 to 24 year olds has the highest likelihood of being enrolled in private schools, with 167 (40.8% in the age bracket) enrolled. Conversely, the age group of 18 to 19 year olds has the lowest likelihood of being enrolled in a private school, with 242 (100.0% in the age bracket) attending a public institution.

| Age Bracket | Public School | Private School |
| 3 to 4 Year Olds | 132 (72.9%) | 49 (27.1%) |
| 5 to 9 Year Old | 1,089 (97.2%) | 32 (2.9%) |
| 10 to 14 Year Olds | 1,700 (99.8%) | 3 (0.2%) |
| 15 to 17 Year Olds | 628 (95.2%) | 32 (4.9%) |
| 18 to 19 Year Olds | 242 (100.0%) | 0 (0.0%) |
| 20 to 24 Year Olds | 242 (59.2%) | 167 (40.8%) |
| 25 to 34 Year Olds | 94 (100.0%) | 0 (0.0%) |
| 35 Years and over | 155 (100.0%) | 0 (0.0%) |
| Total | 4,282 (93.8%) | 283 (6.2%) |
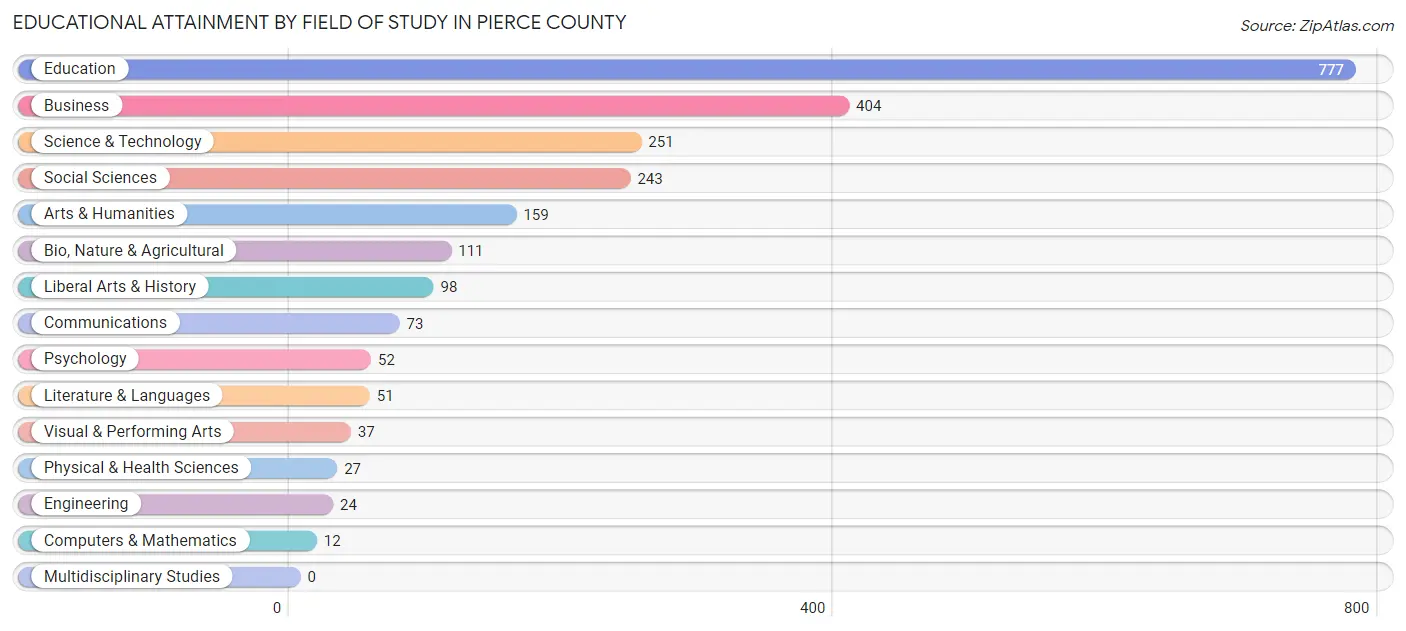
Educational Attainment by Field of Study in Pierce County
Education (777 | 33.5%), business (404 | 17.4%), science & technology (251 | 10.8%), social sciences (243 | 10.5%), and arts & humanities (159 | 6.9%) are the most common fields of study among 2,319 individuals in Pierce County who have obtained a bachelor's degree or higher.
| Field of Study | # Graduates | % Graduates |
| Computers & Mathematics | 12 | 0.5% |
| Bio, Nature & Agricultural | 111 | 4.8% |
| Physical & Health Sciences | 27 | 1.2% |
| Psychology | 52 | 2.2% |
| Social Sciences | 243 | 10.5% |
| Engineering | 24 | 1.0% |
| Multidisciplinary Studies | 0 | 0.0% |
| Science & Technology | 251 | 10.8% |
| Business | 404 | 17.4% |
| Education | 777 | 33.5% |
| Literature & Languages | 51 | 2.2% |
| Liberal Arts & History | 98 | 4.2% |
| Visual & Performing Arts | 37 | 1.6% |
| Communications | 73 | 3.2% |
| Arts & Humanities | 159 | 6.9% |
| Total | 2,319 | 100.0% |
Transportation & Commute in Pierce County
Vehicle Availability by Sex in Pierce County
The most prevalent vehicle ownership categories in Pierce County are males with 2 vehicles (2,126, accounting for 45.6%) and females with 2 vehicles (1,535, making up 56.3%).

| Vehicles Available | Male | Female |
| No Vehicle | 58 (1.3%) | 11 (0.3%) |
| 1 Vehicle | 400 (8.6%) | 634 (16.8%) |
| 2 Vehicles | 2,126 (45.6%) | 1,535 (40.6%) |
| 3 Vehicles | 1,261 (27.1%) | 909 (24.0%) |
| 4 Vehicles | 699 (15.0%) | 628 (16.6%) |
| 5 or more Vehicles | 114 (2.5%) | 62 (1.6%) |
| Total | 4,658 (100.0%) | 3,779 (100.0%) |
Commute Time in Pierce County
The most frequently occuring commute durations in Pierce County are 15 to 19 minutes (1,760 commuters, 21.1%), 20 to 24 minutes (1,539 commuters, 18.4%), and 30 to 34 minutes (1,398 commuters, 16.7%).
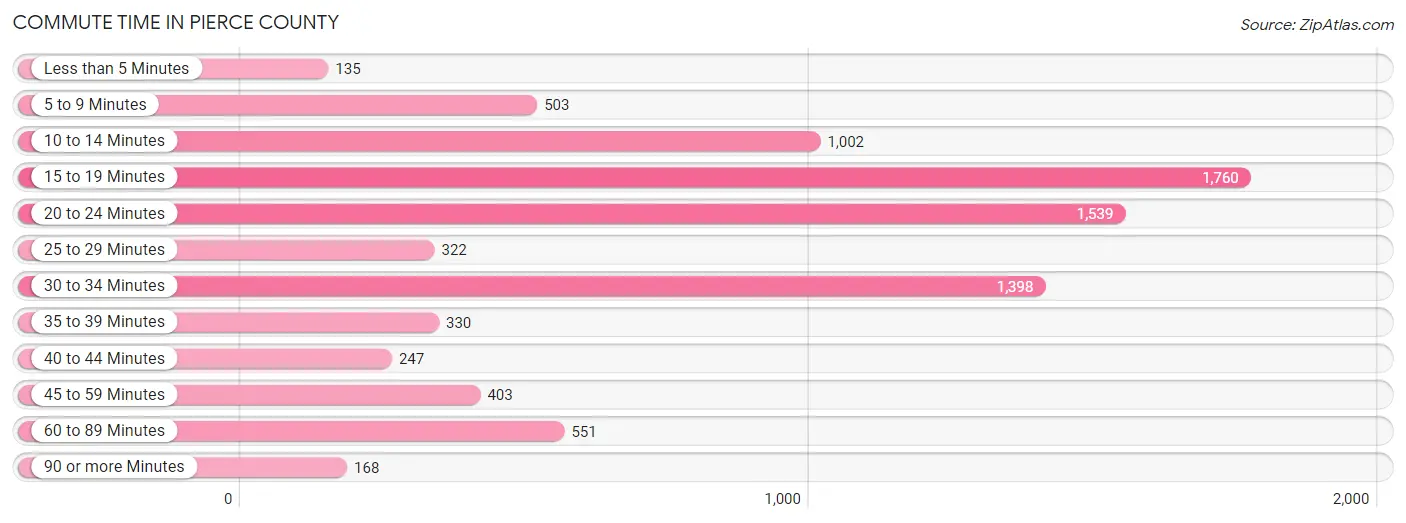
| Commute Time | # Commuters | % Commuters |
| Less than 5 Minutes | 135 | 1.6% |
| 5 to 9 Minutes | 503 | 6.0% |
| 10 to 14 Minutes | 1,002 | 12.0% |
| 15 to 19 Minutes | 1,760 | 21.1% |
| 20 to 24 Minutes | 1,539 | 18.4% |
| 25 to 29 Minutes | 322 | 3.8% |
| 30 to 34 Minutes | 1,398 | 16.7% |
| 35 to 39 Minutes | 330 | 4.0% |
| 40 to 44 Minutes | 247 | 3.0% |
| 45 to 59 Minutes | 403 | 4.8% |
| 60 to 89 Minutes | 551 | 6.6% |
| 90 or more Minutes | 168 | 2.0% |
Commute Time by Sex in Pierce County
The most common commute times in Pierce County are 15 to 19 minutes (931 commuters, 20.1%) for males and 15 to 19 minutes (829 commuters, 22.3%) for females.
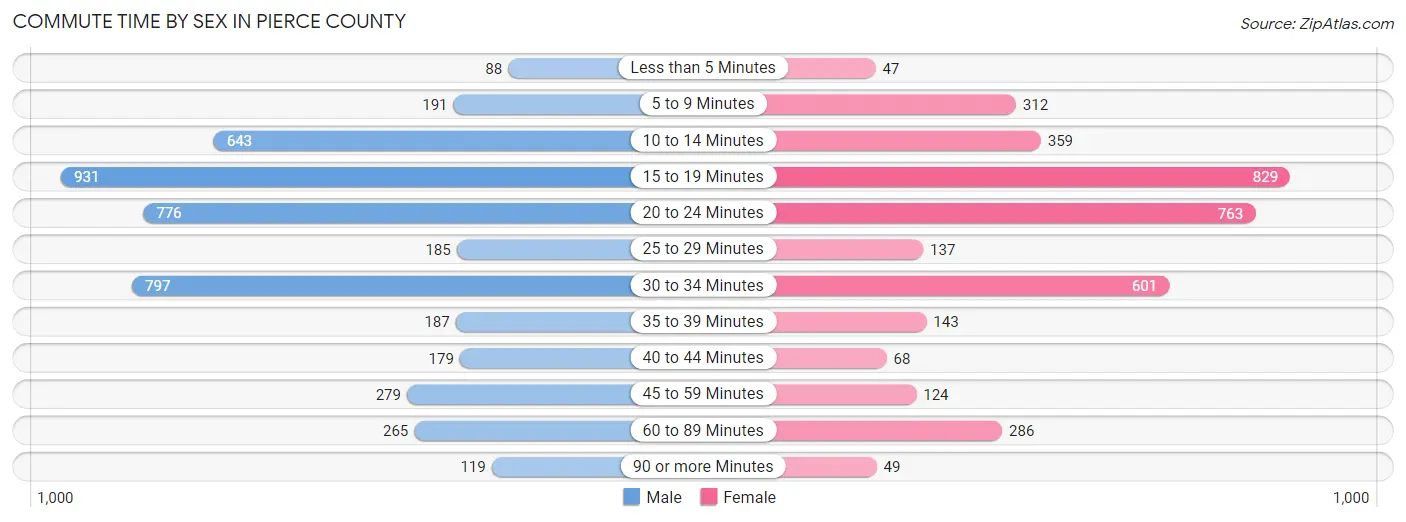
| Commute Time | Male | Female |
| Less than 5 Minutes | 88 (1.9%) | 47 (1.3%) |
| 5 to 9 Minutes | 191 (4.1%) | 312 (8.4%) |
| 10 to 14 Minutes | 643 (13.9%) | 359 (9.7%) |
| 15 to 19 Minutes | 931 (20.1%) | 829 (22.3%) |
| 20 to 24 Minutes | 776 (16.7%) | 763 (20.5%) |
| 25 to 29 Minutes | 185 (4.0%) | 137 (3.7%) |
| 30 to 34 Minutes | 797 (17.2%) | 601 (16.2%) |
| 35 to 39 Minutes | 187 (4.0%) | 143 (3.8%) |
| 40 to 44 Minutes | 179 (3.9%) | 68 (1.8%) |
| 45 to 59 Minutes | 279 (6.0%) | 124 (3.3%) |
| 60 to 89 Minutes | 265 (5.7%) | 286 (7.7%) |
| 90 or more Minutes | 119 (2.6%) | 49 (1.3%) |
Time of Departure to Work by Sex in Pierce County
The most frequent times of departure to work in Pierce County are 7:00 AM to 7:29 AM (980, 21.1%) for males and 7:30 AM to 7:59 AM (685, 18.4%) for females.
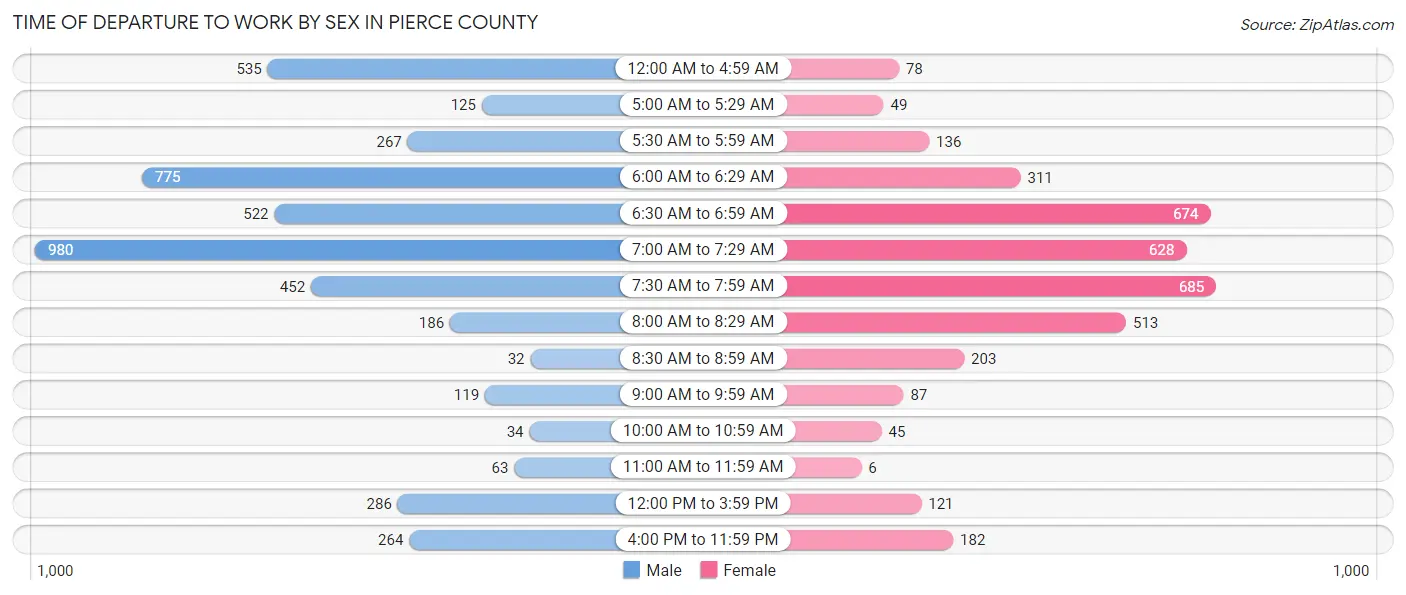
| Time of Departure | Male | Female |
| 12:00 AM to 4:59 AM | 535 (11.5%) | 78 (2.1%) |
| 5:00 AM to 5:29 AM | 125 (2.7%) | 49 (1.3%) |
| 5:30 AM to 5:59 AM | 267 (5.8%) | 136 (3.7%) |
| 6:00 AM to 6:29 AM | 775 (16.7%) | 311 (8.4%) |
| 6:30 AM to 6:59 AM | 522 (11.3%) | 674 (18.1%) |
| 7:00 AM to 7:29 AM | 980 (21.1%) | 628 (16.9%) |
| 7:30 AM to 7:59 AM | 452 (9.7%) | 685 (18.4%) |
| 8:00 AM to 8:29 AM | 186 (4.0%) | 513 (13.8%) |
| 8:30 AM to 8:59 AM | 32 (0.7%) | 203 (5.5%) |
| 9:00 AM to 9:59 AM | 119 (2.6%) | 87 (2.3%) |
| 10:00 AM to 10:59 AM | 34 (0.7%) | 45 (1.2%) |
| 11:00 AM to 11:59 AM | 63 (1.4%) | 6 (0.2%) |
| 12:00 PM to 3:59 PM | 286 (6.2%) | 121 (3.3%) |
| 4:00 PM to 11:59 PM | 264 (5.7%) | 182 (4.9%) |
| Total | 4,640 (100.0%) | 3,718 (100.0%) |
Housing Occupancy in Pierce County
Occupancy by Ownership in Pierce County
Of the total 7,460 dwellings in Pierce County, owner-occupied units account for 5,734 (76.9%), while renter-occupied units make up 1,726 (23.1%).

| Occupancy | # Housing Units | % Housing Units |
| Owner Occupied Housing Units | 5,734 | 76.9% |
| Renter-Occupied Housing Units | 1,726 | 23.1% |
| Total Occupied Housing Units | 7,460 | 100.0% |
Occupancy by Household Size in Pierce County
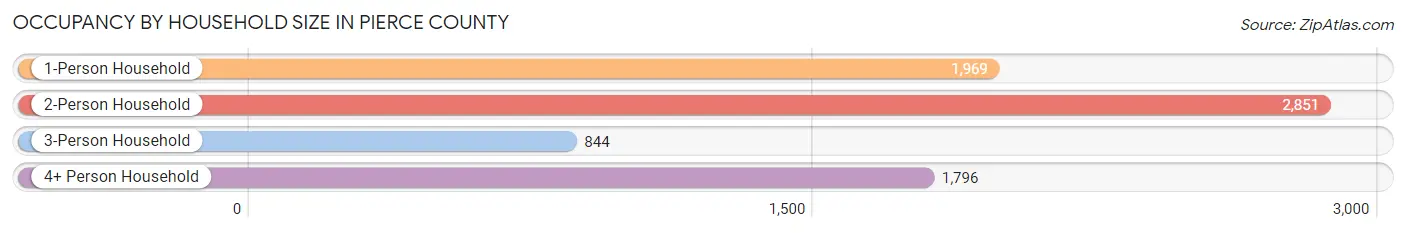
| Household Size | # Housing Units | % Housing Units |
| 1-Person Household | 1,969 | 26.4% |
| 2-Person Household | 2,851 | 38.2% |
| 3-Person Household | 844 | 11.3% |
| 4+ Person Household | 1,796 | 24.1% |
| Total Housing Units | 7,460 | 100.0% |
Occupancy by Ownership by Household Size in Pierce County
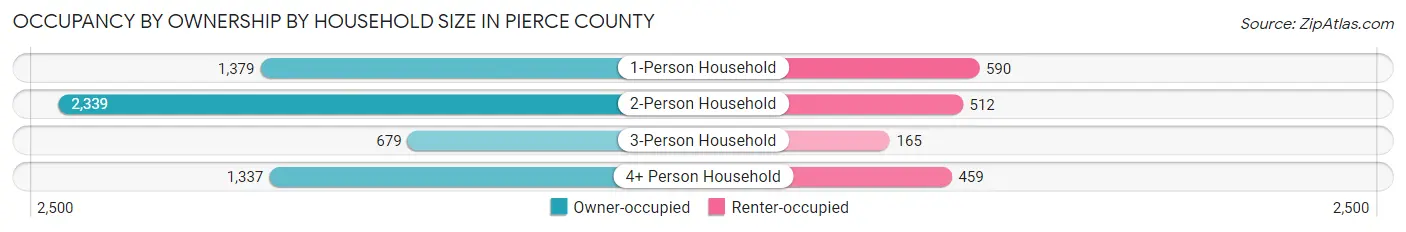
| Household Size | Owner-occupied | Renter-occupied |
| 1-Person Household | 1,379 (70.0%) | 590 (30.0%) |
| 2-Person Household | 2,339 (82.0%) | 512 (18.0%) |
| 3-Person Household | 679 (80.4%) | 165 (19.6%) |
| 4+ Person Household | 1,337 (74.4%) | 459 (25.6%) |
| Total Housing Units | 5,734 (76.9%) | 1,726 (23.1%) |
Occupancy by Educational Attainment in Pierce County
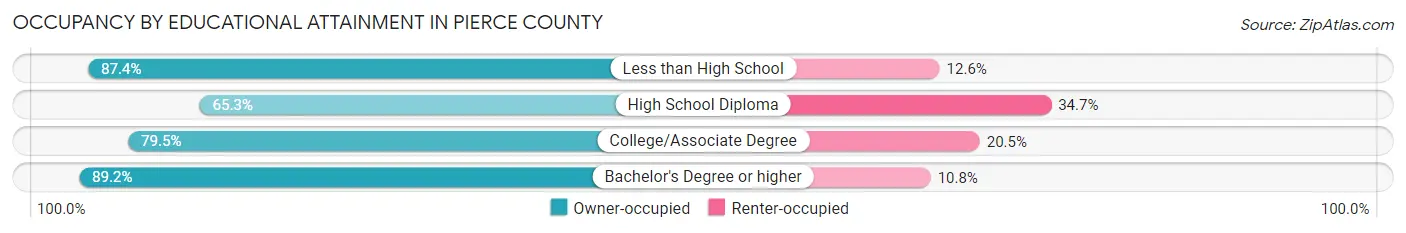
| Household Size | Owner-occupied | Renter-occupied |
| Less than High School | 847 (87.4%) | 122 (12.6%) |
| High School Diploma | 1,911 (65.3%) | 1,016 (34.7%) |
| College/Associate Degree | 1,656 (79.5%) | 428 (20.5%) |
| Bachelor's Degree or higher | 1,320 (89.2%) | 160 (10.8%) |
Occupancy by Age of Householder in Pierce County
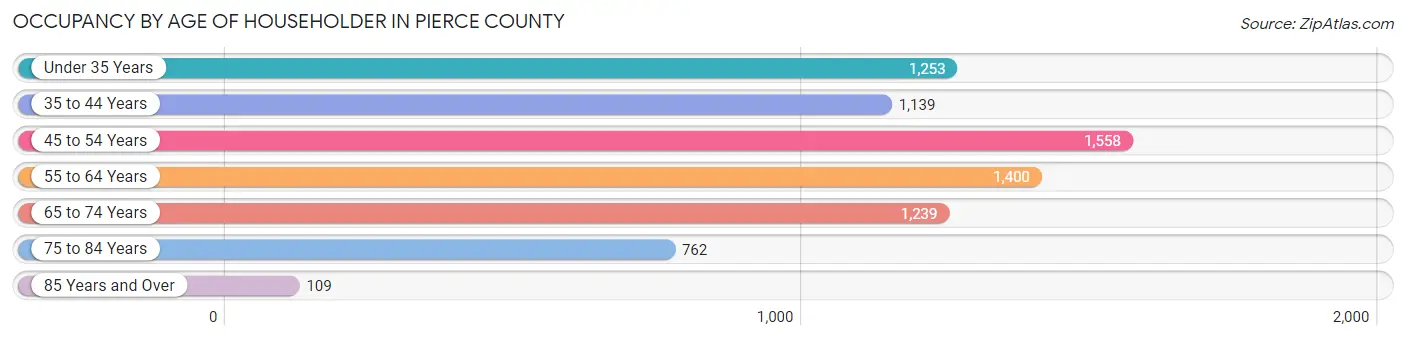
| Age Bracket | # Households | % Households |
| Under 35 Years | 1,253 | 16.8% |
| 35 to 44 Years | 1,139 | 15.3% |
| 45 to 54 Years | 1,558 | 20.9% |
| 55 to 64 Years | 1,400 | 18.8% |
| 65 to 74 Years | 1,239 | 16.6% |
| 75 to 84 Years | 762 | 10.2% |
| 85 Years and Over | 109 | 1.5% |
| Total | 7,460 | 100.0% |
Housing Finances in Pierce County
Median Income by Occupancy in Pierce County
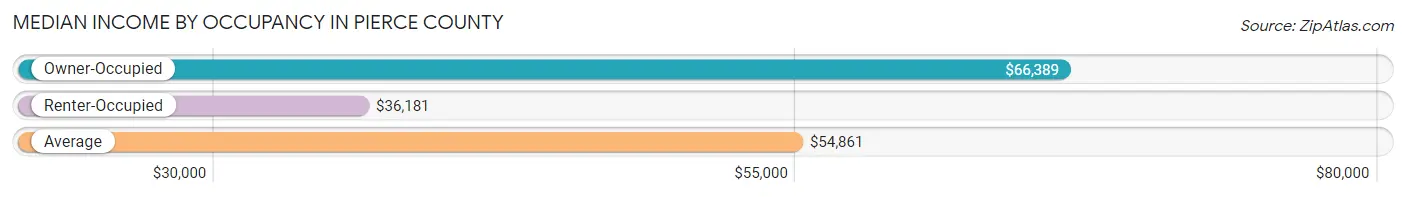
| Occupancy Type | # Households | Median Income |
| Owner-Occupied | 5,734 (76.9%) | $66,389 |
| Renter-Occupied | 1,726 (23.1%) | $36,181 |
| Average | 7,460 (100.0%) | $54,861 |
Occupancy by Householder Income Bracket in Pierce County
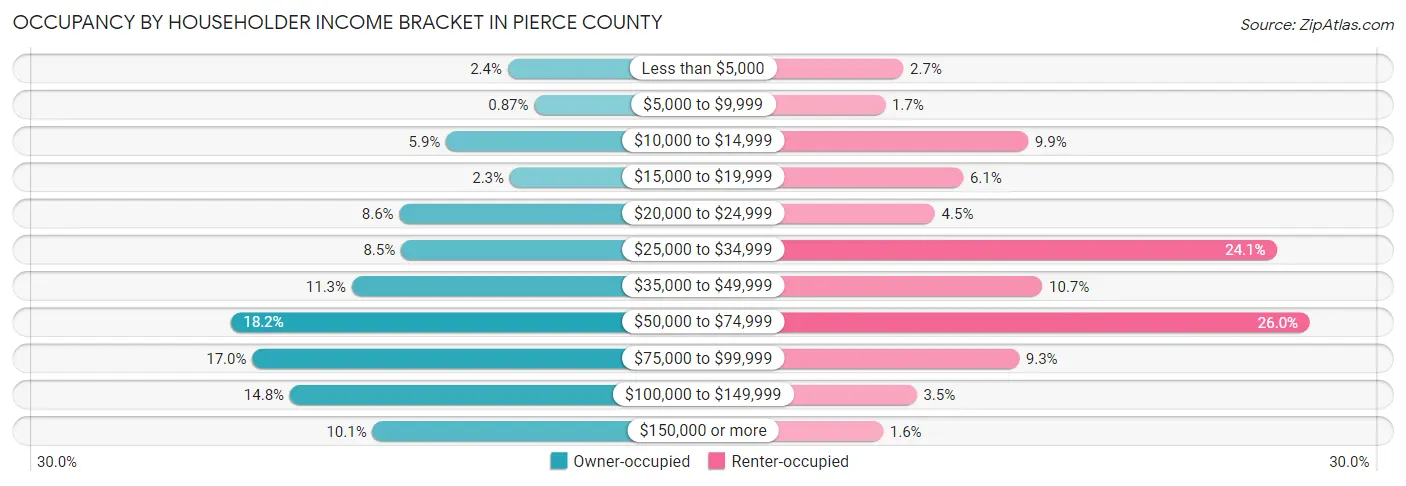
| Income Bracket | Owner-occupied | Renter-occupied |
| Less than $5,000 | 137 (2.4%) | 47 (2.7%) |
| $5,000 to $9,999 | 50 (0.9%) | 29 (1.7%) |
| $10,000 to $14,999 | 339 (5.9%) | 170 (9.9%) |
| $15,000 to $19,999 | 130 (2.3%) | 106 (6.1%) |
| $20,000 to $24,999 | 492 (8.6%) | 78 (4.5%) |
| $25,000 to $34,999 | 487 (8.5%) | 416 (24.1%) |
| $35,000 to $49,999 | 648 (11.3%) | 184 (10.7%) |
| $50,000 to $74,999 | 1,046 (18.2%) | 448 (26.0%) |
| $75,000 to $99,999 | 974 (17.0%) | 161 (9.3%) |
| $100,000 to $149,999 | 851 (14.8%) | 60 (3.5%) |
| $150,000 or more | 580 (10.1%) | 27 (1.6%) |
| Total | 5,734 (100.0%) | 1,726 (100.0%) |
Monthly Housing Cost Tiers in Pierce County
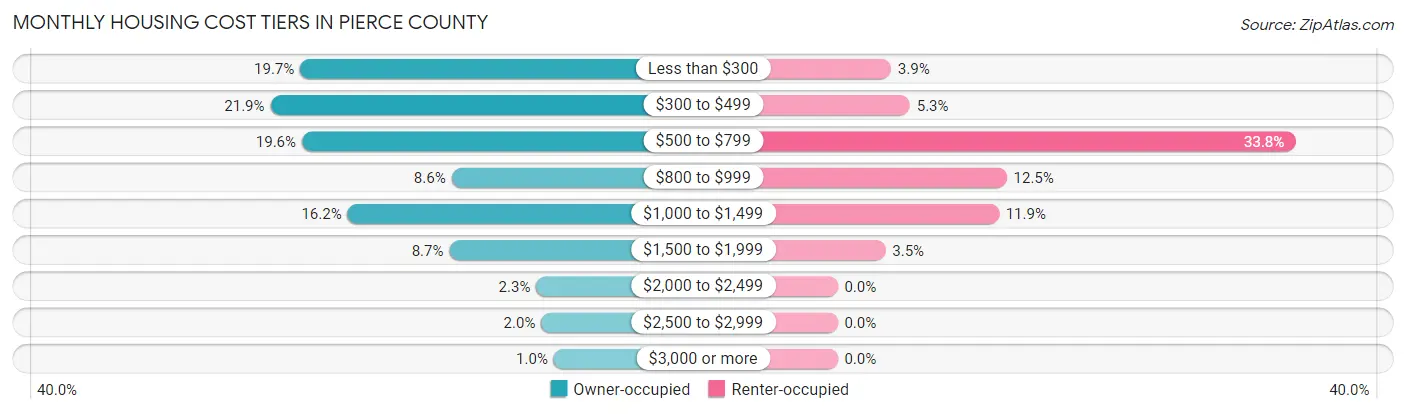
| Monthly Cost | Owner-occupied | Renter-occupied |
| Less than $300 | 1,130 (19.7%) | 68 (3.9%) |
| $300 to $499 | 1,256 (21.9%) | 92 (5.3%) |
| $500 to $799 | 1,123 (19.6%) | 583 (33.8%) |
| $800 to $999 | 491 (8.6%) | 215 (12.5%) |
| $1,000 to $1,499 | 930 (16.2%) | 205 (11.9%) |
| $1,500 to $1,999 | 500 (8.7%) | 61 (3.5%) |
| $2,000 to $2,499 | 133 (2.3%) | 0 (0.0%) |
| $2,500 to $2,999 | 112 (1.9%) | 0 (0.0%) |
| $3,000 or more | 59 (1.0%) | 0 (0.0%) |
| Total | 5,734 (100.0%) | 1,726 (100.0%) |
Physical Housing Characteristics in Pierce County
Housing Structures in Pierce County
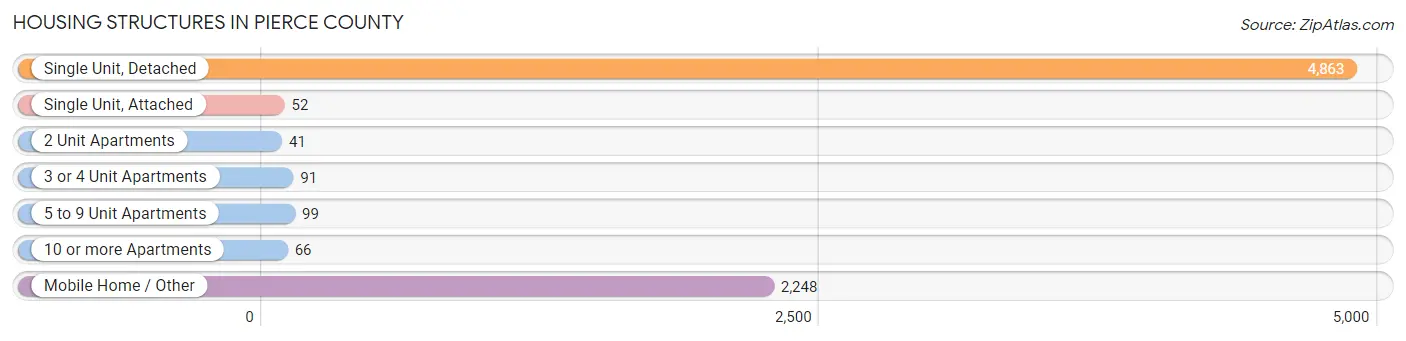
| Structure Type | # Housing Units | % Housing Units |
| Single Unit, Detached | 4,863 | 65.2% |
| Single Unit, Attached | 52 | 0.7% |
| 2 Unit Apartments | 41 | 0.5% |
| 3 or 4 Unit Apartments | 91 | 1.2% |
| 5 to 9 Unit Apartments | 99 | 1.3% |
| 10 or more Apartments | 66 | 0.9% |
| Mobile Home / Other | 2,248 | 30.1% |
| Total | 7,460 | 100.0% |
Housing Structures by Occupancy in Pierce County
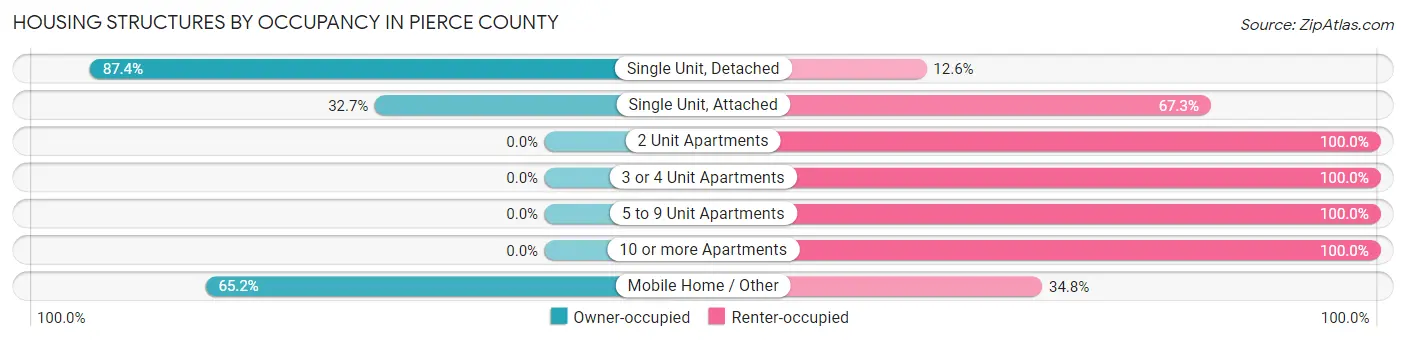
| Structure Type | Owner-occupied | Renter-occupied |
| Single Unit, Detached | 4,252 (87.4%) | 611 (12.6%) |
| Single Unit, Attached | 17 (32.7%) | 35 (67.3%) |
| 2 Unit Apartments | 0 (0.0%) | 41 (100.0%) |
| 3 or 4 Unit Apartments | 0 (0.0%) | 91 (100.0%) |
| 5 to 9 Unit Apartments | 0 (0.0%) | 99 (100.0%) |
| 10 or more Apartments | 0 (0.0%) | 66 (100.0%) |
| Mobile Home / Other | 1,465 (65.2%) | 783 (34.8%) |
| Total | 5,734 (76.9%) | 1,726 (23.1%) |
Housing Structures by Number of Rooms in Pierce County
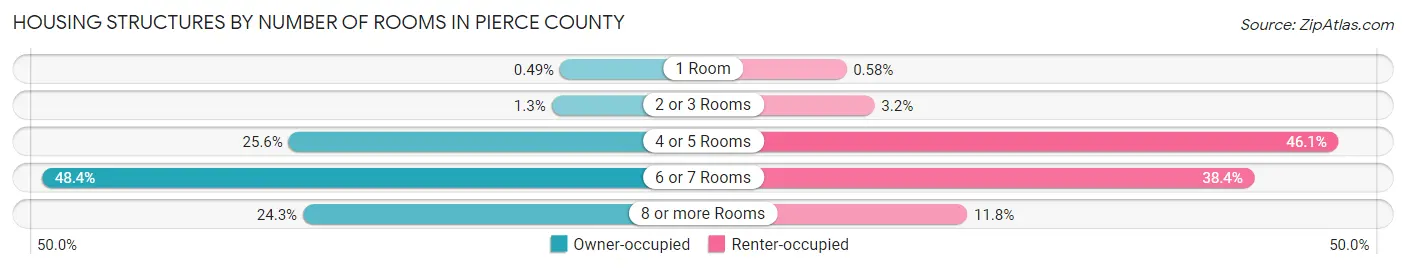
| Number of Rooms | Owner-occupied | Renter-occupied |
| 1 Room | 28 (0.5%) | 10 (0.6%) |
| 2 or 3 Rooms | 73 (1.3%) | 55 (3.2%) |
| 4 or 5 Rooms | 1,467 (25.6%) | 796 (46.1%) |
| 6 or 7 Rooms | 2,775 (48.4%) | 662 (38.4%) |
| 8 or more Rooms | 1,391 (24.3%) | 203 (11.8%) |
| Total | 5,734 (100.0%) | 1,726 (100.0%) |
Housing Structure by Heating Type in Pierce County

| Heating Type | Owner-occupied | Renter-occupied |
| Utility Gas | 184 (3.2%) | 2 (0.1%) |
| Bottled, Tank, or LP Gas | 174 (3.0%) | 15 (0.9%) |
| Electricity | 5,261 (91.7%) | 1,672 (96.9%) |
| Fuel Oil or Kerosene | 0 (0.0%) | 10 (0.6%) |
| Coal or Coke | 0 (0.0%) | 0 (0.0%) |
| All other Fuels | 12 (0.2%) | 25 (1.5%) |
| No Fuel Used | 103 (1.8%) | 2 (0.1%) |
| Total | 5,734 (100.0%) | 1,726 (100.0%) |
Household Vehicle Usage in Pierce County
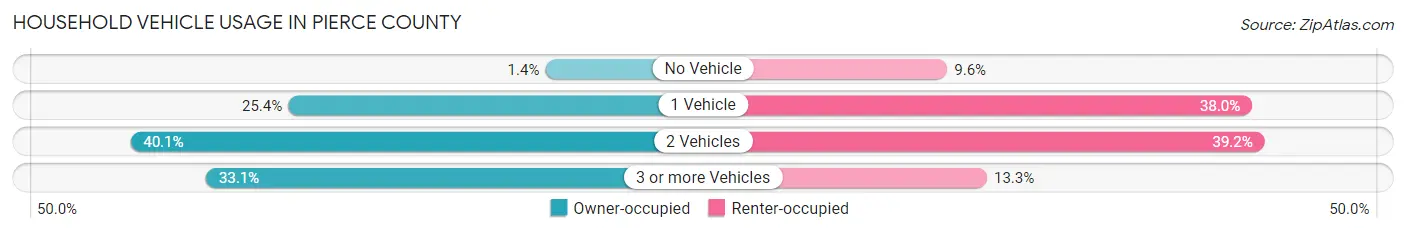
| Vehicles per Household | Owner-occupied | Renter-occupied |
| No Vehicle | 80 (1.4%) | 165 (9.6%) |
| 1 Vehicle | 1,457 (25.4%) | 656 (38.0%) |
| 2 Vehicles | 2,301 (40.1%) | 676 (39.2%) |
| 3 or more Vehicles | 1,896 (33.1%) | 229 (13.3%) |
| Total | 5,734 (100.0%) | 1,726 (100.0%) |
Real Estate & Mortgages in Pierce County
Real Estate and Mortgage Overview in Pierce County
| Characteristic | Without Mortgage | With Mortgage |
| Housing Units | 3,181 | 2,553 |
| Median Property Value | $91,200 | $157,200 |
| Median Household Income | $44,980 | $355 |
| Monthly Housing Costs | $365 | $59 |
| Real Estate Taxes | $782 | $220 |
Property Value by Mortgage Status in Pierce County
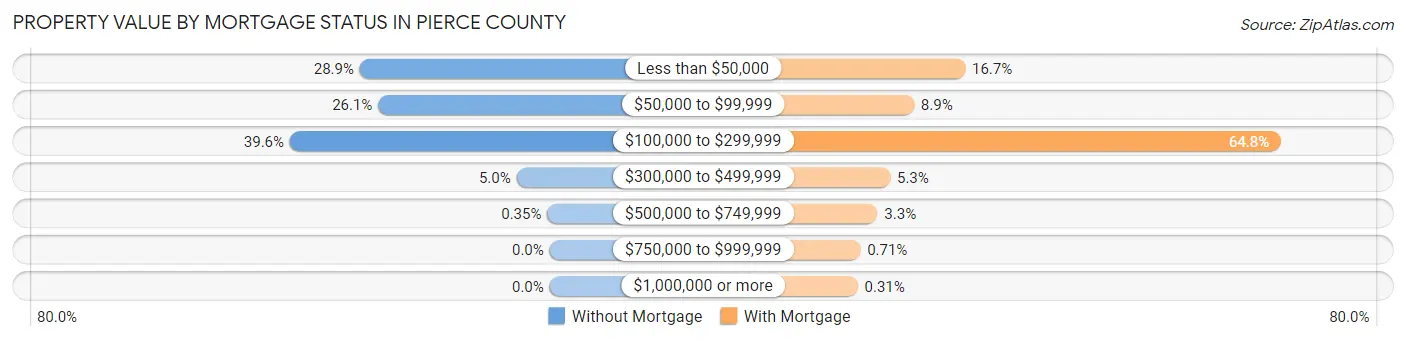
| Property Value | Without Mortgage | With Mortgage |
| Less than $50,000 | 920 (28.9%) | 426 (16.7%) |
| $50,000 to $99,999 | 831 (26.1%) | 227 (8.9%) |
| $100,000 to $299,999 | 1,259 (39.6%) | 1,655 (64.8%) |
| $300,000 to $499,999 | 160 (5.0%) | 134 (5.2%) |
| $500,000 to $749,999 | 11 (0.4%) | 85 (3.3%) |
| $750,000 to $999,999 | 0 (0.0%) | 18 (0.7%) |
| $1,000,000 or more | 0 (0.0%) | 8 (0.3%) |
| Total | 3,181 (100.0%) | 2,553 (100.0%) |
Household Income by Mortgage Status in Pierce County
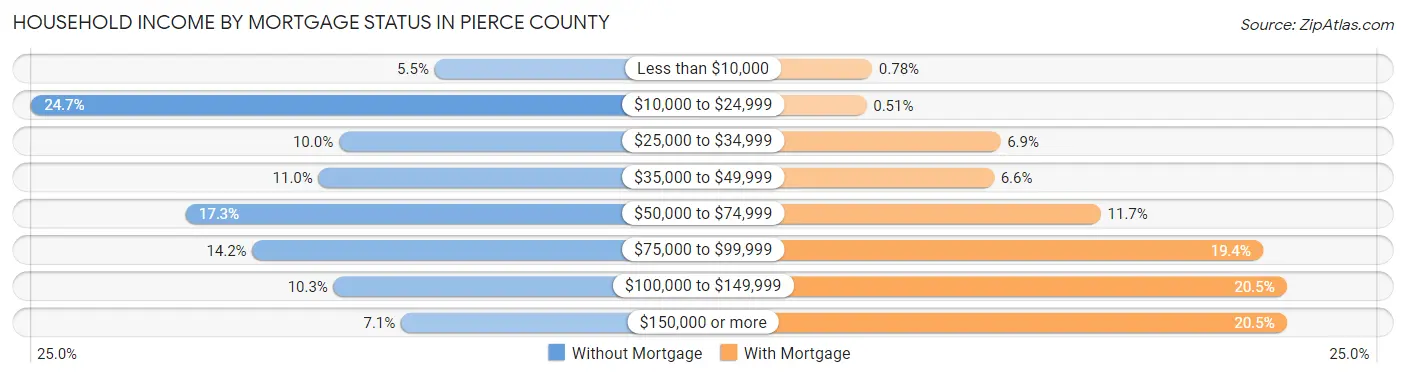
| Household Income | Without Mortgage | With Mortgage |
| Less than $10,000 | 174 (5.5%) | 20 (0.8%) |
| $10,000 to $24,999 | 785 (24.7%) | 13 (0.5%) |
| $25,000 to $34,999 | 319 (10.0%) | 176 (6.9%) |
| $35,000 to $49,999 | 350 (11.0%) | 168 (6.6%) |
| $50,000 to $74,999 | 551 (17.3%) | 298 (11.7%) |
| $75,000 to $99,999 | 450 (14.1%) | 495 (19.4%) |
| $100,000 to $149,999 | 327 (10.3%) | 524 (20.5%) |
| $150,000 or more | 225 (7.1%) | 524 (20.5%) |
| Total | 3,181 (100.0%) | 2,553 (100.0%) |
Property Value to Household Income Ratio in Pierce County

| Value-to-Income Ratio | Without Mortgage | With Mortgage |
| Less than 2.0x | 1,573 (49.4%) | 77,813 (3,047.9%) |
| 2.0x to 2.9x | 472 (14.8%) | 1,323 (51.8%) |
| 3.0x to 3.9x | 304 (9.6%) | 588 (23.0%) |
| 4.0x or more | 780 (24.5%) | 233 (9.1%) |
| Total | 3,181 (100.0%) | 2,553 (100.0%) |
Real Estate Taxes by Mortgage Status in Pierce County

| Property Taxes | Without Mortgage | With Mortgage |
| Less than $800 | 1,529 (48.1%) | 0 (0.0%) |
| $800 to $1,499 | 593 (18.6%) | 491 (19.2%) |
| $800 to $1,499 | 830 (26.1%) | 963 (37.7%) |
| Total | 3,181 (100.0%) | 2,553 (100.0%) |
Health & Disability in Pierce County
Health Insurance Coverage by Age in Pierce County
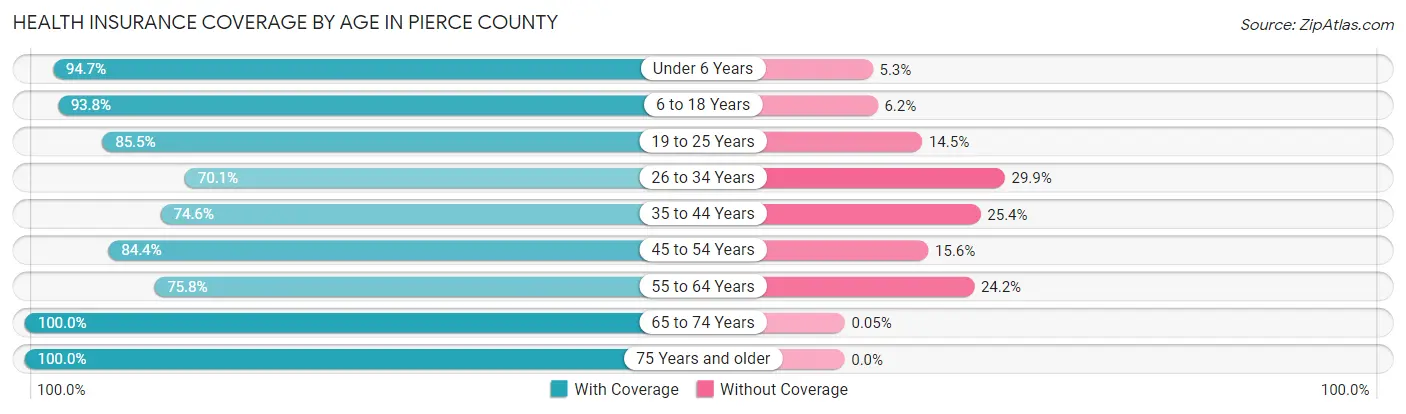
| Age Bracket | With Coverage | Without Coverage |
| Under 6 Years | 1,403 (94.7%) | 78 (5.3%) |
| 6 to 18 Years | 3,475 (93.8%) | 229 (6.2%) |
| 19 to 25 Years | 1,257 (85.5%) | 213 (14.5%) |
| 26 to 34 Years | 1,440 (70.1%) | 614 (29.9%) |
| 35 to 44 Years | 1,747 (74.6%) | 594 (25.4%) |
| 45 to 54 Years | 2,369 (84.4%) | 439 (15.6%) |
| 55 to 64 Years | 1,831 (75.8%) | 584 (24.2%) |
| 65 to 74 Years | 1,929 (100.0%) | 1 (0.1%) |
| 75 Years and older | 1,419 (100.0%) | 0 (0.0%) |
| Total | 16,870 (86.0%) | 2,752 (14.0%) |
Health Insurance Coverage by Citizenship Status in Pierce County
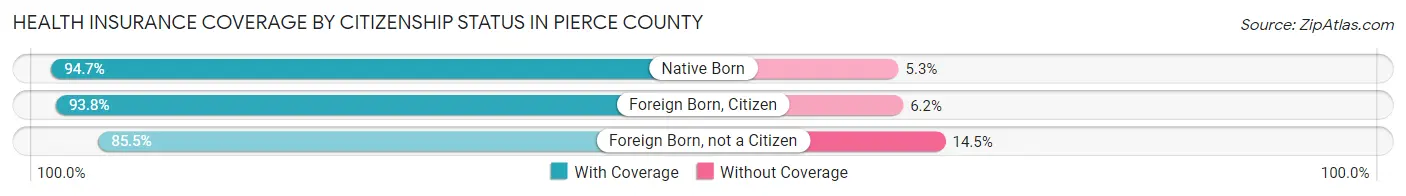
| Citizenship Status | With Coverage | Without Coverage |
| Native Born | 1,403 (94.7%) | 78 (5.3%) |
| Foreign Born, Citizen | 3,475 (93.8%) | 229 (6.2%) |
| Foreign Born, not a Citizen | 1,257 (85.5%) | 213 (14.5%) |
Health Insurance Coverage by Household Income in Pierce County

| Household Income | With Coverage | Without Coverage |
| Under $25,000 | 2,405 (78.5%) | 657 (21.5%) |
| $25,000 to $49,999 | 3,404 (82.6%) | 718 (17.4%) |
| $50,000 to $74,999 | 2,962 (84.2%) | 554 (15.8%) |
| $75,000 to $99,999 | 3,485 (88.4%) | 459 (11.6%) |
| $100,000 and over | 4,587 (92.8%) | 355 (7.2%) |
Public vs Private Health Insurance Coverage by Age in Pierce County
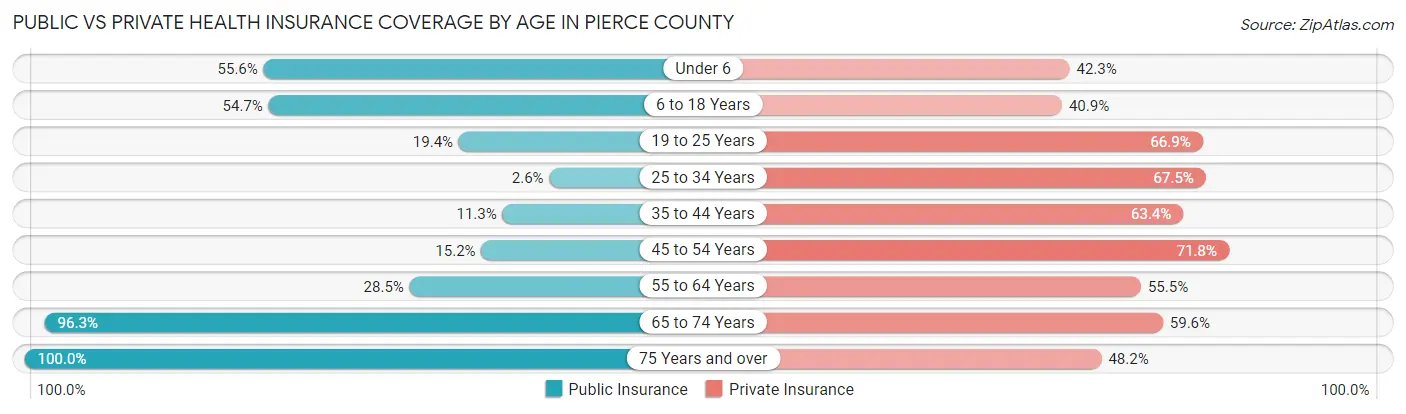
| Age Bracket | Public Insurance | Private Insurance |
| Under 6 | 824 (55.6%) | 626 (42.3%) |
| 6 to 18 Years | 2,026 (54.7%) | 1,514 (40.9%) |
| 19 to 25 Years | 285 (19.4%) | 984 (66.9%) |
| 25 to 34 Years | 53 (2.6%) | 1,387 (67.5%) |
| 35 to 44 Years | 264 (11.3%) | 1,483 (63.3%) |
| 45 to 54 Years | 427 (15.2%) | 2,017 (71.8%) |
| 55 to 64 Years | 689 (28.5%) | 1,341 (55.5%) |
| 65 to 74 Years | 1,858 (96.3%) | 1,150 (59.6%) |
| 75 Years and over | 1,419 (100.0%) | 684 (48.2%) |
| Total | 7,845 (40.0%) | 11,186 (57.0%) |
Disability Status by Sex by Age in Pierce County
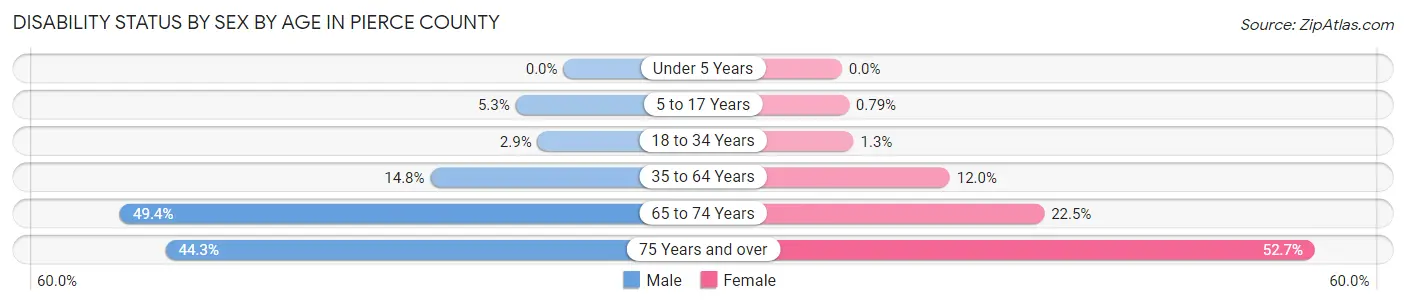
| Age Bracket | Male | Female |
| Under 5 Years | 0 (0.0%) | 0 (0.0%) |
| 5 to 17 Years | 105 (5.3%) | 13 (0.8%) |
| 18 to 34 Years | 53 (2.9%) | 26 (1.3%) |
| 35 to 64 Years | 564 (14.8%) | 452 (12.0%) |
| 65 to 74 Years | 462 (49.4%) | 224 (22.5%) |
| 75 Years and over | 272 (44.3%) | 424 (52.7%) |
Disability Class by Sex by Age in Pierce County
Disability Class: Hearing Difficulty
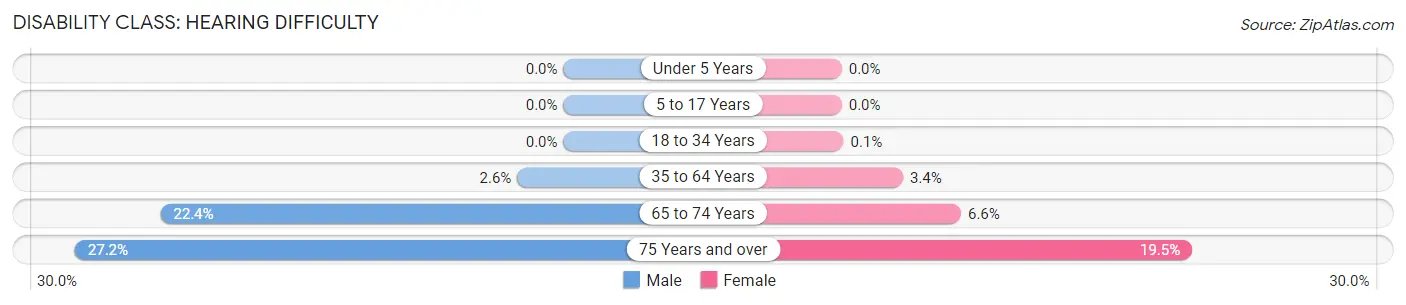
| Age Bracket | Male | Female |
| Under 5 Years | 0 (0.0%) | 0 (0.0%) |
| 5 to 17 Years | 0 (0.0%) | 0 (0.0%) |
| 18 to 34 Years | 0 (0.0%) | 2 (0.1%) |
| 35 to 64 Years | 98 (2.6%) | 128 (3.4%) |
| 65 to 74 Years | 210 (22.4%) | 66 (6.6%) |
| 75 Years and over | 167 (27.2%) | 157 (19.5%) |
Disability Class: Vision Difficulty
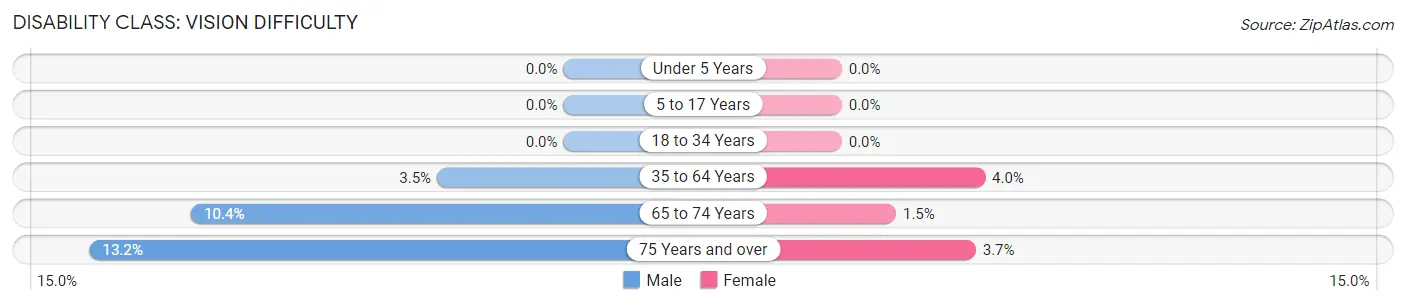
| Age Bracket | Male | Female |
| Under 5 Years | 0 (0.0%) | 0 (0.0%) |
| 5 to 17 Years | 0 (0.0%) | 0 (0.0%) |
| 18 to 34 Years | 0 (0.0%) | 0 (0.0%) |
| 35 to 64 Years | 134 (3.5%) | 150 (4.0%) |
| 65 to 74 Years | 97 (10.4%) | 15 (1.5%) |
| 75 Years and over | 81 (13.2%) | 30 (3.7%) |
Disability Class: Cognitive Difficulty
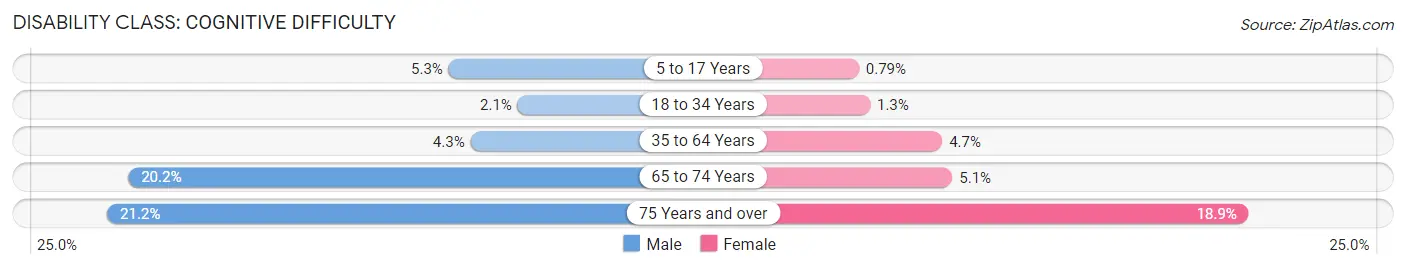
| Age Bracket | Male | Female |
| 5 to 17 Years | 105 (5.3%) | 13 (0.8%) |
| 18 to 34 Years | 39 (2.1%) | 26 (1.3%) |
| 35 to 64 Years | 164 (4.3%) | 175 (4.7%) |
| 65 to 74 Years | 189 (20.2%) | 51 (5.1%) |
| 75 Years and over | 130 (21.2%) | 152 (18.9%) |
Disability Class: Ambulatory Difficulty

| Age Bracket | Male | Female |
| 5 to 17 Years | 0 (0.0%) | 0 (0.0%) |
| 18 to 34 Years | 2 (0.1%) | 1 (0.1%) |
| 35 to 64 Years | 298 (7.8%) | 258 (6.9%) |
| 65 to 74 Years | 259 (27.7%) | 171 (17.2%) |
| 75 Years and over | 94 (15.3%) | 286 (35.5%) |
Disability Class: Self-Care Difficulty
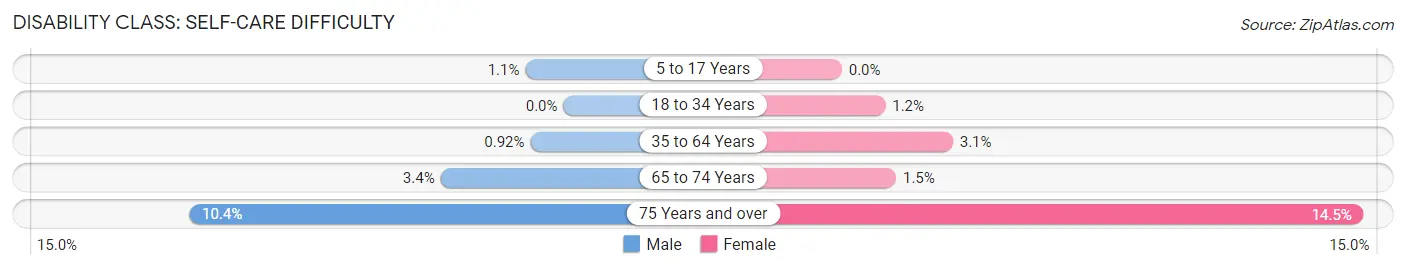
| Age Bracket | Male | Female |
| 5 to 17 Years | 21 (1.1%) | 0 (0.0%) |
| 18 to 34 Years | 0 (0.0%) | 24 (1.2%) |
| 35 to 64 Years | 35 (0.9%) | 116 (3.1%) |
| 65 to 74 Years | 32 (3.4%) | 15 (1.5%) |
| 75 Years and over | 64 (10.4%) | 117 (14.5%) |
Technology Access in Pierce County
Computing Device Access in Pierce County
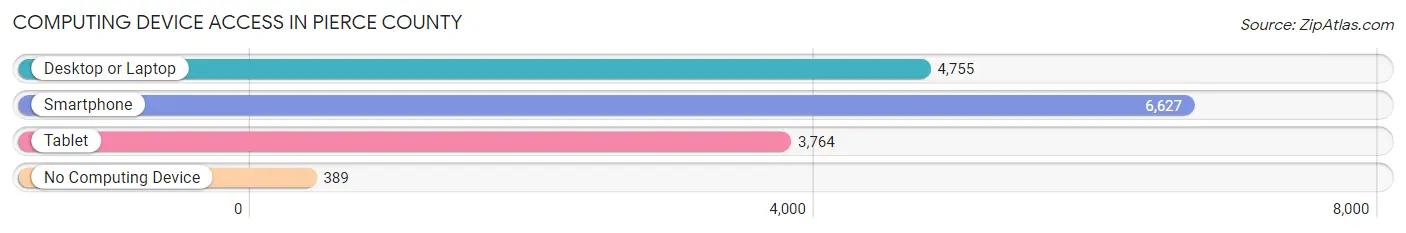
| Device Type | # Households | % Households |
| Desktop or Laptop | 4,755 | 63.7% |
| Smartphone | 6,627 | 88.8% |
| Tablet | 3,764 | 50.5% |
| No Computing Device | 389 | 5.2% |
| Total | 7,460 | 100.0% |
Internet Access in Pierce County
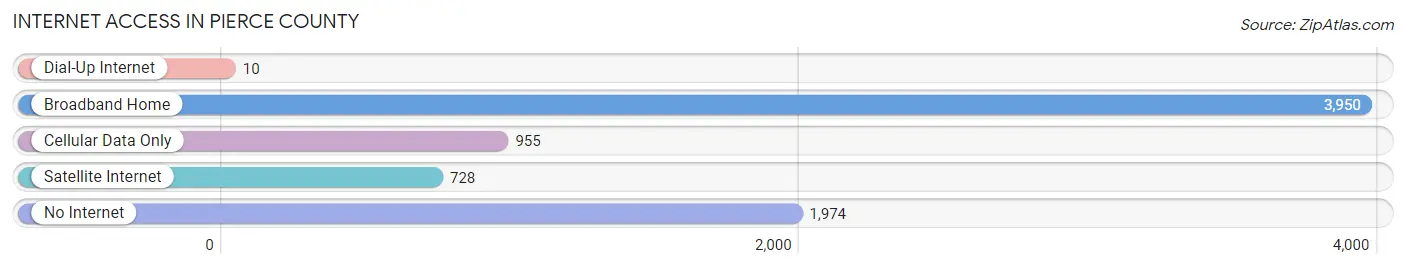
| Internet Type | # Households | % Households |
| Dial-Up Internet | 10 | 0.1% |
| Broadband Home | 3,950 | 52.9% |
| Cellular Data Only | 955 | 12.8% |
| Satellite Internet | 728 | 9.8% |
| No Internet | 1,974 | 26.5% |
| Total | 7,460 | 100.0% |
Pierce County Summary
Pierce County is located in the southeastern part of the U.S. state of Georgia. It is bordered by Appling County to the north, Ware County to the east, Brantley County to the south, and Bacon County to the west. The county seat is Blackshear. The county was created in 1857 from parts of Appling and Ware counties and was named for Franklin Pierce, the 14th President of the United States.
Geography
Pierce County covers an area of 545 square miles, of which 543 square miles is land and 2 square miles (0.4%) is water. The county is located in the Altamaha River basin and is drained by the Satilla River. The Satilla River forms the northern border of the county and the Altamaha River forms the eastern border. The county is located in the Coastal Plain region of Georgia and is mostly flat with some rolling hills. The highest point in the county is located at an elevation of 200 feet.
The county is home to several state parks and wildlife management areas, including the Altamaha Wildlife Management Area, the Satilla Wildlife Management Area, and the Stephen C. Foster State Park.
Demographics
As of the 2010 United States Census, there were 19,133 people, 7,541 households, and 5,541 families living in the county. The population density was 35.2 people per square mile. The racial makeup of the county was 73.2% White, 22.3% Black or African American, 0.3% Native American, 0.5% Asian, 0.1% Pacific Islander, 2.3% from other races, and 1.3% from two or more races. 4.3% of the population were Hispanic or Latino of any race.
The median income for a household in the county was $35,945 and the median income for a family was $43,945. The per capita income for the county was $17,845. About 17.2% of families and 21.2% of the population were below the poverty line, including 28.2% of those under age 18 and 17.2% of those age 65 or over.
Economy
Pierce County is primarily a rural county with a largely agricultural economy. The county is home to several large farms, including the Pierce County Farm Bureau, which is the largest farm in the county. The county is also home to several small businesses, including a number of restaurants, retail stores, and service businesses.
The county is home to several industries, including a paper mill, a lumber mill, and a poultry processing plant. The county is also home to a number of manufacturing companies, including a furniture manufacturer, a plastics manufacturer, and a metal fabrication company.
The county is served by the Blackshear-Pierce County Airport, which is located in the city of Blackshear. The airport is used primarily for general aviation and is served by a number of regional airlines.
Conclusion
Pierce County is a rural county located in the southeastern part of the state of Georgia. The county is home to several state parks and wildlife management areas, and is primarily an agricultural county with a largely agricultural economy. The county is also home to several small businesses, industries, and manufacturing companies. The county is served by the Blackshear-Pierce County Airport, which is used primarily for general aviation.
Common Questions
What is the Total Population of Pierce County?
Total Population of Pierce County is 19,822.
What is the Total Male Population of Pierce County?
Total Male Population of Pierce County is 9,942.
What is the Total Female Population of Pierce County?
Total Female Population of Pierce County is 9,880.
What is the Ratio of Males per 100 Females in Pierce County?
There are 100.63 Males per 100 Females in Pierce County.
What is the Ratio of Females per 100 Males in Pierce County?
There are 99.38 Females per 100 Males in Pierce County.
What is the Median Population Age in Pierce County?
Median Population Age in Pierce County is 39.8 Years.
What is the Average Family Size in Pierce County
Average Family Size in Pierce County is 3.2 People.
What is the Average Household Size in Pierce County
Average Household Size in Pierce County is 2.6 People.
What is Per Capita Income in Pierce County?
Per Capita income in Pierce County is $26,392.
What is the Median Family Income in Pierce County?
Median Family Income in Pierce County is $65,653.
What is the Median Household income in Pierce County?
Median Household Income in Pierce County is $54,861.
What is Income or Wage Gap in Pierce County?
Income or Wage Gap in Pierce County is 27.7%.
Women in Pierce County earn 72.3 cents for every dollar earned by a man.
What is Family Income Deficit in Pierce County?
Family Income Deficit in Pierce County is $7,251.
Families that are below poverty line in Pierce County earn $7,251 less on average than the poverty threshold level.
What is Inequality or Gini Index in Pierce County?
Inequality or Gini Index in Pierce County is 0.44.
How Large is the Labor Force in Pierce County?
There are 8,717 People in the Labor Forcein in Pierce County.
What is the Percentage of People in the Labor Force in Pierce County?
56.5% of People are in the Labor Force in Pierce County.
What is the Unemployment Rate in Pierce County?
Unemployment Rate in Pierce County is 2.3%.