Monroe County, GA
Monroe County Overview
28,287
TOTAL POPULATION
14,308
MALE POPULATION
13,979
FEMALE POPULATION
102.35
MALES / 100 FEMALES
97.70
FEMALES / 100 MALES
42.6
MEDIAN AGE
3.2
AVG FAMILY SIZE
2.6
AVG HOUSEHOLD SIZE
$40,063
PER CAPITA INCOME
$92,679
AVG FAMILY INCOME
$74,867
AVG HOUSEHOLD INCOME
34.0%
WAGE / INCOME GAP [ % ]
66.0¢/ $1
WAGE / INCOME GAP [ $ ]
$9,520
FAMILY INCOME DEFICIT
0.48
INEQUALITY / GINI INDEX
13,689
LABOR FORCE [ PEOPLE ]
59.0%
PERCENT IN LABOR FORCE
3.8%
UNEMPLOYMENT RATE
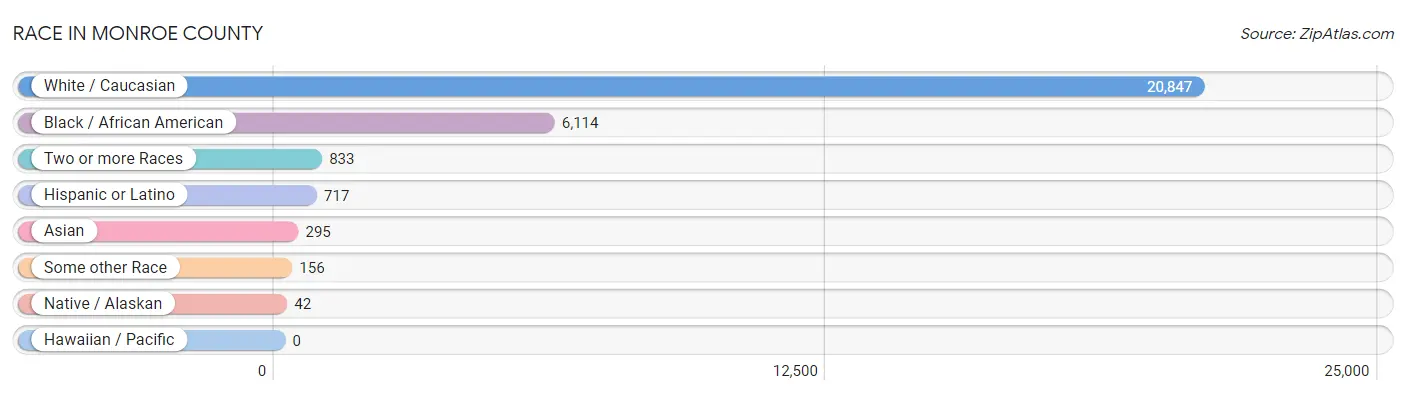
Race in Monroe County
The most populous races in Monroe County are White / Caucasian (20,847 | 73.7%), Black / African American (6,114 | 21.6%), and Two or more Races (833 | 2.9%).
| Race | # Population | % Population |
| Asian | 295 | 1.0% |
| Black / African American | 6,114 | 21.6% |
| Hawaiian / Pacific | 0 | 0.0% |
| Hispanic or Latino | 717 | 2.5% |
| Native / Alaskan | 42 | 0.2% |
| White / Caucasian | 20,847 | 73.7% |
| Two or more Races | 833 | 2.9% |
| Some other Race | 156 | 0.5% |
| Total | 28,287 | 100.0% |
Ancestry in Monroe County
The most populous ancestries reported in Monroe County are American (3,320 | 11.7%), English (3,300 | 11.7%), Irish (1,921 | 6.8%), German (1,583 | 5.6%), and Scotch-Irish (803 | 2.8%), together accounting for 38.6% of all Monroe County residents.

| Ancestry | # Population | % Population |
| African | 62 | 0.2% |
| American | 3,320 | 11.7% |
| Bhutanese | 1 | 0.0% |
| Blackfeet | 21 | 0.1% |
| British | 83 | 0.3% |
| Burmese | 1 | 0.0% |
| Canadian | 8 | 0.0% |
| Central American | 126 | 0.4% |
| Cherokee | 65 | 0.2% |
| Comanche | 13 | 0.1% |
| Cuban | 39 | 0.1% |
| Dutch | 189 | 0.7% |
| Eastern European | 25 | 0.1% |
| English | 3,300 | 11.7% |
| European | 340 | 1.2% |
| French | 205 | 0.7% |
| German | 1,583 | 5.6% |
| German Russian | 31 | 0.1% |
| Guatemalan | 50 | 0.2% |
| Haitian | 263 | 0.9% |
| Honduran | 72 | 0.3% |
| Indian (Asian) | 219 | 0.8% |
| Irish | 1,921 | 6.8% |
| Italian | 240 | 0.9% |
| Jamaican | 5 | 0.0% |
| Korean | 52 | 0.2% |
| Mexican | 453 | 1.6% |
| Mexican American Indian | 15 | 0.1% |
| Northern European | 35 | 0.1% |
| Norwegian | 25 | 0.1% |
| Polish | 105 | 0.4% |
| Puerto Rican | 71 | 0.3% |
| Russian | 18 | 0.1% |
| Salvadoran | 4 | 0.0% |
| Scandinavian | 9 | 0.0% |
| Scotch-Irish | 803 | 2.8% |
| Scottish | 618 | 2.2% |
| Seminole | 19 | 0.1% |
| Sioux | 21 | 0.1% |
| Spanish | 8 | 0.0% |
| Subsaharan African | 62 | 0.2% |
| Swedish | 65 | 0.2% |
| Thai | 9 | 0.0% |
| Turkish | 30 | 0.1% |
| Welsh | 82 | 0.3% | View All 45 Rows |
Immigrants in Monroe County
The most numerous immigrant groups reported in Monroe County came from Asia (160 | 0.6%), Latin America (131 | 0.5%), Eastern Asia (130 | 0.5%), China (129 | 0.5%), and Central America (82 | 0.3%), together accounting for 2.2% of all Monroe County residents.

| Immigration Origin | # Population | % Population |
| Africa | 44 | 0.2% |
| Asia | 160 | 0.6% |
| Canada | 40 | 0.1% |
| Caribbean | 49 | 0.2% |
| Central America | 82 | 0.3% |
| China | 129 | 0.5% |
| Cuba | 30 | 0.1% |
| Dominican Republic | 6 | 0.0% |
| Eastern Africa | 19 | 0.1% |
| Eastern Asia | 130 | 0.5% |
| Europe | 56 | 0.2% |
| Germany | 7 | 0.0% |
| Haiti | 13 | 0.1% |
| Honduras | 29 | 0.1% |
| Ireland | 4 | 0.0% |
| Italy | 10 | 0.0% |
| Kenya | 19 | 0.1% |
| Korea | 1 | 0.0% |
| Latin America | 131 | 0.5% |
| Mexico | 53 | 0.2% |
| Nigeria | 25 | 0.1% |
| Northern Europe | 39 | 0.1% |
| Pakistan | 30 | 0.1% |
| South Central Asia | 30 | 0.1% |
| Southern Europe | 10 | 0.0% |
| Western Africa | 25 | 0.1% |
| Western Europe | 7 | 0.0% | View All 27 Rows |
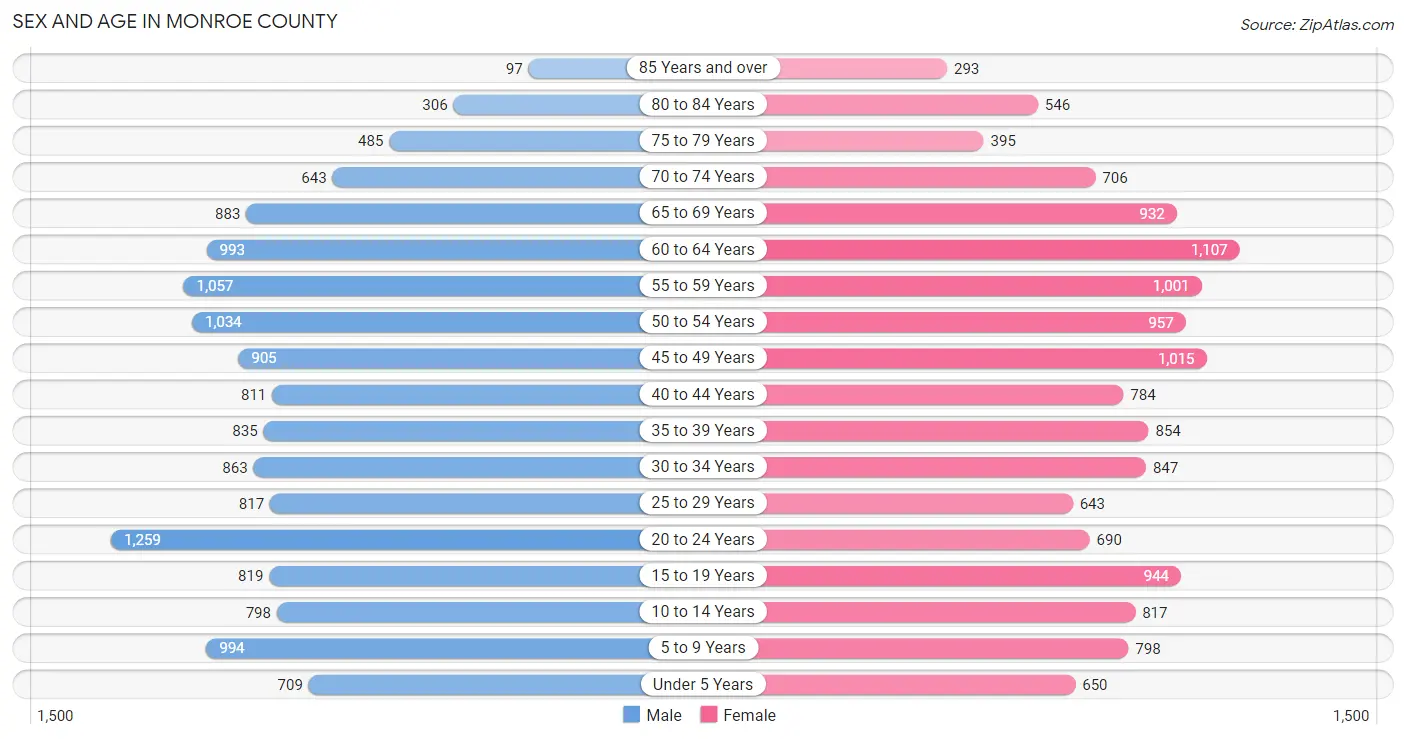
Sex and Age in Monroe County
Sex and Age in Monroe County
The most populous age groups in Monroe County are 20 to 24 Years (1,259 | 8.8%) for men and 60 to 64 Years (1,107 | 7.9%) for women.
| Age Bracket | Male | Female |
| Under 5 Years | 709 (5.0%) | 650 (4.6%) |
| 5 to 9 Years | 994 (7.0%) | 798 (5.7%) |
| 10 to 14 Years | 798 (5.6%) | 817 (5.8%) |
| 15 to 19 Years | 819 (5.7%) | 944 (6.8%) |
| 20 to 24 Years | 1,259 (8.8%) | 690 (4.9%) |
| 25 to 29 Years | 817 (5.7%) | 643 (4.6%) |
| 30 to 34 Years | 863 (6.0%) | 847 (6.1%) |
| 35 to 39 Years | 835 (5.8%) | 854 (6.1%) |
| 40 to 44 Years | 811 (5.7%) | 784 (5.6%) |
| 45 to 49 Years | 905 (6.3%) | 1,015 (7.3%) |
| 50 to 54 Years | 1,034 (7.2%) | 957 (6.9%) |
| 55 to 59 Years | 1,057 (7.4%) | 1,001 (7.2%) |
| 60 to 64 Years | 993 (6.9%) | 1,107 (7.9%) |
| 65 to 69 Years | 883 (6.2%) | 932 (6.7%) |
| 70 to 74 Years | 643 (4.5%) | 706 (5.1%) |
| 75 to 79 Years | 485 (3.4%) | 395 (2.8%) |
| 80 to 84 Years | 306 (2.1%) | 546 (3.9%) |
| 85 Years and over | 97 (0.7%) | 293 (2.1%) |
| Total | 14,308 (100.0%) | 13,979 (100.0%) |
Families and Households in Monroe County
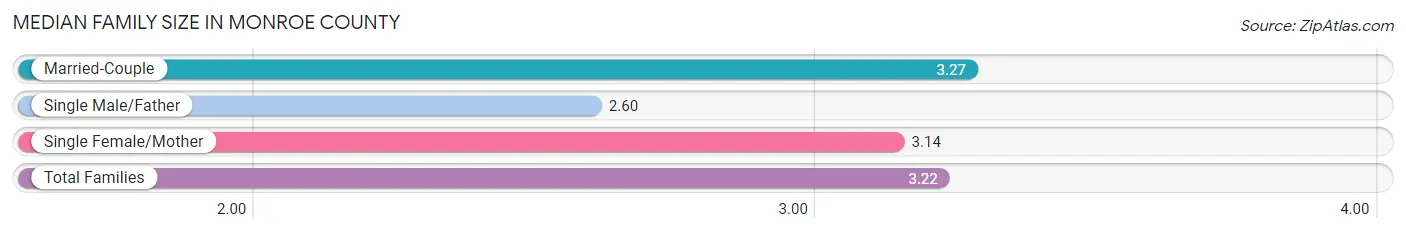
Median Family Size in Monroe County
The median family size in Monroe County is 3.22 persons per family, with married-couple families (5,681 | 79.9%) accounting for the largest median family size of 3.27 persons per family. On the other hand, single male/father families (391 | 5.5%) represent the smallest median family size with 2.60 persons per family.
| Family Type | # Families | Family Size |
| Married-Couple | 5,681 (79.9%) | 3.27 |
| Single Male/Father | 391 (5.5%) | 2.60 |
| Single Female/Mother | 1,034 (14.5%) | 3.14 |
| Total Families | 7,106 (100.0%) | 3.22 |
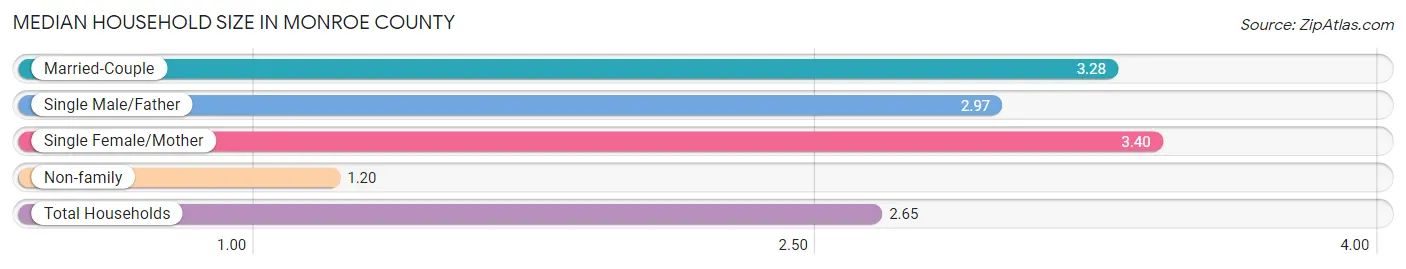
Median Household Size in Monroe County
The median household size in Monroe County is 2.65 persons per household, with single female/mother households (1,034 | 10.1%) accounting for the largest median household size of 3.4 persons per household. non-family households (3,142 | 30.7%) represent the smallest median household size with 1.20 persons per household.
| Household Type | # Households | Household Size |
| Married-Couple | 5,681 (55.4%) | 3.28 |
| Single Male/Father | 391 (3.8%) | 2.97 |
| Single Female/Mother | 1,034 (10.1%) | 3.40 |
| Non-family | 3,142 (30.7%) | 1.20 |
| Total Households | 10,248 (100.0%) | 2.65 |
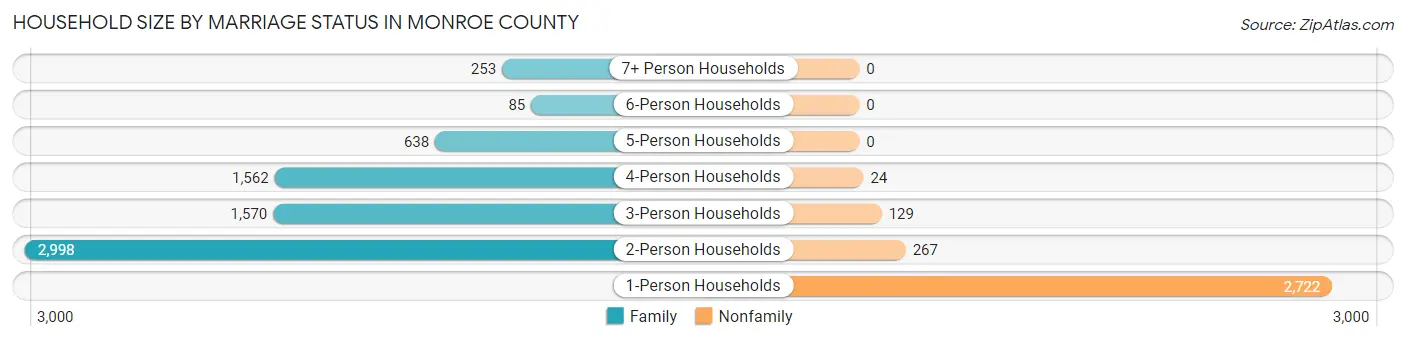
Household Size by Marriage Status in Monroe County
Out of a total of 10,248 households in Monroe County, 7,106 (69.3%) are family households, while 3,142 (30.7%) are nonfamily households. The most numerous type of family households are 2-person households, comprising 2,998, and the most common type of nonfamily households are 1-person households, comprising 2,722.
| Household Size | Family Households | Nonfamily Households |
| 1-Person Households | - | 2,722 (26.6%) |
| 2-Person Households | 2,998 (29.2%) | 267 (2.6%) |
| 3-Person Households | 1,570 (15.3%) | 129 (1.3%) |
| 4-Person Households | 1,562 (15.2%) | 24 (0.2%) |
| 5-Person Households | 638 (6.2%) | 0 (0.0%) |
| 6-Person Households | 85 (0.8%) | 0 (0.0%) |
| 7+ Person Households | 253 (2.5%) | 0 (0.0%) |
| Total | 7,106 (69.3%) | 3,142 (30.7%) |
Female Fertility in Monroe County
Fertility by Age in Monroe County
Average fertility rate in Monroe County is 45.0 births per 1,000 women. Women in the age bracket of 20 to 34 years have the highest fertility rate with 103.0 births per 1,000 women. Women in the age bracket of 20 to 34 years acount for 85.6% of all women with births.

| Age Bracket | Women with Births | Births / 1,000 Women |
| 15 to 19 years | 0 (0.0%) | 0.0 |
| 20 to 34 years | 225 (85.6%) | 103.0 |
| 35 to 50 years | 38 (14.4%) | 14.0 |
| Total | 263 (100.0%) | 45.0 |
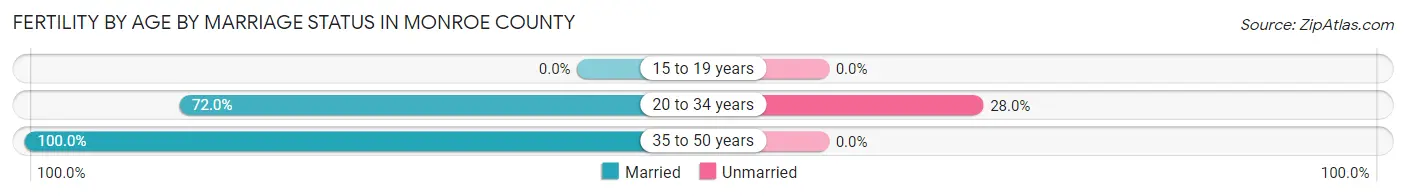
Fertility by Age by Marriage Status in Monroe County
76.0% of women with births (263) in Monroe County are married. The highest percentage of unmarried women with births falls into 20 to 34 years age bracket with 28.0% of them unmarried at the time of birth, while the lowest percentage of unmarried women with births belong to 35 to 50 years age bracket with 0.0% of them unmarried.
| Age Bracket | Married | Unmarried |
| 15 to 19 years | 0 (0.0%) | 0 (0.0%) |
| 20 to 34 years | 162 (72.0%) | 63 (28.0%) |
| 35 to 50 years | 38 (100.0%) | 0 (0.0%) |
| Total | 200 (76.0%) | 63 (23.9%) |
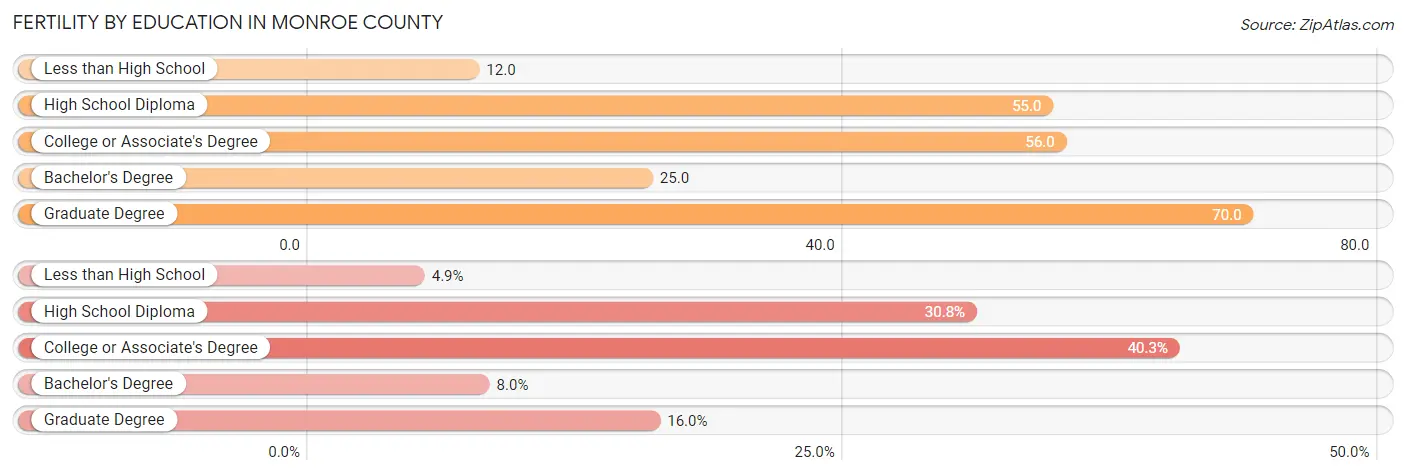
Fertility by Education in Monroe County
Average fertility rate in Monroe County is 45.0 births per 1,000 women. Women with the education attainment of graduate degree have the highest fertility rate of 70.0 births per 1,000 women, while women with the education attainment of less than high school have the lowest fertility at 12.0 births per 1,000 women. Women with the education attainment of college or associate's degree represent 40.3% of all women with births.
| Educational Attainment | Women with Births | Births / 1,000 Women |
| Less than High School | 13 (4.9%) | 12.0 |
| High School Diploma | 81 (30.8%) | 55.0 |
| College or Associate's Degree | 106 (40.3%) | 56.0 |
| Bachelor's Degree | 21 (8.0%) | 25.0 |
| Graduate Degree | 42 (16.0%) | 70.0 |
| Total | 263 (100.0%) | 45.0 |
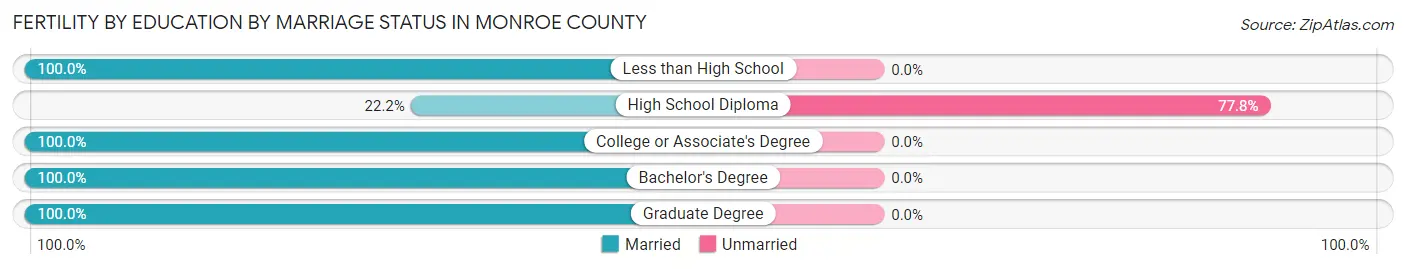
Fertility by Education by Marriage Status in Monroe County
23.9% of women with births in Monroe County are unmarried. Women with the educational attainment of less than high school are most likely to be married with 100.0% of them married at childbirth, while women with the educational attainment of high school diploma are least likely to be married with 77.8% of them unmarried at childbirth.
| Educational Attainment | Married | Unmarried |
| Less than High School | 13 (100.0%) | 0 (0.0%) |
| High School Diploma | 18 (22.2%) | 63 (77.8%) |
| College or Associate's Degree | 106 (100.0%) | 0 (0.0%) |
| Bachelor's Degree | 21 (100.0%) | 0 (0.0%) |
| Graduate Degree | 42 (100.0%) | 0 (0.0%) |
| Total | 200 (76.0%) | 63 (23.9%) |
Income in Monroe County
Income Overview in Monroe County
Per Capita Income in Monroe County is $40,063, while median incomes of families and households are $92,679 and $74,867 respectively.
| Characteristic | Number | Measure |
| Per Capita Income | 28,287 | $40,063 |
| Median Family Income | 7,106 | $92,679 |
| Mean Family Income | 7,106 | $124,653 |
| Median Household Income | 10,248 | $74,867 |
| Mean Household Income | 10,248 | $105,763 |
| Income Deficit | 7,106 | $9,520 |
| Wage / Income Gap (%) | 28,287 | 33.99% |
| Wage / Income Gap ($) | 28,287 | 66.01¢ per $1 |
| Gini / Inequality Index | 28,287 | 0.48 |
Earnings by Sex in Monroe County
Average Earnings in Monroe County are $39,031, $50,345 for men and $33,232 for women, a difference of 34.0%.
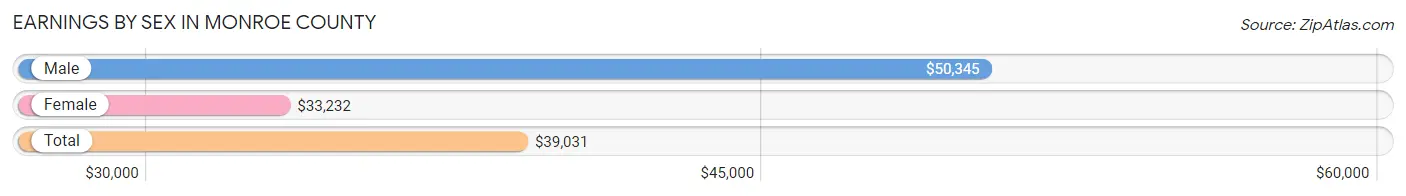
| Sex | Number | Average Earnings |
| Male | 7,685 (52.8%) | $50,345 |
| Female | 6,880 (47.2%) | $33,232 |
| Total | 14,565 (100.0%) | $39,031 |
Earnings by Sex by Income Bracket in Monroe County
The most common earnings brackets in Monroe County are $100,000+ for men (1,558 | 20.3%) and $75,000 to $99,999 for women (641 | 9.3%).

| Income | Male | Female |
| $2,499 or less | 304 (4.0%) | 318 (4.6%) |
| $2,500 to $4,999 | 244 (3.2%) | 324 (4.7%) |
| $5,000 to $7,499 | 195 (2.5%) | 454 (6.6%) |
| $7,500 to $9,999 | 71 (0.9%) | 189 (2.8%) |
| $10,000 to $12,499 | 604 (7.9%) | 364 (5.3%) |
| $12,500 to $14,999 | 190 (2.5%) | 215 (3.1%) |
| $15,000 to $17,499 | 299 (3.9%) | 96 (1.4%) |
| $17,500 to $19,999 | 171 (2.2%) | 140 (2.0%) |
| $20,000 to $22,499 | 45 (0.6%) | 109 (1.6%) |
| $22,500 to $24,999 | 126 (1.6%) | 304 (4.4%) |
| $25,000 to $29,999 | 324 (4.2%) | 487 (7.1%) |
| $30,000 to $34,999 | 440 (5.7%) | 614 (8.9%) |
| $35,000 to $39,999 | 258 (3.4%) | 527 (7.7%) |
| $40,000 to $44,999 | 294 (3.8%) | 504 (7.3%) |
| $45,000 to $49,999 | 252 (3.3%) | 233 (3.4%) |
| $50,000 to $54,999 | 344 (4.5%) | 365 (5.3%) |
| $55,000 to $64,999 | 827 (10.8%) | 364 (5.3%) |
| $65,000 to $74,999 | 407 (5.3%) | 316 (4.6%) |
| $75,000 to $99,999 | 732 (9.5%) | 641 (9.3%) |
| $100,000+ | 1,558 (20.3%) | 316 (4.6%) |
| Total | 7,685 (100.0%) | 6,880 (100.0%) |
Earnings by Sex by Educational Attainment in Monroe County
Average earnings in Monroe County are $57,792 for men and $37,306 for women, a difference of 35.4%. Men with an educational attainment of graduate degree enjoy the highest average annual earnings of $107,778, while those with less than high school education earn the least with $34,800. Women with an educational attainment of graduate degree earn the most with the average annual earnings of $71,696, while those with high school diploma education have the smallest earnings of $28,180.
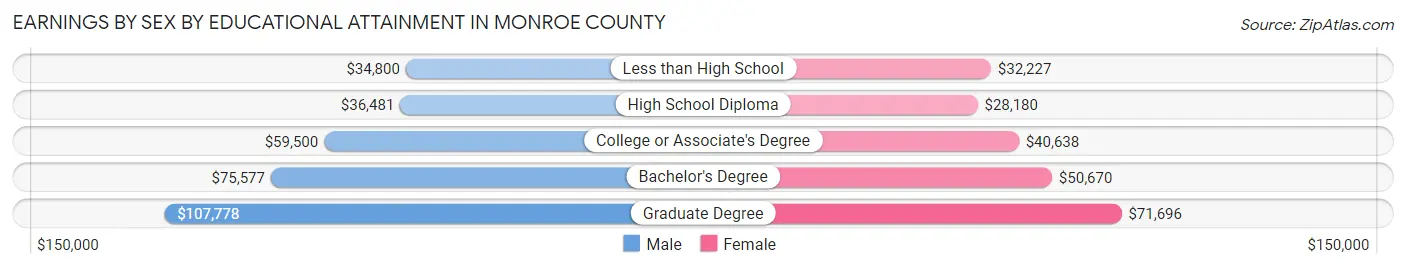
| Educational Attainment | Male Income | Female Income |
| Less than High School | $34,800 | $32,227 |
| High School Diploma | $36,481 | $28,180 |
| College or Associate's Degree | $59,500 | $40,638 |
| Bachelor's Degree | $75,577 | $50,670 |
| Graduate Degree | $107,778 | $71,696 |
| Total | $57,792 | $37,306 |
Family Income in Monroe County
Family Income Brackets in Monroe County
According to the Monroe County family income data, there are 1,705 families falling into the $100,000 to $149,999 income range, which is the most common income bracket and makes up 24.0% of all families. Conversely, the $10,000 to $14,999 income bracket is the least frequent group with only 50 families (0.7%) belonging to this category.
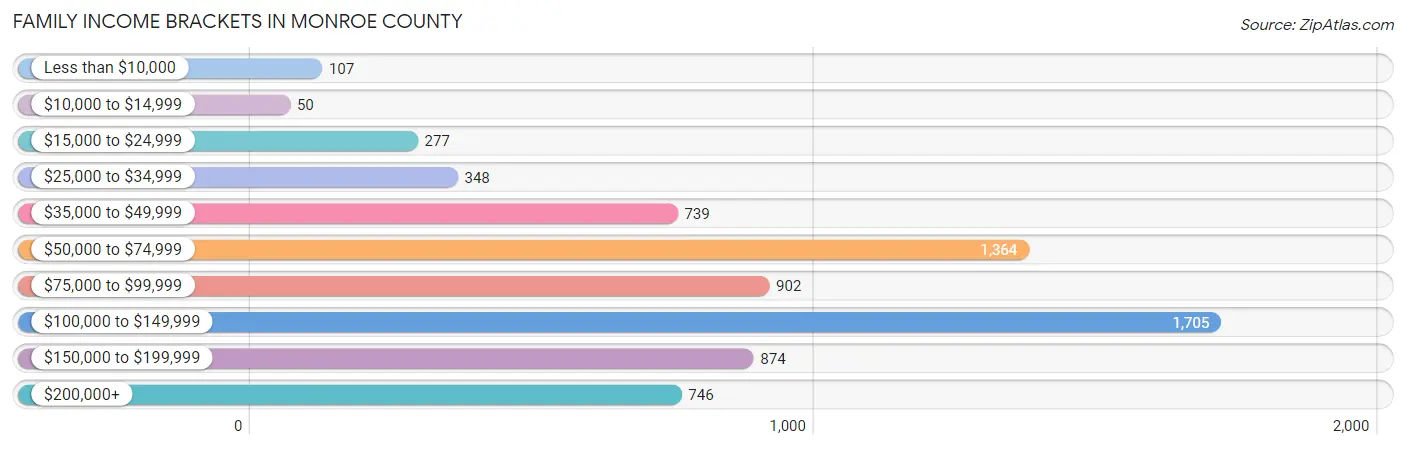
| Income Bracket | # Families | % Families |
| Less than $10,000 | 107 | 1.5% |
| $10,000 to $14,999 | 50 | 0.7% |
| $15,000 to $24,999 | 277 | 3.9% |
| $25,000 to $34,999 | 348 | 4.9% |
| $35,000 to $49,999 | 739 | 10.4% |
| $50,000 to $74,999 | 1,364 | 19.2% |
| $75,000 to $99,999 | 902 | 12.7% |
| $100,000 to $149,999 | 1,705 | 24.0% |
| $150,000 to $199,999 | 874 | 12.3% |
| $200,000+ | 746 | 10.5% |
Family Income by Famaliy Size in Monroe County
7+ person families (216 | 3.0%) account for the highest median family income in Monroe County with $190,474 per family, while 2-person families (3,192 | 44.9%) have the highest median income of $42,832 per family member.
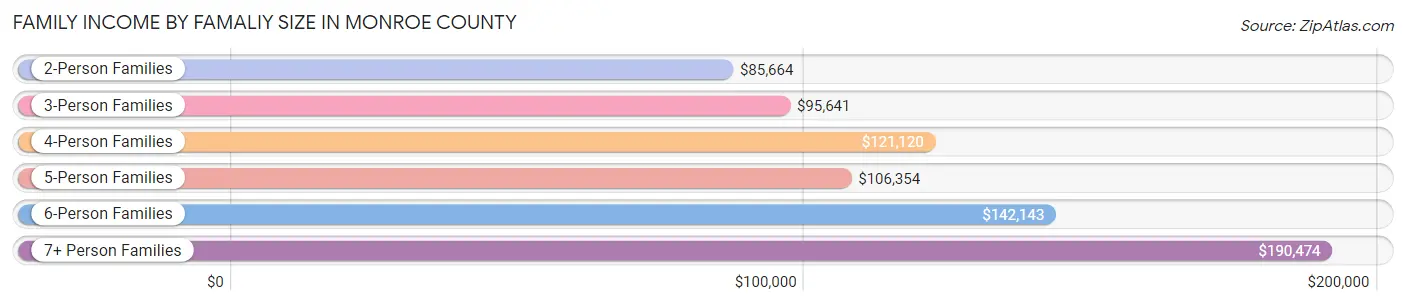
| Income Bracket | # Families | Median Income |
| 2-Person Families | 3,192 (44.9%) | $85,664 |
| 3-Person Families | 1,496 (21.0%) | $95,641 |
| 4-Person Families | 1,449 (20.4%) | $121,120 |
| 5-Person Families | 695 (9.8%) | $106,354 |
| 6-Person Families | 58 (0.8%) | $142,143 |
| 7+ Person Families | 216 (3.0%) | $190,474 |
| Total | 7,106 (100.0%) | $92,679 |
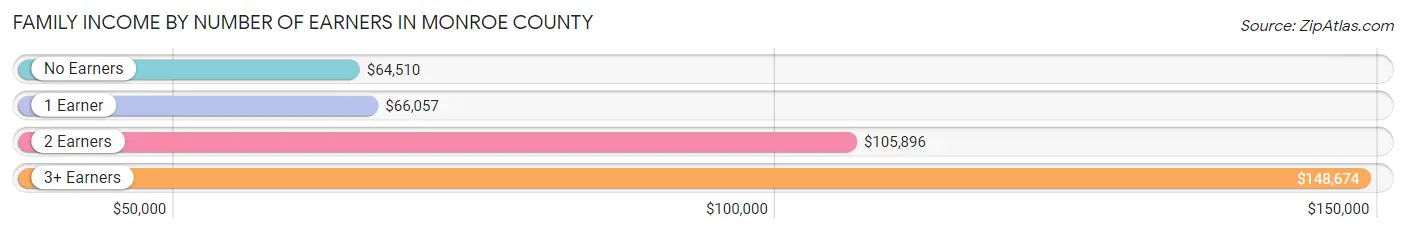
Family Income by Number of Earners in Monroe County
The median family income in Monroe County is $92,679, with families comprising 3+ earners (913) having the highest median family income of $148,674, while families with no earners (1,126) have the lowest median family income of $64,510, accounting for 12.9% and 15.9% of families, respectively.
| Number of Earners | # Families | Median Income |
| No Earners | 1,126 (15.9%) | $64,510 |
| 1 Earner | 1,983 (27.9%) | $66,057 |
| 2 Earners | 3,084 (43.4%) | $105,896 |
| 3+ Earners | 913 (12.9%) | $148,674 |
| Total | 7,106 (100.0%) | $92,679 |
Household Income in Monroe County
Household Income Brackets in Monroe County
With 1,957 households falling in the category, the $50,000 to $74,999 income range is the most frequent in Monroe County, accounting for 19.1% of all households. In contrast, only 236 households (2.3%) fall into the $10,000 to $14,999 income bracket, making it the least populous group.

| Income Bracket | # Households | % Households |
| Less than $10,000 | 502 | 4.9% |
| $10,000 to $14,999 | 236 | 2.3% |
| $15,000 to $24,999 | 851 | 8.3% |
| $25,000 to $34,999 | 512 | 5.0% |
| $35,000 to $49,999 | 1,076 | 10.5% |
| $50,000 to $74,999 | 1,957 | 19.1% |
| $75,000 to $99,999 | 1,353 | 13.2% |
| $100,000 to $149,999 | 1,865 | 18.2% |
| $150,000 to $199,999 | 922 | 9.0% |
| $200,000+ | 974 | 9.5% |
Household Income by Householder Age in Monroe County
The median household income in Monroe County is $74,867, with the highest median household income of $97,109 found in the 45 to 64 years age bracket for the primary householder. A total of 4,397 households (42.9%) fall into this category. Meanwhile, the 15 to 24 years age bracket for the primary householder has the lowest median household income of $37,328, with 196 households (1.9%) in this group.

| Income Bracket | # Households | Median Income |
| 15 to 24 Years | 196 (1.9%) | $37,328 |
| 25 to 44 Years | 2,555 (24.9%) | $78,860 |
| 45 to 64 Years | 4,397 (42.9%) | $97,109 |
| 65+ Years | 3,100 (30.2%) | $64,408 |
| Total | 10,248 (100.0%) | $74,867 |
Poverty in Monroe County
Income Below Poverty by Sex and Age in Monroe County
With 13.8% poverty level for males and 13.7% for females among the residents of Monroe County, 16 and 17 year old males and 6 to 11 year old females are the most vulnerable to poverty, with 126 males (35.4%) and 308 females (29.7%) in their respective age groups living below the poverty level.

| Age Bracket | Male | Female |
| Under 5 Years | 175 (24.7%) | 102 (15.7%) |
| 5 Years | 33 (28.2%) | 39 (27.7%) |
| 6 to 11 Years | 129 (12.5%) | 308 (29.7%) |
| 12 to 14 Years | 7 (1.3%) | 29 (6.7%) |
| 15 Years | 16 (10.1%) | 30 (18.8%) |
| 16 and 17 Years | 126 (35.4%) | 60 (15.5%) |
| 18 to 24 Years | 249 (19.2%) | 119 (10.9%) |
| 25 to 34 Years | 49 (3.3%) | 275 (18.5%) |
| 35 to 44 Years | 488 (34.0%) | 348 (21.2%) |
| 45 to 54 Years | 180 (10.0%) | 138 (7.0%) |
| 55 to 64 Years | 144 (7.3%) | 232 (11.0%) |
| 65 to 74 Years | 167 (11.1%) | 133 (8.2%) |
| 75 Years and over | 61 (7.4%) | 71 (6.6%) |
| Total | 1,824 (13.8%) | 1,884 (13.7%) |
Income Above Poverty by Sex and Age in Monroe County
According to the poverty statistics in Monroe County, males aged 12 to 14 years and females aged 75 years and over are the age groups that are most secure financially, with 98.7% of males and 93.4% of females in these age groups living above the poverty line.

| Age Bracket | Male | Female |
| Under 5 Years | 534 (75.3%) | 548 (84.3%) |
| 5 Years | 84 (71.8%) | 102 (72.3%) |
| 6 to 11 Years | 902 (87.5%) | 730 (70.3%) |
| 12 to 14 Years | 542 (98.7%) | 401 (93.3%) |
| 15 Years | 143 (89.9%) | 130 (81.2%) |
| 16 and 17 Years | 230 (64.6%) | 326 (84.5%) |
| 18 to 24 Years | 1,049 (80.8%) | 969 (89.1%) |
| 25 to 34 Years | 1,446 (96.7%) | 1,215 (81.5%) |
| 35 to 44 Years | 947 (66.0%) | 1,290 (78.7%) |
| 45 to 54 Years | 1,623 (90.0%) | 1,829 (93.0%) |
| 55 to 64 Years | 1,816 (92.6%) | 1,873 (89.0%) |
| 65 to 74 Years | 1,332 (88.9%) | 1,483 (91.8%) |
| 75 Years and over | 763 (92.6%) | 1,013 (93.4%) |
| Total | 11,411 (86.2%) | 11,909 (86.3%) |
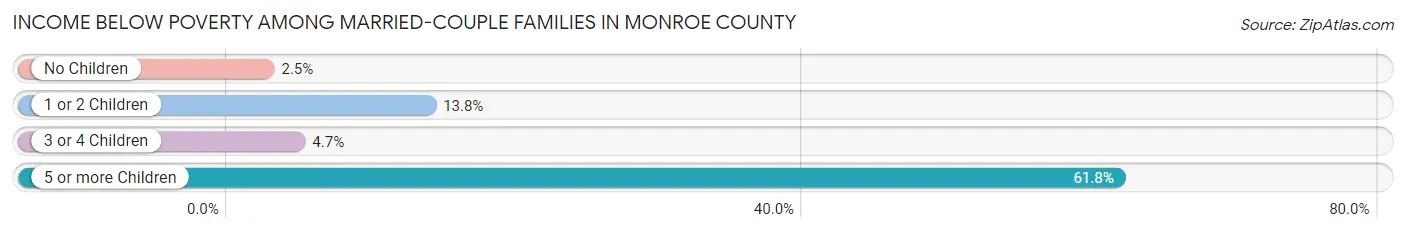
Income Below Poverty Among Married-Couple Families in Monroe County
The poverty statistics for married-couple families in Monroe County show that 7.7% or 440 of the total 5,681 families live below the poverty line. Families with 5 or more children have the highest poverty rate of 61.8%, comprising of 55 families. On the other hand, families with no children have the lowest poverty rate of 2.5%, which includes 79 families.
| Children | Above Poverty | Below Poverty |
| No Children | 3,029 (97.5%) | 79 (2.5%) |
| 1 or 2 Children | 1,792 (86.2%) | 287 (13.8%) |
| 3 or 4 Children | 386 (95.3%) | 19 (4.7%) |
| 5 or more Children | 34 (38.2%) | 55 (61.8%) |
| Total | 5,241 (92.2%) | 440 (7.7%) |
Income Below Poverty Among Single-Parent Households in Monroe County

| Children | Single Father | Single Mother |
| No Children | 0 (0.0%) | 0 (0.0%) |
| 1 or 2 Children | 0 (0.0%) | 98 (16.3%) |
| 3 or 4 Children | 0 (0.0%) | 34 (28.1%) |
| 5 or more Children | 0 (0.0%) | 0 (0.0%) |
| Total | 0 (0.0%) | 132 (12.8%) |
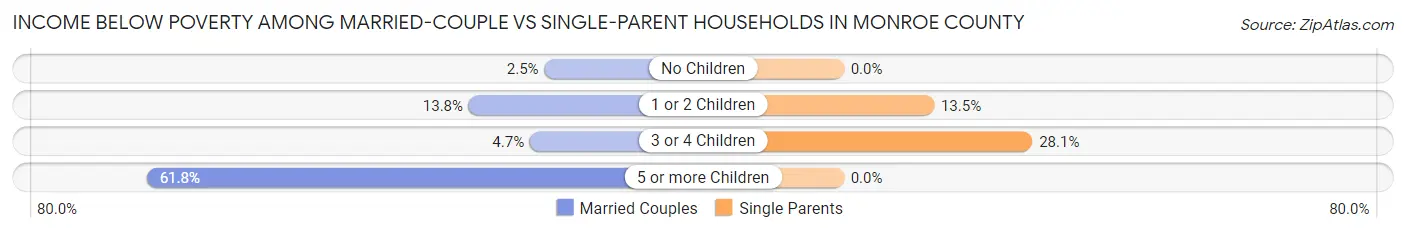
Income Below Poverty Among Married-Couple vs Single-Parent Households in Monroe County
The poverty data for Monroe County shows that 440 of the married-couple family households (7.7%) and 132 of the single-parent households (9.3%) are living below the poverty level. Within the married-couple family households, those with 5 or more children have the highest poverty rate, with 55 households (61.8%) falling below the poverty line. Among the single-parent households, those with 3 or 4 children have the highest poverty rate, with 34 household (28.1%) living below poverty.
| Children | Married-Couple Families | Single-Parent Households |
| No Children | 79 (2.5%) | 0 (0.0%) |
| 1 or 2 Children | 287 (13.8%) | 98 (13.5%) |
| 3 or 4 Children | 19 (4.7%) | 34 (28.1%) |
| 5 or more Children | 55 (61.8%) | 0 (0.0%) |
| Total | 440 (7.7%) | 132 (9.3%) |
Employment Characteristics in Monroe County
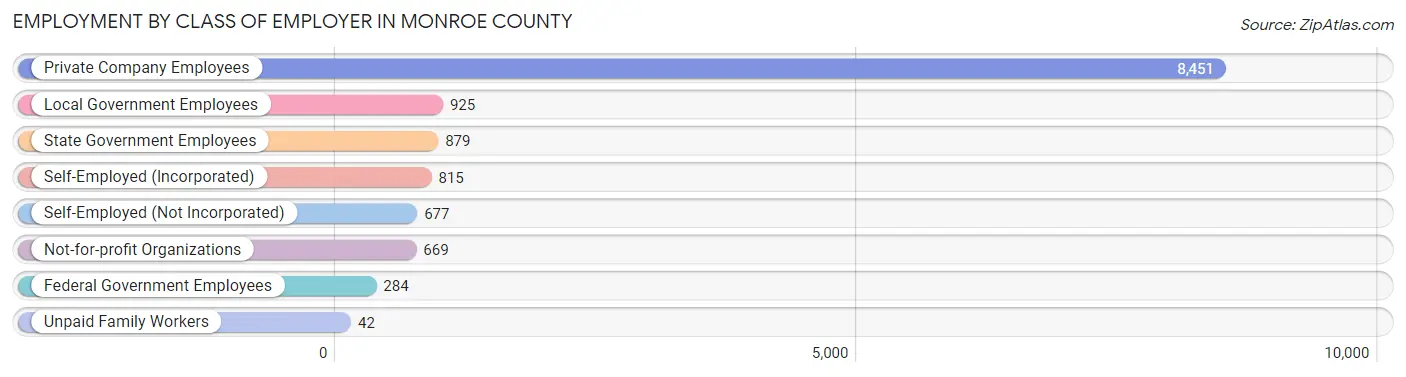
Employment by Class of Employer in Monroe County
Among the 12,742 employed individuals in Monroe County, private company employees (8,451 | 66.3%), local government employees (925 | 7.3%), and state government employees (879 | 6.9%) make up the most common classes of employment.
| Employer Class | # Employees | % Employees |
| Private Company Employees | 8,451 | 66.3% |
| Self-Employed (Incorporated) | 815 | 6.4% |
| Self-Employed (Not Incorporated) | 677 | 5.3% |
| Not-for-profit Organizations | 669 | 5.2% |
| Local Government Employees | 925 | 7.3% |
| State Government Employees | 879 | 6.9% |
| Federal Government Employees | 284 | 2.2% |
| Unpaid Family Workers | 42 | 0.3% |
| Total | 12,742 | 100.0% |
Employment Status by Age in Monroe County
According to the labor force statistics for Monroe County, out of the total population over 16 years of age (23,202), 59.0% or 13,689 individuals are in the labor force, with 3.8% or 520 of them unemployed. The age group with the highest labor force participation rate is 30 to 34 years, with 87.7% or 1,500 individuals in the labor force. Within the labor force, the 16 to 19 years age range has the highest percentage of unemployed individuals, with 9.6% or 59 of them being unemployed.

| Age Bracket | In Labor Force | Unemployed |
| 16 to 19 Years | 617 (42.7%) | 59 (9.6%) |
| 20 to 24 Years | 1,238 (63.5%) | 0 (0.0%) |
| 25 to 29 Years | 1,137 (77.9%) | 9 (0.8%) |
| 30 to 34 Years | 1,500 (87.7%) | 94 (6.3%) |
| 35 to 44 Years | 2,588 (78.8%) | 98 (3.8%) |
| 45 to 54 Years | 3,113 (79.6%) | 212 (6.8%) |
| 55 to 59 Years | 1,482 (72.0%) | 18 (1.2%) |
| 60 to 64 Years | 1,186 (56.5%) | 23 (1.9%) |
| 65 to 74 Years | 725 (22.9%) | 0 (0.0%) |
| 75 Years and over | 89 (4.2%) | 0 (0.0%) |
| Total | 13,689 (59.0%) | 520 (3.8%) |
Employment Status by Educational Attainment in Monroe County
According to labor force statistics for Monroe County, 75.8% of individuals (11,008) out of the total population between 25 and 64 years of age (14,523) are in the labor force, with 4.1% or 451 of them being unemployed. The group with the highest labor force participation rate are those with the educational attainment of bachelor's degree or higher, with 86.1% or 3,795 individuals in the labor force. Within the labor force, individuals with high school diploma education have the highest percentage of unemployment, with 8.3% or 282 of them being unemployed.
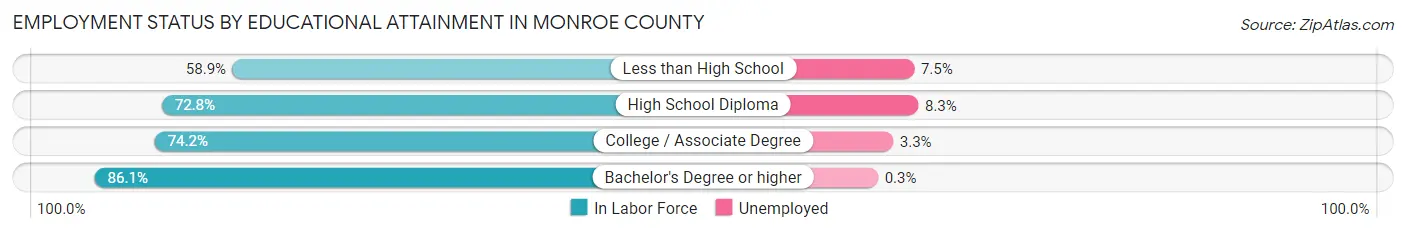
| Educational Attainment | In Labor Force | Unemployed |
| Less than High School | 876 (58.9%) | 112 (7.5%) |
| High School Diploma | 3,392 (72.8%) | 387 (8.3%) |
| College / Associate Degree | 2,944 (74.2%) | 131 (3.3%) |
| Bachelor's Degree or higher | 3,795 (86.1%) | 13 (0.3%) |
| Total | 11,008 (75.8%) | 595 (4.1%) |
Employment Occupations by Sex in Monroe County
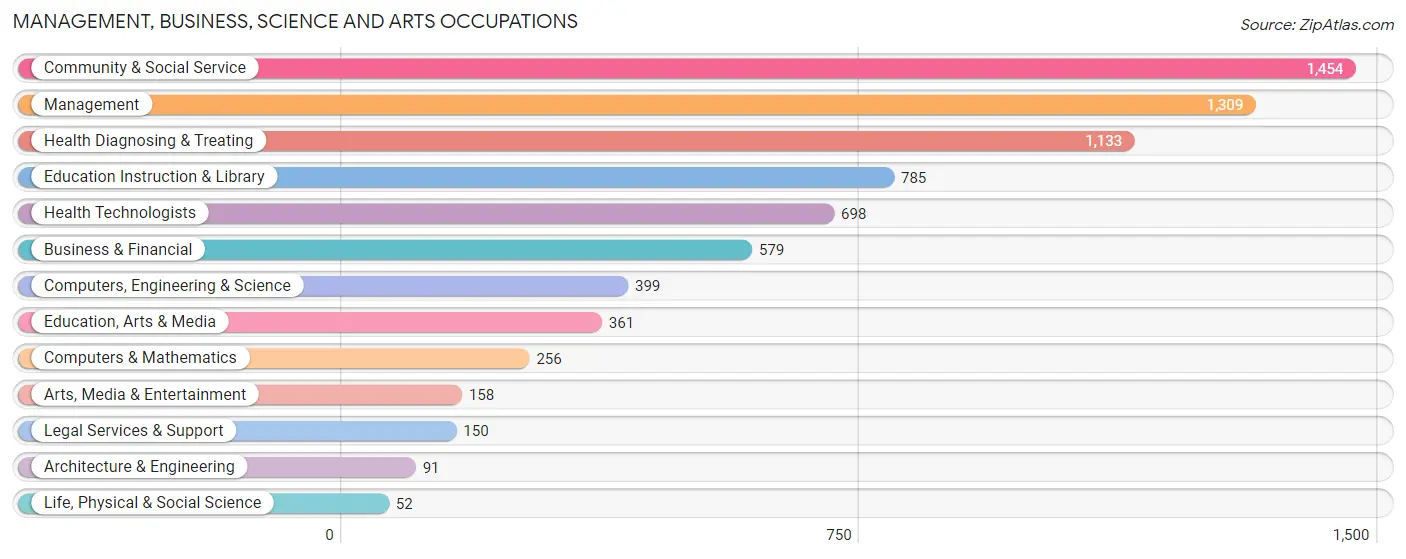
Management, Business, Science and Arts Occupations
The most common Management, Business, Science and Arts occupations in Monroe County are Community & Social Service (1,454 | 11.1%), Management (1,309 | 10.0%), Health Diagnosing & Treating (1,133 | 8.6%), Education Instruction & Library (785 | 6.0%), and Health Technologists (698 | 5.3%).
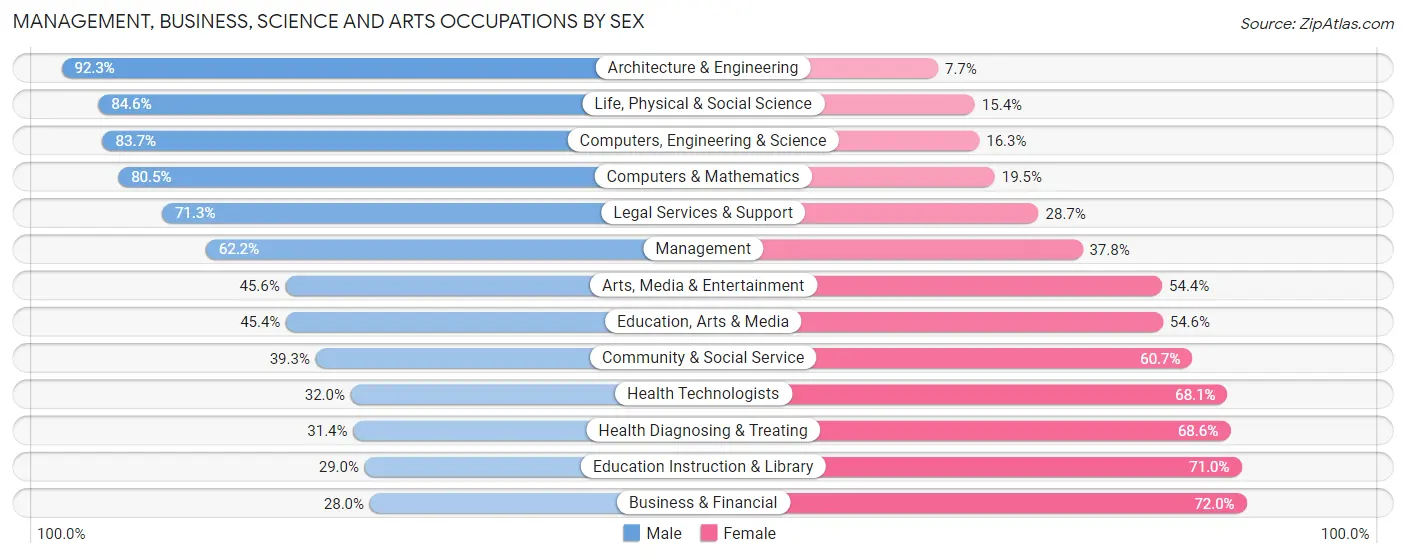
Management, Business, Science and Arts Occupations by Sex
Within the Management, Business, Science and Arts occupations in Monroe County, the most male-oriented occupations are Architecture & Engineering (92.3%), Life, Physical & Social Science (84.6%), and Computers, Engineering & Science (83.7%), while the most female-oriented occupations are Business & Financial (72.0%), Education Instruction & Library (71.0%), and Health Diagnosing & Treating (68.6%).
| Occupation | Male | Female |
| Management | 814 (62.2%) | 495 (37.8%) |
| Business & Financial | 162 (28.0%) | 417 (72.0%) |
| Computers, Engineering & Science | 334 (83.7%) | 65 (16.3%) |
| Computers & Mathematics | 206 (80.5%) | 50 (19.5%) |
| Architecture & Engineering | 84 (92.3%) | 7 (7.7%) |
| Life, Physical & Social Science | 44 (84.6%) | 8 (15.4%) |
| Community & Social Service | 571 (39.3%) | 883 (60.7%) |
| Education, Arts & Media | 164 (45.4%) | 197 (54.6%) |
| Legal Services & Support | 107 (71.3%) | 43 (28.7%) |
| Education Instruction & Library | 228 (29.0%) | 557 (71.0%) |
| Arts, Media & Entertainment | 72 (45.6%) | 86 (54.4%) |
| Health Diagnosing & Treating | 356 (31.4%) | 777 (68.6%) |
| Health Technologists | 223 (32.0%) | 475 (68.0%) |
| Total (Category) | 2,237 (45.9%) | 2,637 (54.1%) |
| Total (Overall) | 6,837 (52.0%) | 6,315 (48.0%) |
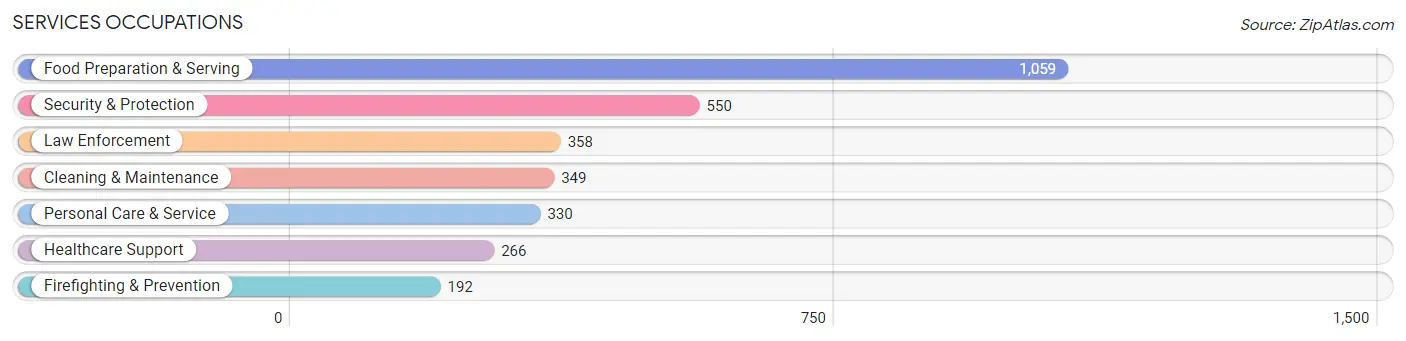
Services Occupations
The most common Services occupations in Monroe County are Food Preparation & Serving (1,059 | 8.1%), Security & Protection (550 | 4.2%), Law Enforcement (358 | 2.7%), Cleaning & Maintenance (349 | 2.6%), and Personal Care & Service (330 | 2.5%).
Services Occupations by Sex
Within the Services occupations in Monroe County, the most male-oriented occupations are Law Enforcement (90.2%), Security & Protection (86.9%), and Cleaning & Maintenance (86.8%), while the most female-oriented occupations are Personal Care & Service (96.7%), Healthcare Support (78.2%), and Food Preparation & Serving (63.3%).

| Occupation | Male | Female |
| Healthcare Support | 58 (21.8%) | 208 (78.2%) |
| Security & Protection | 478 (86.9%) | 72 (13.1%) |
| Firefighting & Prevention | 155 (80.7%) | 37 (19.3%) |
| Law Enforcement | 323 (90.2%) | 35 (9.8%) |
| Food Preparation & Serving | 389 (36.7%) | 670 (63.3%) |
| Cleaning & Maintenance | 303 (86.8%) | 46 (13.2%) |
| Personal Care & Service | 11 (3.3%) | 319 (96.7%) |
| Total (Category) | 1,239 (48.5%) | 1,315 (51.5%) |
| Total (Overall) | 6,837 (52.0%) | 6,315 (48.0%) |
Sales and Office Occupations
The most common Sales and Office occupations in Monroe County are Office & Administration (1,394 | 10.6%), and Sales & Related (1,236 | 9.4%).
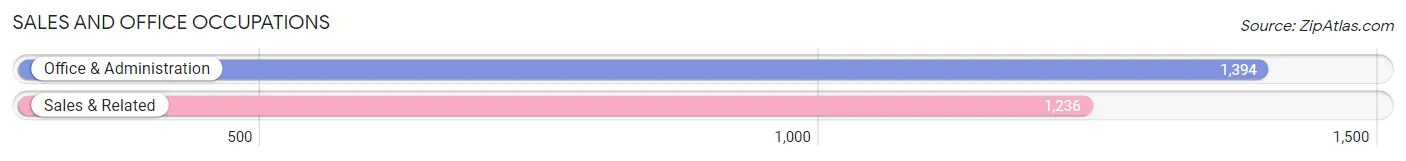
Sales and Office Occupations by Sex

| Occupation | Male | Female |
| Sales & Related | 457 (37.0%) | 779 (63.0%) |
| Office & Administration | 300 (21.5%) | 1,094 (78.5%) |
| Total (Category) | 757 (28.8%) | 1,873 (71.2%) |
| Total (Overall) | 6,837 (52.0%) | 6,315 (48.0%) |
Natural Resources, Construction and Maintenance Occupations
The most common Natural Resources, Construction and Maintenance occupations in Monroe County are Installation, Maintenance & Repair (528 | 4.0%), Construction & Extraction (367 | 2.8%), and Farming, Fishing & Forestry (82 | 0.6%).
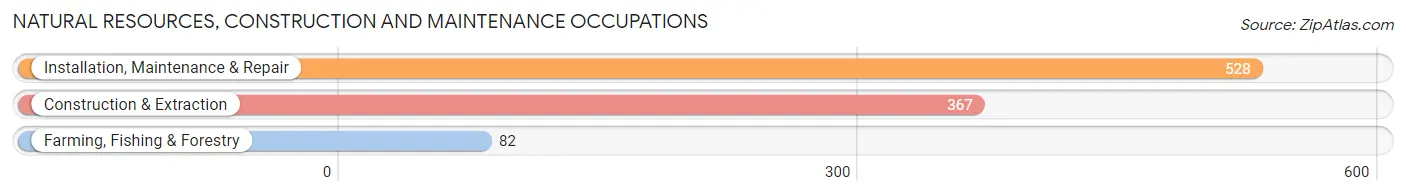
Natural Resources, Construction and Maintenance Occupations by Sex

| Occupation | Male | Female |
| Farming, Fishing & Forestry | 82 (100.0%) | 0 (0.0%) |
| Construction & Extraction | 367 (100.0%) | 0 (0.0%) |
| Installation, Maintenance & Repair | 478 (90.5%) | 50 (9.5%) |
| Total (Category) | 927 (94.9%) | 50 (5.1%) |
| Total (Overall) | 6,837 (52.0%) | 6,315 (48.0%) |
Production, Transportation and Moving Occupations
The most common Production, Transportation and Moving occupations in Monroe County are Production (996 | 7.6%), Transportation (584 | 4.4%), and Material Moving (537 | 4.1%).
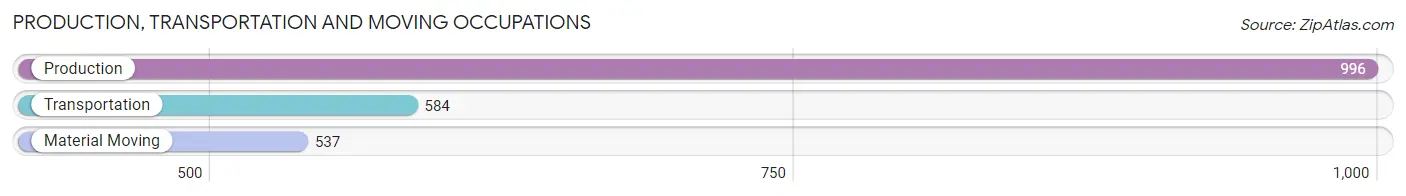
Production, Transportation and Moving Occupations by Sex
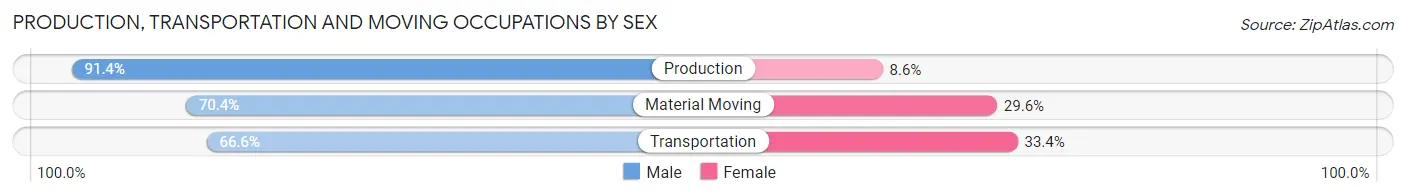
| Occupation | Male | Female |
| Production | 910 (91.4%) | 86 (8.6%) |
| Transportation | 389 (66.6%) | 195 (33.4%) |
| Material Moving | 378 (70.4%) | 159 (29.6%) |
| Total (Category) | 1,677 (79.2%) | 440 (20.8%) |
| Total (Overall) | 6,837 (52.0%) | 6,315 (48.0%) |
Employment Industries by Sex in Monroe County
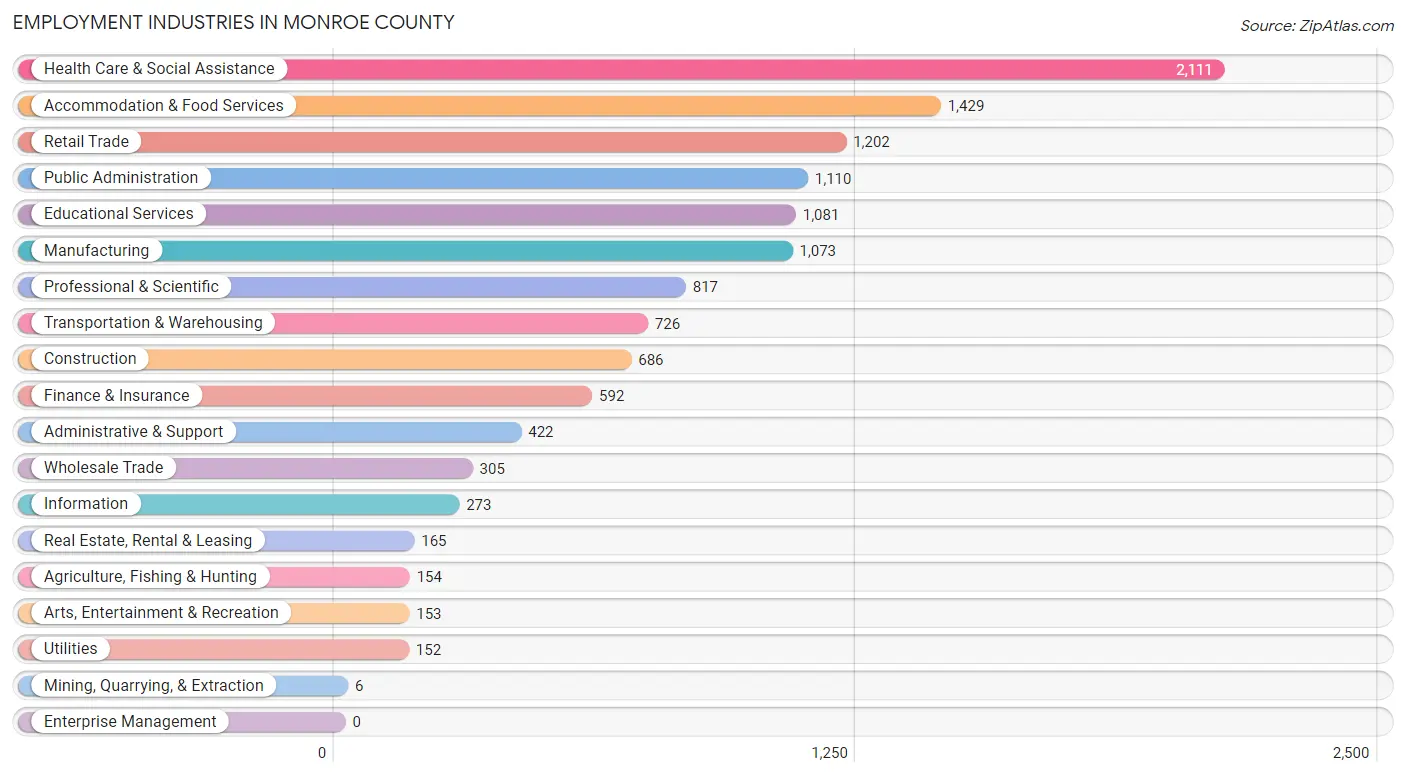
Employment Industries in Monroe County
The major employment industries in Monroe County include Health Care & Social Assistance (2,111 | 16.1%), Accommodation & Food Services (1,429 | 10.9%), Retail Trade (1,202 | 9.1%), Public Administration (1,110 | 8.4%), and Educational Services (1,081 | 8.2%).
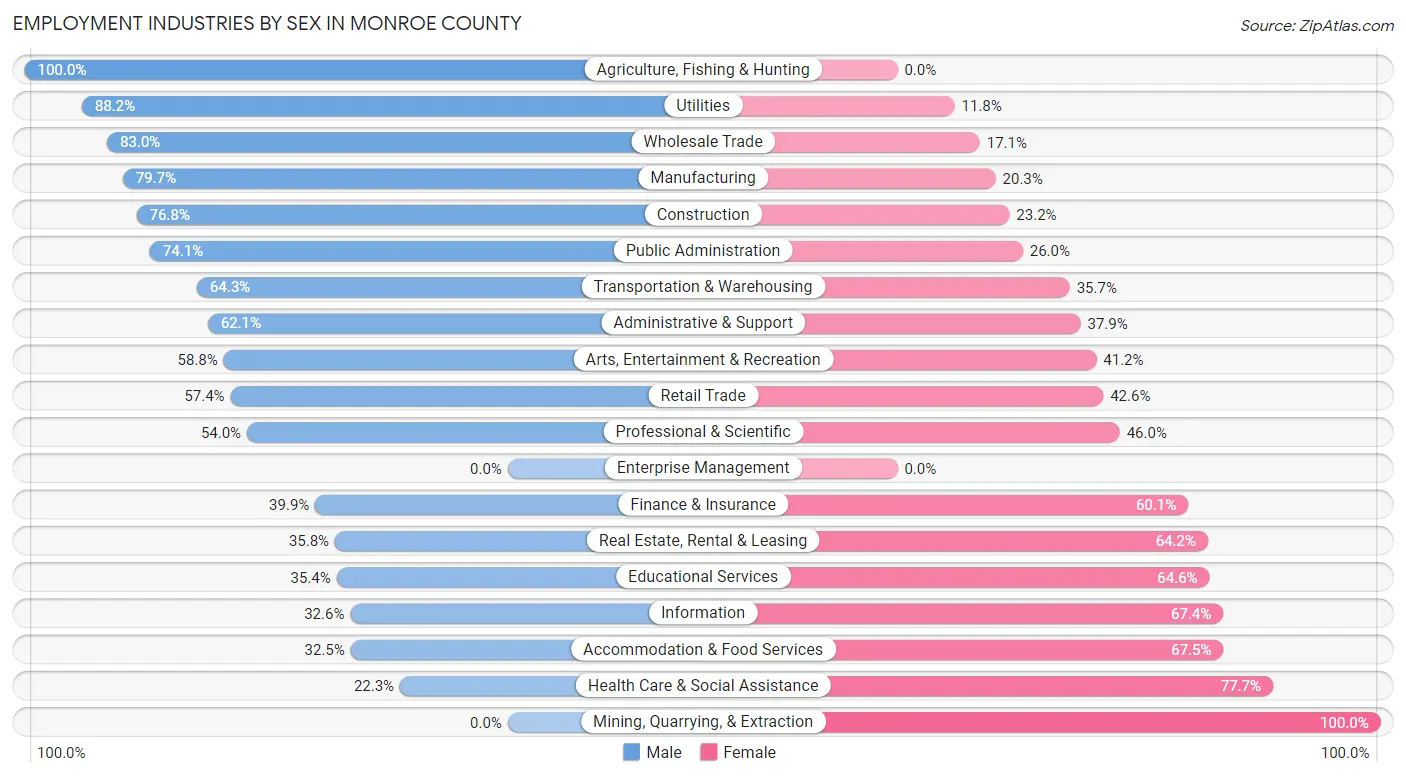
Employment Industries by Sex in Monroe County
The Monroe County industries that see more men than women are Agriculture, Fishing & Hunting (100.0%), Utilities (88.2%), and Wholesale Trade (83.0%), whereas the industries that tend to have a higher number of women are Mining, Quarrying, & Extraction (100.0%), Health Care & Social Assistance (77.7%), and Accommodation & Food Services (67.5%).
| Industry | Male | Female |
| Agriculture, Fishing & Hunting | 154 (100.0%) | 0 (0.0%) |
| Mining, Quarrying, & Extraction | 0 (0.0%) | 6 (100.0%) |
| Construction | 527 (76.8%) | 159 (23.2%) |
| Manufacturing | 855 (79.7%) | 218 (20.3%) |
| Wholesale Trade | 253 (83.0%) | 52 (17.1%) |
| Retail Trade | 690 (57.4%) | 512 (42.6%) |
| Transportation & Warehousing | 467 (64.3%) | 259 (35.7%) |
| Utilities | 134 (88.2%) | 18 (11.8%) |
| Information | 89 (32.6%) | 184 (67.4%) |
| Finance & Insurance | 236 (39.9%) | 356 (60.1%) |
| Real Estate, Rental & Leasing | 59 (35.8%) | 106 (64.2%) |
| Professional & Scientific | 441 (54.0%) | 376 (46.0%) |
| Enterprise Management | 0 (0.0%) | 0 (0.0%) |
| Administrative & Support | 262 (62.1%) | 160 (37.9%) |
| Educational Services | 383 (35.4%) | 698 (64.6%) |
| Health Care & Social Assistance | 471 (22.3%) | 1,640 (77.7%) |
| Arts, Entertainment & Recreation | 90 (58.8%) | 63 (41.2%) |
| Accommodation & Food Services | 465 (32.5%) | 964 (67.5%) |
| Public Administration | 822 (74.1%) | 288 (26.0%) |
| Total | 6,837 (52.0%) | 6,315 (48.0%) |
Education in Monroe County
School Enrollment in Monroe County
The most common levels of schooling among the 6,269 students in Monroe County are high school (1,426 | 22.8%), elementary school (1,378 | 22.0%), and middle school (1,227 | 19.6%).

| School Level | # Students | % Students |
| Nursery / Preschool | 490 | 7.8% |
| Kindergarten | 345 | 5.5% |
| Elementary School | 1,378 | 22.0% |
| Middle School | 1,227 | 19.6% |
| High School | 1,426 | 22.8% |
| College / Undergraduate | 1,063 | 17.0% |
| Graduate / Professional | 340 | 5.4% |
| Total | 6,269 | 100.0% |
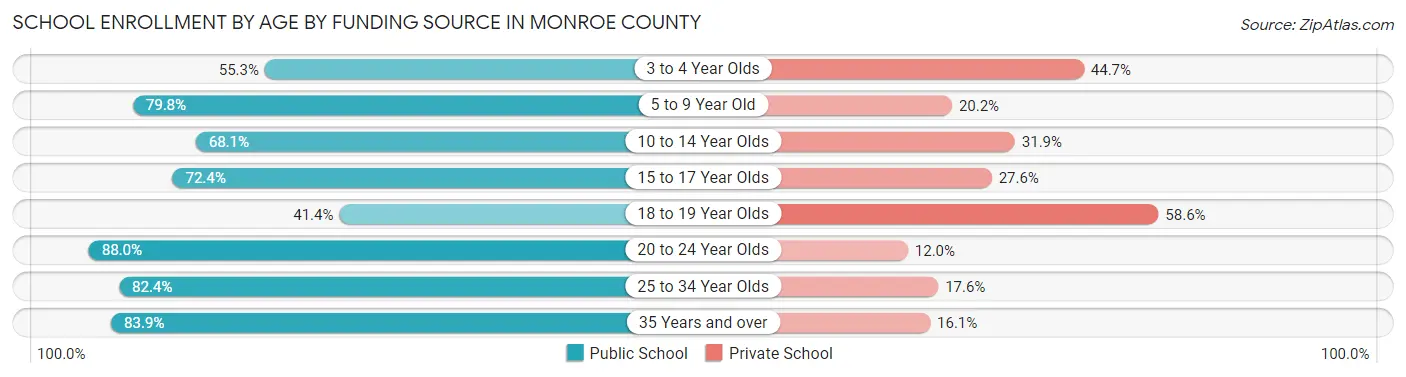
School Enrollment by Age by Funding Source in Monroe County
Out of a total of 6,269 students who are enrolled in schools in Monroe County, 1,661 (26.5%) attend a private institution, while the remaining 4,608 (73.5%) are enrolled in public schools. The age group of 18 to 19 year olds has the highest likelihood of being enrolled in private schools, with 170 (58.6% in the age bracket) enrolled. Conversely, the age group of 20 to 24 year olds has the lowest likelihood of being enrolled in a private school, with 530 (88.0% in the age bracket) attending a public institution.
| Age Bracket | Public School | Private School |
| 3 to 4 Year Olds | 205 (55.3%) | 166 (44.7%) |
| 5 to 9 Year Old | 1,342 (79.8%) | 339 (20.2%) |
| 10 to 14 Year Olds | 1,100 (68.1%) | 515 (31.9%) |
| 15 to 17 Year Olds | 754 (72.4%) | 287 (27.6%) |
| 18 to 19 Year Olds | 120 (41.4%) | 170 (58.6%) |
| 20 to 24 Year Olds | 530 (88.0%) | 72 (12.0%) |
| 25 to 34 Year Olds | 234 (82.4%) | 50 (17.6%) |
| 35 Years and over | 323 (83.9%) | 62 (16.1%) |
| Total | 4,608 (73.5%) | 1,661 (26.5%) |
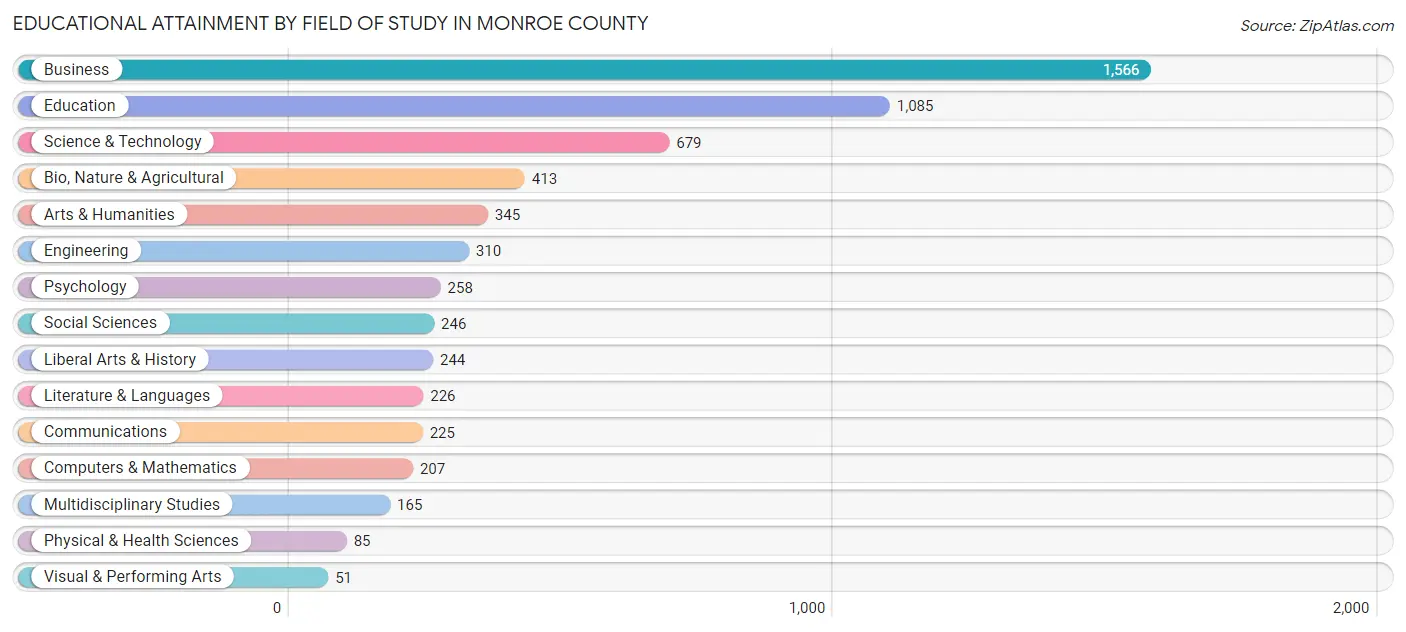
Educational Attainment by Field of Study in Monroe County
Business (1,566 | 25.7%), education (1,085 | 17.8%), science & technology (679 | 11.1%), bio, nature & agricultural (413 | 6.8%), and arts & humanities (345 | 5.7%) are the most common fields of study among 6,105 individuals in Monroe County who have obtained a bachelor's degree or higher.
| Field of Study | # Graduates | % Graduates |
| Computers & Mathematics | 207 | 3.4% |
| Bio, Nature & Agricultural | 413 | 6.8% |
| Physical & Health Sciences | 85 | 1.4% |
| Psychology | 258 | 4.2% |
| Social Sciences | 246 | 4.0% |
| Engineering | 310 | 5.1% |
| Multidisciplinary Studies | 165 | 2.7% |
| Science & Technology | 679 | 11.1% |
| Business | 1,566 | 25.7% |
| Education | 1,085 | 17.8% |
| Literature & Languages | 226 | 3.7% |
| Liberal Arts & History | 244 | 4.0% |
| Visual & Performing Arts | 51 | 0.8% |
| Communications | 225 | 3.7% |
| Arts & Humanities | 345 | 5.7% |
| Total | 6,105 | 100.0% |
Transportation & Commute in Monroe County
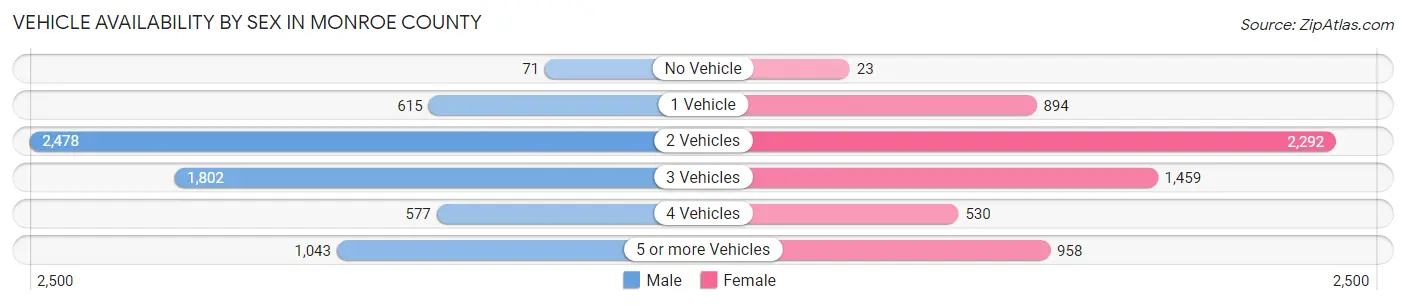
Vehicle Availability by Sex in Monroe County
The most prevalent vehicle ownership categories in Monroe County are males with 2 vehicles (2,478, accounting for 37.6%) and females with 2 vehicles (2,292, making up 40.3%).
| Vehicles Available | Male | Female |
| No Vehicle | 71 (1.1%) | 23 (0.4%) |
| 1 Vehicle | 615 (9.3%) | 894 (14.5%) |
| 2 Vehicles | 2,478 (37.6%) | 2,292 (37.2%) |
| 3 Vehicles | 1,802 (27.4%) | 1,459 (23.7%) |
| 4 Vehicles | 577 (8.8%) | 530 (8.6%) |
| 5 or more Vehicles | 1,043 (15.8%) | 958 (15.6%) |
| Total | 6,586 (100.0%) | 6,156 (100.0%) |
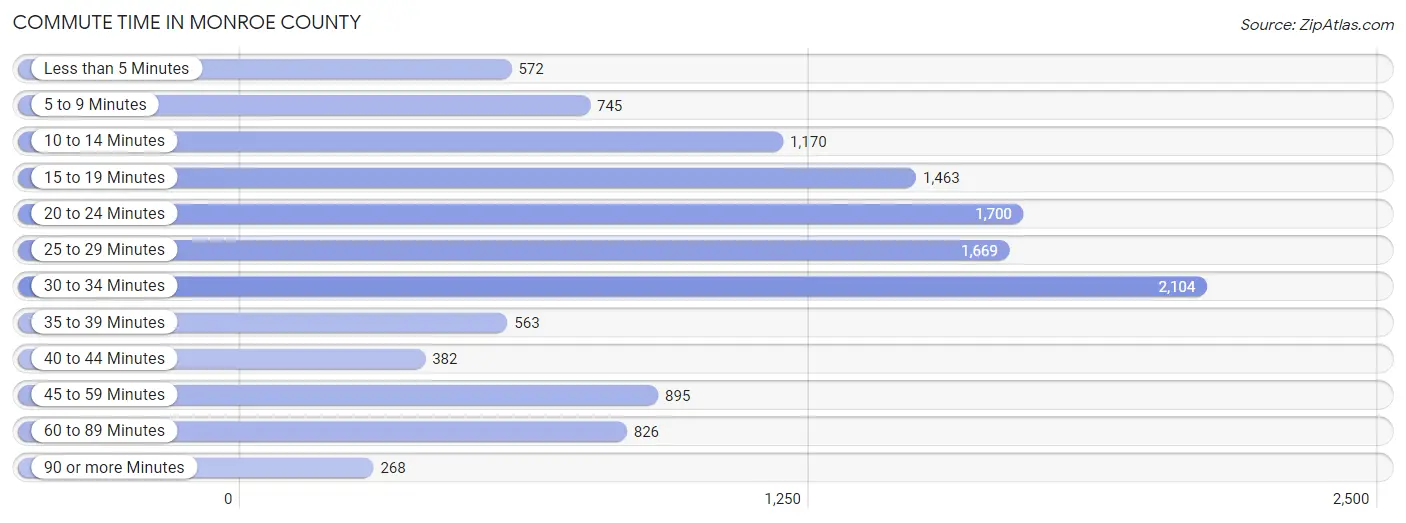
Commute Time in Monroe County
The most frequently occuring commute durations in Monroe County are 30 to 34 minutes (2,104 commuters, 17.0%), 20 to 24 minutes (1,700 commuters, 13.8%), and 25 to 29 minutes (1,669 commuters, 13.5%).
| Commute Time | # Commuters | % Commuters |
| Less than 5 Minutes | 572 | 4.6% |
| 5 to 9 Minutes | 745 | 6.0% |
| 10 to 14 Minutes | 1,170 | 9.5% |
| 15 to 19 Minutes | 1,463 | 11.8% |
| 20 to 24 Minutes | 1,700 | 13.8% |
| 25 to 29 Minutes | 1,669 | 13.5% |
| 30 to 34 Minutes | 2,104 | 17.0% |
| 35 to 39 Minutes | 563 | 4.6% |
| 40 to 44 Minutes | 382 | 3.1% |
| 45 to 59 Minutes | 895 | 7.2% |
| 60 to 89 Minutes | 826 | 6.7% |
| 90 or more Minutes | 268 | 2.2% |
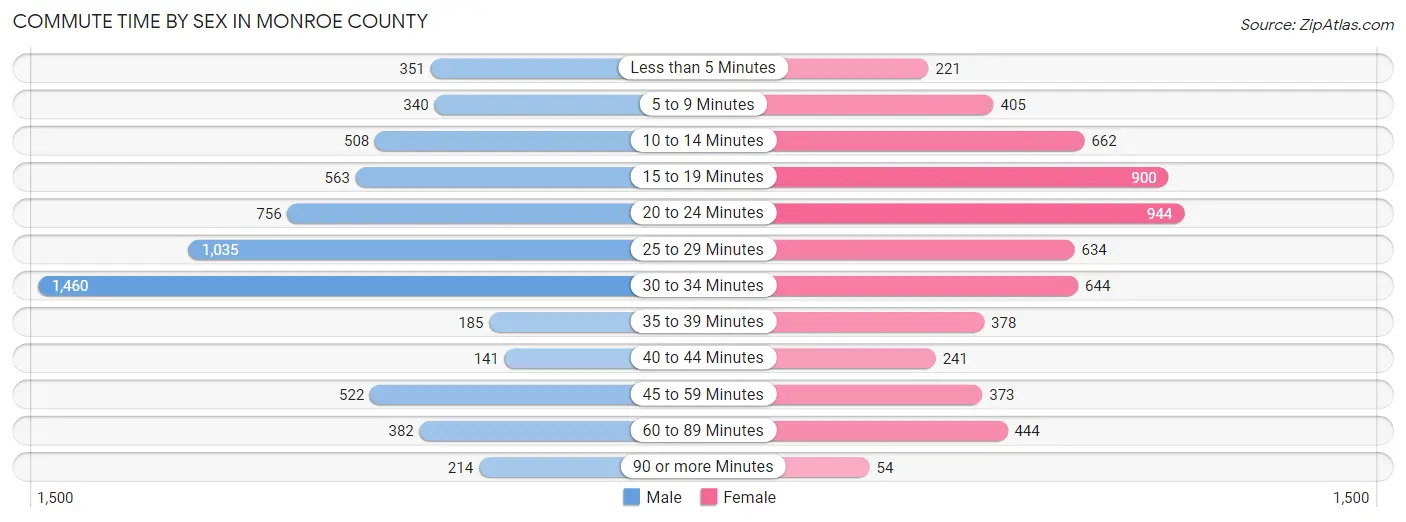
Commute Time by Sex in Monroe County
The most common commute times in Monroe County are 30 to 34 minutes (1,460 commuters, 22.6%) for males and 20 to 24 minutes (944 commuters, 16.0%) for females.
| Commute Time | Male | Female |
| Less than 5 Minutes | 351 (5.4%) | 221 (3.7%) |
| 5 to 9 Minutes | 340 (5.3%) | 405 (6.9%) |
| 10 to 14 Minutes | 508 (7.9%) | 662 (11.2%) |
| 15 to 19 Minutes | 563 (8.7%) | 900 (15.2%) |
| 20 to 24 Minutes | 756 (11.7%) | 944 (16.0%) |
| 25 to 29 Minutes | 1,035 (16.0%) | 634 (10.7%) |
| 30 to 34 Minutes | 1,460 (22.6%) | 644 (10.9%) |
| 35 to 39 Minutes | 185 (2.9%) | 378 (6.4%) |
| 40 to 44 Minutes | 141 (2.2%) | 241 (4.1%) |
| 45 to 59 Minutes | 522 (8.1%) | 373 (6.3%) |
| 60 to 89 Minutes | 382 (5.9%) | 444 (7.5%) |
| 90 or more Minutes | 214 (3.3%) | 54 (0.9%) |
Time of Departure to Work by Sex in Monroe County
The most frequent times of departure to work in Monroe County are 7:30 AM to 7:59 AM (1,166, 18.1%) for males and 7:30 AM to 7:59 AM (1,111, 18.8%) for females.

| Time of Departure | Male | Female |
| 12:00 AM to 4:59 AM | 387 (6.0%) | 190 (3.2%) |
| 5:00 AM to 5:29 AM | 302 (4.7%) | 146 (2.5%) |
| 5:30 AM to 5:59 AM | 176 (2.7%) | 80 (1.4%) |
| 6:00 AM to 6:29 AM | 576 (8.9%) | 523 (8.9%) |
| 6:30 AM to 6:59 AM | 585 (9.1%) | 301 (5.1%) |
| 7:00 AM to 7:29 AM | 1,059 (16.4%) | 913 (15.5%) |
| 7:30 AM to 7:59 AM | 1,166 (18.1%) | 1,111 (18.8%) |
| 8:00 AM to 8:29 AM | 701 (10.9%) | 835 (14.1%) |
| 8:30 AM to 8:59 AM | 428 (6.6%) | 413 (7.0%) |
| 9:00 AM to 9:59 AM | 532 (8.2%) | 157 (2.7%) |
| 10:00 AM to 10:59 AM | 39 (0.6%) | 298 (5.1%) |
| 11:00 AM to 11:59 AM | 70 (1.1%) | 164 (2.8%) |
| 12:00 PM to 3:59 PM | 159 (2.5%) | 261 (4.4%) |
| 4:00 PM to 11:59 PM | 277 (4.3%) | 508 (8.6%) |
| Total | 6,457 (100.0%) | 5,900 (100.0%) |
Housing Occupancy in Monroe County
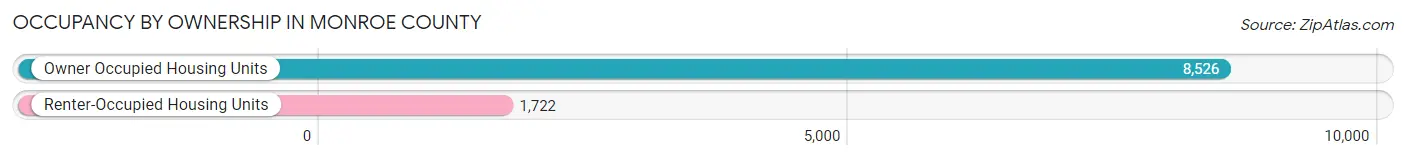
Occupancy by Ownership in Monroe County
Of the total 10,248 dwellings in Monroe County, owner-occupied units account for 8,526 (83.2%), while renter-occupied units make up 1,722 (16.8%).
| Occupancy | # Housing Units | % Housing Units |
| Owner Occupied Housing Units | 8,526 | 83.2% |
| Renter-Occupied Housing Units | 1,722 | 16.8% |
| Total Occupied Housing Units | 10,248 | 100.0% |
Occupancy by Household Size in Monroe County
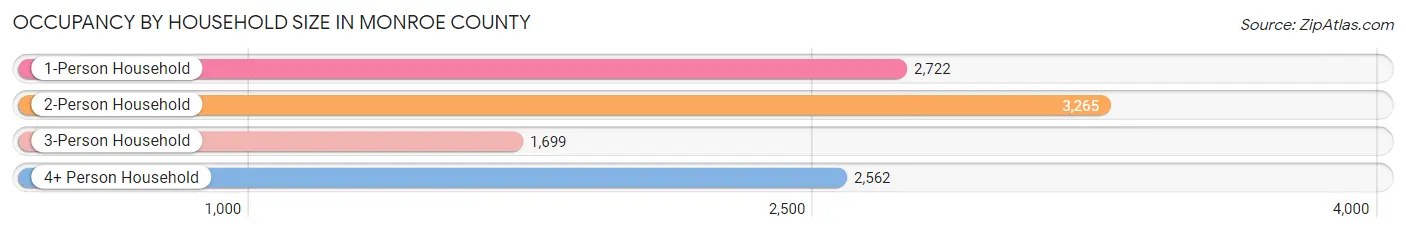
| Household Size | # Housing Units | % Housing Units |
| 1-Person Household | 2,722 | 26.6% |
| 2-Person Household | 3,265 | 31.9% |
| 3-Person Household | 1,699 | 16.6% |
| 4+ Person Household | 2,562 | 25.0% |
| Total Housing Units | 10,248 | 100.0% |
Occupancy by Ownership by Household Size in Monroe County

| Household Size | Owner-occupied | Renter-occupied |
| 1-Person Household | 2,213 (81.3%) | 509 (18.7%) |
| 2-Person Household | 2,738 (83.9%) | 527 (16.1%) |
| 3-Person Household | 1,506 (88.6%) | 193 (11.4%) |
| 4+ Person Household | 2,069 (80.8%) | 493 (19.2%) |
| Total Housing Units | 8,526 (83.2%) | 1,722 (16.8%) |
Occupancy by Educational Attainment in Monroe County

| Household Size | Owner-occupied | Renter-occupied |
| Less than High School | 510 (73.8%) | 181 (26.2%) |
| High School Diploma | 2,647 (76.9%) | 794 (23.1%) |
| College/Associate Degree | 2,307 (82.6%) | 487 (17.4%) |
| Bachelor's Degree or higher | 3,062 (92.2%) | 260 (7.8%) |
Occupancy by Age of Householder in Monroe County
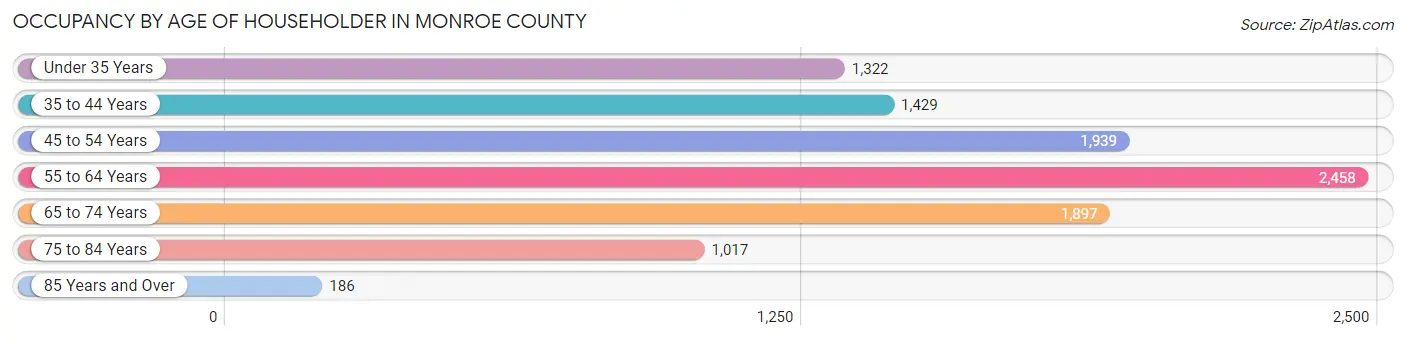
| Age Bracket | # Households | % Households |
| Under 35 Years | 1,322 | 12.9% |
| 35 to 44 Years | 1,429 | 13.9% |
| 45 to 54 Years | 1,939 | 18.9% |
| 55 to 64 Years | 2,458 | 24.0% |
| 65 to 74 Years | 1,897 | 18.5% |
| 75 to 84 Years | 1,017 | 9.9% |
| 85 Years and Over | 186 | 1.8% |
| Total | 10,248 | 100.0% |
Housing Finances in Monroe County
Median Income by Occupancy in Monroe County
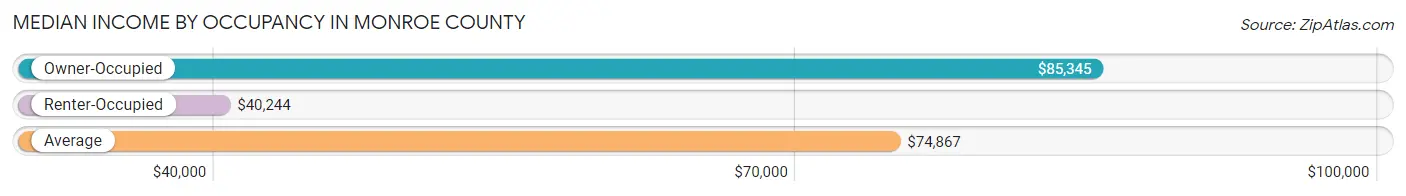
| Occupancy Type | # Households | Median Income |
| Owner-Occupied | 8,526 (83.2%) | $85,345 |
| Renter-Occupied | 1,722 (16.8%) | $40,244 |
| Average | 10,248 (100.0%) | $74,867 |
Occupancy by Householder Income Bracket in Monroe County
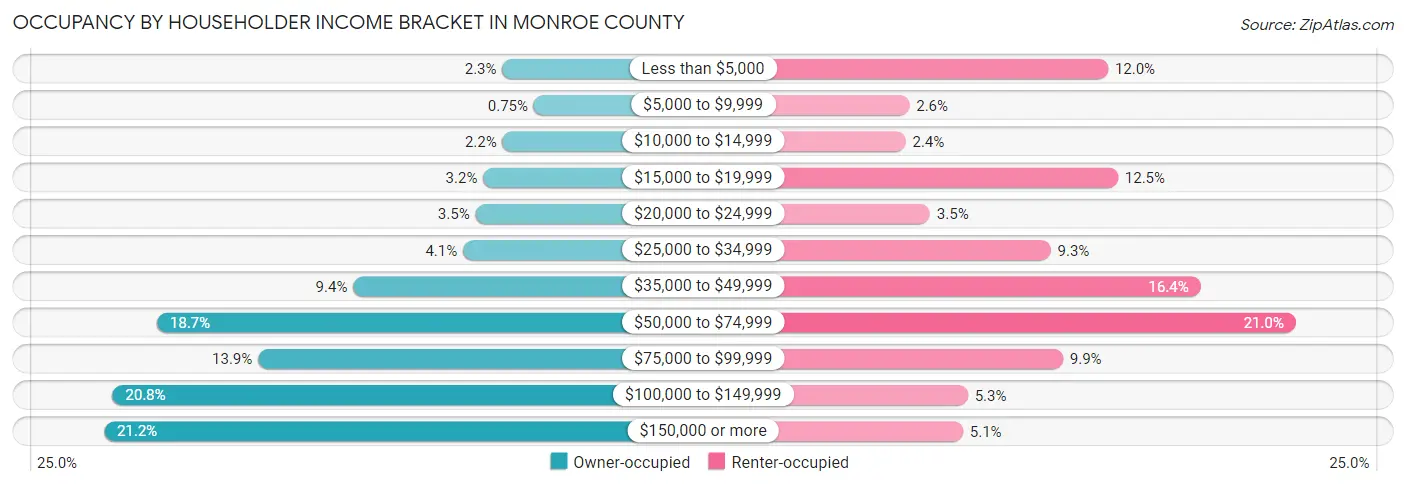
| Income Bracket | Owner-occupied | Renter-occupied |
| Less than $5,000 | 192 (2.2%) | 207 (12.0%) |
| $5,000 to $9,999 | 64 (0.7%) | 44 (2.6%) |
| $10,000 to $14,999 | 191 (2.2%) | 41 (2.4%) |
| $15,000 to $19,999 | 269 (3.2%) | 215 (12.5%) |
| $20,000 to $24,999 | 301 (3.5%) | 61 (3.5%) |
| $25,000 to $34,999 | 351 (4.1%) | 160 (9.3%) |
| $35,000 to $49,999 | 797 (9.3%) | 283 (16.4%) |
| $50,000 to $74,999 | 1,594 (18.7%) | 361 (21.0%) |
| $75,000 to $99,999 | 1,183 (13.9%) | 170 (9.9%) |
| $100,000 to $149,999 | 1,775 (20.8%) | 92 (5.3%) |
| $150,000 or more | 1,809 (21.2%) | 88 (5.1%) |
| Total | 8,526 (100.0%) | 1,722 (100.0%) |
Monthly Housing Cost Tiers in Monroe County

| Monthly Cost | Owner-occupied | Renter-occupied |
| Less than $300 | 877 (10.3%) | 74 (4.3%) |
| $300 to $499 | 1,370 (16.1%) | 41 (2.4%) |
| $500 to $799 | 1,296 (15.2%) | 374 (21.7%) |
| $800 to $999 | 680 (8.0%) | 468 (27.2%) |
| $1,000 to $1,499 | 1,484 (17.4%) | 317 (18.4%) |
| $1,500 to $1,999 | 1,191 (14.0%) | 251 (14.6%) |
| $2,000 to $2,499 | 847 (9.9%) | 0 (0.0%) |
| $2,500 to $2,999 | 210 (2.5%) | 16 (0.9%) |
| $3,000 or more | 571 (6.7%) | 0 (0.0%) |
| Total | 8,526 (100.0%) | 1,722 (100.0%) |
Physical Housing Characteristics in Monroe County
Housing Structures in Monroe County
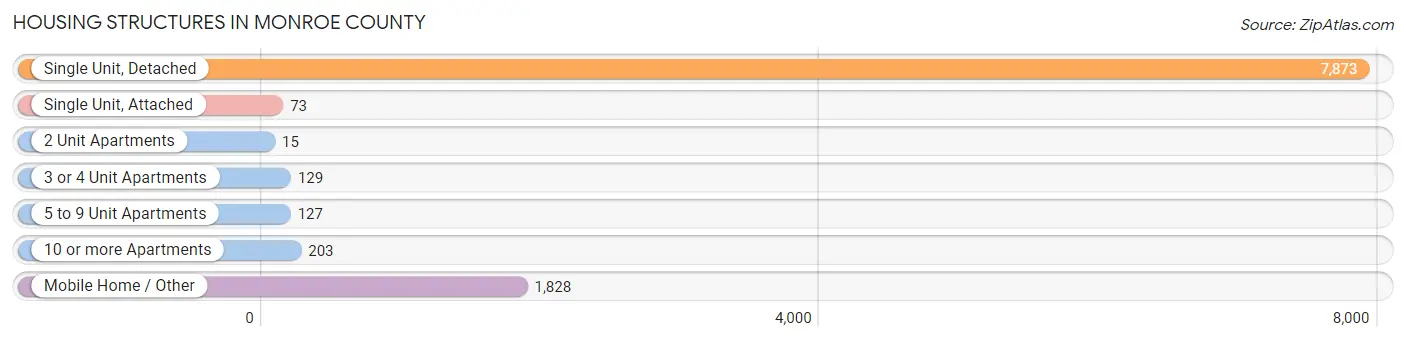
| Structure Type | # Housing Units | % Housing Units |
| Single Unit, Detached | 7,873 | 76.8% |
| Single Unit, Attached | 73 | 0.7% |
| 2 Unit Apartments | 15 | 0.2% |
| 3 or 4 Unit Apartments | 129 | 1.3% |
| 5 to 9 Unit Apartments | 127 | 1.2% |
| 10 or more Apartments | 203 | 2.0% |
| Mobile Home / Other | 1,828 | 17.8% |
| Total | 10,248 | 100.0% |
Housing Structures by Occupancy in Monroe County
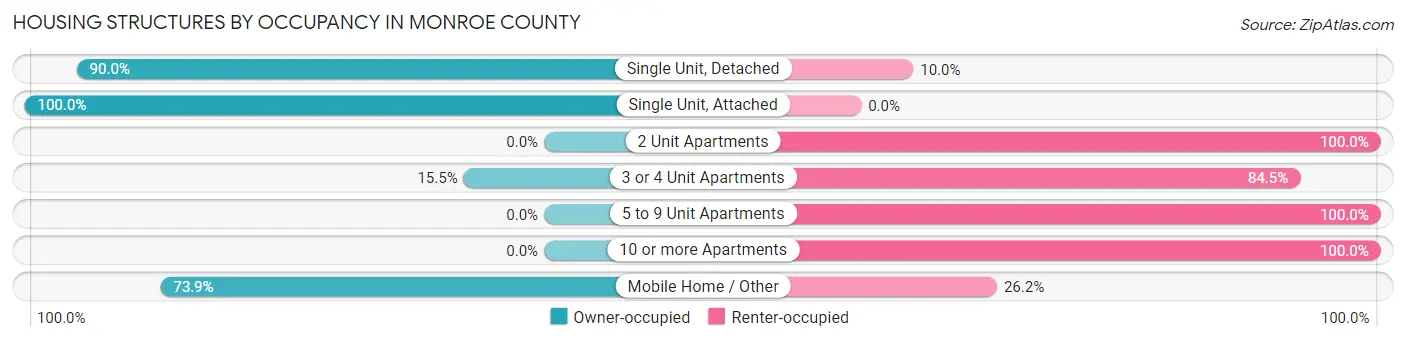
| Structure Type | Owner-occupied | Renter-occupied |
| Single Unit, Detached | 7,083 (90.0%) | 790 (10.0%) |
| Single Unit, Attached | 73 (100.0%) | 0 (0.0%) |
| 2 Unit Apartments | 0 (0.0%) | 15 (100.0%) |
| 3 or 4 Unit Apartments | 20 (15.5%) | 109 (84.5%) |
| 5 to 9 Unit Apartments | 0 (0.0%) | 127 (100.0%) |
| 10 or more Apartments | 0 (0.0%) | 203 (100.0%) |
| Mobile Home / Other | 1,350 (73.9%) | 478 (26.2%) |
| Total | 8,526 (83.2%) | 1,722 (16.8%) |
Housing Structures by Number of Rooms in Monroe County

| Number of Rooms | Owner-occupied | Renter-occupied |
| 1 Room | 25 (0.3%) | 0 (0.0%) |
| 2 or 3 Rooms | 189 (2.2%) | 231 (13.4%) |
| 4 or 5 Rooms | 1,338 (15.7%) | 527 (30.6%) |
| 6 or 7 Rooms | 3,492 (41.0%) | 625 (36.3%) |
| 8 or more Rooms | 3,482 (40.8%) | 339 (19.7%) |
| Total | 8,526 (100.0%) | 1,722 (100.0%) |
Housing Structure by Heating Type in Monroe County
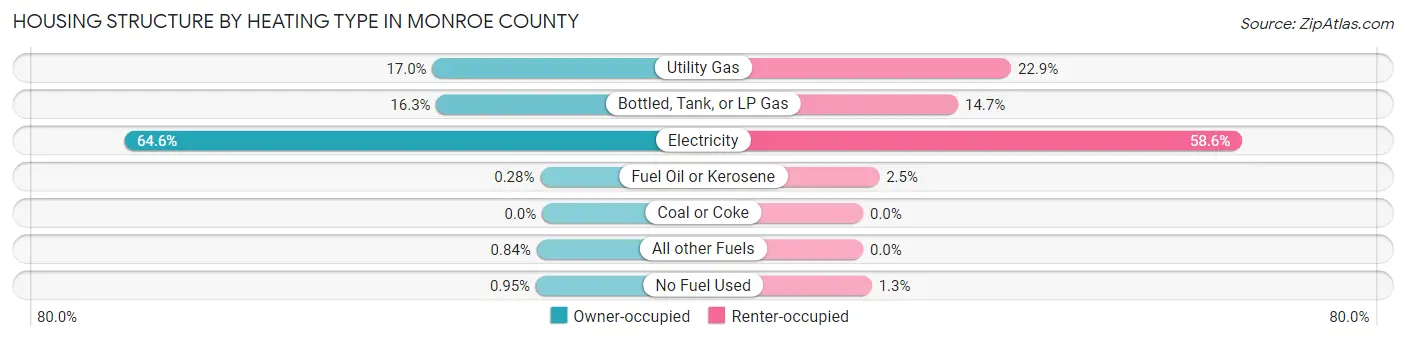
| Heating Type | Owner-occupied | Renter-occupied |
| Utility Gas | 1,445 (17.0%) | 394 (22.9%) |
| Bottled, Tank, or LP Gas | 1,393 (16.3%) | 253 (14.7%) |
| Electricity | 5,511 (64.6%) | 1,009 (58.6%) |
| Fuel Oil or Kerosene | 24 (0.3%) | 43 (2.5%) |
| Coal or Coke | 0 (0.0%) | 0 (0.0%) |
| All other Fuels | 72 (0.8%) | 0 (0.0%) |
| No Fuel Used | 81 (0.9%) | 23 (1.3%) |
| Total | 8,526 (100.0%) | 1,722 (100.0%) |
Household Vehicle Usage in Monroe County
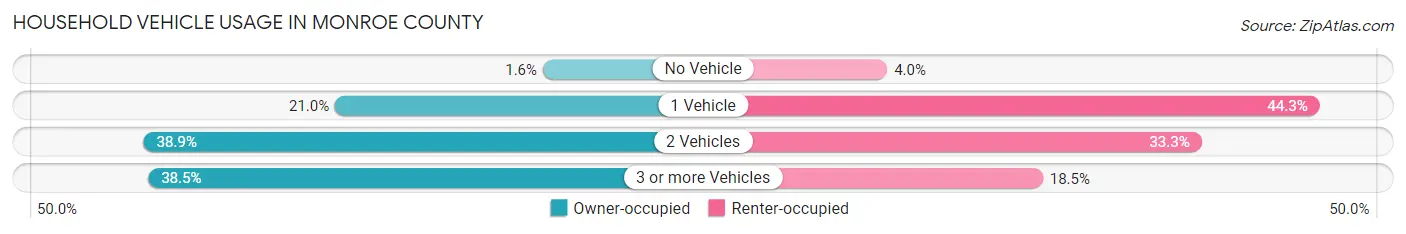
| Vehicles per Household | Owner-occupied | Renter-occupied |
| No Vehicle | 138 (1.6%) | 68 (4.0%) |
| 1 Vehicle | 1,792 (21.0%) | 763 (44.3%) |
| 2 Vehicles | 3,317 (38.9%) | 573 (33.3%) |
| 3 or more Vehicles | 3,279 (38.5%) | 318 (18.5%) |
| Total | 8,526 (100.0%) | 1,722 (100.0%) |
Real Estate & Mortgages in Monroe County
Real Estate and Mortgage Overview in Monroe County
| Characteristic | Without Mortgage | With Mortgage |
| Housing Units | 3,794 | 4,732 |
| Median Property Value | $174,500 | $253,000 |
| Median Household Income | $61,783 | $1,545 |
| Monthly Housing Costs | $436 | $560 |
| Real Estate Taxes | $1,017 | $224 |
Property Value by Mortgage Status in Monroe County
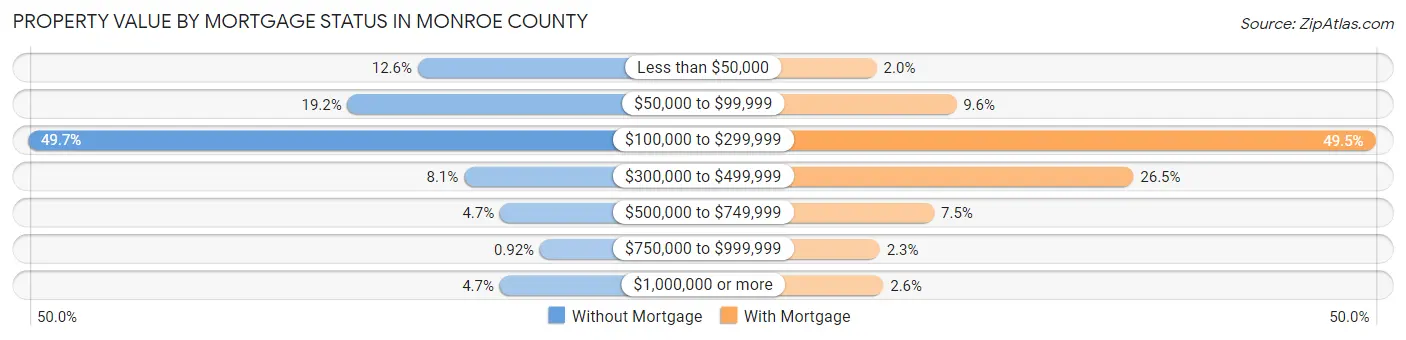
| Property Value | Without Mortgage | With Mortgage |
| Less than $50,000 | 476 (12.6%) | 95 (2.0%) |
| $50,000 to $99,999 | 730 (19.2%) | 454 (9.6%) |
| $100,000 to $299,999 | 1,885 (49.7%) | 2,343 (49.5%) |
| $300,000 to $499,999 | 309 (8.1%) | 1,252 (26.5%) |
| $500,000 to $749,999 | 179 (4.7%) | 354 (7.5%) |
| $750,000 to $999,999 | 35 (0.9%) | 109 (2.3%) |
| $1,000,000 or more | 180 (4.7%) | 125 (2.6%) |
| Total | 3,794 (100.0%) | 4,732 (100.0%) |
Household Income by Mortgage Status in Monroe County

| Household Income | Without Mortgage | With Mortgage |
| Less than $10,000 | 190 (5.0%) | 45 (0.9%) |
| $10,000 to $24,999 | 660 (17.4%) | 66 (1.4%) |
| $25,000 to $34,999 | 169 (4.4%) | 101 (2.1%) |
| $35,000 to $49,999 | 406 (10.7%) | 182 (3.8%) |
| $50,000 to $74,999 | 1,099 (29.0%) | 391 (8.3%) |
| $75,000 to $99,999 | 560 (14.8%) | 495 (10.5%) |
| $100,000 to $149,999 | 446 (11.8%) | 623 (13.2%) |
| $150,000 or more | 264 (7.0%) | 1,329 (28.1%) |
| Total | 3,794 (100.0%) | 4,732 (100.0%) |
Property Value to Household Income Ratio in Monroe County

| Value-to-Income Ratio | Without Mortgage | With Mortgage |
| Less than 2.0x | 1,201 (31.7%) | 117,321 (2,479.3%) |
| 2.0x to 2.9x | 858 (22.6%) | 2,304 (48.7%) |
| 3.0x to 3.9x | 278 (7.3%) | 1,168 (24.7%) |
| 4.0x or more | 1,346 (35.5%) | 463 (9.8%) |
| Total | 3,794 (100.0%) | 4,732 (100.0%) |
Real Estate Taxes by Mortgage Status in Monroe County
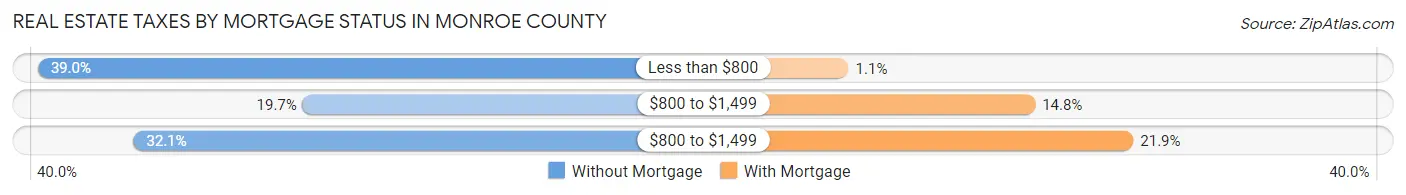
| Property Taxes | Without Mortgage | With Mortgage |
| Less than $800 | 1,481 (39.0%) | 54 (1.1%) |
| $800 to $1,499 | 747 (19.7%) | 699 (14.8%) |
| $800 to $1,499 | 1,216 (32.1%) | 1,038 (21.9%) |
| Total | 3,794 (100.0%) | 4,732 (100.0%) |
Health & Disability in Monroe County
Health Insurance Coverage by Age in Monroe County
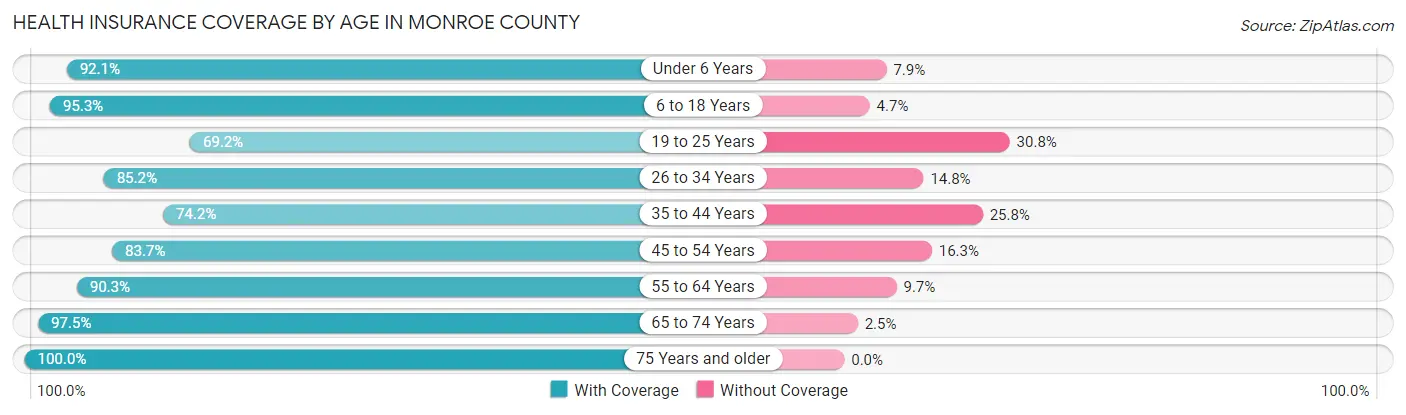
| Age Bracket | With Coverage | Without Coverage |
| Under 6 Years | 1,571 (92.1%) | 134 (7.9%) |
| 6 to 18 Years | 4,208 (95.3%) | 209 (4.7%) |
| 19 to 25 Years | 1,657 (69.2%) | 739 (30.8%) |
| 26 to 34 Years | 2,269 (85.2%) | 393 (14.8%) |
| 35 to 44 Years | 2,280 (74.2%) | 793 (25.8%) |
| 45 to 54 Years | 3,155 (83.7%) | 615 (16.3%) |
| 55 to 64 Years | 3,669 (90.3%) | 396 (9.7%) |
| 65 to 74 Years | 3,037 (97.5%) | 78 (2.5%) |
| 75 Years and older | 1,908 (100.0%) | 0 (0.0%) |
| Total | 23,754 (87.6%) | 3,357 (12.4%) |
Health Insurance Coverage by Citizenship Status in Monroe County
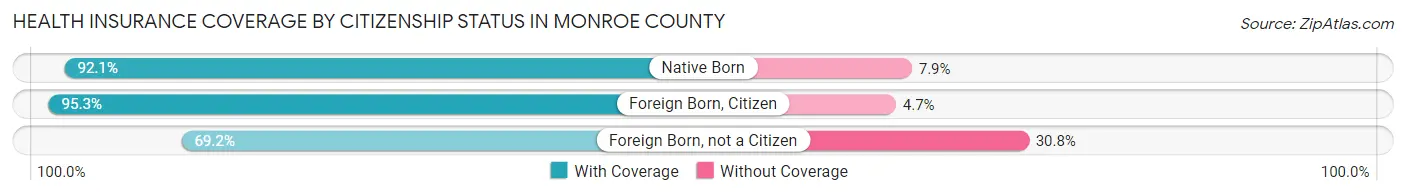
| Citizenship Status | With Coverage | Without Coverage |
| Native Born | 1,571 (92.1%) | 134 (7.9%) |
| Foreign Born, Citizen | 4,208 (95.3%) | 209 (4.7%) |
| Foreign Born, not a Citizen | 1,657 (69.2%) | 739 (30.8%) |
Health Insurance Coverage by Household Income in Monroe County
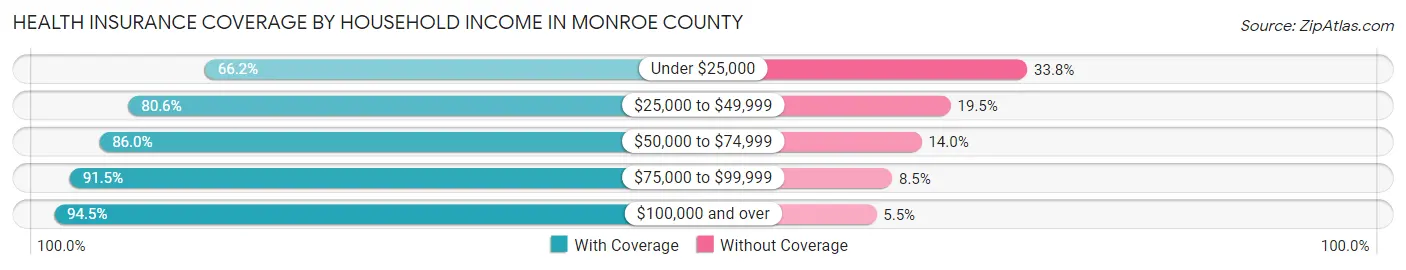
| Household Income | With Coverage | Without Coverage |
| Under $25,000 | 1,858 (66.2%) | 948 (33.8%) |
| $25,000 to $49,999 | 3,363 (80.5%) | 812 (19.5%) |
| $50,000 to $74,999 | 3,862 (86.0%) | 628 (14.0%) |
| $75,000 to $99,999 | 3,142 (91.5%) | 291 (8.5%) |
| $100,000 and over | 11,522 (94.5%) | 674 (5.5%) |
Public vs Private Health Insurance Coverage by Age in Monroe County
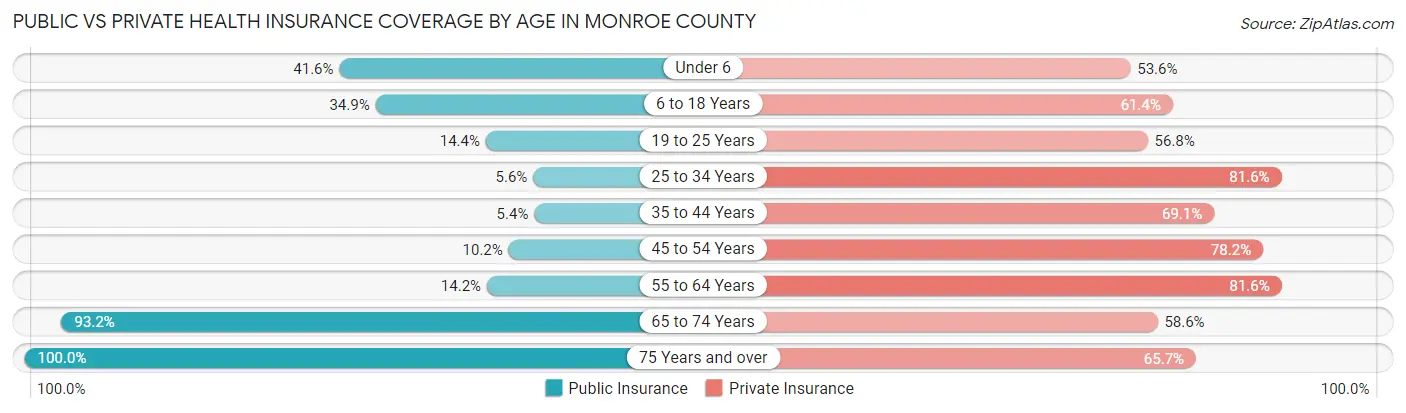
| Age Bracket | Public Insurance | Private Insurance |
| Under 6 | 709 (41.6%) | 913 (53.5%) |
| 6 to 18 Years | 1,540 (34.9%) | 2,713 (61.4%) |
| 19 to 25 Years | 345 (14.4%) | 1,360 (56.8%) |
| 25 to 34 Years | 149 (5.6%) | 2,172 (81.6%) |
| 35 to 44 Years | 166 (5.4%) | 2,123 (69.1%) |
| 45 to 54 Years | 383 (10.2%) | 2,947 (78.2%) |
| 55 to 64 Years | 577 (14.2%) | 3,318 (81.6%) |
| 65 to 74 Years | 2,902 (93.2%) | 1,825 (58.6%) |
| 75 Years and over | 1,908 (100.0%) | 1,254 (65.7%) |
| Total | 8,679 (32.0%) | 18,625 (68.7%) |
Disability Status by Sex by Age in Monroe County
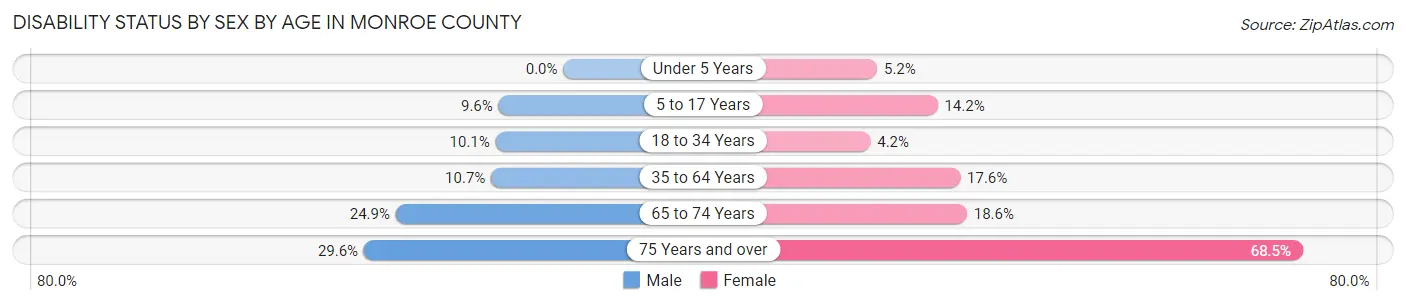
| Age Bracket | Male | Female |
| Under 5 Years | 0 (0.0%) | 34 (5.2%) |
| 5 to 17 Years | 221 (9.6%) | 307 (14.2%) |
| 18 to 34 Years | 280 (10.1%) | 109 (4.2%) |
| 35 to 64 Years | 557 (10.7%) | 1,003 (17.6%) |
| 65 to 74 Years | 373 (24.9%) | 300 (18.6%) |
| 75 Years and over | 244 (29.6%) | 742 (68.4%) |
Disability Class by Sex by Age in Monroe County
Disability Class: Hearing Difficulty

| Age Bracket | Male | Female |
| Under 5 Years | 0 (0.0%) | 0 (0.0%) |
| 5 to 17 Years | 0 (0.0%) | 0 (0.0%) |
| 18 to 34 Years | 127 (4.6%) | 46 (1.8%) |
| 35 to 64 Years | 256 (4.9%) | 131 (2.3%) |
| 65 to 74 Years | 263 (17.5%) | 32 (2.0%) |
| 75 Years and over | 73 (8.9%) | 105 (9.7%) |
Disability Class: Vision Difficulty
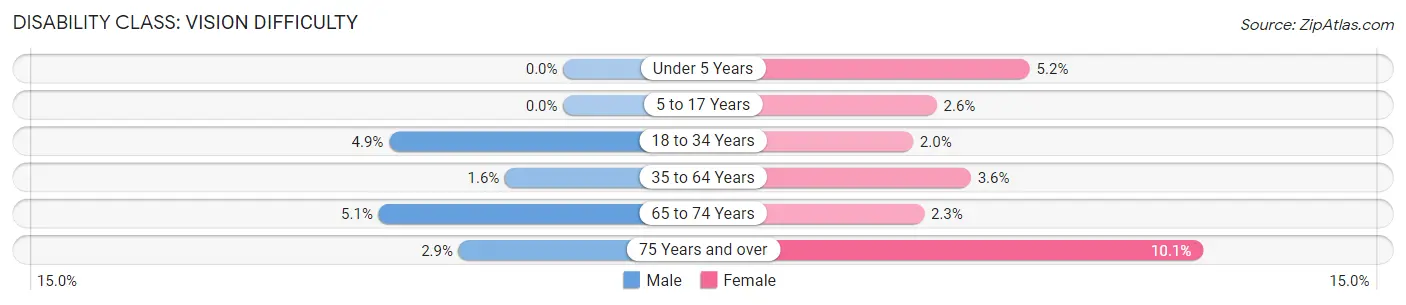
| Age Bracket | Male | Female |
| Under 5 Years | 0 (0.0%) | 34 (5.2%) |
| 5 to 17 Years | 0 (0.0%) | 57 (2.6%) |
| 18 to 34 Years | 135 (4.9%) | 51 (2.0%) |
| 35 to 64 Years | 84 (1.6%) | 205 (3.6%) |
| 65 to 74 Years | 77 (5.1%) | 37 (2.3%) |
| 75 Years and over | 24 (2.9%) | 109 (10.1%) |
Disability Class: Cognitive Difficulty
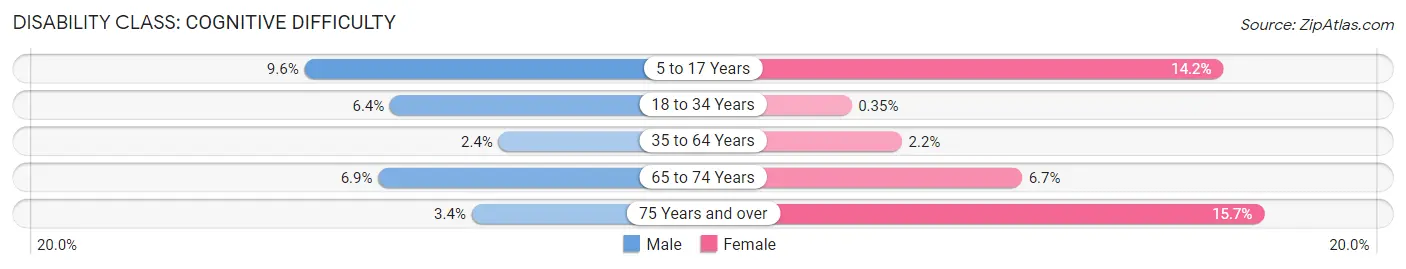
| Age Bracket | Male | Female |
| 5 to 17 Years | 221 (9.6%) | 306 (14.2%) |
| 18 to 34 Years | 179 (6.4%) | 9 (0.4%) |
| 35 to 64 Years | 125 (2.4%) | 127 (2.2%) |
| 65 to 74 Years | 103 (6.9%) | 108 (6.7%) |
| 75 Years and over | 28 (3.4%) | 170 (15.7%) |
Disability Class: Ambulatory Difficulty
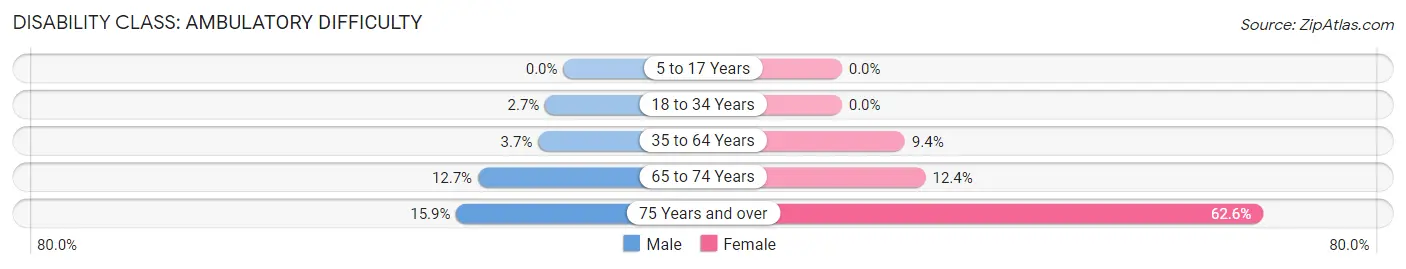
| Age Bracket | Male | Female |
| 5 to 17 Years | 0 (0.0%) | 0 (0.0%) |
| 18 to 34 Years | 75 (2.7%) | 0 (0.0%) |
| 35 to 64 Years | 194 (3.7%) | 535 (9.4%) |
| 65 to 74 Years | 190 (12.7%) | 201 (12.4%) |
| 75 Years and over | 131 (15.9%) | 678 (62.5%) |
Disability Class: Self-Care Difficulty

| Age Bracket | Male | Female |
| 5 to 17 Years | 0 (0.0%) | 0 (0.0%) |
| 18 to 34 Years | 23 (0.8%) | 3 (0.1%) |
| 35 to 64 Years | 46 (0.9%) | 61 (1.1%) |
| 65 to 74 Years | 70 (4.7%) | 114 (7.0%) |
| 75 Years and over | 29 (3.5%) | 133 (12.3%) |
Technology Access in Monroe County
Computing Device Access in Monroe County
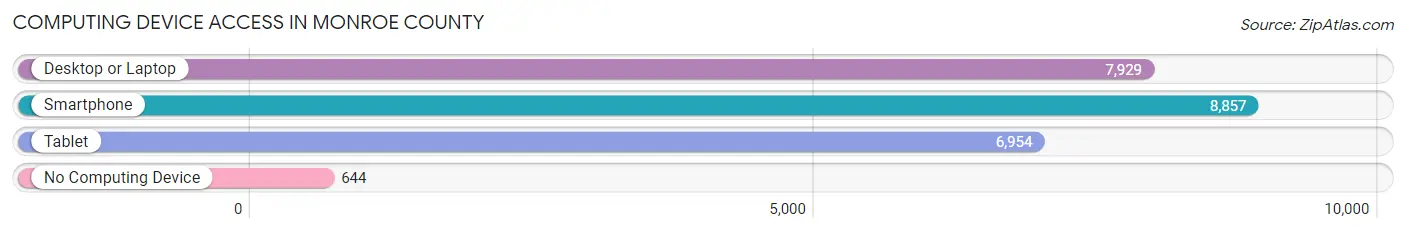
| Device Type | # Households | % Households |
| Desktop or Laptop | 7,929 | 77.4% |
| Smartphone | 8,857 | 86.4% |
| Tablet | 6,954 | 67.9% |
| No Computing Device | 644 | 6.3% |
| Total | 10,248 | 100.0% |
Internet Access in Monroe County

| Internet Type | # Households | % Households |
| Dial-Up Internet | 15 | 0.2% |
| Broadband Home | 5,956 | 58.1% |
| Cellular Data Only | 1,774 | 17.3% |
| Satellite Internet | 1,797 | 17.5% |
| No Internet | 1,314 | 12.8% |
| Total | 10,248 | 100.0% |
Monroe County Summary
Monroe County, Georgia is located in the central part of the state, approximately 50 miles southeast of Atlanta. It is bordered by Butts County to the north, Lamar County to the east, Upson County to the south, and Bibb County to the west. The county seat is Forsyth, and the county is named for James Monroe, the fifth President of the United States.
Geography
Monroe County covers an area of 441 square miles, of which 437 square miles is land and 4 square miles is water. The county is located in the Piedmont region of Georgia, and is characterized by rolling hills and valleys. The Flint River runs through the county, and there are several small lakes and ponds. The highest point in the county is located at an elevation of 890 feet, and the lowest point is at an elevation of 495 feet.
Demographics
As of the 2010 census, Monroe County had a population of 26,424. The racial makeup of the county was 68.2% White, 28.3% African American, 0.4% Native American, 0.7% Asian, 0.1% Pacific Islander, 0.7% from other races, and 1.6% from two or more races. Hispanic or Latino of any race were 2.3% of the population.
The median household income in Monroe County was $41,945, and the median family income was $50,945. The per capita income was $20,945. About 17.2% of the population was below the poverty line.
Economy
Monroe County’s economy is largely based on agriculture, with the main crops being cotton, corn, soybeans, and peanuts. The county also has a thriving timber industry, and there are several manufacturing plants in the area. The county is home to several large employers, including the Monroe County Hospital, the Monroe County Board of Education, and the Monroe County Sheriff’s Office.
History
Monroe County was created in 1821 from parts of Bibb, Jones, and Upson counties. The county was named for James Monroe, the fifth President of the United States. The county seat was originally located in Forsyth, but was moved to Forsyth in 1825.
The county was largely agricultural in the 19th century, and the population grew steadily throughout the century. The county was home to several Confederate military units during the Civil War, and the county was the site of several battles.
In the 20th century, the county’s economy shifted from agriculture to manufacturing, and the population continued to grow. The county was also home to several notable figures, including civil rights leader Hosea Williams and author Carson McCullers.
Today, Monroe County is a thriving community with a diverse economy and a strong sense of community. The county is home to several parks and recreational areas, and is a popular destination for outdoor enthusiasts. The county is also home to several historic sites, including the Monroe County Courthouse and the Monroe County Jail.
Common Questions
What is the Total Population of Monroe County?
Total Population of Monroe County is 28,287.
What is the Total Male Population of Monroe County?
Total Male Population of Monroe County is 14,308.
What is the Total Female Population of Monroe County?
Total Female Population of Monroe County is 13,979.
What is the Ratio of Males per 100 Females in Monroe County?
There are 102.35 Males per 100 Females in Monroe County.
What is the Ratio of Females per 100 Males in Monroe County?
There are 97.70 Females per 100 Males in Monroe County.
What is the Median Population Age in Monroe County?
Median Population Age in Monroe County is 42.6 Years.
What is the Average Family Size in Monroe County
Average Family Size in Monroe County is 3.2 People.
What is the Average Household Size in Monroe County
Average Household Size in Monroe County is 2.6 People.
What is Per Capita Income in Monroe County?
Per Capita income in Monroe County is $40,063.
What is the Median Family Income in Monroe County?
Median Family Income in Monroe County is $92,679.
What is the Median Household income in Monroe County?
Median Household Income in Monroe County is $74,867.
What is Income or Wage Gap in Monroe County?
Income or Wage Gap in Monroe County is 34.0%.
Women in Monroe County earn 66.0 cents for every dollar earned by a man.
What is Family Income Deficit in Monroe County?
Family Income Deficit in Monroe County is $9,520.
Families that are below poverty line in Monroe County earn $9,520 less on average than the poverty threshold level.
What is Inequality or Gini Index in Monroe County?
Inequality or Gini Index in Monroe County is 0.48.
How Large is the Labor Force in Monroe County?
There are 13,689 People in the Labor Forcein in Monroe County.
What is the Percentage of People in the Labor Force in Monroe County?
59.0% of People are in the Labor Force in Monroe County.
What is the Unemployment Rate in Monroe County?
Unemployment Rate in Monroe County is 3.8%.