Jeff Davis County, GA
Jeff Davis County Map
Jeff Davis County Overview
14,791
TOTAL POPULATION
7,389
MALE POPULATION
7,402
FEMALE POPULATION
99.82
MALES / 100 FEMALES
100.18
FEMALES / 100 MALES
39.1
MEDIAN AGE
3.4
AVG FAMILY SIZE
2.7
AVG HOUSEHOLD SIZE
$22,065
PER CAPITA INCOME
$52,236
AVG FAMILY INCOME
$41,780
AVG HOUSEHOLD INCOME
21.8%
WAGE / INCOME GAP [ % ]
78.2¢/ $1
WAGE / INCOME GAP [ $ ]
$11,451
FAMILY INCOME DEFICIT
0.46
INEQUALITY / GINI INDEX
6,066
LABOR FORCE [ PEOPLE ]
52.5%
PERCENT IN LABOR FORCE
4.1%
UNEMPLOYMENT RATE
Jeff Davis County Area Codes
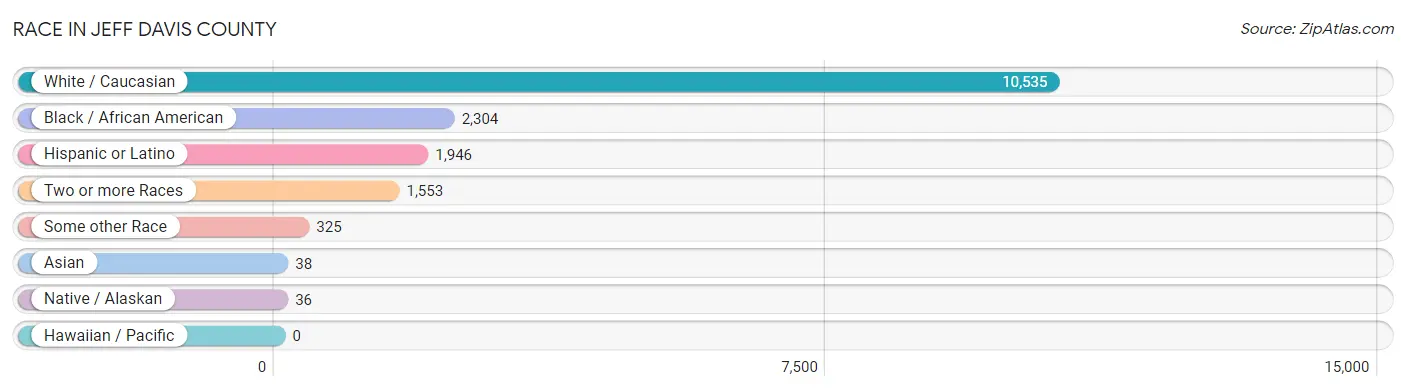
Race in Jeff Davis County
The most populous races in Jeff Davis County are White / Caucasian (10,535 | 71.2%), Black / African American (2,304 | 15.6%), and Hispanic or Latino (1,946 | 13.2%).
| Race | # Population | % Population |
| Asian | 38 | 0.3% |
| Black / African American | 2,304 | 15.6% |
| Hawaiian / Pacific | 0 | 0.0% |
| Hispanic or Latino | 1,946 | 13.2% |
| Native / Alaskan | 36 | 0.2% |
| White / Caucasian | 10,535 | 71.2% |
| Two or more Races | 1,553 | 10.5% |
| Some other Race | 325 | 2.2% |
| Total | 14,791 | 100.0% |
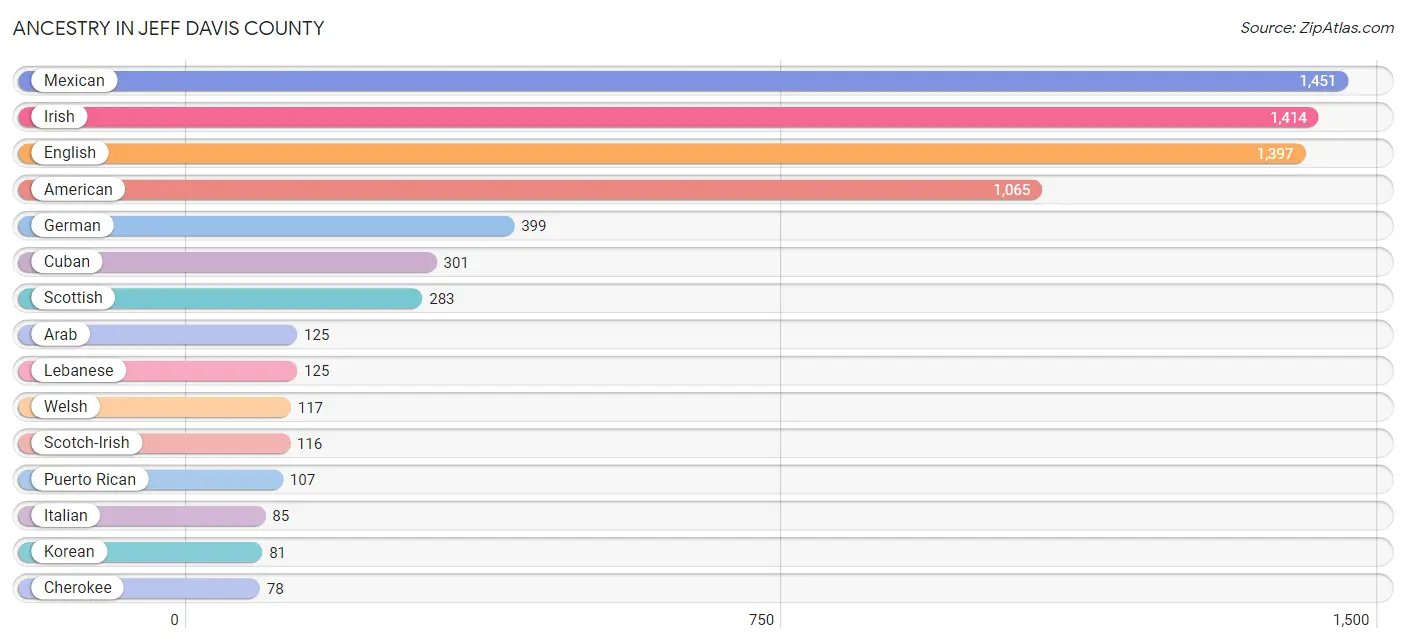
Ancestry in Jeff Davis County
The most populous ancestries reported in Jeff Davis County are Mexican (1,451 | 9.8%), Irish (1,414 | 9.6%), English (1,397 | 9.4%), American (1,065 | 7.2%), and German (399 | 2.7%), together accounting for 38.7% of all Jeff Davis County residents.
| Ancestry | # Population | % Population |
| American | 1,065 | 7.2% |
| Arab | 125 | 0.9% |
| Blackfeet | 3 | 0.0% |
| British | 1 | 0.0% |
| Burmese | 10 | 0.1% |
| Cajun | 49 | 0.3% |
| Central American | 24 | 0.2% |
| Cherokee | 78 | 0.5% |
| Cuban | 301 | 2.0% |
| Czech | 19 | 0.1% |
| Eastern European | 19 | 0.1% |
| English | 1,397 | 9.4% |
| European | 67 | 0.4% |
| French | 40 | 0.3% |
| German | 399 | 2.7% |
| Honduran | 24 | 0.2% |
| Indian (Asian) | 20 | 0.1% |
| Irish | 1,414 | 9.6% |
| Italian | 85 | 0.6% |
| Korean | 81 | 0.5% |
| Lebanese | 125 | 0.9% |
| Mexican | 1,451 | 9.8% |
| Mexican American Indian | 27 | 0.2% |
| Nigerian | 20 | 0.1% |
| Norwegian | 12 | 0.1% |
| Polish | 22 | 0.2% |
| Puerto Rican | 107 | 0.7% |
| Scotch-Irish | 116 | 0.8% |
| Scottish | 283 | 1.9% |
| Spanish | 63 | 0.4% |
| Subsaharan African | 20 | 0.1% |
| Swedish | 38 | 0.3% |
| Swiss | 11 | 0.1% |
| Thai | 14 | 0.1% |
| Welsh | 117 | 0.8% |
| West Indian | 20 | 0.1% | View All 36 Rows |
Immigrants in Jeff Davis County
The most numerous immigrant groups reported in Jeff Davis County came from Central America (484 | 3.3%), Latin America (484 | 3.3%), Mexico (460 | 3.1%), Asia (25 | 0.2%), and Honduras (24 | 0.2%), together accounting for 10.0% of all Jeff Davis County residents.

| Immigration Origin | # Population | % Population |
| Asia | 25 | 0.2% |
| Central America | 484 | 3.3% |
| China | 4 | 0.0% |
| Eastern Asia | 8 | 0.1% |
| Honduras | 24 | 0.2% |
| India | 14 | 0.1% |
| Korea | 4 | 0.0% |
| Latin America | 484 | 3.3% |
| Mexico | 460 | 3.1% |
| Oceania | 11 | 0.1% |
| Philippines | 3 | 0.0% |
| South Central Asia | 14 | 0.1% |
| South Eastern Asia | 3 | 0.0% |
| Taiwan | 4 | 0.0% | View All 14 Rows |
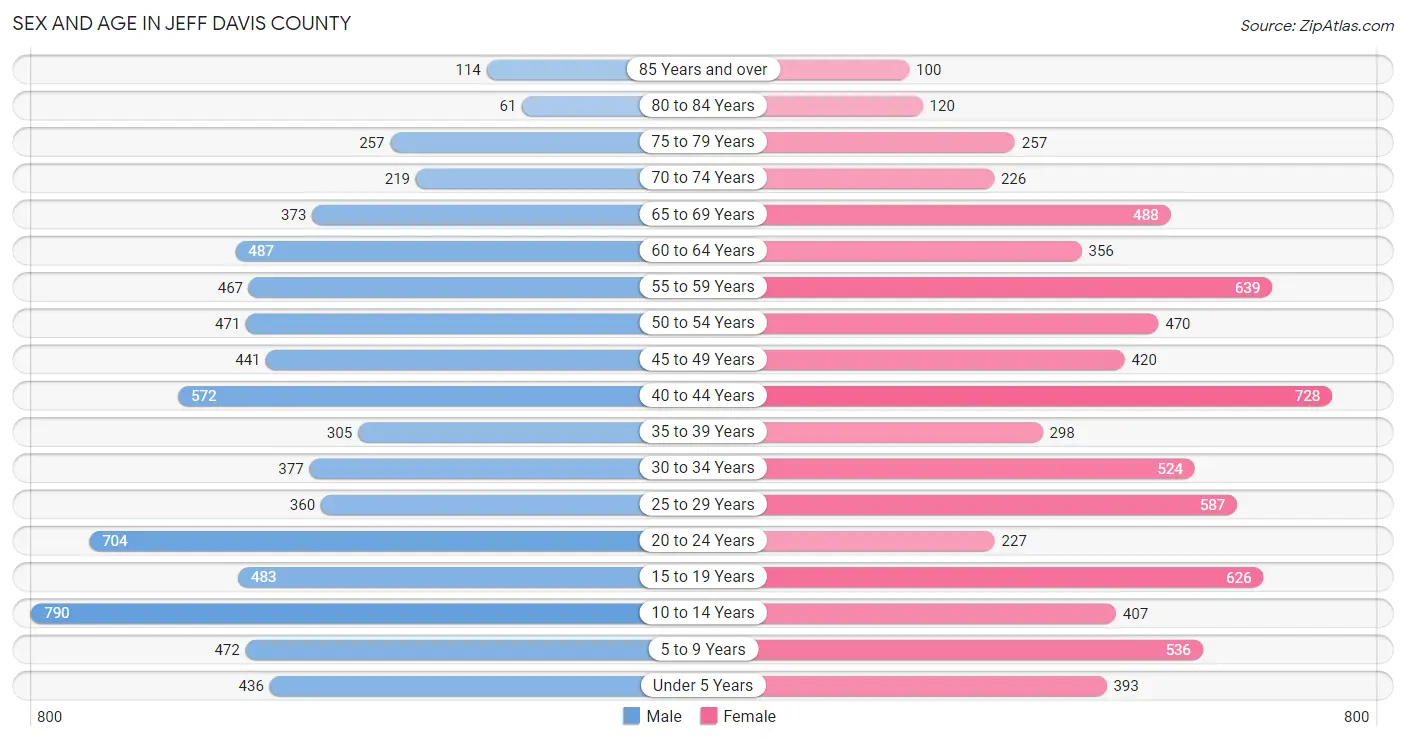
Sex and Age in Jeff Davis County
Sex and Age in Jeff Davis County
The most populous age groups in Jeff Davis County are 10 to 14 Years (790 | 10.7%) for men and 40 to 44 Years (728 | 9.8%) for women.
| Age Bracket | Male | Female |
| Under 5 Years | 436 (5.9%) | 393 (5.3%) |
| 5 to 9 Years | 472 (6.4%) | 536 (7.2%) |
| 10 to 14 Years | 790 (10.7%) | 407 (5.5%) |
| 15 to 19 Years | 483 (6.5%) | 626 (8.5%) |
| 20 to 24 Years | 704 (9.5%) | 227 (3.1%) |
| 25 to 29 Years | 360 (4.9%) | 587 (7.9%) |
| 30 to 34 Years | 377 (5.1%) | 524 (7.1%) |
| 35 to 39 Years | 305 (4.1%) | 298 (4.0%) |
| 40 to 44 Years | 572 (7.7%) | 728 (9.8%) |
| 45 to 49 Years | 441 (6.0%) | 420 (5.7%) |
| 50 to 54 Years | 471 (6.4%) | 470 (6.4%) |
| 55 to 59 Years | 467 (6.3%) | 639 (8.6%) |
| 60 to 64 Years | 487 (6.6%) | 356 (4.8%) |
| 65 to 69 Years | 373 (5.1%) | 488 (6.6%) |
| 70 to 74 Years | 219 (3.0%) | 226 (3.0%) |
| 75 to 79 Years | 257 (3.5%) | 257 (3.5%) |
| 80 to 84 Years | 61 (0.8%) | 120 (1.6%) |
| 85 Years and over | 114 (1.5%) | 100 (1.3%) |
| Total | 7,389 (100.0%) | 7,402 (100.0%) |
Families and Households in Jeff Davis County
Median Family Size in Jeff Davis County
The median family size in Jeff Davis County is 3.40 persons per family, with married-couple families (2,436 | 67.8%) accounting for the largest median family size of 3.5 persons per family. On the other hand, single male/father families (173 | 4.8%) represent the smallest median family size with 2.69 persons per family.

| Family Type | # Families | Family Size |
| Married-Couple | 2,436 (67.8%) | 3.50 |
| Single Male/Father | 173 (4.8%) | 2.69 |
| Single Female/Mother | 983 (27.4%) | 3.27 |
| Total Families | 3,592 (100.0%) | 3.40 |
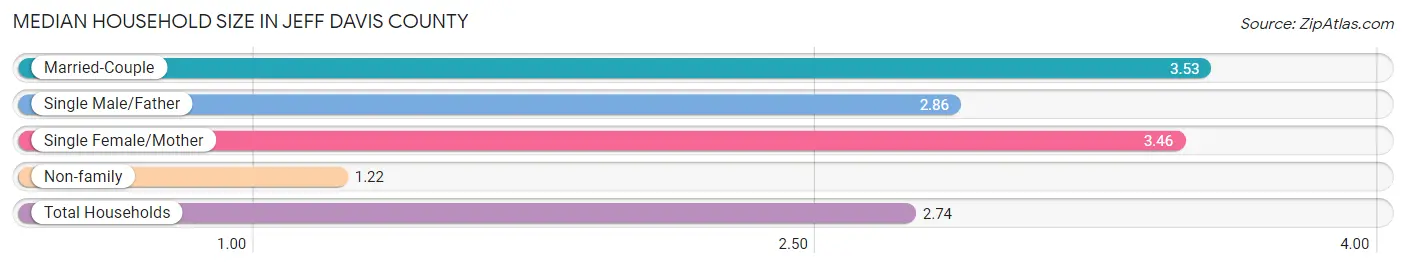
Median Household Size in Jeff Davis County
The median household size in Jeff Davis County is 2.74 persons per household, with married-couple households (2,436 | 45.4%) accounting for the largest median household size of 3.53 persons per household. non-family households (1,773 | 33.1%) represent the smallest median household size with 1.22 persons per household.
| Household Type | # Households | Household Size |
| Married-Couple | 2,436 (45.4%) | 3.53 |
| Single Male/Father | 173 (3.2%) | 2.86 |
| Single Female/Mother | 983 (18.3%) | 3.46 |
| Non-family | 1,773 (33.1%) | 1.22 |
| Total Households | 5,365 (100.0%) | 2.74 |
Household Size by Marriage Status in Jeff Davis County
Out of a total of 5,365 households in Jeff Davis County, 3,592 (66.9%) are family households, while 1,773 (33.1%) are nonfamily households. The most numerous type of family households are 2-person households, comprising 1,310, and the most common type of nonfamily households are 1-person households, comprising 1,447.

| Household Size | Family Households | Nonfamily Households |
| 1-Person Households | - | 1,447 (27.0%) |
| 2-Person Households | 1,310 (24.4%) | 326 (6.1%) |
| 3-Person Households | 995 (18.5%) | 0 (0.0%) |
| 4-Person Households | 545 (10.2%) | 0 (0.0%) |
| 5-Person Households | 566 (10.5%) | 0 (0.0%) |
| 6-Person Households | 93 (1.7%) | 0 (0.0%) |
| 7+ Person Households | 83 (1.5%) | 0 (0.0%) |
| Total | 3,592 (66.9%) | 1,773 (33.1%) |
Female Fertility in Jeff Davis County
Fertility by Age in Jeff Davis County
Average fertility rate in Jeff Davis County is 37.0 births per 1,000 women. Women in the age bracket of 20 to 34 years have the highest fertility rate with 96.0 births per 1,000 women. Women in the age bracket of 20 to 34 years acount for 100.0% of all women with births.

| Age Bracket | Women with Births | Births / 1,000 Women |
| 15 to 19 years | 0 (0.0%) | 0.0 |
| 20 to 34 years | 129 (100.0%) | 96.0 |
| 35 to 50 years | 0 (0.0%) | 0.0 |
| Total | 129 (100.0%) | 37.0 |
Fertility by Age by Marriage Status in Jeff Davis County
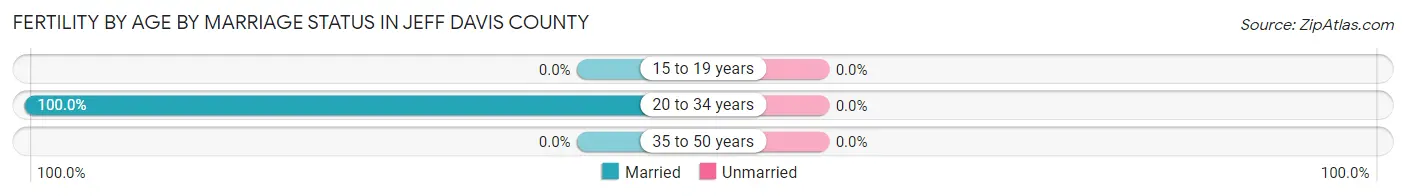
| Age Bracket | Married | Unmarried |
| 15 to 19 years | 0 (0.0%) | 0 (0.0%) |
| 20 to 34 years | 129 (100.0%) | 0 (0.0%) |
| 35 to 50 years | 0 (0.0%) | 0 (0.0%) |
| Total | 129 (100.0%) | 0 (0.0%) |
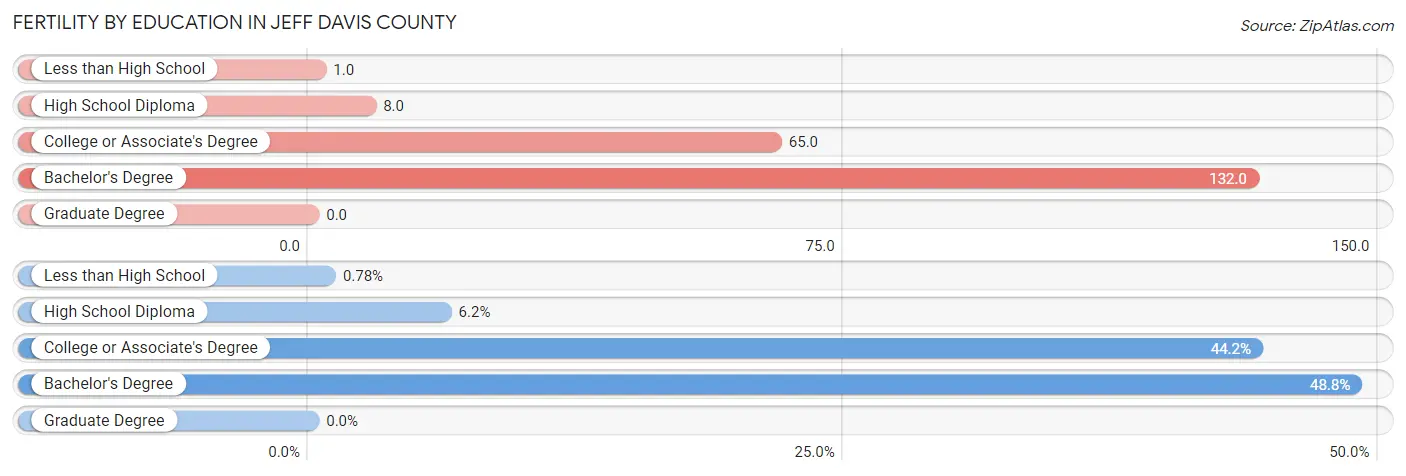
Fertility by Education in Jeff Davis County
| Educational Attainment | Women with Births | Births / 1,000 Women |
| Less than High School | 1 (0.8%) | 1.0 |
| High School Diploma | 8 (6.2%) | 8.0 |
| College or Associate's Degree | 57 (44.2%) | 65.0 |
| Bachelor's Degree | 63 (48.8%) | 132.0 |
| Graduate Degree | 0 (0.0%) | 0.0 |
| Total | 129 (100.0%) | 37.0 |
Fertility by Education by Marriage Status in Jeff Davis County
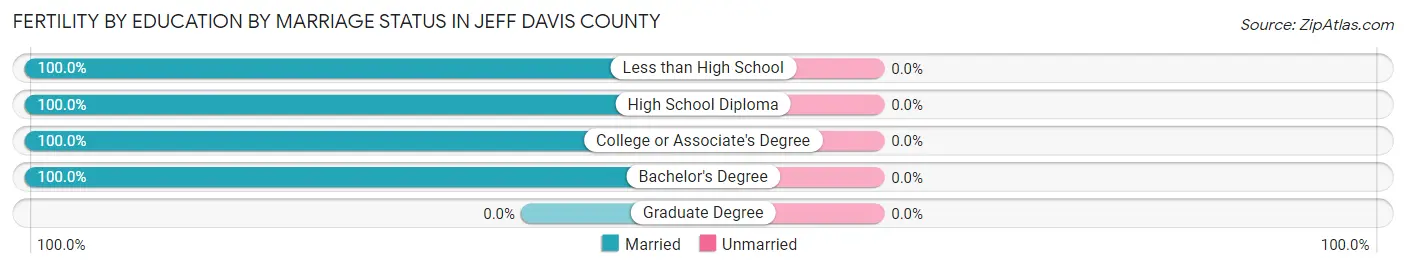
| Educational Attainment | Married | Unmarried |
| Less than High School | 1 (100.0%) | 0 (0.0%) |
| High School Diploma | 8 (100.0%) | 0 (0.0%) |
| College or Associate's Degree | 57 (100.0%) | 0 (0.0%) |
| Bachelor's Degree | 63 (100.0%) | 0 (0.0%) |
| Graduate Degree | 0 (0.0%) | 0 (0.0%) |
| Total | 129 (100.0%) | 0 (0.0%) |
Income in Jeff Davis County
Income Overview in Jeff Davis County
Per Capita Income in Jeff Davis County is $22,065, while median incomes of families and households are $52,236 and $41,780 respectively.
| Characteristic | Number | Measure |
| Per Capita Income | 14,791 | $22,065 |
| Median Family Income | 3,592 | $52,236 |
| Mean Family Income | 3,592 | $66,783 |
| Median Household Income | 5,365 | $41,780 |
| Mean Household Income | 5,365 | $56,898 |
| Income Deficit | 3,592 | $11,451 |
| Wage / Income Gap (%) | 14,791 | 21.77% |
| Wage / Income Gap ($) | 14,791 | 78.23¢ per $1 |
| Gini / Inequality Index | 14,791 | 0.46 |
Earnings by Sex in Jeff Davis County
Average Earnings in Jeff Davis County are $35,775, $40,450 for men and $31,646 for women, a difference of 21.8%.
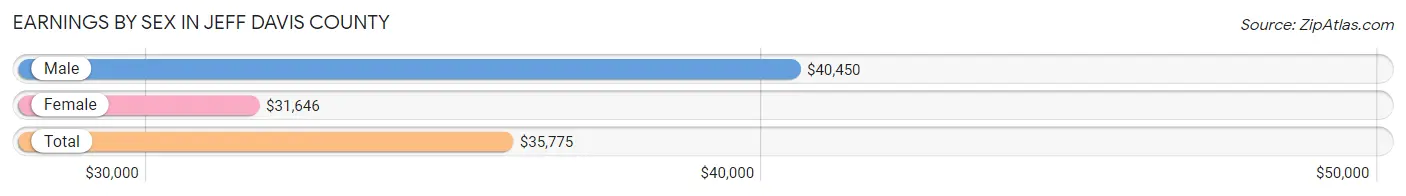
| Sex | Number | Average Earnings |
| Male | 3,205 (52.1%) | $40,450 |
| Female | 2,948 (47.9%) | $31,646 |
| Total | 6,153 (100.0%) | $35,775 |
Earnings by Sex by Income Bracket in Jeff Davis County
The most common earnings brackets in Jeff Davis County are $50,000 to $54,999 for men (340 | 10.6%) and $50,000 to $54,999 for women (320 | 10.8%).
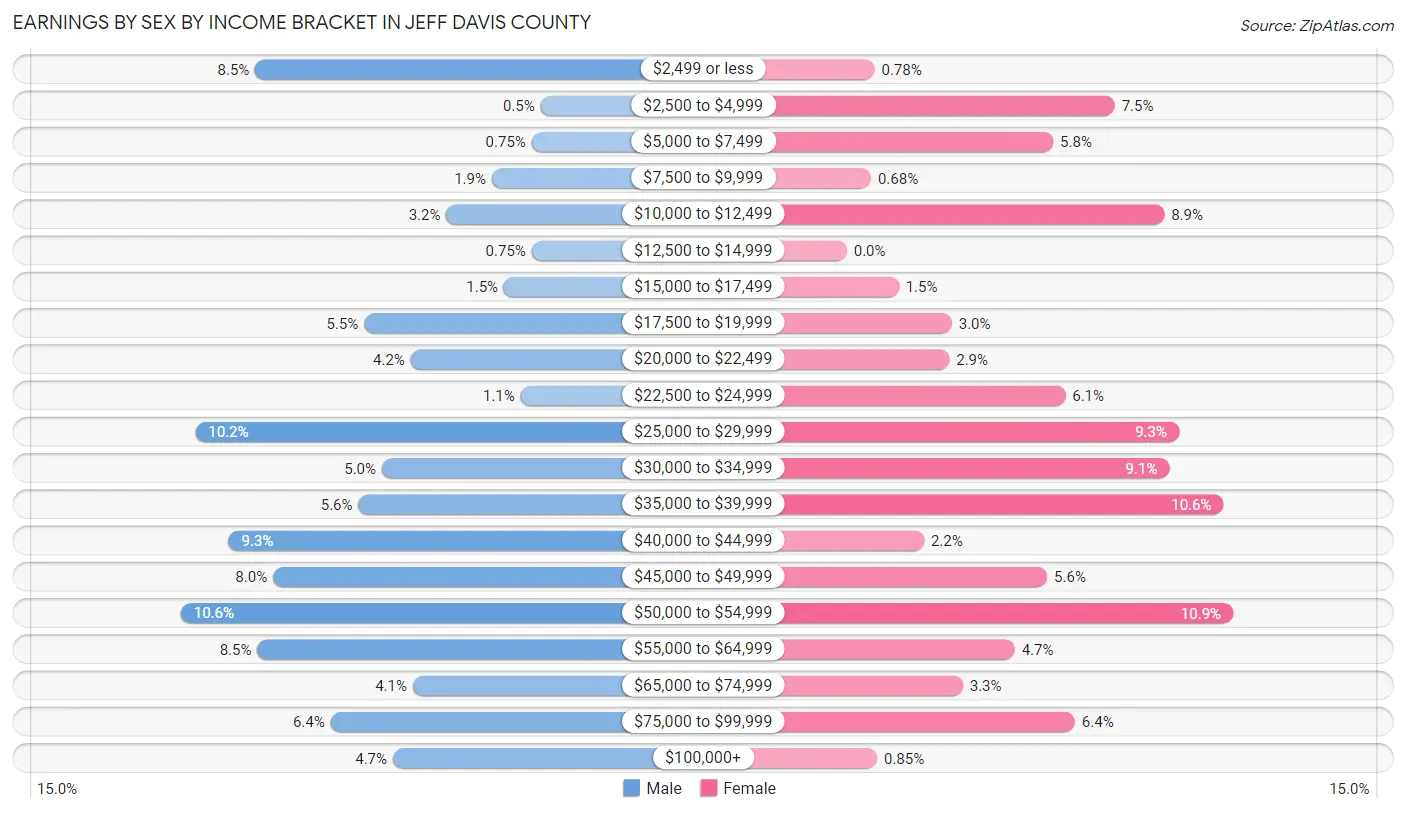
| Income | Male | Female |
| $2,499 or less | 273 (8.5%) | 23 (0.8%) |
| $2,500 to $4,999 | 16 (0.5%) | 222 (7.5%) |
| $5,000 to $7,499 | 24 (0.7%) | 171 (5.8%) |
| $7,500 to $9,999 | 60 (1.9%) | 20 (0.7%) |
| $10,000 to $12,499 | 101 (3.2%) | 263 (8.9%) |
| $12,500 to $14,999 | 24 (0.7%) | 0 (0.0%) |
| $15,000 to $17,499 | 49 (1.5%) | 43 (1.5%) |
| $17,500 to $19,999 | 175 (5.5%) | 87 (2.9%) |
| $20,000 to $22,499 | 133 (4.2%) | 85 (2.9%) |
| $22,500 to $24,999 | 34 (1.1%) | 181 (6.1%) |
| $25,000 to $29,999 | 327 (10.2%) | 275 (9.3%) |
| $30,000 to $34,999 | 159 (5.0%) | 267 (9.1%) |
| $35,000 to $39,999 | 180 (5.6%) | 312 (10.6%) |
| $40,000 to $44,999 | 297 (9.3%) | 64 (2.2%) |
| $45,000 to $49,999 | 257 (8.0%) | 166 (5.6%) |
| $50,000 to $54,999 | 340 (10.6%) | 320 (10.8%) |
| $55,000 to $64,999 | 271 (8.5%) | 139 (4.7%) |
| $65,000 to $74,999 | 131 (4.1%) | 96 (3.3%) |
| $75,000 to $99,999 | 205 (6.4%) | 189 (6.4%) |
| $100,000+ | 149 (4.6%) | 25 (0.9%) |
| Total | 3,205 (100.0%) | 2,948 (100.0%) |
Earnings by Sex by Educational Attainment in Jeff Davis County
Average earnings in Jeff Davis County are $43,258 for men and $33,303 for women, a difference of 23.0%. Men with an educational attainment of graduate degree enjoy the highest average annual earnings of $115,515, while those with high school diploma education earn the least with $41,388. Women with an educational attainment of graduate degree earn the most with the average annual earnings of $53,611, while those with less than high school education have the smallest earnings of $11,852.

| Educational Attainment | Male Income | Female Income |
| Less than High School | $41,951 | $11,852 |
| High School Diploma | $41,388 | $30,909 |
| College or Associate's Degree | $47,857 | $32,201 |
| Bachelor's Degree | $85,417 | $51,364 |
| Graduate Degree | $115,515 | $53,611 |
| Total | $43,258 | $33,303 |
Family Income in Jeff Davis County
Family Income Brackets in Jeff Davis County
According to the Jeff Davis County family income data, there are 772 families falling into the $50,000 to $74,999 income range, which is the most common income bracket and makes up 21.5% of all families. Conversely, the $200,000+ income bracket is the least frequent group with only 75 families (2.1%) belonging to this category.
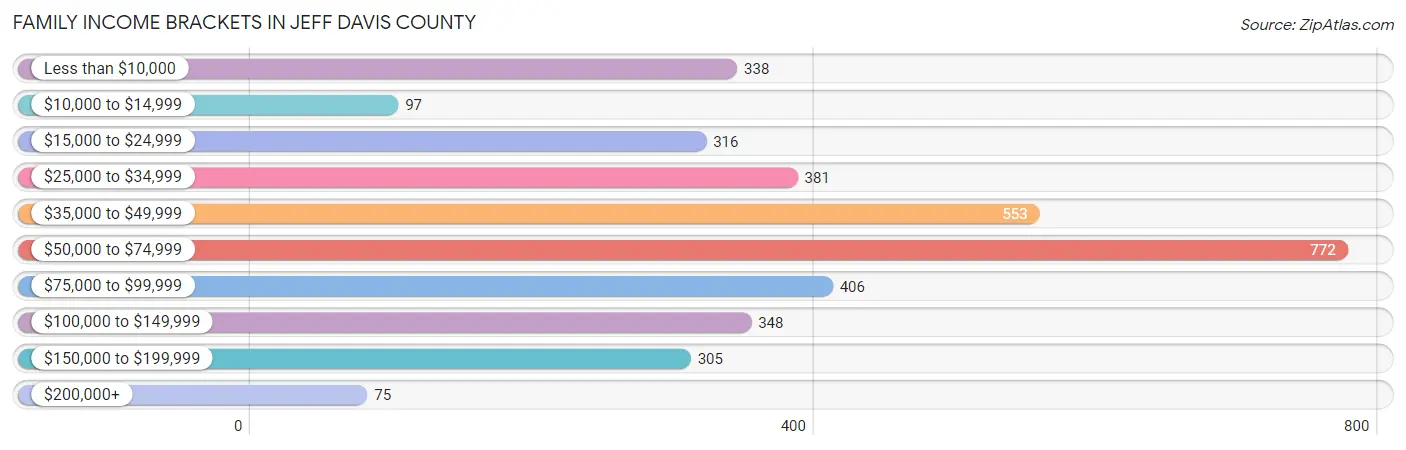
| Income Bracket | # Families | % Families |
| Less than $10,000 | 338 | 9.4% |
| $10,000 to $14,999 | 97 | 2.7% |
| $15,000 to $24,999 | 316 | 8.8% |
| $25,000 to $34,999 | 381 | 10.6% |
| $35,000 to $49,999 | 553 | 15.4% |
| $50,000 to $74,999 | 772 | 21.5% |
| $75,000 to $99,999 | 406 | 11.3% |
| $100,000 to $149,999 | 348 | 9.7% |
| $150,000 to $199,999 | 305 | 8.5% |
| $200,000+ | 75 | 2.1% |
Family Income by Famaliy Size in Jeff Davis County
4-person families (556 | 15.5%) account for the highest median family income in Jeff Davis County with $62,083 per family, while 2-person families (1,420 | 39.5%) have the highest median income of $25,265 per family member.
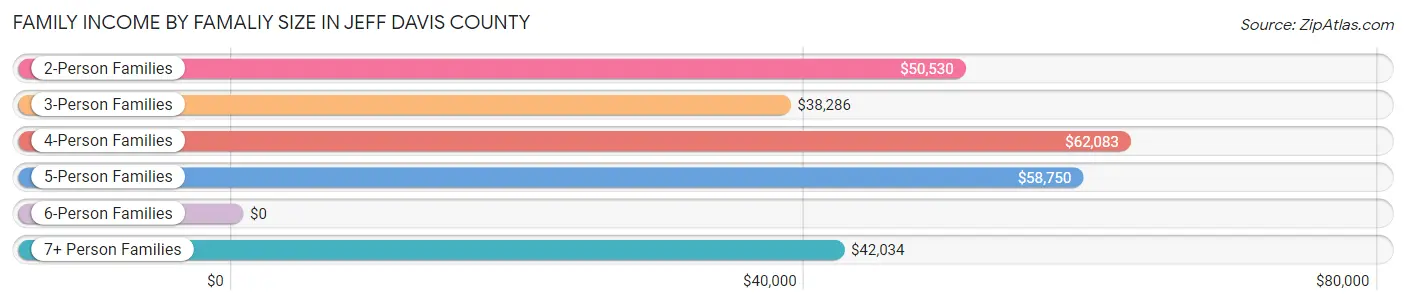
| Income Bracket | # Families | Median Income |
| 2-Person Families | 1,420 (39.5%) | $50,530 |
| 3-Person Families | 920 (25.6%) | $38,286 |
| 4-Person Families | 556 (15.5%) | $62,083 |
| 5-Person Families | 574 (16.0%) | $58,750 |
| 6-Person Families | 39 (1.1%) | $0 |
| 7+ Person Families | 83 (2.3%) | $42,034 |
| Total | 3,592 (100.0%) | $52,236 |
Family Income by Number of Earners in Jeff Davis County
The median family income in Jeff Davis County is $52,236, with families comprising 2 earners (1,180) having the highest median family income of $86,686, while families with no earners (871) have the lowest median family income of $19,750, accounting for 32.9% and 24.2% of families, respectively.
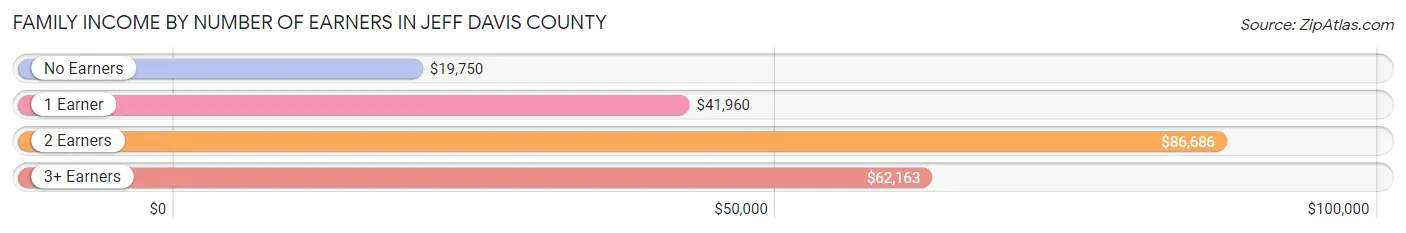
| Number of Earners | # Families | Median Income |
| No Earners | 871 (24.2%) | $19,750 |
| 1 Earner | 1,250 (34.8%) | $41,960 |
| 2 Earners | 1,180 (32.9%) | $86,686 |
| 3+ Earners | 291 (8.1%) | $62,163 |
| Total | 3,592 (100.0%) | $52,236 |
Household Income in Jeff Davis County
Household Income Brackets in Jeff Davis County
With 960 households falling in the category, the $50,000 to $74,999 income range is the most frequent in Jeff Davis County, accounting for 17.9% of all households. In contrast, only 75 households (1.4%) fall into the $200,000+ income bracket, making it the least populous group.

| Income Bracket | # Households | % Households |
| Less than $10,000 | 596 | 11.1% |
| $10,000 to $14,999 | 258 | 4.8% |
| $15,000 to $24,999 | 832 | 15.5% |
| $25,000 to $34,999 | 596 | 11.1% |
| $35,000 to $49,999 | 697 | 13.0% |
| $50,000 to $74,999 | 960 | 17.9% |
| $75,000 to $99,999 | 655 | 12.2% |
| $100,000 to $149,999 | 359 | 6.7% |
| $150,000 to $199,999 | 349 | 6.5% |
| $200,000+ | 75 | 1.4% |
Household Income by Householder Age in Jeff Davis County
The median household income in Jeff Davis County is $41,780, with the highest median household income of $52,338 found in the 45 to 64 years age bracket for the primary householder. A total of 2,047 households (38.2%) fall into this category. Meanwhile, the 15 to 24 years age bracket for the primary householder has the lowest median household income of $0, with 35 households (0.6%) in this group.
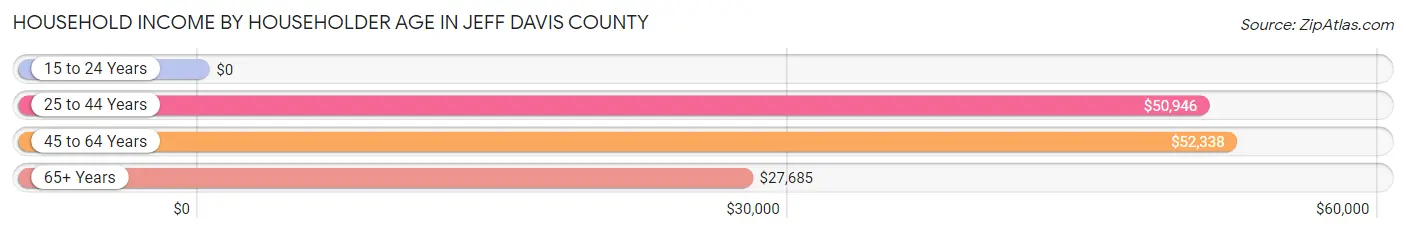
| Income Bracket | # Households | Median Income |
| 15 to 24 Years | 35 (0.6%) | $0 |
| 25 to 44 Years | 1,791 (33.4%) | $50,946 |
| 45 to 64 Years | 2,047 (38.2%) | $52,338 |
| 65+ Years | 1,492 (27.8%) | $27,685 |
| Total | 5,365 (100.0%) | $41,780 |
Poverty in Jeff Davis County
Income Below Poverty by Sex and Age in Jeff Davis County
With 17.4% poverty level for males and 27.8% for females among the residents of Jeff Davis County, 16 and 17 year old males and 6 to 11 year old females are the most vulnerable to poverty, with 120 males (48.4%) and 399 females (58.4%) in their respective age groups living below the poverty level.
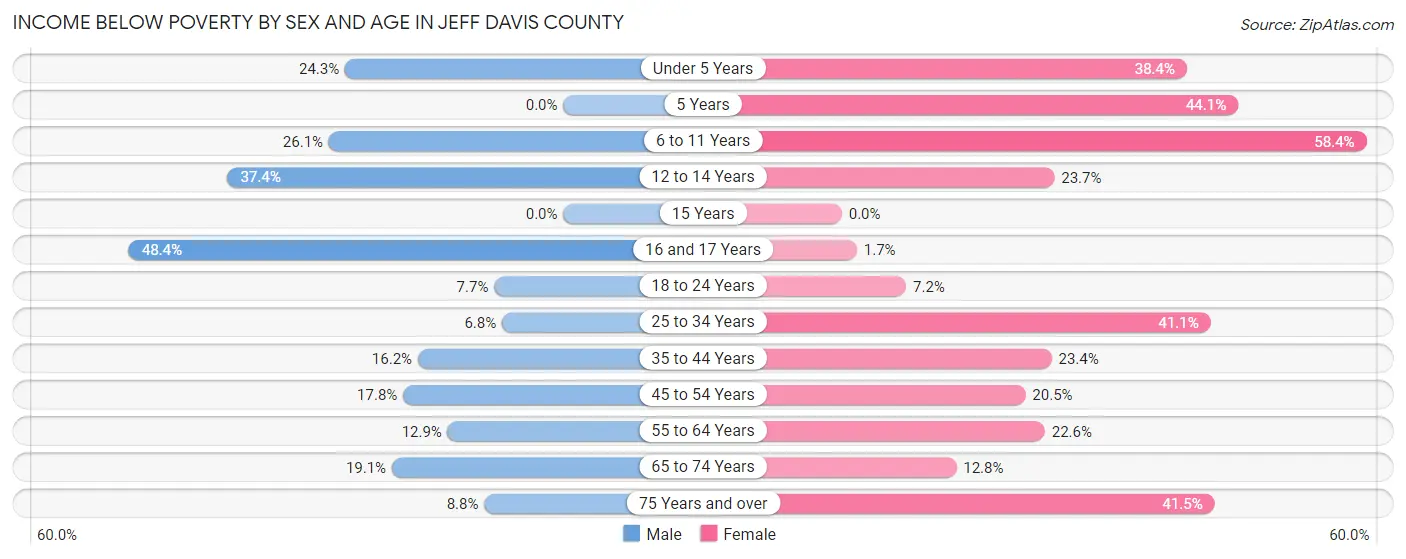
| Age Bracket | Male | Female |
| Under 5 Years | 106 (24.3%) | 151 (38.4%) |
| 5 Years | 0 (0.0%) | 30 (44.1%) |
| 6 to 11 Years | 224 (26.1%) | 399 (58.4%) |
| 12 to 14 Years | 144 (37.4%) | 40 (23.7%) |
| 15 Years | 0 (0.0%) | 0 (0.0%) |
| 16 and 17 Years | 120 (48.4%) | 6 (1.7%) |
| 18 to 24 Years | 60 (7.7%) | 32 (7.2%) |
| 25 to 34 Years | 50 (6.8%) | 455 (41.1%) |
| 35 to 44 Years | 140 (16.2%) | 238 (23.4%) |
| 45 to 54 Years | 162 (17.8%) | 182 (20.4%) |
| 55 to 64 Years | 122 (12.9%) | 225 (22.6%) |
| 65 to 74 Years | 113 (19.1%) | 91 (12.8%) |
| 75 Years and over | 38 (8.8%) | 198 (41.5%) |
| Total | 1,279 (17.4%) | 2,047 (27.8%) |
Income Above Poverty by Sex and Age in Jeff Davis County
According to the poverty statistics in Jeff Davis County, males aged 5 years and females aged 15 years are the age groups that are most secure financially, with 100.0% of males and 100.0% of females in these age groups living above the poverty line.
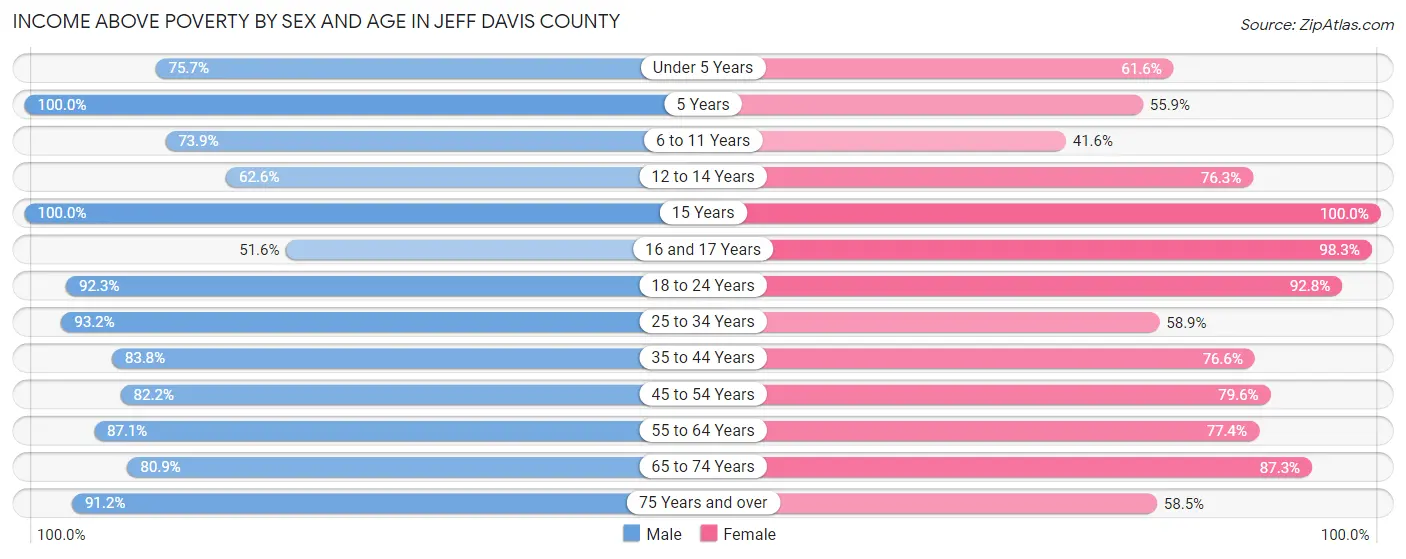
| Age Bracket | Male | Female |
| Under 5 Years | 330 (75.7%) | 242 (61.6%) |
| 5 Years | 19 (100.0%) | 38 (55.9%) |
| 6 to 11 Years | 634 (73.9%) | 284 (41.6%) |
| 12 to 14 Years | 241 (62.6%) | 129 (76.3%) |
| 15 Years | 155 (100.0%) | 48 (100.0%) |
| 16 and 17 Years | 128 (51.6%) | 352 (98.3%) |
| 18 to 24 Years | 719 (92.3%) | 415 (92.8%) |
| 25 to 34 Years | 682 (93.2%) | 653 (58.9%) |
| 35 to 44 Years | 724 (83.8%) | 781 (76.6%) |
| 45 to 54 Years | 746 (82.2%) | 708 (79.5%) |
| 55 to 64 Years | 825 (87.1%) | 770 (77.4%) |
| 65 to 74 Years | 479 (80.9%) | 623 (87.3%) |
| 75 Years and over | 394 (91.2%) | 279 (58.5%) |
| Total | 6,076 (82.6%) | 5,322 (72.2%) |
Income Below Poverty Among Married-Couple Families in Jeff Davis County
The poverty statistics for married-couple families in Jeff Davis County show that 8.9% or 218 of the total 2,436 families live below the poverty line. Families with 5 or more children have the highest poverty rate of 98.1%, comprising of 51 families. On the other hand, families with no children have the lowest poverty rate of 4.6%, which includes 56 families.

| Children | Above Poverty | Below Poverty |
| No Children | 1,160 (95.4%) | 56 (4.6%) |
| 1 or 2 Children | 837 (91.9%) | 74 (8.1%) |
| 3 or 4 Children | 220 (85.6%) | 37 (14.4%) |
| 5 or more Children | 1 (1.9%) | 51 (98.1%) |
| Total | 2,218 (91.0%) | 218 (8.9%) |
Income Below Poverty Among Single-Parent Households in Jeff Davis County
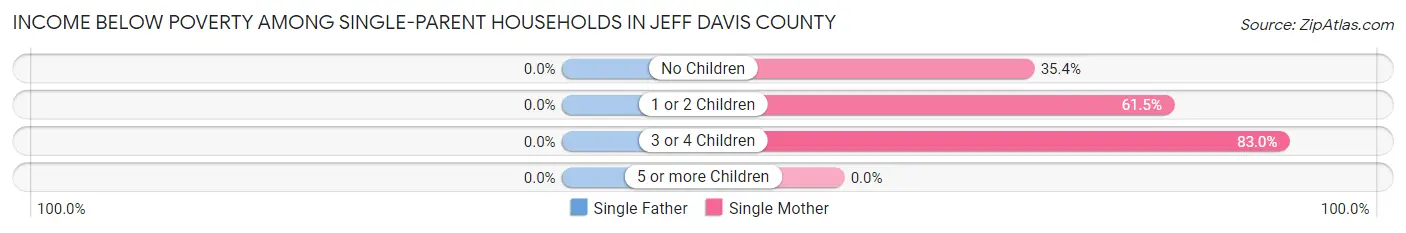
| Children | Single Father | Single Mother |
| No Children | 0 (0.0%) | 80 (35.4%) |
| 1 or 2 Children | 0 (0.0%) | 327 (61.5%) |
| 3 or 4 Children | 0 (0.0%) | 161 (83.0%) |
| 5 or more Children | 0 (0.0%) | 0 (0.0%) |
| Total | 0 (0.0%) | 568 (57.8%) |
Income Below Poverty Among Married-Couple vs Single-Parent Households in Jeff Davis County
The poverty data for Jeff Davis County shows that 218 of the married-couple family households (8.9%) and 568 of the single-parent households (49.1%) are living below the poverty level. Within the married-couple family households, those with 5 or more children have the highest poverty rate, with 51 households (98.1%) falling below the poverty line. Among the single-parent households, those with 3 or 4 children have the highest poverty rate, with 161 household (83.0%) living below poverty.
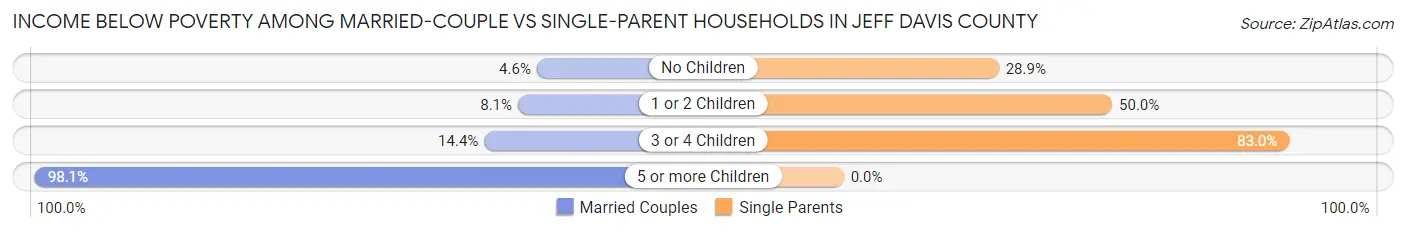
| Children | Married-Couple Families | Single-Parent Households |
| No Children | 56 (4.6%) | 80 (28.9%) |
| 1 or 2 Children | 74 (8.1%) | 327 (50.0%) |
| 3 or 4 Children | 37 (14.4%) | 161 (83.0%) |
| 5 or more Children | 51 (98.1%) | 0 (0.0%) |
| Total | 218 (8.9%) | 568 (49.1%) |
Employment Characteristics in Jeff Davis County
Employment by Class of Employer in Jeff Davis County
Among the 5,757 employed individuals in Jeff Davis County, private company employees (4,494 | 78.1%), local government employees (523 | 9.1%), and self-employed (not incorporated) (209 | 3.6%) make up the most common classes of employment.
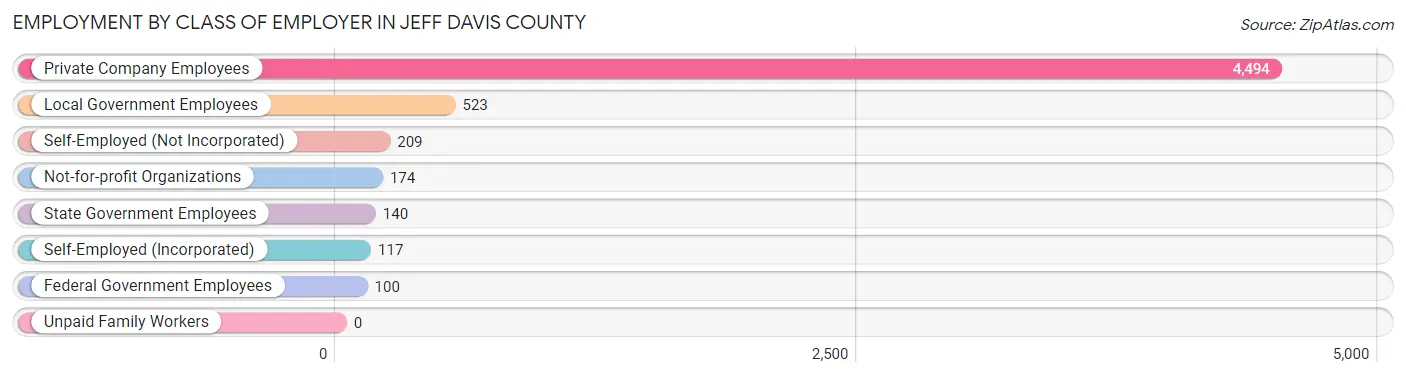
| Employer Class | # Employees | % Employees |
| Private Company Employees | 4,494 | 78.1% |
| Self-Employed (Incorporated) | 117 | 2.0% |
| Self-Employed (Not Incorporated) | 209 | 3.6% |
| Not-for-profit Organizations | 174 | 3.0% |
| Local Government Employees | 523 | 9.1% |
| State Government Employees | 140 | 2.4% |
| Federal Government Employees | 100 | 1.7% |
| Unpaid Family Workers | 0 | 0.0% |
| Total | 5,757 | 100.0% |
Employment Status by Age in Jeff Davis County
According to the labor force statistics for Jeff Davis County, out of the total population over 16 years of age (11,554), 52.5% or 6,066 individuals are in the labor force, with 4.1% or 249 of them unemployed. The age group with the highest labor force participation rate is 30 to 34 years, with 82.0% or 739 individuals in the labor force. Within the labor force, the 60 to 64 years age range has the highest percentage of unemployed individuals, with 14.6% or 75 of them being unemployed.
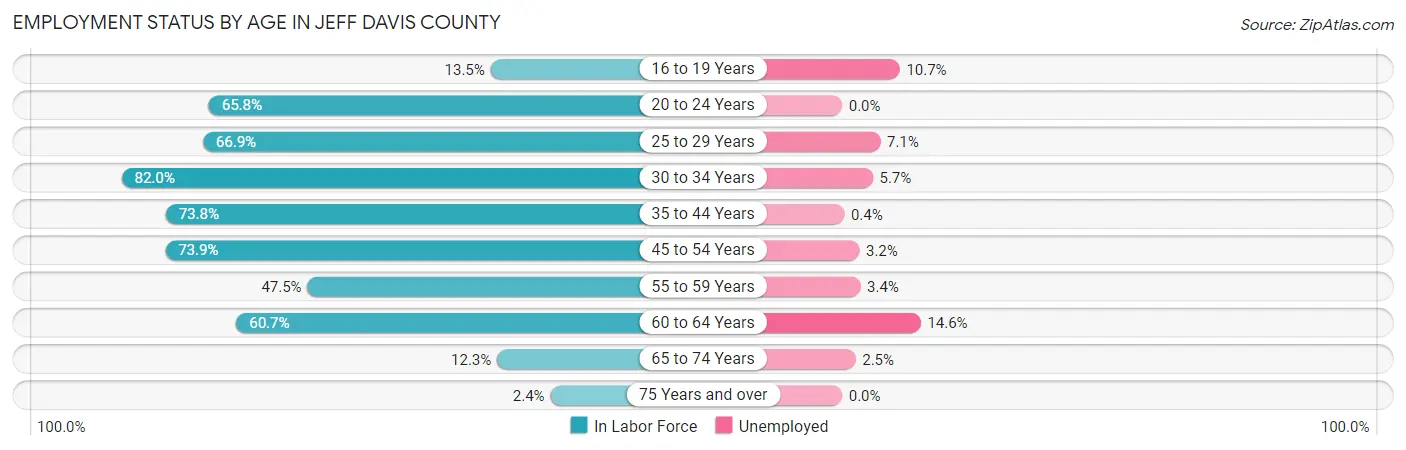
| Age Bracket | In Labor Force | Unemployed |
| 16 to 19 Years | 122 (13.5%) | 13 (10.7%) |
| 20 to 24 Years | 613 (65.8%) | 0 (0.0%) |
| 25 to 29 Years | 634 (66.9%) | 45 (7.1%) |
| 30 to 34 Years | 739 (82.0%) | 42 (5.7%) |
| 35 to 44 Years | 1,404 (73.8%) | 6 (0.4%) |
| 45 to 54 Years | 1,332 (73.9%) | 43 (3.2%) |
| 55 to 59 Years | 525 (47.5%) | 18 (3.4%) |
| 60 to 64 Years | 512 (60.7%) | 75 (14.6%) |
| 65 to 74 Years | 161 (12.3%) | 4 (2.5%) |
| 75 Years and over | 22 (2.4%) | 0 (0.0%) |
| Total | 6,066 (52.5%) | 249 (4.1%) |
Employment Status by Educational Attainment in Jeff Davis County
According to labor force statistics for Jeff Davis County, 68.6% of individuals (5,146) out of the total population between 25 and 64 years of age (7,502) are in the labor force, with 4.5% or 232 of them being unemployed. The group with the highest labor force participation rate are those with the educational attainment of bachelor's degree or higher, with 97.0% or 922 individuals in the labor force. Within the labor force, individuals with less than high school education have the highest percentage of unemployment, with 8.1% or 66 of them being unemployed.
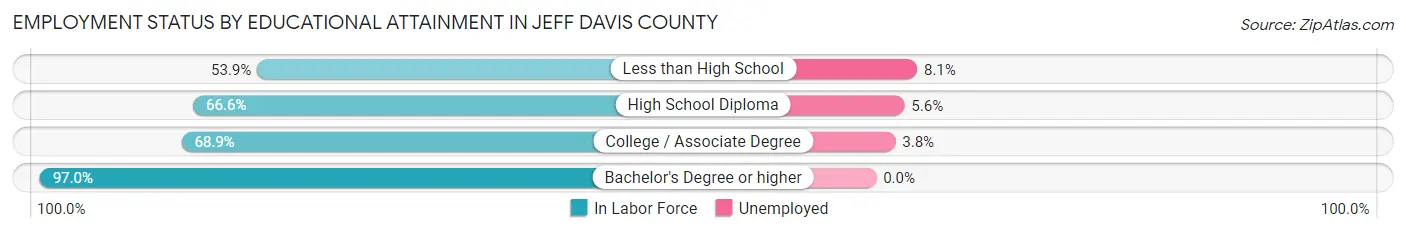
| Educational Attainment | In Labor Force | Unemployed |
| Less than High School | 812 (53.9%) | 122 (8.1%) |
| High School Diploma | 1,849 (66.6%) | 156 (5.6%) |
| College / Associate Degree | 1,563 (68.9%) | 86 (3.8%) |
| Bachelor's Degree or higher | 922 (97.0%) | 0 (0.0%) |
| Total | 5,146 (68.6%) | 338 (4.5%) |
Employment Occupations by Sex in Jeff Davis County
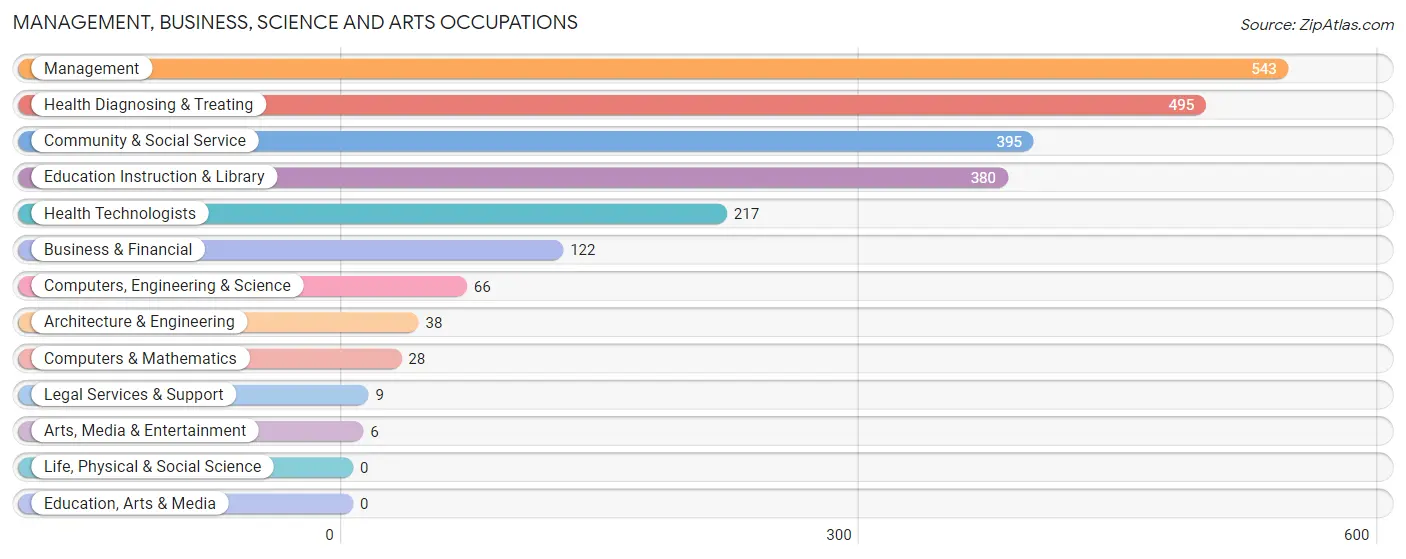
Management, Business, Science and Arts Occupations
The most common Management, Business, Science and Arts occupations in Jeff Davis County are Management (543 | 9.4%), Health Diagnosing & Treating (495 | 8.6%), Community & Social Service (395 | 6.8%), Education Instruction & Library (380 | 6.6%), and Health Technologists (217 | 3.7%).
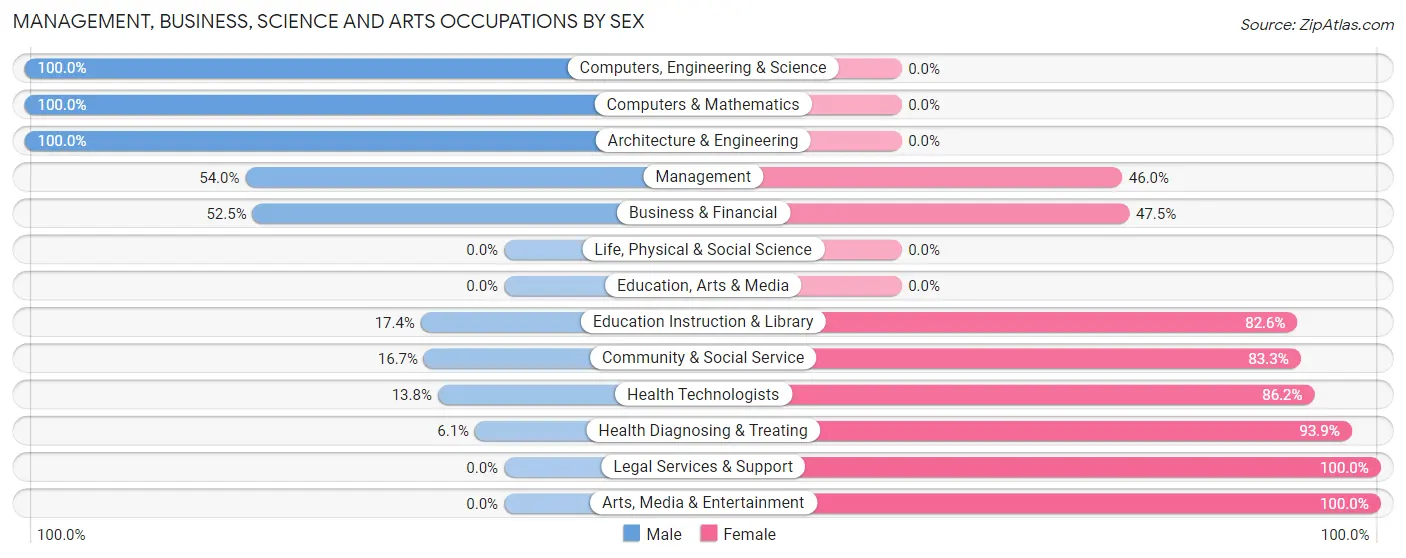
Management, Business, Science and Arts Occupations by Sex
Within the Management, Business, Science and Arts occupations in Jeff Davis County, the most male-oriented occupations are Computers, Engineering & Science (100.0%), Computers & Mathematics (100.0%), and Architecture & Engineering (100.0%), while the most female-oriented occupations are Legal Services & Support (100.0%), Arts, Media & Entertainment (100.0%), and Health Diagnosing & Treating (93.9%).
| Occupation | Male | Female |
| Management | 293 (54.0%) | 250 (46.0%) |
| Business & Financial | 64 (52.5%) | 58 (47.5%) |
| Computers, Engineering & Science | 66 (100.0%) | 0 (0.0%) |
| Computers & Mathematics | 28 (100.0%) | 0 (0.0%) |
| Architecture & Engineering | 38 (100.0%) | 0 (0.0%) |
| Life, Physical & Social Science | 0 (0.0%) | 0 (0.0%) |
| Community & Social Service | 66 (16.7%) | 329 (83.3%) |
| Education, Arts & Media | 0 (0.0%) | 0 (0.0%) |
| Legal Services & Support | 0 (0.0%) | 9 (100.0%) |
| Education Instruction & Library | 66 (17.4%) | 314 (82.6%) |
| Arts, Media & Entertainment | 0 (0.0%) | 6 (100.0%) |
| Health Diagnosing & Treating | 30 (6.1%) | 465 (93.9%) |
| Health Technologists | 30 (13.8%) | 187 (86.2%) |
| Total (Category) | 519 (32.0%) | 1,102 (68.0%) |
| Total (Overall) | 2,974 (51.4%) | 2,809 (48.6%) |
Services Occupations
The most common Services occupations in Jeff Davis County are Food Preparation & Serving (366 | 6.3%), Cleaning & Maintenance (259 | 4.5%), Security & Protection (117 | 2.0%), Law Enforcement (117 | 2.0%), and Personal Care & Service (117 | 2.0%).

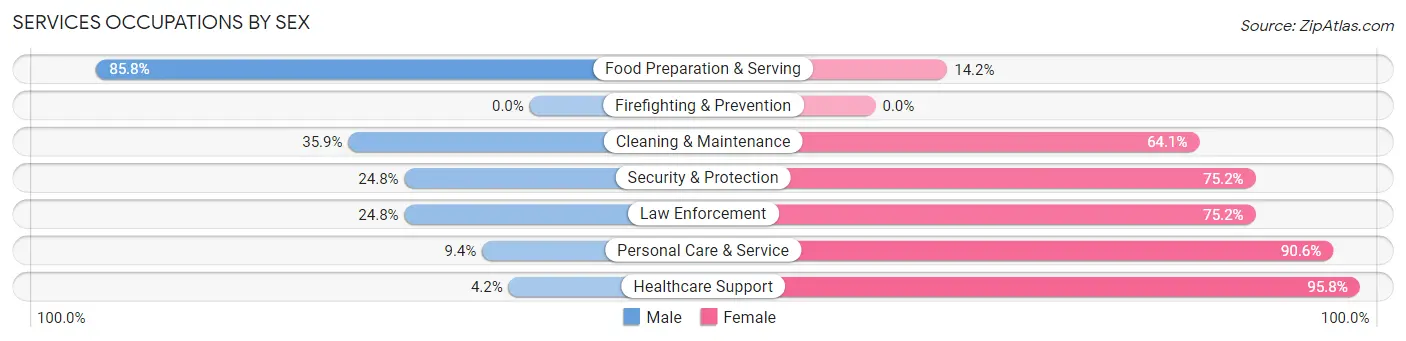
Services Occupations by Sex
Within the Services occupations in Jeff Davis County, the most male-oriented occupations are Food Preparation & Serving (85.8%), Cleaning & Maintenance (35.9%), and Security & Protection (24.8%), while the most female-oriented occupations are Healthcare Support (95.8%), Personal Care & Service (90.6%), and Security & Protection (75.2%).
| Occupation | Male | Female |
| Healthcare Support | 1 (4.2%) | 23 (95.8%) |
| Security & Protection | 29 (24.8%) | 88 (75.2%) |
| Firefighting & Prevention | 0 (0.0%) | 0 (0.0%) |
| Law Enforcement | 29 (24.8%) | 88 (75.2%) |
| Food Preparation & Serving | 314 (85.8%) | 52 (14.2%) |
| Cleaning & Maintenance | 93 (35.9%) | 166 (64.1%) |
| Personal Care & Service | 11 (9.4%) | 106 (90.6%) |
| Total (Category) | 448 (50.7%) | 435 (49.3%) |
| Total (Overall) | 2,974 (51.4%) | 2,809 (48.6%) |
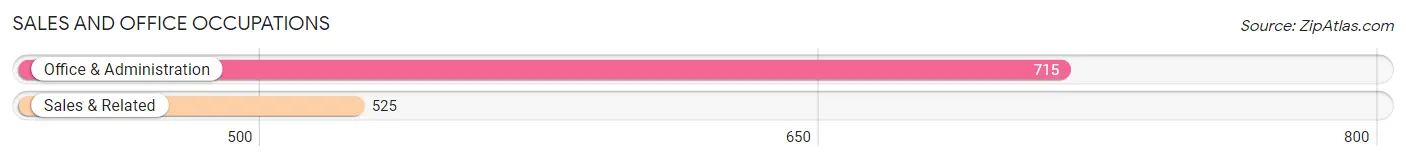
Sales and Office Occupations
The most common Sales and Office occupations in Jeff Davis County are Office & Administration (715 | 12.4%), and Sales & Related (525 | 9.1%).
Sales and Office Occupations by Sex
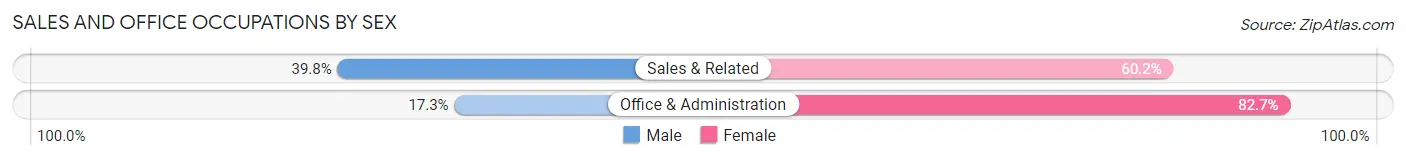
| Occupation | Male | Female |
| Sales & Related | 209 (39.8%) | 316 (60.2%) |
| Office & Administration | 124 (17.3%) | 591 (82.7%) |
| Total (Category) | 333 (26.9%) | 907 (73.2%) |
| Total (Overall) | 2,974 (51.4%) | 2,809 (48.6%) |
Natural Resources, Construction and Maintenance Occupations
The most common Natural Resources, Construction and Maintenance occupations in Jeff Davis County are Construction & Extraction (330 | 5.7%), Farming, Fishing & Forestry (245 | 4.2%), and Installation, Maintenance & Repair (150 | 2.6%).

Natural Resources, Construction and Maintenance Occupations by Sex
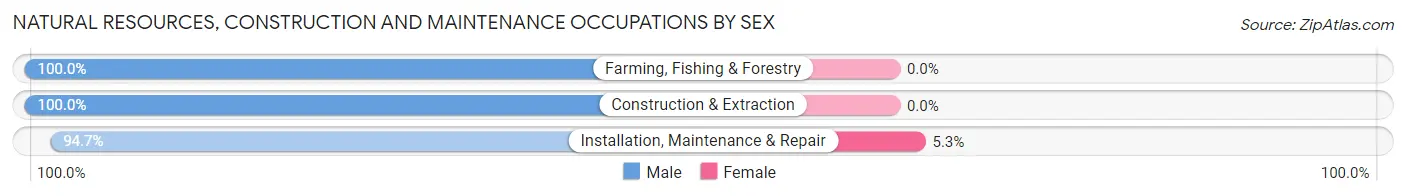
| Occupation | Male | Female |
| Farming, Fishing & Forestry | 245 (100.0%) | 0 (0.0%) |
| Construction & Extraction | 330 (100.0%) | 0 (0.0%) |
| Installation, Maintenance & Repair | 142 (94.7%) | 8 (5.3%) |
| Total (Category) | 717 (98.9%) | 8 (1.1%) |
| Total (Overall) | 2,974 (51.4%) | 2,809 (48.6%) |
Production, Transportation and Moving Occupations
The most common Production, Transportation and Moving occupations in Jeff Davis County are Production (709 | 12.3%), Transportation (379 | 6.6%), and Material Moving (226 | 3.9%).

Production, Transportation and Moving Occupations by Sex
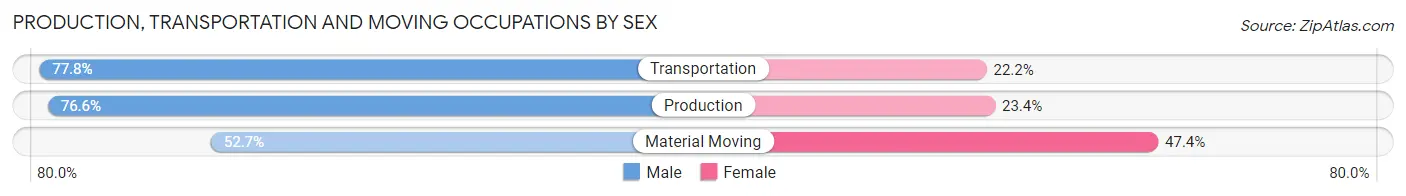
| Occupation | Male | Female |
| Production | 543 (76.6%) | 166 (23.4%) |
| Transportation | 295 (77.8%) | 84 (22.2%) |
| Material Moving | 119 (52.6%) | 107 (47.3%) |
| Total (Category) | 957 (72.8%) | 357 (27.2%) |
| Total (Overall) | 2,974 (51.4%) | 2,809 (48.6%) |
Employment Industries by Sex in Jeff Davis County
Employment Industries in Jeff Davis County
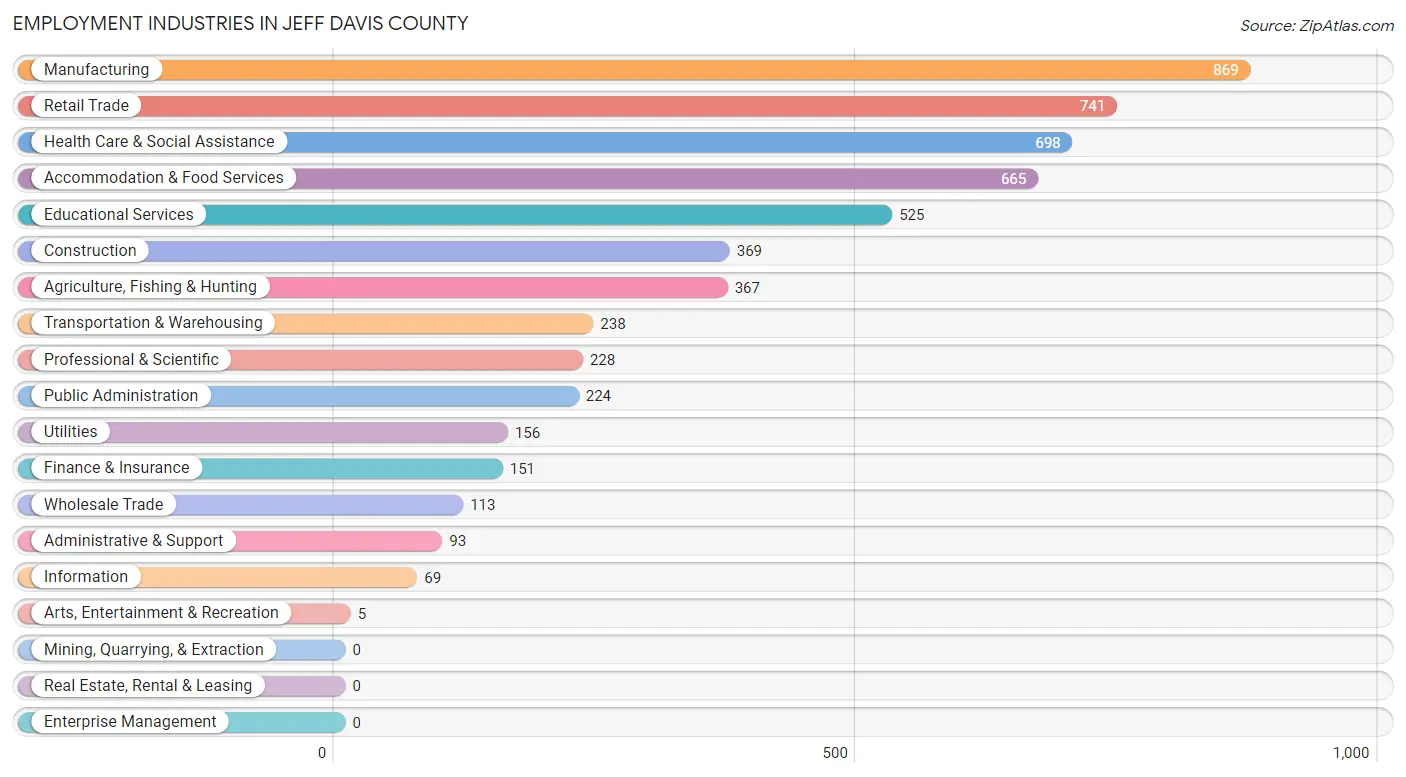
The major employment industries in Jeff Davis County include Manufacturing (869 | 15.0%), Retail Trade (741 | 12.8%), Health Care & Social Assistance (698 | 12.1%), Accommodation & Food Services (665 | 11.5%), and Educational Services (525 | 9.1%).
Employment Industries by Sex in Jeff Davis County
The Jeff Davis County industries that see more men than women are Construction (100.0%), Administrative & Support (100.0%), and Utilities (89.7%), whereas the industries that tend to have a higher number of women are Information (100.0%), Arts, Entertainment & Recreation (100.0%), and Health Care & Social Assistance (91.5%).
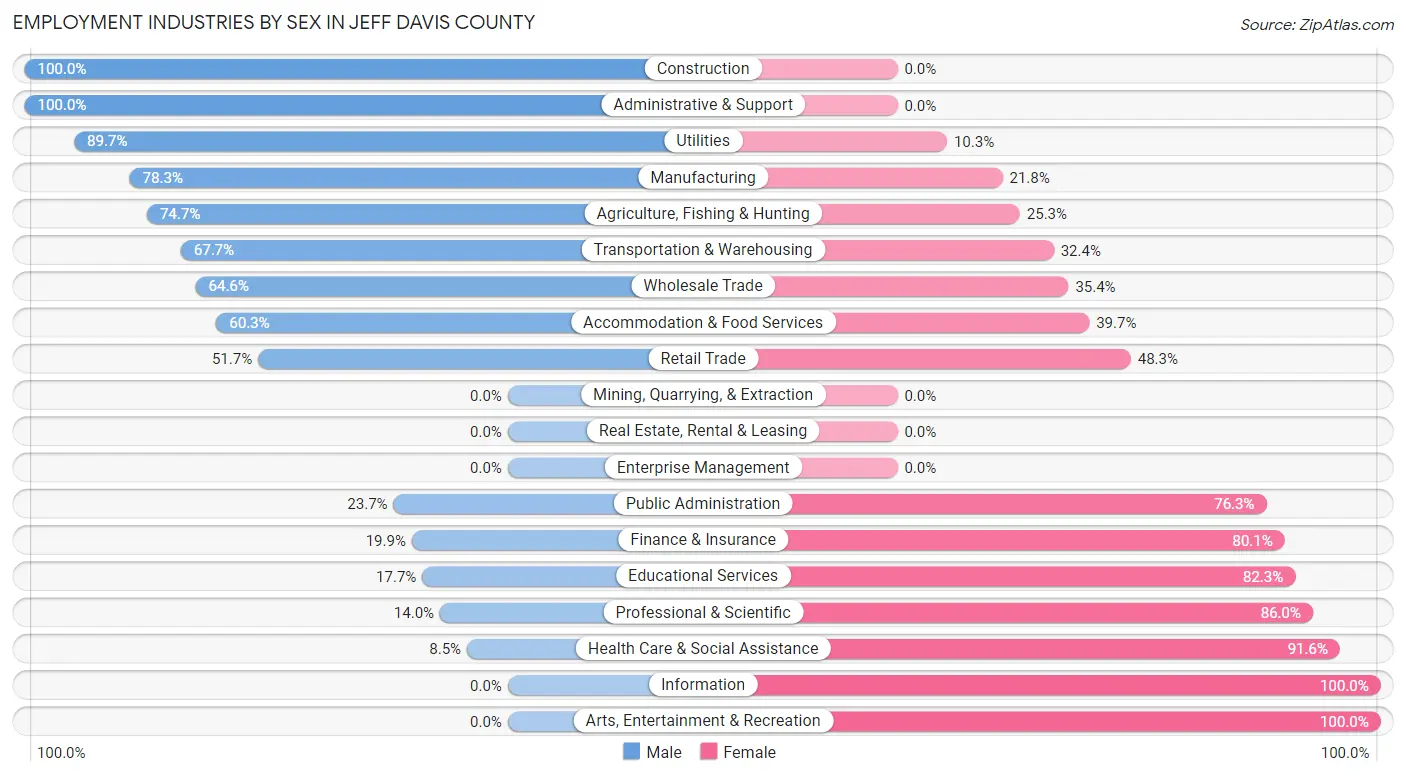
| Industry | Male | Female |
| Agriculture, Fishing & Hunting | 274 (74.7%) | 93 (25.3%) |
| Mining, Quarrying, & Extraction | 0 (0.0%) | 0 (0.0%) |
| Construction | 369 (100.0%) | 0 (0.0%) |
| Manufacturing | 680 (78.2%) | 189 (21.7%) |
| Wholesale Trade | 73 (64.6%) | 40 (35.4%) |
| Retail Trade | 383 (51.7%) | 358 (48.3%) |
| Transportation & Warehousing | 161 (67.6%) | 77 (32.4%) |
| Utilities | 140 (89.7%) | 16 (10.3%) |
| Information | 0 (0.0%) | 69 (100.0%) |
| Finance & Insurance | 30 (19.9%) | 121 (80.1%) |
| Real Estate, Rental & Leasing | 0 (0.0%) | 0 (0.0%) |
| Professional & Scientific | 32 (14.0%) | 196 (86.0%) |
| Enterprise Management | 0 (0.0%) | 0 (0.0%) |
| Administrative & Support | 93 (100.0%) | 0 (0.0%) |
| Educational Services | 93 (17.7%) | 432 (82.3%) |
| Health Care & Social Assistance | 59 (8.5%) | 639 (91.5%) |
| Arts, Entertainment & Recreation | 0 (0.0%) | 5 (100.0%) |
| Accommodation & Food Services | 401 (60.3%) | 264 (39.7%) |
| Public Administration | 53 (23.7%) | 171 (76.3%) |
| Total | 2,974 (51.4%) | 2,809 (48.6%) |
Education in Jeff Davis County
School Enrollment in Jeff Davis County
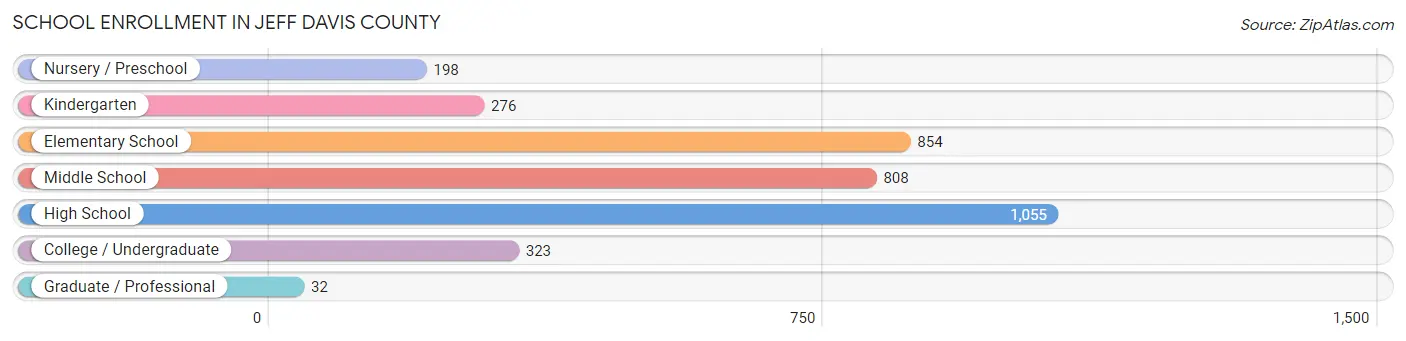
The most common levels of schooling among the 3,546 students in Jeff Davis County are high school (1,055 | 29.7%), elementary school (854 | 24.1%), and middle school (808 | 22.8%).
| School Level | # Students | % Students |
| Nursery / Preschool | 198 | 5.6% |
| Kindergarten | 276 | 7.8% |
| Elementary School | 854 | 24.1% |
| Middle School | 808 | 22.8% |
| High School | 1,055 | 29.7% |
| College / Undergraduate | 323 | 9.1% |
| Graduate / Professional | 32 | 0.9% |
| Total | 3,546 | 100.0% |
School Enrollment by Age by Funding Source in Jeff Davis County
Out of a total of 3,546 students who are enrolled in schools in Jeff Davis County, 372 (10.5%) attend a private institution, while the remaining 3,174 (89.5%) are enrolled in public schools. The age group of 3 to 4 year olds has the highest likelihood of being enrolled in private schools, with 126 (63.6% in the age bracket) enrolled. Conversely, the age group of 10 to 14 year olds has the lowest likelihood of being enrolled in a private school, with 1,057 (100.0% in the age bracket) attending a public institution.

| Age Bracket | Public School | Private School |
| 3 to 4 Year Olds | 72 (36.4%) | 126 (63.6%) |
| 5 to 9 Year Old | 817 (84.9%) | 145 (15.1%) |
| 10 to 14 Year Olds | 1,057 (100.0%) | 0 (0.0%) |
| 15 to 17 Year Olds | 660 (100.0%) | 0 (0.0%) |
| 18 to 19 Year Olds | 266 (95.3%) | 13 (4.7%) |
| 20 to 24 Year Olds | 114 (57.9%) | 83 (42.1%) |
| 25 to 34 Year Olds | 85 (94.4%) | 5 (5.6%) |
| 35 Years and over | 103 (100.0%) | 0 (0.0%) |
| Total | 3,174 (89.5%) | 372 (10.5%) |
Educational Attainment by Field of Study in Jeff Davis County
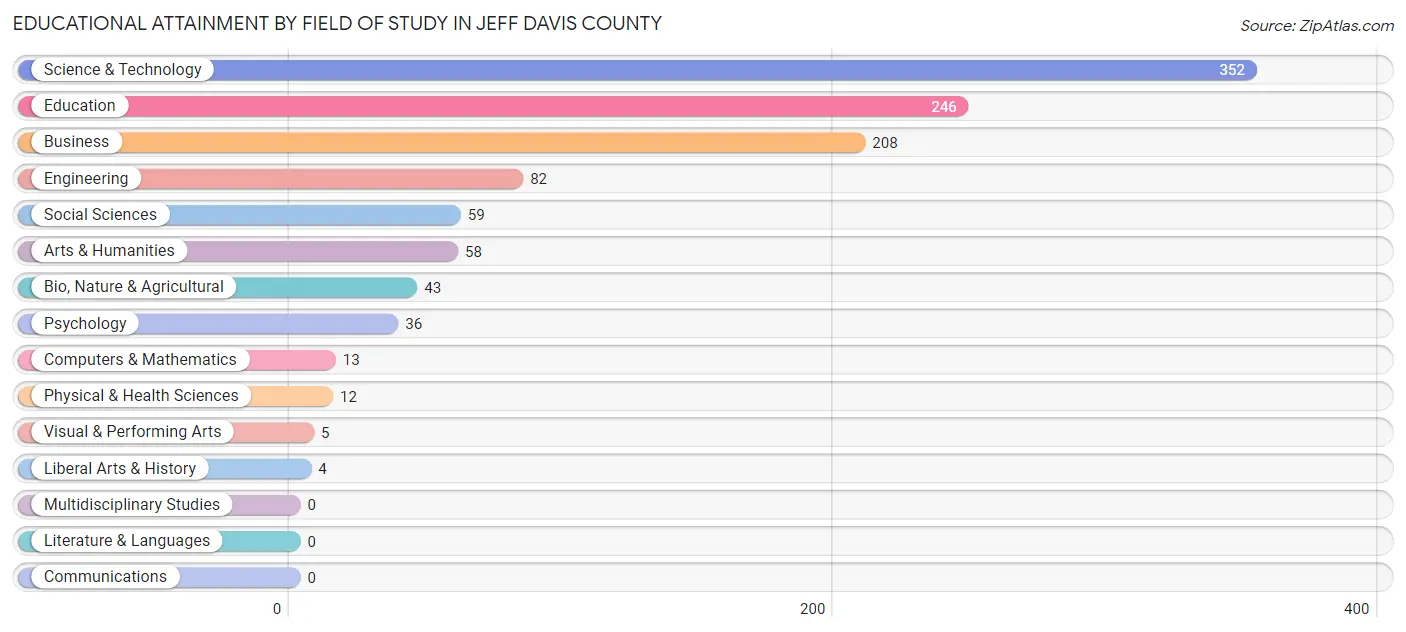
Science & technology (352 | 31.5%), education (246 | 22.0%), business (208 | 18.6%), engineering (82 | 7.3%), and social sciences (59 | 5.3%) are the most common fields of study among 1,118 individuals in Jeff Davis County who have obtained a bachelor's degree or higher.
| Field of Study | # Graduates | % Graduates |
| Computers & Mathematics | 13 | 1.2% |
| Bio, Nature & Agricultural | 43 | 3.8% |
| Physical & Health Sciences | 12 | 1.1% |
| Psychology | 36 | 3.2% |
| Social Sciences | 59 | 5.3% |
| Engineering | 82 | 7.3% |
| Multidisciplinary Studies | 0 | 0.0% |
| Science & Technology | 352 | 31.5% |
| Business | 208 | 18.6% |
| Education | 246 | 22.0% |
| Literature & Languages | 0 | 0.0% |
| Liberal Arts & History | 4 | 0.4% |
| Visual & Performing Arts | 5 | 0.4% |
| Communications | 0 | 0.0% |
| Arts & Humanities | 58 | 5.2% |
| Total | 1,118 | 100.0% |
Transportation & Commute in Jeff Davis County
Vehicle Availability by Sex in Jeff Davis County
The most prevalent vehicle ownership categories in Jeff Davis County are males with 2 vehicles (1,363, accounting for 45.3%) and females with 2 vehicles (1,197, making up 49.6%).

| Vehicles Available | Male | Female |
| No Vehicle | 93 (3.1%) | 37 (1.3%) |
| 1 Vehicle | 583 (19.4%) | 641 (23.3%) |
| 2 Vehicles | 1,363 (45.3%) | 1,197 (43.6%) |
| 3 Vehicles | 590 (19.6%) | 487 (17.7%) |
| 4 Vehicles | 367 (12.2%) | 381 (13.9%) |
| 5 or more Vehicles | 13 (0.4%) | 4 (0.2%) |
| Total | 3,009 (100.0%) | 2,747 (100.0%) |
Commute Time in Jeff Davis County
The most frequently occuring commute durations in Jeff Davis County are 15 to 19 minutes (1,150 commuters, 20.4%), 20 to 24 minutes (1,004 commuters, 17.8%), and 10 to 14 minutes (725 commuters, 12.9%).
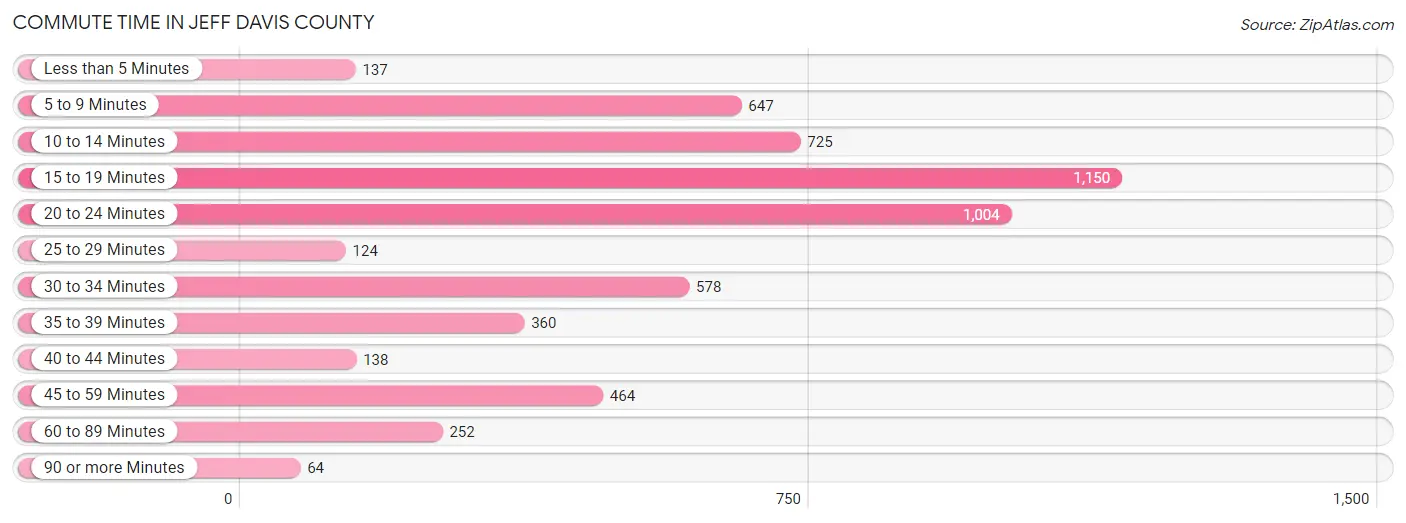
| Commute Time | # Commuters | % Commuters |
| Less than 5 Minutes | 137 | 2.4% |
| 5 to 9 Minutes | 647 | 11.5% |
| 10 to 14 Minutes | 725 | 12.9% |
| 15 to 19 Minutes | 1,150 | 20.4% |
| 20 to 24 Minutes | 1,004 | 17.8% |
| 25 to 29 Minutes | 124 | 2.2% |
| 30 to 34 Minutes | 578 | 10.2% |
| 35 to 39 Minutes | 360 | 6.4% |
| 40 to 44 Minutes | 138 | 2.5% |
| 45 to 59 Minutes | 464 | 8.2% |
| 60 to 89 Minutes | 252 | 4.5% |
| 90 or more Minutes | 64 | 1.1% |
Commute Time by Sex in Jeff Davis County
The most common commute times in Jeff Davis County are 20 to 24 minutes (707 commuters, 24.0%) for males and 15 to 19 minutes (516 commuters, 19.1%) for females.

| Commute Time | Male | Female |
| Less than 5 Minutes | 47 (1.6%) | 90 (3.3%) |
| 5 to 9 Minutes | 196 (6.7%) | 451 (16.7%) |
| 10 to 14 Minutes | 374 (12.7%) | 351 (13.0%) |
| 15 to 19 Minutes | 634 (21.5%) | 516 (19.1%) |
| 20 to 24 Minutes | 707 (24.0%) | 297 (11.0%) |
| 25 to 29 Minutes | 106 (3.6%) | 18 (0.7%) |
| 30 to 34 Minutes | 226 (7.7%) | 352 (13.1%) |
| 35 to 39 Minutes | 148 (5.0%) | 212 (7.9%) |
| 40 to 44 Minutes | 30 (1.0%) | 108 (4.0%) |
| 45 to 59 Minutes | 257 (8.7%) | 207 (7.7%) |
| 60 to 89 Minutes | 158 (5.4%) | 94 (3.5%) |
| 90 or more Minutes | 64 (2.2%) | 0 (0.0%) |
Time of Departure to Work by Sex in Jeff Davis County
The most frequent times of departure to work in Jeff Davis County are 7:00 AM to 7:29 AM (466, 15.8%) for males and 7:00 AM to 7:29 AM (775, 28.7%) for females.
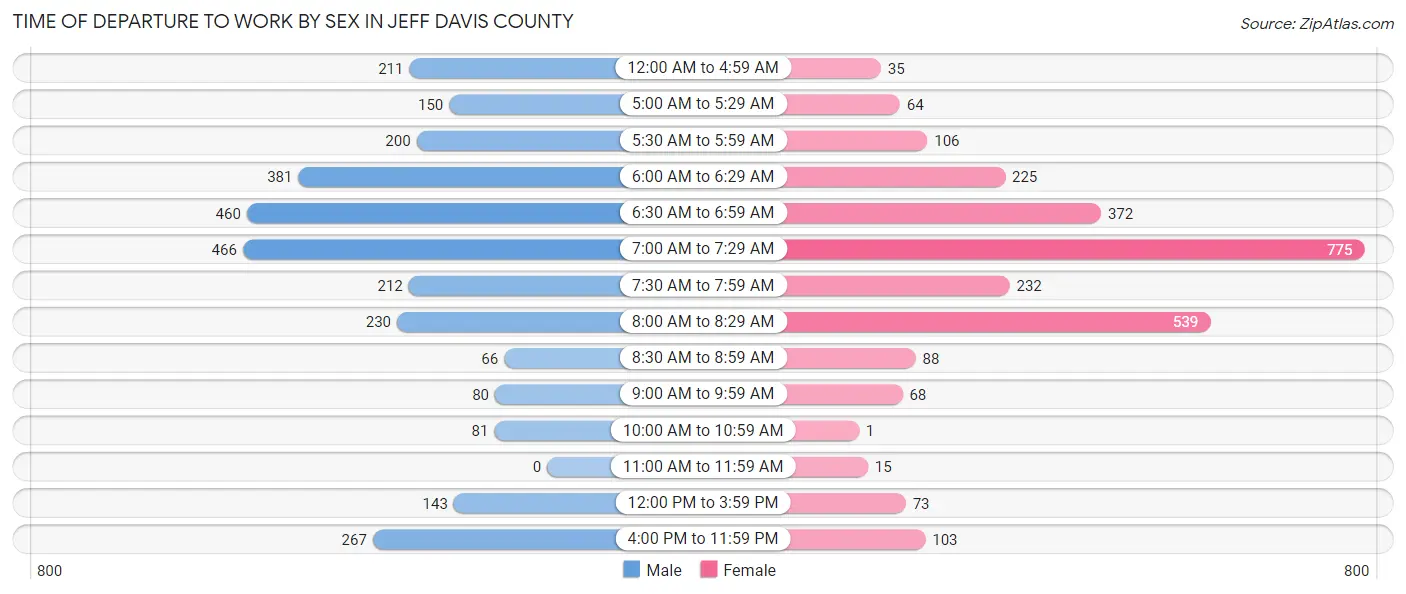
| Time of Departure | Male | Female |
| 12:00 AM to 4:59 AM | 211 (7.2%) | 35 (1.3%) |
| 5:00 AM to 5:29 AM | 150 (5.1%) | 64 (2.4%) |
| 5:30 AM to 5:59 AM | 200 (6.8%) | 106 (3.9%) |
| 6:00 AM to 6:29 AM | 381 (12.9%) | 225 (8.4%) |
| 6:30 AM to 6:59 AM | 460 (15.6%) | 372 (13.8%) |
| 7:00 AM to 7:29 AM | 466 (15.8%) | 775 (28.7%) |
| 7:30 AM to 7:59 AM | 212 (7.2%) | 232 (8.6%) |
| 8:00 AM to 8:29 AM | 230 (7.8%) | 539 (20.0%) |
| 8:30 AM to 8:59 AM | 66 (2.2%) | 88 (3.3%) |
| 9:00 AM to 9:59 AM | 80 (2.7%) | 68 (2.5%) |
| 10:00 AM to 10:59 AM | 81 (2.8%) | 1 (0.0%) |
| 11:00 AM to 11:59 AM | 0 (0.0%) | 15 (0.6%) |
| 12:00 PM to 3:59 PM | 143 (4.9%) | 73 (2.7%) |
| 4:00 PM to 11:59 PM | 267 (9.1%) | 103 (3.8%) |
| Total | 2,947 (100.0%) | 2,696 (100.0%) |
Housing Occupancy in Jeff Davis County
Occupancy by Ownership in Jeff Davis County
Of the total 5,365 dwellings in Jeff Davis County, owner-occupied units account for 3,623 (67.5%), while renter-occupied units make up 1,742 (32.5%).
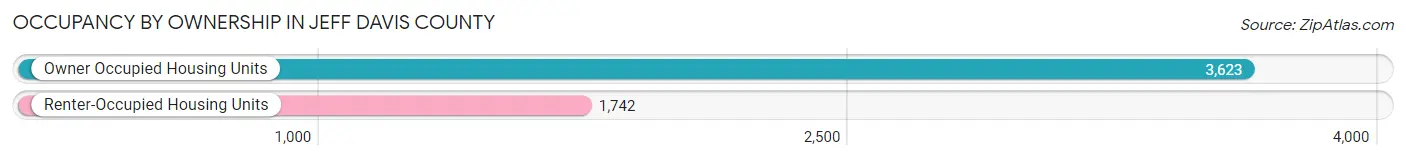
| Occupancy | # Housing Units | % Housing Units |
| Owner Occupied Housing Units | 3,623 | 67.5% |
| Renter-Occupied Housing Units | 1,742 | 32.5% |
| Total Occupied Housing Units | 5,365 | 100.0% |
Occupancy by Household Size in Jeff Davis County
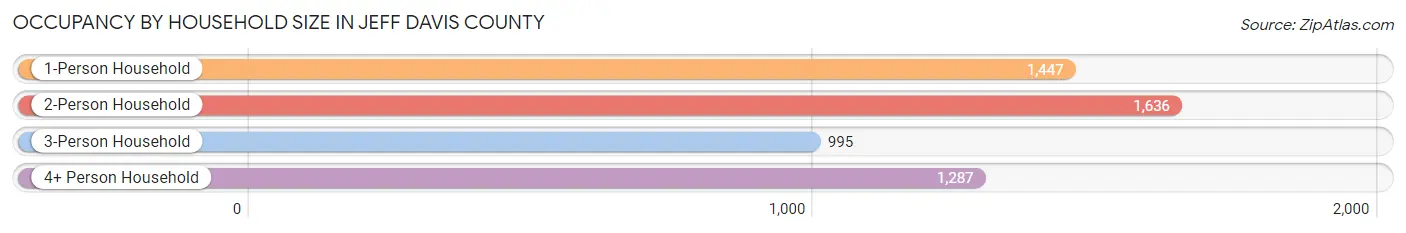
| Household Size | # Housing Units | % Housing Units |
| 1-Person Household | 1,447 | 27.0% |
| 2-Person Household | 1,636 | 30.5% |
| 3-Person Household | 995 | 18.5% |
| 4+ Person Household | 1,287 | 24.0% |
| Total Housing Units | 5,365 | 100.0% |
Occupancy by Ownership by Household Size in Jeff Davis County
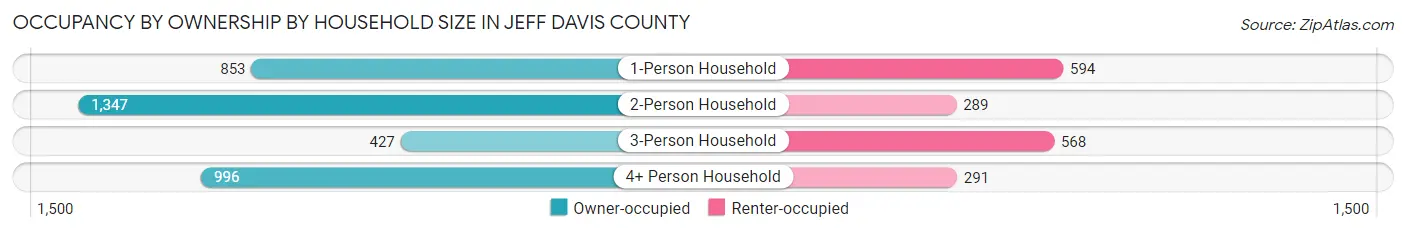
| Household Size | Owner-occupied | Renter-occupied |
| 1-Person Household | 853 (59.0%) | 594 (41.0%) |
| 2-Person Household | 1,347 (82.3%) | 289 (17.7%) |
| 3-Person Household | 427 (42.9%) | 568 (57.1%) |
| 4+ Person Household | 996 (77.4%) | 291 (22.6%) |
| Total Housing Units | 3,623 (67.5%) | 1,742 (32.5%) |
Occupancy by Educational Attainment in Jeff Davis County
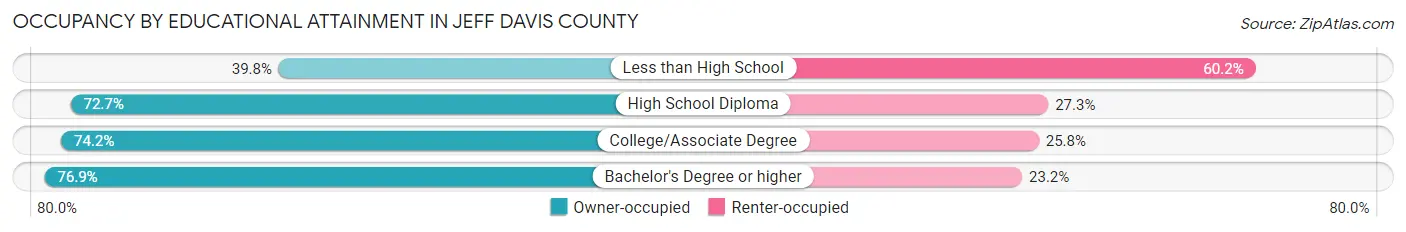
| Household Size | Owner-occupied | Renter-occupied |
| Less than High School | 394 (39.8%) | 595 (60.2%) |
| High School Diploma | 1,548 (72.7%) | 581 (27.3%) |
| College/Associate Degree | 1,286 (74.2%) | 447 (25.8%) |
| Bachelor's Degree or higher | 395 (76.8%) | 119 (23.2%) |
Occupancy by Age of Householder in Jeff Davis County
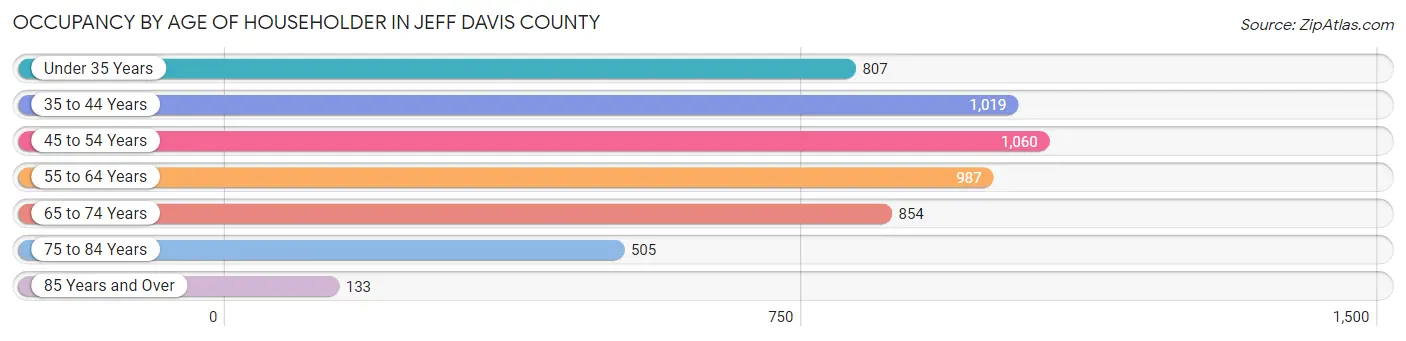
| Age Bracket | # Households | % Households |
| Under 35 Years | 807 | 15.0% |
| 35 to 44 Years | 1,019 | 19.0% |
| 45 to 54 Years | 1,060 | 19.8% |
| 55 to 64 Years | 987 | 18.4% |
| 65 to 74 Years | 854 | 15.9% |
| 75 to 84 Years | 505 | 9.4% |
| 85 Years and Over | 133 | 2.5% |
| Total | 5,365 | 100.0% |
Housing Finances in Jeff Davis County
Median Income by Occupancy in Jeff Davis County
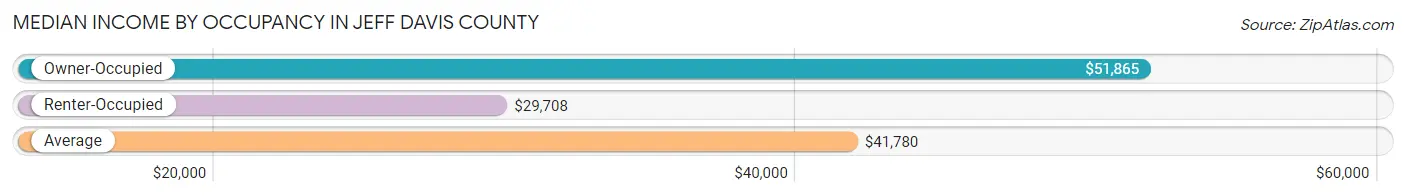
| Occupancy Type | # Households | Median Income |
| Owner-Occupied | 3,623 (67.5%) | $51,865 |
| Renter-Occupied | 1,742 (32.5%) | $29,708 |
| Average | 5,365 (100.0%) | $41,780 |
Occupancy by Householder Income Bracket in Jeff Davis County
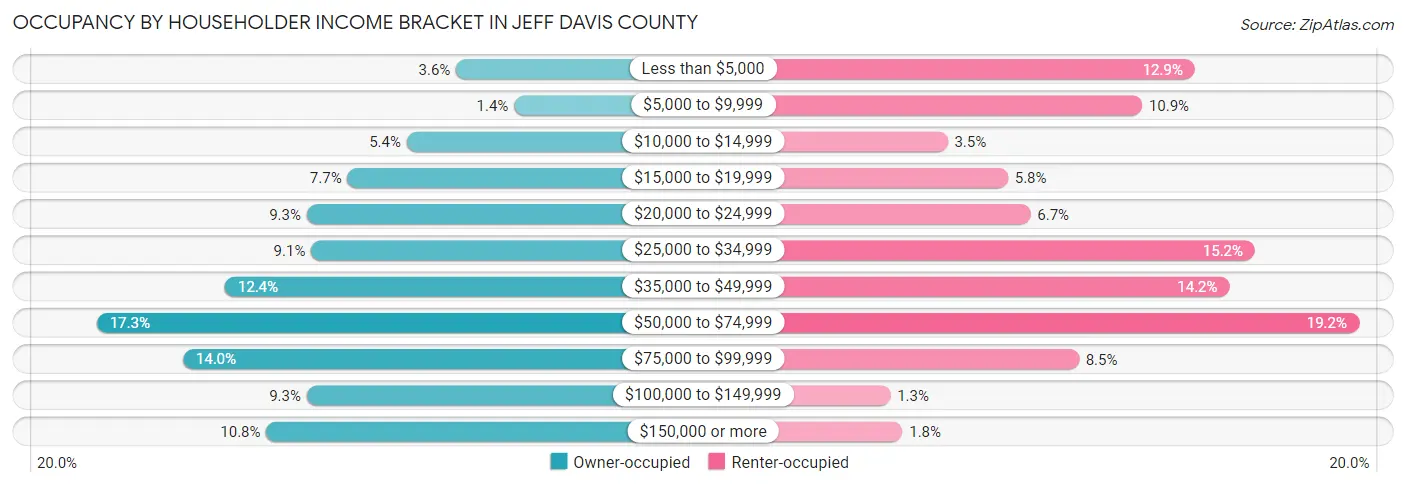
| Income Bracket | Owner-occupied | Renter-occupied |
| Less than $5,000 | 129 (3.6%) | 225 (12.9%) |
| $5,000 to $9,999 | 49 (1.3%) | 190 (10.9%) |
| $10,000 to $14,999 | 197 (5.4%) | 61 (3.5%) |
| $15,000 to $19,999 | 279 (7.7%) | 101 (5.8%) |
| $20,000 to $24,999 | 335 (9.2%) | 116 (6.7%) |
| $25,000 to $34,999 | 329 (9.1%) | 265 (15.2%) |
| $35,000 to $49,999 | 448 (12.4%) | 248 (14.2%) |
| $50,000 to $74,999 | 625 (17.2%) | 334 (19.2%) |
| $75,000 to $99,999 | 506 (14.0%) | 148 (8.5%) |
| $100,000 to $149,999 | 335 (9.2%) | 23 (1.3%) |
| $150,000 or more | 391 (10.8%) | 31 (1.8%) |
| Total | 3,623 (100.0%) | 1,742 (100.0%) |
Monthly Housing Cost Tiers in Jeff Davis County
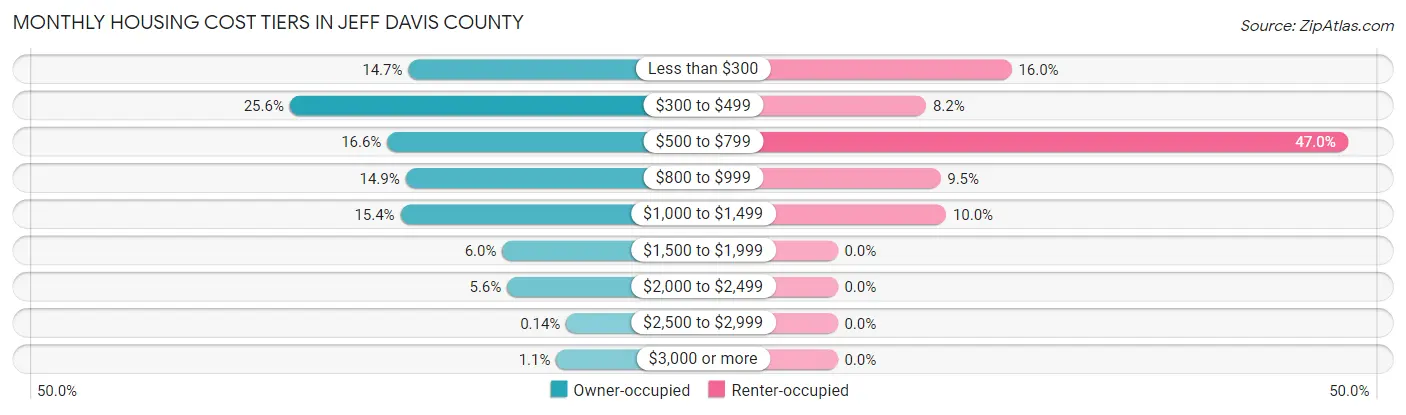
| Monthly Cost | Owner-occupied | Renter-occupied |
| Less than $300 | 532 (14.7%) | 279 (16.0%) |
| $300 to $499 | 927 (25.6%) | 142 (8.2%) |
| $500 to $799 | 602 (16.6%) | 818 (47.0%) |
| $800 to $999 | 541 (14.9%) | 165 (9.5%) |
| $1,000 to $1,499 | 558 (15.4%) | 174 (10.0%) |
| $1,500 to $1,999 | 218 (6.0%) | 0 (0.0%) |
| $2,000 to $2,499 | 202 (5.6%) | 0 (0.0%) |
| $2,500 to $2,999 | 5 (0.1%) | 0 (0.0%) |
| $3,000 or more | 38 (1.1%) | 0 (0.0%) |
| Total | 3,623 (100.0%) | 1,742 (100.0%) |
Physical Housing Characteristics in Jeff Davis County
Housing Structures in Jeff Davis County

| Structure Type | # Housing Units | % Housing Units |
| Single Unit, Detached | 3,288 | 61.3% |
| Single Unit, Attached | 5 | 0.1% |
| 2 Unit Apartments | 183 | 3.4% |
| 3 or 4 Unit Apartments | 134 | 2.5% |
| 5 to 9 Unit Apartments | 155 | 2.9% |
| 10 or more Apartments | 30 | 0.6% |
| Mobile Home / Other | 1,570 | 29.3% |
| Total | 5,365 | 100.0% |
Housing Structures by Occupancy in Jeff Davis County
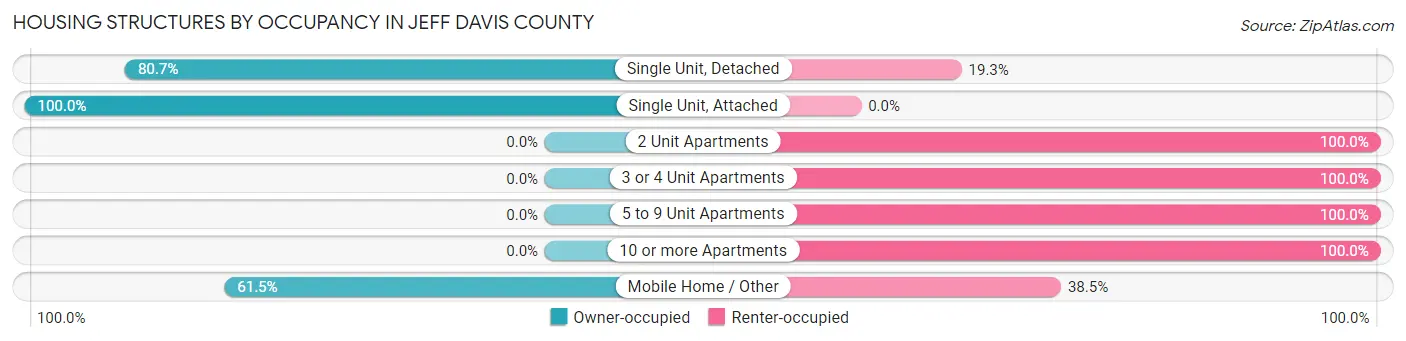
| Structure Type | Owner-occupied | Renter-occupied |
| Single Unit, Detached | 2,652 (80.7%) | 636 (19.3%) |
| Single Unit, Attached | 5 (100.0%) | 0 (0.0%) |
| 2 Unit Apartments | 0 (0.0%) | 183 (100.0%) |
| 3 or 4 Unit Apartments | 0 (0.0%) | 134 (100.0%) |
| 5 to 9 Unit Apartments | 0 (0.0%) | 155 (100.0%) |
| 10 or more Apartments | 0 (0.0%) | 30 (100.0%) |
| Mobile Home / Other | 966 (61.5%) | 604 (38.5%) |
| Total | 3,623 (67.5%) | 1,742 (32.5%) |
Housing Structures by Number of Rooms in Jeff Davis County
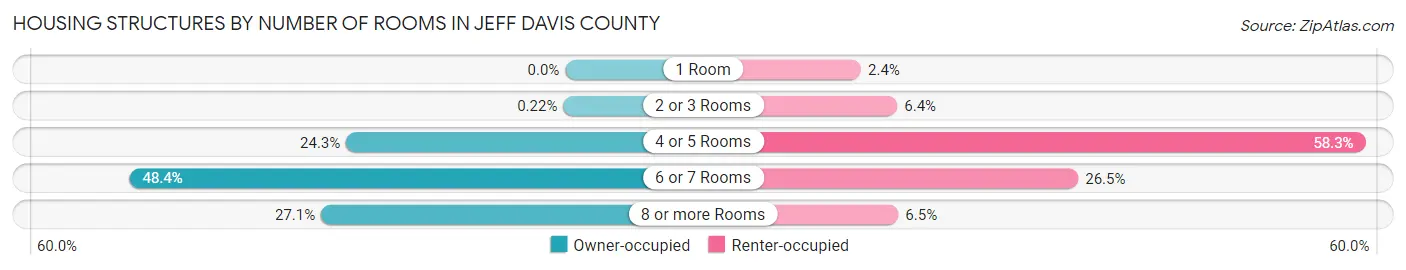
| Number of Rooms | Owner-occupied | Renter-occupied |
| 1 Room | 0 (0.0%) | 41 (2.4%) |
| 2 or 3 Rooms | 8 (0.2%) | 111 (6.4%) |
| 4 or 5 Rooms | 881 (24.3%) | 1,016 (58.3%) |
| 6 or 7 Rooms | 1,752 (48.4%) | 461 (26.5%) |
| 8 or more Rooms | 982 (27.1%) | 113 (6.5%) |
| Total | 3,623 (100.0%) | 1,742 (100.0%) |
Housing Structure by Heating Type in Jeff Davis County
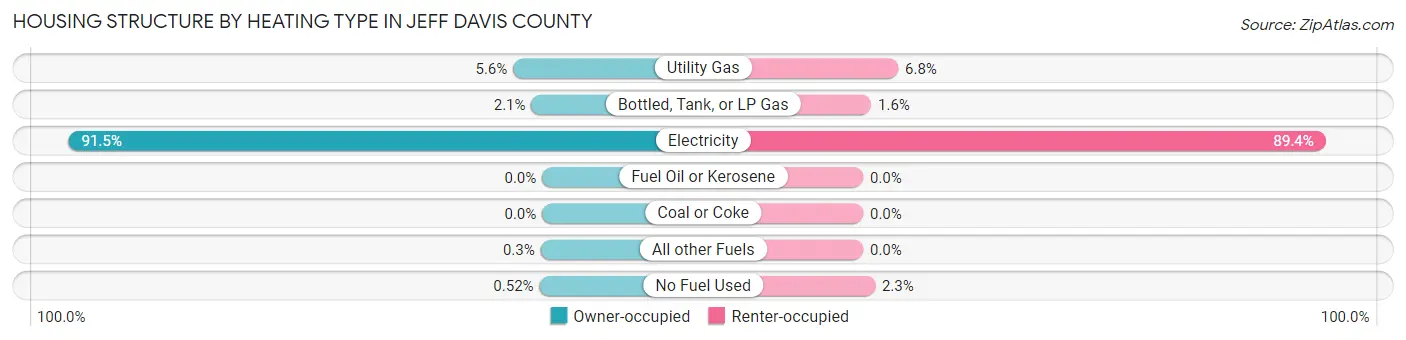
| Heating Type | Owner-occupied | Renter-occupied |
| Utility Gas | 203 (5.6%) | 118 (6.8%) |
| Bottled, Tank, or LP Gas | 75 (2.1%) | 27 (1.5%) |
| Electricity | 3,315 (91.5%) | 1,557 (89.4%) |
| Fuel Oil or Kerosene | 0 (0.0%) | 0 (0.0%) |
| Coal or Coke | 0 (0.0%) | 0 (0.0%) |
| All other Fuels | 11 (0.3%) | 0 (0.0%) |
| No Fuel Used | 19 (0.5%) | 40 (2.3%) |
| Total | 3,623 (100.0%) | 1,742 (100.0%) |
Household Vehicle Usage in Jeff Davis County

| Vehicles per Household | Owner-occupied | Renter-occupied |
| No Vehicle | 211 (5.8%) | 201 (11.5%) |
| 1 Vehicle | 735 (20.3%) | 1,203 (69.1%) |
| 2 Vehicles | 1,607 (44.4%) | 270 (15.5%) |
| 3 or more Vehicles | 1,070 (29.5%) | 68 (3.9%) |
| Total | 3,623 (100.0%) | 1,742 (100.0%) |
Real Estate & Mortgages in Jeff Davis County
Real Estate and Mortgage Overview in Jeff Davis County
| Characteristic | Without Mortgage | With Mortgage |
| Housing Units | 2,079 | 1,544 |
| Median Property Value | $95,500 | $151,300 |
| Median Household Income | $40,125 | $289 |
| Monthly Housing Costs | $419 | $21 |
| Real Estate Taxes | $803 | $26 |
Property Value by Mortgage Status in Jeff Davis County
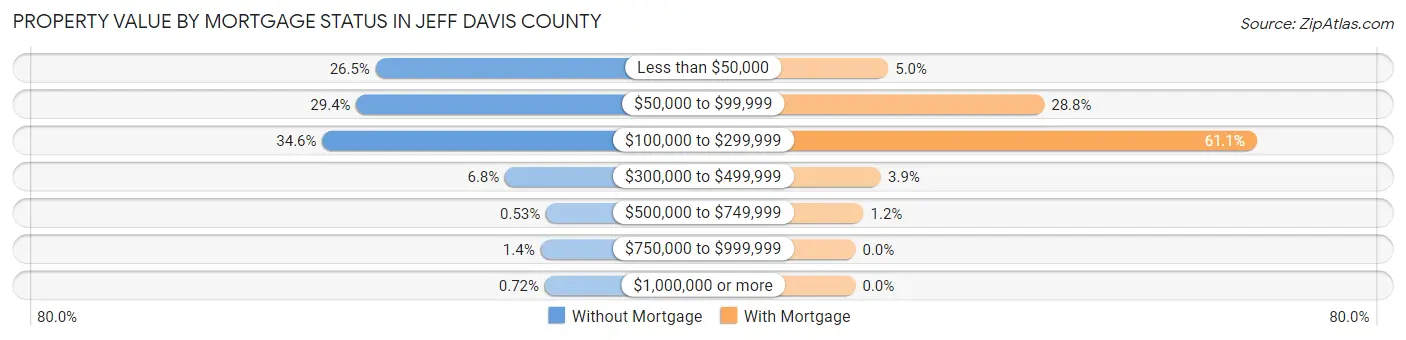
| Property Value | Without Mortgage | With Mortgage |
| Less than $50,000 | 551 (26.5%) | 77 (5.0%) |
| $50,000 to $99,999 | 612 (29.4%) | 444 (28.8%) |
| $100,000 to $299,999 | 720 (34.6%) | 944 (61.1%) |
| $300,000 to $499,999 | 141 (6.8%) | 60 (3.9%) |
| $500,000 to $749,999 | 11 (0.5%) | 19 (1.2%) |
| $750,000 to $999,999 | 29 (1.4%) | 0 (0.0%) |
| $1,000,000 or more | 15 (0.7%) | 0 (0.0%) |
| Total | 2,079 (100.0%) | 1,544 (100.0%) |
Household Income by Mortgage Status in Jeff Davis County

| Household Income | Without Mortgage | With Mortgage |
| Less than $10,000 | 160 (7.7%) | 0 (0.0%) |
| $10,000 to $24,999 | 558 (26.8%) | 18 (1.2%) |
| $25,000 to $34,999 | 221 (10.6%) | 253 (16.4%) |
| $35,000 to $49,999 | 265 (12.8%) | 108 (7.0%) |
| $50,000 to $74,999 | 381 (18.3%) | 183 (11.8%) |
| $75,000 to $99,999 | 261 (12.6%) | 244 (15.8%) |
| $100,000 to $149,999 | 131 (6.3%) | 245 (15.9%) |
| $150,000 or more | 102 (4.9%) | 204 (13.2%) |
| Total | 2,079 (100.0%) | 1,544 (100.0%) |
Property Value to Household Income Ratio in Jeff Davis County
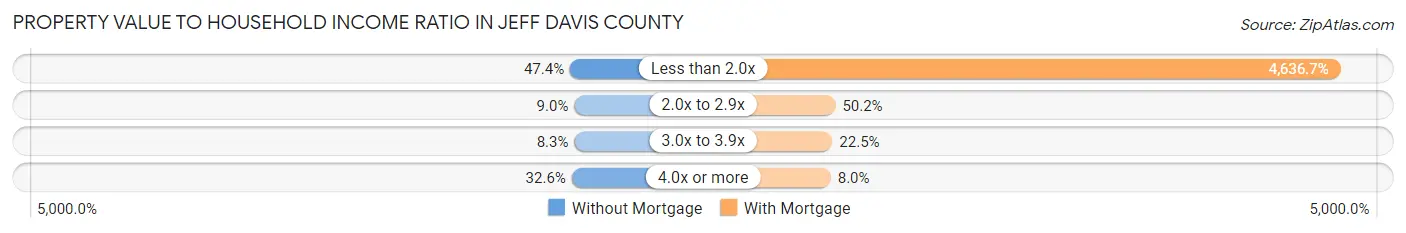
| Value-to-Income Ratio | Without Mortgage | With Mortgage |
| Less than 2.0x | 986 (47.4%) | 71,591 (4,636.7%) |
| 2.0x to 2.9x | 186 (8.9%) | 775 (50.2%) |
| 3.0x to 3.9x | 172 (8.3%) | 348 (22.5%) |
| 4.0x or more | 678 (32.6%) | 124 (8.0%) |
| Total | 2,079 (100.0%) | 1,544 (100.0%) |
Real Estate Taxes by Mortgage Status in Jeff Davis County

| Property Taxes | Without Mortgage | With Mortgage |
| Less than $800 | 979 (47.1%) | 0 (0.0%) |
| $800 to $1,499 | 623 (30.0%) | 268 (17.4%) |
| $800 to $1,499 | 363 (17.5%) | 623 (40.4%) |
| Total | 2,079 (100.0%) | 1,544 (100.0%) |
Health & Disability in Jeff Davis County
Health Insurance Coverage by Age in Jeff Davis County
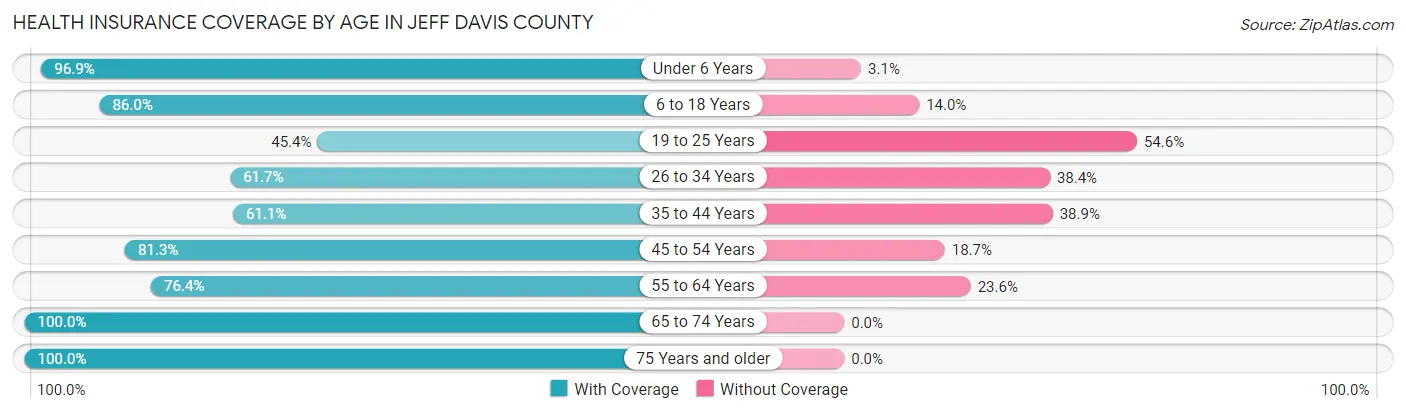
| Age Bracket | With Coverage | Without Coverage |
| Under 6 Years | 896 (96.9%) | 29 (3.1%) |
| 6 to 18 Years | 2,617 (86.0%) | 425 (14.0%) |
| 19 to 25 Years | 551 (45.4%) | 662 (54.6%) |
| 26 to 34 Years | 1,066 (61.7%) | 663 (38.4%) |
| 35 to 44 Years | 1,129 (61.1%) | 718 (38.9%) |
| 45 to 54 Years | 1,461 (81.3%) | 337 (18.7%) |
| 55 to 64 Years | 1,484 (76.4%) | 458 (23.6%) |
| 65 to 74 Years | 1,306 (100.0%) | 0 (0.0%) |
| 75 Years and older | 909 (100.0%) | 0 (0.0%) |
| Total | 11,419 (77.6%) | 3,292 (22.4%) |
Health Insurance Coverage by Citizenship Status in Jeff Davis County
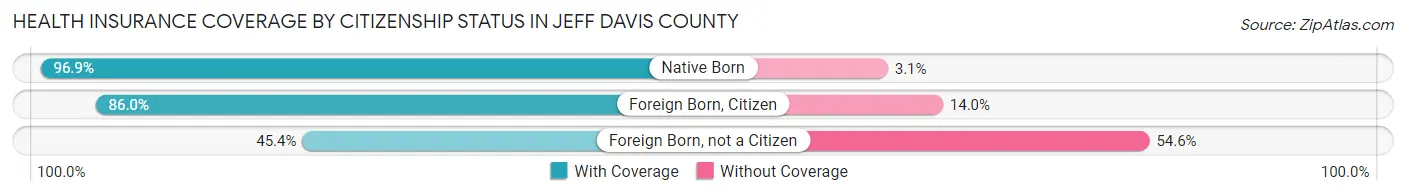
| Citizenship Status | With Coverage | Without Coverage |
| Native Born | 896 (96.9%) | 29 (3.1%) |
| Foreign Born, Citizen | 2,617 (86.0%) | 425 (14.0%) |
| Foreign Born, not a Citizen | 551 (45.4%) | 662 (54.6%) |
Health Insurance Coverage by Household Income in Jeff Davis County
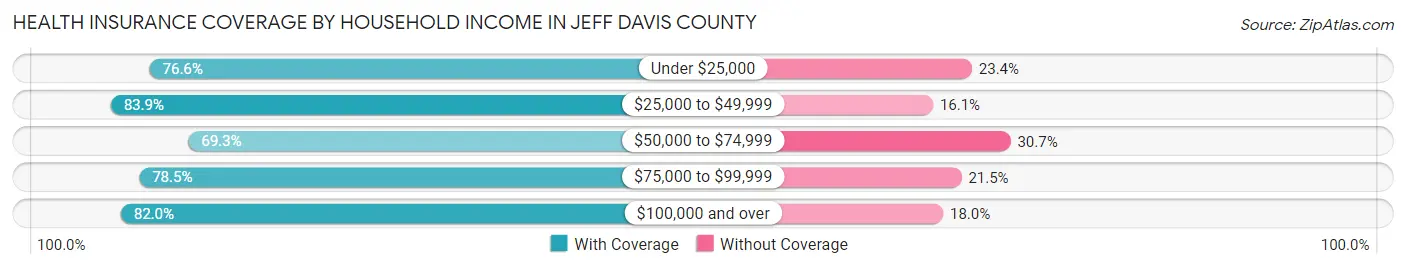
| Household Income | With Coverage | Without Coverage |
| Under $25,000 | 2,383 (76.6%) | 729 (23.4%) |
| $25,000 to $49,999 | 2,608 (83.9%) | 502 (16.1%) |
| $50,000 to $74,999 | 2,392 (69.3%) | 1,058 (30.7%) |
| $75,000 to $99,999 | 1,809 (78.5%) | 495 (21.5%) |
| $100,000 and over | 2,182 (82.0%) | 480 (18.0%) |
Public vs Private Health Insurance Coverage by Age in Jeff Davis County
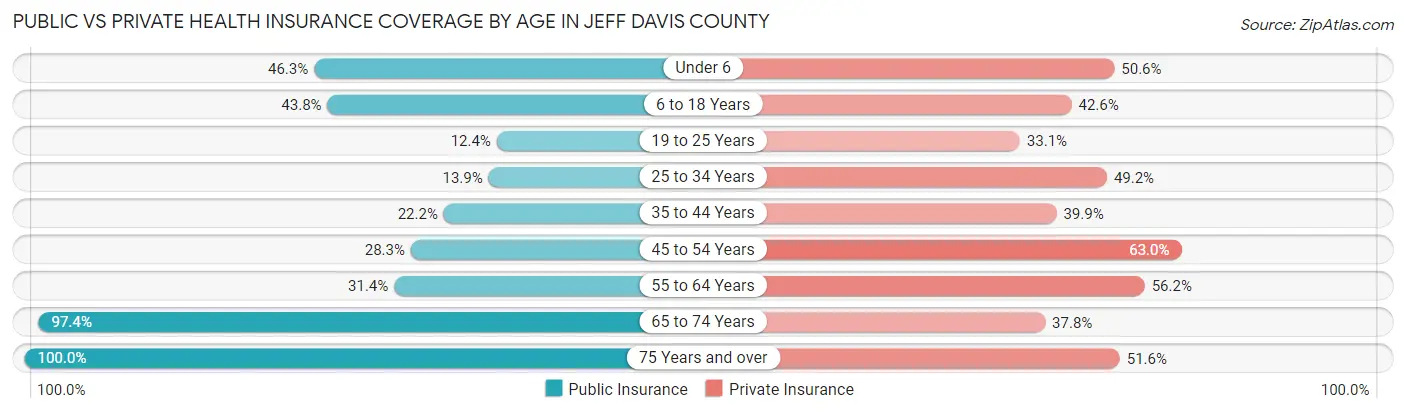
| Age Bracket | Public Insurance | Private Insurance |
| Under 6 | 428 (46.3%) | 468 (50.6%) |
| 6 to 18 Years | 1,332 (43.8%) | 1,297 (42.6%) |
| 19 to 25 Years | 150 (12.4%) | 401 (33.1%) |
| 25 to 34 Years | 240 (13.9%) | 851 (49.2%) |
| 35 to 44 Years | 410 (22.2%) | 736 (39.9%) |
| 45 to 54 Years | 509 (28.3%) | 1,133 (63.0%) |
| 55 to 64 Years | 610 (31.4%) | 1,092 (56.2%) |
| 65 to 74 Years | 1,272 (97.4%) | 493 (37.8%) |
| 75 Years and over | 909 (100.0%) | 469 (51.6%) |
| Total | 5,860 (39.8%) | 6,940 (47.2%) |
Disability Status by Sex by Age in Jeff Davis County

| Age Bracket | Male | Female |
| Under 5 Years | 0 (0.0%) | 114 (29.0%) |
| 5 to 17 Years | 272 (16.3%) | 48 (3.6%) |
| 18 to 34 Years | 81 (5.4%) | 115 (7.4%) |
| 35 to 64 Years | 795 (29.6%) | 601 (20.7%) |
| 65 to 74 Years | 265 (44.8%) | 238 (33.3%) |
| 75 Years and over | 262 (60.7%) | 236 (49.5%) |
Disability Class by Sex by Age in Jeff Davis County
Disability Class: Hearing Difficulty

| Age Bracket | Male | Female |
| Under 5 Years | 0 (0.0%) | 0 (0.0%) |
| 5 to 17 Years | 0 (0.0%) | 0 (0.0%) |
| 18 to 34 Years | 0 (0.0%) | 0 (0.0%) |
| 35 to 64 Years | 309 (11.5%) | 20 (0.7%) |
| 65 to 74 Years | 150 (25.3%) | 40 (5.6%) |
| 75 Years and over | 126 (29.2%) | 70 (14.7%) |
Disability Class: Vision Difficulty
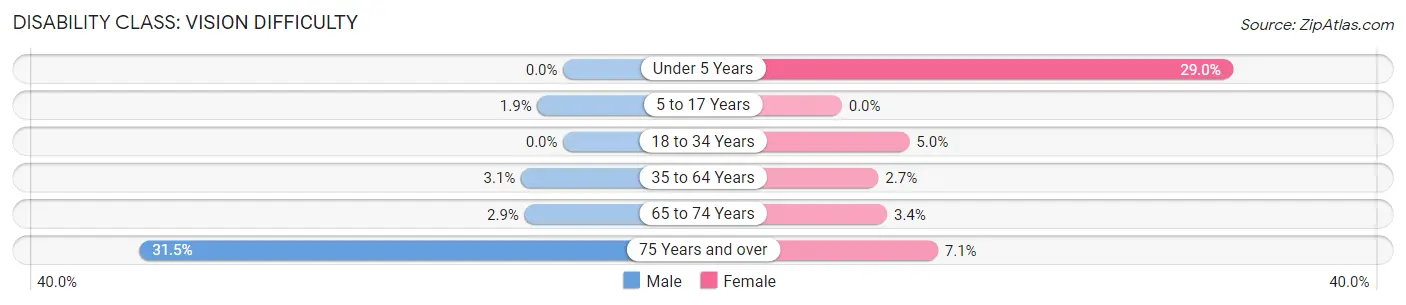
| Age Bracket | Male | Female |
| Under 5 Years | 0 (0.0%) | 114 (29.0%) |
| 5 to 17 Years | 32 (1.9%) | 0 (0.0%) |
| 18 to 34 Years | 0 (0.0%) | 78 (5.0%) |
| 35 to 64 Years | 84 (3.1%) | 79 (2.7%) |
| 65 to 74 Years | 17 (2.9%) | 24 (3.4%) |
| 75 Years and over | 136 (31.5%) | 34 (7.1%) |
Disability Class: Cognitive Difficulty

| Age Bracket | Male | Female |
| 5 to 17 Years | 197 (11.8%) | 48 (3.6%) |
| 18 to 34 Years | 81 (5.4%) | 37 (2.4%) |
| 35 to 64 Years | 367 (13.7%) | 155 (5.3%) |
| 65 to 74 Years | 20 (3.4%) | 0 (0.0%) |
| 75 Years and over | 62 (14.3%) | 20 (4.2%) |
Disability Class: Ambulatory Difficulty
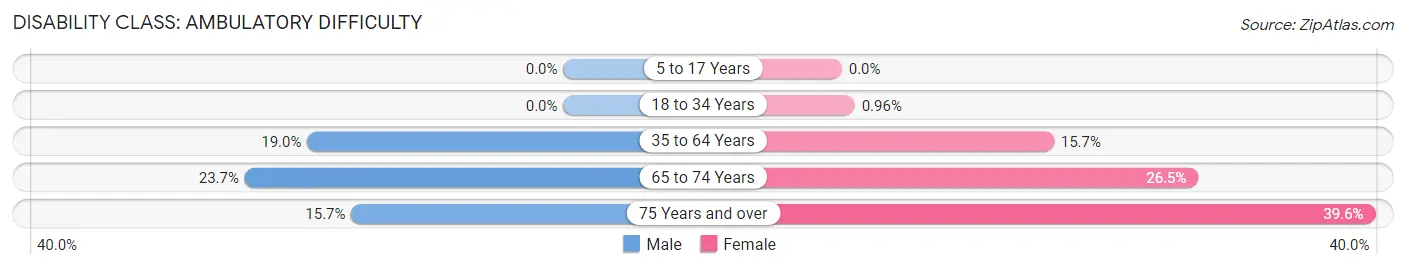
| Age Bracket | Male | Female |
| 5 to 17 Years | 0 (0.0%) | 0 (0.0%) |
| 18 to 34 Years | 0 (0.0%) | 15 (1.0%) |
| 35 to 64 Years | 510 (19.0%) | 457 (15.7%) |
| 65 to 74 Years | 140 (23.6%) | 189 (26.5%) |
| 75 Years and over | 68 (15.7%) | 189 (39.6%) |
Disability Class: Self-Care Difficulty
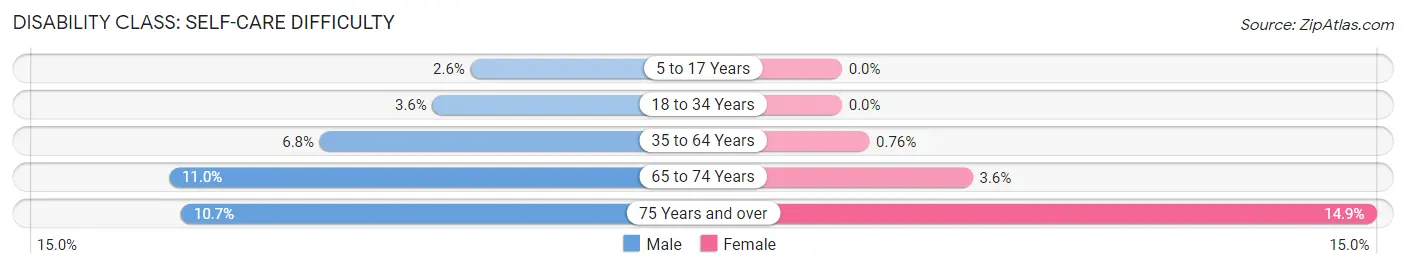
| Age Bracket | Male | Female |
| 5 to 17 Years | 43 (2.6%) | 0 (0.0%) |
| 18 to 34 Years | 55 (3.6%) | 0 (0.0%) |
| 35 to 64 Years | 182 (6.8%) | 22 (0.8%) |
| 65 to 74 Years | 65 (11.0%) | 26 (3.6%) |
| 75 Years and over | 46 (10.6%) | 71 (14.9%) |
Technology Access in Jeff Davis County
Computing Device Access in Jeff Davis County
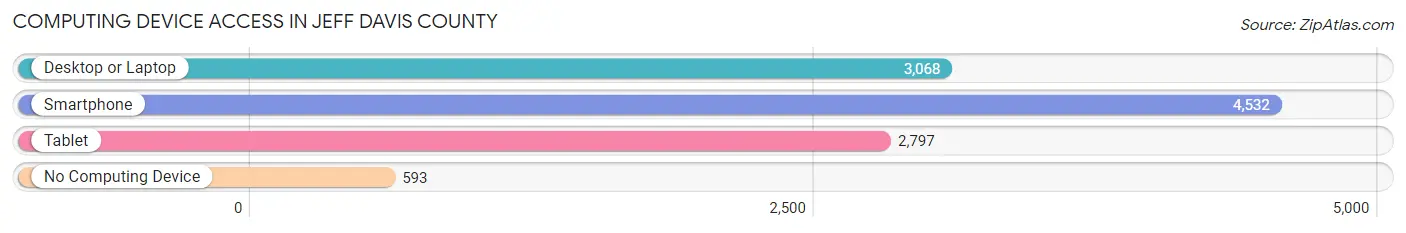
| Device Type | # Households | % Households |
| Desktop or Laptop | 3,068 | 57.2% |
| Smartphone | 4,532 | 84.5% |
| Tablet | 2,797 | 52.1% |
| No Computing Device | 593 | 11.1% |
| Total | 5,365 | 100.0% |
Internet Access in Jeff Davis County
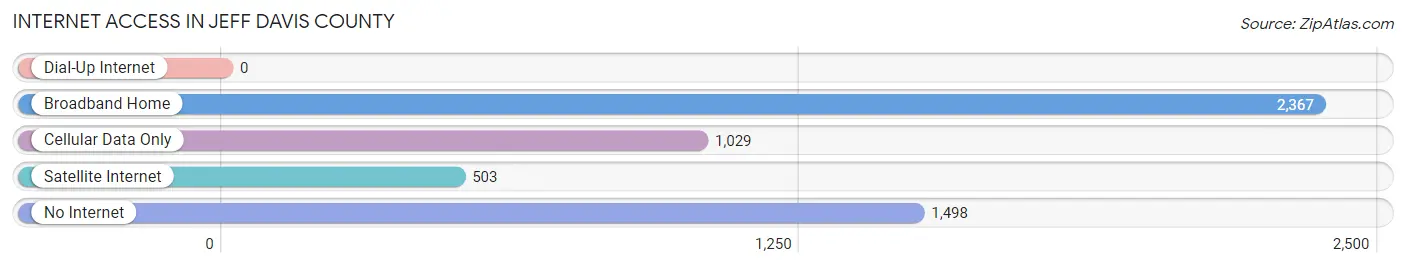
| Internet Type | # Households | % Households |
| Dial-Up Internet | 0 | 0.0% |
| Broadband Home | 2,367 | 44.1% |
| Cellular Data Only | 1,029 | 19.2% |
| Satellite Internet | 503 | 9.4% |
| No Internet | 1,498 | 27.9% |
| Total | 5,365 | 100.0% |
Jeff Davis County Summary
Jeff Davis County is located in the southeastern corner of the state of Georgia, and is part of the Georgia-Florida border region. It is bordered by Bacon County to the north, Appling County to the east, Coffee County to the south, and Atkinson County to the west. The county seat is Hazlehurst, and the county is named for Jefferson Davis, the President of the Confederate States of America.
Geography
Jeff Davis County covers an area of 545 square miles, and is mostly rural. The terrain is mostly flat, with some rolling hills in the northern part of the county. The county is drained by the Satilla River, which forms the western boundary of the county. The county is mostly forested, with some agricultural land in the northern part of the county. The climate is humid subtropical, with hot summers and mild winters.
Demographics
As of the 2010 census, Jeff Davis County had a population of 15,068. The racial makeup of the county was 73.3% White, 23.7% African American, 0.4% Native American, 0.3% Asian, 0.1% Pacific Islander, 1.2% from other races, and 1.1% from two or more races. Hispanic or Latino of any race were 3.2% of the population.
The median income for a household in the county was $30,945, and the median income for a family was $37,917. The per capita income for the county was $15,845. About 19.2% of families and 23.2% of the population were below the poverty line, including 33.2% of those under age 18 and 18.2% of those age 65 or over.
Economy
The economy of Jeff Davis County is largely based on agriculture and forestry. The county is home to several large timber companies, and the timber industry is the largest employer in the county. Other major industries include poultry farming, cattle ranching, and dairy farming. The county also has a small manufacturing sector, with several small factories producing furniture, textiles, and other products.
The county is served by two major highways, US Highway 221 and Georgia State Route 4. The county also has a small airport, the Hazlehurst Municipal Airport.
History
Jeff Davis County was created in 1905 from parts of Appling, Bacon, and Coffee counties. The county was named for Jefferson Davis, the President of the Confederate States of America. The county seat was originally located in Hazlehurst, which was founded in 1856.
The county was largely rural until the 1950s, when the timber industry began to expand. The county also saw an influx of new residents in the 1970s, when the poultry industry began to expand. The county has continued to grow since then, and today it is a largely rural area with a strong agricultural and forestry base.
Common Questions
What is the Total Population of Jeff Davis County?
Total Population of Jeff Davis County is 14,791.
What is the Total Male Population of Jeff Davis County?
Total Male Population of Jeff Davis County is 7,389.
What is the Total Female Population of Jeff Davis County?
Total Female Population of Jeff Davis County is 7,402.
What is the Ratio of Males per 100 Females in Jeff Davis County?
There are 99.82 Males per 100 Females in Jeff Davis County.
What is the Ratio of Females per 100 Males in Jeff Davis County?
There are 100.18 Females per 100 Males in Jeff Davis County.
What is the Median Population Age in Jeff Davis County?
Median Population Age in Jeff Davis County is 39.1 Years.
What is the Average Family Size in Jeff Davis County
Average Family Size in Jeff Davis County is 3.4 People.
What is the Average Household Size in Jeff Davis County
Average Household Size in Jeff Davis County is 2.7 People.
What is Per Capita Income in Jeff Davis County?
Per Capita income in Jeff Davis County is $22,065.
What is the Median Family Income in Jeff Davis County?
Median Family Income in Jeff Davis County is $52,236.
What is the Median Household income in Jeff Davis County?
Median Household Income in Jeff Davis County is $41,780.
What is Income or Wage Gap in Jeff Davis County?
Income or Wage Gap in Jeff Davis County is 21.8%.
Women in Jeff Davis County earn 78.2 cents for every dollar earned by a man.
What is Family Income Deficit in Jeff Davis County?
Family Income Deficit in Jeff Davis County is $11,451.
Families that are below poverty line in Jeff Davis County earn $11,451 less on average than the poverty threshold level.
What is Inequality or Gini Index in Jeff Davis County?
Inequality or Gini Index in Jeff Davis County is 0.46.
How Large is the Labor Force in Jeff Davis County?
There are 6,066 People in the Labor Forcein in Jeff Davis County.
What is the Percentage of People in the Labor Force in Jeff Davis County?
52.5% of People are in the Labor Force in Jeff Davis County.
What is the Unemployment Rate in Jeff Davis County?
Unemployment Rate in Jeff Davis County is 4.1%.