Irwin County, GA
Irwin County Map

Irwin County Overview
9,487
TOTAL POPULATION
4,957
MALE POPULATION
4,530
FEMALE POPULATION
109.43
MALES / 100 FEMALES
91.39
FEMALES / 100 MALES
39.8
MEDIAN AGE
3.3
AVG FAMILY SIZE
2.6
AVG HOUSEHOLD SIZE
$23,794
PER CAPITA INCOME
$68,065
AVG FAMILY INCOME
$46,383
AVG HOUSEHOLD INCOME
16.3%
WAGE / INCOME GAP [ % ]
83.7¢/ $1
WAGE / INCOME GAP [ $ ]
0.43
INEQUALITY / GINI INDEX
4,176
LABOR FORCE [ PEOPLE ]
53.3%
PERCENT IN LABOR FORCE
6.2%
UNEMPLOYMENT RATE
Irwin County Area Codes
Race in Irwin County
The most populous races in Irwin County are White / Caucasian (6,550 | 69.0%), Black / African American (2,492 | 26.3%), and Hispanic or Latino (393 | 4.1%).

| Race | # Population | % Population |
| Asian | 20 | 0.2% |
| Black / African American | 2,492 | 26.3% |
| Hawaiian / Pacific | 0 | 0.0% |
| Hispanic or Latino | 393 | 4.1% |
| Native / Alaskan | 14 | 0.2% |
| White / Caucasian | 6,550 | 69.0% |
| Two or more Races | 129 | 1.4% |
| Some other Race | 282 | 3.0% |
| Total | 9,487 | 100.0% |
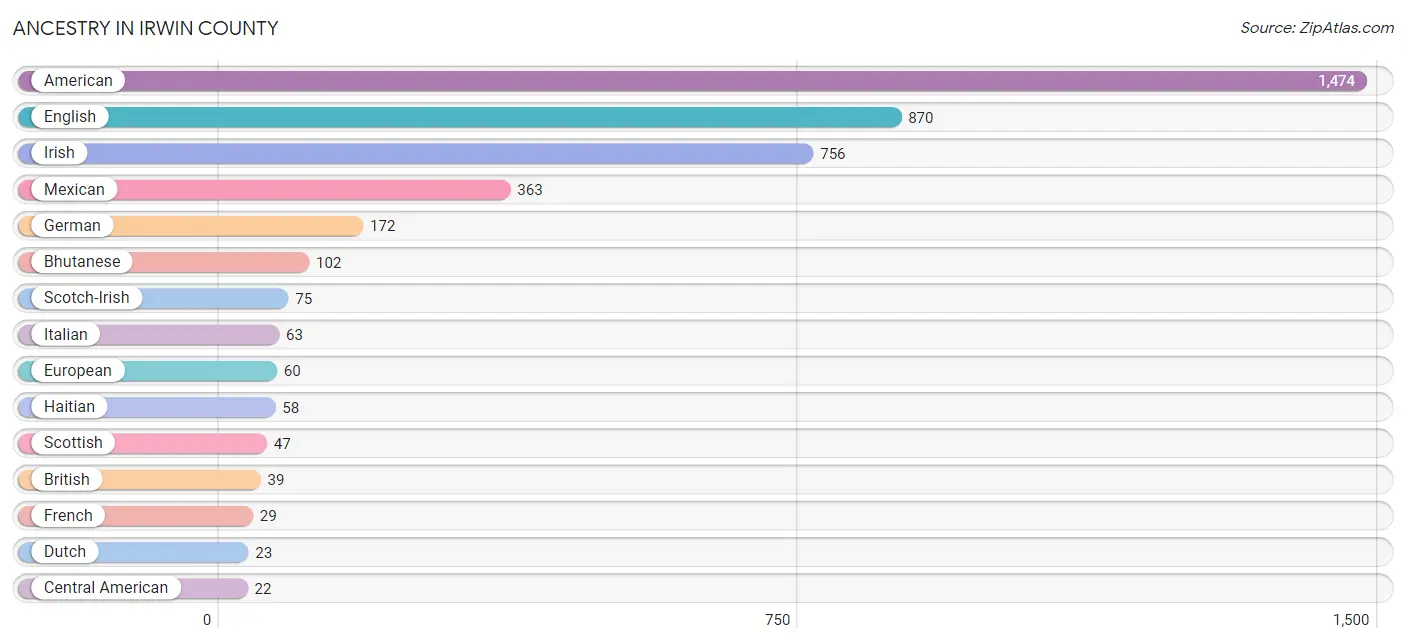
Ancestry in Irwin County
The most populous ancestries reported in Irwin County are American (1,474 | 15.5%), English (870 | 9.2%), Irish (756 | 8.0%), Mexican (363 | 3.8%), and German (172 | 1.8%), together accounting for 38.3% of all Irwin County residents.
| Ancestry | # Population | % Population |
| African | 8 | 0.1% |
| American | 1,474 | 15.5% |
| Bhutanese | 102 | 1.1% |
| British | 39 | 0.4% |
| Canadian | 12 | 0.1% |
| Central American | 22 | 0.2% |
| Czechoslovakian | 11 | 0.1% |
| Dutch | 23 | 0.2% |
| Eastern European | 8 | 0.1% |
| English | 870 | 9.2% |
| European | 60 | 0.6% |
| French | 29 | 0.3% |
| French Canadian | 13 | 0.1% |
| German | 172 | 1.8% |
| Haitian | 58 | 0.6% |
| Honduran | 10 | 0.1% |
| Irish | 756 | 8.0% |
| Italian | 63 | 0.7% |
| Lumbee | 14 | 0.2% |
| Mexican | 363 | 3.8% |
| Nigerian | 10 | 0.1% |
| Norwegian | 15 | 0.2% |
| Pakistani | 15 | 0.2% |
| Puerto Rican | 7 | 0.1% |
| Salvadoran | 12 | 0.1% |
| Scandinavian | 1 | 0.0% |
| Scotch-Irish | 75 | 0.8% |
| Scottish | 47 | 0.5% |
| Slovak | 6 | 0.1% |
| Subsaharan African | 18 | 0.2% |
| Swiss | 8 | 0.1% |
| Thai | 5 | 0.1% | View All 32 Rows |
Immigrants in Irwin County
The most numerous immigrant groups reported in Irwin County came from Central America (82 | 0.9%), Latin America (82 | 0.9%), Mexico (72 | 0.8%), Europe (29 | 0.3%), and Germany (29 | 0.3%), together accounting for 3.1% of all Irwin County residents.

| Immigration Origin | # Population | % Population |
| Asia | 20 | 0.2% |
| Central America | 82 | 0.9% |
| Europe | 29 | 0.3% |
| Germany | 29 | 0.3% |
| Honduras | 10 | 0.1% |
| India | 5 | 0.1% |
| Latin America | 82 | 0.9% |
| Mexico | 72 | 0.8% |
| South Central Asia | 5 | 0.1% |
| South Eastern Asia | 15 | 0.2% |
| Thailand | 15 | 0.2% |
| Western Europe | 29 | 0.3% | View All 12 Rows |
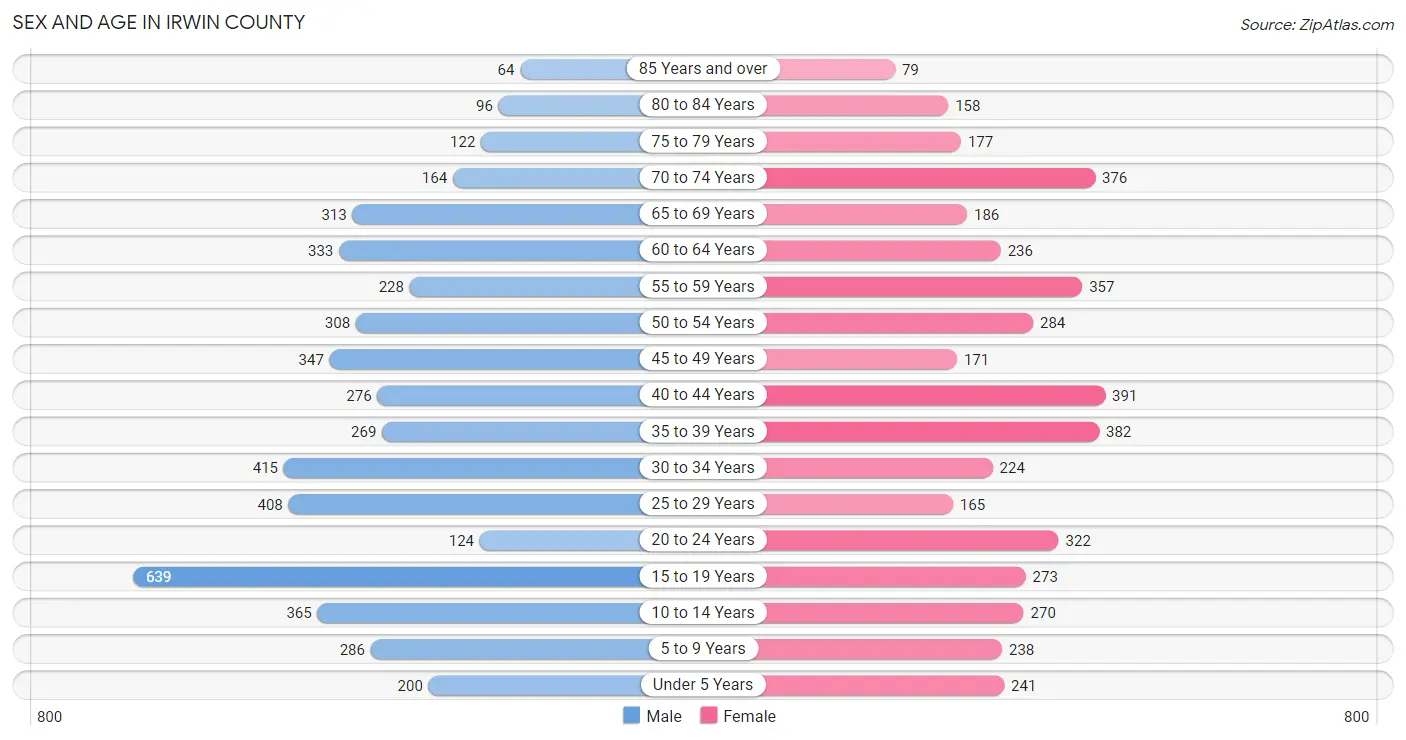
Sex and Age in Irwin County
Sex and Age in Irwin County
The most populous age groups in Irwin County are 15 to 19 Years (639 | 12.9%) for men and 40 to 44 Years (391 | 8.6%) for women.
| Age Bracket | Male | Female |
| Under 5 Years | 200 (4.0%) | 241 (5.3%) |
| 5 to 9 Years | 286 (5.8%) | 238 (5.2%) |
| 10 to 14 Years | 365 (7.4%) | 270 (6.0%) |
| 15 to 19 Years | 639 (12.9%) | 273 (6.0%) |
| 20 to 24 Years | 124 (2.5%) | 322 (7.1%) |
| 25 to 29 Years | 408 (8.2%) | 165 (3.6%) |
| 30 to 34 Years | 415 (8.4%) | 224 (4.9%) |
| 35 to 39 Years | 269 (5.4%) | 382 (8.4%) |
| 40 to 44 Years | 276 (5.6%) | 391 (8.6%) |
| 45 to 49 Years | 347 (7.0%) | 171 (3.8%) |
| 50 to 54 Years | 308 (6.2%) | 284 (6.3%) |
| 55 to 59 Years | 228 (4.6%) | 357 (7.9%) |
| 60 to 64 Years | 333 (6.7%) | 236 (5.2%) |
| 65 to 69 Years | 313 (6.3%) | 186 (4.1%) |
| 70 to 74 Years | 164 (3.3%) | 376 (8.3%) |
| 75 to 79 Years | 122 (2.5%) | 177 (3.9%) |
| 80 to 84 Years | 96 (1.9%) | 158 (3.5%) |
| 85 Years and over | 64 (1.3%) | 79 (1.7%) |
| Total | 4,957 (100.0%) | 4,530 (100.0%) |
Families and Households in Irwin County
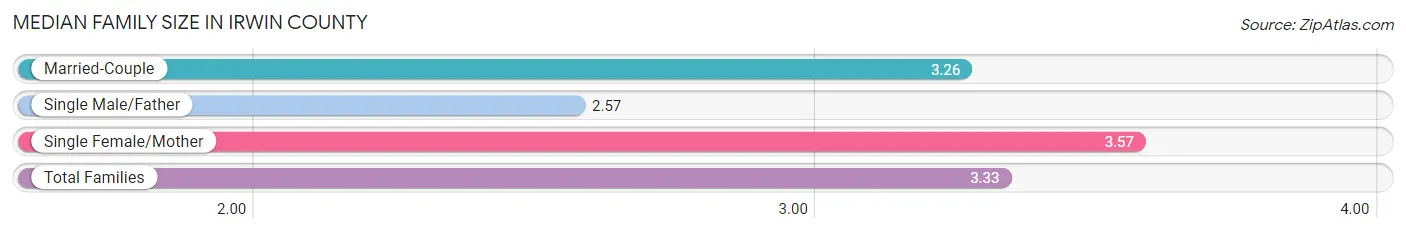
Median Family Size in Irwin County
The median family size in Irwin County is 3.33 persons per family, with single female/mother families (646 | 27.9%) accounting for the largest median family size of 3.57 persons per family. On the other hand, single male/father families (81 | 3.5%) represent the smallest median family size with 2.57 persons per family.
| Family Type | # Families | Family Size |
| Married-Couple | 1,587 (68.6%) | 3.26 |
| Single Male/Father | 81 (3.5%) | 2.57 |
| Single Female/Mother | 646 (27.9%) | 3.57 |
| Total Families | 2,314 (100.0%) | 3.33 |
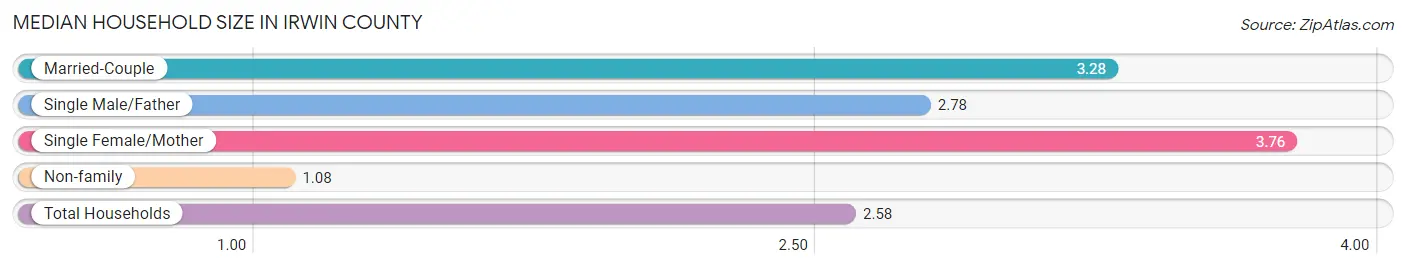
Median Household Size in Irwin County
The median household size in Irwin County is 2.58 persons per household, with single female/mother households (646 | 18.1%) accounting for the largest median household size of 3.76 persons per household. non-family households (1,252 | 35.1%) represent the smallest median household size with 1.08 persons per household.
| Household Type | # Households | Household Size |
| Married-Couple | 1,587 (44.5%) | 3.28 |
| Single Male/Father | 81 (2.3%) | 2.78 |
| Single Female/Mother | 646 (18.1%) | 3.76 |
| Non-family | 1,252 (35.1%) | 1.08 |
| Total Households | 3,566 (100.0%) | 2.58 |
Household Size by Marriage Status in Irwin County
Out of a total of 3,566 households in Irwin County, 2,314 (64.9%) are family households, while 1,252 (35.1%) are nonfamily households. The most numerous type of family households are 2-person households, comprising 1,010, and the most common type of nonfamily households are 1-person households, comprising 1,181.
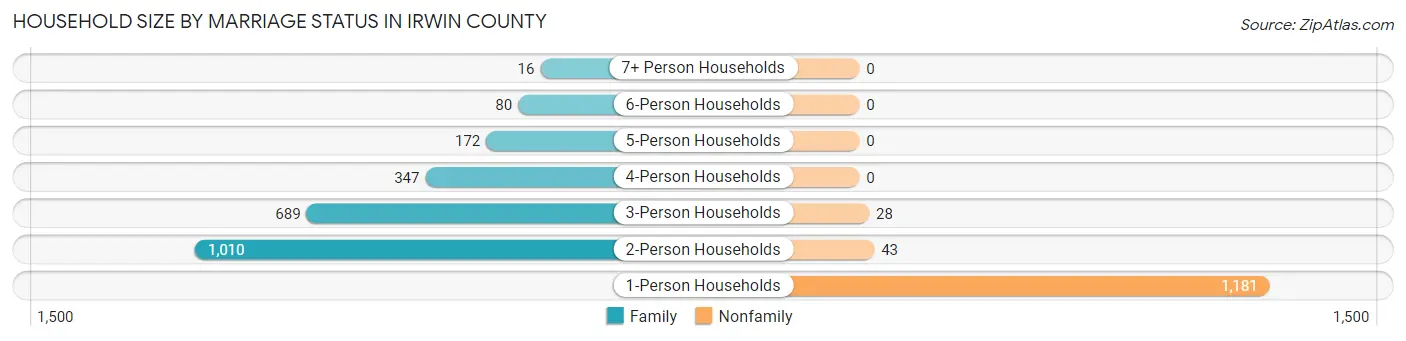
| Household Size | Family Households | Nonfamily Households |
| 1-Person Households | - | 1,181 (33.1%) |
| 2-Person Households | 1,010 (28.3%) | 43 (1.2%) |
| 3-Person Households | 689 (19.3%) | 28 (0.8%) |
| 4-Person Households | 347 (9.7%) | 0 (0.0%) |
| 5-Person Households | 172 (4.8%) | 0 (0.0%) |
| 6-Person Households | 80 (2.2%) | 0 (0.0%) |
| 7+ Person Households | 16 (0.4%) | 0 (0.0%) |
| Total | 2,314 (64.9%) | 1,252 (35.1%) |
Female Fertility in Irwin County
Fertility by Age in Irwin County
Average fertility rate in Irwin County is 44.0 births per 1,000 women. Women in the age bracket of 20 to 34 years have the highest fertility rate with 121.0 births per 1,000 women. Women in the age bracket of 20 to 34 years acount for 100.0% of all women with births.
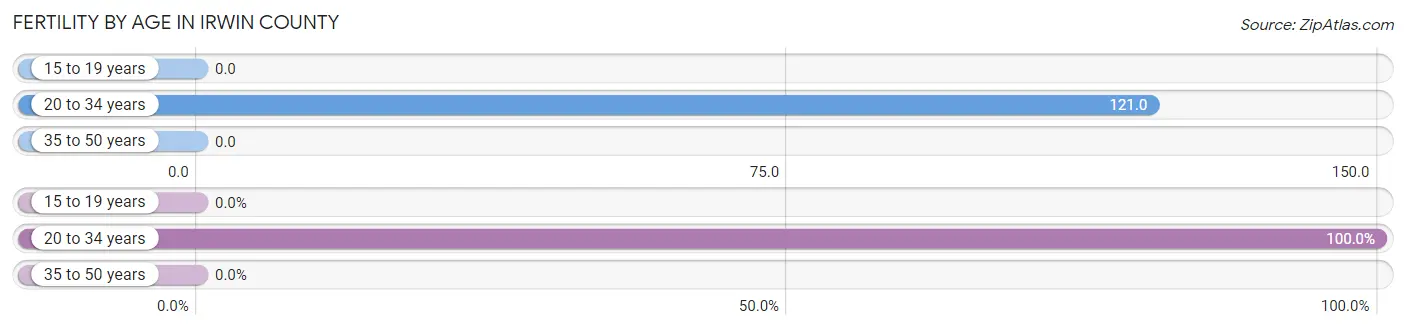
| Age Bracket | Women with Births | Births / 1,000 Women |
| 15 to 19 years | 0 (0.0%) | 0.0 |
| 20 to 34 years | 86 (100.0%) | 121.0 |
| 35 to 50 years | 0 (0.0%) | 0.0 |
| Total | 86 (100.0%) | 44.0 |
Fertility by Age by Marriage Status in Irwin County
14.0% of women with births (86) in Irwin County are married. The highest percentage of unmarried women with births falls into 20 to 34 years age bracket with 86.1% of them unmarried at the time of birth, while the lowest percentage of unmarried women with births belong to 20 to 34 years age bracket with 86.1% of them unmarried.
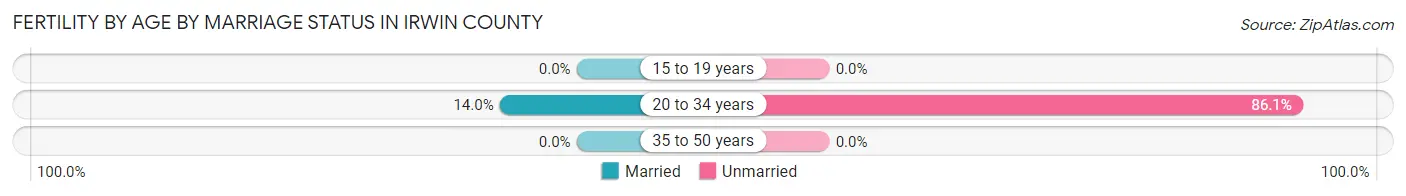
| Age Bracket | Married | Unmarried |
| 15 to 19 years | 0 (0.0%) | 0 (0.0%) |
| 20 to 34 years | 12 (14.0%) | 74 (86.1%) |
| 35 to 50 years | 0 (0.0%) | 0 (0.0%) |
| Total | 12 (14.0%) | 74 (86.1%) |
Fertility by Education in Irwin County

| Educational Attainment | Women with Births | Births / 1,000 Women |
| Less than High School | 23 (26.7%) | 64.0 |
| High School Diploma | 31 (36.0%) | 52.0 |
| College or Associate's Degree | 28 (32.6%) | 34.0 |
| Bachelor's Degree | 4 (4.6%) | 67.0 |
| Graduate Degree | 0 (0.0%) | 0.0 |
| Total | 86 (100.0%) | 44.0 |
Fertility by Education by Marriage Status in Irwin County
86.1% of women with births in Irwin County are unmarried. Women with the educational attainment of bachelor's degree are most likely to be married with 100.0% of them married at childbirth, while women with the educational attainment of less than high school are least likely to be married with 100.0% of them unmarried at childbirth.
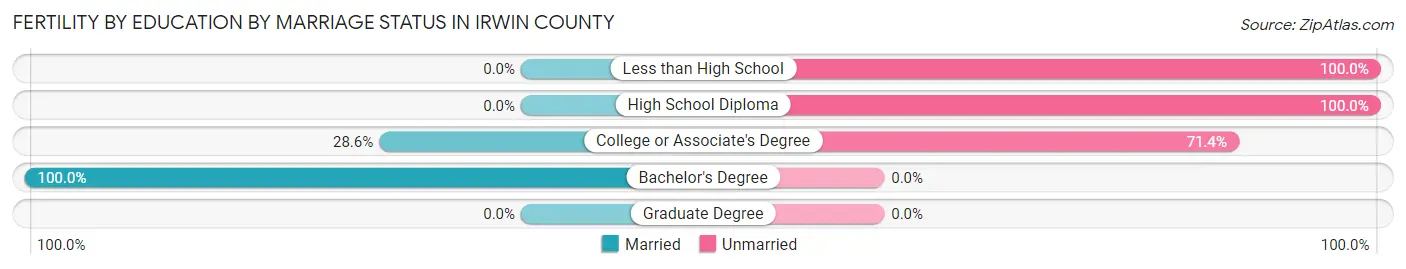
| Educational Attainment | Married | Unmarried |
| Less than High School | 0 (0.0%) | 23 (100.0%) |
| High School Diploma | 0 (0.0%) | 31 (100.0%) |
| College or Associate's Degree | 8 (28.6%) | 20 (71.4%) |
| Bachelor's Degree | 4 (100.0%) | 0 (0.0%) |
| Graduate Degree | 0 (0.0%) | 0 (0.0%) |
| Total | 12 (14.0%) | 74 (86.1%) |
Income in Irwin County
Income Overview in Irwin County
Per Capita Income in Irwin County is $23,794, while median incomes of families and households are $68,065 and $46,383 respectively.
| Characteristic | Number | Measure |
| Per Capita Income | 9,487 | $23,794 |
| Median Family Income | 2,314 | $68,065 |
| Mean Family Income | 2,314 | $73,030 |
| Median Household Income | 3,566 | $46,383 |
| Mean Household Income | 3,566 | $59,585 |
| Income Deficit | 2,314 | $0 |
| Wage / Income Gap (%) | 9,487 | 16.29% |
| Wage / Income Gap ($) | 9,487 | 83.71¢ per $1 |
| Gini / Inequality Index | 9,487 | 0.43 |
Earnings by Sex in Irwin County
Average Earnings in Irwin County are $31,578, $33,902 for men and $28,380 for women, a difference of 16.3%.
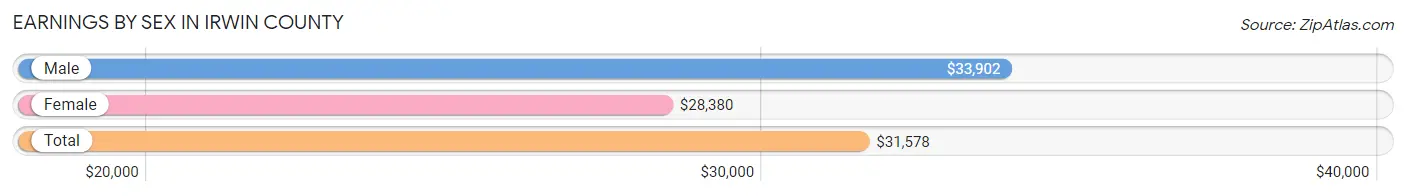
| Sex | Number | Average Earnings |
| Male | 2,266 (53.6%) | $33,902 |
| Female | 1,958 (46.4%) | $28,380 |
| Total | 4,224 (100.0%) | $31,578 |
Earnings by Sex by Income Bracket in Irwin County
The most common earnings brackets in Irwin County are $65,000 to $74,999 for men (235 | 10.4%) and $30,000 to $34,999 for women (271 | 13.8%).
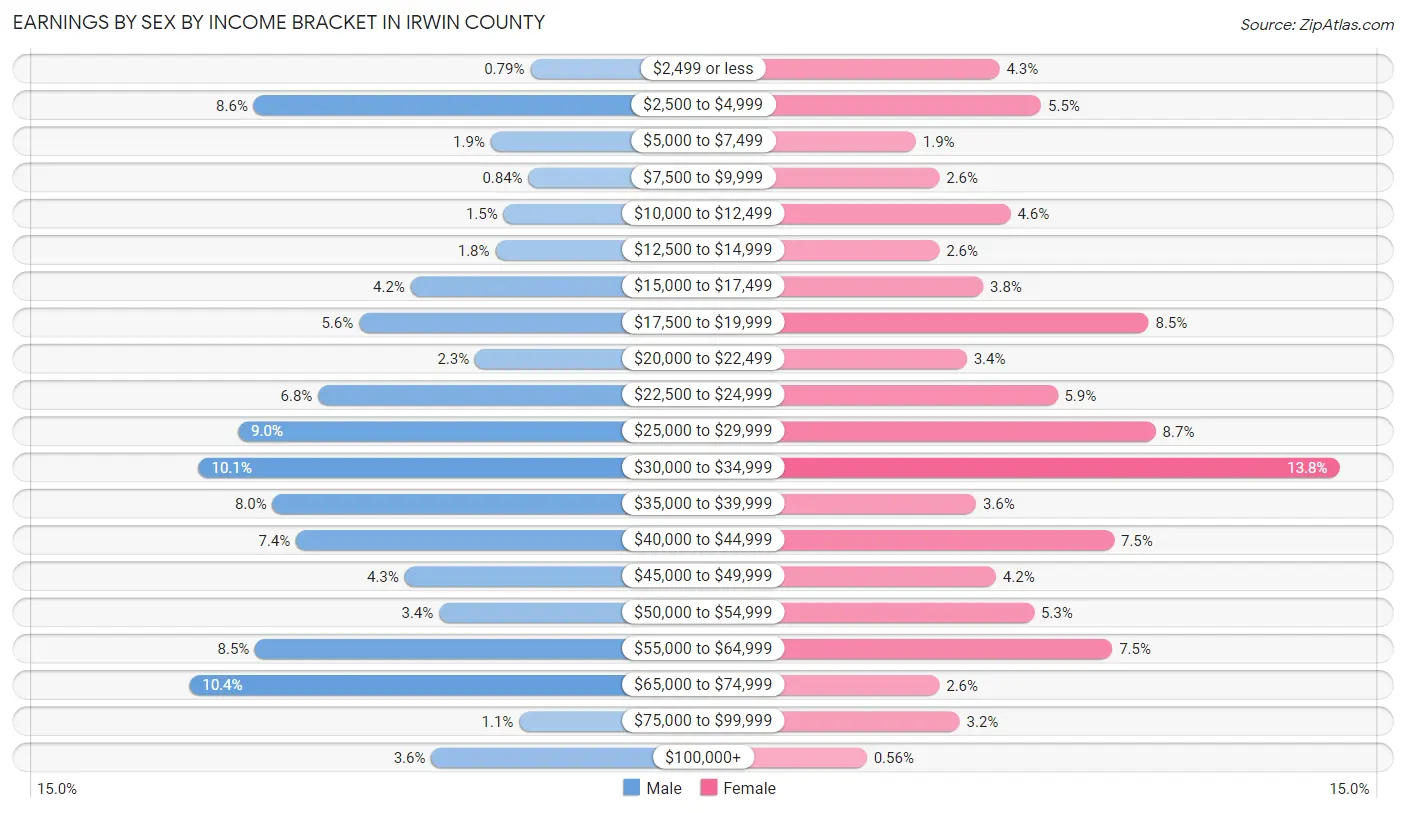
| Income | Male | Female |
| $2,499 or less | 18 (0.8%) | 84 (4.3%) |
| $2,500 to $4,999 | 194 (8.6%) | 107 (5.5%) |
| $5,000 to $7,499 | 43 (1.9%) | 38 (1.9%) |
| $7,500 to $9,999 | 19 (0.8%) | 51 (2.6%) |
| $10,000 to $12,499 | 35 (1.5%) | 90 (4.6%) |
| $12,500 to $14,999 | 40 (1.8%) | 51 (2.6%) |
| $15,000 to $17,499 | 94 (4.2%) | 75 (3.8%) |
| $17,500 to $19,999 | 127 (5.6%) | 166 (8.5%) |
| $20,000 to $22,499 | 53 (2.3%) | 66 (3.4%) |
| $22,500 to $24,999 | 153 (6.8%) | 116 (5.9%) |
| $25,000 to $29,999 | 204 (9.0%) | 170 (8.7%) |
| $30,000 to $34,999 | 229 (10.1%) | 271 (13.8%) |
| $35,000 to $39,999 | 182 (8.0%) | 71 (3.6%) |
| $40,000 to $44,999 | 167 (7.4%) | 147 (7.5%) |
| $45,000 to $49,999 | 98 (4.3%) | 82 (4.2%) |
| $50,000 to $54,999 | 76 (3.4%) | 103 (5.3%) |
| $55,000 to $64,999 | 193 (8.5%) | 146 (7.5%) |
| $65,000 to $74,999 | 235 (10.4%) | 51 (2.6%) |
| $75,000 to $99,999 | 25 (1.1%) | 62 (3.2%) |
| $100,000+ | 81 (3.6%) | 11 (0.6%) |
| Total | 2,266 (100.0%) | 1,958 (100.0%) |
Earnings by Sex by Educational Attainment in Irwin County
Average earnings in Irwin County are $34,963 for men and $30,271 for women, a difference of 13.4%. Men with an educational attainment of bachelor's degree enjoy the highest average annual earnings of $68,631, while those with less than high school education earn the least with $29,547. Women with an educational attainment of graduate degree earn the most with the average annual earnings of $44,440, while those with less than high school education have the smallest earnings of $22,750.
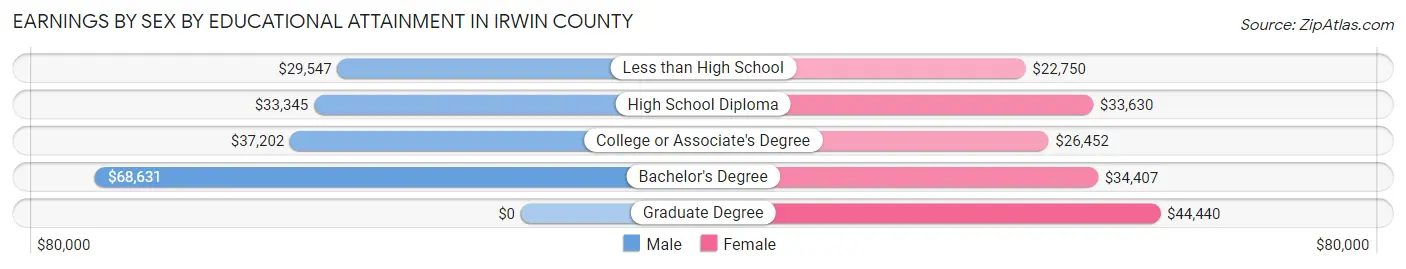
| Educational Attainment | Male Income | Female Income |
| Less than High School | $29,547 | $22,750 |
| High School Diploma | $33,345 | $33,630 |
| College or Associate's Degree | $37,202 | $26,452 |
| Bachelor's Degree | $68,631 | $34,407 |
| Graduate Degree | - | - |
| Total | $34,963 | $30,271 |
Family Income in Irwin County
Family Income Brackets in Irwin County
According to the Irwin County family income data, there are 583 families falling into the $50,000 to $74,999 income range, which is the most common income bracket and makes up 25.2% of all families. Conversely, the $10,000 to $14,999 income bracket is the least frequent group with only 56 families (2.4%) belonging to this category.
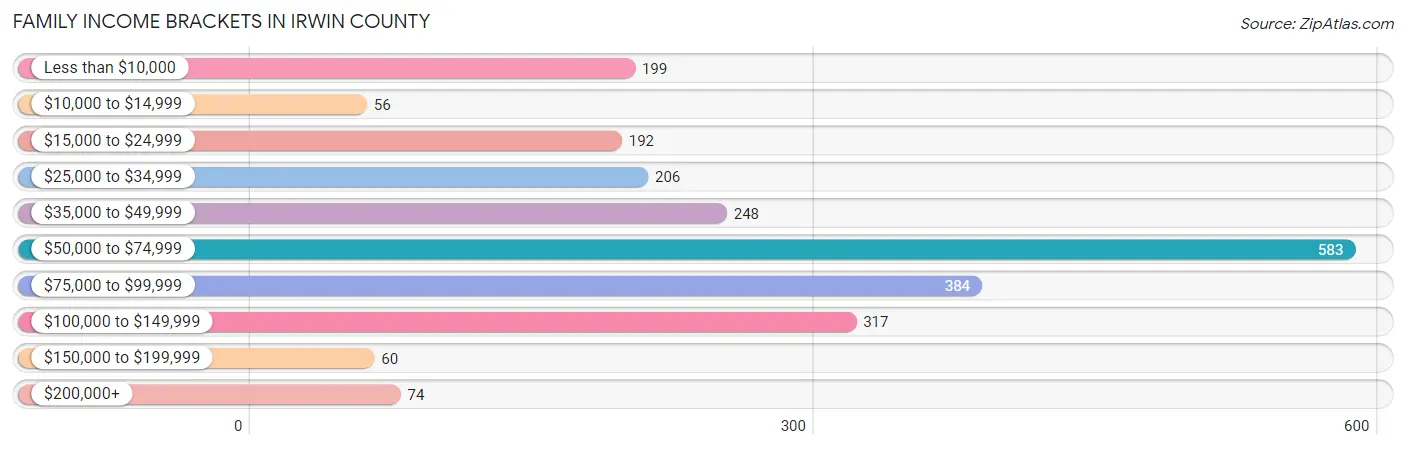
| Income Bracket | # Families | % Families |
| Less than $10,000 | 199 | 8.6% |
| $10,000 to $14,999 | 56 | 2.4% |
| $15,000 to $24,999 | 192 | 8.3% |
| $25,000 to $34,999 | 206 | 8.9% |
| $35,000 to $49,999 | 248 | 10.7% |
| $50,000 to $74,999 | 583 | 25.2% |
| $75,000 to $99,999 | 384 | 16.6% |
| $100,000 to $149,999 | 317 | 13.7% |
| $150,000 to $199,999 | 60 | 2.6% |
| $200,000+ | 74 | 3.2% |
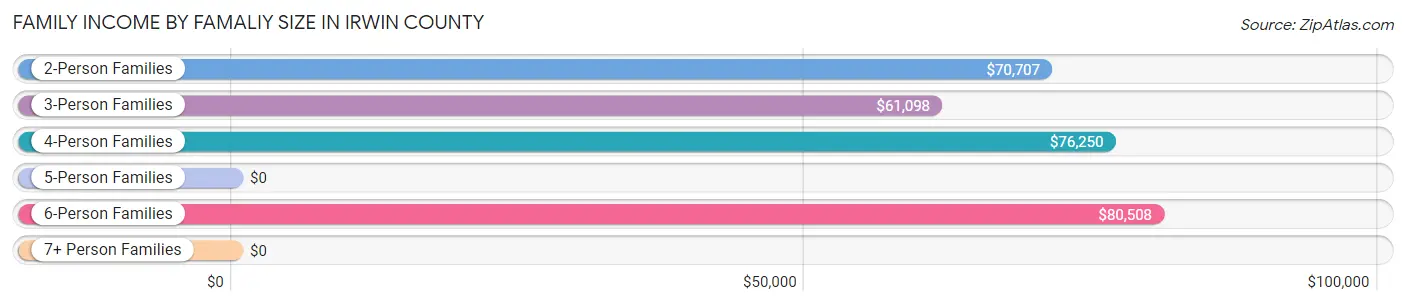
Family Income by Famaliy Size in Irwin County
6-person families (83 | 3.6%) account for the highest median family income in Irwin County with $80,508 per family, while 2-person families (1,073 | 46.4%) have the highest median income of $35,354 per family member.
| Income Bracket | # Families | Median Income |
| 2-Person Families | 1,073 (46.4%) | $70,707 |
| 3-Person Families | 646 (27.9%) | $61,098 |
| 4-Person Families | 345 (14.9%) | $76,250 |
| 5-Person Families | 167 (7.2%) | $0 |
| 6-Person Families | 83 (3.6%) | $80,508 |
| 7+ Person Families | 0 (0.0%) | $0 |
| Total | 2,314 (100.0%) | $68,065 |
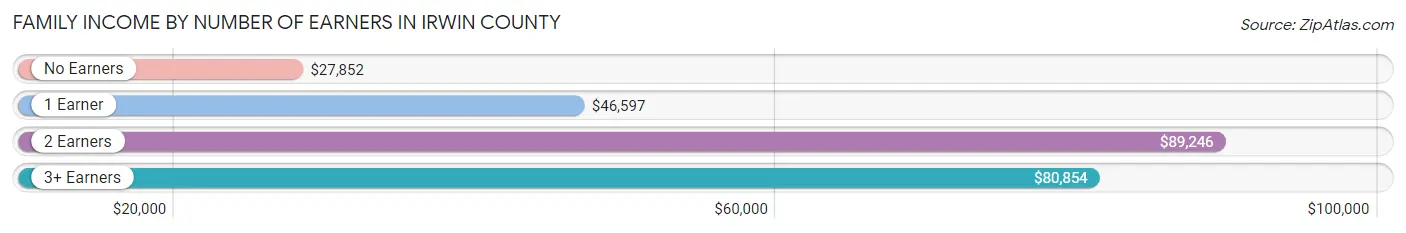
Family Income by Number of Earners in Irwin County
The median family income in Irwin County is $68,065, with families comprising 2 earners (707) having the highest median family income of $89,246, while families with no earners (339) have the lowest median family income of $27,852, accounting for 30.5% and 14.6% of families, respectively.
| Number of Earners | # Families | Median Income |
| No Earners | 339 (14.6%) | $27,852 |
| 1 Earner | 1,040 (44.9%) | $46,597 |
| 2 Earners | 707 (30.5%) | $89,246 |
| 3+ Earners | 228 (9.9%) | $80,854 |
| Total | 2,314 (100.0%) | $68,065 |
Household Income in Irwin County
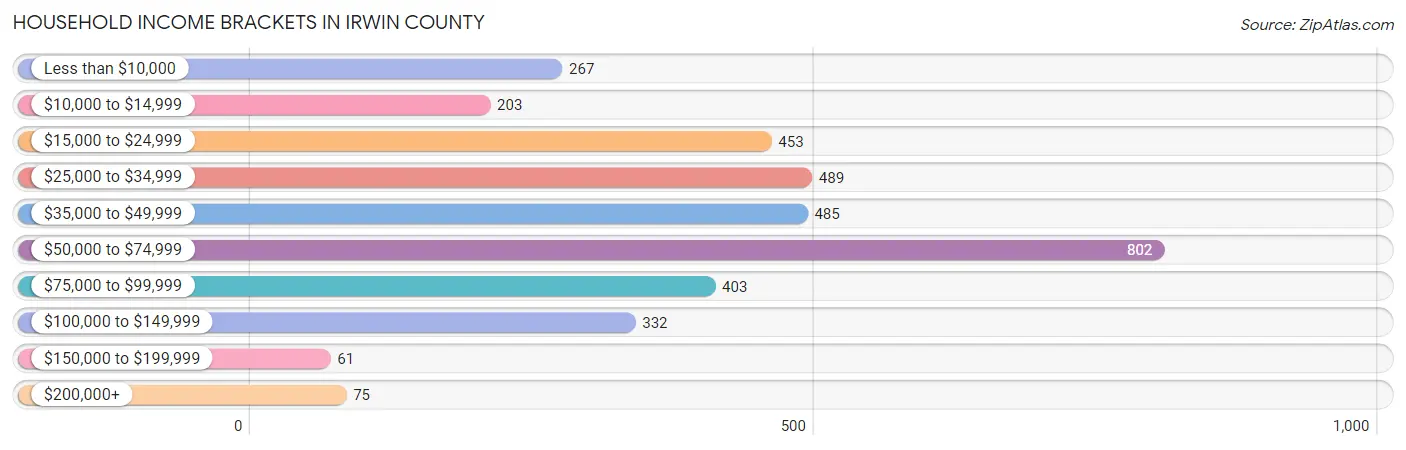
Household Income Brackets in Irwin County
With 802 households falling in the category, the $50,000 to $74,999 income range is the most frequent in Irwin County, accounting for 22.5% of all households. In contrast, only 61 households (1.7%) fall into the $150,000 to $199,999 income bracket, making it the least populous group.
| Income Bracket | # Households | % Households |
| Less than $10,000 | 267 | 7.5% |
| $10,000 to $14,999 | 203 | 5.7% |
| $15,000 to $24,999 | 453 | 12.7% |
| $25,000 to $34,999 | 489 | 13.7% |
| $35,000 to $49,999 | 485 | 13.6% |
| $50,000 to $74,999 | 802 | 22.5% |
| $75,000 to $99,999 | 403 | 11.3% |
| $100,000 to $149,999 | 332 | 9.3% |
| $150,000 to $199,999 | 61 | 1.7% |
| $200,000+ | 75 | 2.1% |
Household Income by Householder Age in Irwin County
The median household income in Irwin County is $46,383, with the highest median household income of $67,872 found in the 45 to 64 years age bracket for the primary householder. A total of 1,186 households (33.3%) fall into this category. Meanwhile, the 15 to 24 years age bracket for the primary householder has the lowest median household income of $0, with 62 households (1.7%) in this group.

| Income Bracket | # Households | Median Income |
| 15 to 24 Years | 62 (1.7%) | $0 |
| 25 to 44 Years | 1,164 (32.6%) | $49,359 |
| 45 to 64 Years | 1,186 (33.3%) | $67,872 |
| 65+ Years | 1,154 (32.4%) | $36,929 |
| Total | 3,566 (100.0%) | $46,383 |
Poverty in Irwin County
Income Below Poverty by Sex and Age in Irwin County
With 22.7% poverty level for males and 21.2% for females among the residents of Irwin County, 12 to 14 year old males and under 5 year old females are the most vulnerable to poverty, with 115 males (44.8%) and 125 females (51.9%) in their respective age groups living below the poverty level.

| Age Bracket | Male | Female |
| Under 5 Years | 84 (42.0%) | 125 (51.9%) |
| 5 Years | 0 (0.0%) | 0 (0.0%) |
| 6 to 11 Years | 124 (35.8%) | 40 (15.6%) |
| 12 to 14 Years | 115 (44.8%) | 44 (26.0%) |
| 15 Years | 0 (0.0%) | 0 (0.0%) |
| 16 and 17 Years | 83 (30.3%) | 27 (17.3%) |
| 18 to 24 Years | 104 (25.9%) | 188 (42.9%) |
| 25 to 34 Years | 180 (22.8%) | 83 (21.3%) |
| 35 to 44 Years | 104 (20.8%) | 210 (27.2%) |
| 45 to 54 Years | 136 (21.8%) | 107 (23.5%) |
| 55 to 64 Years | 70 (12.9%) | 25 (4.2%) |
| 65 to 74 Years | 53 (11.3%) | 83 (14.8%) |
| 75 Years and over | 30 (10.7%) | 13 (3.9%) |
| Total | 1,083 (22.7%) | 945 (21.2%) |
Income Above Poverty by Sex and Age in Irwin County
According to the poverty statistics in Irwin County, males aged 5 years and females aged 5 years are the age groups that are most secure financially, with 100.0% of males and 100.0% of females in these age groups living above the poverty line.

| Age Bracket | Male | Female |
| Under 5 Years | 116 (58.0%) | 116 (48.1%) |
| 5 Years | 37 (100.0%) | 83 (100.0%) |
| 6 to 11 Years | 222 (64.2%) | 216 (84.4%) |
| 12 to 14 Years | 142 (55.2%) | 125 (74.0%) |
| 15 Years | 53 (100.0%) | 0 (0.0%) |
| 16 and 17 Years | 191 (69.7%) | 129 (82.7%) |
| 18 to 24 Years | 298 (74.1%) | 250 (57.1%) |
| 25 to 34 Years | 609 (77.2%) | 306 (78.7%) |
| 35 to 44 Years | 396 (79.2%) | 563 (72.8%) |
| 45 to 54 Years | 487 (78.2%) | 348 (76.5%) |
| 55 to 64 Years | 471 (87.1%) | 568 (95.8%) |
| 65 to 74 Years | 415 (88.7%) | 479 (85.2%) |
| 75 Years and over | 251 (89.3%) | 323 (96.1%) |
| Total | 3,688 (77.3%) | 3,506 (78.8%) |
Income Below Poverty Among Married-Couple Families in Irwin County
The poverty statistics for married-couple families in Irwin County show that 11.8% or 187 of the total 1,587 families live below the poverty line. Families with 3 or 4 children have the highest poverty rate of 35.0%, comprising of 14 families. On the other hand, families with no children have the lowest poverty rate of 5.6%, which includes 57 families.

| Children | Above Poverty | Below Poverty |
| No Children | 964 (94.4%) | 57 (5.6%) |
| 1 or 2 Children | 410 (77.9%) | 116 (22.1%) |
| 3 or 4 Children | 26 (65.0%) | 14 (35.0%) |
| 5 or more Children | 0 (0.0%) | 0 (0.0%) |
| Total | 1,400 (88.2%) | 187 (11.8%) |
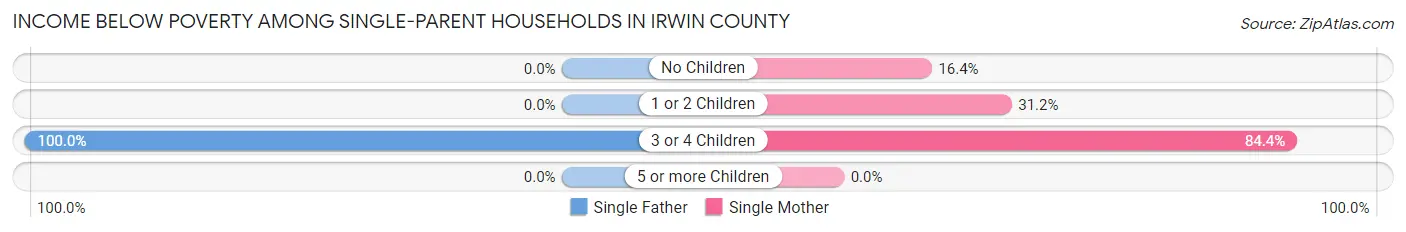
Income Below Poverty Among Single-Parent Households in Irwin County
According to the poverty data in Irwin County, 16.1% or 13 single-father households and 31.3% or 202 single-mother households are living below the poverty line. Among single-father households, those with 3 or 4 children have the highest poverty rate, with 13 households (100.0%) experiencing poverty. Likewise, among single-mother households, those with 3 or 4 children have the highest poverty rate, with 38 households (84.4%) falling below the poverty line.
| Children | Single Father | Single Mother |
| No Children | 0 (0.0%) | 26 (16.4%) |
| 1 or 2 Children | 0 (0.0%) | 138 (31.2%) |
| 3 or 4 Children | 13 (100.0%) | 38 (84.4%) |
| 5 or more Children | 0 (0.0%) | 0 (0.0%) |
| Total | 13 (16.1%) | 202 (31.3%) |
Income Below Poverty Among Married-Couple vs Single-Parent Households in Irwin County
The poverty data for Irwin County shows that 187 of the married-couple family households (11.8%) and 215 of the single-parent households (29.6%) are living below the poverty level. Within the married-couple family households, those with 3 or 4 children have the highest poverty rate, with 14 households (35.0%) falling below the poverty line. Among the single-parent households, those with 3 or 4 children have the highest poverty rate, with 51 household (87.9%) living below poverty.
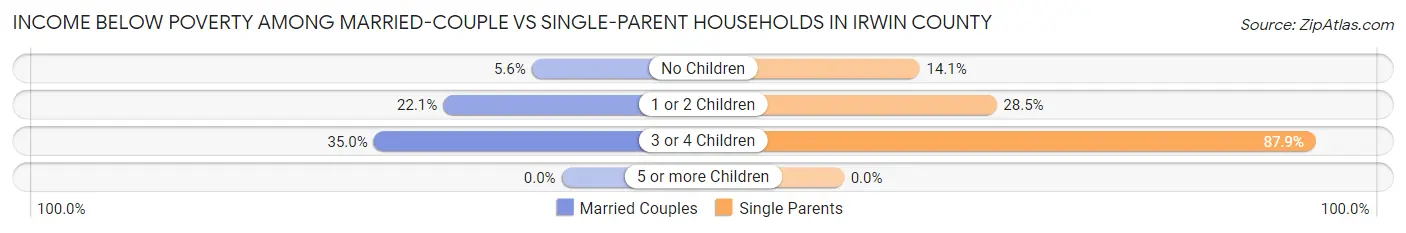
| Children | Married-Couple Families | Single-Parent Households |
| No Children | 57 (5.6%) | 26 (14.1%) |
| 1 or 2 Children | 116 (22.1%) | 138 (28.4%) |
| 3 or 4 Children | 14 (35.0%) | 51 (87.9%) |
| 5 or more Children | 0 (0.0%) | 0 (0.0%) |
| Total | 187 (11.8%) | 215 (29.6%) |
Employment Characteristics in Irwin County
Employment by Class of Employer in Irwin County
Among the 3,897 employed individuals in Irwin County, private company employees (2,514 | 64.5%), local government employees (414 | 10.6%), and state government employees (282 | 7.2%) make up the most common classes of employment.
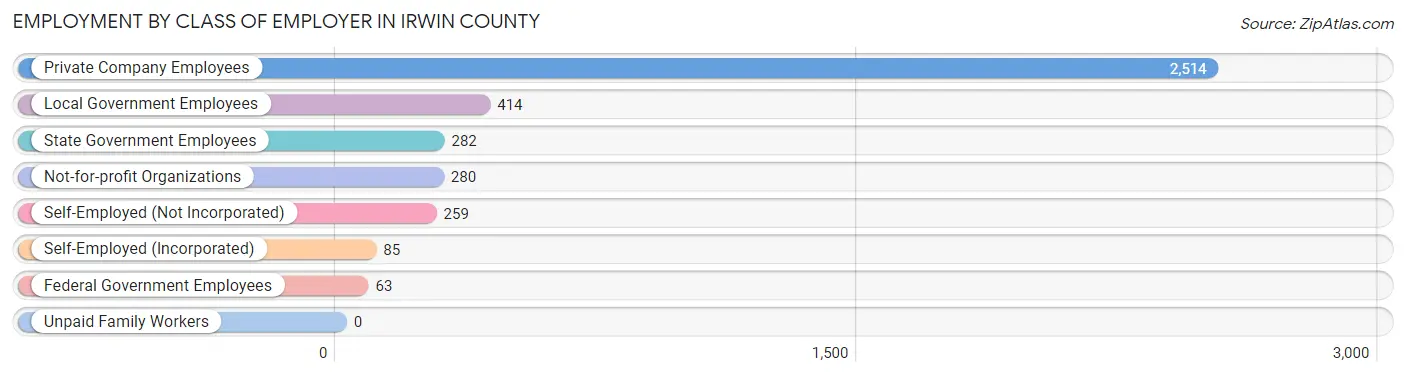
| Employer Class | # Employees | % Employees |
| Private Company Employees | 2,514 | 64.5% |
| Self-Employed (Incorporated) | 85 | 2.2% |
| Self-Employed (Not Incorporated) | 259 | 6.7% |
| Not-for-profit Organizations | 280 | 7.2% |
| Local Government Employees | 414 | 10.6% |
| State Government Employees | 282 | 7.2% |
| Federal Government Employees | 63 | 1.6% |
| Unpaid Family Workers | 0 | 0.0% |
| Total | 3,897 | 100.0% |
Employment Status by Age in Irwin County
According to the labor force statistics for Irwin County, out of the total population over 16 years of age (7,834), 53.3% or 4,176 individuals are in the labor force, with 6.2% or 259 of them unemployed. The age group with the highest labor force participation rate is 25 to 29 years, with 82.2% or 471 individuals in the labor force. Within the labor force, the 20 to 24 years age range has the highest percentage of unemployed individuals, with 33.3% or 86 of them being unemployed.

| Age Bracket | In Labor Force | Unemployed |
| 16 to 19 Years | 131 (15.3%) | 8 (6.1%) |
| 20 to 24 Years | 258 (57.8%) | 86 (33.3%) |
| 25 to 29 Years | 471 (82.2%) | 77 (16.3%) |
| 30 to 34 Years | 436 (68.2%) | 0 (0.0%) |
| 35 to 44 Years | 956 (72.5%) | 57 (6.0%) |
| 45 to 54 Years | 796 (71.7%) | 17 (2.1%) |
| 55 to 59 Years | 475 (81.2%) | 13 (2.7%) |
| 60 to 64 Years | 345 (60.6%) | 0 (0.0%) |
| 65 to 74 Years | 241 (23.2%) | 0 (0.0%) |
| 75 Years and over | 66 (9.5%) | 0 (0.0%) |
| Total | 4,176 (53.3%) | 259 (6.2%) |
Employment Status by Educational Attainment in Irwin County
According to labor force statistics for Irwin County, 72.6% of individuals (3,480) out of the total population between 25 and 64 years of age (4,794) are in the labor force, with 4.7% or 164 of them being unemployed. The group with the highest labor force participation rate are those with the educational attainment of college / associate degree, with 83.2% or 1,286 individuals in the labor force. Within the labor force, individuals with less than high school education have the highest percentage of unemployment, with 13.3% or 65 of them being unemployed.
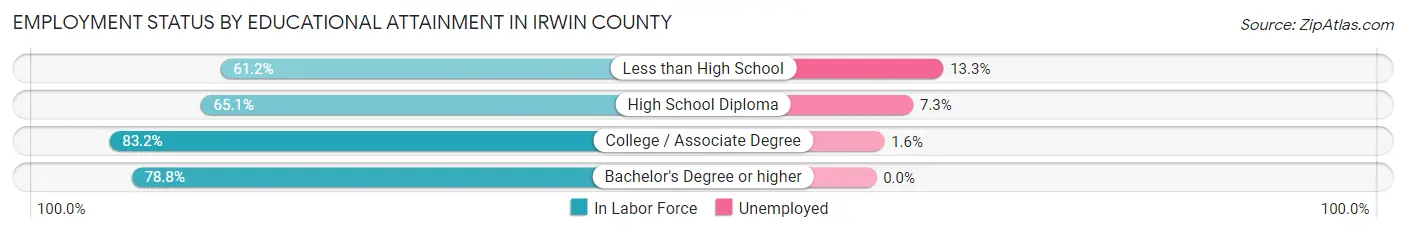
| Educational Attainment | In Labor Force | Unemployed |
| Less than High School | 488 (61.2%) | 106 (13.3%) |
| High School Diploma | 1,077 (65.1%) | 121 (7.3%) |
| College / Associate Degree | 1,286 (83.2%) | 25 (1.6%) |
| Bachelor's Degree or higher | 628 (78.8%) | 0 (0.0%) |
| Total | 3,480 (72.6%) | 225 (4.7%) |
Employment Occupations by Sex in Irwin County
Management, Business, Science and Arts Occupations
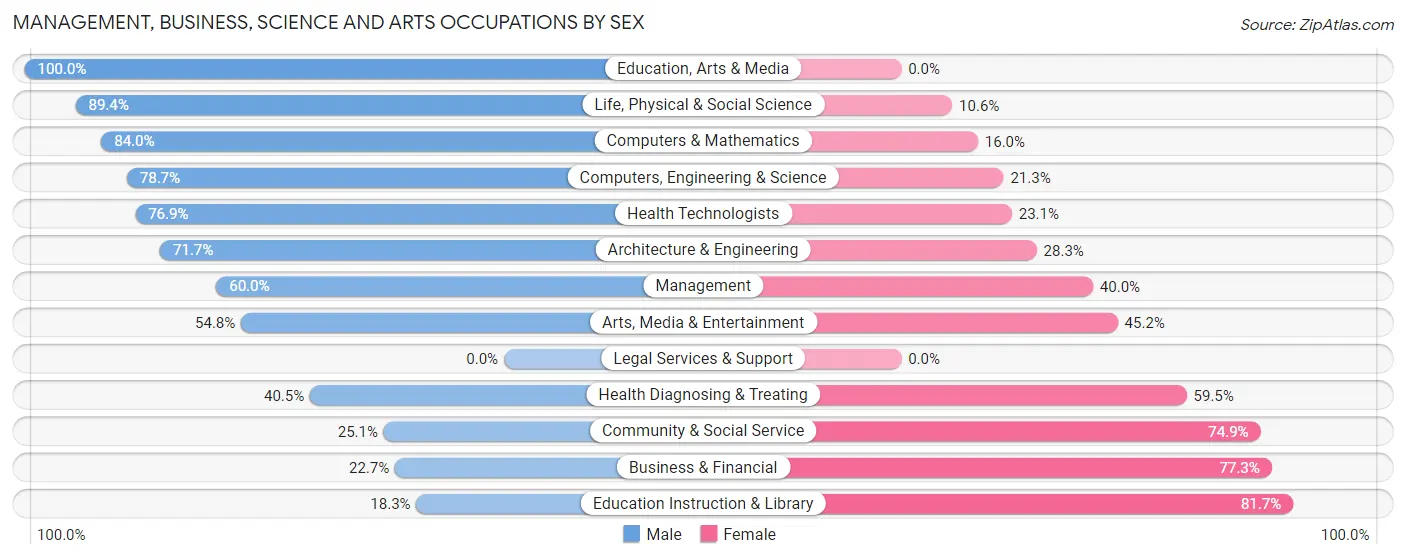
The most common Management, Business, Science and Arts occupations in Irwin County are Community & Social Service (371 | 9.5%), Management (360 | 9.2%), Education Instruction & Library (323 | 8.3%), Health Diagnosing & Treating (173 | 4.4%), and Computers, Engineering & Science (164 | 4.2%).
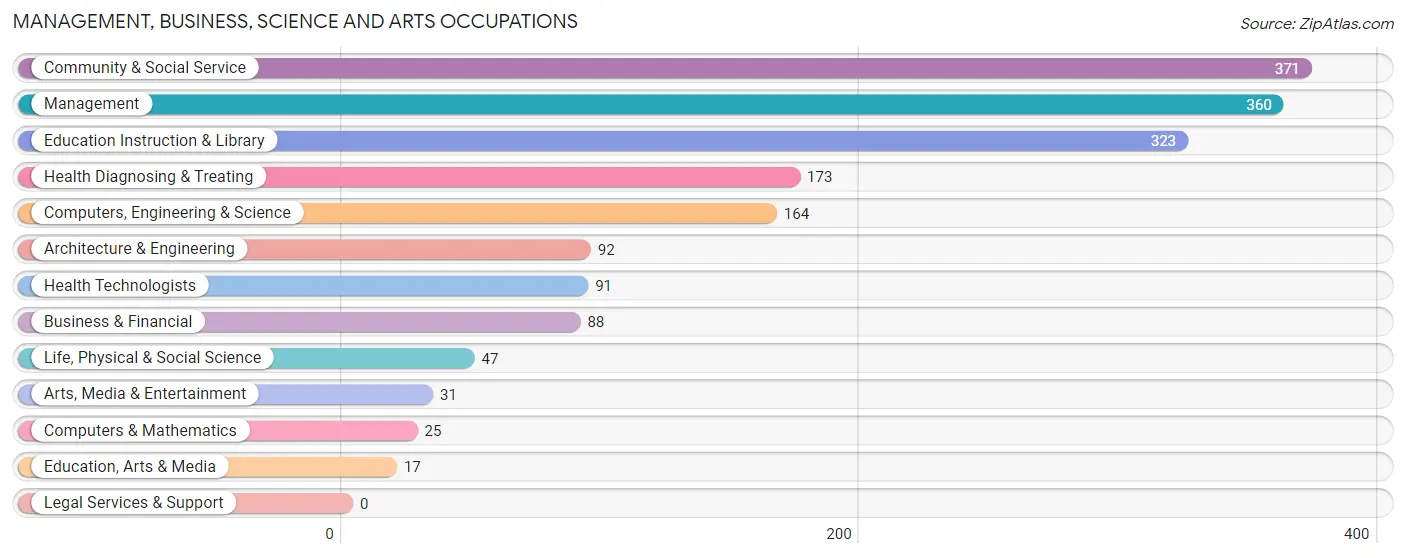
Management, Business, Science and Arts Occupations by Sex
Within the Management, Business, Science and Arts occupations in Irwin County, the most male-oriented occupations are Education, Arts & Media (100.0%), Life, Physical & Social Science (89.4%), and Computers & Mathematics (84.0%), while the most female-oriented occupations are Education Instruction & Library (81.7%), Business & Financial (77.3%), and Community & Social Service (74.9%).
| Occupation | Male | Female |
| Management | 216 (60.0%) | 144 (40.0%) |
| Business & Financial | 20 (22.7%) | 68 (77.3%) |
| Computers, Engineering & Science | 129 (78.7%) | 35 (21.3%) |
| Computers & Mathematics | 21 (84.0%) | 4 (16.0%) |
| Architecture & Engineering | 66 (71.7%) | 26 (28.3%) |
| Life, Physical & Social Science | 42 (89.4%) | 5 (10.6%) |
| Community & Social Service | 93 (25.1%) | 278 (74.9%) |
| Education, Arts & Media | 17 (100.0%) | 0 (0.0%) |
| Legal Services & Support | 0 (0.0%) | 0 (0.0%) |
| Education Instruction & Library | 59 (18.3%) | 264 (81.7%) |
| Arts, Media & Entertainment | 17 (54.8%) | 14 (45.2%) |
| Health Diagnosing & Treating | 70 (40.5%) | 103 (59.5%) |
| Health Technologists | 70 (76.9%) | 21 (23.1%) |
| Total (Category) | 528 (45.7%) | 628 (54.3%) |
| Total (Overall) | 2,121 (54.1%) | 1,796 (45.9%) |
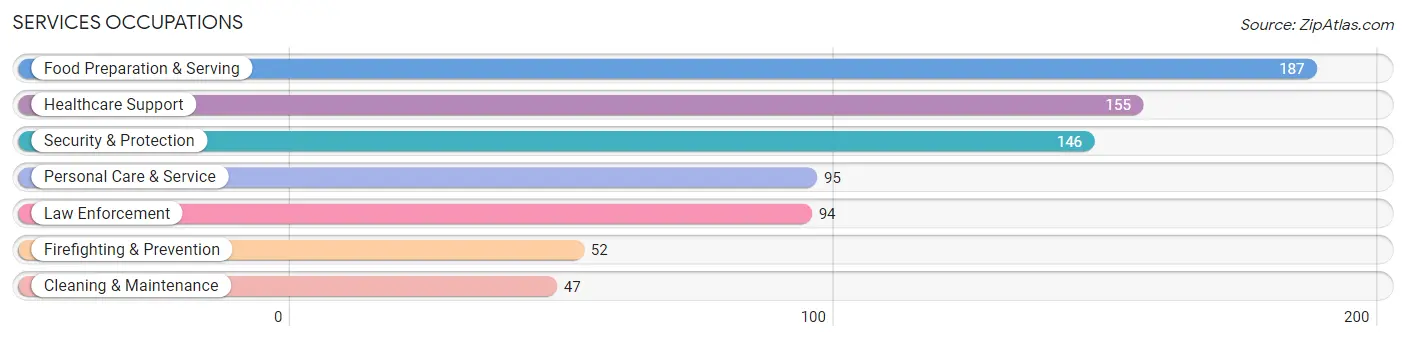
Services Occupations
The most common Services occupations in Irwin County are Food Preparation & Serving (187 | 4.8%), Healthcare Support (155 | 4.0%), Security & Protection (146 | 3.7%), Personal Care & Service (95 | 2.4%), and Law Enforcement (94 | 2.4%).
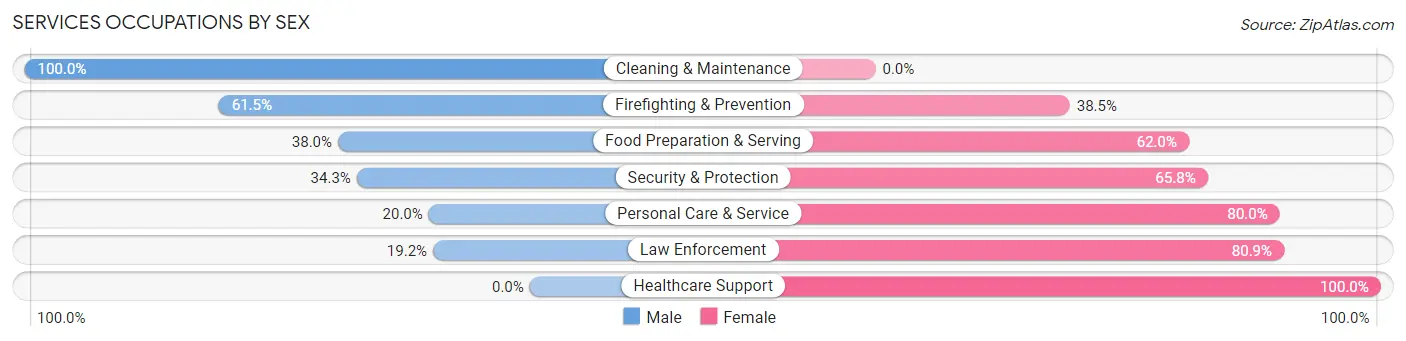
Services Occupations by Sex
Within the Services occupations in Irwin County, the most male-oriented occupations are Cleaning & Maintenance (100.0%), Firefighting & Prevention (61.5%), and Food Preparation & Serving (38.0%), while the most female-oriented occupations are Healthcare Support (100.0%), Law Enforcement (80.8%), and Personal Care & Service (80.0%).
| Occupation | Male | Female |
| Healthcare Support | 0 (0.0%) | 155 (100.0%) |
| Security & Protection | 50 (34.3%) | 96 (65.7%) |
| Firefighting & Prevention | 32 (61.5%) | 20 (38.5%) |
| Law Enforcement | 18 (19.2%) | 76 (80.8%) |
| Food Preparation & Serving | 71 (38.0%) | 116 (62.0%) |
| Cleaning & Maintenance | 47 (100.0%) | 0 (0.0%) |
| Personal Care & Service | 19 (20.0%) | 76 (80.0%) |
| Total (Category) | 187 (29.7%) | 443 (70.3%) |
| Total (Overall) | 2,121 (54.1%) | 1,796 (45.9%) |
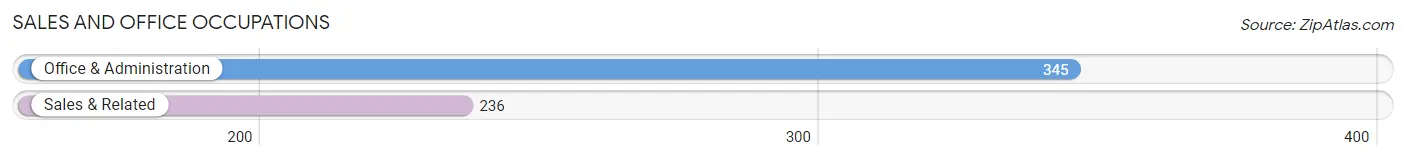
Sales and Office Occupations
The most common Sales and Office occupations in Irwin County are Office & Administration (345 | 8.8%), and Sales & Related (236 | 6.0%).
Sales and Office Occupations by Sex
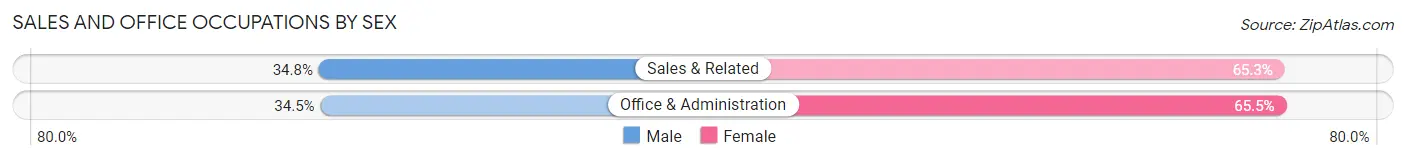
| Occupation | Male | Female |
| Sales & Related | 82 (34.7%) | 154 (65.2%) |
| Office & Administration | 119 (34.5%) | 226 (65.5%) |
| Total (Category) | 201 (34.6%) | 380 (65.4%) |
| Total (Overall) | 2,121 (54.1%) | 1,796 (45.9%) |
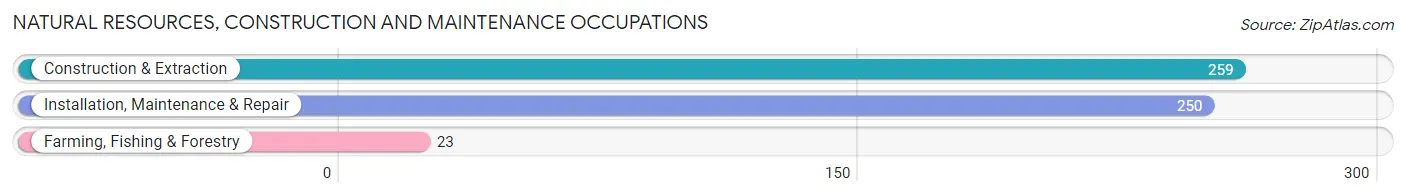
Natural Resources, Construction and Maintenance Occupations
The most common Natural Resources, Construction and Maintenance occupations in Irwin County are Construction & Extraction (259 | 6.6%), Installation, Maintenance & Repair (250 | 6.4%), and Farming, Fishing & Forestry (23 | 0.6%).
Natural Resources, Construction and Maintenance Occupations by Sex
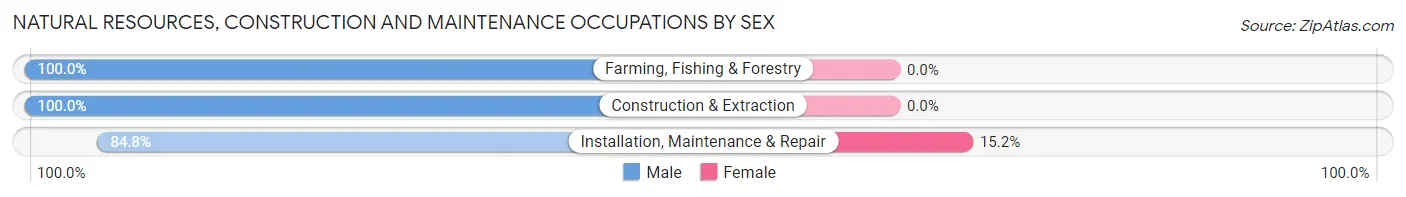
| Occupation | Male | Female |
| Farming, Fishing & Forestry | 23 (100.0%) | 0 (0.0%) |
| Construction & Extraction | 259 (100.0%) | 0 (0.0%) |
| Installation, Maintenance & Repair | 212 (84.8%) | 38 (15.2%) |
| Total (Category) | 494 (92.9%) | 38 (7.1%) |
| Total (Overall) | 2,121 (54.1%) | 1,796 (45.9%) |
Production, Transportation and Moving Occupations
The most common Production, Transportation and Moving occupations in Irwin County are Production (411 | 10.5%), Material Moving (368 | 9.4%), and Transportation (239 | 6.1%).
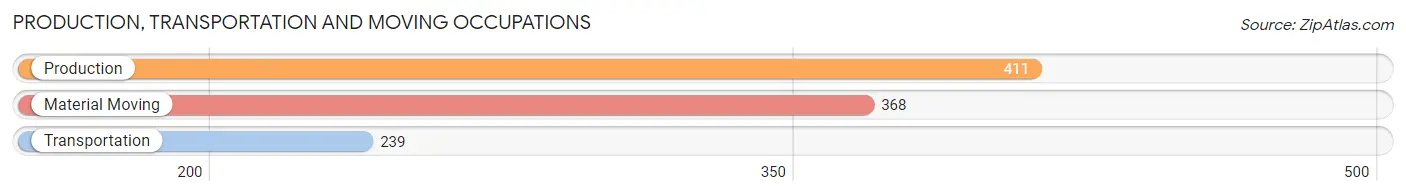
Production, Transportation and Moving Occupations by Sex
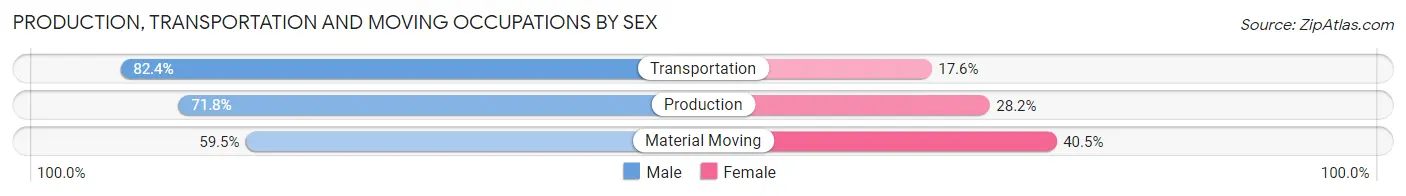
| Occupation | Male | Female |
| Production | 295 (71.8%) | 116 (28.2%) |
| Transportation | 197 (82.4%) | 42 (17.6%) |
| Material Moving | 219 (59.5%) | 149 (40.5%) |
| Total (Category) | 711 (69.8%) | 307 (30.2%) |
| Total (Overall) | 2,121 (54.1%) | 1,796 (45.9%) |
Employment Industries by Sex in Irwin County
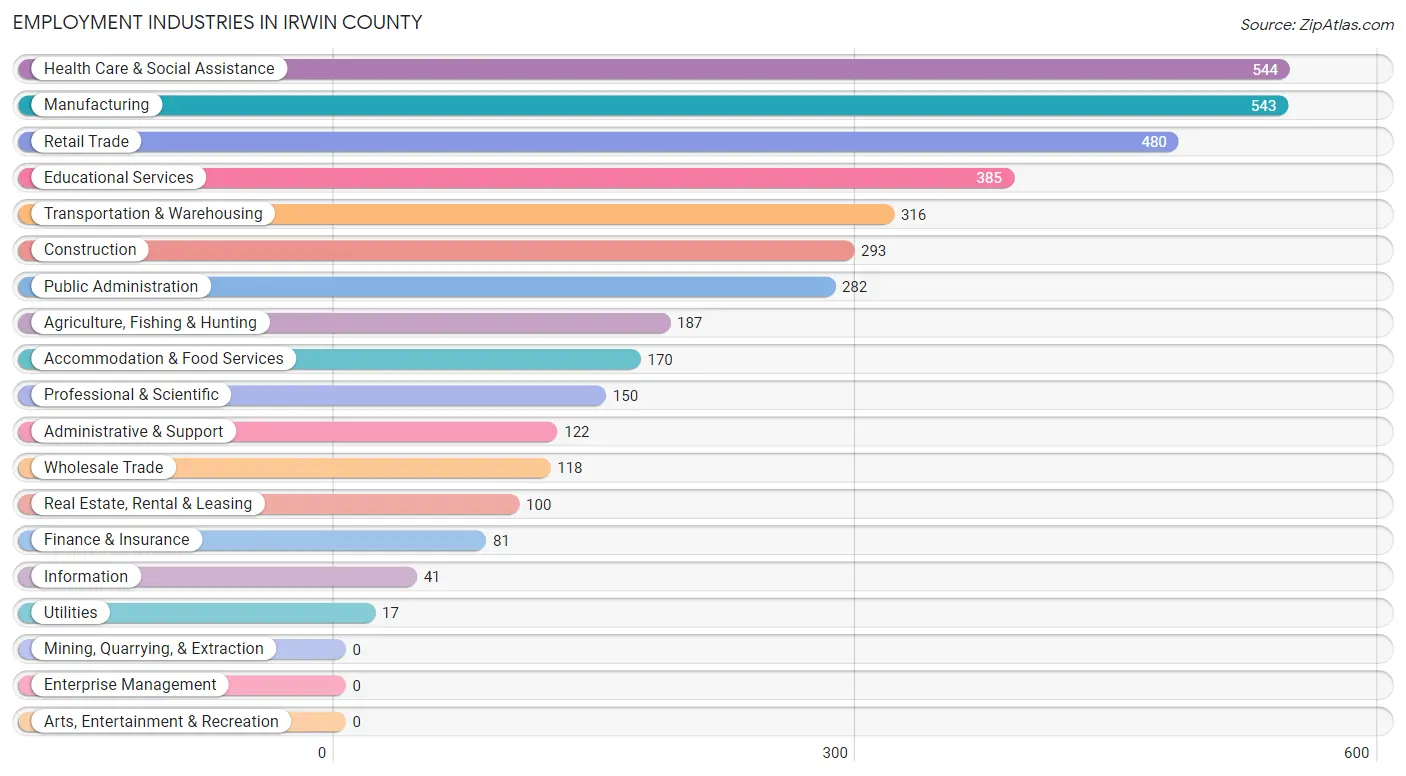
Employment Industries in Irwin County
The major employment industries in Irwin County include Health Care & Social Assistance (544 | 13.9%), Manufacturing (543 | 13.9%), Retail Trade (480 | 12.2%), Educational Services (385 | 9.8%), and Transportation & Warehousing (316 | 8.1%).
Employment Industries by Sex in Irwin County
The Irwin County industries that see more men than women are Construction (100.0%), Utilities (100.0%), and Information (90.2%), whereas the industries that tend to have a higher number of women are Wholesale Trade (91.5%), Educational Services (78.7%), and Public Administration (76.2%).

| Industry | Male | Female |
| Agriculture, Fishing & Hunting | 167 (89.3%) | 20 (10.7%) |
| Mining, Quarrying, & Extraction | 0 (0.0%) | 0 (0.0%) |
| Construction | 293 (100.0%) | 0 (0.0%) |
| Manufacturing | 404 (74.4%) | 139 (25.6%) |
| Wholesale Trade | 10 (8.5%) | 108 (91.5%) |
| Retail Trade | 258 (53.7%) | 222 (46.3%) |
| Transportation & Warehousing | 223 (70.6%) | 93 (29.4%) |
| Utilities | 17 (100.0%) | 0 (0.0%) |
| Information | 37 (90.2%) | 4 (9.8%) |
| Finance & Insurance | 63 (77.8%) | 18 (22.2%) |
| Real Estate, Rental & Leasing | 62 (62.0%) | 38 (38.0%) |
| Professional & Scientific | 69 (46.0%) | 81 (54.0%) |
| Enterprise Management | 0 (0.0%) | 0 (0.0%) |
| Administrative & Support | 101 (82.8%) | 21 (17.2%) |
| Educational Services | 82 (21.3%) | 303 (78.7%) |
| Health Care & Social Assistance | 131 (24.1%) | 413 (75.9%) |
| Arts, Entertainment & Recreation | 0 (0.0%) | 0 (0.0%) |
| Accommodation & Food Services | 71 (41.8%) | 99 (58.2%) |
| Public Administration | 67 (23.8%) | 215 (76.2%) |
| Total | 2,121 (54.1%) | 1,796 (45.9%) |
Education in Irwin County
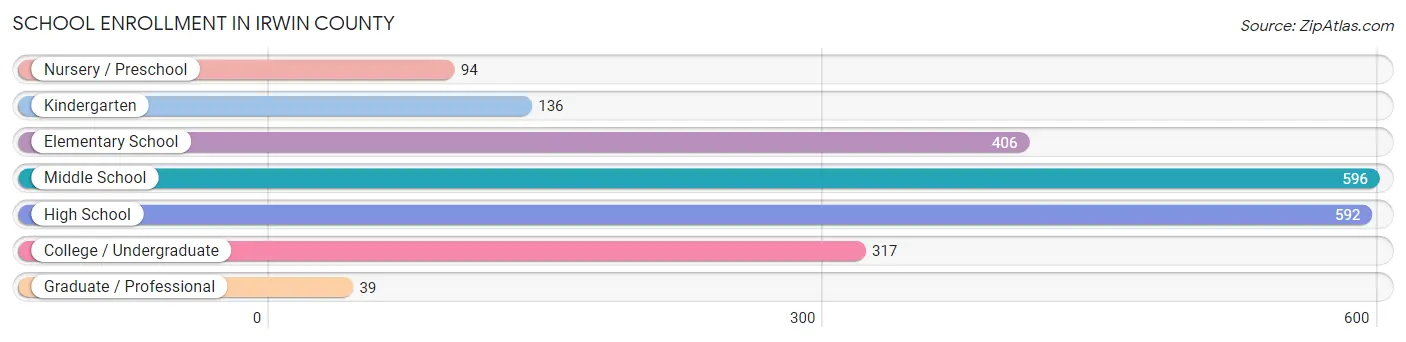
School Enrollment in Irwin County
The most common levels of schooling among the 2,180 students in Irwin County are middle school (596 | 27.3%), high school (592 | 27.2%), and elementary school (406 | 18.6%).
| School Level | # Students | % Students |
| Nursery / Preschool | 94 | 4.3% |
| Kindergarten | 136 | 6.2% |
| Elementary School | 406 | 18.6% |
| Middle School | 596 | 27.3% |
| High School | 592 | 27.2% |
| College / Undergraduate | 317 | 14.5% |
| Graduate / Professional | 39 | 1.8% |
| Total | 2,180 | 100.0% |
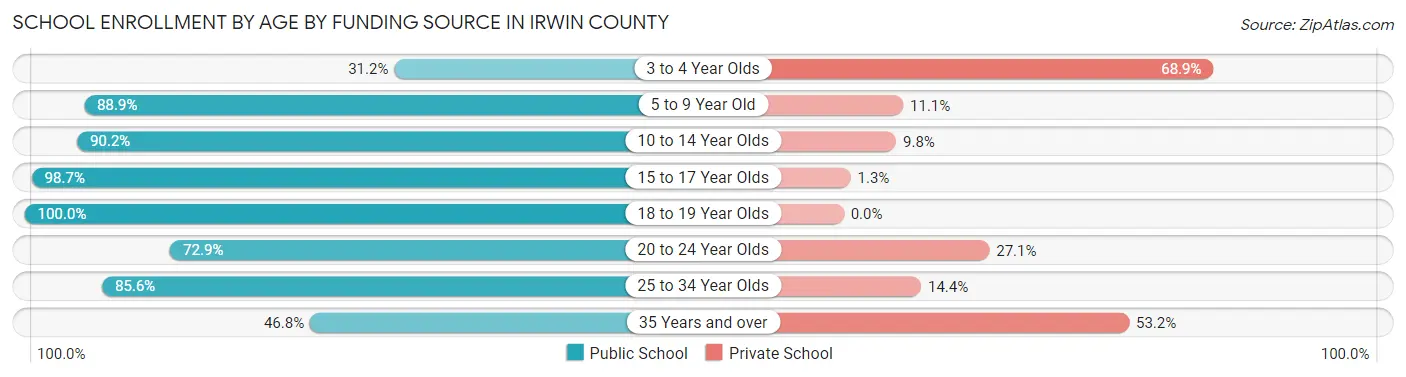
School Enrollment by Age by Funding Source in Irwin County
Out of a total of 2,180 students who are enrolled in schools in Irwin County, 242 (11.1%) attend a private institution, while the remaining 1,938 (88.9%) are enrolled in public schools. The age group of 3 to 4 year olds has the highest likelihood of being enrolled in private schools, with 42 (68.9% in the age bracket) enrolled. Conversely, the age group of 18 to 19 year olds has the lowest likelihood of being enrolled in a private school, with 324 (100.0% in the age bracket) attending a public institution.
| Age Bracket | Public School | Private School |
| 3 to 4 Year Olds | 19 (31.1%) | 42 (68.9%) |
| 5 to 9 Year Old | 466 (88.9%) | 58 (11.1%) |
| 10 to 14 Year Olds | 573 (90.2%) | 62 (9.8%) |
| 15 to 17 Year Olds | 382 (98.7%) | 5 (1.3%) |
| 18 to 19 Year Olds | 324 (100.0%) | 0 (0.0%) |
| 20 to 24 Year Olds | 43 (72.9%) | 16 (27.1%) |
| 25 to 34 Year Olds | 95 (85.6%) | 16 (14.4%) |
| 35 Years and over | 37 (46.8%) | 42 (53.2%) |
| Total | 1,938 (88.9%) | 242 (11.1%) |
Educational Attainment by Field of Study in Irwin County
Education (258 | 22.1%), science & technology (218 | 18.7%), business (214 | 18.3%), liberal arts & history (91 | 7.8%), and bio, nature & agricultural (78 | 6.7%) are the most common fields of study among 1,168 individuals in Irwin County who have obtained a bachelor's degree or higher.

| Field of Study | # Graduates | % Graduates |
| Computers & Mathematics | 63 | 5.4% |
| Bio, Nature & Agricultural | 78 | 6.7% |
| Physical & Health Sciences | 59 | 5.1% |
| Psychology | 0 | 0.0% |
| Social Sciences | 17 | 1.5% |
| Engineering | 10 | 0.9% |
| Multidisciplinary Studies | 0 | 0.0% |
| Science & Technology | 218 | 18.7% |
| Business | 214 | 18.3% |
| Education | 258 | 22.1% |
| Literature & Languages | 73 | 6.2% |
| Liberal Arts & History | 91 | 7.8% |
| Visual & Performing Arts | 16 | 1.4% |
| Communications | 42 | 3.6% |
| Arts & Humanities | 29 | 2.5% |
| Total | 1,168 | 100.0% |
Transportation & Commute in Irwin County
Vehicle Availability by Sex in Irwin County
The most prevalent vehicle ownership categories in Irwin County are males with 2 vehicles (917, accounting for 43.5%) and females with 2 vehicles (589, making up 51.4%).

| Vehicles Available | Male | Female |
| No Vehicle | 18 (0.9%) | 165 (9.2%) |
| 1 Vehicle | 202 (9.6%) | 498 (27.9%) |
| 2 Vehicles | 917 (43.5%) | 589 (33.0%) |
| 3 Vehicles | 690 (32.7%) | 389 (21.8%) |
| 4 Vehicles | 111 (5.3%) | 90 (5.1%) |
| 5 or more Vehicles | 171 (8.1%) | 52 (2.9%) |
| Total | 2,109 (100.0%) | 1,783 (100.0%) |
Commute Time in Irwin County
The most frequently occuring commute durations in Irwin County are 30 to 34 minutes (601 commuters, 16.2%), 5 to 9 minutes (599 commuters, 16.1%), and 15 to 19 minutes (452 commuters, 12.1%).
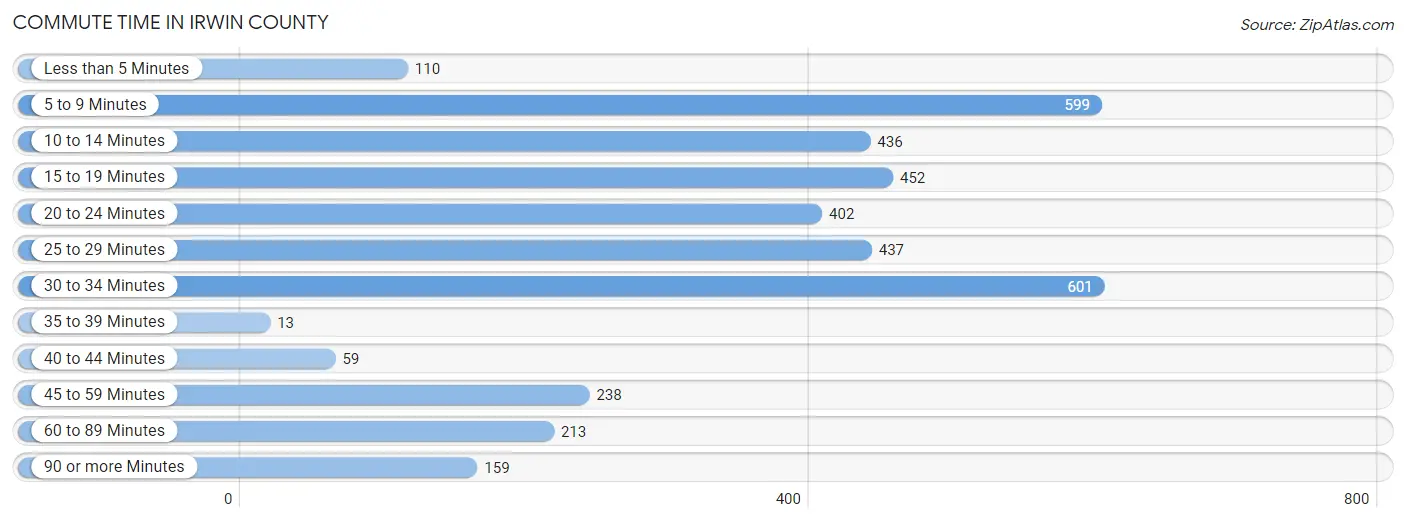
| Commute Time | # Commuters | % Commuters |
| Less than 5 Minutes | 110 | 3.0% |
| 5 to 9 Minutes | 599 | 16.1% |
| 10 to 14 Minutes | 436 | 11.7% |
| 15 to 19 Minutes | 452 | 12.1% |
| 20 to 24 Minutes | 402 | 10.8% |
| 25 to 29 Minutes | 437 | 11.7% |
| 30 to 34 Minutes | 601 | 16.2% |
| 35 to 39 Minutes | 13 | 0.4% |
| 40 to 44 Minutes | 59 | 1.6% |
| 45 to 59 Minutes | 238 | 6.4% |
| 60 to 89 Minutes | 213 | 5.7% |
| 90 or more Minutes | 159 | 4.3% |
Commute Time by Sex in Irwin County
The most common commute times in Irwin County are 30 to 34 minutes (432 commuters, 21.7%) for males and 5 to 9 minutes (300 commuters, 17.3%) for females.
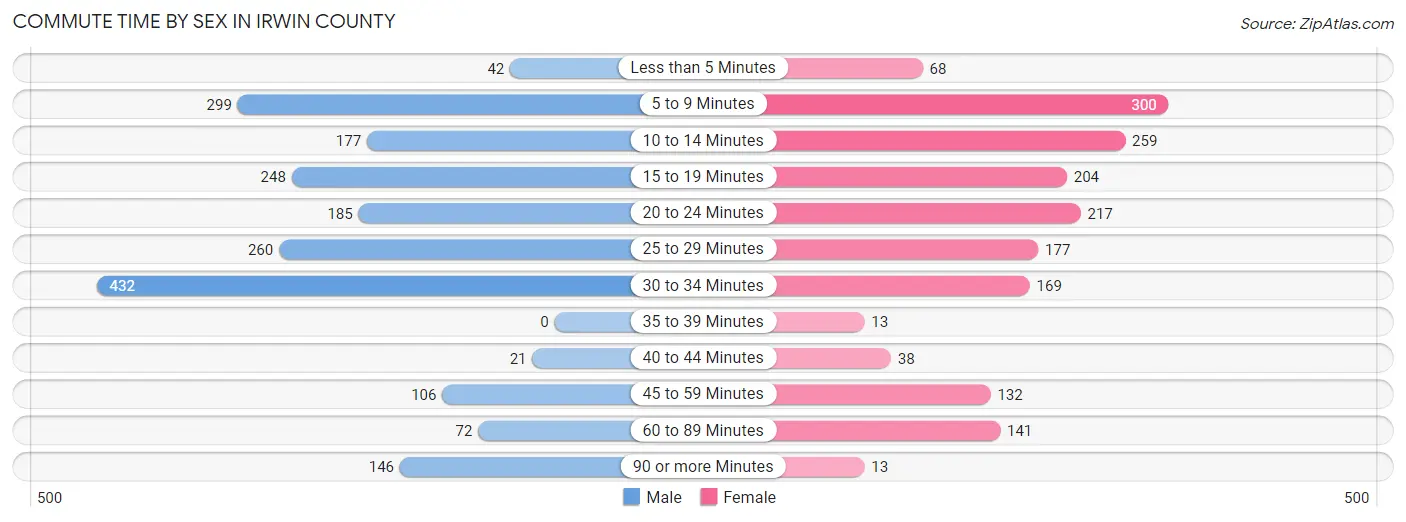
| Commute Time | Male | Female |
| Less than 5 Minutes | 42 (2.1%) | 68 (3.9%) |
| 5 to 9 Minutes | 299 (15.0%) | 300 (17.3%) |
| 10 to 14 Minutes | 177 (8.9%) | 259 (15.0%) |
| 15 to 19 Minutes | 248 (12.5%) | 204 (11.8%) |
| 20 to 24 Minutes | 185 (9.3%) | 217 (12.5%) |
| 25 to 29 Minutes | 260 (13.1%) | 177 (10.2%) |
| 30 to 34 Minutes | 432 (21.7%) | 169 (9.8%) |
| 35 to 39 Minutes | 0 (0.0%) | 13 (0.7%) |
| 40 to 44 Minutes | 21 (1.1%) | 38 (2.2%) |
| 45 to 59 Minutes | 106 (5.3%) | 132 (7.6%) |
| 60 to 89 Minutes | 72 (3.6%) | 141 (8.2%) |
| 90 or more Minutes | 146 (7.3%) | 13 (0.7%) |
Time of Departure to Work by Sex in Irwin County
The most frequent times of departure to work in Irwin County are 6:30 AM to 6:59 AM (434, 21.8%) for males and 7:30 AM to 7:59 AM (350, 20.2%) for females.

| Time of Departure | Male | Female |
| 12:00 AM to 4:59 AM | 145 (7.3%) | 6 (0.4%) |
| 5:00 AM to 5:29 AM | 129 (6.5%) | 78 (4.5%) |
| 5:30 AM to 5:59 AM | 115 (5.8%) | 97 (5.6%) |
| 6:00 AM to 6:29 AM | 426 (21.4%) | 238 (13.8%) |
| 6:30 AM to 6:59 AM | 434 (21.8%) | 303 (17.5%) |
| 7:00 AM to 7:29 AM | 208 (10.5%) | 314 (18.1%) |
| 7:30 AM to 7:59 AM | 140 (7.0%) | 350 (20.2%) |
| 8:00 AM to 8:29 AM | 174 (8.7%) | 67 (3.9%) |
| 8:30 AM to 8:59 AM | 21 (1.1%) | 23 (1.3%) |
| 9:00 AM to 9:59 AM | 76 (3.8%) | 91 (5.3%) |
| 10:00 AM to 10:59 AM | 0 (0.0%) | 14 (0.8%) |
| 11:00 AM to 11:59 AM | 0 (0.0%) | 0 (0.0%) |
| 12:00 PM to 3:59 PM | 0 (0.0%) | 50 (2.9%) |
| 4:00 PM to 11:59 PM | 120 (6.0%) | 100 (5.8%) |
| Total | 1,988 (100.0%) | 1,731 (100.0%) |
Housing Occupancy in Irwin County
Occupancy by Ownership in Irwin County
Of the total 3,566 dwellings in Irwin County, owner-occupied units account for 2,571 (72.1%), while renter-occupied units make up 995 (27.9%).

| Occupancy | # Housing Units | % Housing Units |
| Owner Occupied Housing Units | 2,571 | 72.1% |
| Renter-Occupied Housing Units | 995 | 27.9% |
| Total Occupied Housing Units | 3,566 | 100.0% |
Occupancy by Household Size in Irwin County

| Household Size | # Housing Units | % Housing Units |
| 1-Person Household | 1,181 | 33.1% |
| 2-Person Household | 1,053 | 29.5% |
| 3-Person Household | 717 | 20.1% |
| 4+ Person Household | 615 | 17.2% |
| Total Housing Units | 3,566 | 100.0% |
Occupancy by Ownership by Household Size in Irwin County

| Household Size | Owner-occupied | Renter-occupied |
| 1-Person Household | 929 (78.7%) | 252 (21.3%) |
| 2-Person Household | 753 (71.5%) | 300 (28.5%) |
| 3-Person Household | 402 (56.1%) | 315 (43.9%) |
| 4+ Person Household | 487 (79.2%) | 128 (20.8%) |
| Total Housing Units | 2,571 (72.1%) | 995 (27.9%) |
Occupancy by Educational Attainment in Irwin County
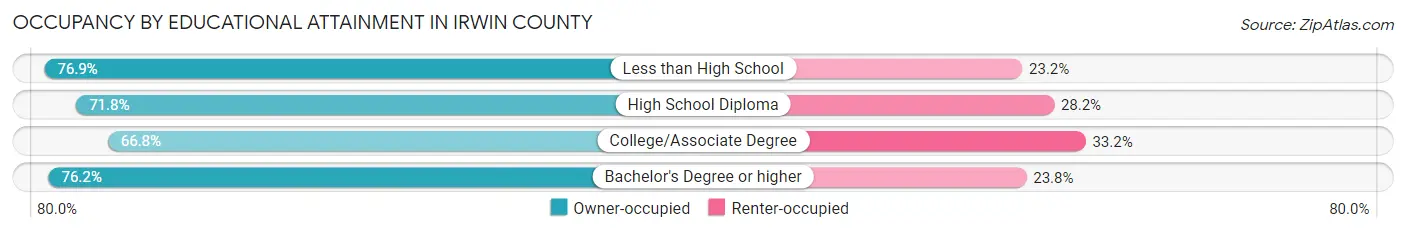
| Household Size | Owner-occupied | Renter-occupied |
| Less than High School | 478 (76.8%) | 144 (23.2%) |
| High School Diploma | 937 (71.8%) | 368 (28.2%) |
| College/Associate Degree | 660 (66.8%) | 328 (33.2%) |
| Bachelor's Degree or higher | 496 (76.2%) | 155 (23.8%) |
Occupancy by Age of Householder in Irwin County
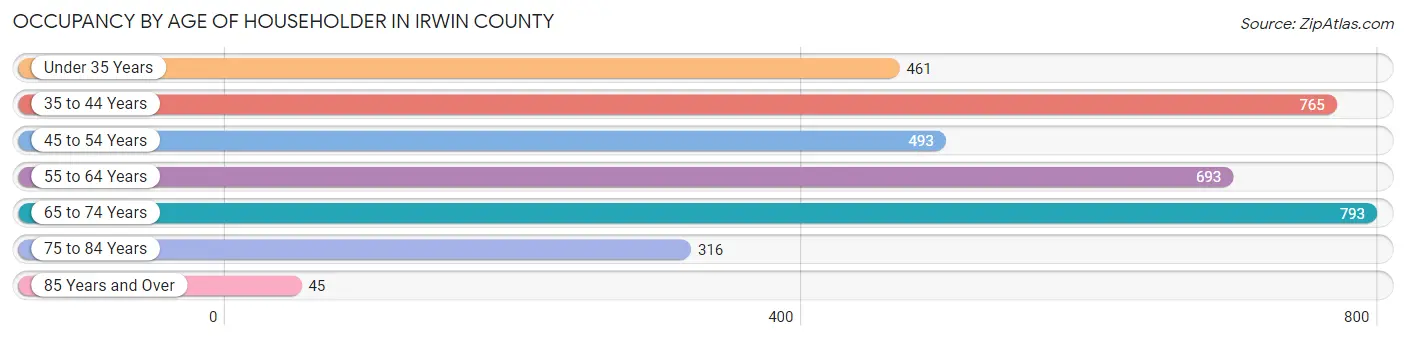
| Age Bracket | # Households | % Households |
| Under 35 Years | 461 | 12.9% |
| 35 to 44 Years | 765 | 21.4% |
| 45 to 54 Years | 493 | 13.8% |
| 55 to 64 Years | 693 | 19.4% |
| 65 to 74 Years | 793 | 22.2% |
| 75 to 84 Years | 316 | 8.9% |
| 85 Years and Over | 45 | 1.3% |
| Total | 3,566 | 100.0% |
Housing Finances in Irwin County
Median Income by Occupancy in Irwin County
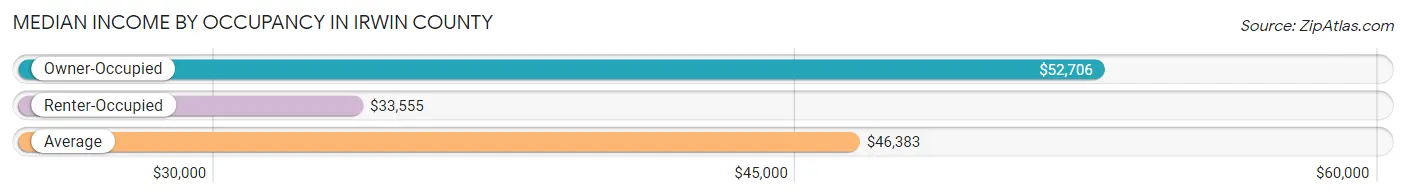
| Occupancy Type | # Households | Median Income |
| Owner-Occupied | 2,571 (72.1%) | $52,706 |
| Renter-Occupied | 995 (27.9%) | $33,555 |
| Average | 3,566 (100.0%) | $46,383 |
Occupancy by Householder Income Bracket in Irwin County
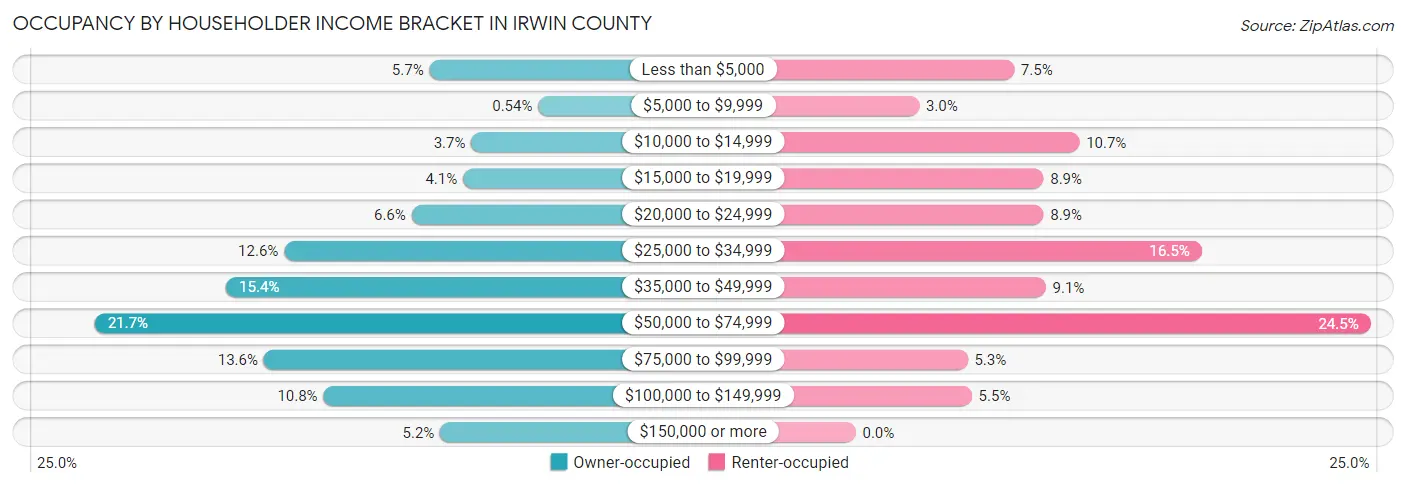
| Income Bracket | Owner-occupied | Renter-occupied |
| Less than $5,000 | 147 (5.7%) | 75 (7.5%) |
| $5,000 to $9,999 | 14 (0.5%) | 30 (3.0%) |
| $10,000 to $14,999 | 96 (3.7%) | 106 (10.6%) |
| $15,000 to $19,999 | 106 (4.1%) | 89 (8.9%) |
| $20,000 to $24,999 | 169 (6.6%) | 89 (8.9%) |
| $25,000 to $34,999 | 325 (12.6%) | 164 (16.5%) |
| $35,000 to $49,999 | 396 (15.4%) | 90 (9.0%) |
| $50,000 to $74,999 | 557 (21.7%) | 244 (24.5%) |
| $75,000 to $99,999 | 350 (13.6%) | 53 (5.3%) |
| $100,000 to $149,999 | 277 (10.8%) | 55 (5.5%) |
| $150,000 or more | 134 (5.2%) | 0 (0.0%) |
| Total | 2,571 (100.0%) | 995 (100.0%) |
Monthly Housing Cost Tiers in Irwin County

| Monthly Cost | Owner-occupied | Renter-occupied |
| Less than $300 | 504 (19.6%) | 33 (3.3%) |
| $300 to $499 | 570 (22.2%) | 119 (12.0%) |
| $500 to $799 | 674 (26.2%) | 321 (32.3%) |
| $800 to $999 | 195 (7.6%) | 163 (16.4%) |
| $1,000 to $1,499 | 398 (15.5%) | 158 (15.9%) |
| $1,500 to $1,999 | 81 (3.2%) | 20 (2.0%) |
| $2,000 to $2,499 | 123 (4.8%) | 0 (0.0%) |
| $2,500 to $2,999 | 0 (0.0%) | 0 (0.0%) |
| $3,000 or more | 26 (1.0%) | 0 (0.0%) |
| Total | 2,571 (100.0%) | 995 (100.0%) |
Physical Housing Characteristics in Irwin County
Housing Structures in Irwin County
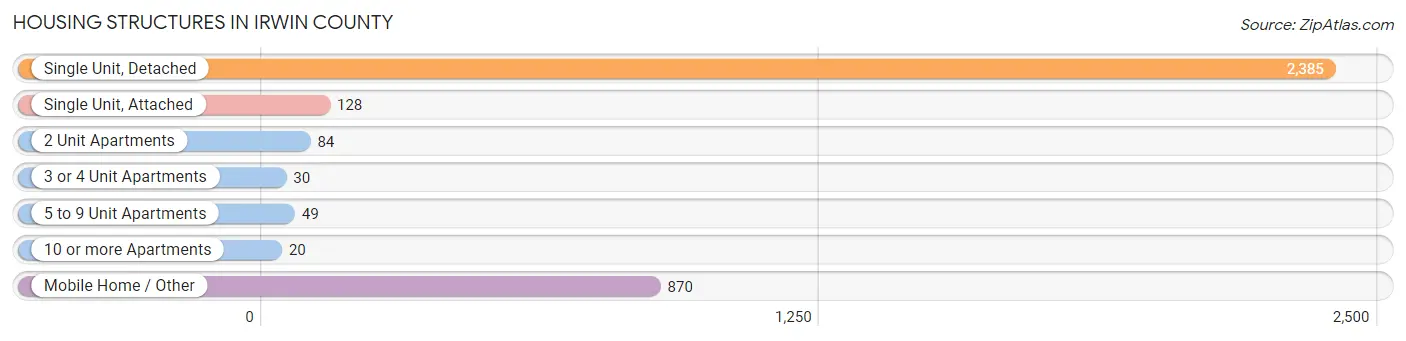
| Structure Type | # Housing Units | % Housing Units |
| Single Unit, Detached | 2,385 | 66.9% |
| Single Unit, Attached | 128 | 3.6% |
| 2 Unit Apartments | 84 | 2.4% |
| 3 or 4 Unit Apartments | 30 | 0.8% |
| 5 to 9 Unit Apartments | 49 | 1.4% |
| 10 or more Apartments | 20 | 0.6% |
| Mobile Home / Other | 870 | 24.4% |
| Total | 3,566 | 100.0% |
Housing Structures by Occupancy in Irwin County
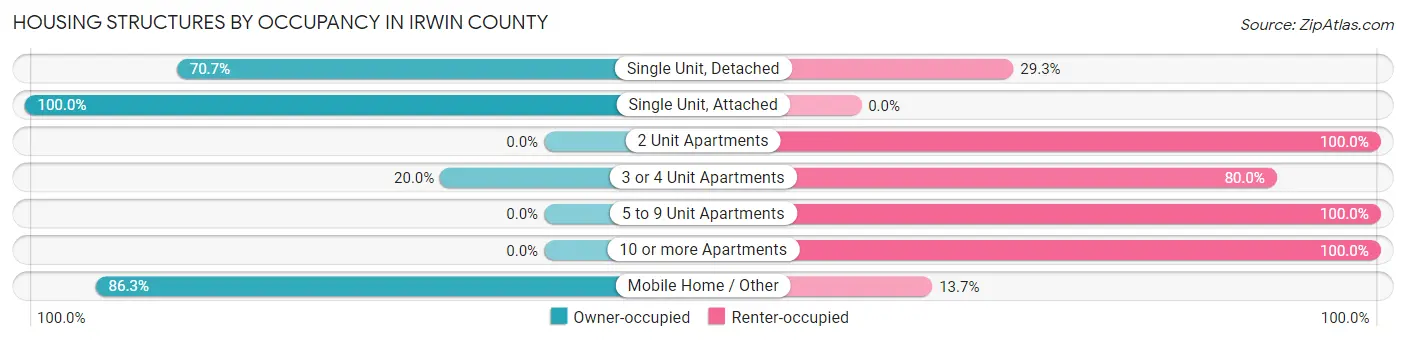
| Structure Type | Owner-occupied | Renter-occupied |
| Single Unit, Detached | 1,686 (70.7%) | 699 (29.3%) |
| Single Unit, Attached | 128 (100.0%) | 0 (0.0%) |
| 2 Unit Apartments | 0 (0.0%) | 84 (100.0%) |
| 3 or 4 Unit Apartments | 6 (20.0%) | 24 (80.0%) |
| 5 to 9 Unit Apartments | 0 (0.0%) | 49 (100.0%) |
| 10 or more Apartments | 0 (0.0%) | 20 (100.0%) |
| Mobile Home / Other | 751 (86.3%) | 119 (13.7%) |
| Total | 2,571 (72.1%) | 995 (27.9%) |
Housing Structures by Number of Rooms in Irwin County
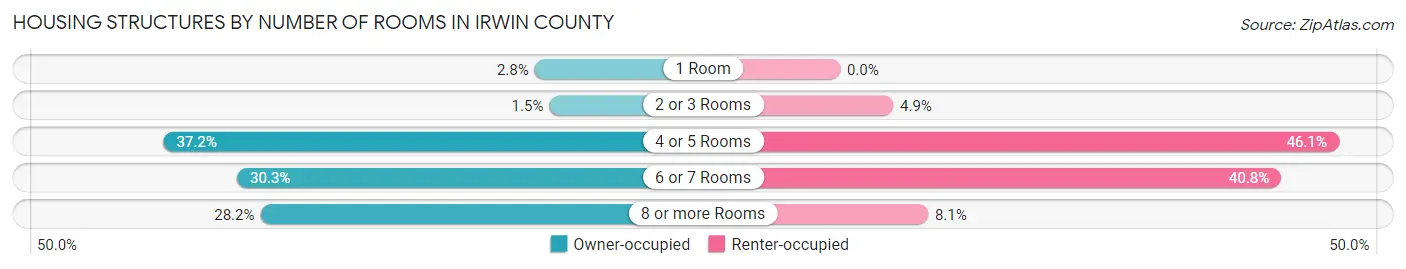
| Number of Rooms | Owner-occupied | Renter-occupied |
| 1 Room | 73 (2.8%) | 0 (0.0%) |
| 2 or 3 Rooms | 38 (1.5%) | 49 (4.9%) |
| 4 or 5 Rooms | 955 (37.1%) | 459 (46.1%) |
| 6 or 7 Rooms | 780 (30.3%) | 406 (40.8%) |
| 8 or more Rooms | 725 (28.2%) | 81 (8.1%) |
| Total | 2,571 (100.0%) | 995 (100.0%) |
Housing Structure by Heating Type in Irwin County
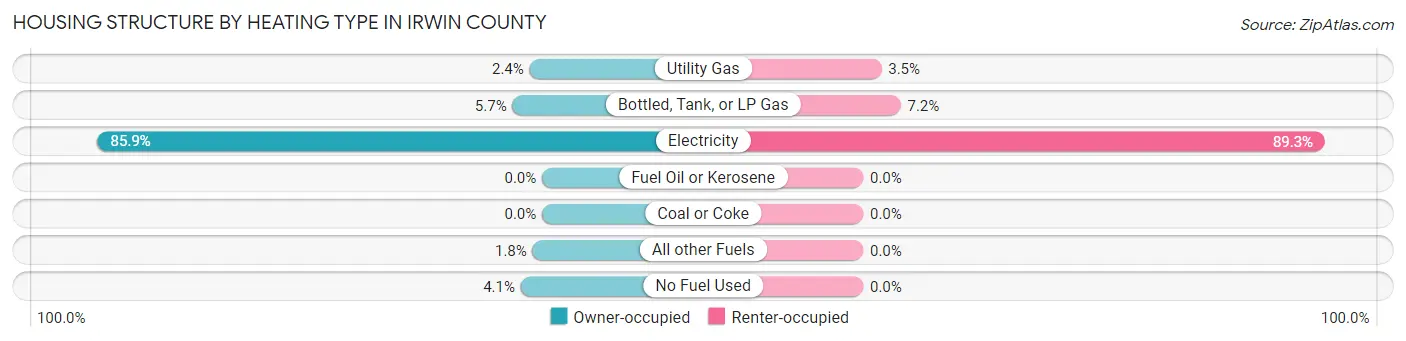
| Heating Type | Owner-occupied | Renter-occupied |
| Utility Gas | 62 (2.4%) | 35 (3.5%) |
| Bottled, Tank, or LP Gas | 147 (5.7%) | 72 (7.2%) |
| Electricity | 2,209 (85.9%) | 888 (89.2%) |
| Fuel Oil or Kerosene | 0 (0.0%) | 0 (0.0%) |
| Coal or Coke | 0 (0.0%) | 0 (0.0%) |
| All other Fuels | 47 (1.8%) | 0 (0.0%) |
| No Fuel Used | 106 (4.1%) | 0 (0.0%) |
| Total | 2,571 (100.0%) | 995 (100.0%) |
Household Vehicle Usage in Irwin County

| Vehicles per Household | Owner-occupied | Renter-occupied |
| No Vehicle | 72 (2.8%) | 170 (17.1%) |
| 1 Vehicle | 707 (27.5%) | 336 (33.8%) |
| 2 Vehicles | 1,084 (42.2%) | 338 (34.0%) |
| 3 or more Vehicles | 708 (27.5%) | 151 (15.2%) |
| Total | 2,571 (100.0%) | 995 (100.0%) |
Real Estate & Mortgages in Irwin County
Real Estate and Mortgage Overview in Irwin County
| Characteristic | Without Mortgage | With Mortgage |
| Housing Units | 1,532 | 1,039 |
| Median Property Value | $85,400 | $109,700 |
| Median Household Income | $51,250 | $67 |
| Monthly Housing Costs | $377 | $26 |
| Real Estate Taxes | $854 | $0 |
Property Value by Mortgage Status in Irwin County

| Property Value | Without Mortgage | With Mortgage |
| Less than $50,000 | 450 (29.4%) | 86 (8.3%) |
| $50,000 to $99,999 | 496 (32.4%) | 361 (34.7%) |
| $100,000 to $299,999 | 416 (27.2%) | 540 (52.0%) |
| $300,000 to $499,999 | 91 (5.9%) | 20 (1.9%) |
| $500,000 to $749,999 | 79 (5.2%) | 26 (2.5%) |
| $750,000 to $999,999 | 0 (0.0%) | 0 (0.0%) |
| $1,000,000 or more | 0 (0.0%) | 6 (0.6%) |
| Total | 1,532 (100.0%) | 1,039 (100.0%) |
Household Income by Mortgage Status in Irwin County

| Household Income | Without Mortgage | With Mortgage |
| Less than $10,000 | 44 (2.9%) | 7 (0.7%) |
| $10,000 to $24,999 | 298 (19.5%) | 117 (11.3%) |
| $25,000 to $34,999 | 141 (9.2%) | 73 (7.0%) |
| $35,000 to $49,999 | 275 (17.9%) | 184 (17.7%) |
| $50,000 to $74,999 | 371 (24.2%) | 121 (11.7%) |
| $75,000 to $99,999 | 258 (16.8%) | 186 (17.9%) |
| $100,000 to $149,999 | 78 (5.1%) | 92 (8.8%) |
| $150,000 or more | 67 (4.4%) | 199 (19.2%) |
| Total | 1,532 (100.0%) | 1,039 (100.0%) |
Property Value to Household Income Ratio in Irwin County
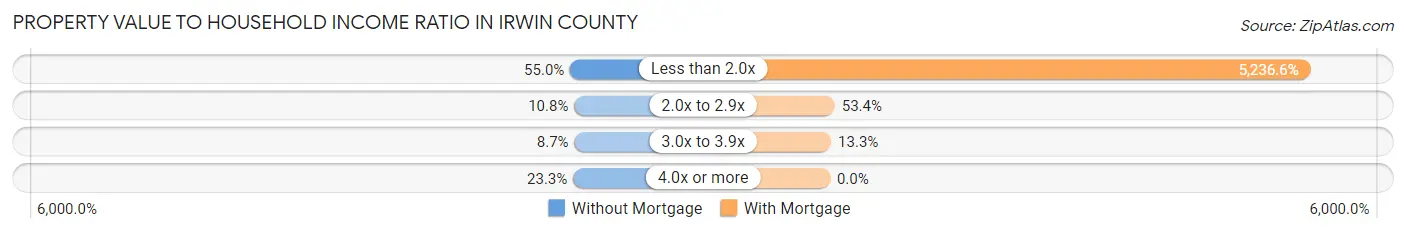
| Value-to-Income Ratio | Without Mortgage | With Mortgage |
| Less than 2.0x | 843 (55.0%) | 54,408 (5,236.6%) |
| 2.0x to 2.9x | 166 (10.8%) | 555 (53.4%) |
| 3.0x to 3.9x | 133 (8.7%) | 138 (13.3%) |
| 4.0x or more | 357 (23.3%) | 0 (0.0%) |
| Total | 1,532 (100.0%) | 1,039 (100.0%) |
Real Estate Taxes by Mortgage Status in Irwin County
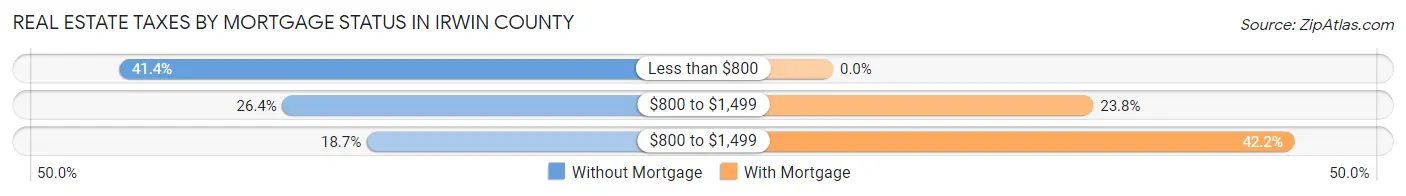
| Property Taxes | Without Mortgage | With Mortgage |
| Less than $800 | 634 (41.4%) | 0 (0.0%) |
| $800 to $1,499 | 405 (26.4%) | 247 (23.8%) |
| $800 to $1,499 | 287 (18.7%) | 438 (42.2%) |
| Total | 1,532 (100.0%) | 1,039 (100.0%) |
Health & Disability in Irwin County
Health Insurance Coverage by Age in Irwin County
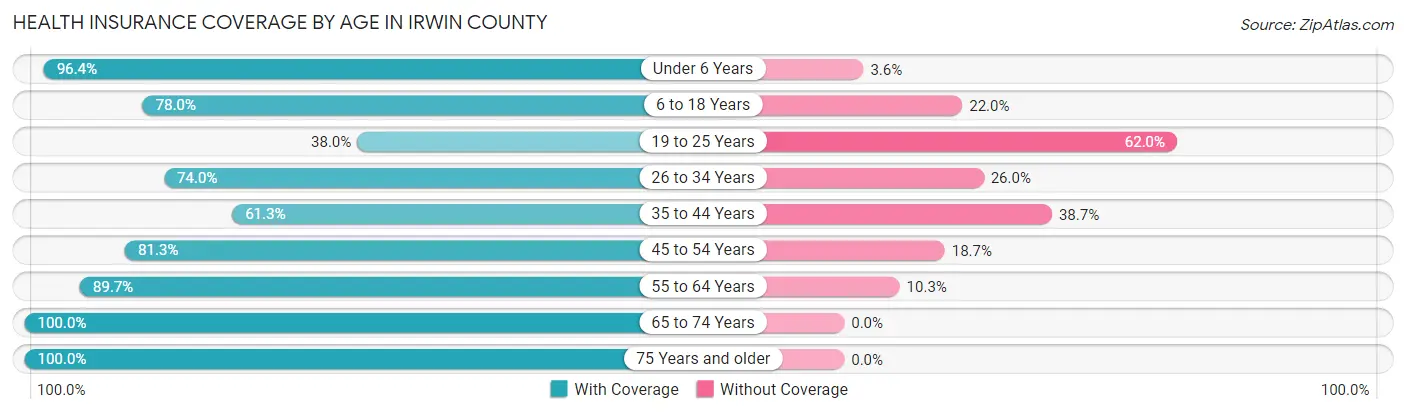
| Age Bracket | With Coverage | Without Coverage |
| Under 6 Years | 541 (96.4%) | 20 (3.6%) |
| 6 to 18 Years | 1,343 (78.0%) | 379 (22.0%) |
| 19 to 25 Years | 264 (38.0%) | 431 (62.0%) |
| 26 to 34 Years | 831 (74.0%) | 292 (26.0%) |
| 35 to 44 Years | 780 (61.3%) | 493 (38.7%) |
| 45 to 54 Years | 876 (81.3%) | 202 (18.7%) |
| 55 to 64 Years | 1,017 (89.7%) | 117 (10.3%) |
| 65 to 74 Years | 1,030 (100.0%) | 0 (0.0%) |
| 75 Years and older | 617 (100.0%) | 0 (0.0%) |
| Total | 7,299 (79.0%) | 1,934 (20.9%) |
Health Insurance Coverage by Citizenship Status in Irwin County
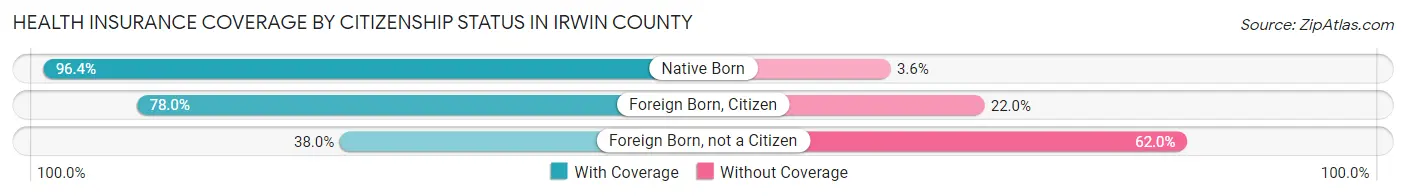
| Citizenship Status | With Coverage | Without Coverage |
| Native Born | 541 (96.4%) | 20 (3.6%) |
| Foreign Born, Citizen | 1,343 (78.0%) | 379 (22.0%) |
| Foreign Born, not a Citizen | 264 (38.0%) | 431 (62.0%) |
Health Insurance Coverage by Household Income in Irwin County
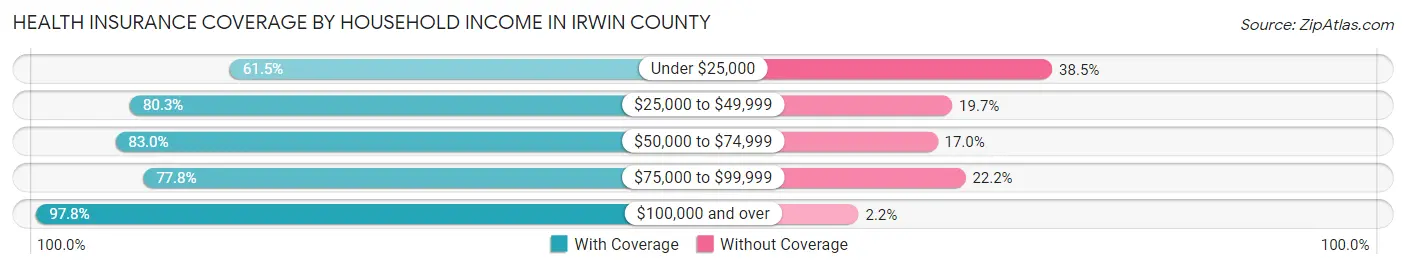
| Household Income | With Coverage | Without Coverage |
| Under $25,000 | 1,291 (61.5%) | 807 (38.5%) |
| $25,000 to $49,999 | 1,834 (80.3%) | 451 (19.7%) |
| $50,000 to $74,999 | 1,665 (83.0%) | 341 (17.0%) |
| $75,000 to $99,999 | 1,060 (77.8%) | 303 (22.2%) |
| $100,000 and over | 1,423 (97.8%) | 32 (2.2%) |
Public vs Private Health Insurance Coverage by Age in Irwin County
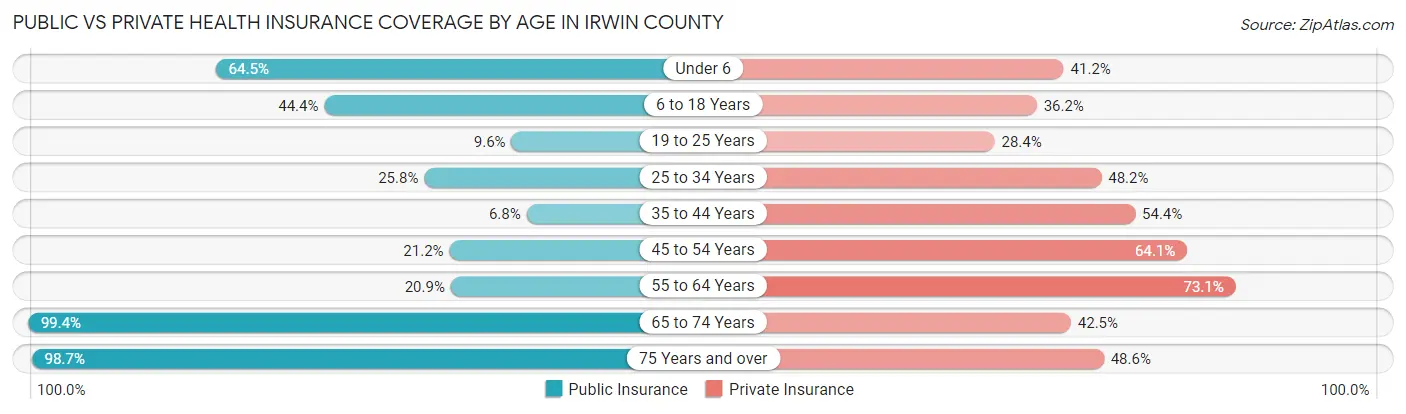
| Age Bracket | Public Insurance | Private Insurance |
| Under 6 | 362 (64.5%) | 231 (41.2%) |
| 6 to 18 Years | 764 (44.4%) | 623 (36.2%) |
| 19 to 25 Years | 67 (9.6%) | 197 (28.3%) |
| 25 to 34 Years | 290 (25.8%) | 541 (48.2%) |
| 35 to 44 Years | 87 (6.8%) | 693 (54.4%) |
| 45 to 54 Years | 228 (21.1%) | 691 (64.1%) |
| 55 to 64 Years | 237 (20.9%) | 829 (73.1%) |
| 65 to 74 Years | 1,024 (99.4%) | 438 (42.5%) |
| 75 Years and over | 609 (98.7%) | 300 (48.6%) |
| Total | 3,668 (39.7%) | 4,543 (49.2%) |
Disability Status by Sex by Age in Irwin County
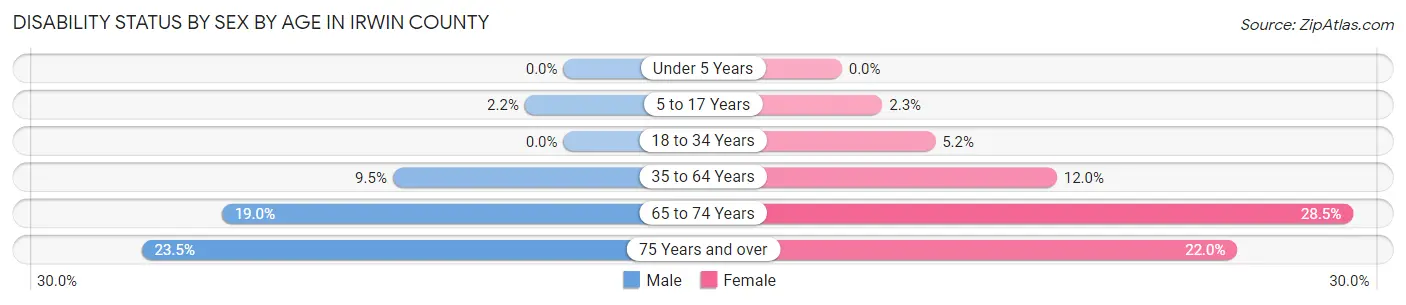
| Age Bracket | Male | Female |
| Under 5 Years | 0 (0.0%) | 0 (0.0%) |
| 5 to 17 Years | 21 (2.1%) | 15 (2.3%) |
| 18 to 34 Years | 0 (0.0%) | 43 (5.2%) |
| 35 to 64 Years | 158 (9.5%) | 218 (12.0%) |
| 65 to 74 Years | 89 (19.0%) | 160 (28.5%) |
| 75 Years and over | 66 (23.5%) | 74 (22.0%) |
Disability Class by Sex by Age in Irwin County
Disability Class: Hearing Difficulty
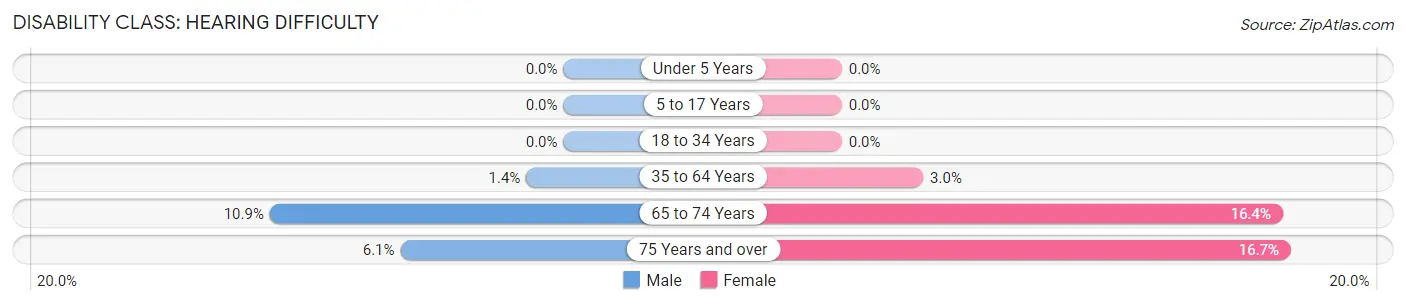
| Age Bracket | Male | Female |
| Under 5 Years | 0 (0.0%) | 0 (0.0%) |
| 5 to 17 Years | 0 (0.0%) | 0 (0.0%) |
| 18 to 34 Years | 0 (0.0%) | 0 (0.0%) |
| 35 to 64 Years | 23 (1.4%) | 55 (3.0%) |
| 65 to 74 Years | 51 (10.9%) | 92 (16.4%) |
| 75 Years and over | 17 (6.0%) | 56 (16.7%) |
Disability Class: Vision Difficulty
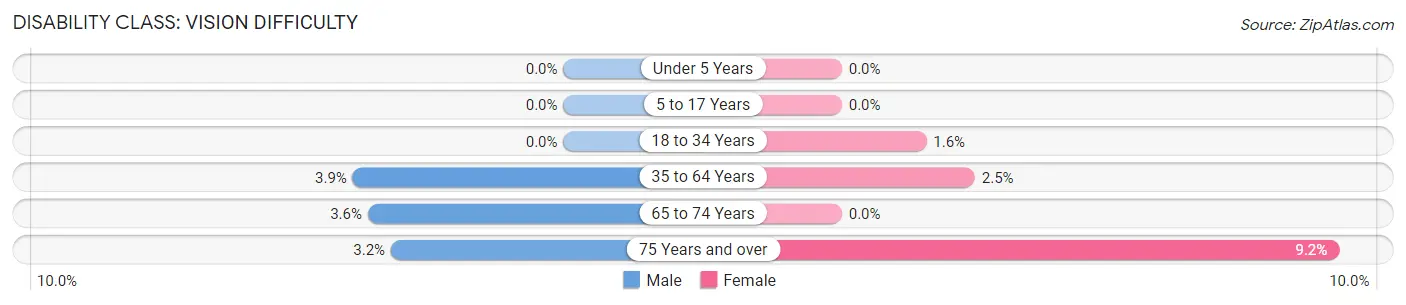
| Age Bracket | Male | Female |
| Under 5 Years | 0 (0.0%) | 0 (0.0%) |
| 5 to 17 Years | 0 (0.0%) | 0 (0.0%) |
| 18 to 34 Years | 0 (0.0%) | 13 (1.6%) |
| 35 to 64 Years | 65 (3.9%) | 45 (2.5%) |
| 65 to 74 Years | 17 (3.6%) | 0 (0.0%) |
| 75 Years and over | 9 (3.2%) | 31 (9.2%) |
Disability Class: Cognitive Difficulty
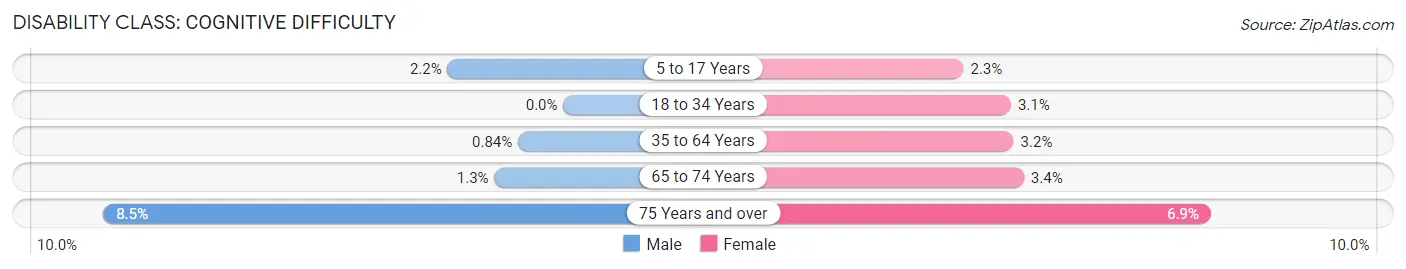
| Age Bracket | Male | Female |
| 5 to 17 Years | 21 (2.1%) | 15 (2.3%) |
| 18 to 34 Years | 0 (0.0%) | 26 (3.1%) |
| 35 to 64 Years | 14 (0.8%) | 58 (3.2%) |
| 65 to 74 Years | 6 (1.3%) | 19 (3.4%) |
| 75 Years and over | 24 (8.5%) | 23 (6.9%) |
Disability Class: Ambulatory Difficulty
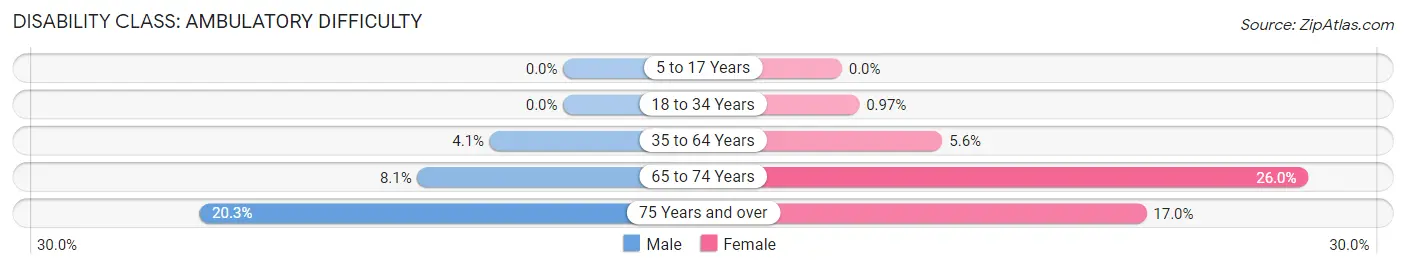
| Age Bracket | Male | Female |
| 5 to 17 Years | 0 (0.0%) | 0 (0.0%) |
| 18 to 34 Years | 0 (0.0%) | 8 (1.0%) |
| 35 to 64 Years | 68 (4.1%) | 102 (5.6%) |
| 65 to 74 Years | 38 (8.1%) | 146 (26.0%) |
| 75 Years and over | 57 (20.3%) | 57 (17.0%) |
Disability Class: Self-Care Difficulty
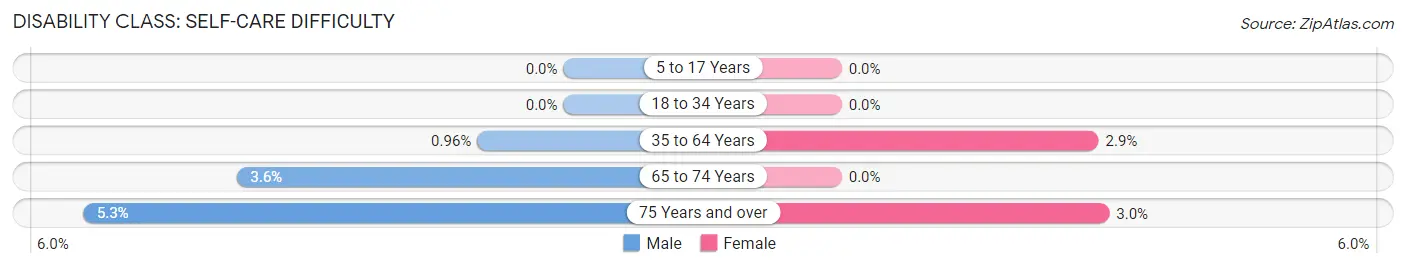
| Age Bracket | Male | Female |
| 5 to 17 Years | 0 (0.0%) | 0 (0.0%) |
| 18 to 34 Years | 0 (0.0%) | 0 (0.0%) |
| 35 to 64 Years | 16 (1.0%) | 52 (2.9%) |
| 65 to 74 Years | 17 (3.6%) | 0 (0.0%) |
| 75 Years and over | 15 (5.3%) | 10 (3.0%) |
Technology Access in Irwin County
Computing Device Access in Irwin County
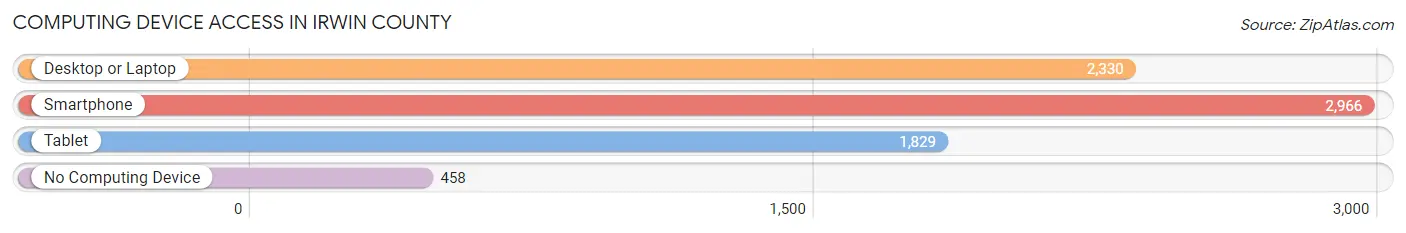
| Device Type | # Households | % Households |
| Desktop or Laptop | 2,330 | 65.3% |
| Smartphone | 2,966 | 83.2% |
| Tablet | 1,829 | 51.3% |
| No Computing Device | 458 | 12.8% |
| Total | 3,566 | 100.0% |
Internet Access in Irwin County

| Internet Type | # Households | % Households |
| Dial-Up Internet | 0 | 0.0% |
| Broadband Home | 1,725 | 48.4% |
| Cellular Data Only | 573 | 16.1% |
| Satellite Internet | 862 | 24.2% |
| No Internet | 846 | 23.7% |
| Total | 3,566 | 100.0% |
Irwin County Summary
Irwin County is located in the south-central part of the state of Georgia, in the United States. It is part of the Valdosta Metropolitan Statistical Area. The county was created in 1818 and named for Governor Jared Irwin. As of the 2010 census, the population was 9,538.
Geography
Irwin County is located in the south-central part of Georgia, in the United States. It is bordered by Ben Hill County to the north, Wilcox County to the east, Tift County to the south, and Coffee County to the west. The county has a total area of 441 square miles, of which 439 square miles is land and 2.2 square miles (0.5%) is water. The county is located in the Okefenokee Swamp region of Georgia.
The county is divided into two distinct regions. The northern part of the county is mostly flat, with some rolling hills. The southern part of the county is hilly and heavily forested. The county is drained by the Ocmulgee River, which forms the western boundary of the county.
History
Irwin County was created in 1818 from parts of Wilcox and Telfair counties. It was named for Governor Jared Irwin, who served as the first governor of Georgia from 1779 to 1781.
The county was largely agricultural in its early years, with cotton being the primary crop. The county was also home to several sawmills and gristmills.
In the late 19th century, the county began to develop a timber industry. The county was also home to several turpentine stills.
In the early 20th century, the county began to develop a manufacturing industry. The county was home to several textile mills, as well as a brick plant and a furniture factory.
In the late 20th century, the county began to develop a tourism industry. The county is home to several state parks, as well as the Okefenokee National Wildlife Refuge.
Economy
The economy of Irwin County is largely based on agriculture and manufacturing. The county is home to several poultry farms, as well as several timber and paper mills. The county is also home to several manufacturing plants, including a furniture factory and a brick plant.
The county is also home to several state parks, as well as the Okefenokee National Wildlife Refuge. Tourism is an important part of the county's economy.
Demographics
As of the 2010 census, there were 9,538 people, 3,717 households, and 2,541 families living in the county. The population density was 22 people per square mile. There were 4,093 housing units at an average density of 9 per square mile.
The racial makeup of the county was 73.3% White, 23.3% Black or African American, 0.3% Native American, 0.2% Asian, 0.1% Pacific Islander, 1.3% from other races, and 1.5% from two or more races. 2.7% of the population were Hispanic or Latino of any race.
There were 3,717 households, out of which 28.7% had children under the age of 18 living with them, 51.2% were married couples living together, 13.7% had a female householder with no husband present, and 30.3% were non-families. 26.2% of all households were made up of individuals, and 11.3% had someone living alone who was 65 years of age or older. The average household size was 2.53 and the average family size was 3.05.
In the county, the population was spread out, with 24.7% under the age of 18, 8.3% from 18 to 24, 25.7% from 25 to 44, 25.3% from 45 to 64, and 15.9% who were 65 years of age or older. The median age was 38 years. For every 100 females, there were 94.2 males. For every 100 females age 18 and over, there were 91.2 males.
The median income for a household in the county was $30,945, and the median income for a family was $36,945. Males had a median income of $30,945 versus $21,945 for females. The per capita income for the county was $15,945. About 14.3% of families and 17.3% of the population were below the poverty line, including 22.3% of those under age 18 and 16.3% of those age 65 or over.
Common Questions
What is the Total Population of Irwin County?
Total Population of Irwin County is 9,487.
What is the Total Male Population of Irwin County?
Total Male Population of Irwin County is 4,957.
What is the Total Female Population of Irwin County?
Total Female Population of Irwin County is 4,530.
What is the Ratio of Males per 100 Females in Irwin County?
There are 109.43 Males per 100 Females in Irwin County.
What is the Ratio of Females per 100 Males in Irwin County?
There are 91.39 Females per 100 Males in Irwin County.
What is the Median Population Age in Irwin County?
Median Population Age in Irwin County is 39.8 Years.
What is the Average Family Size in Irwin County
Average Family Size in Irwin County is 3.3 People.
What is the Average Household Size in Irwin County
Average Household Size in Irwin County is 2.6 People.
What is Per Capita Income in Irwin County?
Per Capita income in Irwin County is $23,794.
What is the Median Family Income in Irwin County?
Median Family Income in Irwin County is $68,065.
What is the Median Household income in Irwin County?
Median Household Income in Irwin County is $46,383.
What is Income or Wage Gap in Irwin County?
Income or Wage Gap in Irwin County is 16.3%.
Women in Irwin County earn 83.7 cents for every dollar earned by a man.
What is Inequality or Gini Index in Irwin County?
Inequality or Gini Index in Irwin County is 0.43.
How Large is the Labor Force in Irwin County?
There are 4,176 People in the Labor Forcein in Irwin County.
What is the Percentage of People in the Labor Force in Irwin County?
53.3% of People are in the Labor Force in Irwin County.
What is the Unemployment Rate in Irwin County?
Unemployment Rate in Irwin County is 6.2%.