Hart County, GA
Hart County Map

Hart County Overview
26,110
TOTAL POPULATION
12,979
MALE POPULATION
13,131
FEMALE POPULATION
98.84
MALES / 100 FEMALES
101.17
FEMALES / 100 MALES
45.1
MEDIAN AGE
3.1
AVG FAMILY SIZE
2.5
AVG HOUSEHOLD SIZE
$30,636
PER CAPITA INCOME
$77,241
AVG FAMILY INCOME
$61,765
AVG HOUSEHOLD INCOME
30.0%
WAGE / INCOME GAP [ % ]
70.0¢/ $1
WAGE / INCOME GAP [ $ ]
$9,455
FAMILY INCOME DEFICIT
0.44
INEQUALITY / GINI INDEX
11,635
LABOR FORCE [ PEOPLE ]
54.7%
PERCENT IN LABOR FORCE
4.8%
UNEMPLOYMENT RATE
Hart County Area Codes
Race in Hart County
The most populous races in Hart County are White / Caucasian (19,695 | 75.4%), Black / African American (4,607 | 17.6%), and Two or more Races (1,211 | 4.6%).

| Race | # Population | % Population |
| Asian | 342 | 1.3% |
| Black / African American | 4,607 | 17.6% |
| Hawaiian / Pacific | 0 | 0.0% |
| Hispanic or Latino | 1,028 | 3.9% |
| Native / Alaskan | 126 | 0.5% |
| White / Caucasian | 19,695 | 75.4% |
| Two or more Races | 1,211 | 4.6% |
| Some other Race | 129 | 0.5% |
| Total | 26,110 | 100.0% |
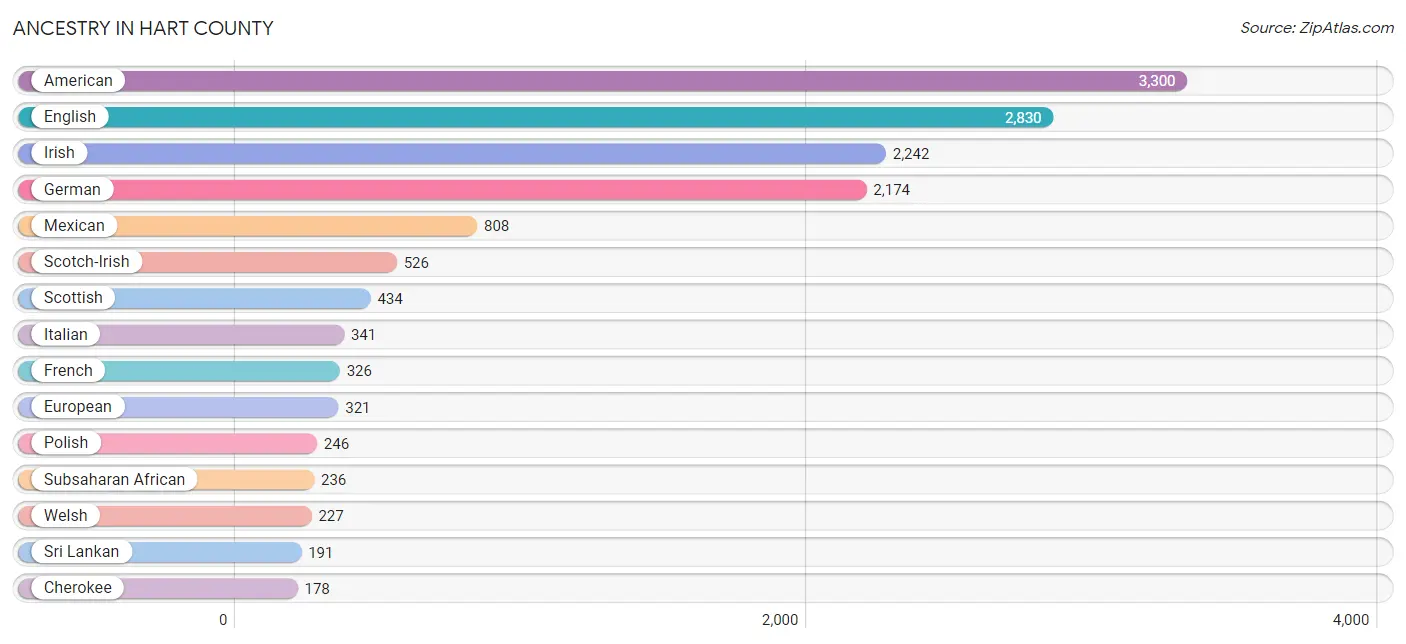
Ancestry in Hart County
The most populous ancestries reported in Hart County are American (3,300 | 12.6%), English (2,830 | 10.8%), Irish (2,242 | 8.6%), German (2,174 | 8.3%), and Mexican (808 | 3.1%), together accounting for 43.5% of all Hart County residents.
| Ancestry | # Population | % Population |
| Afghan | 12 | 0.1% |
| African | 177 | 0.7% |
| American | 3,300 | 12.6% |
| Bhutanese | 22 | 0.1% |
| Blackfeet | 10 | 0.0% |
| British | 68 | 0.3% |
| Burmese | 70 | 0.3% |
| Canadian | 49 | 0.2% |
| Central American | 92 | 0.4% |
| Central American Indian | 23 | 0.1% |
| Cherokee | 178 | 0.7% |
| Chickasaw | 3 | 0.0% |
| Crow | 28 | 0.1% |
| Cuban | 50 | 0.2% |
| Czech | 57 | 0.2% |
| Dutch | 114 | 0.4% |
| Eastern European | 11 | 0.0% |
| English | 2,830 | 10.8% |
| European | 321 | 1.2% |
| Finnish | 5 | 0.0% |
| French | 326 | 1.3% |
| French American Indian | 18 | 0.1% |
| French Canadian | 81 | 0.3% |
| German | 2,174 | 8.3% |
| Greek | 43 | 0.2% |
| Guatemalan | 1 | 0.0% |
| Guyanese | 25 | 0.1% |
| Honduran | 3 | 0.0% |
| Hungarian | 27 | 0.1% |
| Indian (Asian) | 19 | 0.1% |
| Irish | 2,242 | 8.6% |
| Italian | 341 | 1.3% |
| Korean | 55 | 0.2% |
| Lithuanian | 11 | 0.0% |
| Mexican | 808 | 3.1% |
| Mexican American Indian | 55 | 0.2% |
| Nicaraguan | 64 | 0.3% |
| Nigerian | 59 | 0.2% |
| Norwegian | 64 | 0.3% |
| Panamanian | 24 | 0.1% |
| Pennsylvania German | 16 | 0.1% |
| Polish | 246 | 0.9% |
| Portuguese | 15 | 0.1% |
| Puerto Rican | 47 | 0.2% |
| Russian | 54 | 0.2% |
| Scotch-Irish | 526 | 2.0% |
| Scottish | 434 | 1.7% |
| Slovak | 9 | 0.0% |
| Spaniard | 6 | 0.0% |
| Sri Lankan | 191 | 0.7% |
| Subsaharan African | 236 | 0.9% |
| Swedish | 112 | 0.4% |
| Swiss | 19 | 0.1% |
| Thai | 25 | 0.1% |
| Ukrainian | 8 | 0.0% |
| Welsh | 227 | 0.9% | View All 56 Rows |
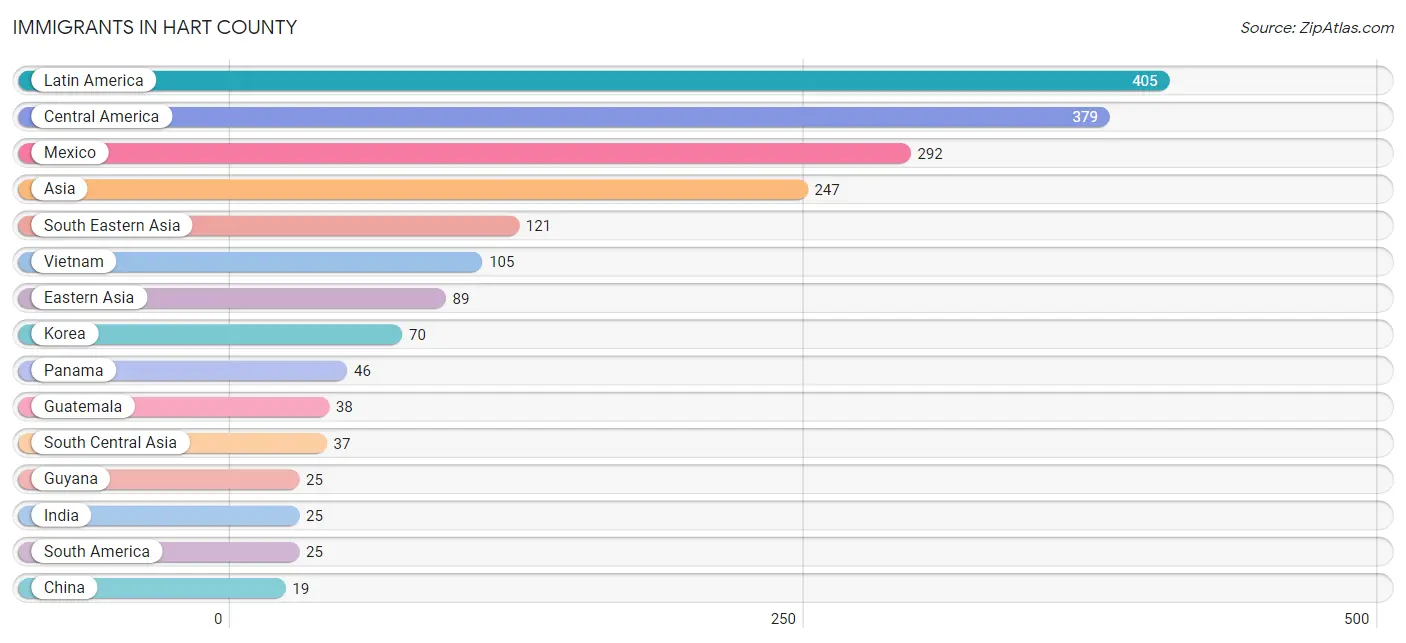
Immigrants in Hart County
The most numerous immigrant groups reported in Hart County came from Latin America (405 | 1.5%), Central America (379 | 1.5%), Mexico (292 | 1.1%), Asia (247 | 0.9%), and South Eastern Asia (121 | 0.5%), together accounting for 5.5% of all Hart County residents.
| Immigration Origin | # Population | % Population |
| Afghanistan | 12 | 0.1% |
| Africa | 10 | 0.0% |
| Asia | 247 | 0.9% |
| Canada | 18 | 0.1% |
| Caribbean | 1 | 0.0% |
| Central America | 379 | 1.5% |
| China | 19 | 0.1% |
| Cuba | 1 | 0.0% |
| Eastern Asia | 89 | 0.3% |
| England | 10 | 0.0% |
| Europe | 10 | 0.0% |
| Guatemala | 38 | 0.2% |
| Guyana | 25 | 0.1% |
| Honduras | 3 | 0.0% |
| India | 25 | 0.1% |
| Korea | 70 | 0.3% |
| Latin America | 405 | 1.5% |
| Mexico | 292 | 1.1% |
| Northern Europe | 10 | 0.0% |
| Panama | 46 | 0.2% |
| Philippines | 16 | 0.1% |
| South America | 25 | 0.1% |
| South Central Asia | 37 | 0.1% |
| South Eastern Asia | 121 | 0.5% |
| Taiwan | 19 | 0.1% |
| Vietnam | 105 | 0.4% | View All 26 Rows |
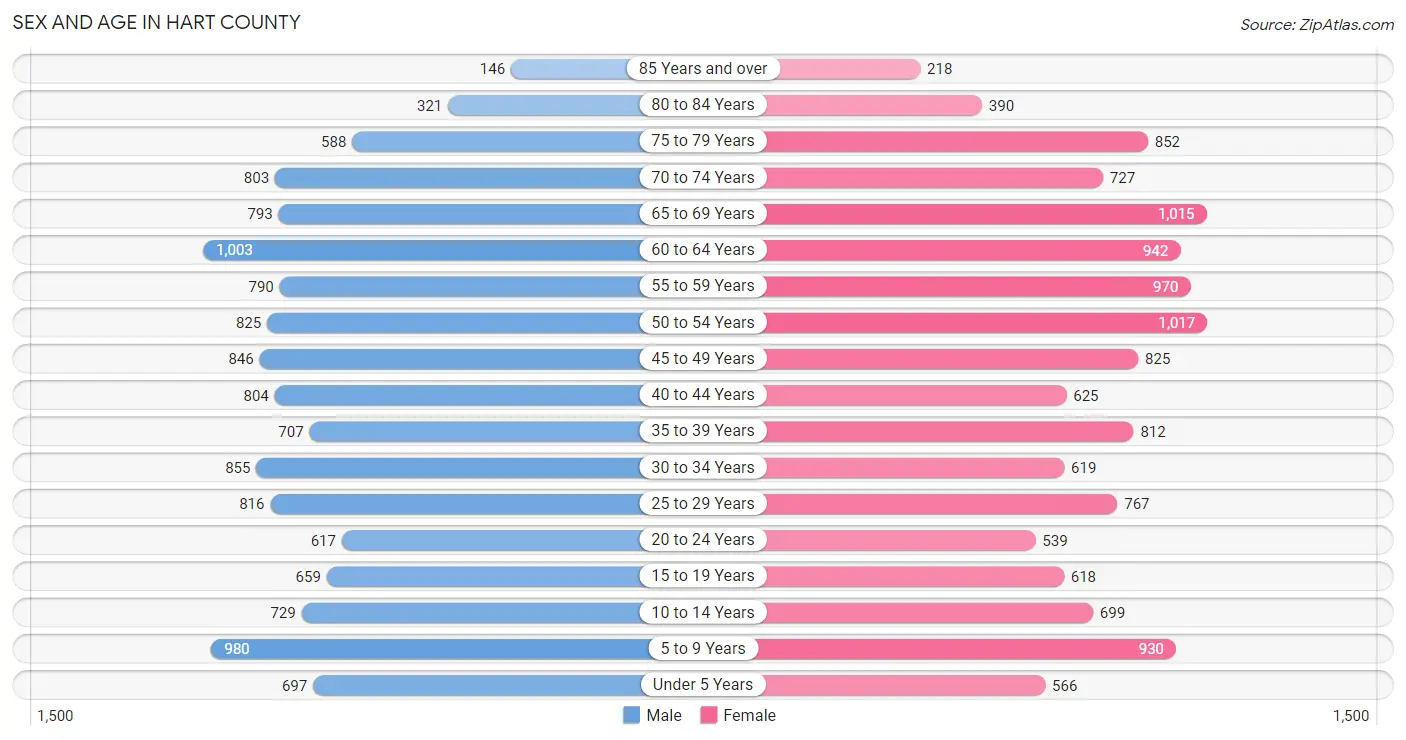
Sex and Age in Hart County
Sex and Age in Hart County
The most populous age groups in Hart County are 60 to 64 Years (1,003 | 7.7%) for men and 50 to 54 Years (1,017 | 7.7%) for women.
| Age Bracket | Male | Female |
| Under 5 Years | 697 (5.4%) | 566 (4.3%) |
| 5 to 9 Years | 980 (7.5%) | 930 (7.1%) |
| 10 to 14 Years | 729 (5.6%) | 699 (5.3%) |
| 15 to 19 Years | 659 (5.1%) | 618 (4.7%) |
| 20 to 24 Years | 617 (4.8%) | 539 (4.1%) |
| 25 to 29 Years | 816 (6.3%) | 767 (5.8%) |
| 30 to 34 Years | 855 (6.6%) | 619 (4.7%) |
| 35 to 39 Years | 707 (5.4%) | 812 (6.2%) |
| 40 to 44 Years | 804 (6.2%) | 625 (4.8%) |
| 45 to 49 Years | 846 (6.5%) | 825 (6.3%) |
| 50 to 54 Years | 825 (6.4%) | 1,017 (7.7%) |
| 55 to 59 Years | 790 (6.1%) | 970 (7.4%) |
| 60 to 64 Years | 1,003 (7.7%) | 942 (7.2%) |
| 65 to 69 Years | 793 (6.1%) | 1,015 (7.7%) |
| 70 to 74 Years | 803 (6.2%) | 727 (5.5%) |
| 75 to 79 Years | 588 (4.5%) | 852 (6.5%) |
| 80 to 84 Years | 321 (2.5%) | 390 (3.0%) |
| 85 Years and over | 146 (1.1%) | 218 (1.7%) |
| Total | 12,979 (100.0%) | 13,131 (100.0%) |
Families and Households in Hart County
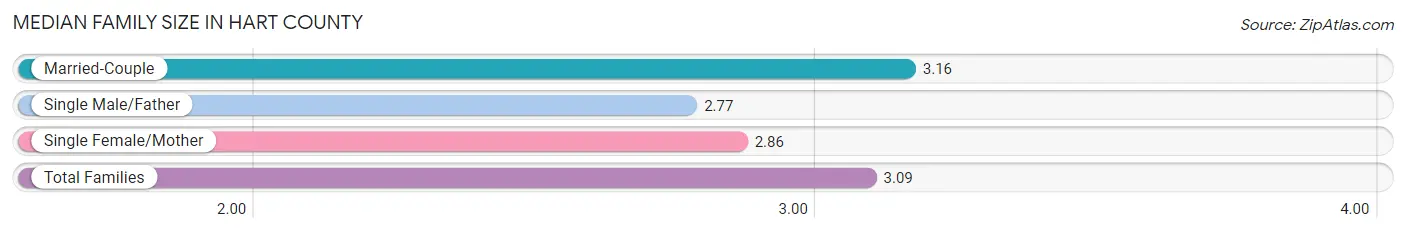
Median Family Size in Hart County
The median family size in Hart County is 3.09 persons per family, with married-couple families (5,256 | 78.0%) accounting for the largest median family size of 3.16 persons per family. On the other hand, single male/father families (531 | 7.9%) represent the smallest median family size with 2.77 persons per family.
| Family Type | # Families | Family Size |
| Married-Couple | 5,256 (78.0%) | 3.16 |
| Single Male/Father | 531 (7.9%) | 2.77 |
| Single Female/Mother | 954 (14.1%) | 2.86 |
| Total Families | 6,741 (100.0%) | 3.09 |
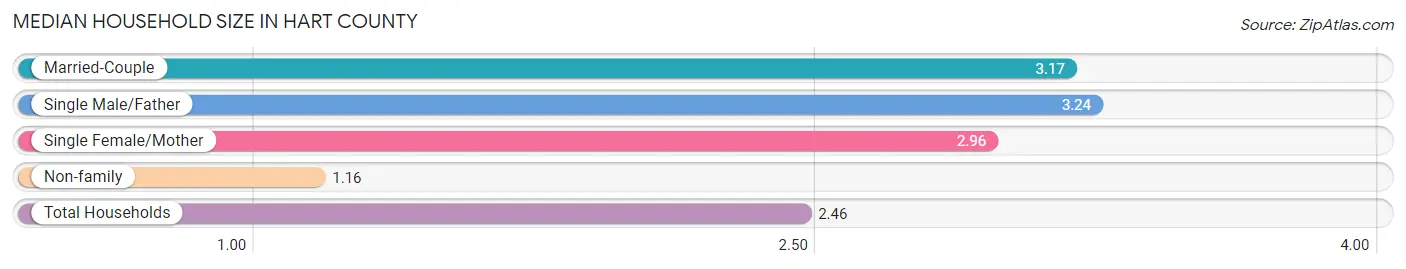
Median Household Size in Hart County
The median household size in Hart County is 2.46 persons per household, with single male/father households (531 | 5.2%) accounting for the largest median household size of 3.24 persons per household. non-family households (3,553 | 34.5%) represent the smallest median household size with 1.16 persons per household.
| Household Type | # Households | Household Size |
| Married-Couple | 5,256 (51.1%) | 3.17 |
| Single Male/Father | 531 (5.2%) | 3.24 |
| Single Female/Mother | 954 (9.3%) | 2.96 |
| Non-family | 3,553 (34.5%) | 1.16 |
| Total Households | 10,294 (100.0%) | 2.46 |
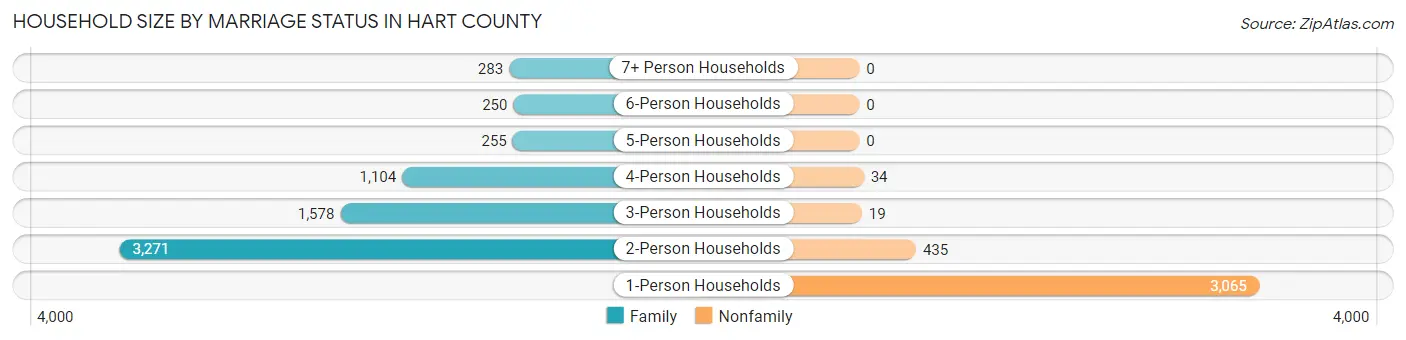
Household Size by Marriage Status in Hart County
Out of a total of 10,294 households in Hart County, 6,741 (65.5%) are family households, while 3,553 (34.5%) are nonfamily households. The most numerous type of family households are 2-person households, comprising 3,271, and the most common type of nonfamily households are 1-person households, comprising 3,065.
| Household Size | Family Households | Nonfamily Households |
| 1-Person Households | - | 3,065 (29.8%) |
| 2-Person Households | 3,271 (31.8%) | 435 (4.2%) |
| 3-Person Households | 1,578 (15.3%) | 19 (0.2%) |
| 4-Person Households | 1,104 (10.7%) | 34 (0.3%) |
| 5-Person Households | 255 (2.5%) | 0 (0.0%) |
| 6-Person Households | 250 (2.4%) | 0 (0.0%) |
| 7+ Person Households | 283 (2.8%) | 0 (0.0%) |
| Total | 6,741 (65.5%) | 3,553 (34.5%) |
Female Fertility in Hart County
Fertility by Age in Hart County
Average fertility rate in Hart County is 85.0 births per 1,000 women. Women in the age bracket of 20 to 34 years have the highest fertility rate with 99.0 births per 1,000 women. Women in the age bracket of 35 to 50 years acount for 53.9% of all women with births.
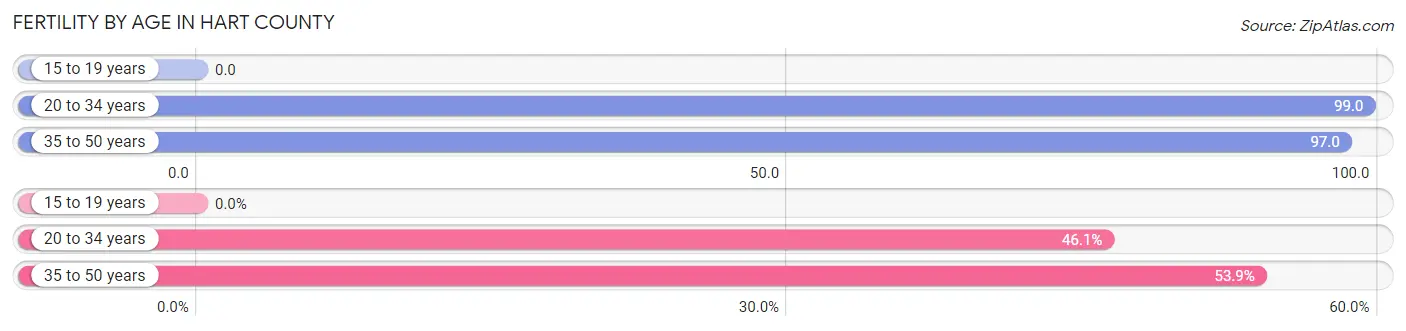
| Age Bracket | Women with Births | Births / 1,000 Women |
| 15 to 19 years | 0 (0.0%) | 0.0 |
| 20 to 34 years | 190 (46.1%) | 99.0 |
| 35 to 50 years | 222 (53.9%) | 97.0 |
| Total | 412 (100.0%) | 85.0 |
Fertility by Age by Marriage Status in Hart County
85.4% of women with births (412) in Hart County are married. The highest percentage of unmarried women with births falls into 20 to 34 years age bracket with 20.5% of them unmarried at the time of birth, while the lowest percentage of unmarried women with births belong to 35 to 50 years age bracket with 9.5% of them unmarried.

| Age Bracket | Married | Unmarried |
| 15 to 19 years | 0 (0.0%) | 0 (0.0%) |
| 20 to 34 years | 151 (79.5%) | 39 (20.5%) |
| 35 to 50 years | 201 (90.5%) | 21 (9.5%) |
| Total | 352 (85.4%) | 60 (14.6%) |
Fertility by Education in Hart County
Average fertility rate in Hart County is 85.0 births per 1,000 women. Women with the education attainment of bachelor's degree have the highest fertility rate of 299.0 births per 1,000 women, while women with the education attainment of high school diploma have the lowest fertility at 44.0 births per 1,000 women. Women with the education attainment of less than high school represent 28.6% of all women with births.
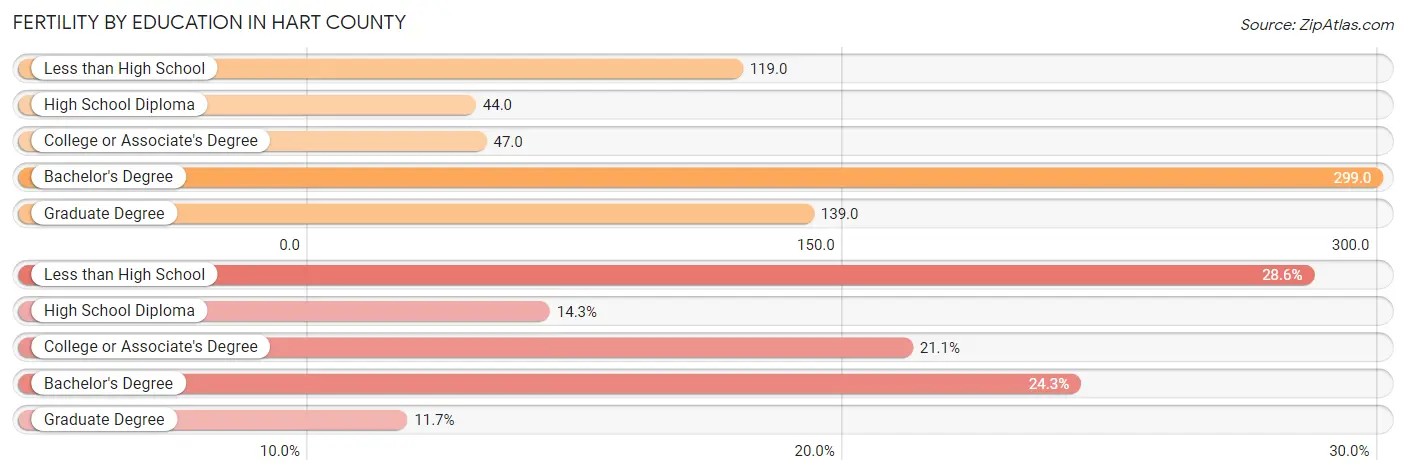
| Educational Attainment | Women with Births | Births / 1,000 Women |
| Less than High School | 118 (28.6%) | 119.0 |
| High School Diploma | 59 (14.3%) | 44.0 |
| College or Associate's Degree | 87 (21.1%) | 47.0 |
| Bachelor's Degree | 100 (24.3%) | 299.0 |
| Graduate Degree | 48 (11.7%) | 139.0 |
| Total | 412 (100.0%) | 85.0 |
Fertility by Education by Marriage Status in Hart County
14.6% of women with births in Hart County are unmarried. Women with the educational attainment of high school diploma are most likely to be married with 100.0% of them married at childbirth, while women with the educational attainment of less than high school are least likely to be married with 36.4% of them unmarried at childbirth.
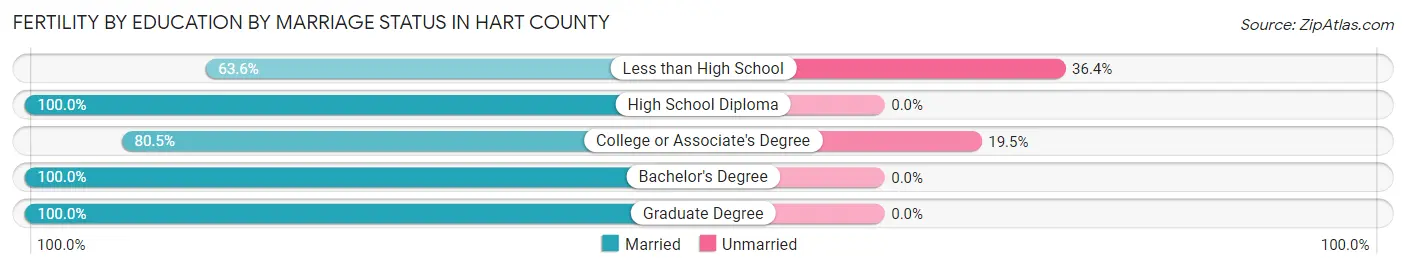
| Educational Attainment | Married | Unmarried |
| Less than High School | 75 (63.6%) | 43 (36.4%) |
| High School Diploma | 59 (100.0%) | 0 (0.0%) |
| College or Associate's Degree | 70 (80.5%) | 17 (19.5%) |
| Bachelor's Degree | 100 (100.0%) | 0 (0.0%) |
| Graduate Degree | 48 (100.0%) | 0 (0.0%) |
| Total | 352 (85.4%) | 60 (14.6%) |
Income in Hart County
Income Overview in Hart County
Per Capita Income in Hart County is $30,636, while median incomes of families and households are $77,241 and $61,765 respectively.
| Characteristic | Number | Measure |
| Per Capita Income | 26,110 | $30,636 |
| Median Family Income | 6,741 | $77,241 |
| Mean Family Income | 6,741 | $92,248 |
| Median Household Income | 10,294 | $61,765 |
| Mean Household Income | 10,294 | $77,141 |
| Income Deficit | 6,741 | $9,455 |
| Wage / Income Gap (%) | 26,110 | 29.96% |
| Wage / Income Gap ($) | 26,110 | 70.04¢ per $1 |
| Gini / Inequality Index | 26,110 | 0.44 |
Earnings by Sex in Hart County
Average Earnings in Hart County are $34,972, $42,733 for men and $29,931 for women, a difference of 30.0%.

| Sex | Number | Average Earnings |
| Male | 6,594 (52.9%) | $42,733 |
| Female | 5,868 (47.1%) | $29,931 |
| Total | 12,462 (100.0%) | $34,972 |
Earnings by Sex by Income Bracket in Hart County
The most common earnings brackets in Hart County are $100,000+ for men (981 | 14.9%) and $30,000 to $34,999 for women (614 | 10.5%).
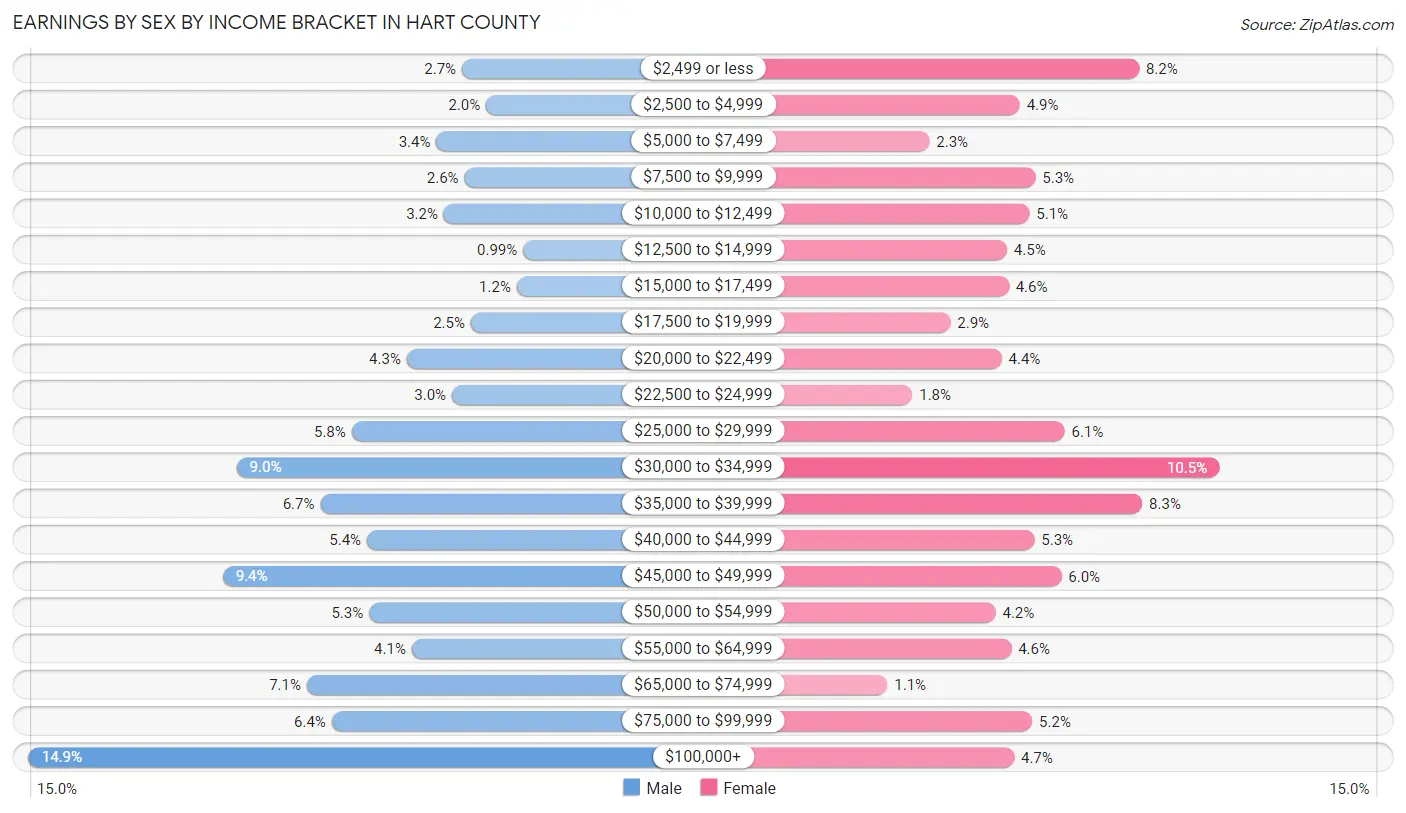
| Income | Male | Female |
| $2,499 or less | 179 (2.7%) | 482 (8.2%) |
| $2,500 to $4,999 | 134 (2.0%) | 285 (4.9%) |
| $5,000 to $7,499 | 226 (3.4%) | 136 (2.3%) |
| $7,500 to $9,999 | 174 (2.6%) | 311 (5.3%) |
| $10,000 to $12,499 | 212 (3.2%) | 301 (5.1%) |
| $12,500 to $14,999 | 65 (1.0%) | 264 (4.5%) |
| $15,000 to $17,499 | 77 (1.2%) | 267 (4.5%) |
| $17,500 to $19,999 | 162 (2.5%) | 171 (2.9%) |
| $20,000 to $22,499 | 281 (4.3%) | 255 (4.3%) |
| $22,500 to $24,999 | 197 (3.0%) | 108 (1.8%) |
| $25,000 to $29,999 | 383 (5.8%) | 359 (6.1%) |
| $30,000 to $34,999 | 596 (9.0%) | 614 (10.5%) |
| $35,000 to $39,999 | 441 (6.7%) | 487 (8.3%) |
| $40,000 to $44,999 | 355 (5.4%) | 309 (5.3%) |
| $45,000 to $49,999 | 622 (9.4%) | 354 (6.0%) |
| $50,000 to $54,999 | 351 (5.3%) | 245 (4.2%) |
| $55,000 to $64,999 | 272 (4.1%) | 271 (4.6%) |
| $65,000 to $74,999 | 466 (7.1%) | 67 (1.1%) |
| $75,000 to $99,999 | 420 (6.4%) | 306 (5.2%) |
| $100,000+ | 981 (14.9%) | 276 (4.7%) |
| Total | 6,594 (100.0%) | 5,868 (100.0%) |
Earnings by Sex by Educational Attainment in Hart County
Average earnings in Hart County are $44,853 for men and $32,968 for women, a difference of 26.5%. Men with an educational attainment of bachelor's degree enjoy the highest average annual earnings of $75,556, while those with high school diploma education earn the least with $33,438. Women with an educational attainment of graduate degree earn the most with the average annual earnings of $64,737, while those with less than high school education have the smallest earnings of $21,223.
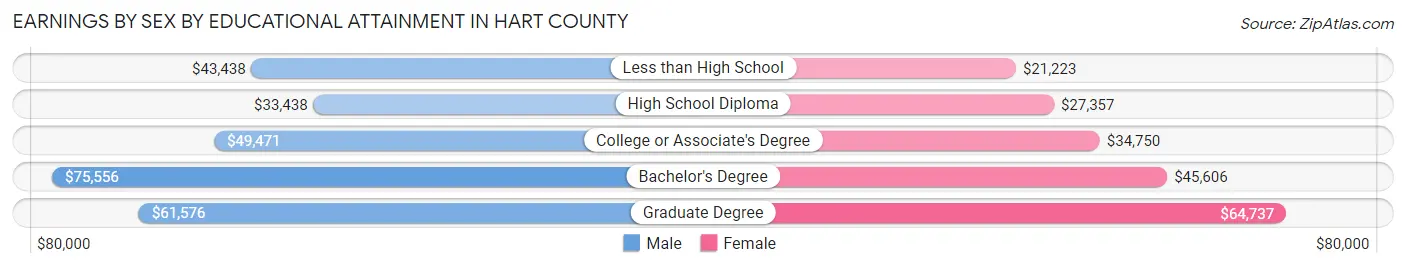
| Educational Attainment | Male Income | Female Income |
| Less than High School | $43,438 | $21,223 |
| High School Diploma | $33,438 | $27,357 |
| College or Associate's Degree | $49,471 | $34,750 |
| Bachelor's Degree | $75,556 | $45,606 |
| Graduate Degree | $61,576 | $64,737 |
| Total | $44,853 | $32,968 |
Family Income in Hart County
Family Income Brackets in Hart County
According to the Hart County family income data, there are 1,348 families falling into the $100,000 to $149,999 income range, which is the most common income bracket and makes up 20.0% of all families. Conversely, the $10,000 to $14,999 income bracket is the least frequent group with only 81 families (1.2%) belonging to this category.
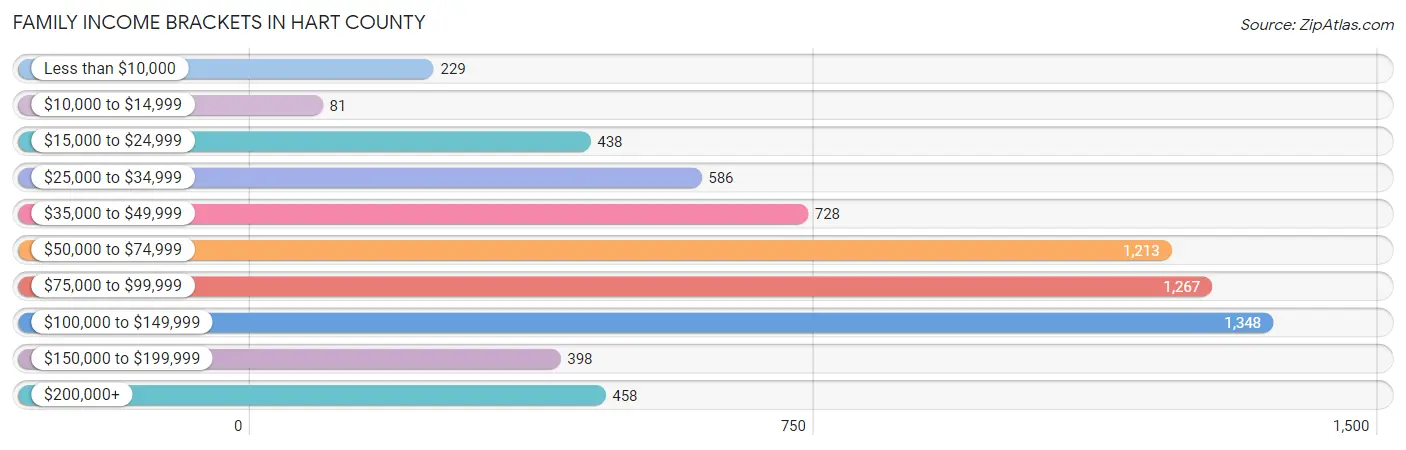
| Income Bracket | # Families | % Families |
| Less than $10,000 | 229 | 3.4% |
| $10,000 to $14,999 | 81 | 1.2% |
| $15,000 to $24,999 | 438 | 6.5% |
| $25,000 to $34,999 | 586 | 8.7% |
| $35,000 to $49,999 | 728 | 10.8% |
| $50,000 to $74,999 | 1,213 | 18.0% |
| $75,000 to $99,999 | 1,267 | 18.8% |
| $100,000 to $149,999 | 1,348 | 20.0% |
| $150,000 to $199,999 | 398 | 5.9% |
| $200,000+ | 458 | 6.8% |
Family Income by Famaliy Size in Hart County
7+ person families (273 | 4.1%) account for the highest median family income in Hart County with $115,742 per family, while 2-person families (3,477 | 51.6%) have the highest median income of $33,899 per family member.
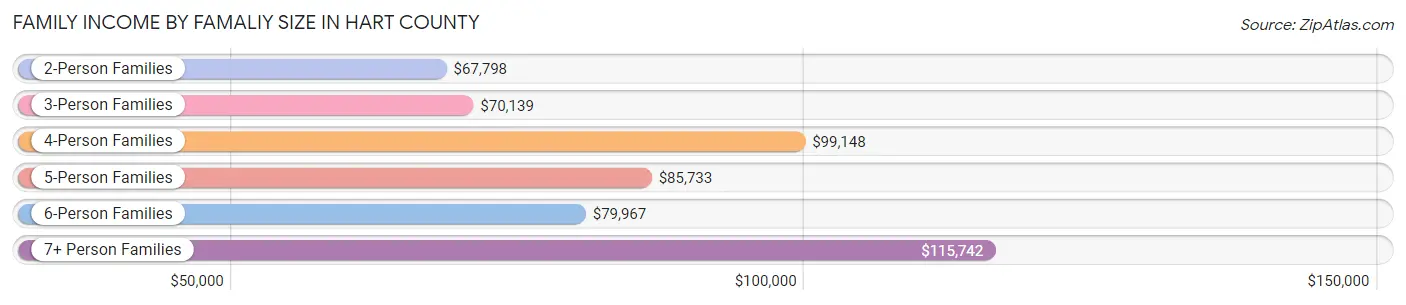
| Income Bracket | # Families | Median Income |
| 2-Person Families | 3,477 (51.6%) | $67,798 |
| 3-Person Families | 1,457 (21.6%) | $70,139 |
| 4-Person Families | 1,073 (15.9%) | $99,148 |
| 5-Person Families | 211 (3.1%) | $85,733 |
| 6-Person Families | 250 (3.7%) | $79,967 |
| 7+ Person Families | 273 (4.1%) | $115,742 |
| Total | 6,741 (100.0%) | $77,241 |
Family Income by Number of Earners in Hart County
The median family income in Hart County is $77,241, with families comprising 3+ earners (747) having the highest median family income of $115,117, while families with no earners (1,392) have the lowest median family income of $46,250, accounting for 11.1% and 20.6% of families, respectively.
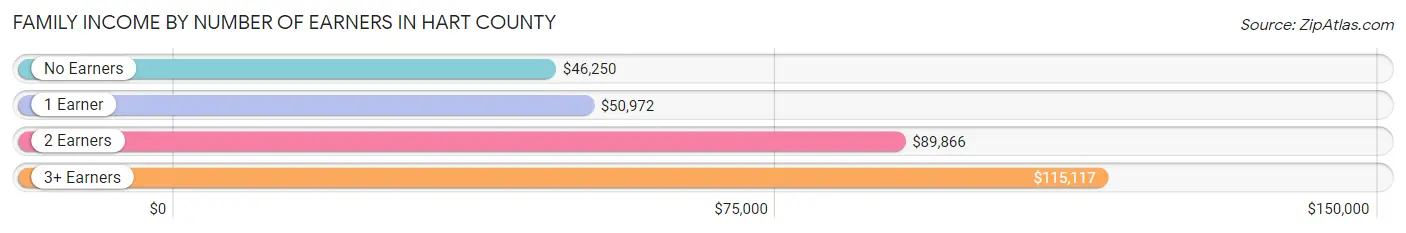
| Number of Earners | # Families | Median Income |
| No Earners | 1,392 (20.6%) | $46,250 |
| 1 Earner | 1,873 (27.8%) | $50,972 |
| 2 Earners | 2,729 (40.5%) | $89,866 |
| 3+ Earners | 747 (11.1%) | $115,117 |
| Total | 6,741 (100.0%) | $77,241 |
Household Income in Hart County
Household Income Brackets in Hart County
With 1,925 households falling in the category, the $50,000 to $74,999 income range is the most frequent in Hart County, accounting for 18.7% of all households. In contrast, only 474 households (4.6%) fall into the $150,000 to $199,999 income bracket, making it the least populous group.

| Income Bracket | # Households | % Households |
| Less than $10,000 | 597 | 5.8% |
| $10,000 to $14,999 | 515 | 5.0% |
| $15,000 to $24,999 | 1,019 | 9.9% |
| $25,000 to $34,999 | 947 | 9.2% |
| $35,000 to $49,999 | 1,297 | 12.6% |
| $50,000 to $74,999 | 1,925 | 18.7% |
| $75,000 to $99,999 | 1,451 | 14.1% |
| $100,000 to $149,999 | 1,585 | 15.4% |
| $150,000 to $199,999 | 474 | 4.6% |
| $200,000+ | 504 | 4.9% |
Household Income by Householder Age in Hart County
The median household income in Hart County is $61,765, with the highest median household income of $75,220 found in the 25 to 44 years age bracket for the primary householder. A total of 2,627 households (25.5%) fall into this category. Meanwhile, the 65+ years age bracket for the primary householder has the lowest median household income of $44,740, with 3,582 households (34.8%) in this group.
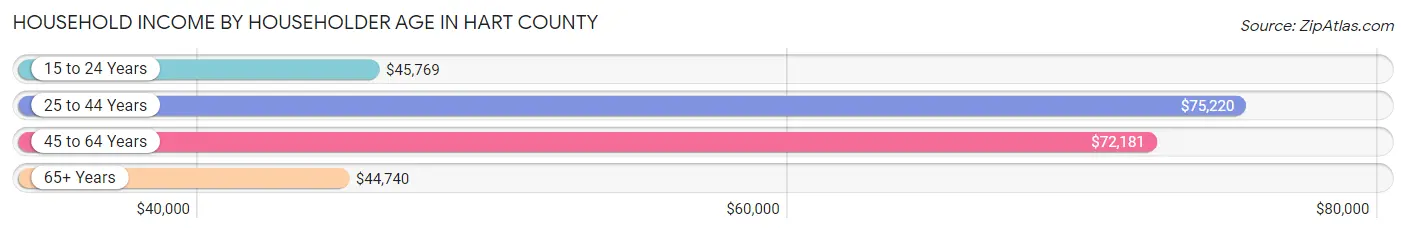
| Income Bracket | # Households | Median Income |
| 15 to 24 Years | 212 (2.1%) | $45,769 |
| 25 to 44 Years | 2,627 (25.5%) | $75,220 |
| 45 to 64 Years | 3,873 (37.6%) | $72,181 |
| 65+ Years | 3,582 (34.8%) | $44,740 |
| Total | 10,294 (100.0%) | $61,765 |
Poverty in Hart County
Income Below Poverty by Sex and Age in Hart County
With 10.6% poverty level for males and 11.1% for females among the residents of Hart County, under 5 year old males and 5 year old females are the most vulnerable to poverty, with 188 males (27.0%) and 67 females (51.1%) in their respective age groups living below the poverty level.
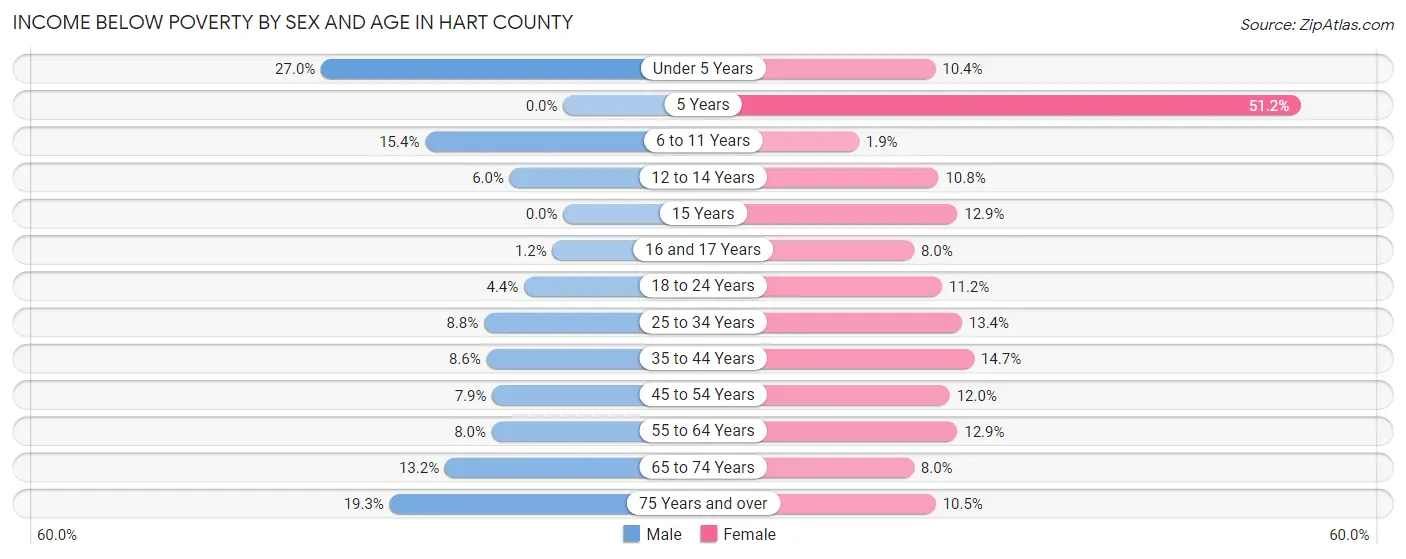
| Age Bracket | Male | Female |
| Under 5 Years | 188 (27.0%) | 59 (10.4%) |
| 5 Years | 0 (0.0%) | 67 (51.1%) |
| 6 to 11 Years | 150 (15.4%) | 21 (1.9%) |
| 12 to 14 Years | 26 (6.0%) | 39 (10.8%) |
| 15 Years | 0 (0.0%) | 18 (12.9%) |
| 16 and 17 Years | 4 (1.2%) | 18 (8.0%) |
| 18 to 24 Years | 37 (4.4%) | 86 (11.2%) |
| 25 to 34 Years | 142 (8.8%) | 168 (13.4%) |
| 35 to 44 Years | 126 (8.6%) | 188 (14.7%) |
| 45 to 54 Years | 131 (7.9%) | 210 (12.0%) |
| 55 to 64 Years | 142 (8.0%) | 241 (12.9%) |
| 65 to 74 Years | 206 (13.2%) | 138 (8.0%) |
| 75 Years and over | 193 (19.3%) | 144 (10.5%) |
| Total | 1,345 (10.6%) | 1,397 (11.1%) |
Income Above Poverty by Sex and Age in Hart County
According to the poverty statistics in Hart County, males aged 5 years and females aged 6 to 11 years are the age groups that are most secure financially, with 100.0% of males and 98.1% of females in these age groups living above the poverty line.
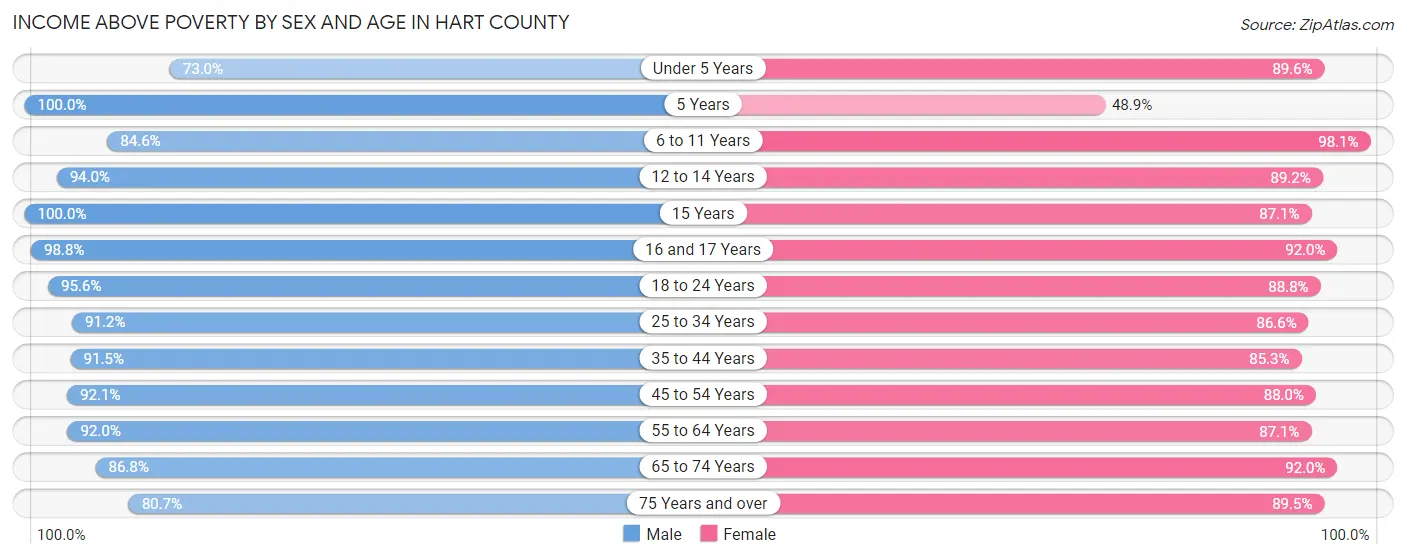
| Age Bracket | Male | Female |
| Under 5 Years | 509 (73.0%) | 507 (89.6%) |
| 5 Years | 259 (100.0%) | 64 (48.8%) |
| 6 to 11 Years | 825 (84.6%) | 1,083 (98.1%) |
| 12 to 14 Years | 410 (94.0%) | 323 (89.2%) |
| 15 Years | 98 (100.0%) | 122 (87.1%) |
| 16 and 17 Years | 328 (98.8%) | 206 (92.0%) |
| 18 to 24 Years | 809 (95.6%) | 684 (88.8%) |
| 25 to 34 Years | 1,466 (91.2%) | 1,089 (86.6%) |
| 35 to 44 Years | 1,348 (91.4%) | 1,089 (85.3%) |
| 45 to 54 Years | 1,525 (92.1%) | 1,537 (88.0%) |
| 55 to 64 Years | 1,640 (92.0%) | 1,633 (87.1%) |
| 65 to 74 Years | 1,357 (86.8%) | 1,583 (92.0%) |
| 75 Years and over | 805 (80.7%) | 1,233 (89.5%) |
| Total | 11,379 (89.4%) | 11,153 (88.9%) |
Income Below Poverty Among Married-Couple Families in Hart County
The poverty statistics for married-couple families in Hart County show that 5.0% or 262 of the total 5,256 families live below the poverty line. Families with 1 or 2 children have the highest poverty rate of 10.5%, comprising of 132 families. On the other hand, families with 5 or more children have the lowest poverty rate of 0.0%, which includes 0 families.
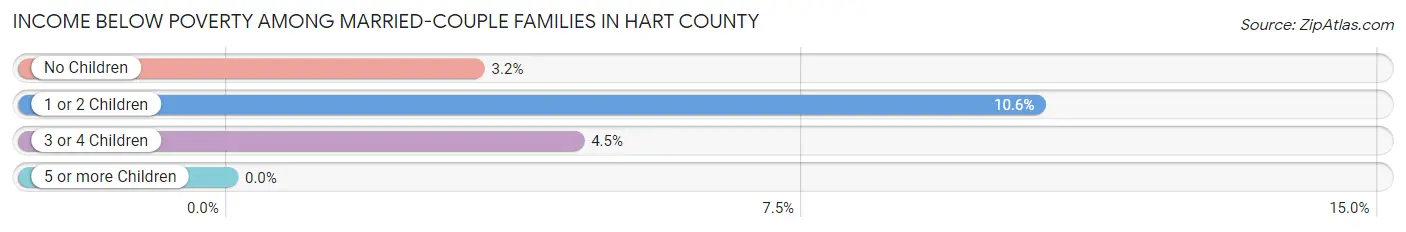
| Children | Above Poverty | Below Poverty |
| No Children | 3,302 (96.8%) | 110 (3.2%) |
| 1 or 2 Children | 1,119 (89.4%) | 132 (10.5%) |
| 3 or 4 Children | 422 (95.5%) | 20 (4.5%) |
| 5 or more Children | 151 (100.0%) | 0 (0.0%) |
| Total | 4,994 (95.0%) | 262 (5.0%) |
Income Below Poverty Among Single-Parent Households in Hart County
According to the poverty data in Hart County, 21.7% or 115 single-father households and 19.6% or 187 single-mother households are living below the poverty line. Among single-father households, those with 1 or 2 children have the highest poverty rate, with 115 households (53.5%) experiencing poverty. Likewise, among single-mother households, those with 1 or 2 children have the highest poverty rate, with 147 households (36.7%) falling below the poverty line.
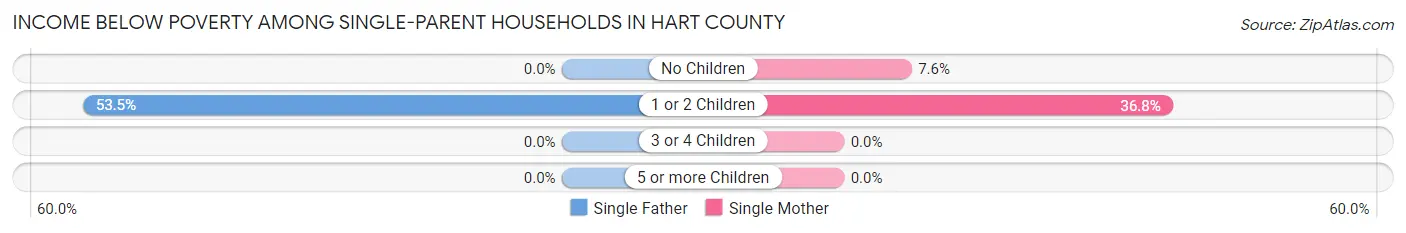
| Children | Single Father | Single Mother |
| No Children | 0 (0.0%) | 40 (7.5%) |
| 1 or 2 Children | 115 (53.5%) | 147 (36.7%) |
| 3 or 4 Children | 0 (0.0%) | 0 (0.0%) |
| 5 or more Children | 0 (0.0%) | 0 (0.0%) |
| Total | 115 (21.7%) | 187 (19.6%) |
Income Below Poverty Among Married-Couple vs Single-Parent Households in Hart County
The poverty data for Hart County shows that 262 of the married-couple family households (5.0%) and 302 of the single-parent households (20.3%) are living below the poverty level. Within the married-couple family households, those with 1 or 2 children have the highest poverty rate, with 132 households (10.5%) falling below the poverty line. Among the single-parent households, those with 1 or 2 children have the highest poverty rate, with 262 household (42.6%) living below poverty.

| Children | Married-Couple Families | Single-Parent Households |
| No Children | 110 (3.2%) | 40 (4.8%) |
| 1 or 2 Children | 132 (10.5%) | 262 (42.6%) |
| 3 or 4 Children | 20 (4.5%) | 0 (0.0%) |
| 5 or more Children | 0 (0.0%) | 0 (0.0%) |
| Total | 262 (5.0%) | 302 (20.3%) |
Employment Characteristics in Hart County
Employment by Class of Employer in Hart County
Among the 10,998 employed individuals in Hart County, private company employees (7,528 | 68.4%), self-employed (not incorporated) (922 | 8.4%), and local government employees (889 | 8.1%) make up the most common classes of employment.
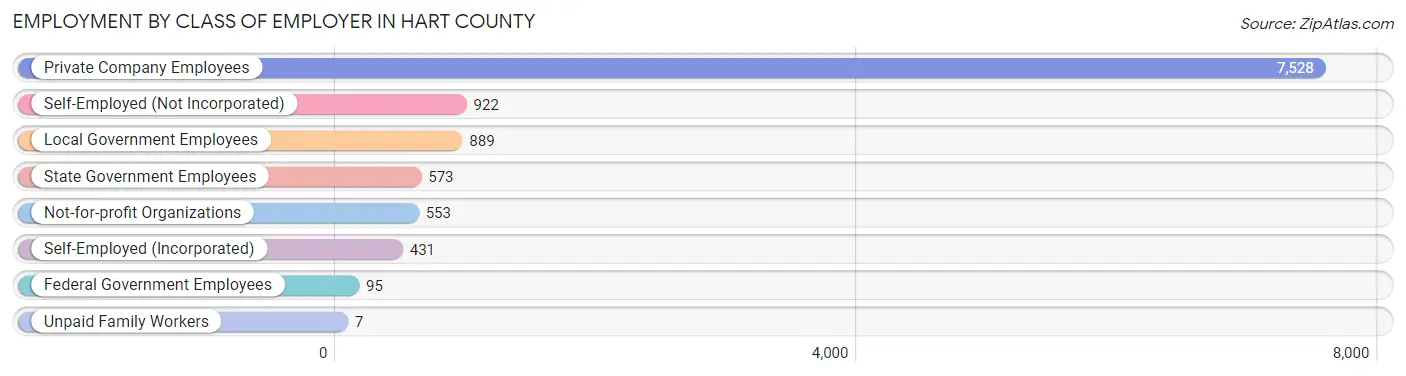
| Employer Class | # Employees | % Employees |
| Private Company Employees | 7,528 | 68.4% |
| Self-Employed (Incorporated) | 431 | 3.9% |
| Self-Employed (Not Incorporated) | 922 | 8.4% |
| Not-for-profit Organizations | 553 | 5.0% |
| Local Government Employees | 889 | 8.1% |
| State Government Employees | 573 | 5.2% |
| Federal Government Employees | 95 | 0.9% |
| Unpaid Family Workers | 7 | 0.1% |
| Total | 10,998 | 100.0% |
Employment Status by Age in Hart County
According to the labor force statistics for Hart County, out of the total population over 16 years of age (21,271), 54.7% or 11,635 individuals are in the labor force, with 4.8% or 558 of them unemployed. The age group with the highest labor force participation rate is 25 to 29 years, with 88.6% or 1,403 individuals in the labor force. Within the labor force, the 45 to 54 years age range has the highest percentage of unemployed individuals, with 11.2% or 312 of them being unemployed.
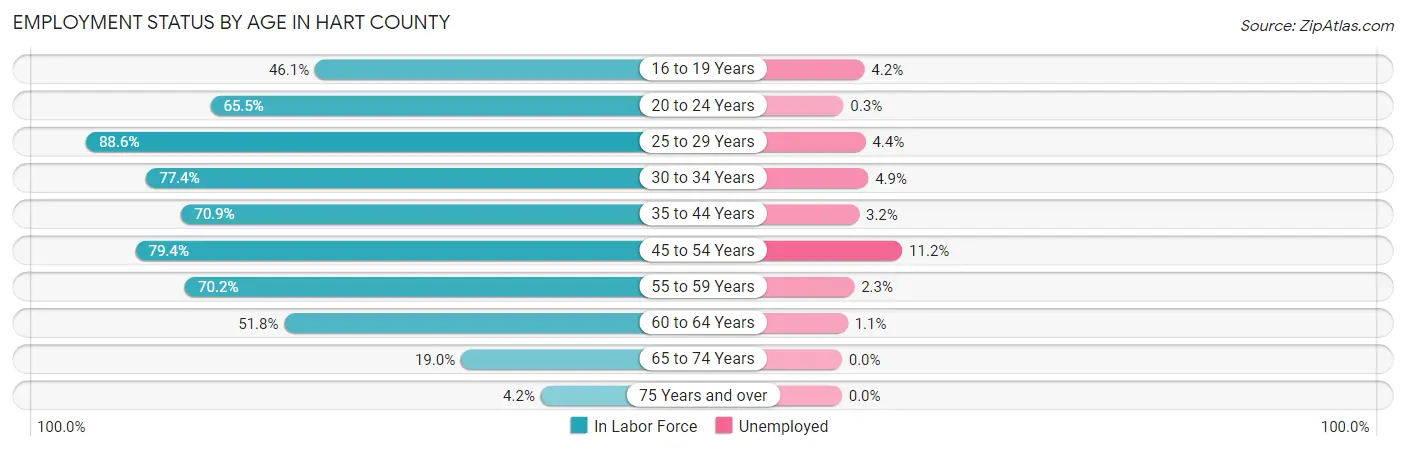
| Age Bracket | In Labor Force | Unemployed |
| 16 to 19 Years | 479 (46.1%) | 20 (4.2%) |
| 20 to 24 Years | 757 (65.5%) | 2 (0.3%) |
| 25 to 29 Years | 1,403 (88.6%) | 62 (4.4%) |
| 30 to 34 Years | 1,141 (77.4%) | 56 (4.9%) |
| 35 to 44 Years | 2,090 (70.9%) | 67 (3.2%) |
| 45 to 54 Years | 2,789 (79.4%) | 312 (11.2%) |
| 55 to 59 Years | 1,236 (70.2%) | 28 (2.3%) |
| 60 to 64 Years | 1,008 (51.8%) | 11 (1.1%) |
| 65 to 74 Years | 634 (19.0%) | 0 (0.0%) |
| 75 Years and over | 106 (4.2%) | 0 (0.0%) |
| Total | 11,635 (54.7%) | 558 (4.8%) |
Employment Status by Educational Attainment in Hart County
According to labor force statistics for Hart County, 73.1% of individuals (9,666) out of the total population between 25 and 64 years of age (13,223) are in the labor force, with 5.5% or 532 of them being unemployed. The group with the highest labor force participation rate are those with the educational attainment of college / associate degree, with 81.6% or 3,460 individuals in the labor force. Within the labor force, individuals with high school diploma education have the highest percentage of unemployment, with 10.0% or 314 of them being unemployed.
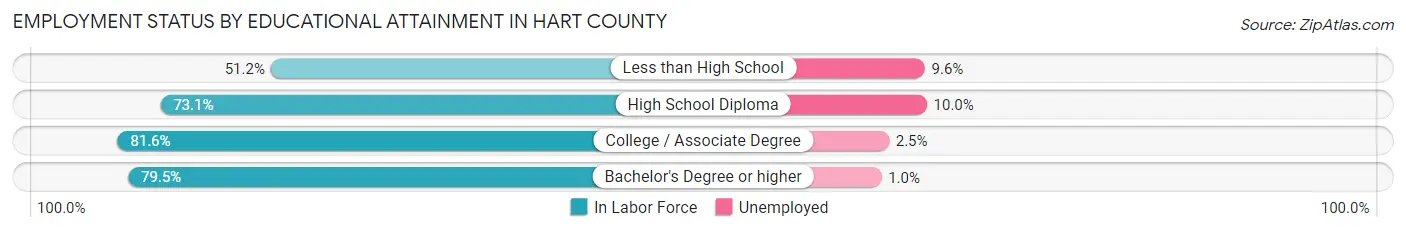
| Educational Attainment | In Labor Force | Unemployed |
| Less than High School | 1,196 (51.2%) | 224 (9.6%) |
| High School Diploma | 3,140 (73.1%) | 430 (10.0%) |
| College / Associate Degree | 3,460 (81.6%) | 106 (2.5%) |
| Bachelor's Degree or higher | 1,871 (79.5%) | 24 (1.0%) |
| Total | 9,666 (73.1%) | 727 (5.5%) |
Employment Occupations by Sex in Hart County
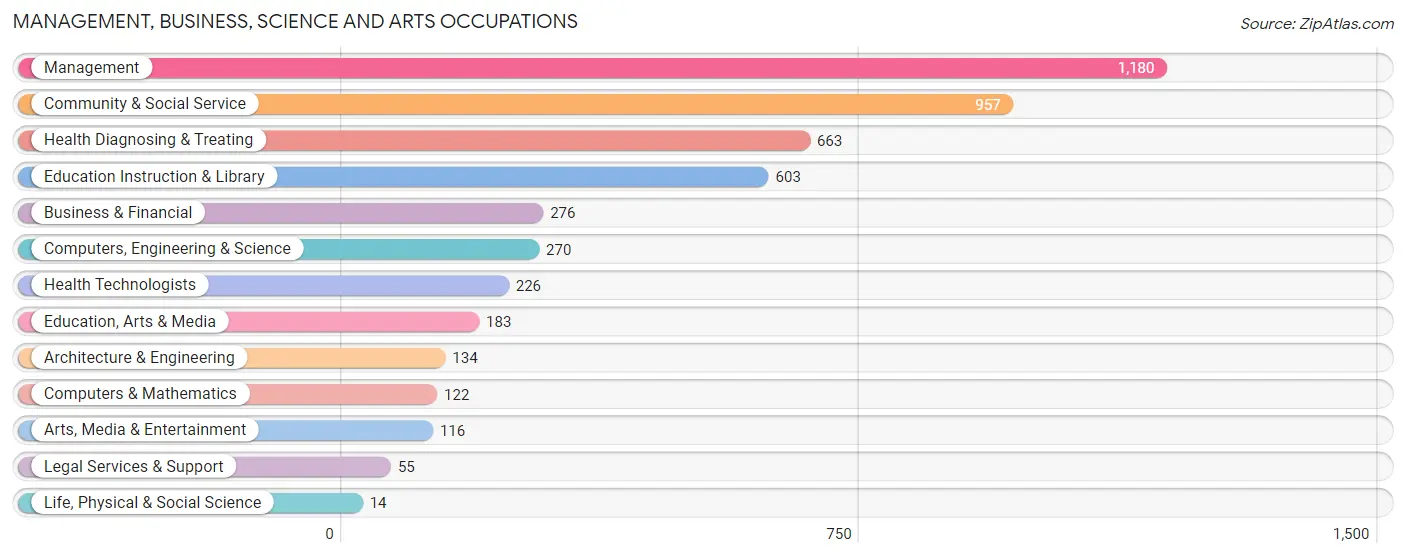
Management, Business, Science and Arts Occupations
The most common Management, Business, Science and Arts occupations in Hart County are Management (1,180 | 10.7%), Community & Social Service (957 | 8.7%), Health Diagnosing & Treating (663 | 6.0%), Education Instruction & Library (603 | 5.5%), and Business & Financial (276 | 2.5%).
Management, Business, Science and Arts Occupations by Sex
Within the Management, Business, Science and Arts occupations in Hart County, the most male-oriented occupations are Architecture & Engineering (91.0%), Computers & Mathematics (90.2%), and Computers, Engineering & Science (85.9%), while the most female-oriented occupations are Life, Physical & Social Science (100.0%), Legal Services & Support (85.5%), and Health Technologists (77.9%).

| Occupation | Male | Female |
| Management | 714 (60.5%) | 466 (39.5%) |
| Business & Financial | 79 (28.6%) | 197 (71.4%) |
| Computers, Engineering & Science | 232 (85.9%) | 38 (14.1%) |
| Computers & Mathematics | 110 (90.2%) | 12 (9.8%) |
| Architecture & Engineering | 122 (91.0%) | 12 (9.0%) |
| Life, Physical & Social Science | 0 (0.0%) | 14 (100.0%) |
| Community & Social Service | 355 (37.1%) | 602 (62.9%) |
| Education, Arts & Media | 85 (46.5%) | 98 (53.5%) |
| Legal Services & Support | 8 (14.5%) | 47 (85.5%) |
| Education Instruction & Library | 187 (31.0%) | 416 (69.0%) |
| Arts, Media & Entertainment | 75 (64.7%) | 41 (35.3%) |
| Health Diagnosing & Treating | 214 (32.3%) | 449 (67.7%) |
| Health Technologists | 50 (22.1%) | 176 (77.9%) |
| Total (Category) | 1,594 (47.6%) | 1,752 (52.4%) |
| Total (Overall) | 6,052 (54.8%) | 4,994 (45.2%) |
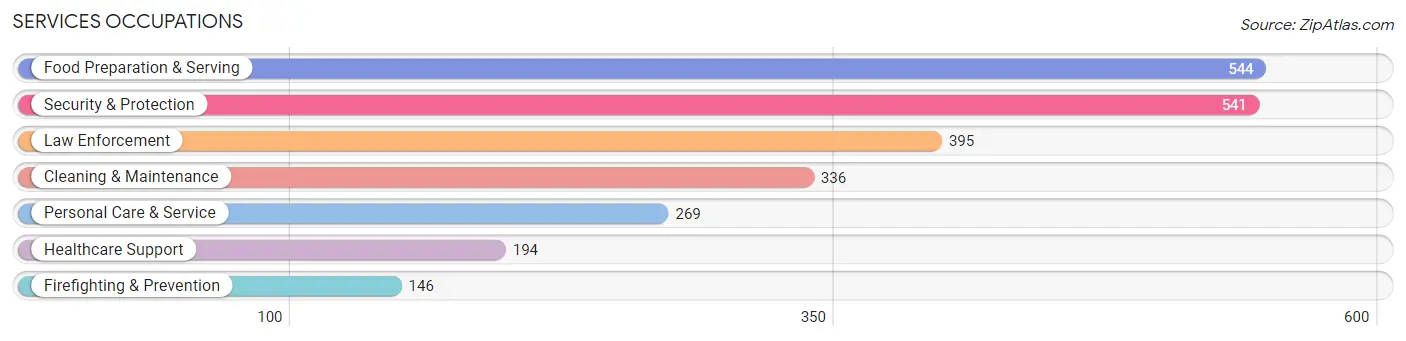
Services Occupations
The most common Services occupations in Hart County are Food Preparation & Serving (544 | 4.9%), Security & Protection (541 | 4.9%), Law Enforcement (395 | 3.6%), Cleaning & Maintenance (336 | 3.0%), and Personal Care & Service (269 | 2.4%).
Services Occupations by Sex
Within the Services occupations in Hart County, the most male-oriented occupations are Law Enforcement (92.7%), Security & Protection (81.5%), and Cleaning & Maintenance (74.1%), while the most female-oriented occupations are Healthcare Support (97.4%), Personal Care & Service (79.2%), and Food Preparation & Serving (66.7%).
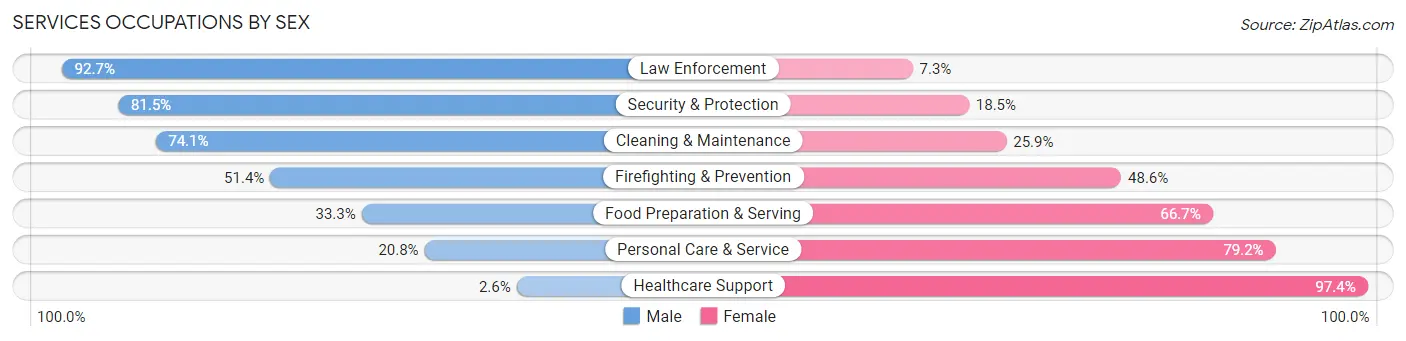
| Occupation | Male | Female |
| Healthcare Support | 5 (2.6%) | 189 (97.4%) |
| Security & Protection | 441 (81.5%) | 100 (18.5%) |
| Firefighting & Prevention | 75 (51.4%) | 71 (48.6%) |
| Law Enforcement | 366 (92.7%) | 29 (7.3%) |
| Food Preparation & Serving | 181 (33.3%) | 363 (66.7%) |
| Cleaning & Maintenance | 249 (74.1%) | 87 (25.9%) |
| Personal Care & Service | 56 (20.8%) | 213 (79.2%) |
| Total (Category) | 932 (49.5%) | 952 (50.5%) |
| Total (Overall) | 6,052 (54.8%) | 4,994 (45.2%) |
Sales and Office Occupations
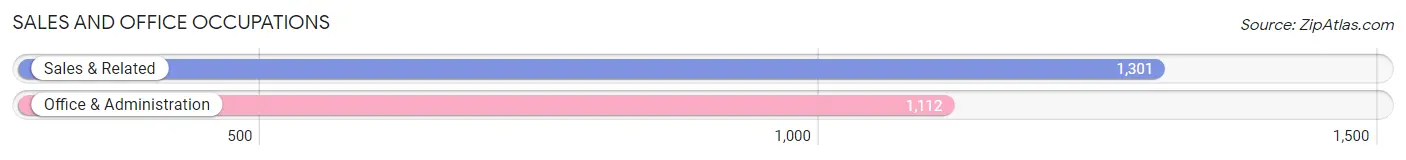
The most common Sales and Office occupations in Hart County are Sales & Related (1,301 | 11.8%), and Office & Administration (1,112 | 10.1%).
Sales and Office Occupations by Sex

| Occupation | Male | Female |
| Sales & Related | 655 (50.3%) | 646 (49.6%) |
| Office & Administration | 114 (10.2%) | 998 (89.7%) |
| Total (Category) | 769 (31.9%) | 1,644 (68.1%) |
| Total (Overall) | 6,052 (54.8%) | 4,994 (45.2%) |
Natural Resources, Construction and Maintenance Occupations
The most common Natural Resources, Construction and Maintenance occupations in Hart County are Construction & Extraction (717 | 6.5%), Installation, Maintenance & Repair (451 | 4.1%), and Farming, Fishing & Forestry (157 | 1.4%).

Natural Resources, Construction and Maintenance Occupations by Sex

| Occupation | Male | Female |
| Farming, Fishing & Forestry | 156 (99.4%) | 1 (0.6%) |
| Construction & Extraction | 692 (96.5%) | 25 (3.5%) |
| Installation, Maintenance & Repair | 407 (90.2%) | 44 (9.8%) |
| Total (Category) | 1,255 (94.7%) | 70 (5.3%) |
| Total (Overall) | 6,052 (54.8%) | 4,994 (45.2%) |
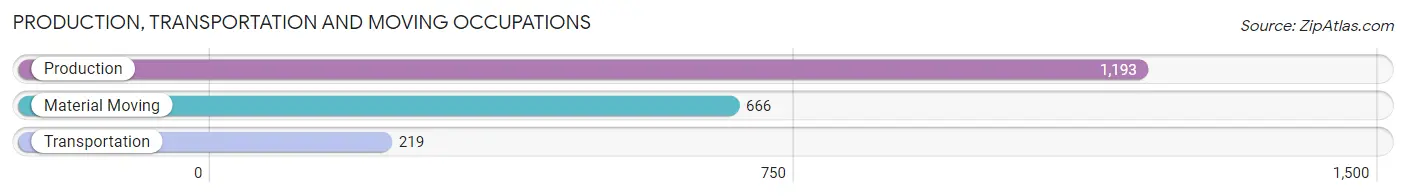
Production, Transportation and Moving Occupations
The most common Production, Transportation and Moving occupations in Hart County are Production (1,193 | 10.8%), Material Moving (666 | 6.0%), and Transportation (219 | 2.0%).
Production, Transportation and Moving Occupations by Sex
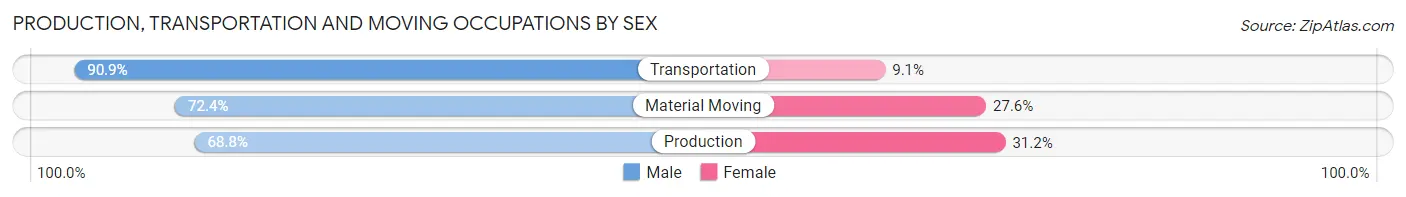
| Occupation | Male | Female |
| Production | 821 (68.8%) | 372 (31.2%) |
| Transportation | 199 (90.9%) | 20 (9.1%) |
| Material Moving | 482 (72.4%) | 184 (27.6%) |
| Total (Category) | 1,502 (72.3%) | 576 (27.7%) |
| Total (Overall) | 6,052 (54.8%) | 4,994 (45.2%) |
Employment Industries by Sex in Hart County
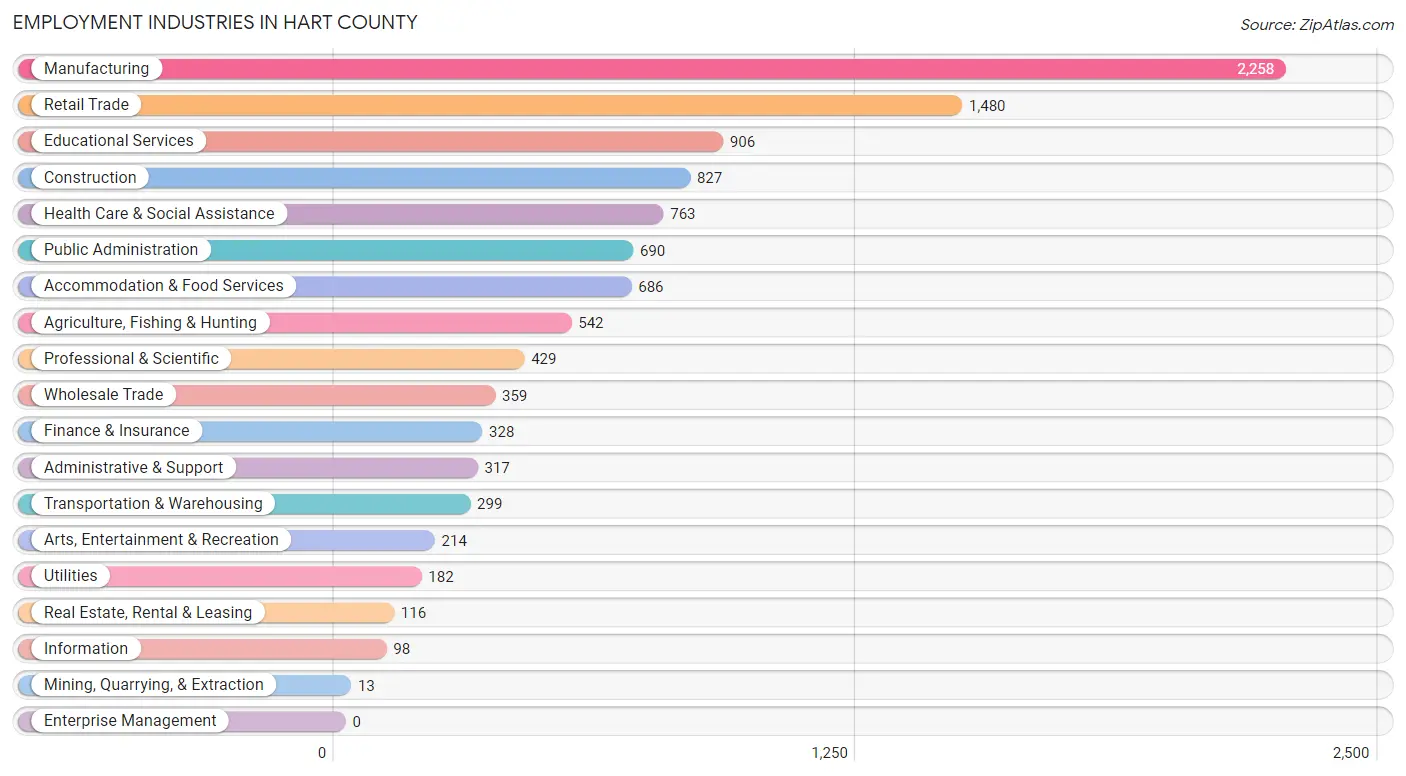
Employment Industries in Hart County
The major employment industries in Hart County include Manufacturing (2,258 | 20.4%), Retail Trade (1,480 | 13.4%), Educational Services (906 | 8.2%), Construction (827 | 7.5%), and Health Care & Social Assistance (763 | 6.9%).
Employment Industries by Sex in Hart County
The Hart County industries that see more men than women are Mining, Quarrying, & Extraction (100.0%), Construction (94.6%), and Transportation & Warehousing (83.3%), whereas the industries that tend to have a higher number of women are Health Care & Social Assistance (90.2%), Professional & Scientific (77.6%), and Finance & Insurance (72.6%).
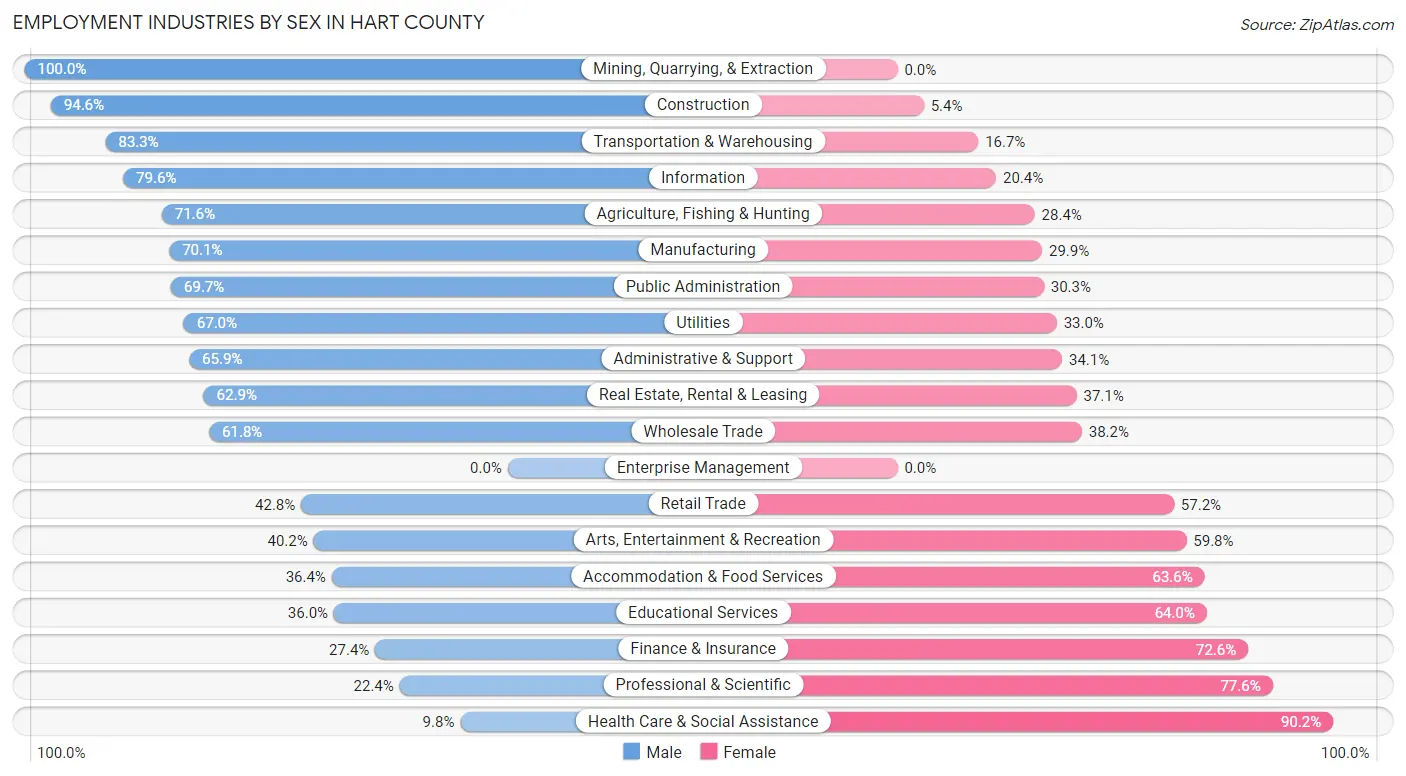
| Industry | Male | Female |
| Agriculture, Fishing & Hunting | 388 (71.6%) | 154 (28.4%) |
| Mining, Quarrying, & Extraction | 13 (100.0%) | 0 (0.0%) |
| Construction | 782 (94.6%) | 45 (5.4%) |
| Manufacturing | 1,582 (70.1%) | 676 (29.9%) |
| Wholesale Trade | 222 (61.8%) | 137 (38.2%) |
| Retail Trade | 633 (42.8%) | 847 (57.2%) |
| Transportation & Warehousing | 249 (83.3%) | 50 (16.7%) |
| Utilities | 122 (67.0%) | 60 (33.0%) |
| Information | 78 (79.6%) | 20 (20.4%) |
| Finance & Insurance | 90 (27.4%) | 238 (72.6%) |
| Real Estate, Rental & Leasing | 73 (62.9%) | 43 (37.1%) |
| Professional & Scientific | 96 (22.4%) | 333 (77.6%) |
| Enterprise Management | 0 (0.0%) | 0 (0.0%) |
| Administrative & Support | 209 (65.9%) | 108 (34.1%) |
| Educational Services | 326 (36.0%) | 580 (64.0%) |
| Health Care & Social Assistance | 75 (9.8%) | 688 (90.2%) |
| Arts, Entertainment & Recreation | 86 (40.2%) | 128 (59.8%) |
| Accommodation & Food Services | 250 (36.4%) | 436 (63.6%) |
| Public Administration | 481 (69.7%) | 209 (30.3%) |
| Total | 6,052 (54.8%) | 4,994 (45.2%) |
Education in Hart County
School Enrollment in Hart County
The most common levels of schooling among the 5,348 students in Hart County are elementary school (1,429 | 26.7%), high school (1,209 | 22.6%), and middle school (1,107 | 20.7%).
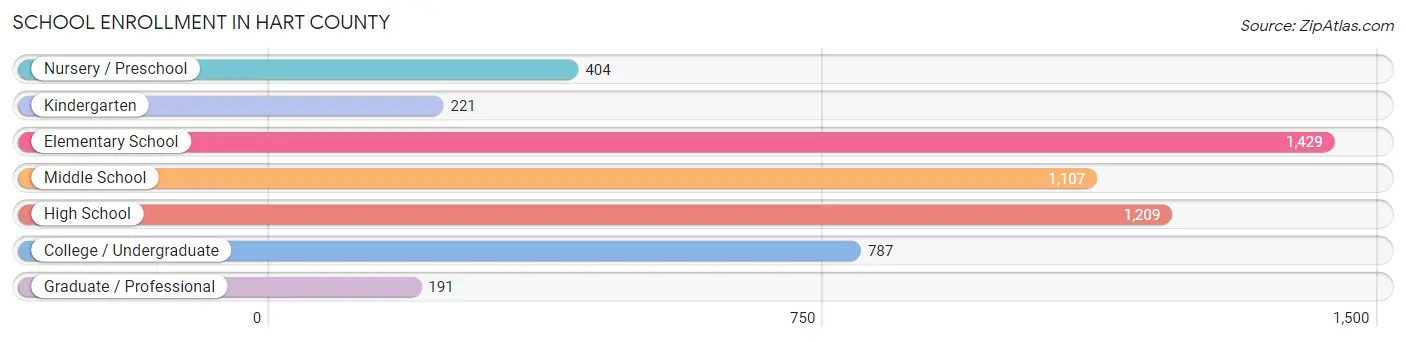
| School Level | # Students | % Students |
| Nursery / Preschool | 404 | 7.5% |
| Kindergarten | 221 | 4.1% |
| Elementary School | 1,429 | 26.7% |
| Middle School | 1,107 | 20.7% |
| High School | 1,209 | 22.6% |
| College / Undergraduate | 787 | 14.7% |
| Graduate / Professional | 191 | 3.6% |
| Total | 5,348 | 100.0% |
School Enrollment by Age by Funding Source in Hart County
Out of a total of 5,348 students who are enrolled in schools in Hart County, 749 (14.0%) attend a private institution, while the remaining 4,599 (86.0%) are enrolled in public schools. The age group of 3 to 4 year olds has the highest likelihood of being enrolled in private schools, with 132 (56.2% in the age bracket) enrolled. Conversely, the age group of 20 to 24 year olds has the lowest likelihood of being enrolled in a private school, with 318 (94.4% in the age bracket) attending a public institution.
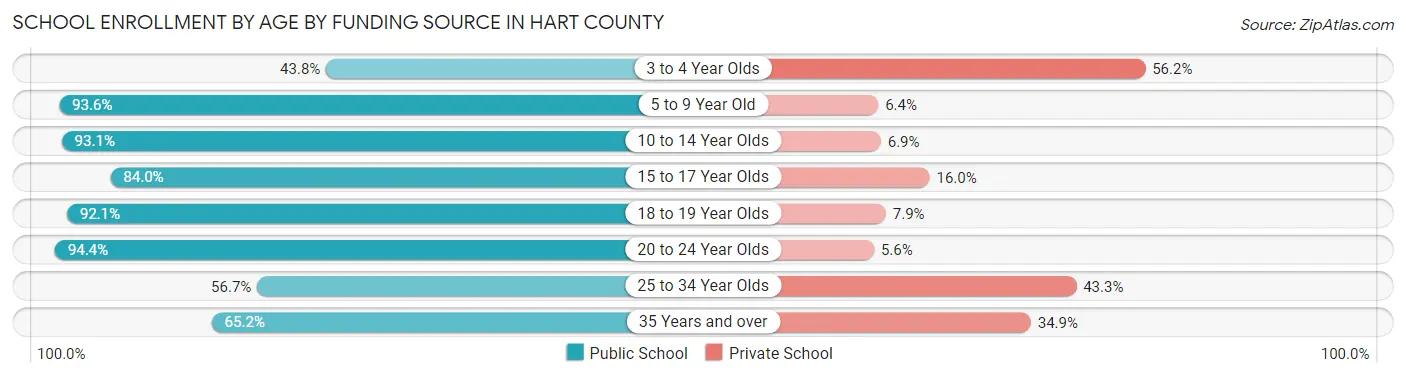
| Age Bracket | Public School | Private School |
| 3 to 4 Year Olds | 103 (43.8%) | 132 (56.2%) |
| 5 to 9 Year Old | 1,602 (93.6%) | 110 (6.4%) |
| 10 to 14 Year Olds | 1,280 (93.1%) | 95 (6.9%) |
| 15 to 17 Year Olds | 667 (84.0%) | 127 (16.0%) |
| 18 to 19 Year Olds | 258 (92.1%) | 22 (7.9%) |
| 20 to 24 Year Olds | 318 (94.4%) | 19 (5.6%) |
| 25 to 34 Year Olds | 212 (56.7%) | 162 (43.3%) |
| 35 Years and over | 157 (65.1%) | 84 (34.8%) |
| Total | 4,599 (86.0%) | 749 (14.0%) |
Educational Attainment by Field of Study in Hart County
Business (840 | 22.3%), education (687 | 18.2%), science & technology (364 | 9.7%), computers & mathematics (275 | 7.3%), and arts & humanities (249 | 6.6%) are the most common fields of study among 3,767 individuals in Hart County who have obtained a bachelor's degree or higher.
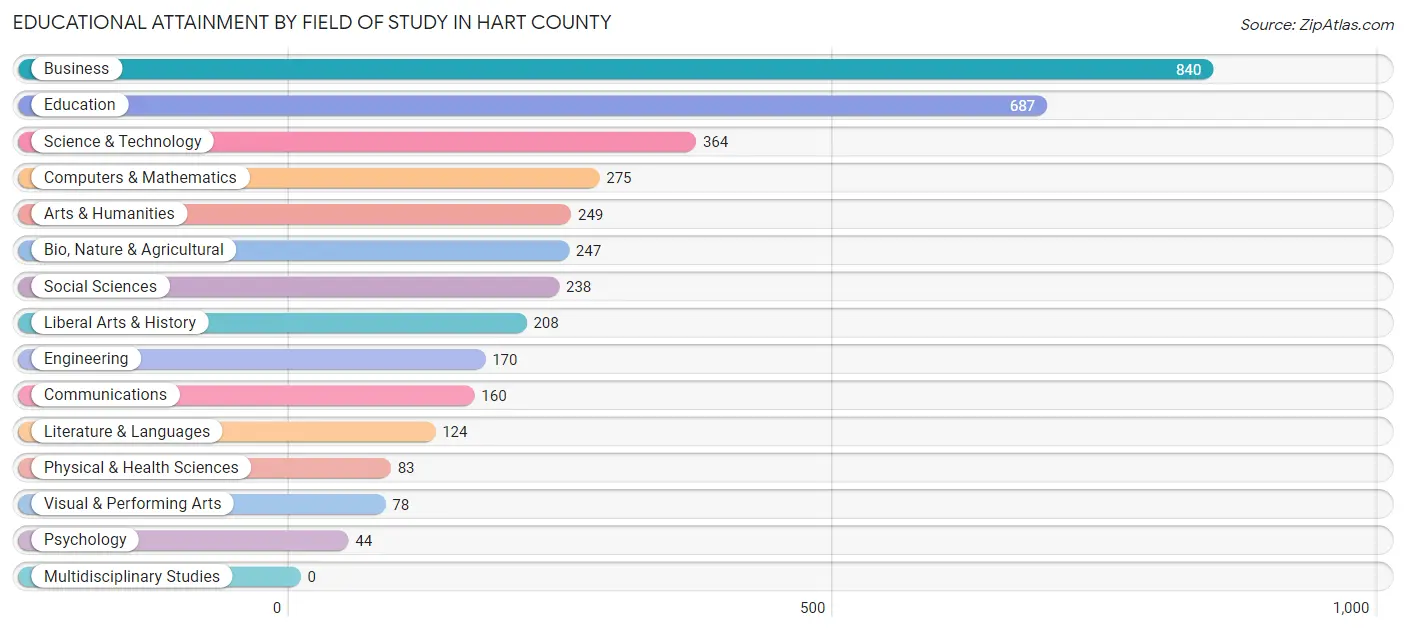
| Field of Study | # Graduates | % Graduates |
| Computers & Mathematics | 275 | 7.3% |
| Bio, Nature & Agricultural | 247 | 6.6% |
| Physical & Health Sciences | 83 | 2.2% |
| Psychology | 44 | 1.2% |
| Social Sciences | 238 | 6.3% |
| Engineering | 170 | 4.5% |
| Multidisciplinary Studies | 0 | 0.0% |
| Science & Technology | 364 | 9.7% |
| Business | 840 | 22.3% |
| Education | 687 | 18.2% |
| Literature & Languages | 124 | 3.3% |
| Liberal Arts & History | 208 | 5.5% |
| Visual & Performing Arts | 78 | 2.1% |
| Communications | 160 | 4.3% |
| Arts & Humanities | 249 | 6.6% |
| Total | 3,767 | 100.0% |
Transportation & Commute in Hart County
Vehicle Availability by Sex in Hart County
The most prevalent vehicle ownership categories in Hart County are males with 2 vehicles (2,231, accounting for 37.0%) and females with 2 vehicles (1,725, making up 45.0%).

| Vehicles Available | Male | Female |
| No Vehicle | 89 (1.5%) | 85 (1.7%) |
| 1 Vehicle | 1,133 (18.8%) | 883 (17.8%) |
| 2 Vehicles | 2,231 (37.0%) | 1,725 (34.8%) |
| 3 Vehicles | 1,545 (25.6%) | 1,100 (22.2%) |
| 4 Vehicles | 683 (11.3%) | 712 (14.3%) |
| 5 or more Vehicles | 356 (5.9%) | 455 (9.2%) |
| Total | 6,037 (100.0%) | 4,960 (100.0%) |
Commute Time in Hart County
The most frequently occuring commute durations in Hart County are 10 to 14 minutes (1,958 commuters, 19.1%), 15 to 19 minutes (1,730 commuters, 16.9%), and 5 to 9 minutes (1,421 commuters, 13.9%).
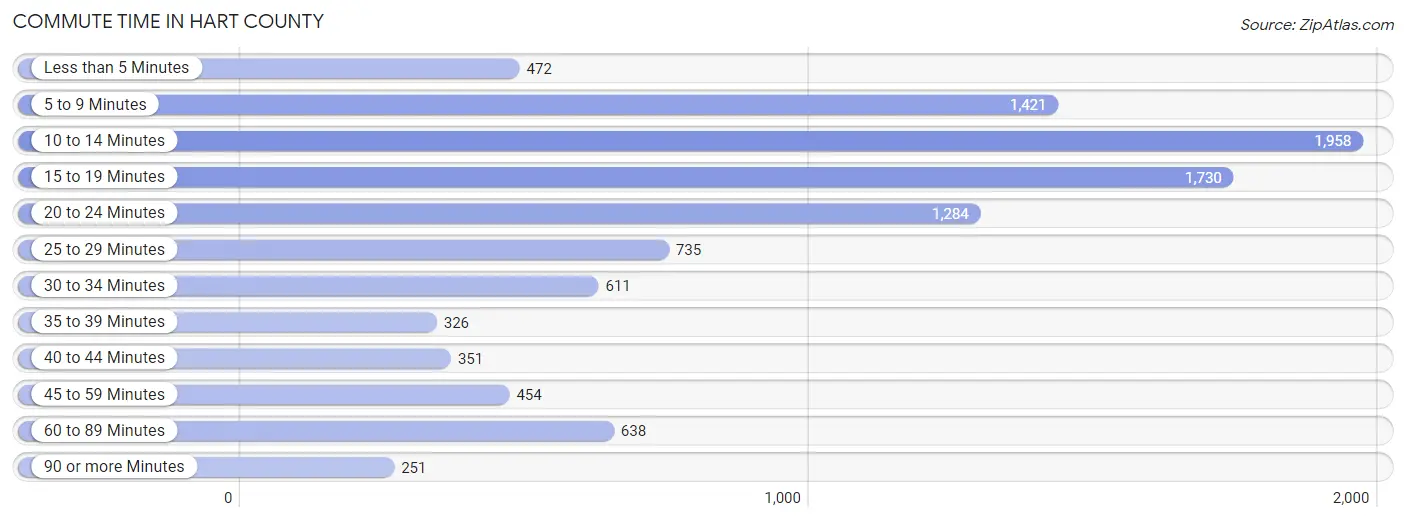
| Commute Time | # Commuters | % Commuters |
| Less than 5 Minutes | 472 | 4.6% |
| 5 to 9 Minutes | 1,421 | 13.9% |
| 10 to 14 Minutes | 1,958 | 19.1% |
| 15 to 19 Minutes | 1,730 | 16.9% |
| 20 to 24 Minutes | 1,284 | 12.6% |
| 25 to 29 Minutes | 735 | 7.2% |
| 30 to 34 Minutes | 611 | 6.0% |
| 35 to 39 Minutes | 326 | 3.2% |
| 40 to 44 Minutes | 351 | 3.4% |
| 45 to 59 Minutes | 454 | 4.4% |
| 60 to 89 Minutes | 638 | 6.2% |
| 90 or more Minutes | 251 | 2.5% |
Commute Time by Sex in Hart County
The most common commute times in Hart County are 15 to 19 minutes (1,102 commuters, 19.7%) for males and 10 to 14 minutes (1,158 commuters, 24.9%) for females.
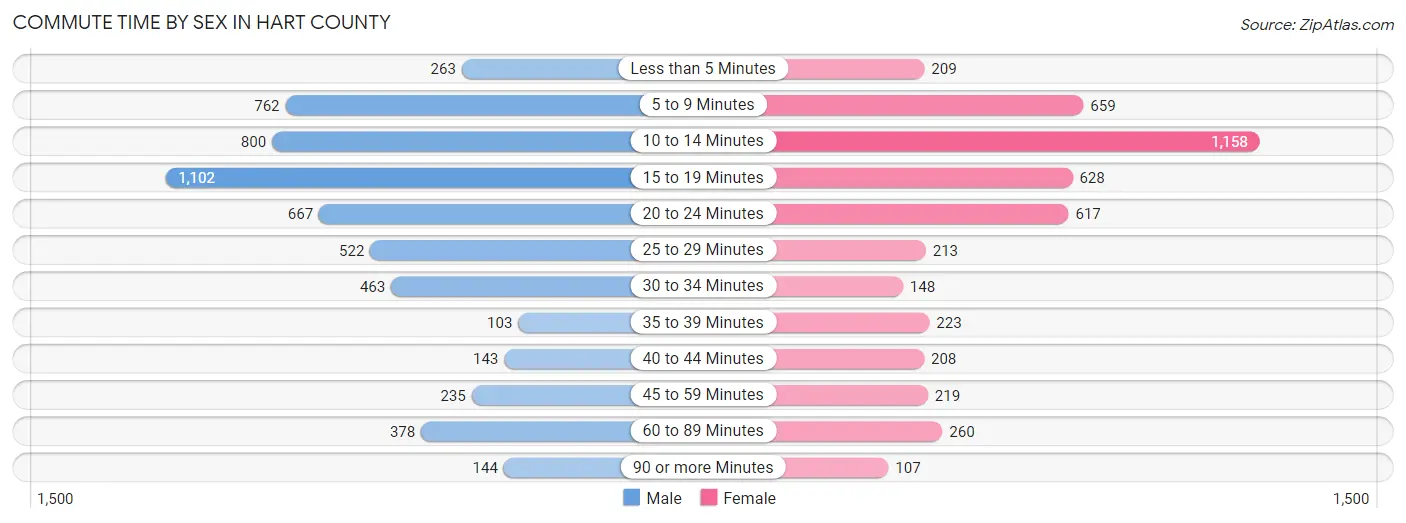
| Commute Time | Male | Female |
| Less than 5 Minutes | 263 (4.7%) | 209 (4.5%) |
| 5 to 9 Minutes | 762 (13.7%) | 659 (14.2%) |
| 10 to 14 Minutes | 800 (14.3%) | 1,158 (24.9%) |
| 15 to 19 Minutes | 1,102 (19.7%) | 628 (13.5%) |
| 20 to 24 Minutes | 667 (11.9%) | 617 (13.3%) |
| 25 to 29 Minutes | 522 (9.3%) | 213 (4.6%) |
| 30 to 34 Minutes | 463 (8.3%) | 148 (3.2%) |
| 35 to 39 Minutes | 103 (1.8%) | 223 (4.8%) |
| 40 to 44 Minutes | 143 (2.6%) | 208 (4.5%) |
| 45 to 59 Minutes | 235 (4.2%) | 219 (4.7%) |
| 60 to 89 Minutes | 378 (6.8%) | 260 (5.6%) |
| 90 or more Minutes | 144 (2.6%) | 107 (2.3%) |
Time of Departure to Work by Sex in Hart County
The most frequent times of departure to work in Hart County are 7:00 AM to 7:29 AM (859, 15.4%) for males and 7:30 AM to 7:59 AM (912, 19.6%) for females.

| Time of Departure | Male | Female |
| 12:00 AM to 4:59 AM | 247 (4.4%) | 199 (4.3%) |
| 5:00 AM to 5:29 AM | 265 (4.8%) | 212 (4.6%) |
| 5:30 AM to 5:59 AM | 425 (7.6%) | 70 (1.5%) |
| 6:00 AM to 6:29 AM | 261 (4.7%) | 461 (9.9%) |
| 6:30 AM to 6:59 AM | 724 (13.0%) | 362 (7.8%) |
| 7:00 AM to 7:29 AM | 859 (15.4%) | 844 (18.1%) |
| 7:30 AM to 7:59 AM | 698 (12.5%) | 912 (19.6%) |
| 8:00 AM to 8:29 AM | 374 (6.7%) | 427 (9.2%) |
| 8:30 AM to 8:59 AM | 345 (6.2%) | 280 (6.0%) |
| 9:00 AM to 9:59 AM | 587 (10.5%) | 316 (6.8%) |
| 10:00 AM to 10:59 AM | 21 (0.4%) | 125 (2.7%) |
| 11:00 AM to 11:59 AM | 0 (0.0%) | 16 (0.3%) |
| 12:00 PM to 3:59 PM | 85 (1.5%) | 255 (5.5%) |
| 4:00 PM to 11:59 PM | 691 (12.4%) | 170 (3.7%) |
| Total | 5,582 (100.0%) | 4,649 (100.0%) |
Housing Occupancy in Hart County
Occupancy by Ownership in Hart County
Of the total 10,294 dwellings in Hart County, owner-occupied units account for 7,748 (75.3%), while renter-occupied units make up 2,546 (24.7%).
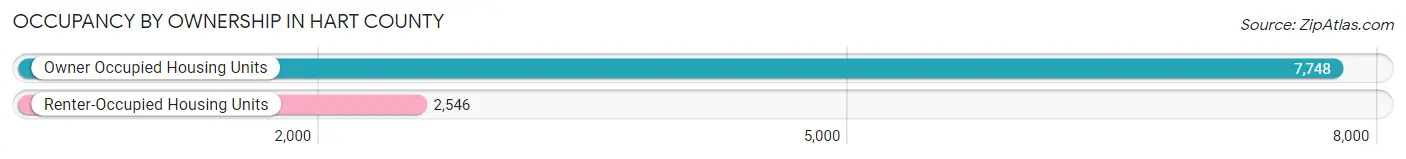
| Occupancy | # Housing Units | % Housing Units |
| Owner Occupied Housing Units | 7,748 | 75.3% |
| Renter-Occupied Housing Units | 2,546 | 24.7% |
| Total Occupied Housing Units | 10,294 | 100.0% |
Occupancy by Household Size in Hart County
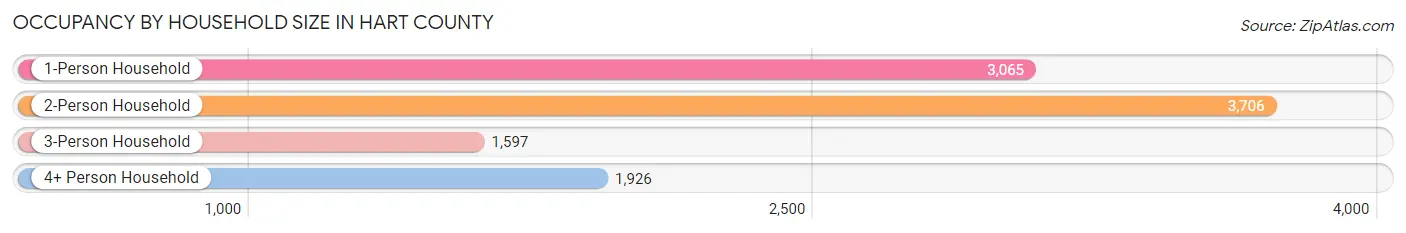
| Household Size | # Housing Units | % Housing Units |
| 1-Person Household | 3,065 | 29.8% |
| 2-Person Household | 3,706 | 36.0% |
| 3-Person Household | 1,597 | 15.5% |
| 4+ Person Household | 1,926 | 18.7% |
| Total Housing Units | 10,294 | 100.0% |
Occupancy by Ownership by Household Size in Hart County

| Household Size | Owner-occupied | Renter-occupied |
| 1-Person Household | 2,067 (67.4%) | 998 (32.6%) |
| 2-Person Household | 3,002 (81.0%) | 704 (19.0%) |
| 3-Person Household | 1,164 (72.9%) | 433 (27.1%) |
| 4+ Person Household | 1,515 (78.7%) | 411 (21.3%) |
| Total Housing Units | 7,748 (75.3%) | 2,546 (24.7%) |
Occupancy by Educational Attainment in Hart County

| Household Size | Owner-occupied | Renter-occupied |
| Less than High School | 1,001 (65.1%) | 537 (34.9%) |
| High School Diploma | 2,758 (79.4%) | 716 (20.6%) |
| College/Associate Degree | 2,248 (68.6%) | 1,028 (31.4%) |
| Bachelor's Degree or higher | 1,741 (86.8%) | 265 (13.2%) |
Occupancy by Age of Householder in Hart County
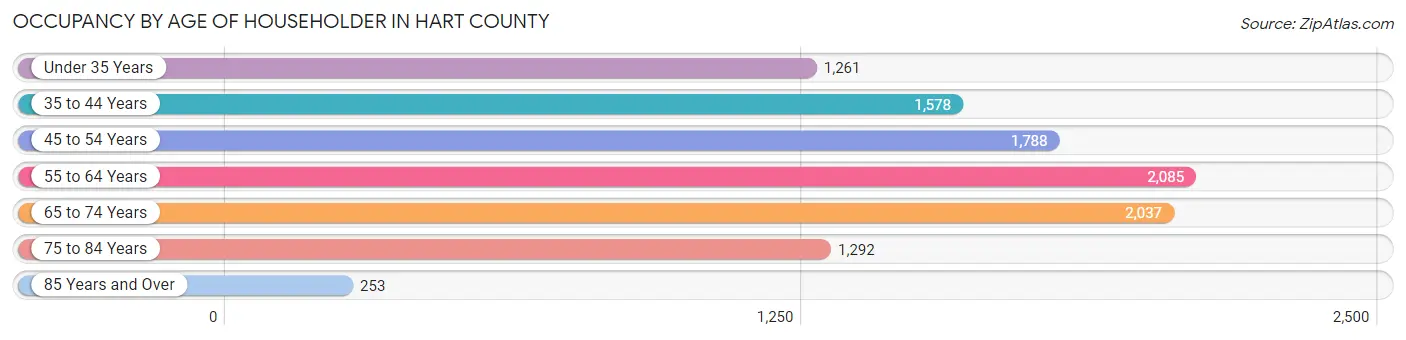
| Age Bracket | # Households | % Households |
| Under 35 Years | 1,261 | 12.2% |
| 35 to 44 Years | 1,578 | 15.3% |
| 45 to 54 Years | 1,788 | 17.4% |
| 55 to 64 Years | 2,085 | 20.3% |
| 65 to 74 Years | 2,037 | 19.8% |
| 75 to 84 Years | 1,292 | 12.6% |
| 85 Years and Over | 253 | 2.5% |
| Total | 10,294 | 100.0% |
Housing Finances in Hart County
Median Income by Occupancy in Hart County
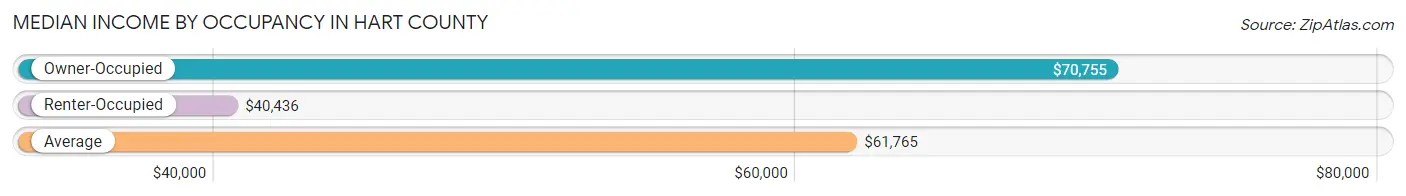
| Occupancy Type | # Households | Median Income |
| Owner-Occupied | 7,748 (75.3%) | $70,755 |
| Renter-Occupied | 2,546 (24.7%) | $40,436 |
| Average | 10,294 (100.0%) | $61,765 |
Occupancy by Householder Income Bracket in Hart County
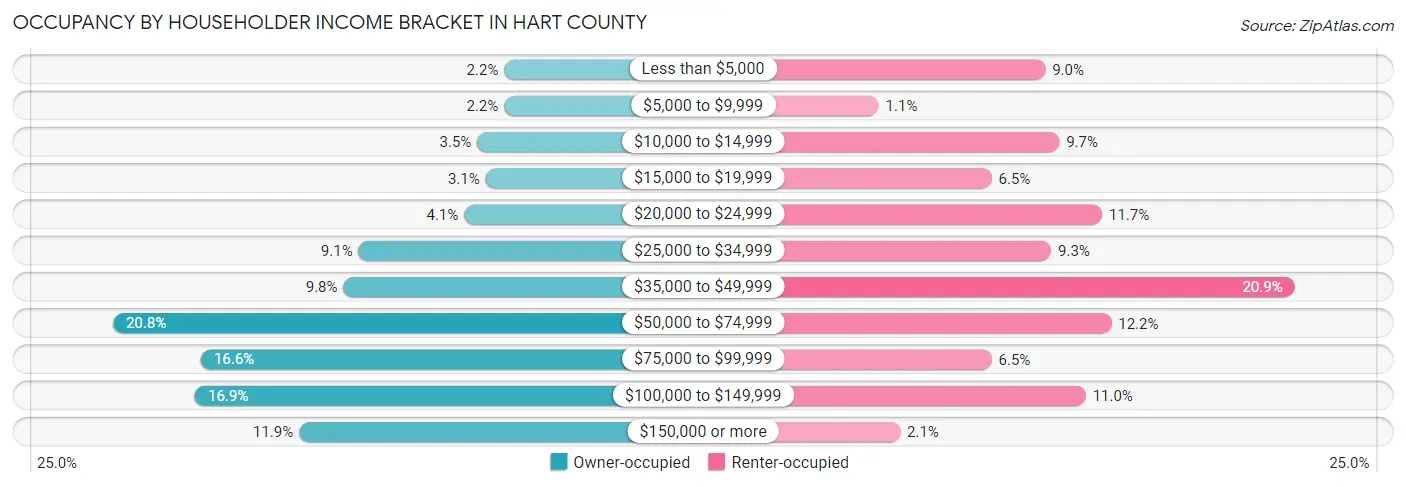
| Income Bracket | Owner-occupied | Renter-occupied |
| Less than $5,000 | 167 (2.2%) | 230 (9.0%) |
| $5,000 to $9,999 | 168 (2.2%) | 28 (1.1%) |
| $10,000 to $14,999 | 267 (3.5%) | 247 (9.7%) |
| $15,000 to $19,999 | 236 (3.0%) | 165 (6.5%) |
| $20,000 to $24,999 | 315 (4.1%) | 299 (11.7%) |
| $25,000 to $34,999 | 705 (9.1%) | 237 (9.3%) |
| $35,000 to $49,999 | 761 (9.8%) | 532 (20.9%) |
| $50,000 to $74,999 | 1,611 (20.8%) | 310 (12.2%) |
| $75,000 to $99,999 | 1,286 (16.6%) | 165 (6.5%) |
| $100,000 to $149,999 | 1,308 (16.9%) | 279 (11.0%) |
| $150,000 or more | 924 (11.9%) | 54 (2.1%) |
| Total | 7,748 (100.0%) | 2,546 (100.0%) |
Monthly Housing Cost Tiers in Hart County
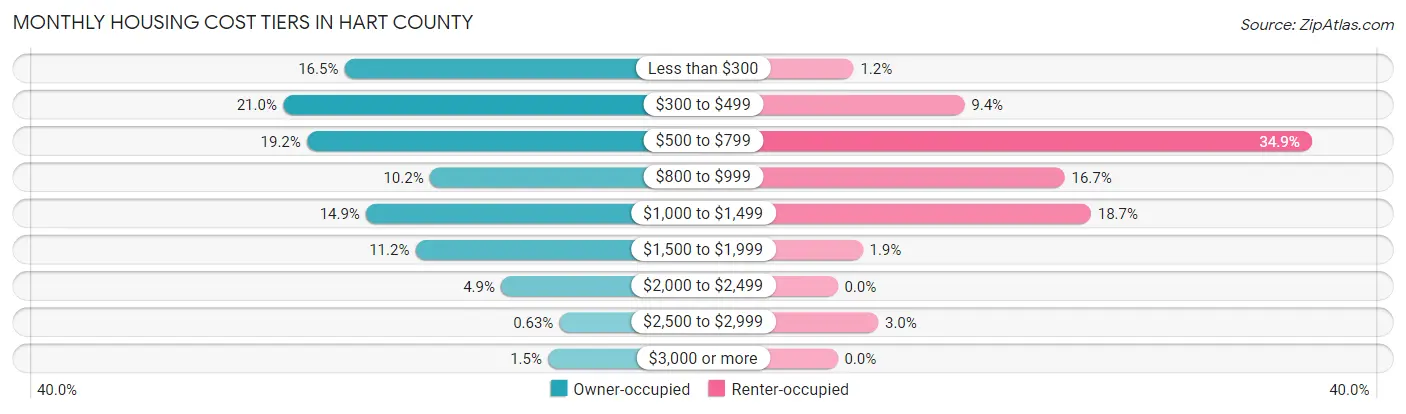
| Monthly Cost | Owner-occupied | Renter-occupied |
| Less than $300 | 1,275 (16.5%) | 30 (1.2%) |
| $300 to $499 | 1,626 (21.0%) | 238 (9.3%) |
| $500 to $799 | 1,490 (19.2%) | 889 (34.9%) |
| $800 to $999 | 789 (10.2%) | 426 (16.7%) |
| $1,000 to $1,499 | 1,153 (14.9%) | 475 (18.7%) |
| $1,500 to $1,999 | 870 (11.2%) | 47 (1.8%) |
| $2,000 to $2,499 | 382 (4.9%) | 0 (0.0%) |
| $2,500 to $2,999 | 49 (0.6%) | 76 (3.0%) |
| $3,000 or more | 114 (1.5%) | 0 (0.0%) |
| Total | 7,748 (100.0%) | 2,546 (100.0%) |
Physical Housing Characteristics in Hart County
Housing Structures in Hart County
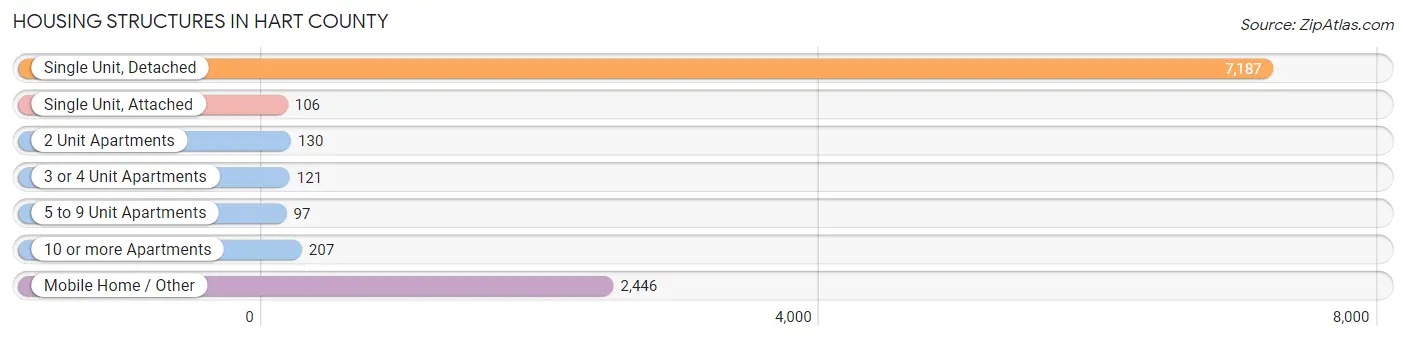
| Structure Type | # Housing Units | % Housing Units |
| Single Unit, Detached | 7,187 | 69.8% |
| Single Unit, Attached | 106 | 1.0% |
| 2 Unit Apartments | 130 | 1.3% |
| 3 or 4 Unit Apartments | 121 | 1.2% |
| 5 to 9 Unit Apartments | 97 | 0.9% |
| 10 or more Apartments | 207 | 2.0% |
| Mobile Home / Other | 2,446 | 23.8% |
| Total | 10,294 | 100.0% |
Housing Structures by Occupancy in Hart County
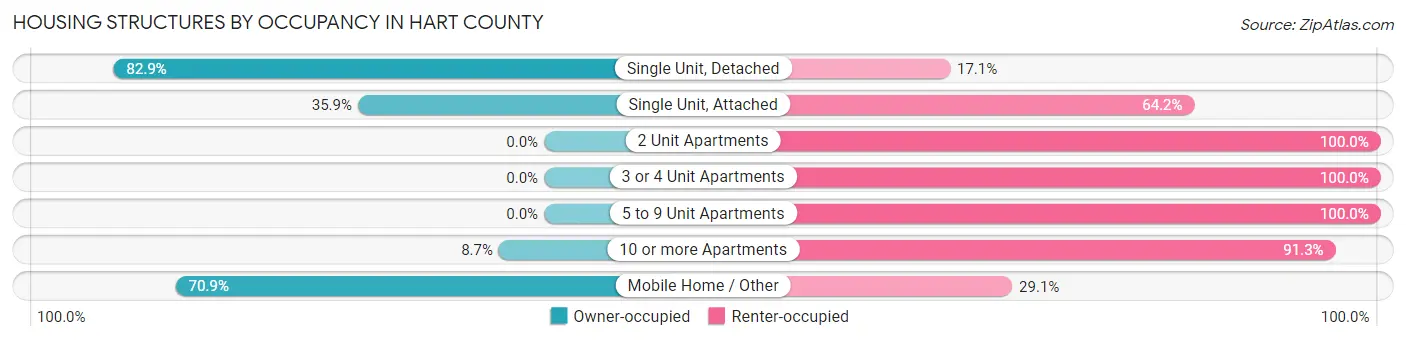
| Structure Type | Owner-occupied | Renter-occupied |
| Single Unit, Detached | 5,957 (82.9%) | 1,230 (17.1%) |
| Single Unit, Attached | 38 (35.8%) | 68 (64.1%) |
| 2 Unit Apartments | 0 (0.0%) | 130 (100.0%) |
| 3 or 4 Unit Apartments | 0 (0.0%) | 121 (100.0%) |
| 5 to 9 Unit Apartments | 0 (0.0%) | 97 (100.0%) |
| 10 or more Apartments | 18 (8.7%) | 189 (91.3%) |
| Mobile Home / Other | 1,735 (70.9%) | 711 (29.1%) |
| Total | 7,748 (75.3%) | 2,546 (24.7%) |
Housing Structures by Number of Rooms in Hart County
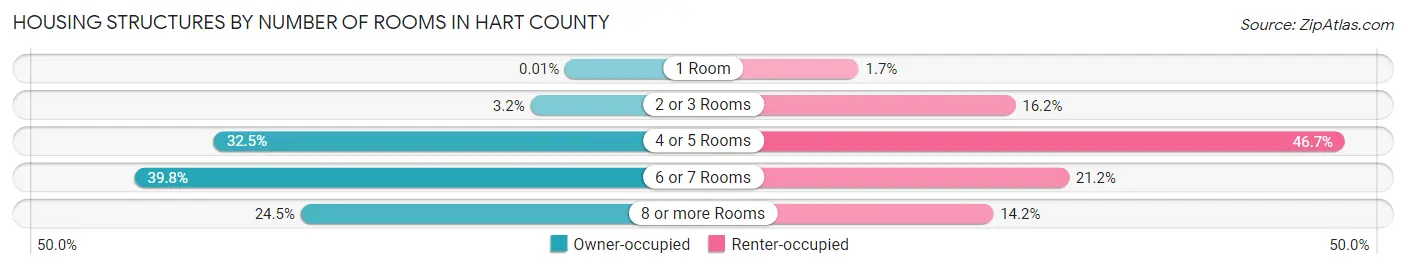
| Number of Rooms | Owner-occupied | Renter-occupied |
| 1 Room | 1 (0.0%) | 44 (1.7%) |
| 2 or 3 Rooms | 249 (3.2%) | 413 (16.2%) |
| 4 or 5 Rooms | 2,518 (32.5%) | 1,189 (46.7%) |
| 6 or 7 Rooms | 3,085 (39.8%) | 539 (21.2%) |
| 8 or more Rooms | 1,895 (24.5%) | 361 (14.2%) |
| Total | 7,748 (100.0%) | 2,546 (100.0%) |
Housing Structure by Heating Type in Hart County

| Heating Type | Owner-occupied | Renter-occupied |
| Utility Gas | 1,149 (14.8%) | 322 (12.7%) |
| Bottled, Tank, or LP Gas | 779 (10.1%) | 135 (5.3%) |
| Electricity | 5,533 (71.4%) | 1,937 (76.1%) |
| Fuel Oil or Kerosene | 0 (0.0%) | 9 (0.4%) |
| Coal or Coke | 0 (0.0%) | 0 (0.0%) |
| All other Fuels | 262 (3.4%) | 143 (5.6%) |
| No Fuel Used | 25 (0.3%) | 0 (0.0%) |
| Total | 7,748 (100.0%) | 2,546 (100.0%) |
Household Vehicle Usage in Hart County
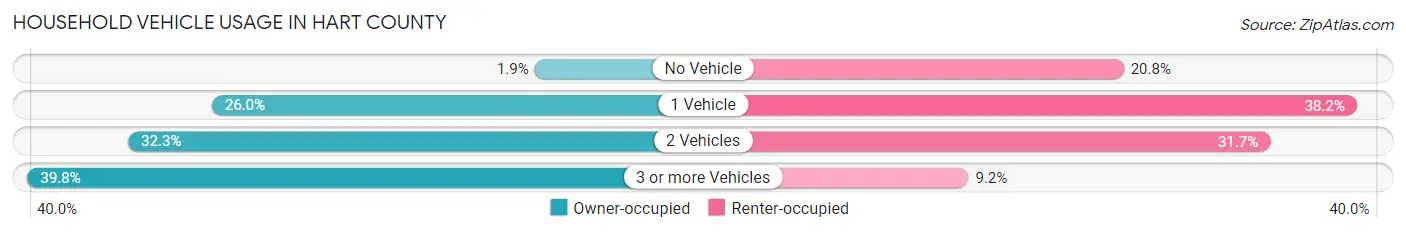
| Vehicles per Household | Owner-occupied | Renter-occupied |
| No Vehicle | 149 (1.9%) | 530 (20.8%) |
| 1 Vehicle | 2,016 (26.0%) | 973 (38.2%) |
| 2 Vehicles | 2,500 (32.3%) | 808 (31.7%) |
| 3 or more Vehicles | 3,083 (39.8%) | 235 (9.2%) |
| Total | 7,748 (100.0%) | 2,546 (100.0%) |
Real Estate & Mortgages in Hart County
Real Estate and Mortgage Overview in Hart County
| Characteristic | Without Mortgage | With Mortgage |
| Housing Units | 4,133 | 3,615 |
| Median Property Value | $137,700 | $218,000 |
| Median Household Income | $63,664 | $643 |
| Monthly Housing Costs | $382 | $114 |
| Real Estate Taxes | $786 | $153 |
Property Value by Mortgage Status in Hart County
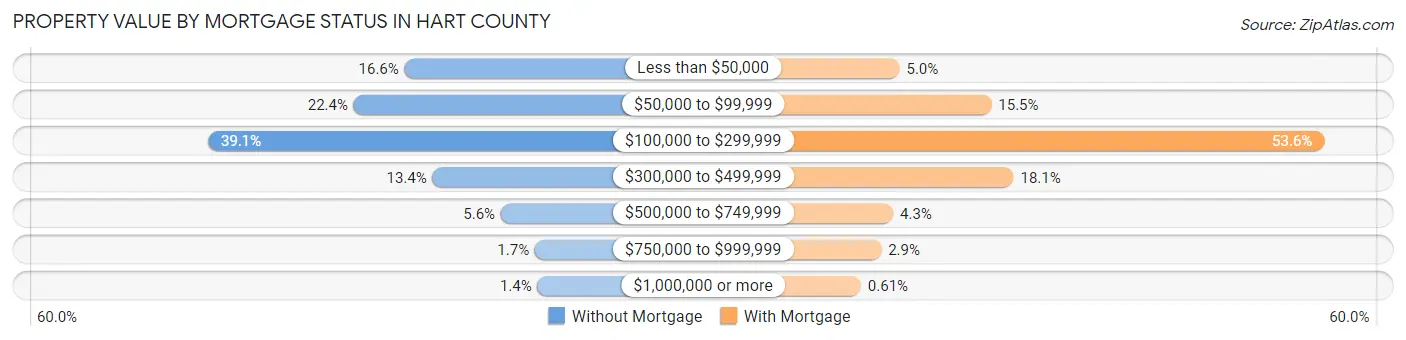
| Property Value | Without Mortgage | With Mortgage |
| Less than $50,000 | 685 (16.6%) | 182 (5.0%) |
| $50,000 to $99,999 | 925 (22.4%) | 561 (15.5%) |
| $100,000 to $299,999 | 1,614 (39.1%) | 1,936 (53.5%) |
| $300,000 to $499,999 | 553 (13.4%) | 653 (18.1%) |
| $500,000 to $749,999 | 230 (5.6%) | 155 (4.3%) |
| $750,000 to $999,999 | 69 (1.7%) | 106 (2.9%) |
| $1,000,000 or more | 57 (1.4%) | 22 (0.6%) |
| Total | 4,133 (100.0%) | 3,615 (100.0%) |
Household Income by Mortgage Status in Hart County
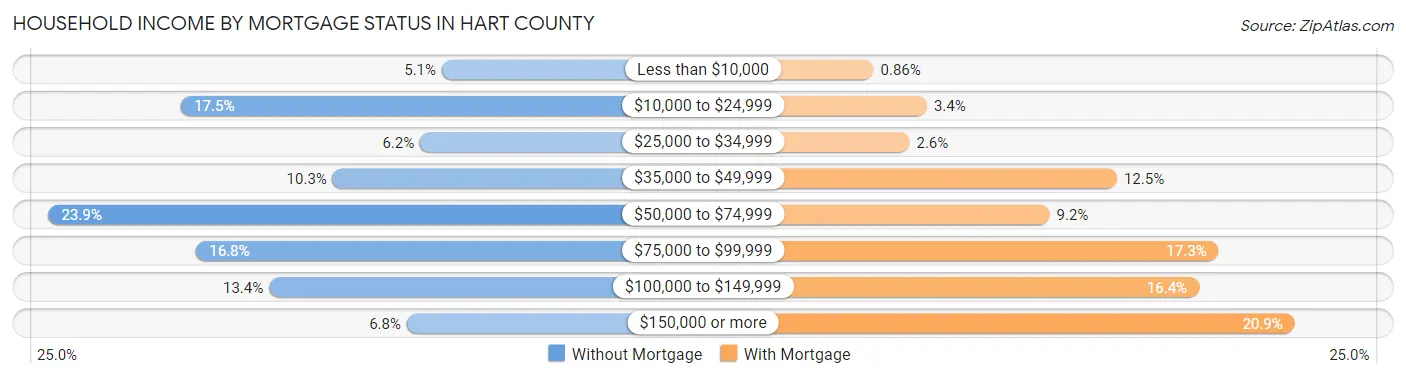
| Household Income | Without Mortgage | With Mortgage |
| Less than $10,000 | 212 (5.1%) | 31 (0.9%) |
| $10,000 to $24,999 | 725 (17.5%) | 123 (3.4%) |
| $25,000 to $34,999 | 255 (6.2%) | 93 (2.6%) |
| $35,000 to $49,999 | 427 (10.3%) | 450 (12.4%) |
| $50,000 to $74,999 | 986 (23.9%) | 334 (9.2%) |
| $75,000 to $99,999 | 695 (16.8%) | 625 (17.3%) |
| $100,000 to $149,999 | 552 (13.4%) | 591 (16.4%) |
| $150,000 or more | 281 (6.8%) | 756 (20.9%) |
| Total | 4,133 (100.0%) | 3,615 (100.0%) |
Property Value to Household Income Ratio in Hart County
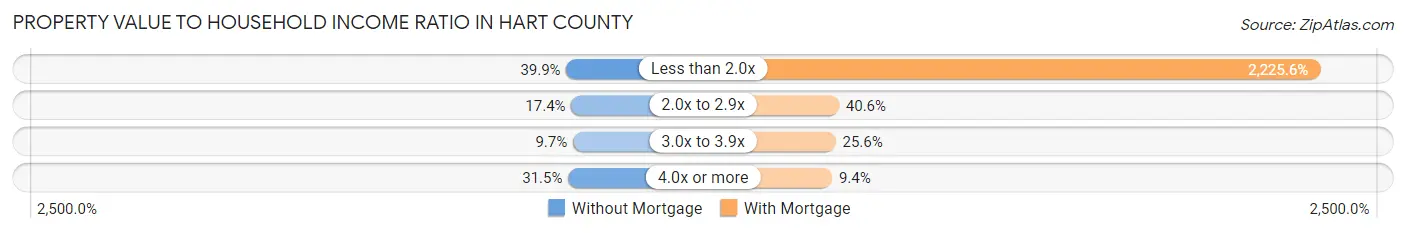
| Value-to-Income Ratio | Without Mortgage | With Mortgage |
| Less than 2.0x | 1,649 (39.9%) | 80,456 (2,225.6%) |
| 2.0x to 2.9x | 721 (17.4%) | 1,467 (40.6%) |
| 3.0x to 3.9x | 401 (9.7%) | 924 (25.6%) |
| 4.0x or more | 1,302 (31.5%) | 341 (9.4%) |
| Total | 4,133 (100.0%) | 3,615 (100.0%) |
Real Estate Taxes by Mortgage Status in Hart County

| Property Taxes | Without Mortgage | With Mortgage |
| Less than $800 | 1,988 (48.1%) | 0 (0.0%) |
| $800 to $1,499 | 871 (21.1%) | 823 (22.8%) |
| $800 to $1,499 | 1,053 (25.5%) | 1,213 (33.6%) |
| Total | 4,133 (100.0%) | 3,615 (100.0%) |
Health & Disability in Hart County
Health Insurance Coverage by Age in Hart County

| Age Bracket | With Coverage | Without Coverage |
| Under 6 Years | 1,553 (93.8%) | 102 (6.2%) |
| 6 to 18 Years | 3,713 (90.2%) | 403 (9.8%) |
| 19 to 25 Years | 998 (75.6%) | 322 (24.4%) |
| 26 to 34 Years | 2,257 (81.6%) | 509 (18.4%) |
| 35 to 44 Years | 2,169 (79.4%) | 564 (20.6%) |
| 45 to 54 Years | 2,826 (83.0%) | 577 (17.0%) |
| 55 to 64 Years | 3,269 (89.4%) | 387 (10.6%) |
| 65 to 74 Years | 3,254 (99.1%) | 30 (0.9%) |
| 75 Years and older | 2,375 (100.0%) | 0 (0.0%) |
| Total | 22,414 (88.6%) | 2,894 (11.4%) |
Health Insurance Coverage by Citizenship Status in Hart County
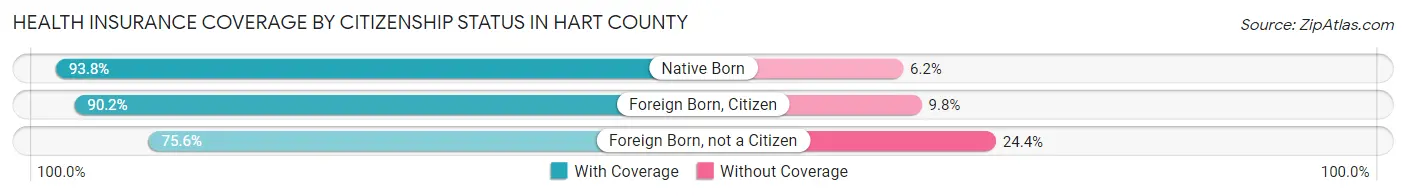
| Citizenship Status | With Coverage | Without Coverage |
| Native Born | 1,553 (93.8%) | 102 (6.2%) |
| Foreign Born, Citizen | 3,713 (90.2%) | 403 (9.8%) |
| Foreign Born, not a Citizen | 998 (75.6%) | 322 (24.4%) |
Health Insurance Coverage by Household Income in Hart County
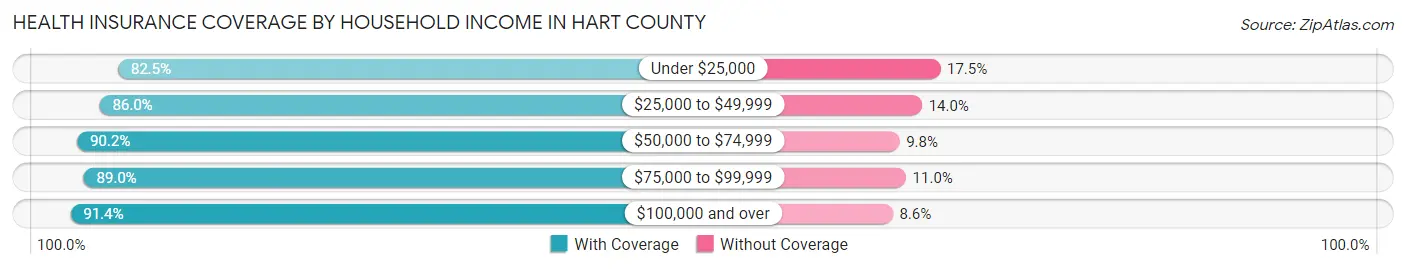
| Household Income | With Coverage | Without Coverage |
| Under $25,000 | 2,618 (82.5%) | 554 (17.5%) |
| $25,000 to $49,999 | 4,254 (86.0%) | 694 (14.0%) |
| $50,000 to $74,999 | 3,940 (90.2%) | 429 (9.8%) |
| $75,000 to $99,999 | 4,234 (89.0%) | 525 (11.0%) |
| $100,000 and over | 7,361 (91.4%) | 689 (8.6%) |
Public vs Private Health Insurance Coverage by Age in Hart County

| Age Bracket | Public Insurance | Private Insurance |
| Under 6 | 785 (47.4%) | 876 (52.9%) |
| 6 to 18 Years | 1,458 (35.4%) | 2,600 (63.2%) |
| 19 to 25 Years | 152 (11.5%) | 887 (67.2%) |
| 25 to 34 Years | 256 (9.3%) | 2,054 (74.3%) |
| 35 to 44 Years | 429 (15.7%) | 1,880 (68.8%) |
| 45 to 54 Years | 324 (9.5%) | 2,530 (74.4%) |
| 55 to 64 Years | 913 (25.0%) | 2,672 (73.1%) |
| 65 to 74 Years | 3,215 (97.9%) | 1,734 (52.8%) |
| 75 Years and over | 2,375 (100.0%) | 1,360 (57.3%) |
| Total | 9,907 (39.2%) | 16,593 (65.6%) |
Disability Status by Sex by Age in Hart County
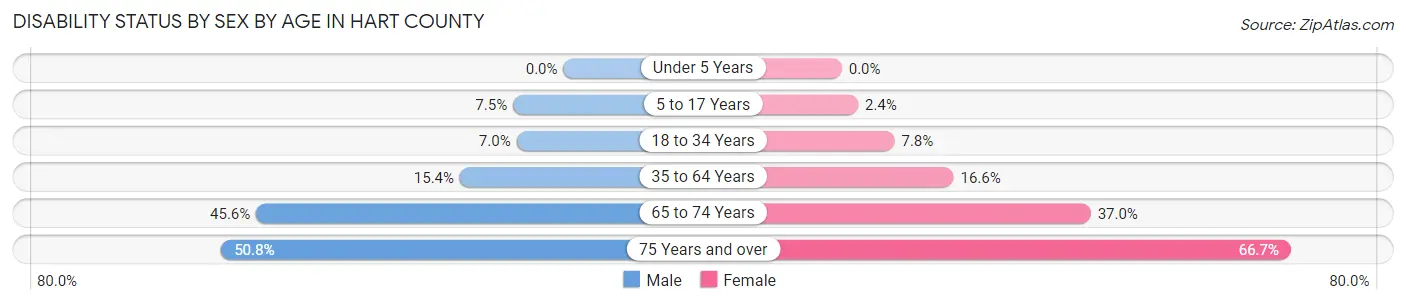
| Age Bracket | Male | Female |
| Under 5 Years | 0 (0.0%) | 0 (0.0%) |
| 5 to 17 Years | 160 (7.5%) | 48 (2.4%) |
| 18 to 34 Years | 170 (7.0%) | 158 (7.8%) |
| 35 to 64 Years | 752 (15.4%) | 813 (16.6%) |
| 65 to 74 Years | 713 (45.6%) | 636 (37.0%) |
| 75 Years and over | 507 (50.8%) | 918 (66.7%) |
Disability Class by Sex by Age in Hart County
Disability Class: Hearing Difficulty
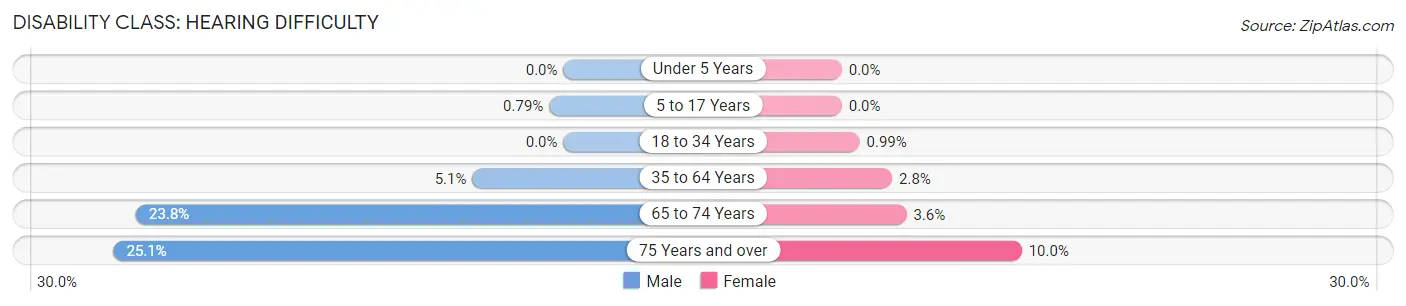
| Age Bracket | Male | Female |
| Under 5 Years | 0 (0.0%) | 0 (0.0%) |
| 5 to 17 Years | 17 (0.8%) | 0 (0.0%) |
| 18 to 34 Years | 0 (0.0%) | 20 (1.0%) |
| 35 to 64 Years | 248 (5.1%) | 137 (2.8%) |
| 65 to 74 Years | 372 (23.8%) | 62 (3.6%) |
| 75 Years and over | 250 (25.1%) | 138 (10.0%) |
Disability Class: Vision Difficulty
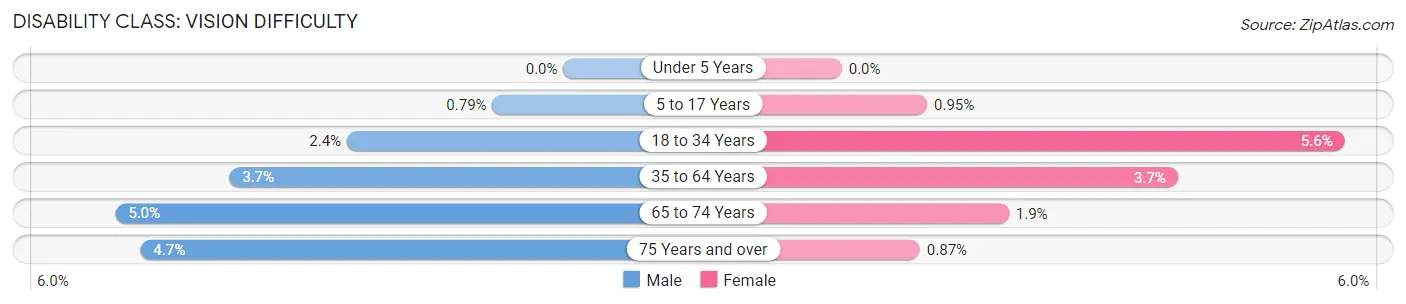
| Age Bracket | Male | Female |
| Under 5 Years | 0 (0.0%) | 0 (0.0%) |
| 5 to 17 Years | 17 (0.8%) | 19 (0.9%) |
| 18 to 34 Years | 59 (2.4%) | 113 (5.6%) |
| 35 to 64 Years | 182 (3.7%) | 183 (3.7%) |
| 65 to 74 Years | 78 (5.0%) | 32 (1.9%) |
| 75 Years and over | 47 (4.7%) | 12 (0.9%) |
Disability Class: Cognitive Difficulty
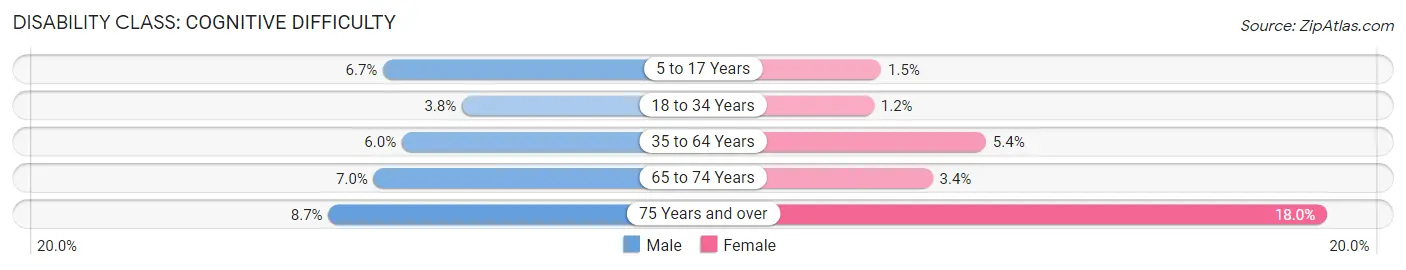
| Age Bracket | Male | Female |
| 5 to 17 Years | 143 (6.7%) | 29 (1.5%) |
| 18 to 34 Years | 92 (3.8%) | 24 (1.2%) |
| 35 to 64 Years | 293 (6.0%) | 262 (5.3%) |
| 65 to 74 Years | 110 (7.0%) | 58 (3.4%) |
| 75 Years and over | 87 (8.7%) | 248 (18.0%) |
Disability Class: Ambulatory Difficulty
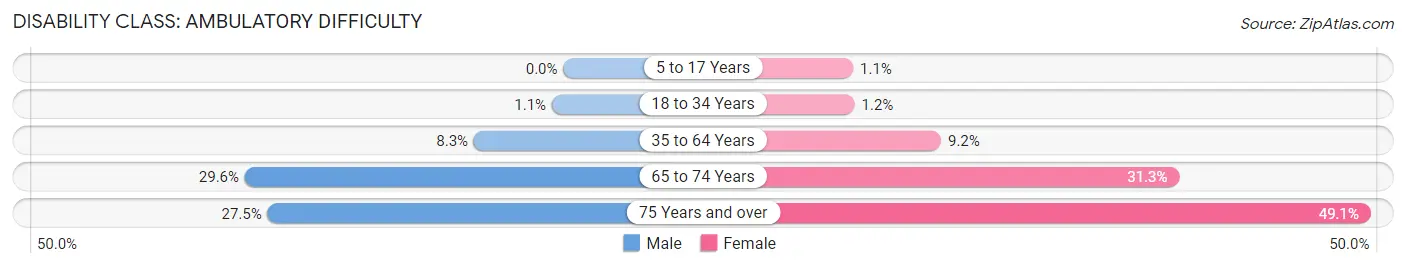
| Age Bracket | Male | Female |
| 5 to 17 Years | 0 (0.0%) | 21 (1.1%) |
| 18 to 34 Years | 26 (1.1%) | 24 (1.2%) |
| 35 to 64 Years | 406 (8.3%) | 451 (9.2%) |
| 65 to 74 Years | 462 (29.6%) | 539 (31.3%) |
| 75 Years and over | 274 (27.5%) | 676 (49.1%) |
Disability Class: Self-Care Difficulty
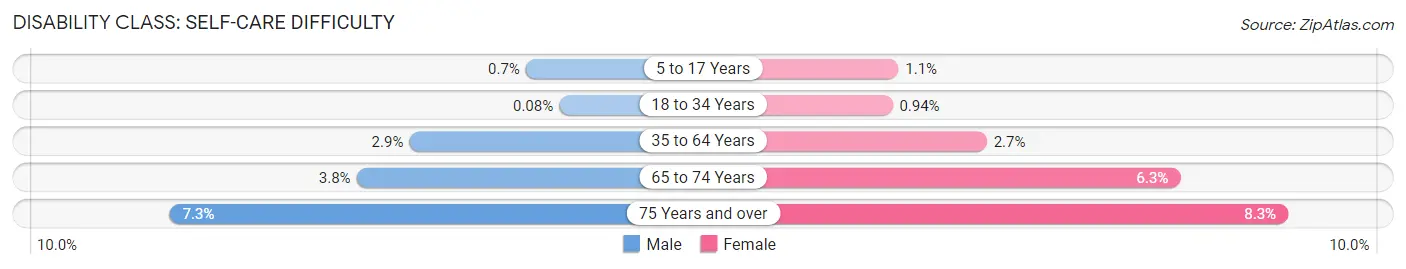
| Age Bracket | Male | Female |
| 5 to 17 Years | 15 (0.7%) | 21 (1.1%) |
| 18 to 34 Years | 2 (0.1%) | 19 (0.9%) |
| 35 to 64 Years | 140 (2.9%) | 132 (2.7%) |
| 65 to 74 Years | 60 (3.8%) | 108 (6.3%) |
| 75 Years and over | 73 (7.3%) | 114 (8.3%) |
Technology Access in Hart County
Computing Device Access in Hart County
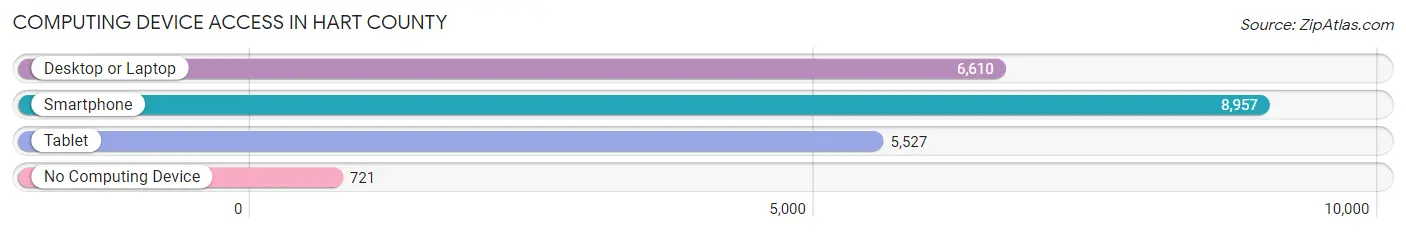
| Device Type | # Households | % Households |
| Desktop or Laptop | 6,610 | 64.2% |
| Smartphone | 8,957 | 87.0% |
| Tablet | 5,527 | 53.7% |
| No Computing Device | 721 | 7.0% |
| Total | 10,294 | 100.0% |
Internet Access in Hart County
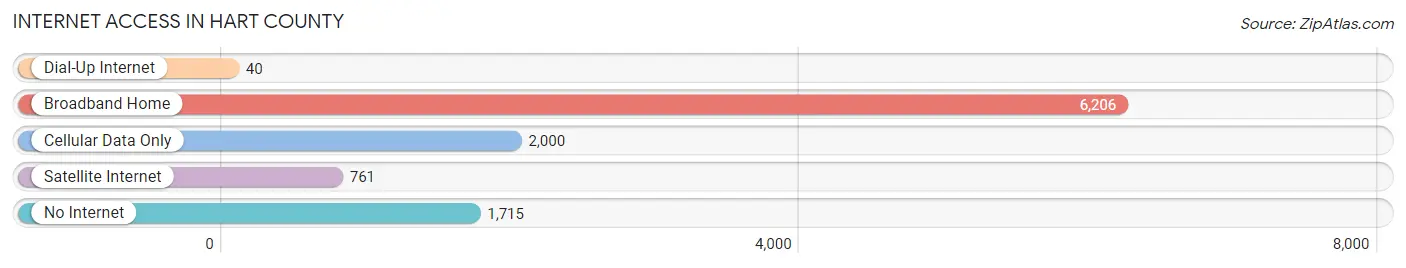
| Internet Type | # Households | % Households |
| Dial-Up Internet | 40 | 0.4% |
| Broadband Home | 6,206 | 60.3% |
| Cellular Data Only | 2,000 | 19.4% |
| Satellite Internet | 761 | 7.4% |
| No Internet | 1,715 | 16.7% |
| Total | 10,294 | 100.0% |
Hart County Summary
History
Hart County, Georgia is located in the northeastern part of the state and is part of the Athens-Clarke-Barrow Metropolitan Statistical Area. The county was created in 1853 from parts of Franklin, Elbert, and Madison counties. It was named for Nancy Hart, a Revolutionary War heroine who was captured by Tories and escaped.
The county was home to the Cherokee Indians prior to the arrival of European settlers. The first settlers arrived in the late 1700s and early 1800s, and the county was officially established in 1853. The county seat is Hartwell, which was named after the Hart family.
The county was largely agricultural in the 19th century, with cotton and tobacco being the main crops. The county also had several sawmills and gristmills. The railroad arrived in the late 1800s, and the county began to develop more industry.
In the early 20th century, the county was home to several textile mills, which provided jobs for many of the county’s residents. The county also had several brickyards and lumber mills.
The county was also home to several military bases during World War II, including Camp Wheeler and Camp Toccoa. These bases provided jobs for many of the county’s residents.
Geography
Hart County is located in the northeastern part of the state of Georgia. It is bordered by Franklin County to the north, Elbert County to the east, Madison County to the south, and Oglethorpe County to the west. The county covers an area of approximately 437 square miles and has a population of approximately 20,000 people.
The county is located in the Piedmont region of Georgia and is mostly hilly and forested. The county is drained by the Broad River, which flows through the county from north to south. The county is also home to several lakes, including Hartwell Lake, which is the largest lake in the state.
Economy
The economy of Hart County is largely based on agriculture and manufacturing. The county is home to several large farms, which produce a variety of crops, including cotton, corn, soybeans, and tobacco. The county also has several large poultry farms, which produce eggs and poultry products.
The county is also home to several manufacturing companies, which produce a variety of products, including textiles, furniture, and automotive parts. The county is also home to several large distribution centers, which provide jobs for many of the county’s residents.
The county is also home to several tourist attractions, including the Hart County Historical Society Museum, the Hart County Fairgrounds, and the Hart County Recreation Area. These attractions provide jobs for many of the county’s residents.
Demographics
As of the 2010 census, the population of Hart County was 19,944. The population is approximately 54% white, 40% African American, 2% Hispanic, and 4% other. The median household income is $37,945, and the median home value is $117,400.
The county is home to several colleges and universities, including the University of Georgia, Georgia State University, and Georgia Institute of Technology. The county is also home to several public schools, including Hart County High School, Hart County Middle School, and Hart County Elementary School.
Conclusion
Hart County, Georgia is a rural county located in the northeastern part of the state. The county was created in 1853 and is home to approximately 20,000 people. The county is largely agricultural, with cotton, corn, soybeans, and tobacco being the main crops. The county is also home to several manufacturing companies, which produce a variety of products. The county is also home to several tourist attractions, including the Hart County Historical Society Museum, the Hart County Fairgrounds, and the Hart County Recreation Area. The population of the county is approximately 54% white, 40% African American, 2% Hispanic, and 4% other. The median household income is $37,945, and the median home value is $117,400.
Common Questions
What is the Total Population of Hart County?
Total Population of Hart County is 26,110.
What is the Total Male Population of Hart County?
Total Male Population of Hart County is 12,979.
What is the Total Female Population of Hart County?
Total Female Population of Hart County is 13,131.
What is the Ratio of Males per 100 Females in Hart County?
There are 98.84 Males per 100 Females in Hart County.
What is the Ratio of Females per 100 Males in Hart County?
There are 101.17 Females per 100 Males in Hart County.
What is the Median Population Age in Hart County?
Median Population Age in Hart County is 45.1 Years.
What is the Average Family Size in Hart County
Average Family Size in Hart County is 3.1 People.
What is the Average Household Size in Hart County
Average Household Size in Hart County is 2.5 People.
What is Per Capita Income in Hart County?
Per Capita income in Hart County is $30,636.
What is the Median Family Income in Hart County?
Median Family Income in Hart County is $77,241.
What is the Median Household income in Hart County?
Median Household Income in Hart County is $61,765.
What is Income or Wage Gap in Hart County?
Income or Wage Gap in Hart County is 30.0%.
Women in Hart County earn 70.0 cents for every dollar earned by a man.
What is Family Income Deficit in Hart County?
Family Income Deficit in Hart County is $9,455.
Families that are below poverty line in Hart County earn $9,455 less on average than the poverty threshold level.
What is Inequality or Gini Index in Hart County?
Inequality or Gini Index in Hart County is 0.44.
How Large is the Labor Force in Hart County?
There are 11,635 People in the Labor Forcein in Hart County.
What is the Percentage of People in the Labor Force in Hart County?
54.7% of People are in the Labor Force in Hart County.
What is the Unemployment Rate in Hart County?
Unemployment Rate in Hart County is 4.8%.