Fannin County, GA
Fannin County Overview
25,436
TOTAL POPULATION
12,481
MALE POPULATION
12,955
FEMALE POPULATION
96.34
MALES / 100 FEMALES
103.80
FEMALES / 100 MALES
53.8
MEDIAN AGE
2.7
AVG FAMILY SIZE
2.2
AVG HOUSEHOLD SIZE
$36,058
PER CAPITA INCOME
$61,406
AVG FAMILY INCOME
$54,857
AVG HOUSEHOLD INCOME
38.3%
WAGE / INCOME GAP [ % ]
61.7¢/ $1
WAGE / INCOME GAP [ $ ]
$10,951
FAMILY INCOME DEFICIT
0.49
INEQUALITY / GINI INDEX
10,568
LABOR FORCE [ PEOPLE ]
48.1%
PERCENT IN LABOR FORCE
5.4%
UNEMPLOYMENT RATE
Race in Fannin County
The most populous races in Fannin County are White / Caucasian (23,947 | 94.2%), Two or more Races (936 | 3.7%), and Hispanic or Latino (708 | 2.8%).

| Race | # Population | % Population |
| Asian | 121 | 0.5% |
| Black / African American | 68 | 0.3% |
| Hawaiian / Pacific | 0 | 0.0% |
| Hispanic or Latino | 708 | 2.8% |
| Native / Alaskan | 38 | 0.2% |
| White / Caucasian | 23,947 | 94.2% |
| Two or more Races | 936 | 3.7% |
| Some other Race | 326 | 1.3% |
| Total | 25,436 | 100.0% |
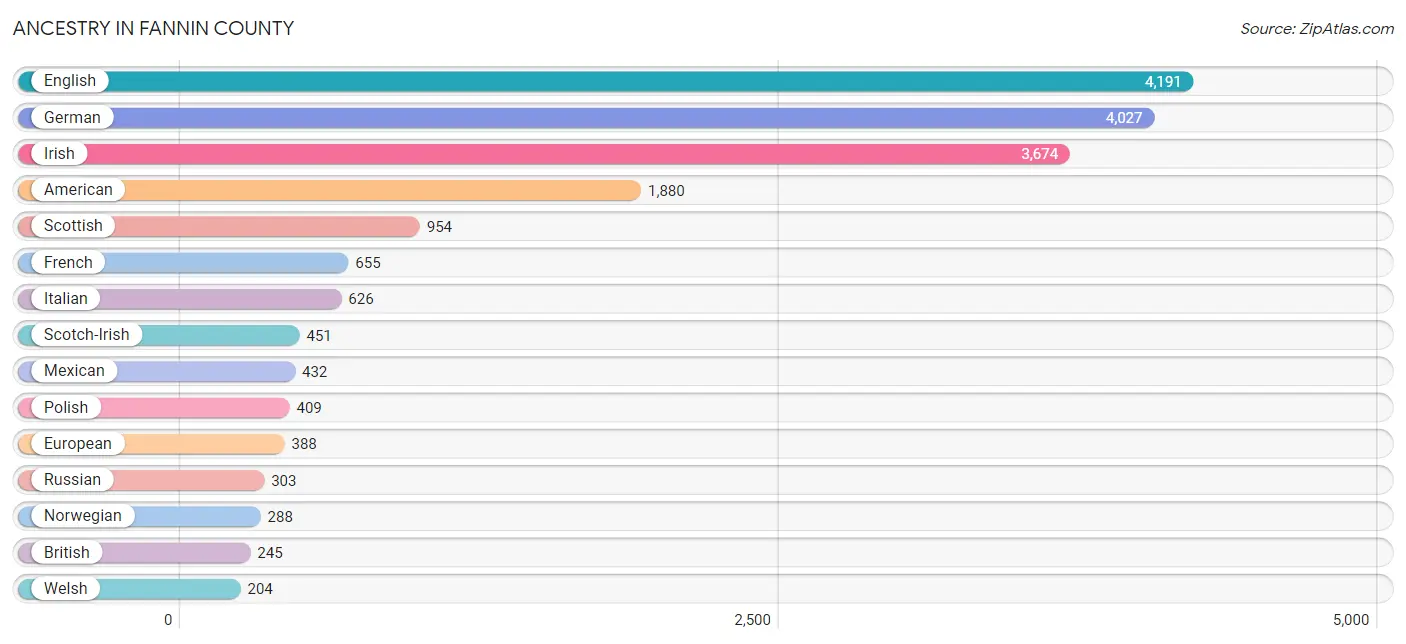
Ancestry in Fannin County
The most populous ancestries reported in Fannin County are English (4,191 | 16.5%), German (4,027 | 15.8%), Irish (3,674 | 14.4%), American (1,880 | 7.4%), and Scottish (954 | 3.7%), together accounting for 57.9% of all Fannin County residents.
| Ancestry | # Population | % Population |
| African | 68 | 0.3% |
| Albanian | 54 | 0.2% |
| American | 1,880 | 7.4% |
| Apache | 22 | 0.1% |
| Arab | 58 | 0.2% |
| Austrian | 27 | 0.1% |
| Belgian | 141 | 0.5% |
| British | 245 | 1.0% |
| Burmese | 57 | 0.2% |
| Cajun | 7 | 0.0% |
| Canadian | 5 | 0.0% |
| Central American | 53 | 0.2% |
| Cherokee | 125 | 0.5% |
| Colombian | 46 | 0.2% |
| Creek | 2 | 0.0% |
| Croatian | 14 | 0.1% |
| Cuban | 63 | 0.3% |
| Czech | 33 | 0.1% |
| Danish | 11 | 0.0% |
| Dutch | 170 | 0.7% |
| Eastern European | 99 | 0.4% |
| English | 4,191 | 16.5% |
| European | 388 | 1.5% |
| Filipino | 6 | 0.0% |
| French | 655 | 2.6% |
| French Canadian | 75 | 0.3% |
| German | 4,027 | 15.8% |
| Greek | 147 | 0.6% |
| Guamanian / Chamorro | 31 | 0.1% |
| Guatemalan | 31 | 0.1% |
| Honduran | 3 | 0.0% |
| Hungarian | 142 | 0.6% |
| Indian (Asian) | 63 | 0.3% |
| Iraqi | 16 | 0.1% |
| Irish | 3,674 | 14.4% |
| Italian | 626 | 2.5% |
| Korean | 115 | 0.4% |
| Lebanese | 42 | 0.2% |
| Lithuanian | 38 | 0.2% |
| Mexican | 432 | 1.7% |
| Native Hawaiian | 63 | 0.3% |
| Nigerian | 2 | 0.0% |
| Northern European | 69 | 0.3% |
| Norwegian | 288 | 1.1% |
| Panamanian | 19 | 0.1% |
| Pennsylvania German | 16 | 0.1% |
| Polish | 409 | 1.6% |
| Portuguese | 28 | 0.1% |
| Puerto Rican | 59 | 0.2% |
| Romanian | 59 | 0.2% |
| Russian | 303 | 1.2% |
| Samoan | 63 | 0.3% |
| Scandinavian | 119 | 0.5% |
| Scotch-Irish | 451 | 1.8% |
| Scottish | 954 | 3.7% |
| Seminole | 66 | 0.3% |
| Slovak | 54 | 0.2% |
| South African | 20 | 0.1% |
| South American | 46 | 0.2% |
| Spaniard | 12 | 0.1% |
| Spanish | 9 | 0.0% |
| Sri Lankan | 63 | 0.3% |
| Subsaharan African | 90 | 0.4% |
| Swedish | 136 | 0.5% |
| Swiss | 12 | 0.1% |
| Thai | 68 | 0.3% |
| Ukrainian | 14 | 0.1% |
| Welsh | 204 | 0.8% | View All 68 Rows |
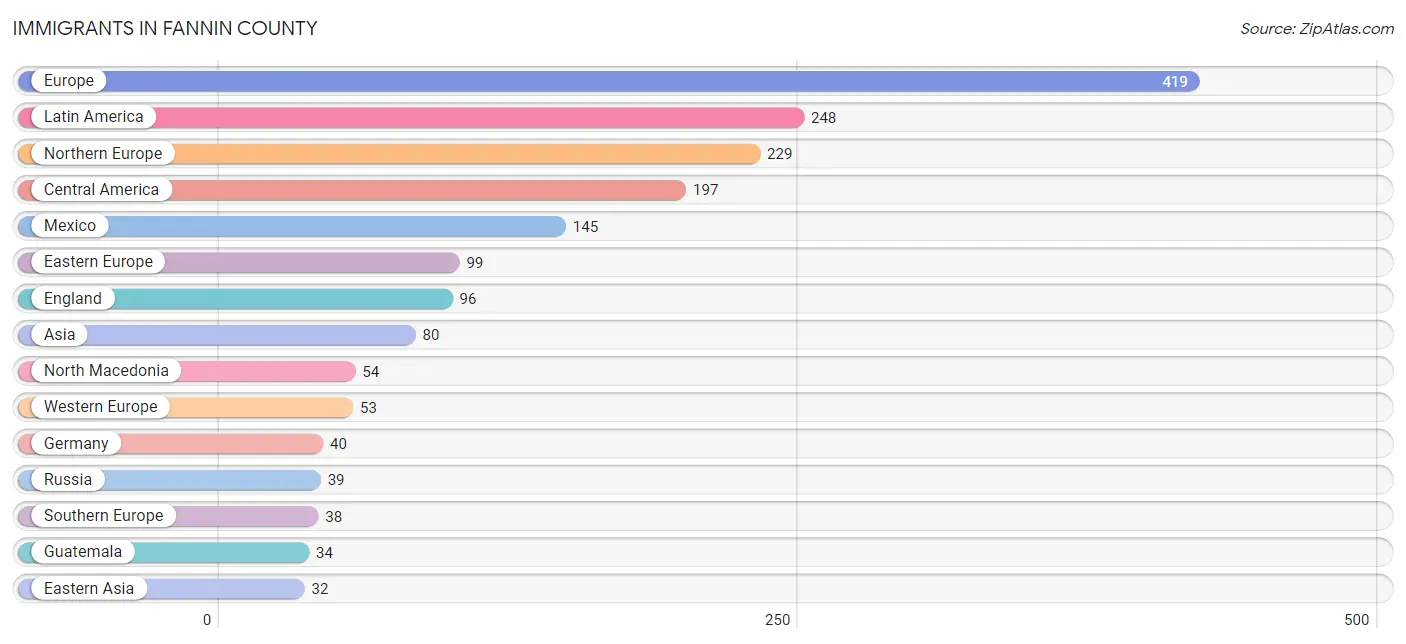
Immigrants in Fannin County
The most numerous immigrant groups reported in Fannin County came from Europe (419 | 1.7%), Latin America (248 | 1.0%), Northern Europe (229 | 0.9%), Central America (197 | 0.8%), and Mexico (145 | 0.6%), together accounting for 4.9% of all Fannin County residents.
| Immigration Origin | # Population | % Population |
| Africa | 20 | 0.1% |
| Asia | 80 | 0.3% |
| Austria | 13 | 0.1% |
| Belize | 13 | 0.1% |
| Canada | 11 | 0.0% |
| Caribbean | 21 | 0.1% |
| Central America | 197 | 0.8% |
| China | 10 | 0.0% |
| Colombia | 30 | 0.1% |
| Cuba | 21 | 0.1% |
| Eastern Asia | 32 | 0.1% |
| Eastern Europe | 99 | 0.4% |
| England | 96 | 0.4% |
| Europe | 419 | 1.7% |
| Germany | 40 | 0.2% |
| Greece | 25 | 0.1% |
| Guatemala | 34 | 0.1% |
| Honduras | 4 | 0.0% |
| Iraq | 16 | 0.1% |
| Italy | 13 | 0.1% |
| Korea | 22 | 0.1% |
| Latin America | 248 | 1.0% |
| Mexico | 145 | 0.6% |
| North Macedonia | 54 | 0.2% |
| Northern Europe | 229 | 0.9% |
| Panama | 1 | 0.0% |
| Philippines | 30 | 0.1% |
| Poland | 6 | 0.0% |
| Russia | 39 | 0.2% |
| Scotland | 16 | 0.1% |
| South Africa | 20 | 0.1% |
| South America | 30 | 0.1% |
| South Eastern Asia | 32 | 0.1% |
| Southern Europe | 38 | 0.2% |
| Taiwan | 6 | 0.0% |
| Vietnam | 2 | 0.0% |
| Western Asia | 16 | 0.1% |
| Western Europe | 53 | 0.2% | View All 38 Rows |
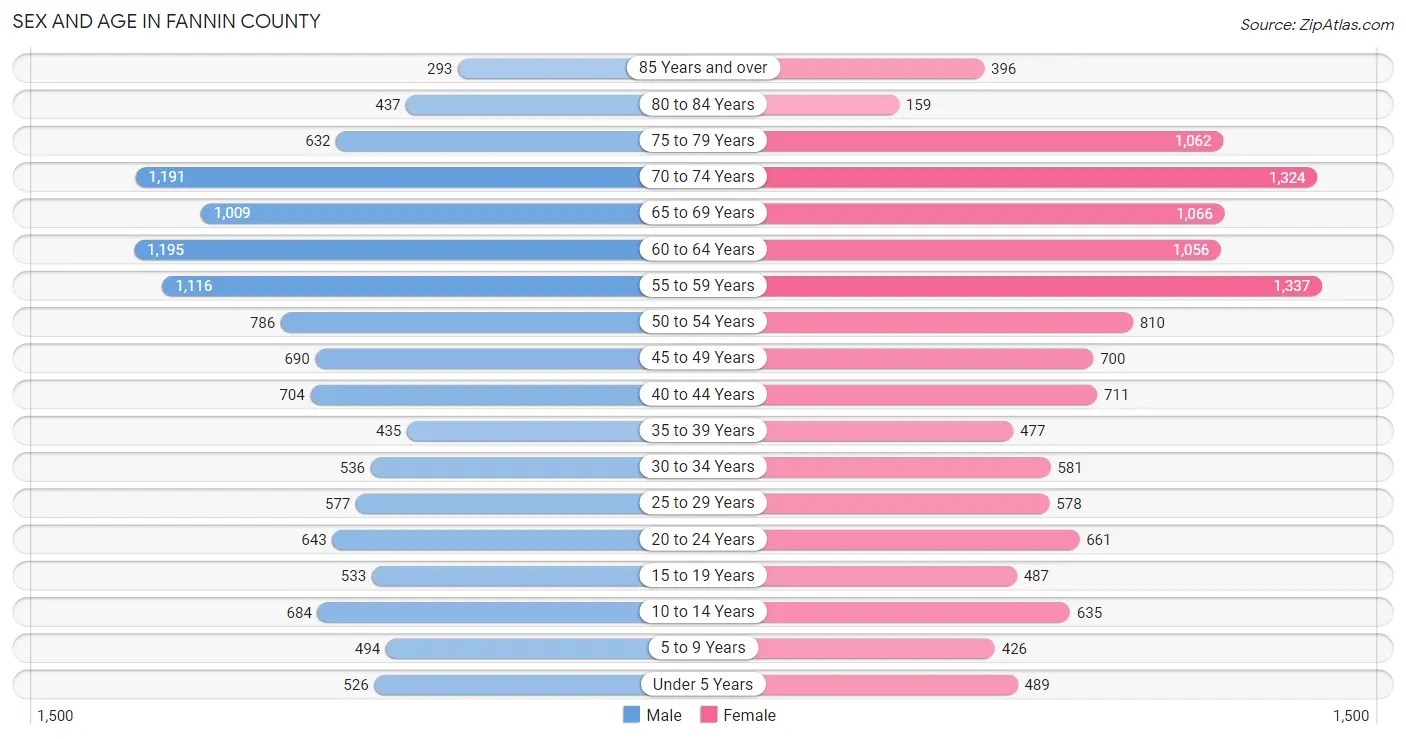
Sex and Age in Fannin County
Sex and Age in Fannin County
The most populous age groups in Fannin County are 60 to 64 Years (1,195 | 9.6%) for men and 55 to 59 Years (1,337 | 10.3%) for women.
| Age Bracket | Male | Female |
| Under 5 Years | 526 (4.2%) | 489 (3.8%) |
| 5 to 9 Years | 494 (4.0%) | 426 (3.3%) |
| 10 to 14 Years | 684 (5.5%) | 635 (4.9%) |
| 15 to 19 Years | 533 (4.3%) | 487 (3.8%) |
| 20 to 24 Years | 643 (5.1%) | 661 (5.1%) |
| 25 to 29 Years | 577 (4.6%) | 578 (4.5%) |
| 30 to 34 Years | 536 (4.3%) | 581 (4.5%) |
| 35 to 39 Years | 435 (3.5%) | 477 (3.7%) |
| 40 to 44 Years | 704 (5.6%) | 711 (5.5%) |
| 45 to 49 Years | 690 (5.5%) | 700 (5.4%) |
| 50 to 54 Years | 786 (6.3%) | 810 (6.2%) |
| 55 to 59 Years | 1,116 (8.9%) | 1,337 (10.3%) |
| 60 to 64 Years | 1,195 (9.6%) | 1,056 (8.2%) |
| 65 to 69 Years | 1,009 (8.1%) | 1,066 (8.2%) |
| 70 to 74 Years | 1,191 (9.5%) | 1,324 (10.2%) |
| 75 to 79 Years | 632 (5.1%) | 1,062 (8.2%) |
| 80 to 84 Years | 437 (3.5%) | 159 (1.2%) |
| 85 Years and over | 293 (2.4%) | 396 (3.1%) |
| Total | 12,481 (100.0%) | 12,955 (100.0%) |
Families and Households in Fannin County
Median Family Size in Fannin County
The median family size in Fannin County is 2.66 persons per family, with single female/mother families (1,215 | 15.4%) accounting for the largest median family size of 2.75 persons per family. On the other hand, single male/father families (356 | 4.5%) represent the smallest median family size with 2.48 persons per family.

| Family Type | # Families | Family Size |
| Married-Couple | 6,303 (80.0%) | 2.65 |
| Single Male/Father | 356 (4.5%) | 2.48 |
| Single Female/Mother | 1,215 (15.4%) | 2.75 |
| Total Families | 7,874 (100.0%) | 2.66 |
Median Household Size in Fannin County
The median household size in Fannin County is 2.23 persons per household, with single female/mother households (1,215 | 10.7%) accounting for the largest median household size of 2.87 persons per household. non-family households (3,453 | 30.5%) represent the smallest median household size with 1.15 persons per household.

| Household Type | # Households | Household Size |
| Married-Couple | 6,303 (55.6%) | 2.67 |
| Single Male/Father | 356 (3.1%) | 2.67 |
| Single Female/Mother | 1,215 (10.7%) | 2.87 |
| Non-family | 3,453 (30.5%) | 1.15 |
| Total Households | 11,327 (100.0%) | 2.23 |
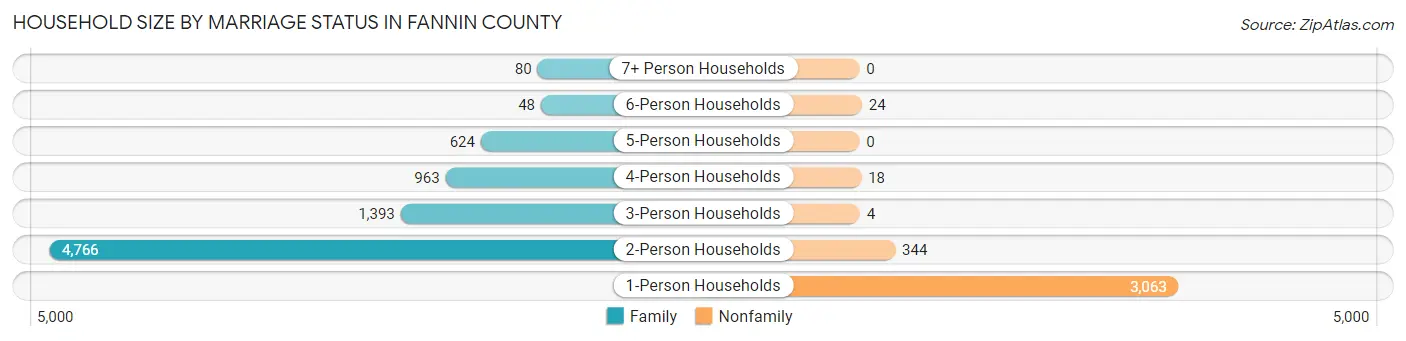
Household Size by Marriage Status in Fannin County
Out of a total of 11,327 households in Fannin County, 7,874 (69.5%) are family households, while 3,453 (30.5%) are nonfamily households. The most numerous type of family households are 2-person households, comprising 4,766, and the most common type of nonfamily households are 1-person households, comprising 3,063.
| Household Size | Family Households | Nonfamily Households |
| 1-Person Households | - | 3,063 (27.0%) |
| 2-Person Households | 4,766 (42.1%) | 344 (3.0%) |
| 3-Person Households | 1,393 (12.3%) | 4 (0.0%) |
| 4-Person Households | 963 (8.5%) | 18 (0.2%) |
| 5-Person Households | 624 (5.5%) | 0 (0.0%) |
| 6-Person Households | 48 (0.4%) | 24 (0.2%) |
| 7+ Person Households | 80 (0.7%) | 0 (0.0%) |
| Total | 7,874 (69.5%) | 3,453 (30.5%) |
Female Fertility in Fannin County
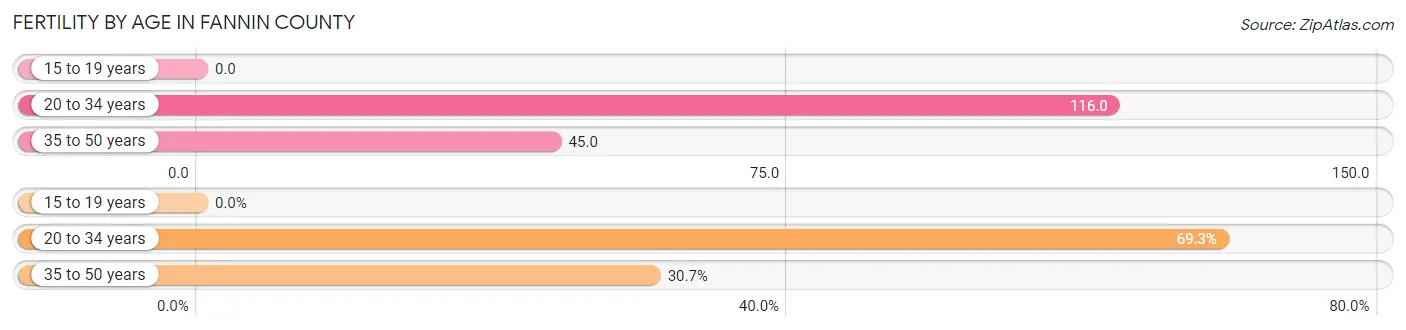
Fertility by Age in Fannin County
Average fertility rate in Fannin County is 70.0 births per 1,000 women. Women in the age bracket of 20 to 34 years have the highest fertility rate with 116.0 births per 1,000 women. Women in the age bracket of 20 to 34 years acount for 69.3% of all women with births.
| Age Bracket | Women with Births | Births / 1,000 Women |
| 15 to 19 years | 0 (0.0%) | 0.0 |
| 20 to 34 years | 212 (69.3%) | 116.0 |
| 35 to 50 years | 94 (30.7%) | 45.0 |
| Total | 306 (100.0%) | 70.0 |
Fertility by Age by Marriage Status in Fannin County
69.3% of women with births (306) in Fannin County are married. The highest percentage of unmarried women with births falls into 35 to 50 years age bracket with 100.0% of them unmarried at the time of birth, while the lowest percentage of unmarried women with births belong to 20 to 34 years age bracket with 0.0% of them unmarried.

| Age Bracket | Married | Unmarried |
| 15 to 19 years | 0 (0.0%) | 0 (0.0%) |
| 20 to 34 years | 212 (100.0%) | 0 (0.0%) |
| 35 to 50 years | 0 (0.0%) | 94 (100.0%) |
| Total | 212 (69.3%) | 94 (30.7%) |
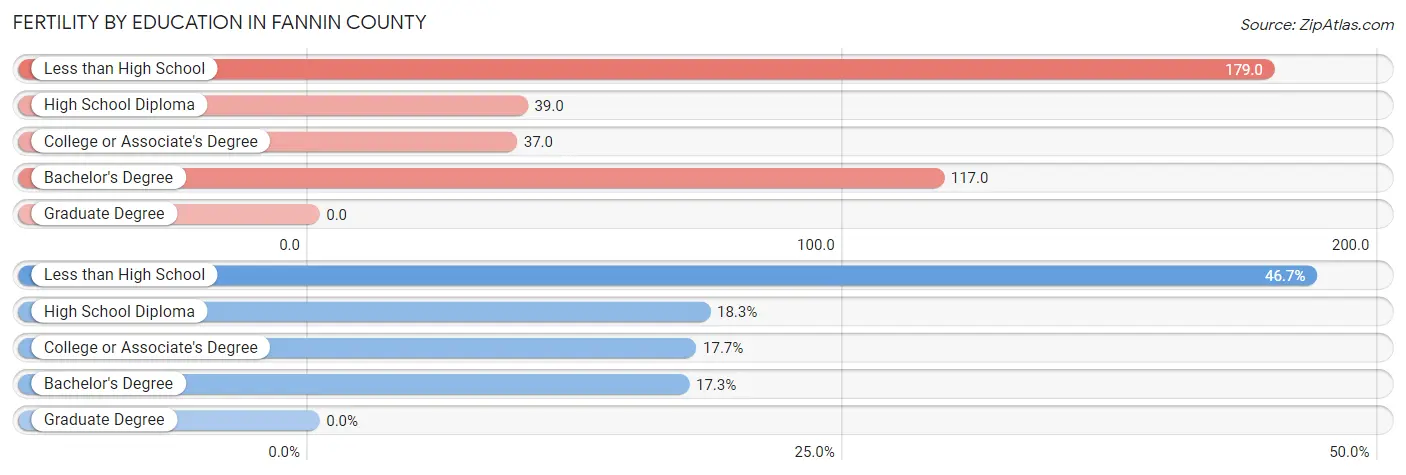
Fertility by Education in Fannin County
| Educational Attainment | Women with Births | Births / 1,000 Women |
| Less than High School | 143 (46.7%) | 179.0 |
| High School Diploma | 56 (18.3%) | 39.0 |
| College or Associate's Degree | 54 (17.6%) | 37.0 |
| Bachelor's Degree | 53 (17.3%) | 117.0 |
| Graduate Degree | 0 (0.0%) | 0.0 |
| Total | 306 (100.0%) | 70.0 |
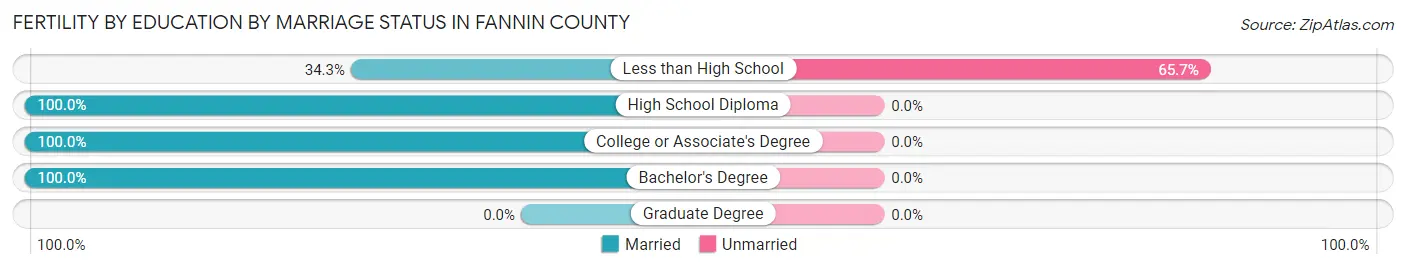
Fertility by Education by Marriage Status in Fannin County
30.7% of women with births in Fannin County are unmarried. Women with the educational attainment of high school diploma are most likely to be married with 100.0% of them married at childbirth, while women with the educational attainment of less than high school are least likely to be married with 65.7% of them unmarried at childbirth.
| Educational Attainment | Married | Unmarried |
| Less than High School | 49 (34.3%) | 94 (65.7%) |
| High School Diploma | 56 (100.0%) | 0 (0.0%) |
| College or Associate's Degree | 54 (100.0%) | 0 (0.0%) |
| Bachelor's Degree | 53 (100.0%) | 0 (0.0%) |
| Graduate Degree | 0 (0.0%) | 0 (0.0%) |
| Total | 212 (69.3%) | 94 (30.7%) |
Income in Fannin County
Income Overview in Fannin County
Per Capita Income in Fannin County is $36,058, while median incomes of families and households are $61,406 and $54,857 respectively.
| Characteristic | Number | Measure |
| Per Capita Income | 25,436 | $36,058 |
| Median Family Income | 7,874 | $61,406 |
| Mean Family Income | 7,874 | $87,581 |
| Median Household Income | 11,327 | $54,857 |
| Mean Household Income | 11,327 | $80,336 |
| Income Deficit | 7,874 | $10,951 |
| Wage / Income Gap (%) | 25,436 | 38.31% |
| Wage / Income Gap ($) | 25,436 | 61.69¢ per $1 |
| Gini / Inequality Index | 25,436 | 0.49 |
Earnings by Sex in Fannin County
Average Earnings in Fannin County are $31,991, $42,884 for men and $26,457 for women, a difference of 38.3%.

| Sex | Number | Average Earnings |
| Male | 6,026 (53.5%) | $42,884 |
| Female | 5,228 (46.5%) | $26,457 |
| Total | 11,254 (100.0%) | $31,991 |
Earnings by Sex by Income Bracket in Fannin County
The most common earnings brackets in Fannin County are $100,000+ for men (676 | 11.2%) and $25,000 to $29,999 for women (527 | 10.1%).

| Income | Male | Female |
| $2,499 or less | 218 (3.6%) | 462 (8.8%) |
| $2,500 to $4,999 | 91 (1.5%) | 176 (3.4%) |
| $5,000 to $7,499 | 267 (4.4%) | 296 (5.7%) |
| $7,500 to $9,999 | 133 (2.2%) | 191 (3.6%) |
| $10,000 to $12,499 | 349 (5.8%) | 346 (6.6%) |
| $12,500 to $14,999 | 181 (3.0%) | 183 (3.5%) |
| $15,000 to $17,499 | 140 (2.3%) | 221 (4.2%) |
| $17,500 to $19,999 | 102 (1.7%) | 235 (4.5%) |
| $20,000 to $22,499 | 71 (1.2%) | 135 (2.6%) |
| $22,500 to $24,999 | 205 (3.4%) | 239 (4.6%) |
| $25,000 to $29,999 | 515 (8.6%) | 527 (10.1%) |
| $30,000 to $34,999 | 369 (6.1%) | 332 (6.4%) |
| $35,000 to $39,999 | 174 (2.9%) | 389 (7.4%) |
| $40,000 to $44,999 | 358 (5.9%) | 237 (4.5%) |
| $45,000 to $49,999 | 415 (6.9%) | 276 (5.3%) |
| $50,000 to $54,999 | 350 (5.8%) | 147 (2.8%) |
| $55,000 to $64,999 | 510 (8.5%) | 137 (2.6%) |
| $65,000 to $74,999 | 471 (7.8%) | 112 (2.1%) |
| $75,000 to $99,999 | 431 (7.1%) | 220 (4.2%) |
| $100,000+ | 676 (11.2%) | 367 (7.0%) |
| Total | 6,026 (100.0%) | 5,228 (100.0%) |
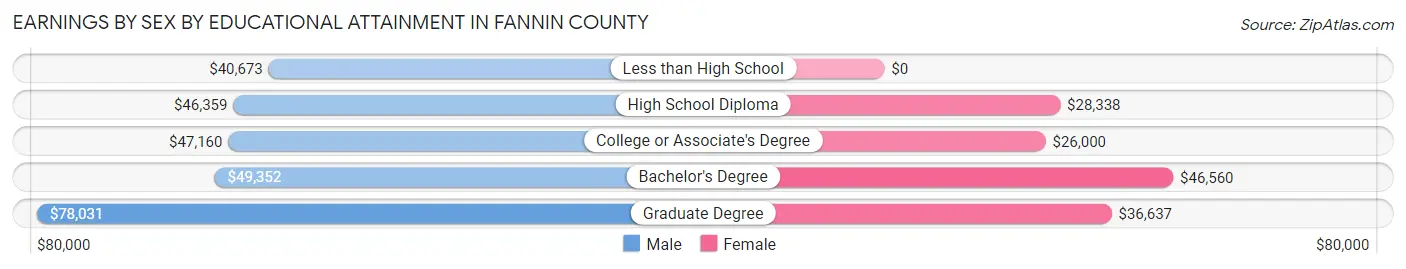
Earnings by Sex by Educational Attainment in Fannin County
Average earnings in Fannin County are $46,730 for men and $29,213 for women, a difference of 37.5%. Men with an educational attainment of graduate degree enjoy the highest average annual earnings of $78,031, while those with less than high school education earn the least with $40,673. Women with an educational attainment of bachelor's degree earn the most with the average annual earnings of $46,560, while those with college or associate's degree education have the smallest earnings of $26,000.
| Educational Attainment | Male Income | Female Income |
| Less than High School | $40,673 | $0 |
| High School Diploma | $46,359 | $28,338 |
| College or Associate's Degree | $47,160 | $26,000 |
| Bachelor's Degree | $49,352 | $46,560 |
| Graduate Degree | $78,031 | $36,637 |
| Total | $46,730 | $29,213 |
Family Income in Fannin County
Family Income Brackets in Fannin County
According to the Fannin County family income data, there are 1,787 families falling into the $50,000 to $74,999 income range, which is the most common income bracket and makes up 22.7% of all families. Conversely, the $10,000 to $14,999 income bracket is the least frequent group with only 110 families (1.4%) belonging to this category.
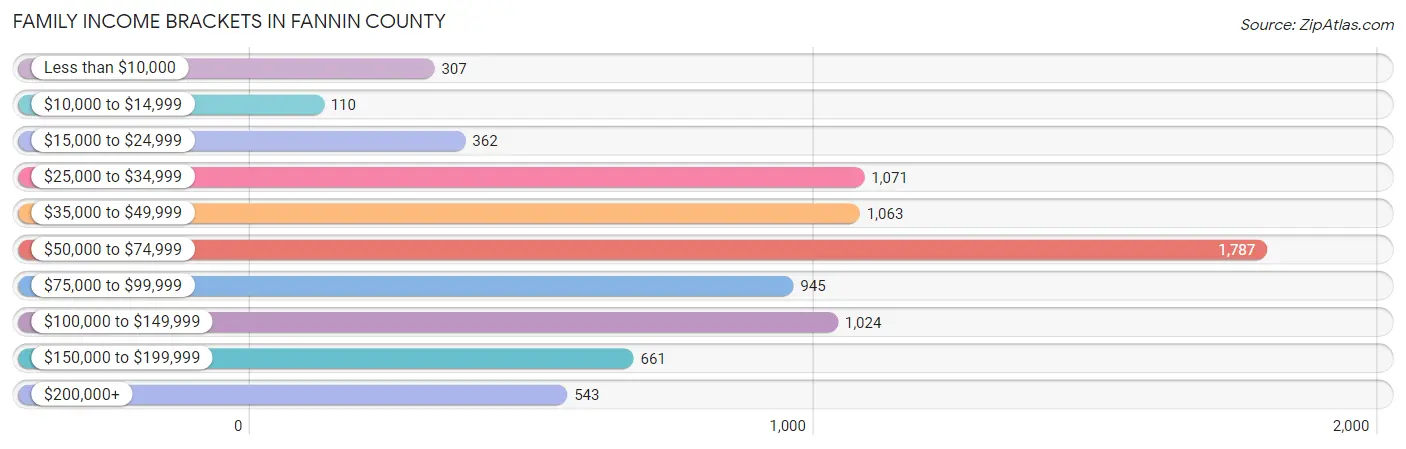
| Income Bracket | # Families | % Families |
| Less than $10,000 | 307 | 3.9% |
| $10,000 to $14,999 | 110 | 1.4% |
| $15,000 to $24,999 | 362 | 4.6% |
| $25,000 to $34,999 | 1,071 | 13.6% |
| $35,000 to $49,999 | 1,063 | 13.5% |
| $50,000 to $74,999 | 1,787 | 22.7% |
| $75,000 to $99,999 | 945 | 12.0% |
| $100,000 to $149,999 | 1,024 | 13.0% |
| $150,000 to $199,999 | 661 | 8.4% |
| $200,000+ | 543 | 6.9% |
Family Income by Famaliy Size in Fannin County
7+ person families (80 | 1.0%) account for the highest median family income in Fannin County with $71,250 per family, while 2-person families (4,865 | 61.8%) have the highest median income of $30,118 per family member.
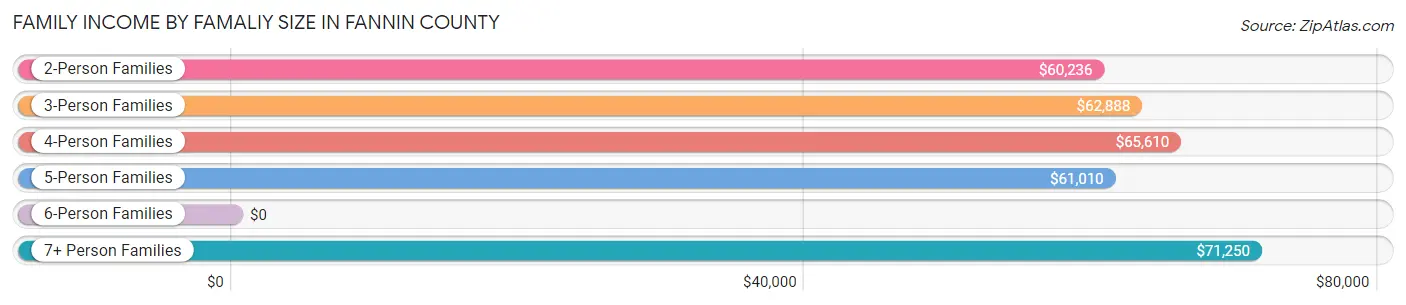
| Income Bracket | # Families | Median Income |
| 2-Person Families | 4,865 (61.8%) | $60,236 |
| 3-Person Families | 1,399 (17.8%) | $62,888 |
| 4-Person Families | 931 (11.8%) | $65,610 |
| 5-Person Families | 557 (7.1%) | $61,010 |
| 6-Person Families | 42 (0.5%) | $0 |
| 7+ Person Families | 80 (1.0%) | $71,250 |
| Total | 7,874 (100.0%) | $61,406 |
Family Income by Number of Earners in Fannin County
The median family income in Fannin County is $61,406, with families comprising 2 earners (2,308) having the highest median family income of $89,327, while families with no earners (2,382) have the lowest median family income of $39,947, accounting for 29.3% and 30.2% of families, respectively.

| Number of Earners | # Families | Median Income |
| No Earners | 2,382 (30.2%) | $39,947 |
| 1 Earner | 2,635 (33.5%) | $52,973 |
| 2 Earners | 2,308 (29.3%) | $89,327 |
| 3+ Earners | 549 (7.0%) | $69,458 |
| Total | 7,874 (100.0%) | $61,406 |
Household Income in Fannin County
Household Income Brackets in Fannin County
With 2,617 households falling in the category, the $50,000 to $74,999 income range is the most frequent in Fannin County, accounting for 23.1% of all households. In contrast, only 555 households (4.9%) fall into the $10,000 to $14,999 income bracket, making it the least populous group.
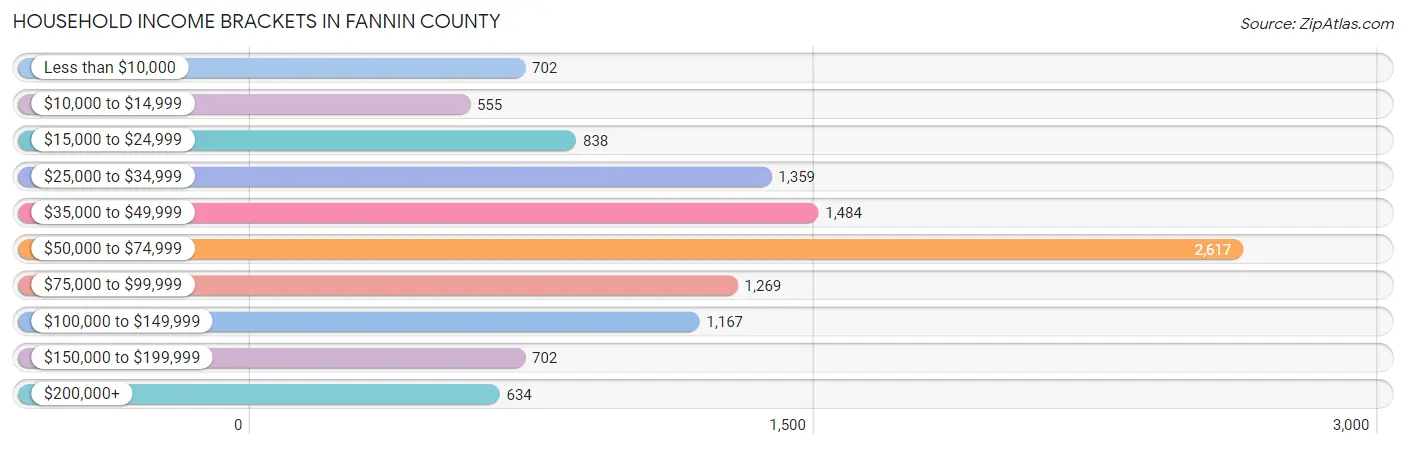
| Income Bracket | # Households | % Households |
| Less than $10,000 | 702 | 6.2% |
| $10,000 to $14,999 | 555 | 4.9% |
| $15,000 to $24,999 | 838 | 7.4% |
| $25,000 to $34,999 | 1,359 | 12.0% |
| $35,000 to $49,999 | 1,484 | 13.1% |
| $50,000 to $74,999 | 2,617 | 23.1% |
| $75,000 to $99,999 | 1,269 | 11.2% |
| $100,000 to $149,999 | 1,167 | 10.3% |
| $150,000 to $199,999 | 702 | 6.2% |
| $200,000+ | 634 | 5.6% |
Household Income by Householder Age in Fannin County
The median household income in Fannin County is $54,857, with the highest median household income of $65,574 found in the 45 to 64 years age bracket for the primary householder. A total of 4,397 households (38.8%) fall into this category. Meanwhile, the 15 to 24 years age bracket for the primary householder has the lowest median household income of $33,229, with 179 households (1.6%) in this group.
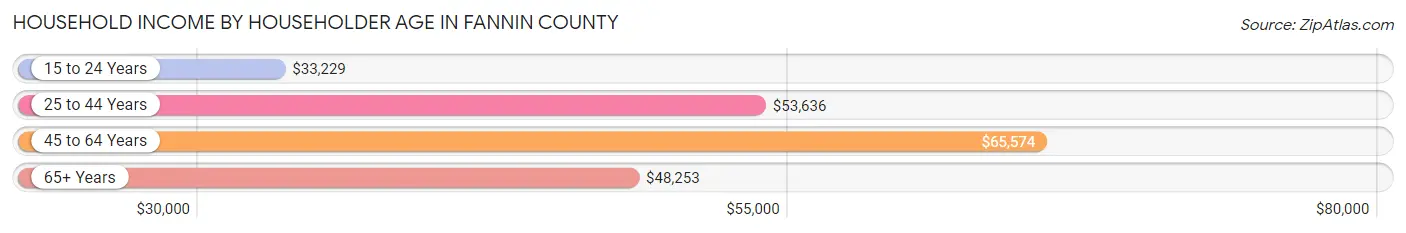
| Income Bracket | # Households | Median Income |
| 15 to 24 Years | 179 (1.6%) | $33,229 |
| 25 to 44 Years | 2,228 (19.7%) | $53,636 |
| 45 to 64 Years | 4,397 (38.8%) | $65,574 |
| 65+ Years | 4,523 (39.9%) | $48,253 |
| Total | 11,327 (100.0%) | $54,857 |
Poverty in Fannin County
Income Below Poverty by Sex and Age in Fannin County
With 10.0% poverty level for males and 13.5% for females among the residents of Fannin County, 6 to 11 year old males and 15 year old females are the most vulnerable to poverty, with 154 males (24.8%) and 41 females (62.1%) in their respective age groups living below the poverty level.

| Age Bracket | Male | Female |
| Under 5 Years | 56 (10.6%) | 123 (26.6%) |
| 5 Years | 14 (9.9%) | 0 (0.0%) |
| 6 to 11 Years | 154 (24.8%) | 88 (13.7%) |
| 12 to 14 Years | 87 (21.0%) | 34 (13.8%) |
| 15 Years | 23 (15.9%) | 41 (62.1%) |
| 16 and 17 Years | 9 (3.8%) | 94 (29.6%) |
| 18 to 24 Years | 132 (16.9%) | 121 (15.8%) |
| 25 to 34 Years | 104 (9.5%) | 84 (7.3%) |
| 35 to 44 Years | 145 (12.7%) | 339 (28.5%) |
| 45 to 54 Years | 128 (8.7%) | 54 (3.6%) |
| 55 to 64 Years | 132 (5.7%) | 250 (10.5%) |
| 65 to 74 Years | 101 (4.6%) | 212 (8.9%) |
| 75 Years and over | 152 (11.5%) | 296 (18.6%) |
| Total | 1,237 (10.0%) | 1,736 (13.5%) |
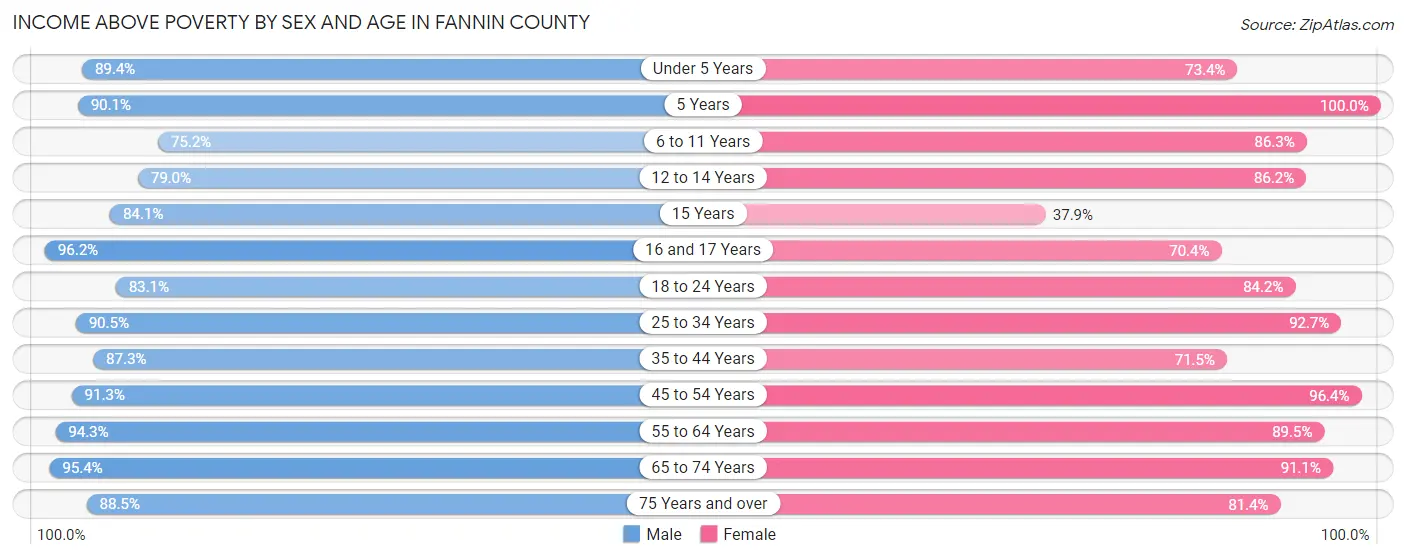
Income Above Poverty by Sex and Age in Fannin County
According to the poverty statistics in Fannin County, males aged 16 and 17 years and females aged 5 years are the age groups that are most secure financially, with 96.2% of males and 100.0% of females in these age groups living above the poverty line.
| Age Bracket | Male | Female |
| Under 5 Years | 470 (89.3%) | 340 (73.4%) |
| 5 Years | 128 (90.1%) | 163 (100.0%) |
| 6 to 11 Years | 468 (75.2%) | 553 (86.3%) |
| 12 to 14 Years | 327 (79.0%) | 212 (86.2%) |
| 15 Years | 122 (84.1%) | 25 (37.9%) |
| 16 and 17 Years | 229 (96.2%) | 224 (70.4%) |
| 18 to 24 Years | 648 (83.1%) | 643 (84.2%) |
| 25 to 34 Years | 991 (90.5%) | 1,065 (92.7%) |
| 35 to 44 Years | 994 (87.3%) | 849 (71.5%) |
| 45 to 54 Years | 1,339 (91.3%) | 1,453 (96.4%) |
| 55 to 64 Years | 2,175 (94.3%) | 2,139 (89.5%) |
| 65 to 74 Years | 2,088 (95.4%) | 2,178 (91.1%) |
| 75 Years and over | 1,167 (88.5%) | 1,296 (81.4%) |
| Total | 11,146 (90.0%) | 11,140 (86.5%) |
Income Below Poverty Among Married-Couple Families in Fannin County
The poverty statistics for married-couple families in Fannin County show that 5.1% or 320 of the total 6,303 families live below the poverty line. Families with 5 or more children have the highest poverty rate of 33.3%, comprising of 10 families. On the other hand, families with 1 or 2 children have the lowest poverty rate of 0.6%, which includes 8 families.

| Children | Above Poverty | Below Poverty |
| No Children | 4,414 (93.7%) | 298 (6.3%) |
| 1 or 2 Children | 1,260 (99.4%) | 8 (0.6%) |
| 3 or 4 Children | 289 (98.6%) | 4 (1.4%) |
| 5 or more Children | 20 (66.7%) | 10 (33.3%) |
| Total | 5,983 (94.9%) | 320 (5.1%) |
Income Below Poverty Among Single-Parent Households in Fannin County
According to the poverty data in Fannin County, 12.9% or 46 single-father households and 24.9% or 303 single-mother households are living below the poverty line. Among single-father households, those with 1 or 2 children have the highest poverty rate, with 44 households (24.6%) experiencing poverty. Likewise, among single-mother households, those with 1 or 2 children have the highest poverty rate, with 252 households (44.4%) falling below the poverty line.

| Children | Single Father | Single Mother |
| No Children | 0 (0.0%) | 3 (0.6%) |
| 1 or 2 Children | 44 (24.6%) | 252 (44.4%) |
| 3 or 4 Children | 2 (9.1%) | 48 (30.4%) |
| 5 or more Children | 0 (0.0%) | 0 (0.0%) |
| Total | 46 (12.9%) | 303 (24.9%) |
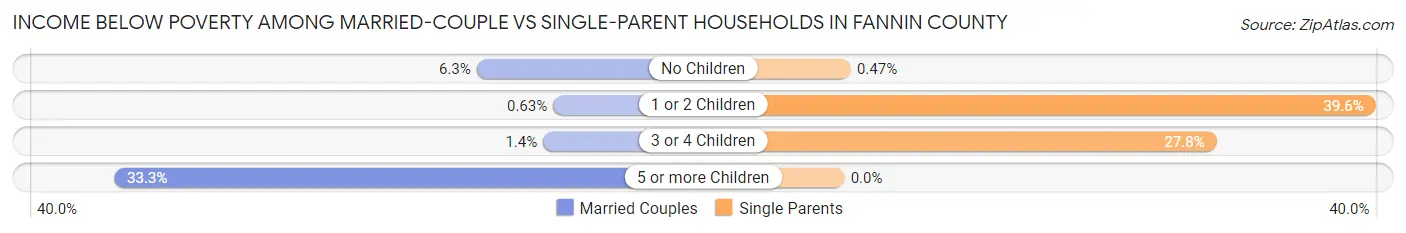
Income Below Poverty Among Married-Couple vs Single-Parent Households in Fannin County
The poverty data for Fannin County shows that 320 of the married-couple family households (5.1%) and 349 of the single-parent households (22.2%) are living below the poverty level. Within the married-couple family households, those with 5 or more children have the highest poverty rate, with 10 households (33.3%) falling below the poverty line. Among the single-parent households, those with 1 or 2 children have the highest poverty rate, with 296 household (39.6%) living below poverty.
| Children | Married-Couple Families | Single-Parent Households |
| No Children | 298 (6.3%) | 3 (0.5%) |
| 1 or 2 Children | 8 (0.6%) | 296 (39.6%) |
| 3 or 4 Children | 4 (1.4%) | 50 (27.8%) |
| 5 or more Children | 10 (33.3%) | 0 (0.0%) |
| Total | 320 (5.1%) | 349 (22.2%) |
Employment Characteristics in Fannin County
Employment by Class of Employer in Fannin County
Among the 9,711 employed individuals in Fannin County, private company employees (6,114 | 63.0%), self-employed (not incorporated) (1,110 | 11.4%), and self-employed (incorporated) (818 | 8.4%) make up the most common classes of employment.

| Employer Class | # Employees | % Employees |
| Private Company Employees | 6,114 | 63.0% |
| Self-Employed (Incorporated) | 818 | 8.4% |
| Self-Employed (Not Incorporated) | 1,110 | 11.4% |
| Not-for-profit Organizations | 479 | 4.9% |
| Local Government Employees | 662 | 6.8% |
| State Government Employees | 358 | 3.7% |
| Federal Government Employees | 170 | 1.8% |
| Unpaid Family Workers | 0 | 0.0% |
| Total | 9,711 | 100.0% |
Employment Status by Age in Fannin County
According to the labor force statistics for Fannin County, out of the total population over 16 years of age (21,971), 48.1% or 10,568 individuals are in the labor force, with 5.4% or 571 of them unemployed. The age group with the highest labor force participation rate is 25 to 29 years, with 87.7% or 1,013 individuals in the labor force. Within the labor force, the 16 to 19 years age range has the highest percentage of unemployed individuals, with 31.5% or 94 of them being unemployed.

| Age Bracket | In Labor Force | Unemployed |
| 16 to 19 Years | 298 (36.8%) | 94 (31.5%) |
| 20 to 24 Years | 1,011 (77.5%) | 71 (7.0%) |
| 25 to 29 Years | 1,013 (87.7%) | 0 (0.0%) |
| 30 to 34 Years | 859 (76.9%) | 52 (6.1%) |
| 35 to 44 Years | 1,776 (76.3%) | 149 (8.4%) |
| 45 to 54 Years | 2,317 (77.6%) | 37 (1.6%) |
| 55 to 59 Years | 1,445 (58.9%) | 142 (9.8%) |
| 60 to 64 Years | 968 (43.0%) | 13 (1.3%) |
| 65 to 74 Years | 748 (16.3%) | 13 (1.7%) |
| 75 Years and over | 128 (4.3%) | 5 (3.9%) |
| Total | 10,568 (48.1%) | 571 (5.4%) |
Employment Status by Educational Attainment in Fannin County
According to labor force statistics for Fannin County, 68.2% of individuals (8,381) out of the total population between 25 and 64 years of age (12,289) are in the labor force, with 4.7% or 394 of them being unemployed. The group with the highest labor force participation rate are those with the educational attainment of bachelor's degree or higher, with 72.6% or 1,839 individuals in the labor force. Within the labor force, individuals with college / associate degree education have the highest percentage of unemployment, with 6.7% or 188 of them being unemployed.

| Educational Attainment | In Labor Force | Unemployed |
| Less than High School | 653 (48.6%) | 70 (5.2%) |
| High School Diploma | 3,084 (68.4%) | 176 (3.9%) |
| College / Associate Degree | 2,802 (71.8%) | 262 (6.7%) |
| Bachelor's Degree or higher | 1,839 (72.6%) | 71 (2.8%) |
| Total | 8,381 (68.2%) | 578 (4.7%) |
Employment Occupations by Sex in Fannin County
Management, Business, Science and Arts Occupations
The most common Management, Business, Science and Arts occupations in Fannin County are Management (1,095 | 11.0%), Community & Social Service (1,074 | 10.8%), Education Instruction & Library (577 | 5.8%), Business & Financial (454 | 4.5%), and Health Diagnosing & Treating (415 | 4.2%).

Management, Business, Science and Arts Occupations by Sex
Within the Management, Business, Science and Arts occupations in Fannin County, the most male-oriented occupations are Architecture & Engineering (100.0%), Life, Physical & Social Science (100.0%), and Management (71.5%), while the most female-oriented occupations are Legal Services & Support (100.0%), Health Technologists (77.5%), and Education Instruction & Library (77.1%).

| Occupation | Male | Female |
| Management | 783 (71.5%) | 312 (28.5%) |
| Business & Financial | 252 (55.5%) | 202 (44.5%) |
| Computers, Engineering & Science | 134 (69.1%) | 60 (30.9%) |
| Computers & Mathematics | 72 (54.5%) | 60 (45.5%) |
| Architecture & Engineering | 58 (100.0%) | 0 (0.0%) |
| Life, Physical & Social Science | 4 (100.0%) | 0 (0.0%) |
| Community & Social Service | 331 (30.8%) | 743 (69.2%) |
| Education, Arts & Media | 94 (43.5%) | 122 (56.5%) |
| Legal Services & Support | 0 (0.0%) | 29 (100.0%) |
| Education Instruction & Library | 132 (22.9%) | 445 (77.1%) |
| Arts, Media & Entertainment | 105 (41.7%) | 147 (58.3%) |
| Health Diagnosing & Treating | 99 (23.9%) | 316 (76.1%) |
| Health Technologists | 65 (22.5%) | 224 (77.5%) |
| Total (Category) | 1,599 (49.5%) | 1,633 (50.5%) |
| Total (Overall) | 5,420 (54.3%) | 4,559 (45.7%) |
Services Occupations
The most common Services occupations in Fannin County are Food Preparation & Serving (735 | 7.4%), Cleaning & Maintenance (529 | 5.3%), Personal Care & Service (342 | 3.4%), Healthcare Support (297 | 3.0%), and Security & Protection (213 | 2.1%).

Services Occupations by Sex
Within the Services occupations in Fannin County, the most male-oriented occupations are Firefighting & Prevention (74.3%), Security & Protection (72.3%), and Law Enforcement (65.2%), while the most female-oriented occupations are Healthcare Support (84.5%), Personal Care & Service (71.4%), and Food Preparation & Serving (52.8%).

| Occupation | Male | Female |
| Healthcare Support | 46 (15.5%) | 251 (84.5%) |
| Security & Protection | 154 (72.3%) | 59 (27.7%) |
| Firefighting & Prevention | 124 (74.3%) | 43 (25.8%) |
| Law Enforcement | 30 (65.2%) | 16 (34.8%) |
| Food Preparation & Serving | 347 (47.2%) | 388 (52.8%) |
| Cleaning & Maintenance | 289 (54.6%) | 240 (45.4%) |
| Personal Care & Service | 98 (28.6%) | 244 (71.4%) |
| Total (Category) | 934 (44.1%) | 1,182 (55.9%) |
| Total (Overall) | 5,420 (54.3%) | 4,559 (45.7%) |
Sales and Office Occupations
The most common Sales and Office occupations in Fannin County are Office & Administration (1,128 | 11.3%), and Sales & Related (1,021 | 10.2%).

Sales and Office Occupations by Sex

| Occupation | Male | Female |
| Sales & Related | 468 (45.8%) | 553 (54.2%) |
| Office & Administration | 196 (17.4%) | 932 (82.6%) |
| Total (Category) | 664 (30.9%) | 1,485 (69.1%) |
| Total (Overall) | 5,420 (54.3%) | 4,559 (45.7%) |
Natural Resources, Construction and Maintenance Occupations
The most common Natural Resources, Construction and Maintenance occupations in Fannin County are Construction & Extraction (780 | 7.8%), and Installation, Maintenance & Repair (286 | 2.9%).
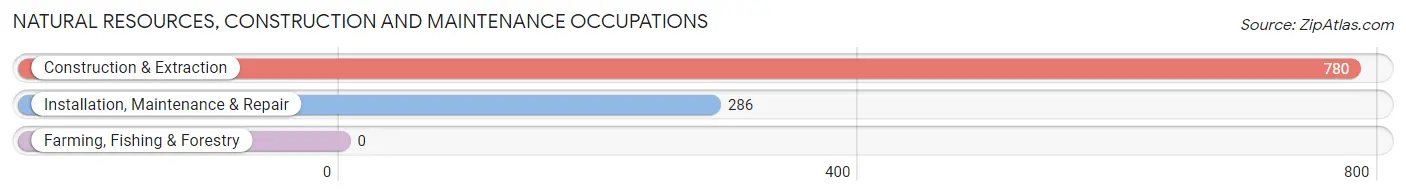
Natural Resources, Construction and Maintenance Occupations by Sex

| Occupation | Male | Female |
| Farming, Fishing & Forestry | 0 (0.0%) | 0 (0.0%) |
| Construction & Extraction | 779 (99.9%) | 1 (0.1%) |
| Installation, Maintenance & Repair | 286 (100.0%) | 0 (0.0%) |
| Total (Category) | 1,065 (99.9%) | 1 (0.1%) |
| Total (Overall) | 5,420 (54.3%) | 4,559 (45.7%) |
Production, Transportation and Moving Occupations
The most common Production, Transportation and Moving occupations in Fannin County are Production (768 | 7.7%), Transportation (344 | 3.5%), and Material Moving (304 | 3.0%).

Production, Transportation and Moving Occupations by Sex

| Occupation | Male | Female |
| Production | 524 (68.2%) | 244 (31.8%) |
| Transportation | 331 (96.2%) | 13 (3.8%) |
| Material Moving | 303 (99.7%) | 1 (0.3%) |
| Total (Category) | 1,158 (81.8%) | 258 (18.2%) |
| Total (Overall) | 5,420 (54.3%) | 4,559 (45.7%) |
Employment Industries by Sex in Fannin County
Employment Industries in Fannin County
The major employment industries in Fannin County include Retail Trade (1,192 | 11.9%), Construction (1,149 | 11.5%), Manufacturing (1,114 | 11.2%), Health Care & Social Assistance (954 | 9.6%), and Accommodation & Food Services (740 | 7.4%).
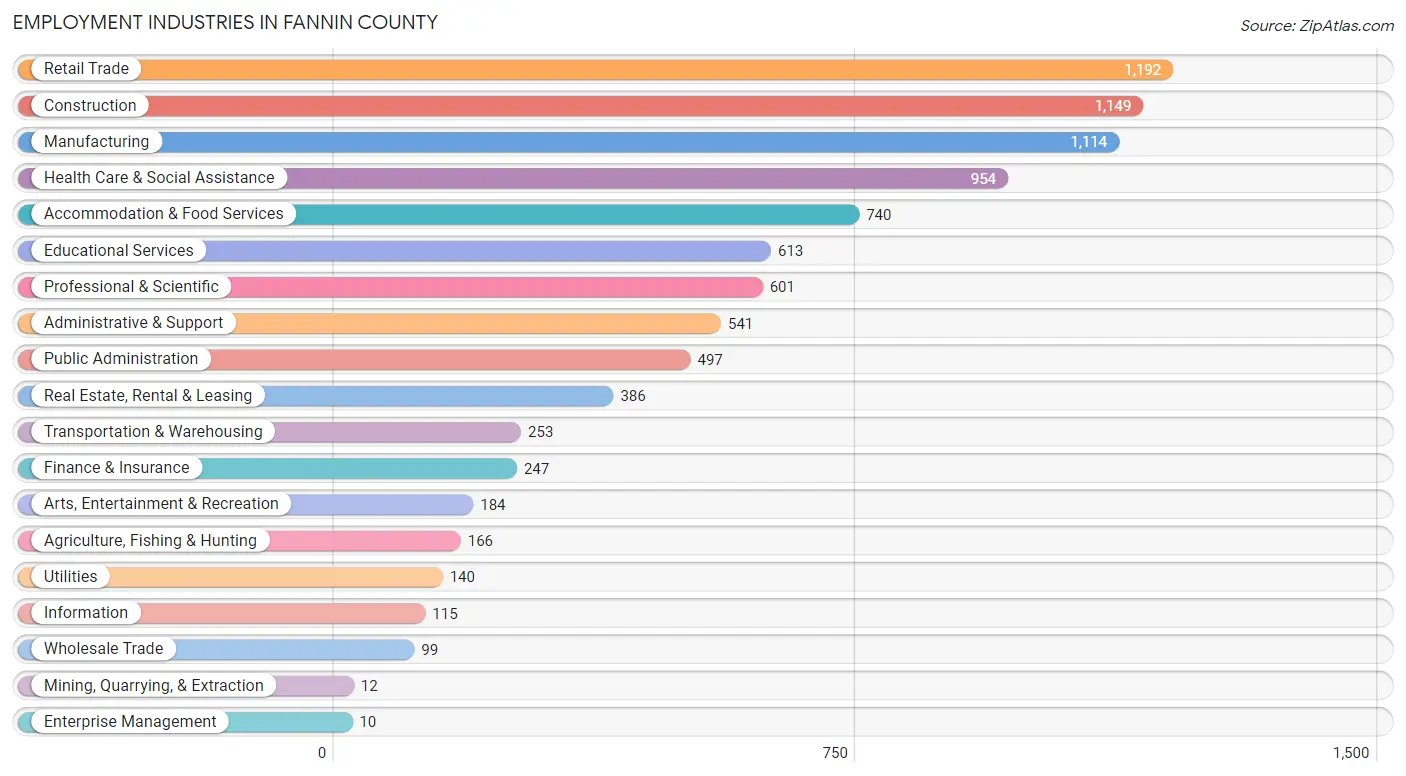
Employment Industries by Sex in Fannin County
The Fannin County industries that see more men than women are Mining, Quarrying, & Extraction (100.0%), Utilities (100.0%), and Construction (94.0%), whereas the industries that tend to have a higher number of women are Enterprise Management (100.0%), Information (87.8%), and Health Care & Social Assistance (87.7%).

| Industry | Male | Female |
| Agriculture, Fishing & Hunting | 94 (56.6%) | 72 (43.4%) |
| Mining, Quarrying, & Extraction | 12 (100.0%) | 0 (0.0%) |
| Construction | 1,080 (94.0%) | 69 (6.0%) |
| Manufacturing | 647 (58.1%) | 467 (41.9%) |
| Wholesale Trade | 74 (74.8%) | 25 (25.3%) |
| Retail Trade | 570 (47.8%) | 622 (52.2%) |
| Transportation & Warehousing | 228 (90.1%) | 25 (9.9%) |
| Utilities | 140 (100.0%) | 0 (0.0%) |
| Information | 14 (12.2%) | 101 (87.8%) |
| Finance & Insurance | 33 (13.4%) | 214 (86.6%) |
| Real Estate, Rental & Leasing | 194 (50.3%) | 192 (49.7%) |
| Professional & Scientific | 337 (56.1%) | 264 (43.9%) |
| Enterprise Management | 0 (0.0%) | 10 (100.0%) |
| Administrative & Support | 428 (79.1%) | 113 (20.9%) |
| Educational Services | 177 (28.9%) | 436 (71.1%) |
| Health Care & Social Assistance | 117 (12.3%) | 837 (87.7%) |
| Arts, Entertainment & Recreation | 84 (45.7%) | 100 (54.3%) |
| Accommodation & Food Services | 373 (50.4%) | 367 (49.6%) |
| Public Administration | 260 (52.3%) | 237 (47.7%) |
| Total | 5,420 (54.3%) | 4,559 (45.7%) |
Education in Fannin County
School Enrollment in Fannin County
The most common levels of schooling among the 3,770 students in Fannin County are middle school (1,052 | 27.9%), high school (857 | 22.7%), and elementary school (611 | 16.2%).

| School Level | # Students | % Students |
| Nursery / Preschool | 204 | 5.4% |
| Kindergarten | 386 | 10.2% |
| Elementary School | 611 | 16.2% |
| Middle School | 1,052 | 27.9% |
| High School | 857 | 22.7% |
| College / Undergraduate | 537 | 14.2% |
| Graduate / Professional | 123 | 3.3% |
| Total | 3,770 | 100.0% |
School Enrollment by Age by Funding Source in Fannin County
Out of a total of 3,770 students who are enrolled in schools in Fannin County, 841 (22.3%) attend a private institution, while the remaining 2,929 (77.7%) are enrolled in public schools. The age group of 3 to 4 year olds has the highest likelihood of being enrolled in private schools, with 101 (82.8% in the age bracket) enrolled. Conversely, the age group of 18 to 19 year olds has the lowest likelihood of being enrolled in a private school, with 125 (100.0% in the age bracket) attending a public institution.

| Age Bracket | Public School | Private School |
| 3 to 4 Year Olds | 21 (17.2%) | 101 (82.8%) |
| 5 to 9 Year Old | 765 (86.9%) | 115 (13.1%) |
| 10 to 14 Year Olds | 963 (79.3%) | 251 (20.7%) |
| 15 to 17 Year Olds | 546 (73.4%) | 198 (26.6%) |
| 18 to 19 Year Olds | 125 (100.0%) | 0 (0.0%) |
| 20 to 24 Year Olds | 241 (88.0%) | 33 (12.0%) |
| 25 to 34 Year Olds | 99 (65.6%) | 52 (34.4%) |
| 35 Years and over | 169 (65.0%) | 91 (35.0%) |
| Total | 2,929 (77.7%) | 841 (22.3%) |
Educational Attainment by Field of Study in Fannin County
Business (880 | 17.6%), science & technology (817 | 16.3%), education (806 | 16.1%), social sciences (445 | 8.9%), and psychology (301 | 6.0%) are the most common fields of study among 5,004 individuals in Fannin County who have obtained a bachelor's degree or higher.
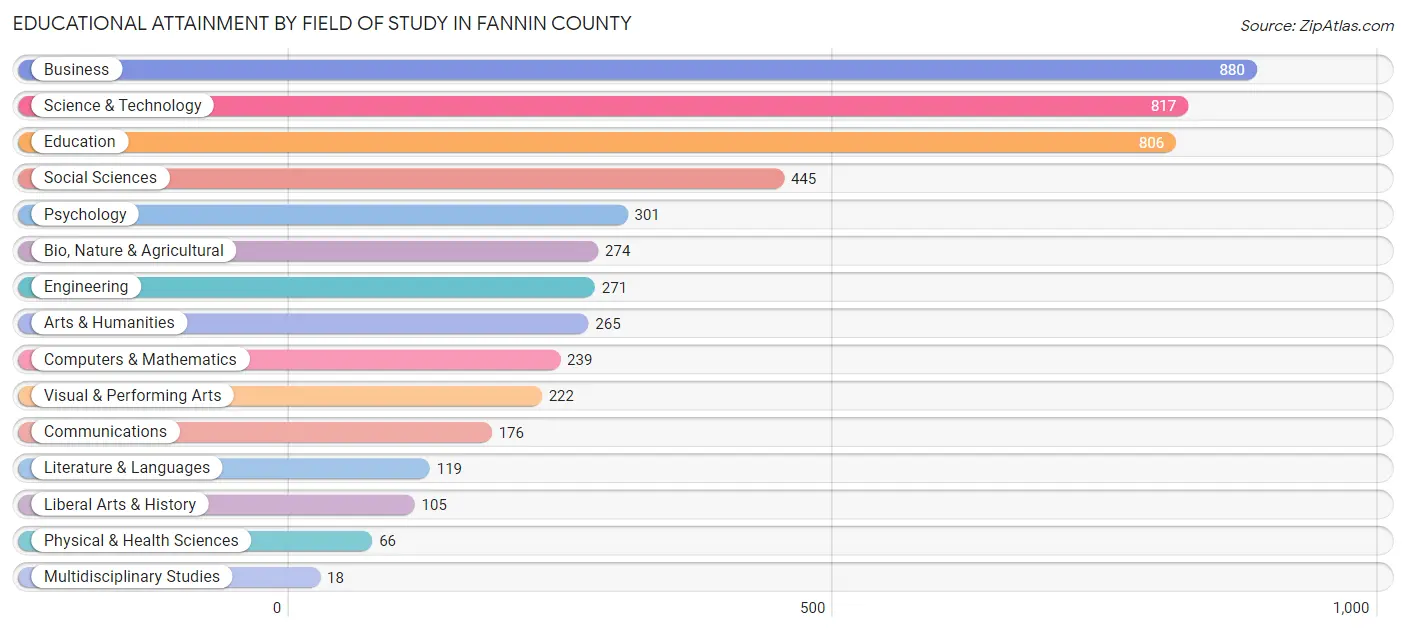
| Field of Study | # Graduates | % Graduates |
| Computers & Mathematics | 239 | 4.8% |
| Bio, Nature & Agricultural | 274 | 5.5% |
| Physical & Health Sciences | 66 | 1.3% |
| Psychology | 301 | 6.0% |
| Social Sciences | 445 | 8.9% |
| Engineering | 271 | 5.4% |
| Multidisciplinary Studies | 18 | 0.4% |
| Science & Technology | 817 | 16.3% |
| Business | 880 | 17.6% |
| Education | 806 | 16.1% |
| Literature & Languages | 119 | 2.4% |
| Liberal Arts & History | 105 | 2.1% |
| Visual & Performing Arts | 222 | 4.4% |
| Communications | 176 | 3.5% |
| Arts & Humanities | 265 | 5.3% |
| Total | 5,004 | 100.0% |
Transportation & Commute in Fannin County
Vehicle Availability by Sex in Fannin County
The most prevalent vehicle ownership categories in Fannin County are males with 2 vehicles (1,975, accounting for 37.4%) and females with 2 vehicles (1,683, making up 44.6%).

| Vehicles Available | Male | Female |
| No Vehicle | 137 (2.6%) | 37 (0.8%) |
| 1 Vehicle | 844 (16.0%) | 691 (15.6%) |
| 2 Vehicles | 1,975 (37.4%) | 1,683 (38.0%) |
| 3 Vehicles | 1,481 (28.1%) | 1,210 (27.3%) |
| 4 Vehicles | 489 (9.3%) | 507 (11.4%) |
| 5 or more Vehicles | 353 (6.7%) | 303 (6.8%) |
| Total | 5,279 (100.0%) | 4,431 (100.0%) |
Commute Time in Fannin County
The most frequently occuring commute durations in Fannin County are 15 to 19 minutes (1,722 commuters, 19.5%), 10 to 14 minutes (1,293 commuters, 14.7%), and 20 to 24 minutes (1,161 commuters, 13.2%).
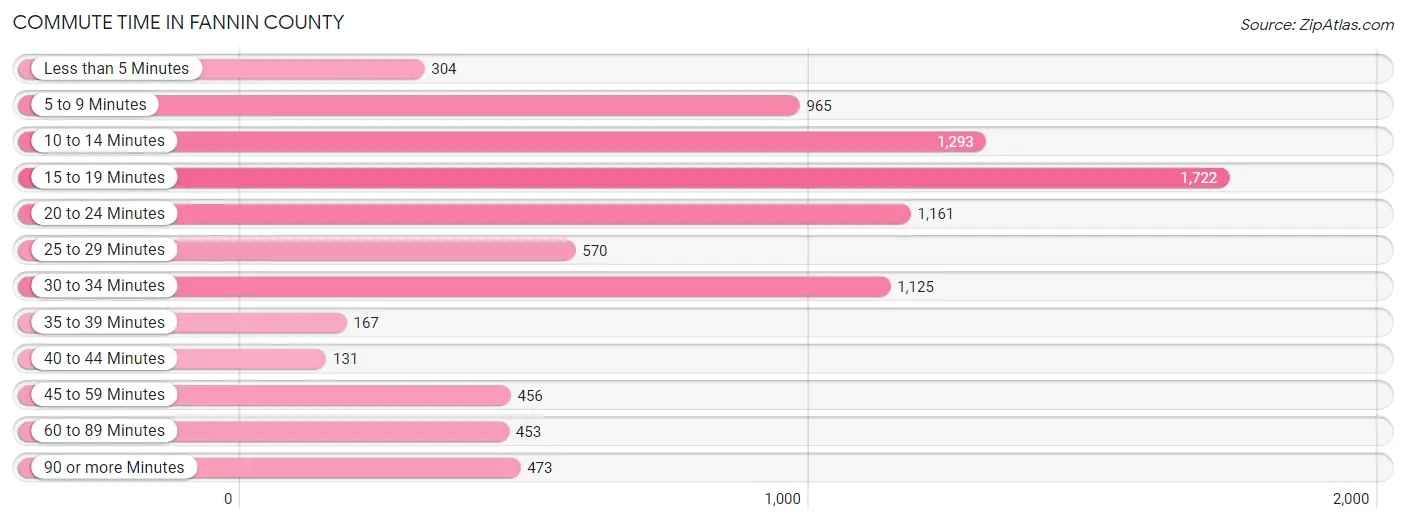
| Commute Time | # Commuters | % Commuters |
| Less than 5 Minutes | 304 | 3.5% |
| 5 to 9 Minutes | 965 | 10.9% |
| 10 to 14 Minutes | 1,293 | 14.7% |
| 15 to 19 Minutes | 1,722 | 19.5% |
| 20 to 24 Minutes | 1,161 | 13.2% |
| 25 to 29 Minutes | 570 | 6.5% |
| 30 to 34 Minutes | 1,125 | 12.8% |
| 35 to 39 Minutes | 167 | 1.9% |
| 40 to 44 Minutes | 131 | 1.5% |
| 45 to 59 Minutes | 456 | 5.2% |
| 60 to 89 Minutes | 453 | 5.1% |
| 90 or more Minutes | 473 | 5.4% |
Commute Time by Sex in Fannin County
The most common commute times in Fannin County are 15 to 19 minutes (823 commuters, 16.9%) for males and 15 to 19 minutes (899 commuters, 22.8%) for females.
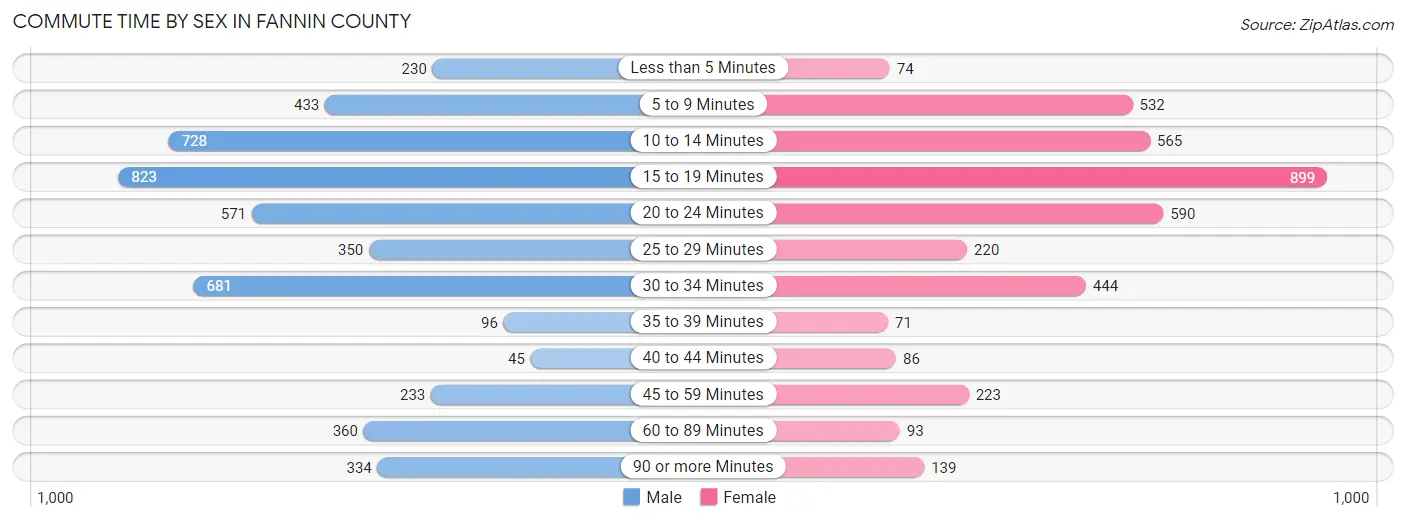
| Commute Time | Male | Female |
| Less than 5 Minutes | 230 (4.7%) | 74 (1.9%) |
| 5 to 9 Minutes | 433 (8.9%) | 532 (13.5%) |
| 10 to 14 Minutes | 728 (14.9%) | 565 (14.3%) |
| 15 to 19 Minutes | 823 (16.9%) | 899 (22.8%) |
| 20 to 24 Minutes | 571 (11.7%) | 590 (15.0%) |
| 25 to 29 Minutes | 350 (7.2%) | 220 (5.6%) |
| 30 to 34 Minutes | 681 (13.9%) | 444 (11.3%) |
| 35 to 39 Minutes | 96 (2.0%) | 71 (1.8%) |
| 40 to 44 Minutes | 45 (0.9%) | 86 (2.2%) |
| 45 to 59 Minutes | 233 (4.8%) | 223 (5.7%) |
| 60 to 89 Minutes | 360 (7.4%) | 93 (2.4%) |
| 90 or more Minutes | 334 (6.8%) | 139 (3.5%) |
Time of Departure to Work by Sex in Fannin County
The most frequent times of departure to work in Fannin County are 7:30 AM to 7:59 AM (759, 15.5%) for males and 7:30 AM to 7:59 AM (614, 15.6%) for females.
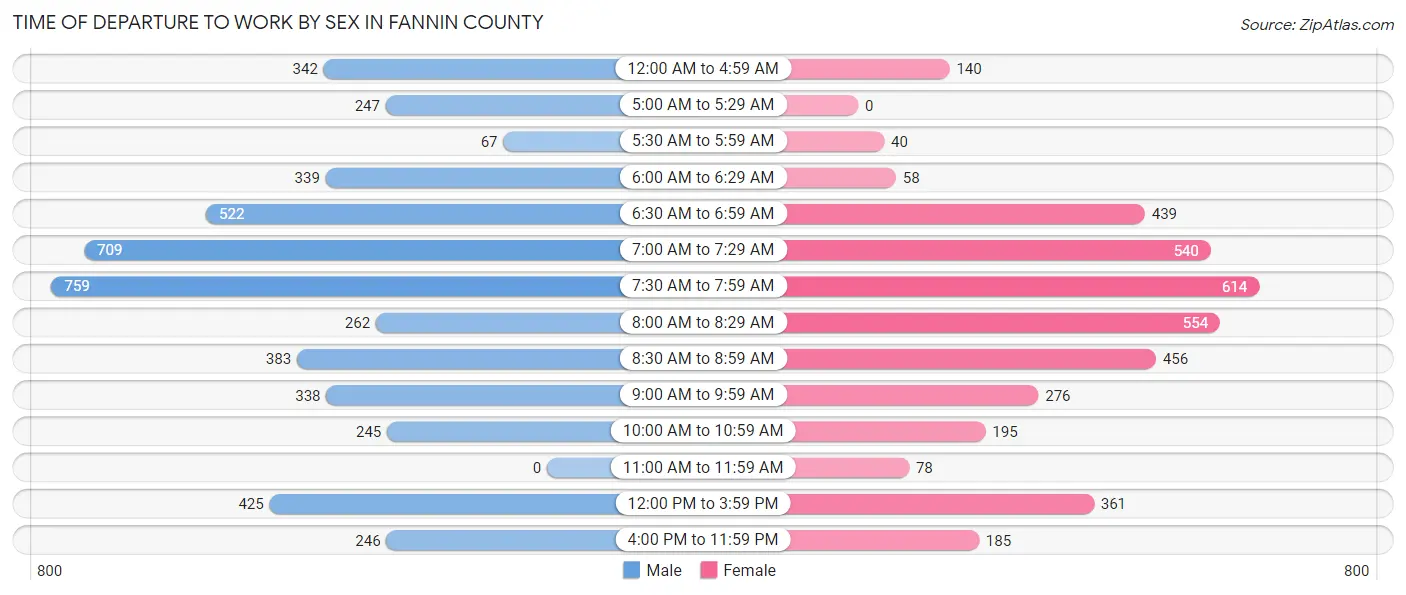
| Time of Departure | Male | Female |
| 12:00 AM to 4:59 AM | 342 (7.0%) | 140 (3.6%) |
| 5:00 AM to 5:29 AM | 247 (5.1%) | 0 (0.0%) |
| 5:30 AM to 5:59 AM | 67 (1.4%) | 40 (1.0%) |
| 6:00 AM to 6:29 AM | 339 (6.9%) | 58 (1.5%) |
| 6:30 AM to 6:59 AM | 522 (10.7%) | 439 (11.2%) |
| 7:00 AM to 7:29 AM | 709 (14.5%) | 540 (13.7%) |
| 7:30 AM to 7:59 AM | 759 (15.5%) | 614 (15.6%) |
| 8:00 AM to 8:29 AM | 262 (5.4%) | 554 (14.1%) |
| 8:30 AM to 8:59 AM | 383 (7.8%) | 456 (11.6%) |
| 9:00 AM to 9:59 AM | 338 (6.9%) | 276 (7.0%) |
| 10:00 AM to 10:59 AM | 245 (5.0%) | 195 (5.0%) |
| 11:00 AM to 11:59 AM | 0 (0.0%) | 78 (2.0%) |
| 12:00 PM to 3:59 PM | 425 (8.7%) | 361 (9.2%) |
| 4:00 PM to 11:59 PM | 246 (5.0%) | 185 (4.7%) |
| Total | 4,884 (100.0%) | 3,936 (100.0%) |
Housing Occupancy in Fannin County
Occupancy by Ownership in Fannin County
Of the total 11,327 dwellings in Fannin County, owner-occupied units account for 8,809 (77.8%), while renter-occupied units make up 2,518 (22.2%).

| Occupancy | # Housing Units | % Housing Units |
| Owner Occupied Housing Units | 8,809 | 77.8% |
| Renter-Occupied Housing Units | 2,518 | 22.2% |
| Total Occupied Housing Units | 11,327 | 100.0% |
Occupancy by Household Size in Fannin County
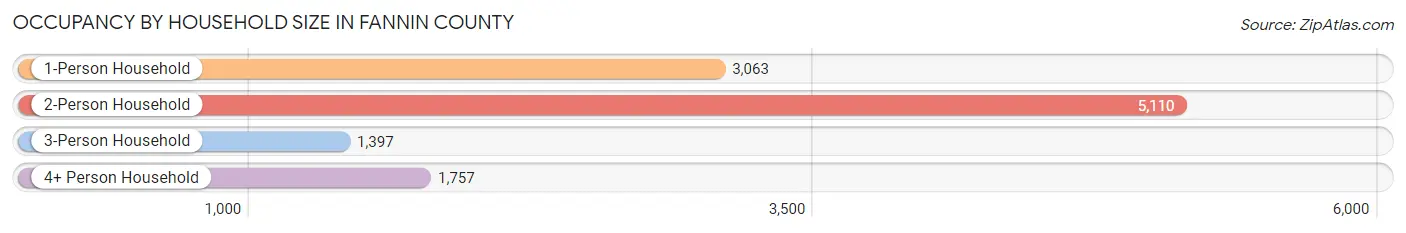
| Household Size | # Housing Units | % Housing Units |
| 1-Person Household | 3,063 | 27.0% |
| 2-Person Household | 5,110 | 45.1% |
| 3-Person Household | 1,397 | 12.3% |
| 4+ Person Household | 1,757 | 15.5% |
| Total Housing Units | 11,327 | 100.0% |
Occupancy by Ownership by Household Size in Fannin County
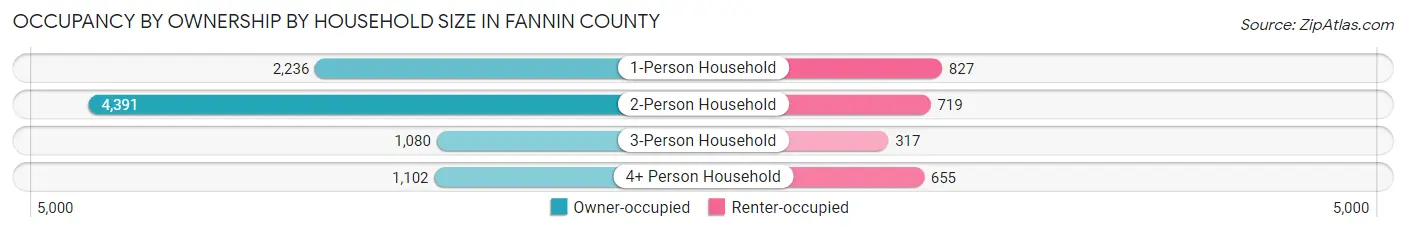
| Household Size | Owner-occupied | Renter-occupied |
| 1-Person Household | 2,236 (73.0%) | 827 (27.0%) |
| 2-Person Household | 4,391 (85.9%) | 719 (14.1%) |
| 3-Person Household | 1,080 (77.3%) | 317 (22.7%) |
| 4+ Person Household | 1,102 (62.7%) | 655 (37.3%) |
| Total Housing Units | 8,809 (77.8%) | 2,518 (22.2%) |
Occupancy by Educational Attainment in Fannin County

| Household Size | Owner-occupied | Renter-occupied |
| Less than High School | 754 (62.4%) | 454 (37.6%) |
| High School Diploma | 2,866 (73.8%) | 1,020 (26.3%) |
| College/Associate Degree | 2,543 (75.9%) | 807 (24.1%) |
| Bachelor's Degree or higher | 2,646 (91.8%) | 237 (8.2%) |
Occupancy by Age of Householder in Fannin County
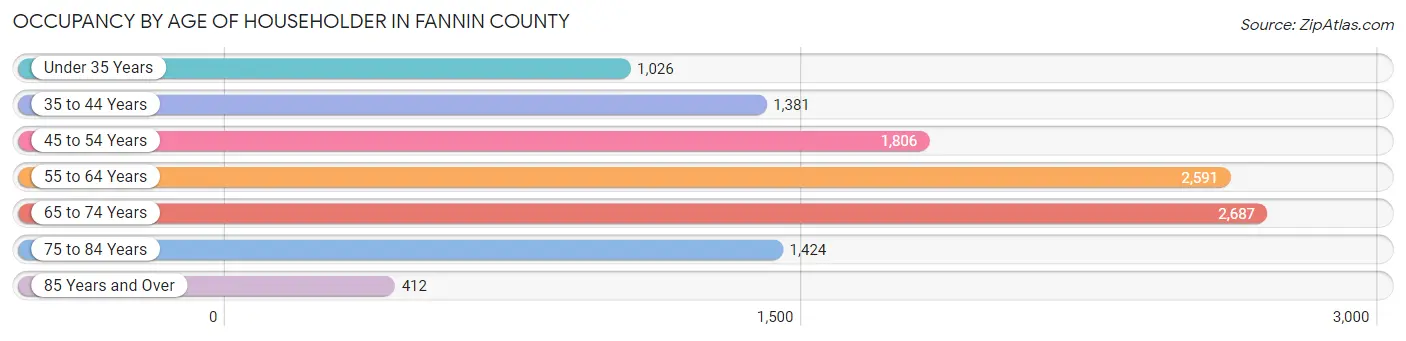
| Age Bracket | # Households | % Households |
| Under 35 Years | 1,026 | 9.1% |
| 35 to 44 Years | 1,381 | 12.2% |
| 45 to 54 Years | 1,806 | 15.9% |
| 55 to 64 Years | 2,591 | 22.9% |
| 65 to 74 Years | 2,687 | 23.7% |
| 75 to 84 Years | 1,424 | 12.6% |
| 85 Years and Over | 412 | 3.6% |
| Total | 11,327 | 100.0% |
Housing Finances in Fannin County
Median Income by Occupancy in Fannin County
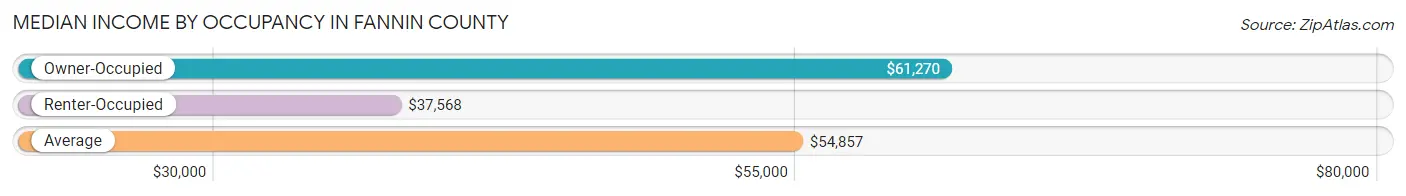
| Occupancy Type | # Households | Median Income |
| Owner-Occupied | 8,809 (77.8%) | $61,270 |
| Renter-Occupied | 2,518 (22.2%) | $37,568 |
| Average | 11,327 (100.0%) | $54,857 |
Occupancy by Householder Income Bracket in Fannin County

| Income Bracket | Owner-occupied | Renter-occupied |
| Less than $5,000 | 429 (4.9%) | 122 (4.9%) |
| $5,000 to $9,999 | 92 (1.0%) | 57 (2.3%) |
| $10,000 to $14,999 | 318 (3.6%) | 242 (9.6%) |
| $15,000 to $19,999 | 320 (3.6%) | 63 (2.5%) |
| $20,000 to $24,999 | 325 (3.7%) | 134 (5.3%) |
| $25,000 to $34,999 | 803 (9.1%) | 551 (21.9%) |
| $35,000 to $49,999 | 1,116 (12.7%) | 364 (14.5%) |
| $50,000 to $74,999 | 2,022 (23.0%) | 590 (23.4%) |
| $75,000 to $99,999 | 1,048 (11.9%) | 224 (8.9%) |
| $100,000 to $149,999 | 1,037 (11.8%) | 135 (5.4%) |
| $150,000 or more | 1,299 (14.7%) | 36 (1.4%) |
| Total | 8,809 (100.0%) | 2,518 (100.0%) |
Monthly Housing Cost Tiers in Fannin County
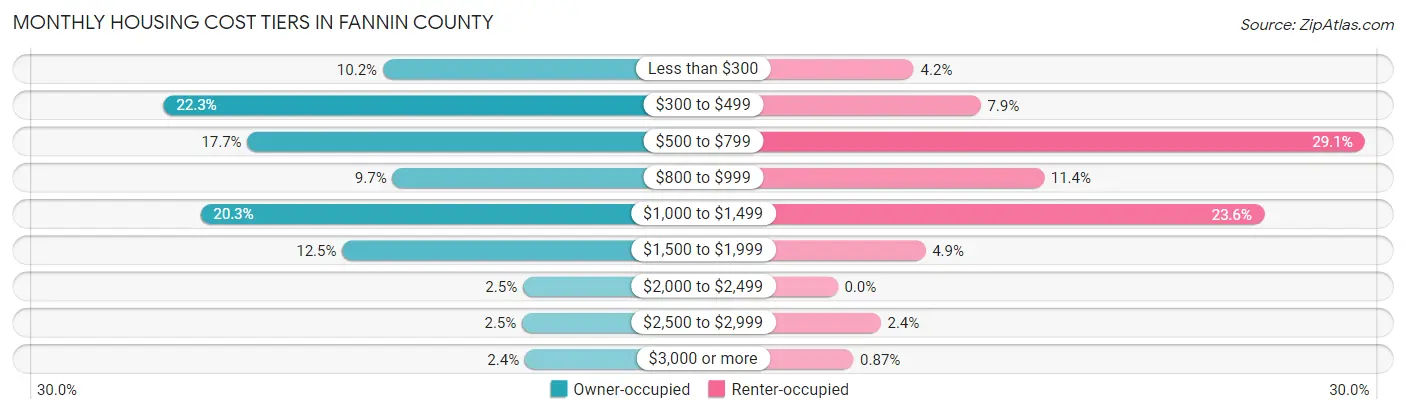
| Monthly Cost | Owner-occupied | Renter-occupied |
| Less than $300 | 899 (10.2%) | 106 (4.2%) |
| $300 to $499 | 1,967 (22.3%) | 199 (7.9%) |
| $500 to $799 | 1,558 (17.7%) | 733 (29.1%) |
| $800 to $999 | 853 (9.7%) | 287 (11.4%) |
| $1,000 to $1,499 | 1,787 (20.3%) | 593 (23.5%) |
| $1,500 to $1,999 | 1,097 (12.4%) | 122 (4.9%) |
| $2,000 to $2,499 | 218 (2.5%) | 0 (0.0%) |
| $2,500 to $2,999 | 222 (2.5%) | 60 (2.4%) |
| $3,000 or more | 208 (2.4%) | 22 (0.9%) |
| Total | 8,809 (100.0%) | 2,518 (100.0%) |
Physical Housing Characteristics in Fannin County
Housing Structures in Fannin County
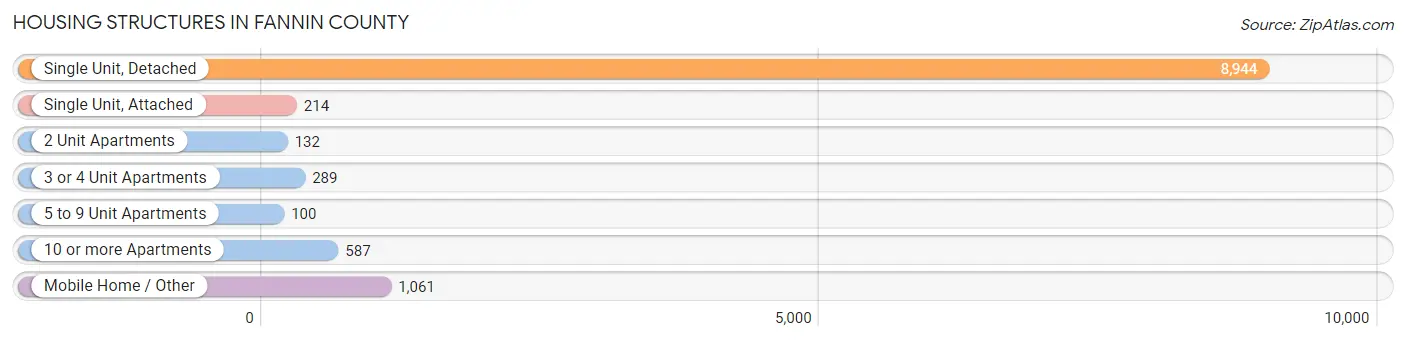
| Structure Type | # Housing Units | % Housing Units |
| Single Unit, Detached | 8,944 | 79.0% |
| Single Unit, Attached | 214 | 1.9% |
| 2 Unit Apartments | 132 | 1.2% |
| 3 or 4 Unit Apartments | 289 | 2.5% |
| 5 to 9 Unit Apartments | 100 | 0.9% |
| 10 or more Apartments | 587 | 5.2% |
| Mobile Home / Other | 1,061 | 9.4% |
| Total | 11,327 | 100.0% |
Housing Structures by Occupancy in Fannin County
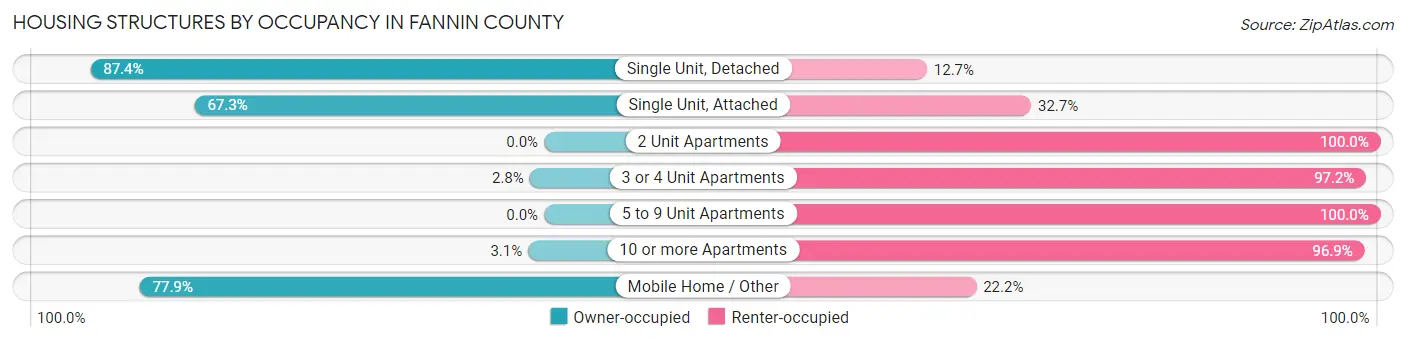
| Structure Type | Owner-occupied | Renter-occupied |
| Single Unit, Detached | 7,813 (87.4%) | 1,131 (12.7%) |
| Single Unit, Attached | 144 (67.3%) | 70 (32.7%) |
| 2 Unit Apartments | 0 (0.0%) | 132 (100.0%) |
| 3 or 4 Unit Apartments | 8 (2.8%) | 281 (97.2%) |
| 5 to 9 Unit Apartments | 0 (0.0%) | 100 (100.0%) |
| 10 or more Apartments | 18 (3.1%) | 569 (96.9%) |
| Mobile Home / Other | 826 (77.8%) | 235 (22.2%) |
| Total | 8,809 (77.8%) | 2,518 (22.2%) |
Housing Structures by Number of Rooms in Fannin County
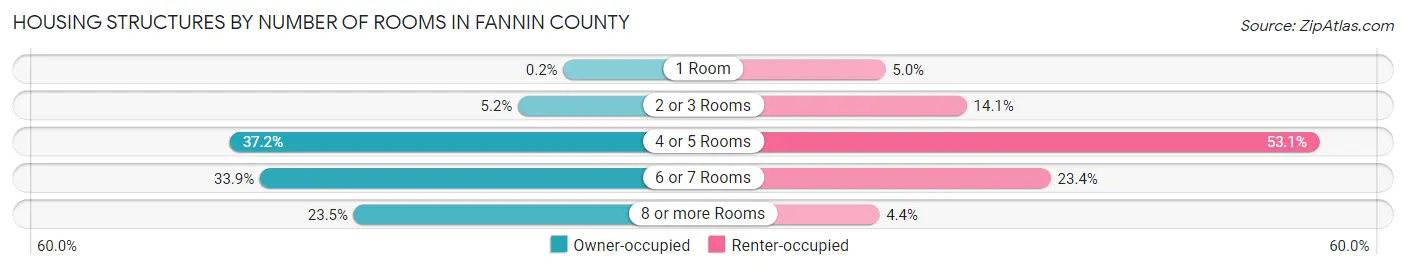
| Number of Rooms | Owner-occupied | Renter-occupied |
| 1 Room | 18 (0.2%) | 127 (5.0%) |
| 2 or 3 Rooms | 460 (5.2%) | 354 (14.1%) |
| 4 or 5 Rooms | 3,280 (37.2%) | 1,338 (53.1%) |
| 6 or 7 Rooms | 2,984 (33.9%) | 589 (23.4%) |
| 8 or more Rooms | 2,067 (23.5%) | 110 (4.4%) |
| Total | 8,809 (100.0%) | 2,518 (100.0%) |
Housing Structure by Heating Type in Fannin County

| Heating Type | Owner-occupied | Renter-occupied |
| Utility Gas | 297 (3.4%) | 38 (1.5%) |
| Bottled, Tank, or LP Gas | 3,662 (41.6%) | 507 (20.1%) |
| Electricity | 4,321 (49.0%) | 1,874 (74.4%) |
| Fuel Oil or Kerosene | 207 (2.4%) | 1 (0.0%) |
| Coal or Coke | 0 (0.0%) | 0 (0.0%) |
| All other Fuels | 322 (3.7%) | 55 (2.2%) |
| No Fuel Used | 0 (0.0%) | 43 (1.7%) |
| Total | 8,809 (100.0%) | 2,518 (100.0%) |
Household Vehicle Usage in Fannin County
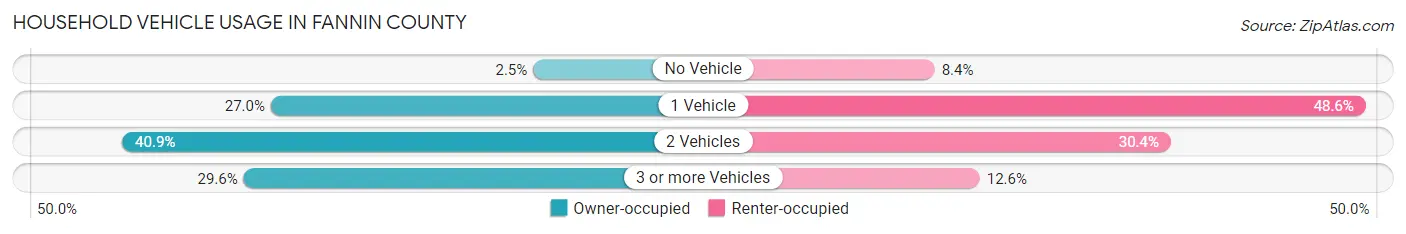
| Vehicles per Household | Owner-occupied | Renter-occupied |
| No Vehicle | 223 (2.5%) | 211 (8.4%) |
| 1 Vehicle | 2,380 (27.0%) | 1,224 (48.6%) |
| 2 Vehicles | 3,602 (40.9%) | 766 (30.4%) |
| 3 or more Vehicles | 2,604 (29.6%) | 317 (12.6%) |
| Total | 8,809 (100.0%) | 2,518 (100.0%) |
Real Estate & Mortgages in Fannin County
Real Estate and Mortgage Overview in Fannin County
| Characteristic | Without Mortgage | With Mortgage |
| Housing Units | 4,662 | 4,147 |
| Median Property Value | $242,000 | $272,900 |
| Median Household Income | $54,106 | $817 |
| Monthly Housing Costs | $441 | $208 |
| Real Estate Taxes | $796 | $116 |
Property Value by Mortgage Status in Fannin County
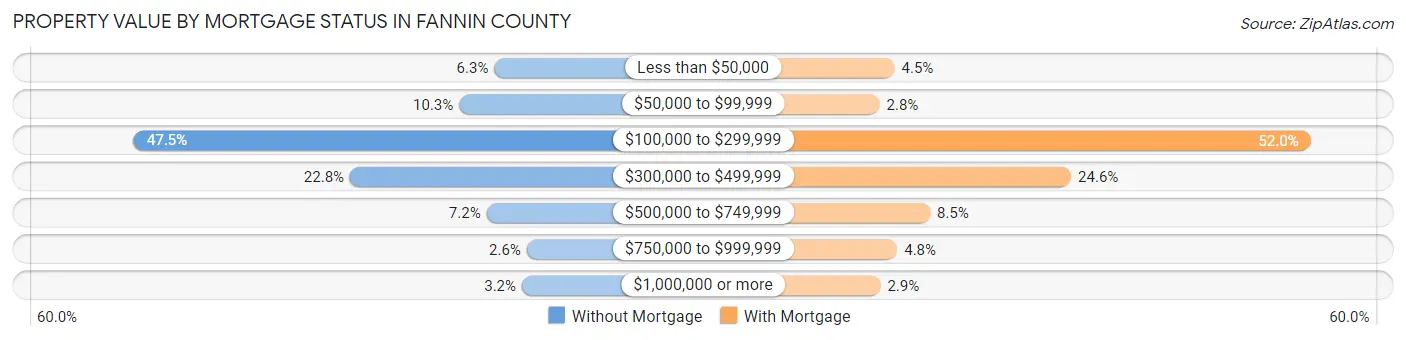
| Property Value | Without Mortgage | With Mortgage |
| Less than $50,000 | 295 (6.3%) | 185 (4.5%) |
| $50,000 to $99,999 | 482 (10.3%) | 114 (2.8%) |
| $100,000 to $299,999 | 2,215 (47.5%) | 2,157 (52.0%) |
| $300,000 to $499,999 | 1,064 (22.8%) | 1,022 (24.6%) |
| $500,000 to $749,999 | 336 (7.2%) | 353 (8.5%) |
| $750,000 to $999,999 | 122 (2.6%) | 198 (4.8%) |
| $1,000,000 or more | 148 (3.2%) | 118 (2.9%) |
| Total | 4,662 (100.0%) | 4,147 (100.0%) |
Household Income by Mortgage Status in Fannin County

| Household Income | Without Mortgage | With Mortgage |
| Less than $10,000 | 326 (7.0%) | 100 (2.4%) |
| $10,000 to $24,999 | 641 (13.8%) | 195 (4.7%) |
| $25,000 to $34,999 | 424 (9.1%) | 322 (7.8%) |
| $35,000 to $49,999 | 554 (11.9%) | 379 (9.1%) |
| $50,000 to $74,999 | 1,324 (28.4%) | 562 (13.6%) |
| $75,000 to $99,999 | 464 (10.0%) | 698 (16.8%) |
| $100,000 to $149,999 | 447 (9.6%) | 584 (14.1%) |
| $150,000 or more | 482 (10.3%) | 590 (14.2%) |
| Total | 4,662 (100.0%) | 4,147 (100.0%) |
Property Value to Household Income Ratio in Fannin County
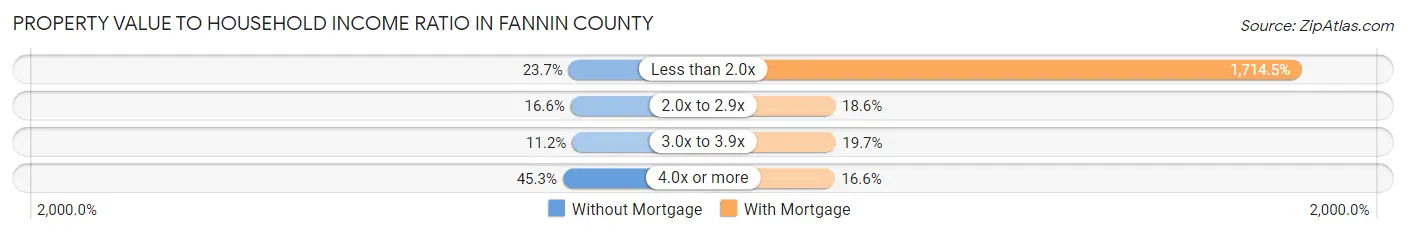
| Value-to-Income Ratio | Without Mortgage | With Mortgage |
| Less than 2.0x | 1,106 (23.7%) | 71,101 (1,714.5%) |
| 2.0x to 2.9x | 774 (16.6%) | 771 (18.6%) |
| 3.0x to 3.9x | 522 (11.2%) | 816 (19.7%) |
| 4.0x or more | 2,112 (45.3%) | 687 (16.6%) |
| Total | 4,662 (100.0%) | 4,147 (100.0%) |
Real Estate Taxes by Mortgage Status in Fannin County
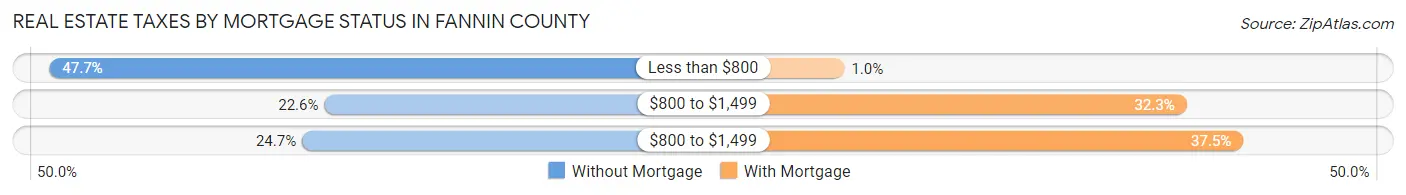
| Property Taxes | Without Mortgage | With Mortgage |
| Less than $800 | 2,225 (47.7%) | 43 (1.0%) |
| $800 to $1,499 | 1,055 (22.6%) | 1,339 (32.3%) |
| $800 to $1,499 | 1,150 (24.7%) | 1,553 (37.4%) |
| Total | 4,662 (100.0%) | 4,147 (100.0%) |
Health & Disability in Fannin County
Health Insurance Coverage by Age in Fannin County
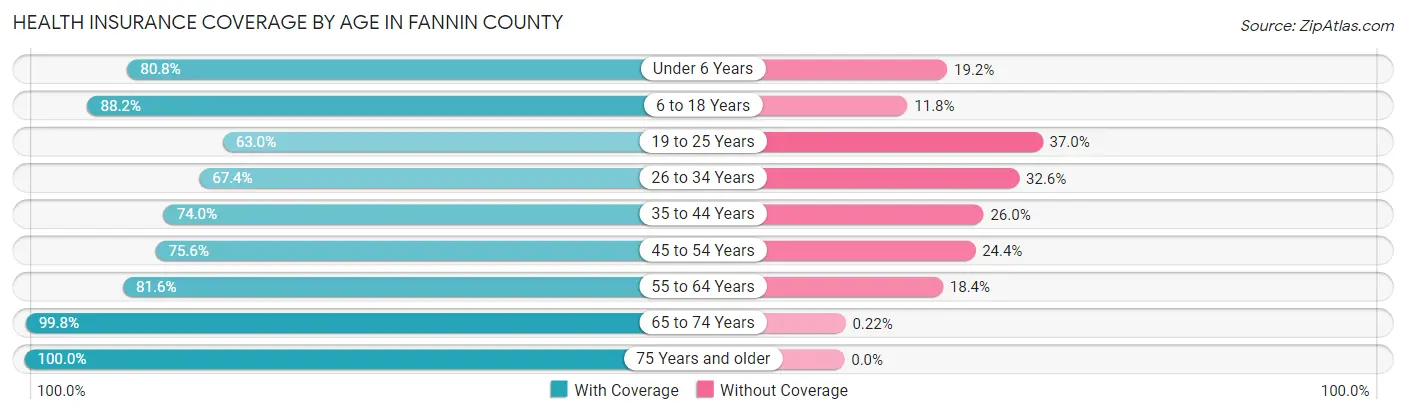
| Age Bracket | With Coverage | Without Coverage |
| Under 6 Years | 1,067 (80.8%) | 253 (19.2%) |
| 6 to 18 Years | 2,490 (88.2%) | 332 (11.8%) |
| 19 to 25 Years | 1,052 (63.0%) | 617 (37.0%) |
| 26 to 34 Years | 1,340 (67.4%) | 648 (32.6%) |
| 35 to 44 Years | 1,723 (74.0%) | 604 (26.0%) |
| 45 to 54 Years | 2,248 (75.6%) | 726 (24.4%) |
| 55 to 64 Years | 3,833 (81.6%) | 863 (18.4%) |
| 65 to 74 Years | 4,569 (99.8%) | 10 (0.2%) |
| 75 Years and older | 2,911 (100.0%) | 0 (0.0%) |
| Total | 21,233 (84.0%) | 4,053 (16.0%) |
Health Insurance Coverage by Citizenship Status in Fannin County
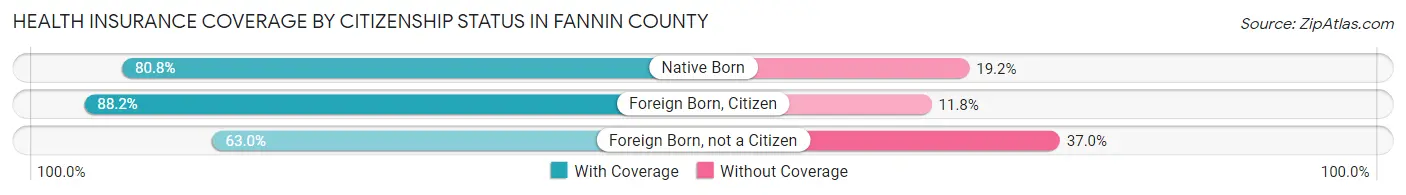
| Citizenship Status | With Coverage | Without Coverage |
| Native Born | 1,067 (80.8%) | 253 (19.2%) |
| Foreign Born, Citizen | 2,490 (88.2%) | 332 (11.8%) |
| Foreign Born, not a Citizen | 1,052 (63.0%) | 617 (37.0%) |
Health Insurance Coverage by Household Income in Fannin County
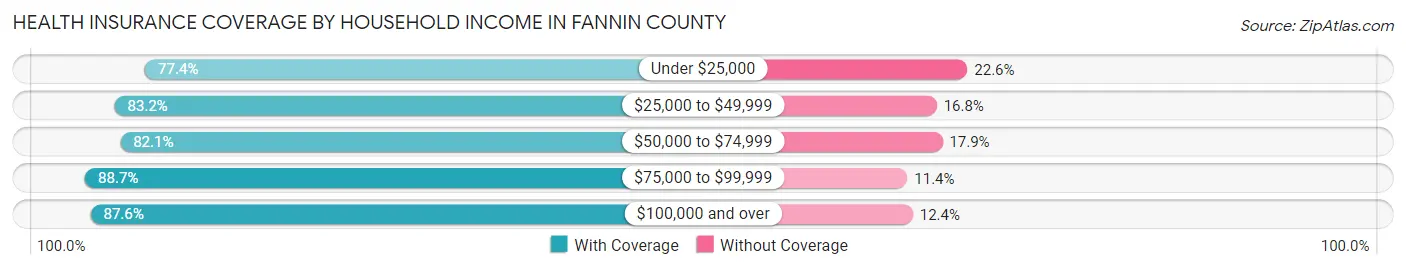
| Household Income | With Coverage | Without Coverage |
| Under $25,000 | 2,566 (77.4%) | 749 (22.6%) |
| $25,000 to $49,999 | 5,254 (83.2%) | 1,064 (16.8%) |
| $50,000 to $74,999 | 4,898 (82.1%) | 1,069 (17.9%) |
| $75,000 to $99,999 | 2,678 (88.6%) | 343 (11.4%) |
| $100,000 and over | 5,814 (87.6%) | 820 (12.4%) |
Public vs Private Health Insurance Coverage by Age in Fannin County

| Age Bracket | Public Insurance | Private Insurance |
| Under 6 | 699 (52.9%) | 378 (28.6%) |
| 6 to 18 Years | 1,397 (49.5%) | 1,214 (43.0%) |
| 19 to 25 Years | 250 (15.0%) | 858 (51.4%) |
| 25 to 34 Years | 488 (24.5%) | 1,080 (54.3%) |
| 35 to 44 Years | 347 (14.9%) | 1,465 (63.0%) |
| 45 to 54 Years | 362 (12.2%) | 1,941 (65.3%) |
| 55 to 64 Years | 831 (17.7%) | 3,338 (71.1%) |
| 65 to 74 Years | 4,517 (98.7%) | 2,348 (51.3%) |
| 75 Years and over | 2,911 (100.0%) | 1,595 (54.8%) |
| Total | 11,802 (46.7%) | 14,217 (56.2%) |
Disability Status by Sex by Age in Fannin County
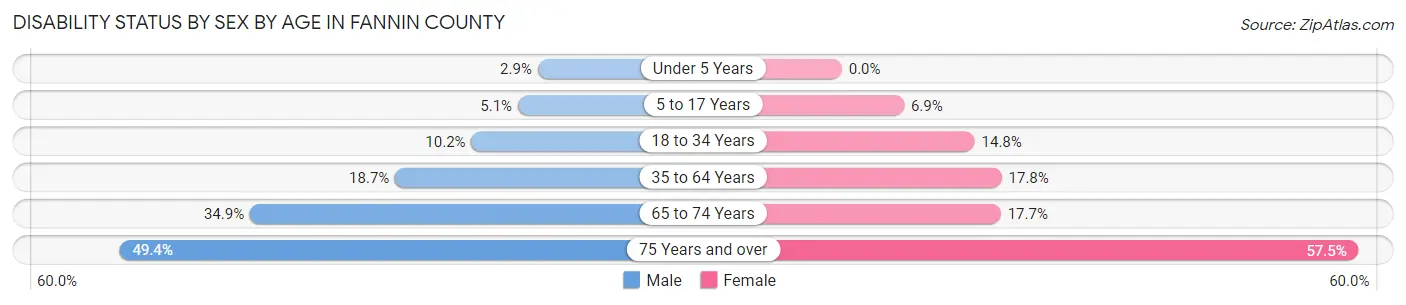
| Age Bracket | Male | Female |
| Under 5 Years | 15 (2.9%) | 0 (0.0%) |
| 5 to 17 Years | 79 (5.1%) | 100 (6.9%) |
| 18 to 34 Years | 191 (10.2%) | 283 (14.8%) |
| 35 to 64 Years | 920 (18.7%) | 905 (17.8%) |
| 65 to 74 Years | 764 (34.9%) | 423 (17.7%) |
| 75 Years and over | 652 (49.4%) | 916 (57.5%) |
Disability Class by Sex by Age in Fannin County
Disability Class: Hearing Difficulty
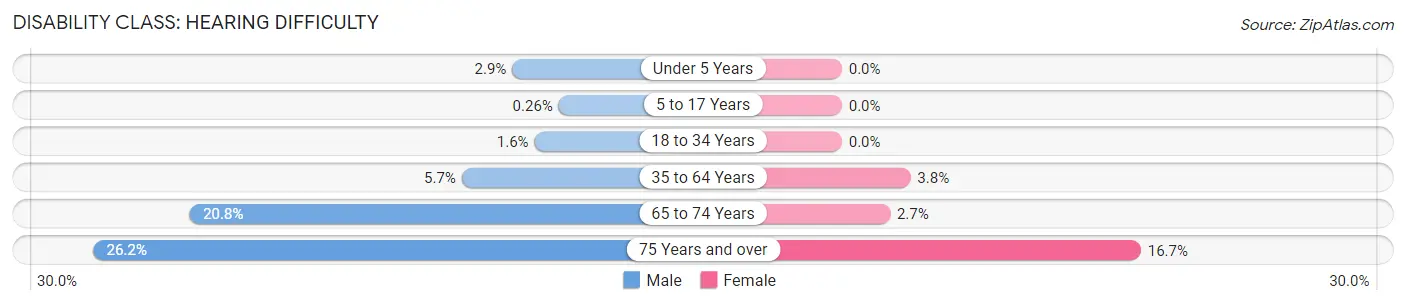
| Age Bracket | Male | Female |
| Under 5 Years | 15 (2.9%) | 0 (0.0%) |
| 5 to 17 Years | 4 (0.3%) | 0 (0.0%) |
| 18 to 34 Years | 30 (1.6%) | 0 (0.0%) |
| 35 to 64 Years | 278 (5.7%) | 194 (3.8%) |
| 65 to 74 Years | 455 (20.8%) | 64 (2.7%) |
| 75 Years and over | 345 (26.2%) | 265 (16.7%) |
Disability Class: Vision Difficulty
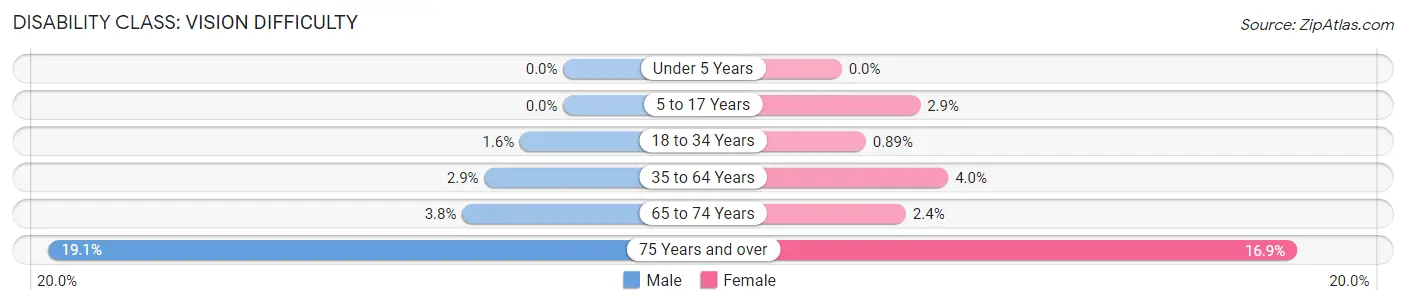
| Age Bracket | Male | Female |
| Under 5 Years | 0 (0.0%) | 0 (0.0%) |
| 5 to 17 Years | 0 (0.0%) | 42 (2.9%) |
| 18 to 34 Years | 30 (1.6%) | 17 (0.9%) |
| 35 to 64 Years | 144 (2.9%) | 201 (4.0%) |
| 65 to 74 Years | 82 (3.7%) | 57 (2.4%) |
| 75 Years and over | 252 (19.1%) | 269 (16.9%) |
Disability Class: Cognitive Difficulty
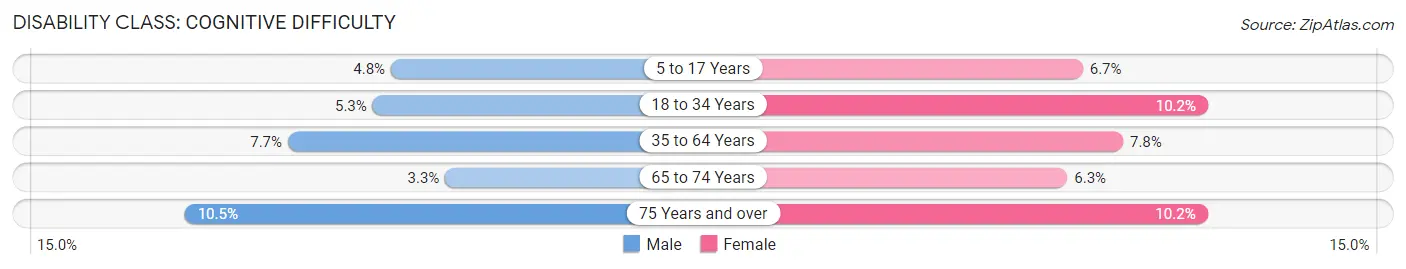
| Age Bracket | Male | Female |
| 5 to 17 Years | 75 (4.8%) | 97 (6.7%) |
| 18 to 34 Years | 99 (5.3%) | 195 (10.2%) |
| 35 to 64 Years | 377 (7.7%) | 398 (7.8%) |
| 65 to 74 Years | 72 (3.3%) | 150 (6.3%) |
| 75 Years and over | 139 (10.5%) | 162 (10.2%) |
Disability Class: Ambulatory Difficulty

| Age Bracket | Male | Female |
| 5 to 17 Years | 0 (0.0%) | 37 (2.6%) |
| 18 to 34 Years | 62 (3.3%) | 6 (0.3%) |
| 35 to 64 Years | 612 (12.5%) | 574 (11.3%) |
| 65 to 74 Years | 322 (14.7%) | 381 (15.9%) |
| 75 Years and over | 399 (30.2%) | 675 (42.4%) |
Disability Class: Self-Care Difficulty

| Age Bracket | Male | Female |
| 5 to 17 Years | 0 (0.0%) | 32 (2.2%) |
| 18 to 34 Years | 62 (3.3%) | 0 (0.0%) |
| 35 to 64 Years | 152 (3.1%) | 257 (5.1%) |
| 65 to 74 Years | 89 (4.1%) | 165 (6.9%) |
| 75 Years and over | 77 (5.8%) | 175 (11.0%) |
Technology Access in Fannin County
Computing Device Access in Fannin County
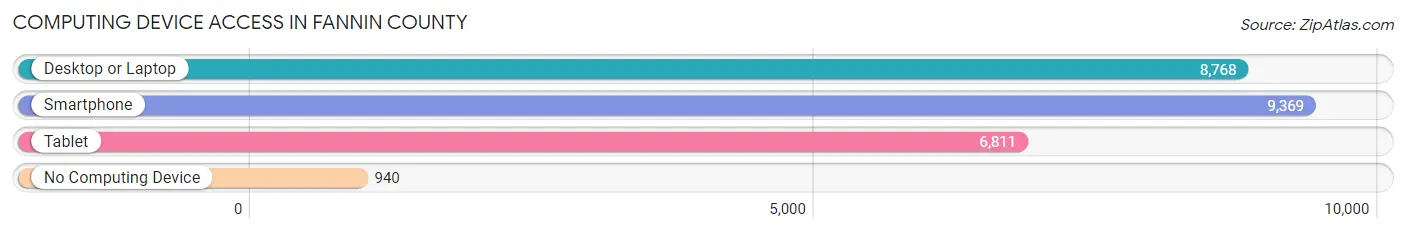
| Device Type | # Households | % Households |
| Desktop or Laptop | 8,768 | 77.4% |
| Smartphone | 9,369 | 82.7% |
| Tablet | 6,811 | 60.1% |
| No Computing Device | 940 | 8.3% |
| Total | 11,327 | 100.0% |
Internet Access in Fannin County
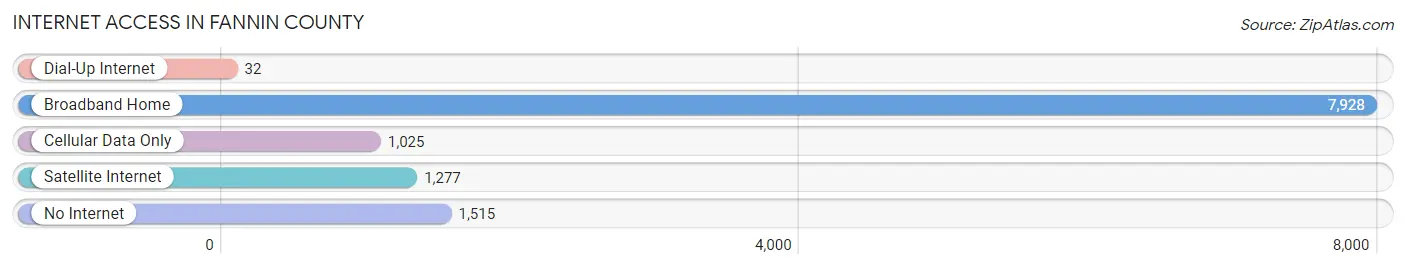
| Internet Type | # Households | % Households |
| Dial-Up Internet | 32 | 0.3% |
| Broadband Home | 7,928 | 70.0% |
| Cellular Data Only | 1,025 | 9.0% |
| Satellite Internet | 1,277 | 11.3% |
| No Internet | 1,515 | 13.4% |
| Total | 11,327 | 100.0% |
Fannin County Summary
Fannin County is located in the north-central part of the state of Georgia, in the Appalachian Mountains. It is bordered by Gilmer, Union, Towns, and Lumpkin counties. The county seat is Blue Ridge, and the county has a population of approximately 23,000 people.
History
Fannin County was created in 1854 from parts of Gilmer and Union counties. It was named for James W. Fannin, a hero of the Texas Revolution. The county was originally part of the Cherokee Nation, and the area was home to many Cherokee villages. The county was also home to the Cherokee Trail of Tears, which was the route taken by the Cherokee people when they were forcibly removed from their ancestral lands in the 1830s.
The county was largely rural until the late 19th century, when the railroad was built through the area. This brought an influx of settlers and businesses, and the county began to develop. The county seat, Blue Ridge, was established in 1883.
Geography
Fannin County is located in the Appalachian Mountains, and is part of the Blue Ridge Mountains. The county is mostly mountainous, with elevations ranging from 1,000 to 4,000 feet. The highest point in the county is Brasstown Bald, which is 4,784 feet above sea level. The county is home to several rivers, including the Toccoa, Nottely, and Hiawassee.
The county is mostly forested, with the majority of the land being covered in hardwood and pine forests. There are also several lakes in the county, including Blue Ridge Lake, Lake Nottely, and Lake Chatuge.
Economy
The economy of Fannin County is largely based on tourism and agriculture. The county is home to several tourist attractions, including the Blue Ridge Scenic Railway, the Blue Ridge Mountains, and the Appalachian Trail. The county is also home to several wineries and vineyards, as well as several apple orchards.
Agriculture is also an important part of the economy. The county is home to several farms, which produce a variety of crops, including corn, soybeans, hay, and tobacco. Livestock production is also important, with cattle, hogs, and poultry being raised in the county.
Demographics
As of the 2010 census, the population of Fannin County was 23,682. The population is mostly white (94.3%), with small percentages of African American (2.7%), Hispanic (1.3%), and Asian (0.7%) residents. The median household income is $37,845, and the median age is 44.
The county is home to several small towns, including Blue Ridge, McCaysville, and Mineral Bluff. The county seat, Blue Ridge, is the largest town in the county, with a population of 1,290. The town is a popular tourist destination, and is home to several restaurants, shops, and galleries.
Common Questions
What is the Total Population of Fannin County?
Total Population of Fannin County is 25,436.
What is the Total Male Population of Fannin County?
Total Male Population of Fannin County is 12,481.
What is the Total Female Population of Fannin County?
Total Female Population of Fannin County is 12,955.
What is the Ratio of Males per 100 Females in Fannin County?
There are 96.34 Males per 100 Females in Fannin County.
What is the Ratio of Females per 100 Males in Fannin County?
There are 103.80 Females per 100 Males in Fannin County.
What is the Median Population Age in Fannin County?
Median Population Age in Fannin County is 53.8 Years.
What is the Average Family Size in Fannin County
Average Family Size in Fannin County is 2.7 People.
What is the Average Household Size in Fannin County
Average Household Size in Fannin County is 2.2 People.
What is Per Capita Income in Fannin County?
Per Capita income in Fannin County is $36,058.
What is the Median Family Income in Fannin County?
Median Family Income in Fannin County is $61,406.
What is the Median Household income in Fannin County?
Median Household Income in Fannin County is $54,857.
What is Income or Wage Gap in Fannin County?
Income or Wage Gap in Fannin County is 38.3%.
Women in Fannin County earn 61.7 cents for every dollar earned by a man.
What is Family Income Deficit in Fannin County?
Family Income Deficit in Fannin County is $10,951.
Families that are below poverty line in Fannin County earn $10,951 less on average than the poverty threshold level.
What is Inequality or Gini Index in Fannin County?
Inequality or Gini Index in Fannin County is 0.49.
How Large is the Labor Force in Fannin County?
There are 10,568 People in the Labor Forcein in Fannin County.
What is the Percentage of People in the Labor Force in Fannin County?
48.1% of People are in the Labor Force in Fannin County.
What is the Unemployment Rate in Fannin County?
Unemployment Rate in Fannin County is 5.4%.