Emanuel County, GA
Emanuel County Map

Emanuel County Overview
22,907
TOTAL POPULATION
11,621
MALE POPULATION
11,286
FEMALE POPULATION
102.97
MALES / 100 FEMALES
97.12
FEMALES / 100 MALES
37.4
MEDIAN AGE
3.2
AVG FAMILY SIZE
2.6
AVG HOUSEHOLD SIZE
$24,696
PER CAPITA INCOME
$53,973
AVG FAMILY INCOME
$47,905
AVG HOUSEHOLD INCOME
28.5%
WAGE / INCOME GAP [ % ]
71.5¢/ $1
WAGE / INCOME GAP [ $ ]
$8,934
FAMILY INCOME DEFICIT
0.45
INEQUALITY / GINI INDEX
10,096
LABOR FORCE [ PEOPLE ]
56.9%
PERCENT IN LABOR FORCE
8.9%
UNEMPLOYMENT RATE
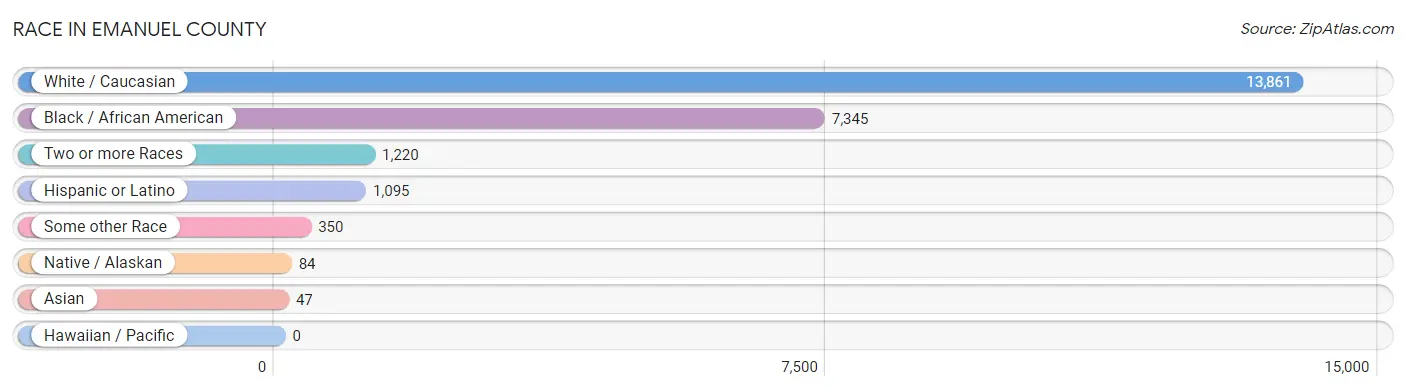
Race in Emanuel County
The most populous races in Emanuel County are White / Caucasian (13,861 | 60.5%), Black / African American (7,345 | 32.1%), and Two or more Races (1,220 | 5.3%).
| Race | # Population | % Population |
| Asian | 47 | 0.2% |
| Black / African American | 7,345 | 32.1% |
| Hawaiian / Pacific | 0 | 0.0% |
| Hispanic or Latino | 1,095 | 4.8% |
| Native / Alaskan | 84 | 0.4% |
| White / Caucasian | 13,861 | 60.5% |
| Two or more Races | 1,220 | 5.3% |
| Some other Race | 350 | 1.5% |
| Total | 22,907 | 100.0% |
Ancestry in Emanuel County
The most populous ancestries reported in Emanuel County are American (3,492 | 15.2%), Irish (1,667 | 7.3%), English (1,284 | 5.6%), Mexican (890 | 3.9%), and German (690 | 3.0%), together accounting for 35.0% of all Emanuel County residents.

| Ancestry | # Population | % Population |
| African | 139 | 0.6% |
| American | 3,492 | 15.2% |
| Arab | 30 | 0.1% |
| Austrian | 20 | 0.1% |
| Bahamian | 5 | 0.0% |
| Blackfeet | 159 | 0.7% |
| Brazilian | 13 | 0.1% |
| British | 72 | 0.3% |
| Burmese | 7 | 0.0% |
| Cajun | 99 | 0.4% |
| Cape Verdean | 13 | 0.1% |
| Central American Indian | 2 | 0.0% |
| Cherokee | 431 | 1.9% |
| Cuban | 51 | 0.2% |
| Czech | 30 | 0.1% |
| Danish | 41 | 0.2% |
| Dutch | 162 | 0.7% |
| Egyptian | 15 | 0.1% |
| English | 1,284 | 5.6% |
| European | 465 | 2.0% |
| Finnish | 8 | 0.0% |
| French | 67 | 0.3% |
| French Canadian | 15 | 0.1% |
| German | 690 | 3.0% |
| Greek | 24 | 0.1% |
| Haitian | 4 | 0.0% |
| Hungarian | 15 | 0.1% |
| Icelander | 22 | 0.1% |
| Irish | 1,667 | 7.3% |
| Italian | 637 | 2.8% |
| Jamaican | 54 | 0.2% |
| Korean | 7 | 0.0% |
| Lithuanian | 8 | 0.0% |
| Macedonian | 51 | 0.2% |
| Mexican | 890 | 3.9% |
| Mexican American Indian | 2 | 0.0% |
| Moroccan | 15 | 0.1% |
| Norwegian | 17 | 0.1% |
| Polish | 86 | 0.4% |
| Portuguese | 116 | 0.5% |
| Puerto Rican | 153 | 0.7% |
| Romanian | 7 | 0.0% |
| Russian | 13 | 0.1% |
| Samoan | 7 | 0.0% |
| Scotch-Irish | 153 | 0.7% |
| Scottish | 383 | 1.7% |
| Sri Lankan | 6 | 0.0% |
| Subsaharan African | 152 | 0.7% |
| Swedish | 19 | 0.1% |
| Swiss | 18 | 0.1% |
| Thai | 37 | 0.2% |
| Welsh | 6 | 0.0% | View All 52 Rows |
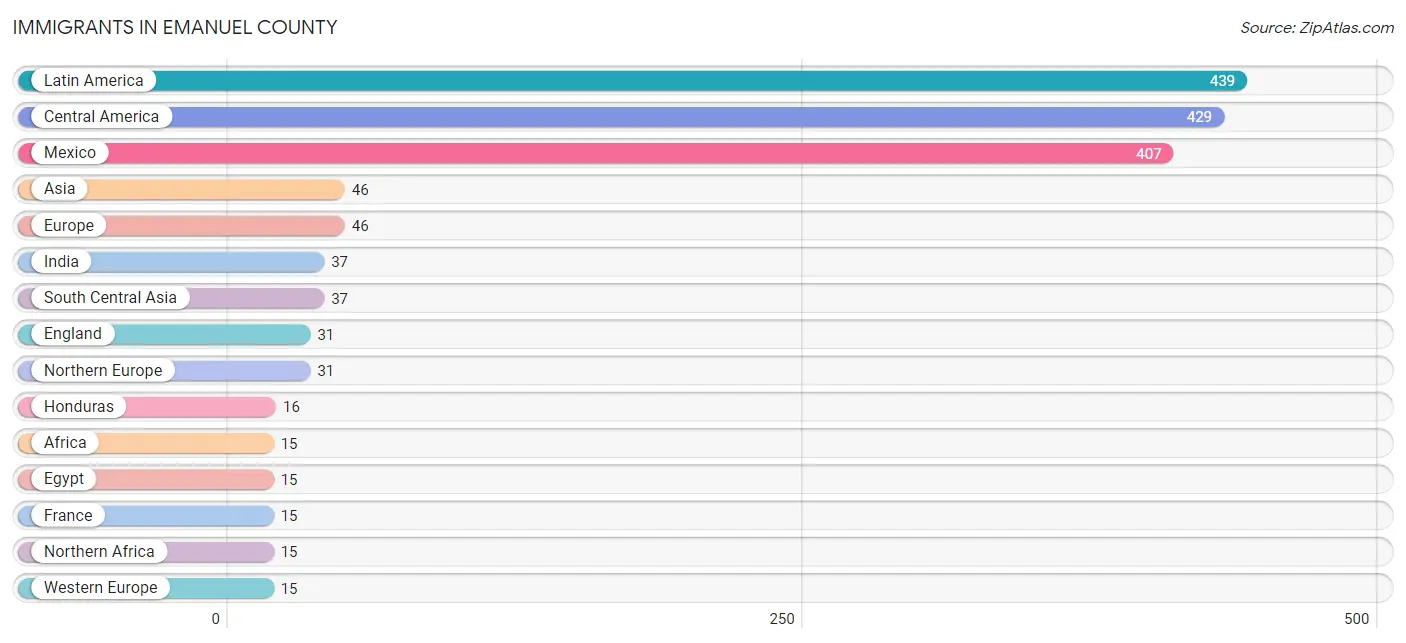
Immigrants in Emanuel County
The most numerous immigrant groups reported in Emanuel County came from Latin America (439 | 1.9%), Central America (429 | 1.9%), Mexico (407 | 1.8%), Asia (46 | 0.2%), and Europe (46 | 0.2%), together accounting for 6.0% of all Emanuel County residents.
| Immigration Origin | # Population | % Population |
| Africa | 15 | 0.1% |
| Asia | 46 | 0.2% |
| Brazil | 6 | 0.0% |
| Canada | 11 | 0.1% |
| Caribbean | 4 | 0.0% |
| Central America | 429 | 1.9% |
| Cuba | 4 | 0.0% |
| Eastern Asia | 6 | 0.0% |
| Egypt | 15 | 0.1% |
| England | 31 | 0.1% |
| Europe | 46 | 0.2% |
| France | 15 | 0.1% |
| Guatemala | 6 | 0.0% |
| Honduras | 16 | 0.1% |
| India | 37 | 0.2% |
| Korea | 6 | 0.0% |
| Latin America | 439 | 1.9% |
| Mexico | 407 | 1.8% |
| Northern Africa | 15 | 0.1% |
| Northern Europe | 31 | 0.1% |
| Philippines | 3 | 0.0% |
| South America | 6 | 0.0% |
| South Central Asia | 37 | 0.2% |
| South Eastern Asia | 3 | 0.0% |
| Western Europe | 15 | 0.1% | View All 25 Rows |
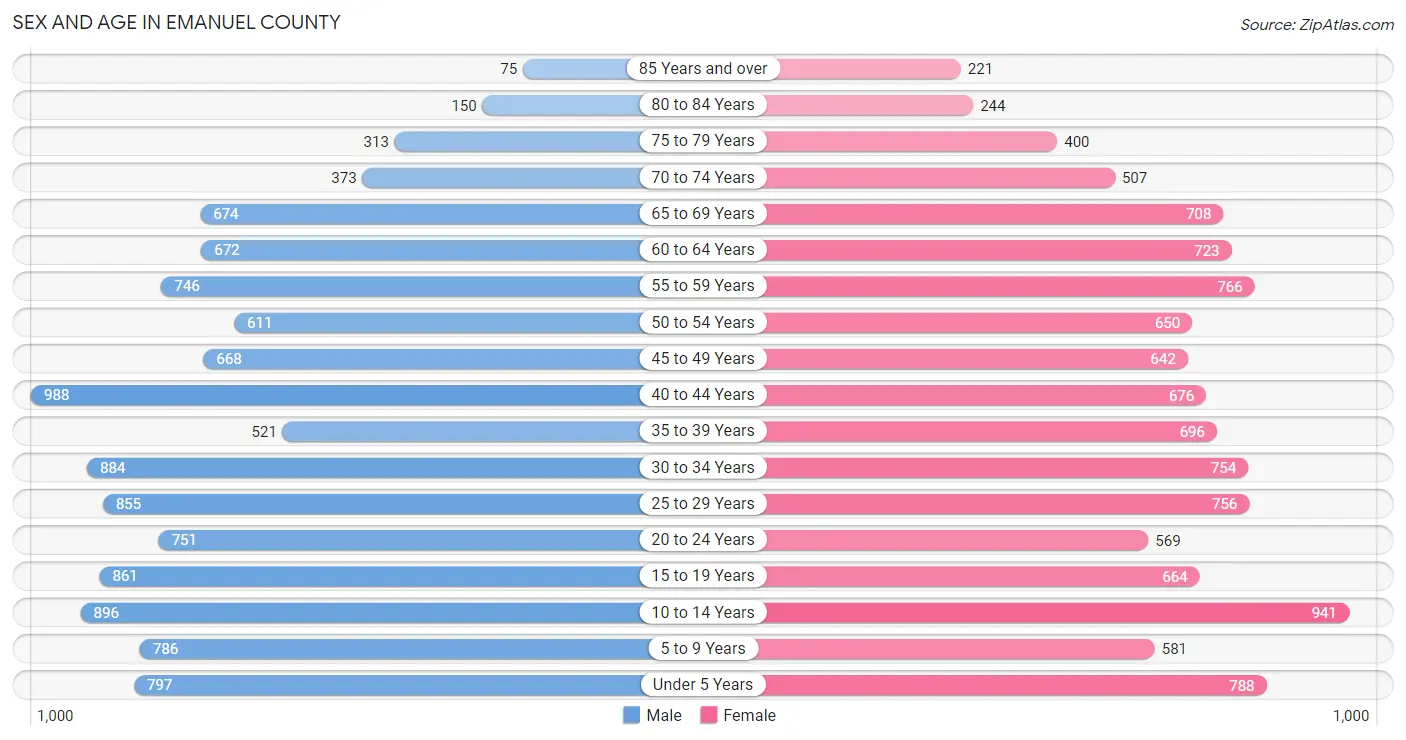
Sex and Age in Emanuel County
Sex and Age in Emanuel County
The most populous age groups in Emanuel County are 40 to 44 Years (988 | 8.5%) for men and 10 to 14 Years (941 | 8.3%) for women.
| Age Bracket | Male | Female |
| Under 5 Years | 797 (6.9%) | 788 (7.0%) |
| 5 to 9 Years | 786 (6.8%) | 581 (5.1%) |
| 10 to 14 Years | 896 (7.7%) | 941 (8.3%) |
| 15 to 19 Years | 861 (7.4%) | 664 (5.9%) |
| 20 to 24 Years | 751 (6.5%) | 569 (5.0%) |
| 25 to 29 Years | 855 (7.4%) | 756 (6.7%) |
| 30 to 34 Years | 884 (7.6%) | 754 (6.7%) |
| 35 to 39 Years | 521 (4.5%) | 696 (6.2%) |
| 40 to 44 Years | 988 (8.5%) | 676 (6.0%) |
| 45 to 49 Years | 668 (5.8%) | 642 (5.7%) |
| 50 to 54 Years | 611 (5.3%) | 650 (5.8%) |
| 55 to 59 Years | 746 (6.4%) | 766 (6.8%) |
| 60 to 64 Years | 672 (5.8%) | 723 (6.4%) |
| 65 to 69 Years | 674 (5.8%) | 708 (6.3%) |
| 70 to 74 Years | 373 (3.2%) | 507 (4.5%) |
| 75 to 79 Years | 313 (2.7%) | 400 (3.5%) |
| 80 to 84 Years | 150 (1.3%) | 244 (2.2%) |
| 85 Years and over | 75 (0.6%) | 221 (2.0%) |
| Total | 11,621 (100.0%) | 11,286 (100.0%) |
Families and Households in Emanuel County
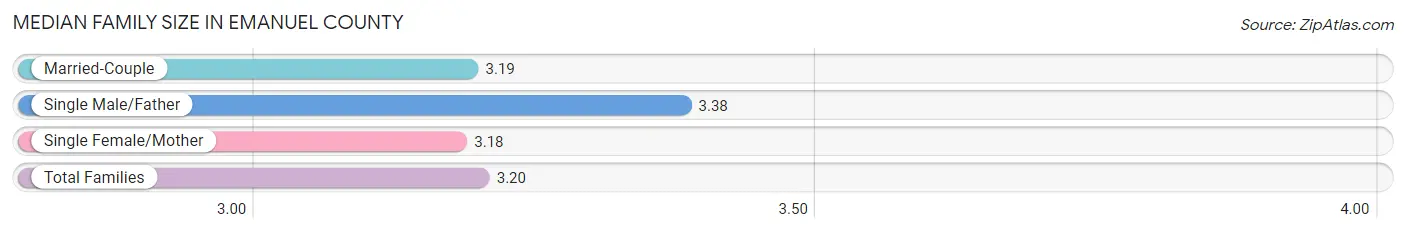
Median Family Size in Emanuel County
The median family size in Emanuel County is 3.20 persons per family, with single male/father families (366 | 6.5%) accounting for the largest median family size of 3.38 persons per family. On the other hand, single female/mother families (1,823 | 32.4%) represent the smallest median family size with 3.18 persons per family.
| Family Type | # Families | Family Size |
| Married-Couple | 3,440 (61.1%) | 3.19 |
| Single Male/Father | 366 (6.5%) | 3.38 |
| Single Female/Mother | 1,823 (32.4%) | 3.18 |
| Total Families | 5,629 (100.0%) | 3.20 |
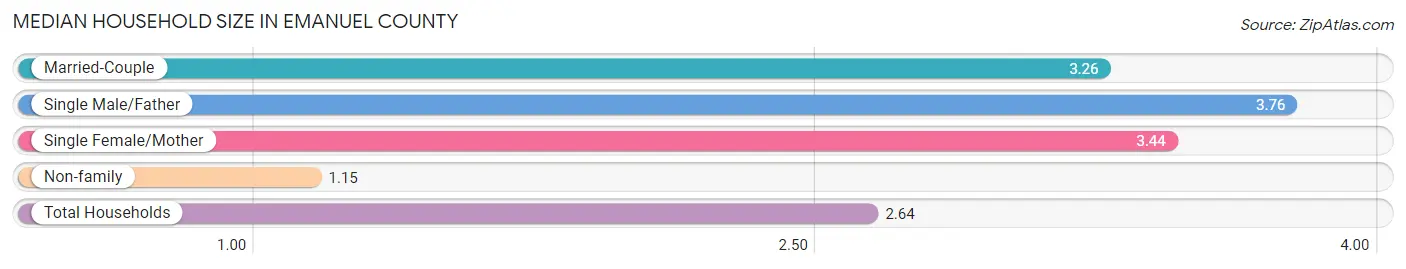
Median Household Size in Emanuel County
The median household size in Emanuel County is 2.64 persons per household, with single male/father households (366 | 4.4%) accounting for the largest median household size of 3.76 persons per household. non-family households (2,692 | 32.4%) represent the smallest median household size with 1.15 persons per household.
| Household Type | # Households | Household Size |
| Married-Couple | 3,440 (41.3%) | 3.26 |
| Single Male/Father | 366 (4.4%) | 3.76 |
| Single Female/Mother | 1,823 (21.9%) | 3.44 |
| Non-family | 2,692 (32.4%) | 1.15 |
| Total Households | 8,321 (100.0%) | 2.64 |
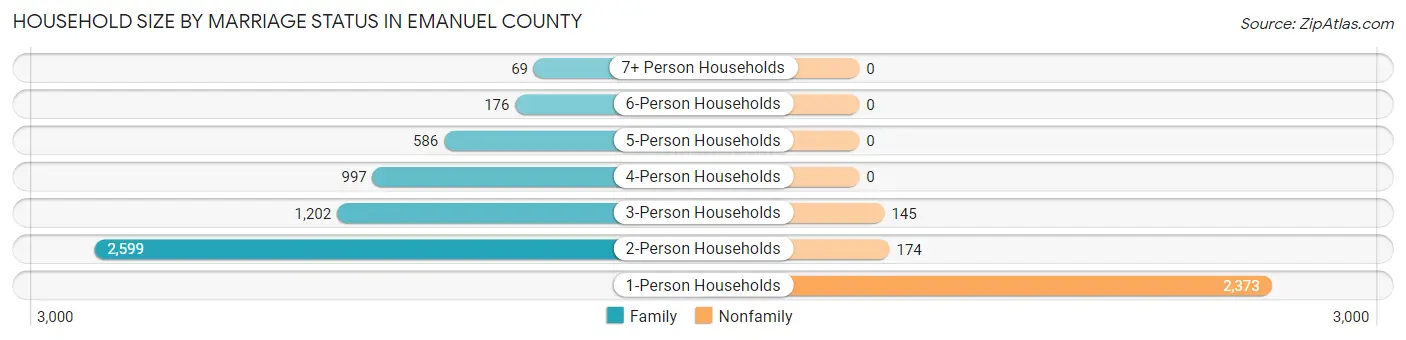
Household Size by Marriage Status in Emanuel County
Out of a total of 8,321 households in Emanuel County, 5,629 (67.6%) are family households, while 2,692 (32.4%) are nonfamily households. The most numerous type of family households are 2-person households, comprising 2,599, and the most common type of nonfamily households are 1-person households, comprising 2,373.
| Household Size | Family Households | Nonfamily Households |
| 1-Person Households | - | 2,373 (28.5%) |
| 2-Person Households | 2,599 (31.2%) | 174 (2.1%) |
| 3-Person Households | 1,202 (14.4%) | 145 (1.7%) |
| 4-Person Households | 997 (12.0%) | 0 (0.0%) |
| 5-Person Households | 586 (7.0%) | 0 (0.0%) |
| 6-Person Households | 176 (2.1%) | 0 (0.0%) |
| 7+ Person Households | 69 (0.8%) | 0 (0.0%) |
| Total | 5,629 (67.6%) | 2,692 (32.4%) |
Female Fertility in Emanuel County
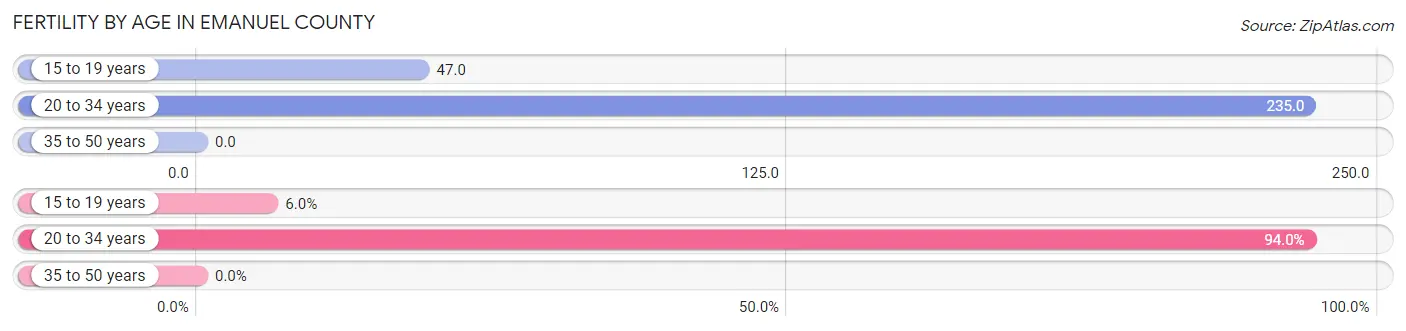
Fertility by Age in Emanuel County
Average fertility rate in Emanuel County is 107.0 births per 1,000 women. Women in the age bracket of 20 to 34 years have the highest fertility rate with 235.0 births per 1,000 women. Women in the age bracket of 20 to 34 years acount for 94.0% of all women with births.
| Age Bracket | Women with Births | Births / 1,000 Women |
| 15 to 19 years | 31 (6.0%) | 47.0 |
| 20 to 34 years | 488 (94.0%) | 235.0 |
| 35 to 50 years | 0 (0.0%) | 0.0 |
| Total | 519 (100.0%) | 107.0 |
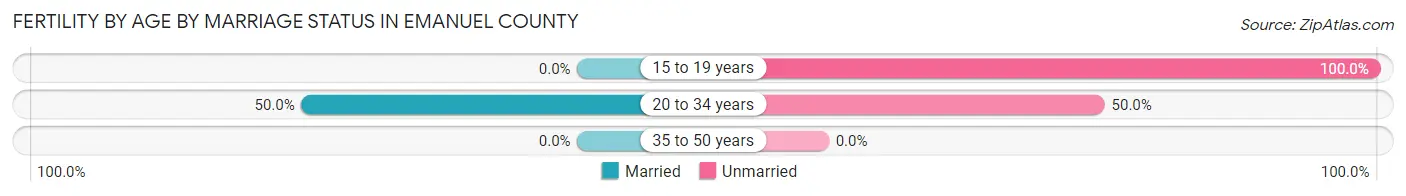
Fertility by Age by Marriage Status in Emanuel County
47.0% of women with births (519) in Emanuel County are married. The highest percentage of unmarried women with births falls into 15 to 19 years age bracket with 100.0% of them unmarried at the time of birth, while the lowest percentage of unmarried women with births belong to 20 to 34 years age bracket with 50.0% of them unmarried.
| Age Bracket | Married | Unmarried |
| 15 to 19 years | 0 (0.0%) | 31 (100.0%) |
| 20 to 34 years | 244 (50.0%) | 244 (50.0%) |
| 35 to 50 years | 0 (0.0%) | 0 (0.0%) |
| Total | 244 (47.0%) | 275 (53.0%) |
Fertility by Education in Emanuel County
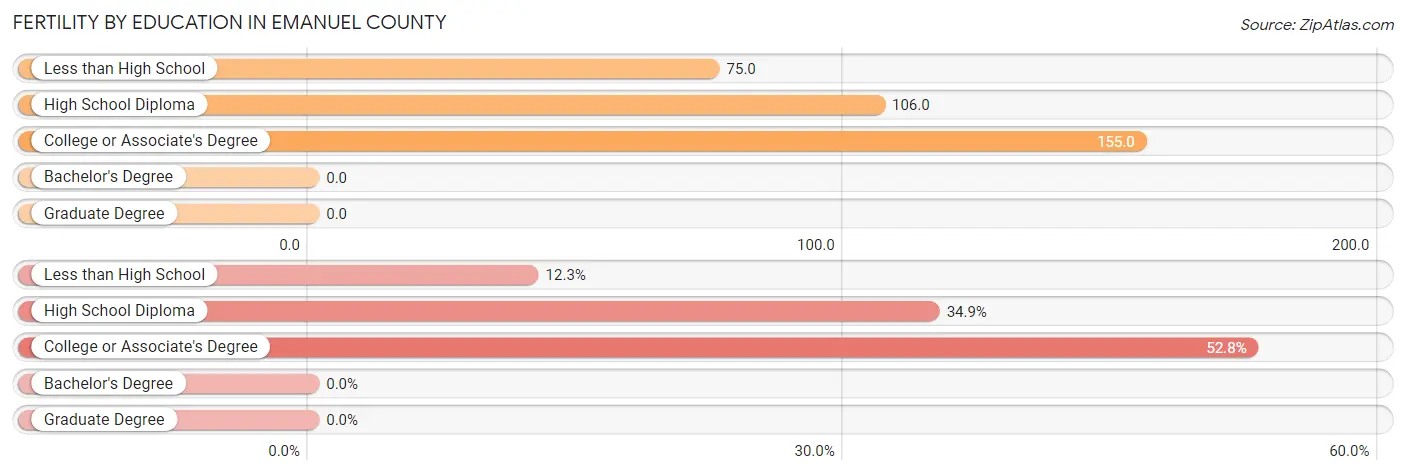
| Educational Attainment | Women with Births | Births / 1,000 Women |
| Less than High School | 64 (12.3%) | 75.0 |
| High School Diploma | 181 (34.9%) | 106.0 |
| College or Associate's Degree | 274 (52.8%) | 155.0 |
| Bachelor's Degree | 0 (0.0%) | 0.0 |
| Graduate Degree | 0 (0.0%) | 0.0 |
| Total | 519 (100.0%) | 107.0 |
Fertility by Education by Marriage Status in Emanuel County
53.0% of women with births in Emanuel County are unmarried. Women with the educational attainment of college or associate's degree are most likely to be married with 60.6% of them married at childbirth, while women with the educational attainment of high school diploma are least likely to be married with 70.7% of them unmarried at childbirth.

| Educational Attainment | Married | Unmarried |
| Less than High School | 25 (39.1%) | 39 (60.9%) |
| High School Diploma | 53 (29.3%) | 128 (70.7%) |
| College or Associate's Degree | 166 (60.6%) | 108 (39.4%) |
| Bachelor's Degree | 0 (0.0%) | 0 (0.0%) |
| Graduate Degree | 0 (0.0%) | 0 (0.0%) |
| Total | 244 (47.0%) | 275 (53.0%) |
Income in Emanuel County
Income Overview in Emanuel County
Per Capita Income in Emanuel County is $24,696, while median incomes of families and households are $53,973 and $47,905 respectively.
| Characteristic | Number | Measure |
| Per Capita Income | 22,907 | $24,696 |
| Median Family Income | 5,629 | $53,973 |
| Mean Family Income | 5,629 | $65,614 |
| Median Household Income | 8,321 | $47,905 |
| Mean Household Income | 8,321 | $62,820 |
| Income Deficit | 5,629 | $8,934 |
| Wage / Income Gap (%) | 22,907 | 28.52% |
| Wage / Income Gap ($) | 22,907 | 71.48¢ per $1 |
| Gini / Inequality Index | 22,907 | 0.45 |
Earnings by Sex in Emanuel County
Average Earnings in Emanuel County are $32,384, $37,221 for men and $26,607 for women, a difference of 28.5%.

| Sex | Number | Average Earnings |
| Male | 5,866 (55.3%) | $37,221 |
| Female | 4,748 (44.7%) | $26,607 |
| Total | 10,614 (100.0%) | $32,384 |
Earnings by Sex by Income Bracket in Emanuel County
The most common earnings brackets in Emanuel County are $35,000 to $39,999 for men (522 | 8.9%) and $22,500 to $24,999 for women (402 | 8.5%).

| Income | Male | Female |
| $2,499 or less | 406 (6.9%) | 375 (7.9%) |
| $2,500 to $4,999 | 160 (2.7%) | 172 (3.6%) |
| $5,000 to $7,499 | 246 (4.2%) | 179 (3.8%) |
| $7,500 to $9,999 | 158 (2.7%) | 98 (2.1%) |
| $10,000 to $12,499 | 213 (3.6%) | 255 (5.4%) |
| $12,500 to $14,999 | 68 (1.2%) | 177 (3.7%) |
| $15,000 to $17,499 | 152 (2.6%) | 177 (3.7%) |
| $17,500 to $19,999 | 231 (3.9%) | 204 (4.3%) |
| $20,000 to $22,499 | 111 (1.9%) | 209 (4.4%) |
| $22,500 to $24,999 | 363 (6.2%) | 402 (8.5%) |
| $25,000 to $29,999 | 235 (4.0%) | 347 (7.3%) |
| $30,000 to $34,999 | 439 (7.5%) | 347 (7.3%) |
| $35,000 to $39,999 | 522 (8.9%) | 272 (5.7%) |
| $40,000 to $44,999 | 477 (8.1%) | 202 (4.3%) |
| $45,000 to $49,999 | 383 (6.5%) | 261 (5.5%) |
| $50,000 to $54,999 | 167 (2.9%) | 196 (4.1%) |
| $55,000 to $64,999 | 388 (6.6%) | 258 (5.4%) |
| $65,000 to $74,999 | 428 (7.3%) | 213 (4.5%) |
| $75,000 to $99,999 | 296 (5.1%) | 175 (3.7%) |
| $100,000+ | 423 (7.2%) | 229 (4.8%) |
| Total | 5,866 (100.0%) | 4,748 (100.0%) |
Earnings by Sex by Educational Attainment in Emanuel County
Average earnings in Emanuel County are $39,041 for men and $29,864 for women, a difference of 23.5%. Men with an educational attainment of graduate degree enjoy the highest average annual earnings of $101,875, while those with less than high school education earn the least with $26,317. Women with an educational attainment of graduate degree earn the most with the average annual earnings of $64,519, while those with less than high school education have the smallest earnings of $23,463.
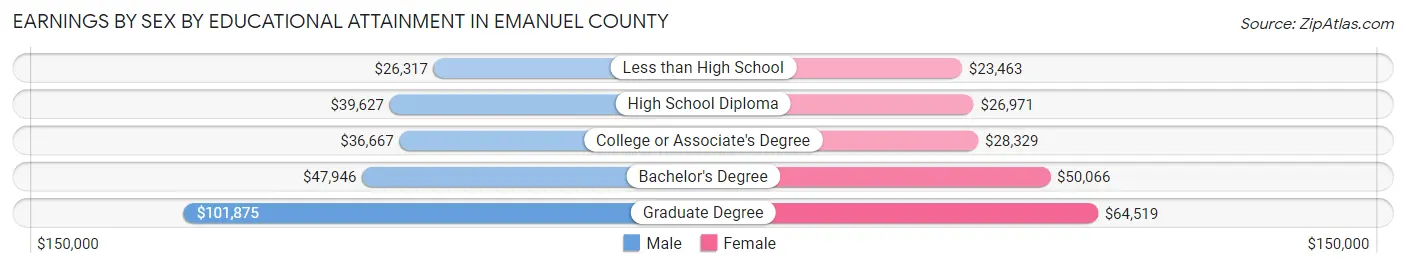
| Educational Attainment | Male Income | Female Income |
| Less than High School | $26,317 | $23,463 |
| High School Diploma | $39,627 | $26,971 |
| College or Associate's Degree | $36,667 | $28,329 |
| Bachelor's Degree | $47,946 | $50,066 |
| Graduate Degree | $101,875 | $64,519 |
| Total | $39,041 | $29,864 |
Family Income in Emanuel County
Family Income Brackets in Emanuel County
According to the Emanuel County family income data, there are 1,323 families falling into the $50,000 to $74,999 income range, which is the most common income bracket and makes up 23.5% of all families. Conversely, the $200,000+ income bracket is the least frequent group with only 101 families (1.8%) belonging to this category.
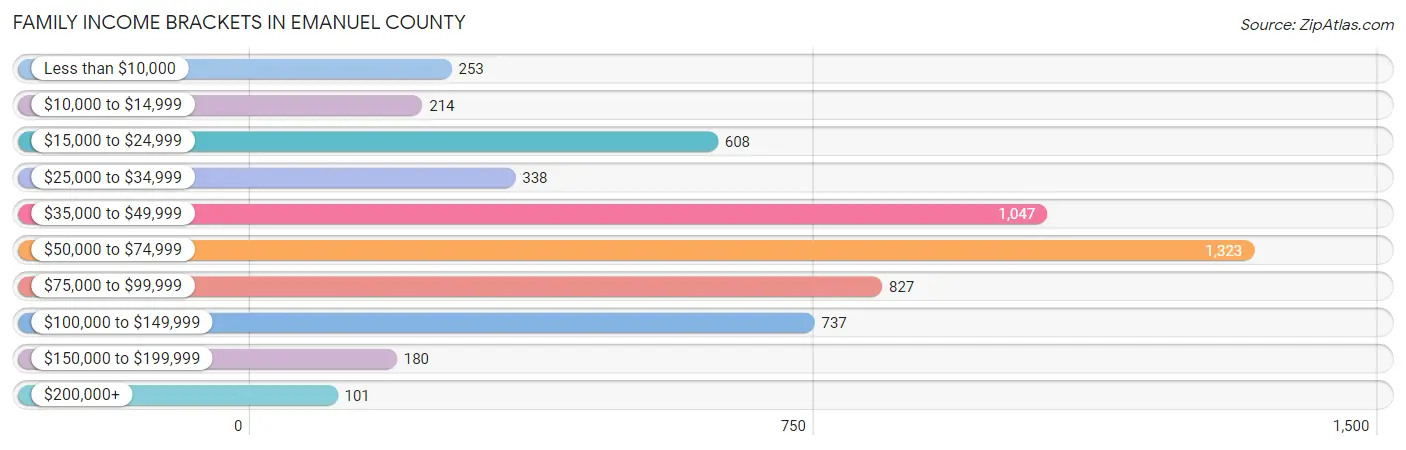
| Income Bracket | # Families | % Families |
| Less than $10,000 | 253 | 4.5% |
| $10,000 to $14,999 | 214 | 3.8% |
| $15,000 to $24,999 | 608 | 10.8% |
| $25,000 to $34,999 | 338 | 6.0% |
| $35,000 to $49,999 | 1,047 | 18.6% |
| $50,000 to $74,999 | 1,323 | 23.5% |
| $75,000 to $99,999 | 827 | 14.7% |
| $100,000 to $149,999 | 737 | 13.1% |
| $150,000 to $199,999 | 180 | 3.2% |
| $200,000+ | 101 | 1.8% |
Family Income by Famaliy Size in Emanuel County
7+ person families (51 | 0.9%) account for the highest median family income in Emanuel County with $92,361 per family, while 2-person families (2,796 | 49.7%) have the highest median income of $25,354 per family member.
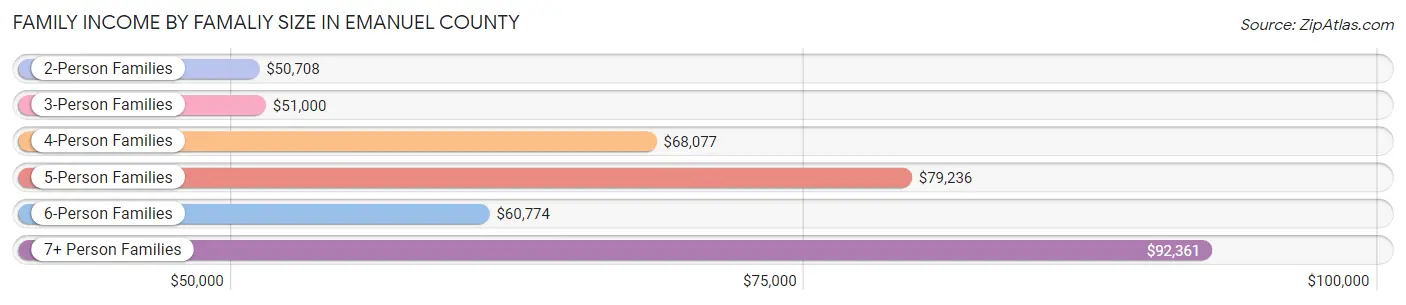
| Income Bracket | # Families | Median Income |
| 2-Person Families | 2,796 (49.7%) | $50,708 |
| 3-Person Families | 1,368 (24.3%) | $51,000 |
| 4-Person Families | 686 (12.2%) | $68,077 |
| 5-Person Families | 577 (10.2%) | $79,236 |
| 6-Person Families | 151 (2.7%) | $60,774 |
| 7+ Person Families | 51 (0.9%) | $92,361 |
| Total | 5,629 (100.0%) | $53,973 |
Family Income by Number of Earners in Emanuel County
The median family income in Emanuel County is $53,973, with families comprising 3+ earners (409) having the highest median family income of $95,129, while families with no earners (883) have the lowest median family income of $24,250, accounting for 7.3% and 15.7% of families, respectively.

| Number of Earners | # Families | Median Income |
| No Earners | 883 (15.7%) | $24,250 |
| 1 Earner | 2,224 (39.5%) | $45,725 |
| 2 Earners | 2,113 (37.5%) | $70,871 |
| 3+ Earners | 409 (7.3%) | $95,129 |
| Total | 5,629 (100.0%) | $53,973 |
Household Income in Emanuel County
Household Income Brackets in Emanuel County
With 1,731 households falling in the category, the $50,000 to $74,999 income range is the most frequent in Emanuel County, accounting for 20.8% of all households. In contrast, only 183 households (2.2%) fall into the $200,000+ income bracket, making it the least populous group.
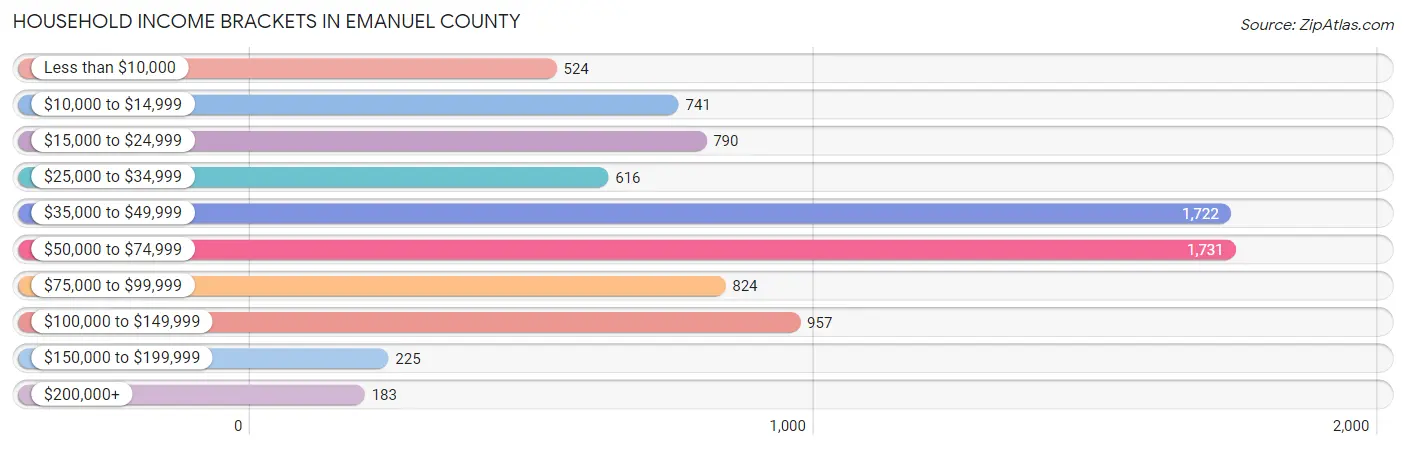
| Income Bracket | # Households | % Households |
| Less than $10,000 | 524 | 6.3% |
| $10,000 to $14,999 | 741 | 8.9% |
| $15,000 to $24,999 | 790 | 9.5% |
| $25,000 to $34,999 | 616 | 7.4% |
| $35,000 to $49,999 | 1,722 | 20.7% |
| $50,000 to $74,999 | 1,731 | 20.8% |
| $75,000 to $99,999 | 824 | 9.9% |
| $100,000 to $149,999 | 957 | 11.5% |
| $150,000 to $199,999 | 225 | 2.7% |
| $200,000+ | 183 | 2.2% |
Household Income by Householder Age in Emanuel County
The median household income in Emanuel County is $47,905, with the highest median household income of $51,554 found in the 45 to 64 years age bracket for the primary householder. A total of 2,832 households (34.0%) fall into this category. Meanwhile, the 65+ years age bracket for the primary householder has the lowest median household income of $36,407, with 2,370 households (28.5%) in this group.
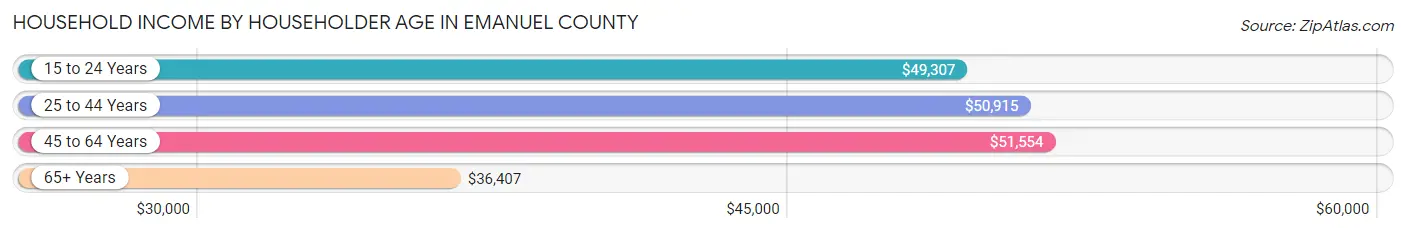
| Income Bracket | # Households | Median Income |
| 15 to 24 Years | 444 (5.3%) | $49,307 |
| 25 to 44 Years | 2,675 (32.2%) | $50,915 |
| 45 to 64 Years | 2,832 (34.0%) | $51,554 |
| 65+ Years | 2,370 (28.5%) | $36,407 |
| Total | 8,321 (100.0%) | $47,905 |
Poverty in Emanuel County
Income Below Poverty by Sex and Age in Emanuel County
With 19.6% poverty level for males and 23.2% for females among the residents of Emanuel County, 5 year old males and under 5 year old females are the most vulnerable to poverty, with 72 males (77.4%) and 320 females (40.6%) in their respective age groups living below the poverty level.

| Age Bracket | Male | Female |
| Under 5 Years | 270 (34.0%) | 320 (40.6%) |
| 5 Years | 72 (77.4%) | 0 (0.0%) |
| 6 to 11 Years | 278 (34.6%) | 195 (20.9%) |
| 12 to 14 Years | 190 (26.3%) | 63 (16.2%) |
| 15 Years | 67 (55.8%) | 61 (24.0%) |
| 16 and 17 Years | 44 (11.4%) | 17 (10.3%) |
| 18 to 24 Years | 62 (5.9%) | 218 (27.3%) |
| 25 to 34 Years | 376 (23.5%) | 491 (33.2%) |
| 35 to 44 Years | 146 (10.9%) | 150 (11.9%) |
| 45 to 54 Years | 195 (15.7%) | 378 (29.9%) |
| 55 to 64 Years | 355 (26.2%) | 246 (17.0%) |
| 65 to 74 Years | 57 (5.6%) | 162 (13.5%) |
| 75 Years and over | 54 (10.5%) | 207 (27.2%) |
| Total | 2,166 (19.6%) | 2,508 (23.2%) |
Income Above Poverty by Sex and Age in Emanuel County
According to the poverty statistics in Emanuel County, males aged 65 to 74 years and females aged 5 years are the age groups that are most secure financially, with 94.4% of males and 100.0% of females in these age groups living above the poverty line.
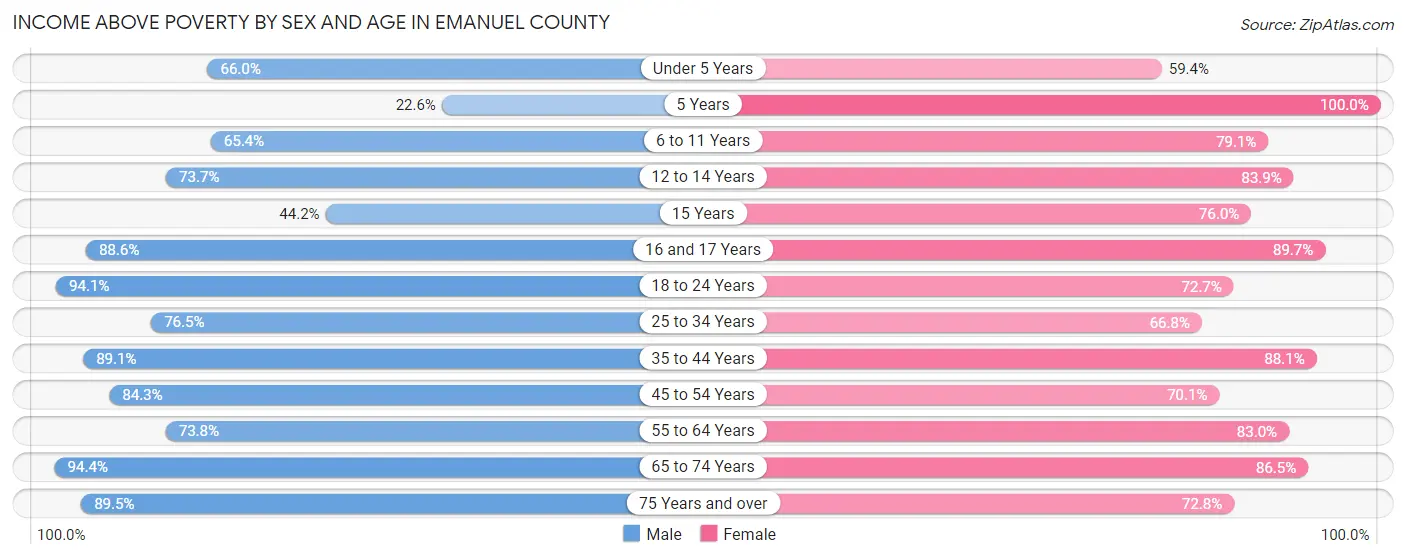
| Age Bracket | Male | Female |
| Under 5 Years | 525 (66.0%) | 468 (59.4%) |
| 5 Years | 21 (22.6%) | 93 (100.0%) |
| 6 to 11 Years | 526 (65.4%) | 740 (79.1%) |
| 12 to 14 Years | 533 (73.7%) | 327 (83.9%) |
| 15 Years | 53 (44.2%) | 193 (76.0%) |
| 16 and 17 Years | 342 (88.6%) | 148 (89.7%) |
| 18 to 24 Years | 996 (94.1%) | 581 (72.7%) |
| 25 to 34 Years | 1,223 (76.5%) | 988 (66.8%) |
| 35 to 44 Years | 1,196 (89.1%) | 1,111 (88.1%) |
| 45 to 54 Years | 1,044 (84.3%) | 884 (70.1%) |
| 55 to 64 Years | 999 (73.8%) | 1,199 (83.0%) |
| 65 to 74 Years | 962 (94.4%) | 1,041 (86.5%) |
| 75 Years and over | 460 (89.5%) | 554 (72.8%) |
| Total | 8,880 (80.4%) | 8,327 (76.8%) |
Income Below Poverty Among Married-Couple Families in Emanuel County
The poverty statistics for married-couple families in Emanuel County show that 5.2% or 178 of the total 3,440 families live below the poverty line. Families with 3 or 4 children have the highest poverty rate of 9.3%, comprising of 40 families. On the other hand, families with 5 or more children have the lowest poverty rate of 0.0%, which includes 0 families.
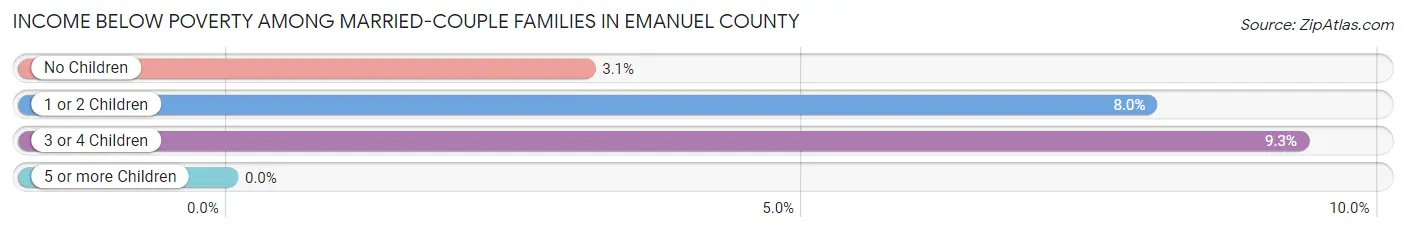
| Children | Above Poverty | Below Poverty |
| No Children | 2,025 (96.9%) | 65 (3.1%) |
| 1 or 2 Children | 840 (92.0%) | 73 (8.0%) |
| 3 or 4 Children | 389 (90.7%) | 40 (9.3%) |
| 5 or more Children | 8 (100.0%) | 0 (0.0%) |
| Total | 3,262 (94.8%) | 178 (5.2%) |
Income Below Poverty Among Single-Parent Households in Emanuel County
According to the poverty data in Emanuel County, 21.3% or 78 single-father households and 40.3% or 734 single-mother households are living below the poverty line. Among single-father households, those with 5 or more children have the highest poverty rate, with 7 households (100.0%) experiencing poverty. Likewise, among single-mother households, those with 1 or 2 children have the highest poverty rate, with 534 households (59.6%) falling below the poverty line.
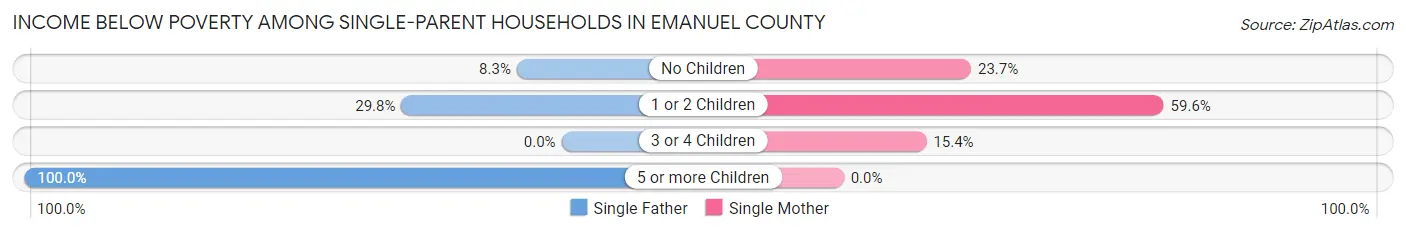
| Children | Single Father | Single Mother |
| No Children | 14 (8.3%) | 163 (23.7%) |
| 1 or 2 Children | 57 (29.8%) | 534 (59.6%) |
| 3 or 4 Children | 0 (0.0%) | 37 (15.4%) |
| 5 or more Children | 7 (100.0%) | 0 (0.0%) |
| Total | 78 (21.3%) | 734 (40.3%) |
Income Below Poverty Among Married-Couple vs Single-Parent Households in Emanuel County
The poverty data for Emanuel County shows that 178 of the married-couple family households (5.2%) and 812 of the single-parent households (37.1%) are living below the poverty level. Within the married-couple family households, those with 3 or 4 children have the highest poverty rate, with 40 households (9.3%) falling below the poverty line. Among the single-parent households, those with 5 or more children have the highest poverty rate, with 7 household (100.0%) living below poverty.

| Children | Married-Couple Families | Single-Parent Households |
| No Children | 65 (3.1%) | 177 (20.7%) |
| 1 or 2 Children | 73 (8.0%) | 591 (54.4%) |
| 3 or 4 Children | 40 (9.3%) | 37 (15.4%) |
| 5 or more Children | 0 (0.0%) | 7 (100.0%) |
| Total | 178 (5.2%) | 812 (37.1%) |
Employment Characteristics in Emanuel County
Employment by Class of Employer in Emanuel County
Among the 8,865 employed individuals in Emanuel County, private company employees (6,024 | 67.9%), self-employed (not incorporated) (743 | 8.4%), and state government employees (661 | 7.5%) make up the most common classes of employment.

| Employer Class | # Employees | % Employees |
| Private Company Employees | 6,024 | 67.9% |
| Self-Employed (Incorporated) | 386 | 4.3% |
| Self-Employed (Not Incorporated) | 743 | 8.4% |
| Not-for-profit Organizations | 308 | 3.5% |
| Local Government Employees | 596 | 6.7% |
| State Government Employees | 661 | 7.5% |
| Federal Government Employees | 91 | 1.0% |
| Unpaid Family Workers | 56 | 0.6% |
| Total | 8,865 | 100.0% |
Employment Status by Age in Emanuel County
According to the labor force statistics for Emanuel County, out of the total population over 16 years of age (17,744), 56.9% or 10,096 individuals are in the labor force, with 8.9% or 899 of them unemployed. The age group with the highest labor force participation rate is 20 to 24 years, with 77.3% or 1,020 individuals in the labor force. Within the labor force, the 16 to 19 years age range has the highest percentage of unemployed individuals, with 20.6% or 85 of them being unemployed.

| Age Bracket | In Labor Force | Unemployed |
| 16 to 19 Years | 413 (35.9%) | 85 (20.6%) |
| 20 to 24 Years | 1,020 (77.3%) | 210 (20.6%) |
| 25 to 29 Years | 1,133 (70.3%) | 162 (14.3%) |
| 30 to 34 Years | 1,212 (74.0%) | 63 (5.2%) |
| 35 to 44 Years | 2,118 (73.5%) | 182 (8.6%) |
| 45 to 54 Years | 1,807 (70.3%) | 143 (7.9%) |
| 55 to 59 Years | 1,083 (71.6%) | 22 (2.0%) |
| 60 to 64 Years | 636 (45.6%) | 27 (4.2%) |
| 65 to 74 Years | 586 (25.9%) | 3 (0.5%) |
| 75 Years and over | 87 (6.2%) | 0 (0.0%) |
| Total | 10,096 (56.9%) | 899 (8.9%) |
Employment Status by Educational Attainment in Emanuel County
According to labor force statistics for Emanuel County, 68.8% of individuals (7,986) out of the total population between 25 and 64 years of age (11,608) are in the labor force, with 7.5% or 599 of them being unemployed. The group with the highest labor force participation rate are those with the educational attainment of bachelor's degree or higher, with 84.7% or 922 individuals in the labor force. Within the labor force, individuals with less than high school education have the highest percentage of unemployment, with 12.3% or 149 of them being unemployed.
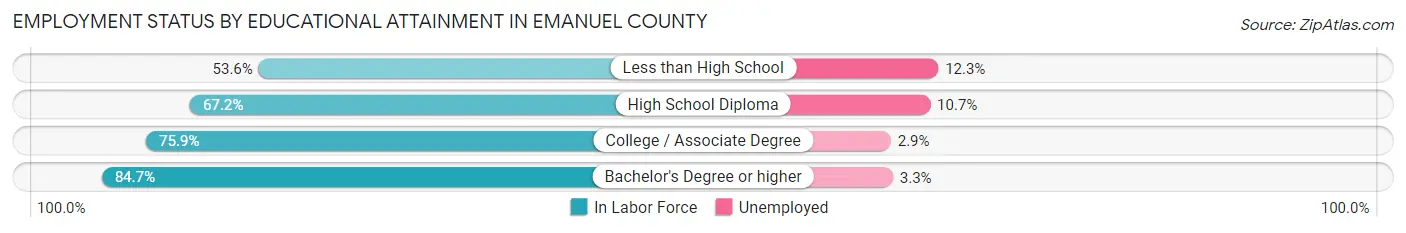
| Educational Attainment | In Labor Force | Unemployed |
| Less than High School | 1,215 (53.6%) | 279 (12.3%) |
| High School Diploma | 3,207 (67.2%) | 511 (10.7%) |
| College / Associate Degree | 2,643 (75.9%) | 101 (2.9%) |
| Bachelor's Degree or higher | 922 (84.7%) | 36 (3.3%) |
| Total | 7,986 (68.8%) | 871 (7.5%) |
Employment Occupations by Sex in Emanuel County
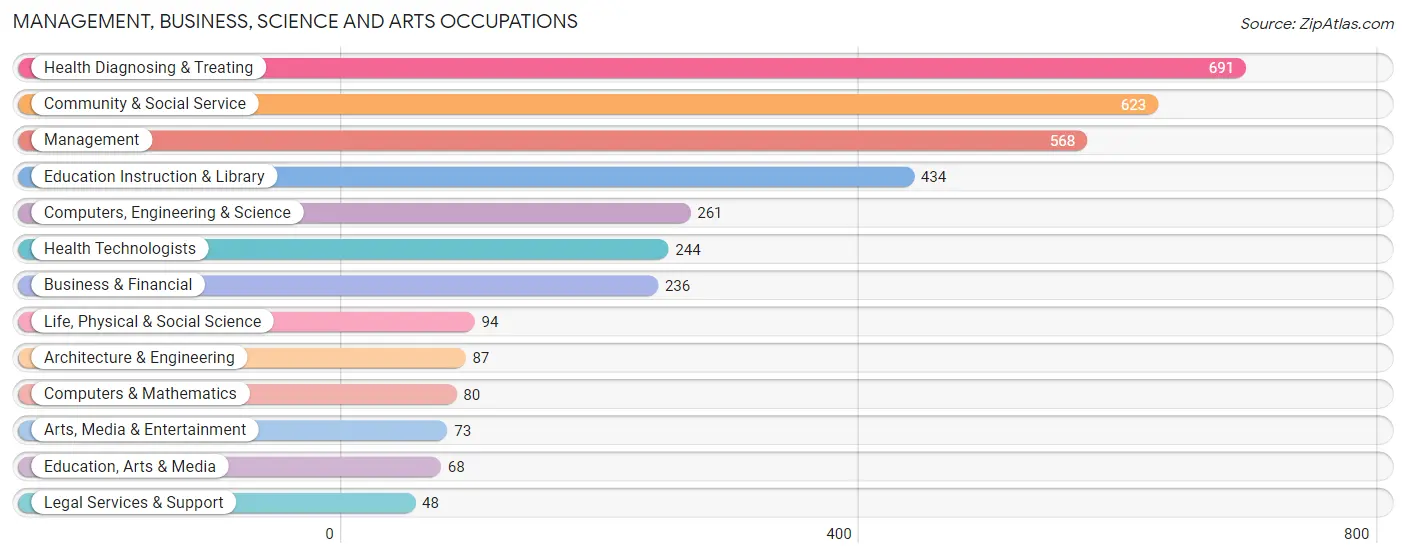
Management, Business, Science and Arts Occupations
The most common Management, Business, Science and Arts occupations in Emanuel County are Health Diagnosing & Treating (691 | 7.5%), Community & Social Service (623 | 6.8%), Management (568 | 6.2%), Education Instruction & Library (434 | 4.7%), and Computers, Engineering & Science (261 | 2.8%).
Management, Business, Science and Arts Occupations by Sex
Within the Management, Business, Science and Arts occupations in Emanuel County, the most male-oriented occupations are Architecture & Engineering (88.5%), Arts, Media & Entertainment (79.4%), and Legal Services & Support (75.0%), while the most female-oriented occupations are Life, Physical & Social Science (88.3%), Health Diagnosing & Treating (86.8%), and Education Instruction & Library (80.2%).
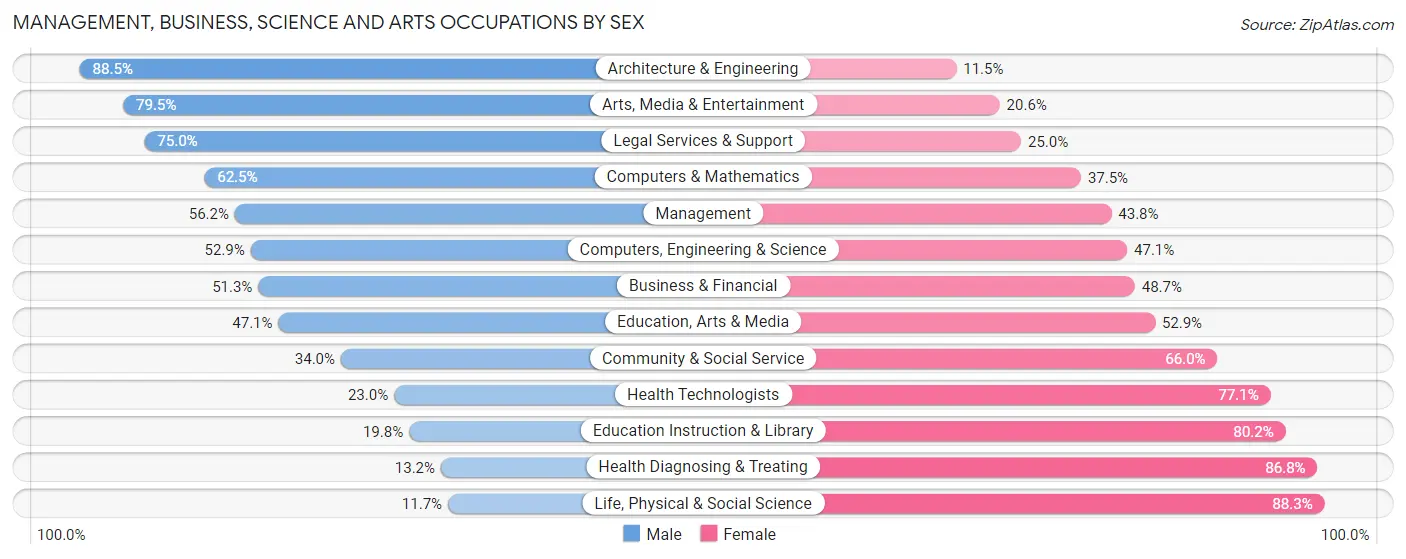
| Occupation | Male | Female |
| Management | 319 (56.2%) | 249 (43.8%) |
| Business & Financial | 121 (51.3%) | 115 (48.7%) |
| Computers, Engineering & Science | 138 (52.9%) | 123 (47.1%) |
| Computers & Mathematics | 50 (62.5%) | 30 (37.5%) |
| Architecture & Engineering | 77 (88.5%) | 10 (11.5%) |
| Life, Physical & Social Science | 11 (11.7%) | 83 (88.3%) |
| Community & Social Service | 212 (34.0%) | 411 (66.0%) |
| Education, Arts & Media | 32 (47.1%) | 36 (52.9%) |
| Legal Services & Support | 36 (75.0%) | 12 (25.0%) |
| Education Instruction & Library | 86 (19.8%) | 348 (80.2%) |
| Arts, Media & Entertainment | 58 (79.4%) | 15 (20.5%) |
| Health Diagnosing & Treating | 91 (13.2%) | 600 (86.8%) |
| Health Technologists | 56 (23.0%) | 188 (77.0%) |
| Total (Category) | 881 (37.0%) | 1,498 (63.0%) |
| Total (Overall) | 5,030 (54.7%) | 4,164 (45.3%) |
Services Occupations
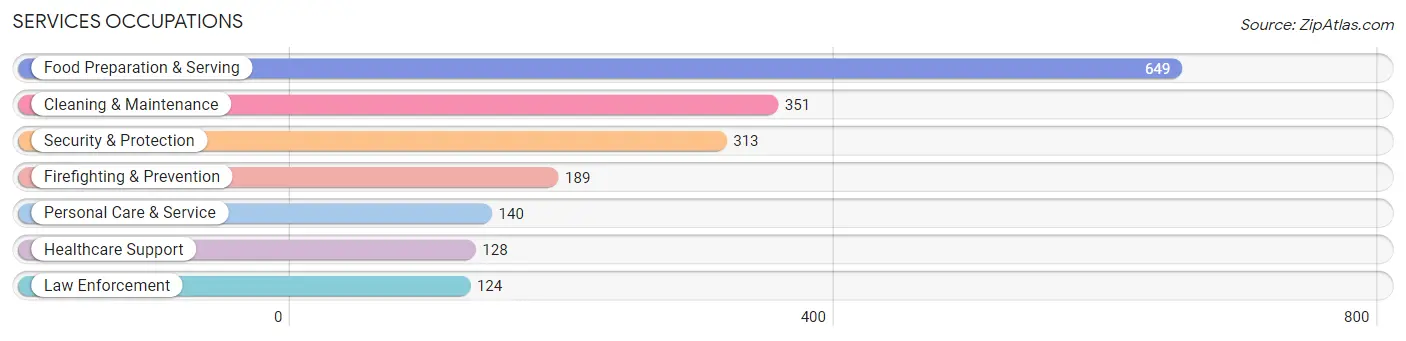
The most common Services occupations in Emanuel County are Food Preparation & Serving (649 | 7.1%), Cleaning & Maintenance (351 | 3.8%), Security & Protection (313 | 3.4%), Firefighting & Prevention (189 | 2.1%), and Personal Care & Service (140 | 1.5%).
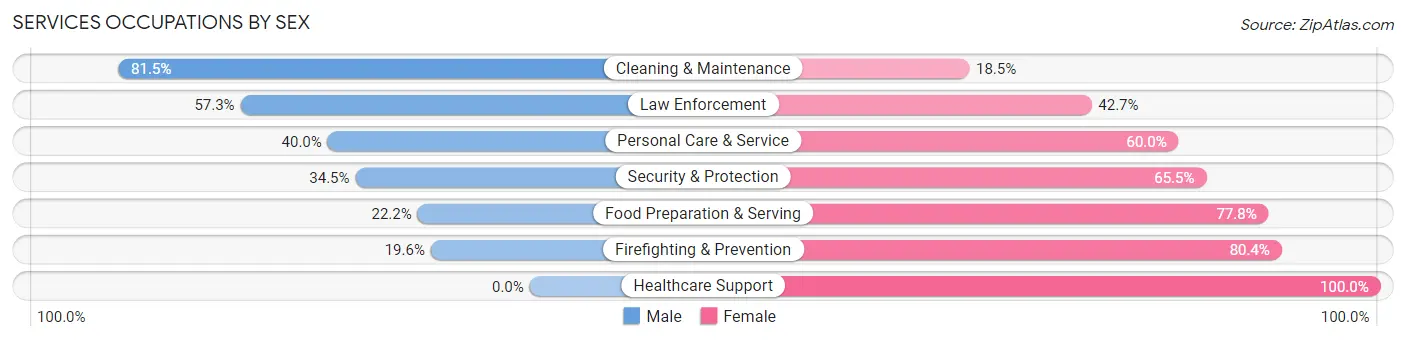
Services Occupations by Sex
Within the Services occupations in Emanuel County, the most male-oriented occupations are Cleaning & Maintenance (81.5%), Law Enforcement (57.3%), and Personal Care & Service (40.0%), while the most female-oriented occupations are Healthcare Support (100.0%), Firefighting & Prevention (80.4%), and Food Preparation & Serving (77.8%).
| Occupation | Male | Female |
| Healthcare Support | 0 (0.0%) | 128 (100.0%) |
| Security & Protection | 108 (34.5%) | 205 (65.5%) |
| Firefighting & Prevention | 37 (19.6%) | 152 (80.4%) |
| Law Enforcement | 71 (57.3%) | 53 (42.7%) |
| Food Preparation & Serving | 144 (22.2%) | 505 (77.8%) |
| Cleaning & Maintenance | 286 (81.5%) | 65 (18.5%) |
| Personal Care & Service | 56 (40.0%) | 84 (60.0%) |
| Total (Category) | 594 (37.6%) | 987 (62.4%) |
| Total (Overall) | 5,030 (54.7%) | 4,164 (45.3%) |
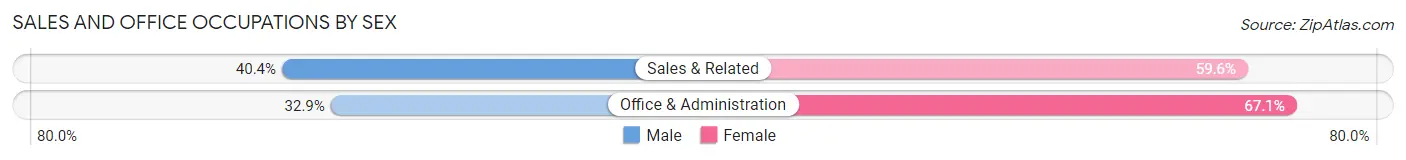
Sales and Office Occupations
The most common Sales and Office occupations in Emanuel County are Office & Administration (890 | 9.7%), and Sales & Related (710 | 7.7%).

Sales and Office Occupations by Sex
| Occupation | Male | Female |
| Sales & Related | 287 (40.4%) | 423 (59.6%) |
| Office & Administration | 293 (32.9%) | 597 (67.1%) |
| Total (Category) | 580 (36.2%) | 1,020 (63.7%) |
| Total (Overall) | 5,030 (54.7%) | 4,164 (45.3%) |
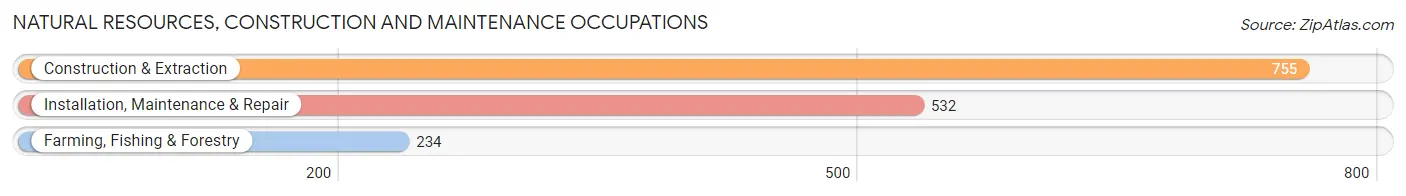
Natural Resources, Construction and Maintenance Occupations
The most common Natural Resources, Construction and Maintenance occupations in Emanuel County are Construction & Extraction (755 | 8.2%), Installation, Maintenance & Repair (532 | 5.8%), and Farming, Fishing & Forestry (234 | 2.5%).
Natural Resources, Construction and Maintenance Occupations by Sex
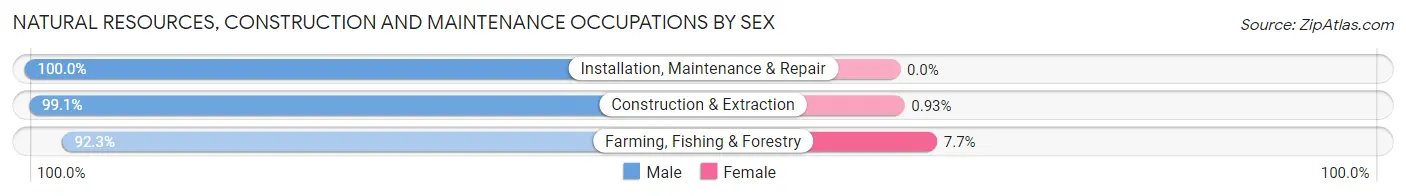
| Occupation | Male | Female |
| Farming, Fishing & Forestry | 216 (92.3%) | 18 (7.7%) |
| Construction & Extraction | 748 (99.1%) | 7 (0.9%) |
| Installation, Maintenance & Repair | 532 (100.0%) | 0 (0.0%) |
| Total (Category) | 1,496 (98.4%) | 25 (1.6%) |
| Total (Overall) | 5,030 (54.7%) | 4,164 (45.3%) |
Production, Transportation and Moving Occupations
The most common Production, Transportation and Moving occupations in Emanuel County are Production (1,016 | 11.1%), Transportation (701 | 7.6%), and Material Moving (396 | 4.3%).

Production, Transportation and Moving Occupations by Sex
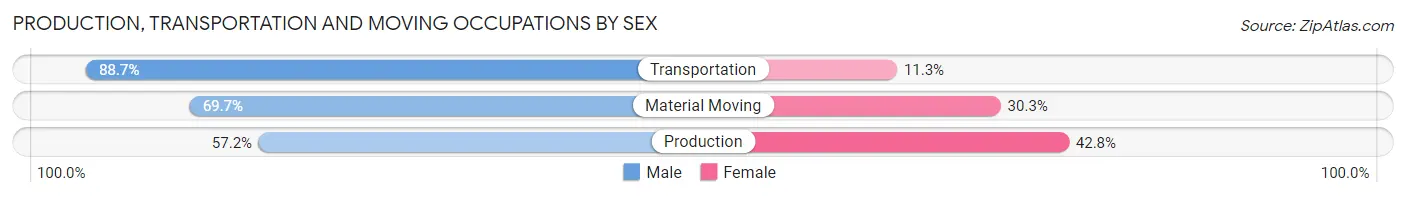
| Occupation | Male | Female |
| Production | 581 (57.2%) | 435 (42.8%) |
| Transportation | 622 (88.7%) | 79 (11.3%) |
| Material Moving | 276 (69.7%) | 120 (30.3%) |
| Total (Category) | 1,479 (70.0%) | 634 (30.0%) |
| Total (Overall) | 5,030 (54.7%) | 4,164 (45.3%) |
Employment Industries by Sex in Emanuel County
Employment Industries in Emanuel County
The major employment industries in Emanuel County include Manufacturing (1,462 | 15.9%), Retail Trade (1,248 | 13.6%), Health Care & Social Assistance (1,122 | 12.2%), Construction (872 | 9.5%), and Educational Services (753 | 8.2%).

Employment Industries by Sex in Emanuel County
The Emanuel County industries that see more men than women are Construction (95.5%), Utilities (95.5%), and Transportation & Warehousing (92.6%), whereas the industries that tend to have a higher number of women are Health Care & Social Assistance (87.4%), Finance & Insurance (78.0%), and Public Administration (72.0%).
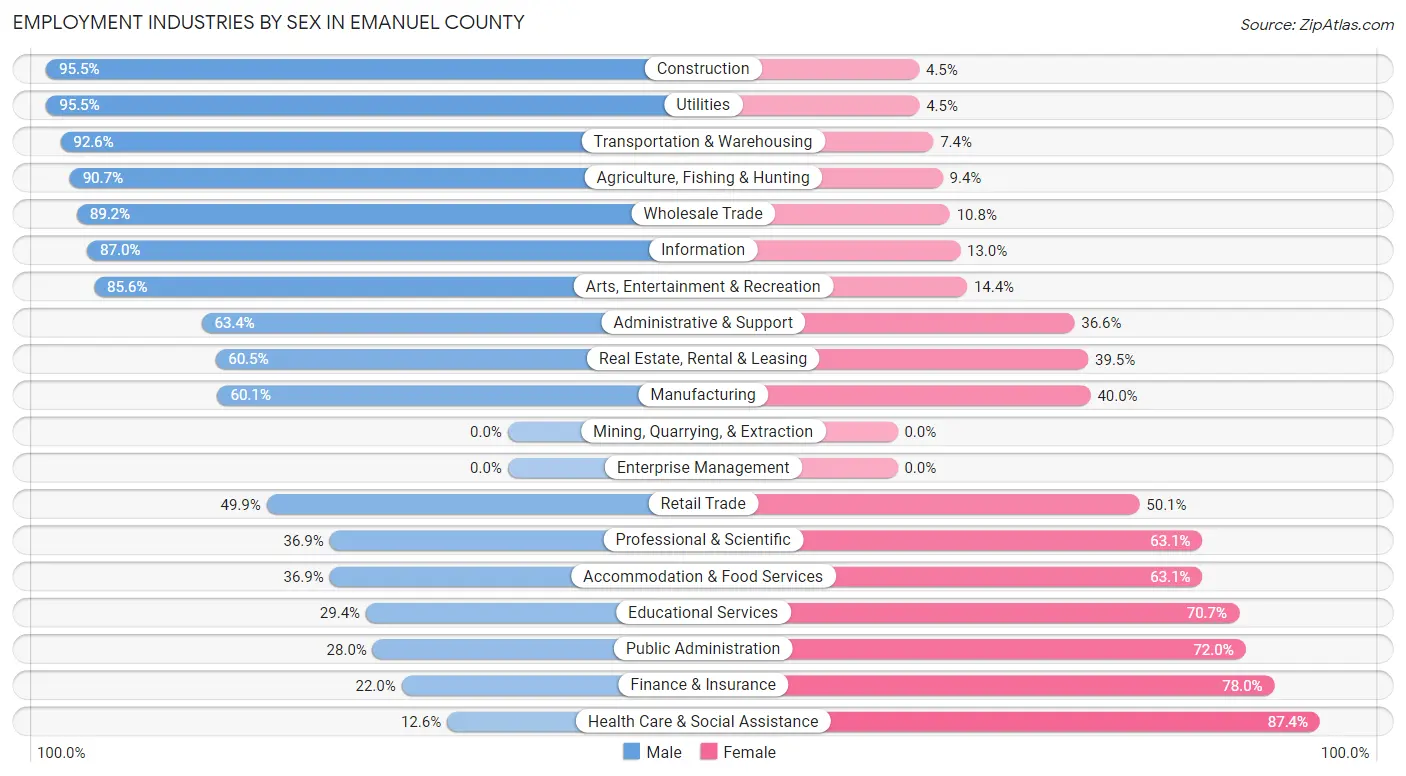
| Industry | Male | Female |
| Agriculture, Fishing & Hunting | 349 (90.6%) | 36 (9.3%) |
| Mining, Quarrying, & Extraction | 0 (0.0%) | 0 (0.0%) |
| Construction | 833 (95.5%) | 39 (4.5%) |
| Manufacturing | 878 (60.1%) | 584 (40.0%) |
| Wholesale Trade | 140 (89.2%) | 17 (10.8%) |
| Retail Trade | 623 (49.9%) | 625 (50.1%) |
| Transportation & Warehousing | 637 (92.6%) | 51 (7.4%) |
| Utilities | 127 (95.5%) | 6 (4.5%) |
| Information | 47 (87.0%) | 7 (13.0%) |
| Finance & Insurance | 20 (22.0%) | 71 (78.0%) |
| Real Estate, Rental & Leasing | 69 (60.5%) | 45 (39.5%) |
| Professional & Scientific | 118 (36.9%) | 202 (63.1%) |
| Enterprise Management | 0 (0.0%) | 0 (0.0%) |
| Administrative & Support | 213 (63.4%) | 123 (36.6%) |
| Educational Services | 221 (29.3%) | 532 (70.7%) |
| Health Care & Social Assistance | 141 (12.6%) | 981 (87.4%) |
| Arts, Entertainment & Recreation | 119 (85.6%) | 20 (14.4%) |
| Accommodation & Food Services | 222 (36.9%) | 380 (63.1%) |
| Public Administration | 125 (28.0%) | 322 (72.0%) |
| Total | 5,030 (54.7%) | 4,164 (45.3%) |
Education in Emanuel County
School Enrollment in Emanuel County
The most common levels of schooling among the 5,306 students in Emanuel County are middle school (1,549 | 29.2%), high school (1,364 | 25.7%), and elementary school (966 | 18.2%).
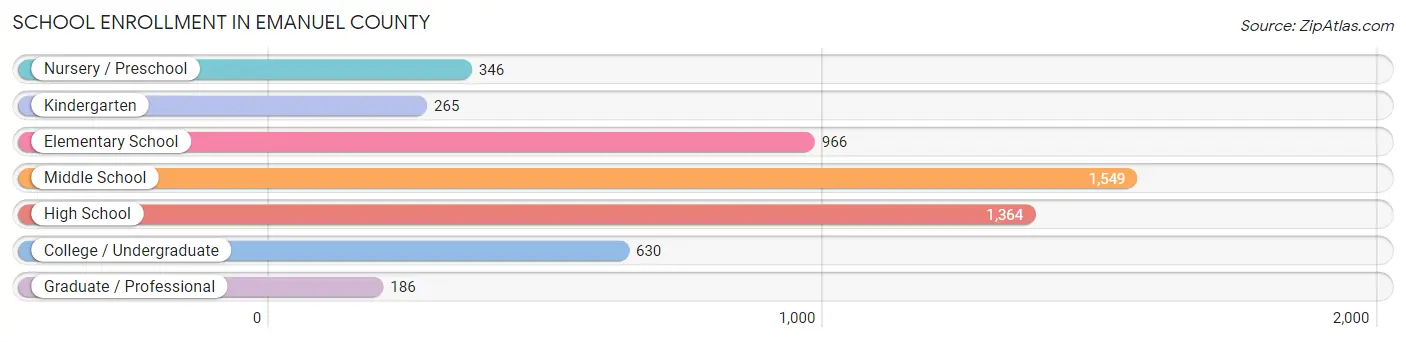
| School Level | # Students | % Students |
| Nursery / Preschool | 346 | 6.5% |
| Kindergarten | 265 | 5.0% |
| Elementary School | 966 | 18.2% |
| Middle School | 1,549 | 29.2% |
| High School | 1,364 | 25.7% |
| College / Undergraduate | 630 | 11.9% |
| Graduate / Professional | 186 | 3.5% |
| Total | 5,306 | 100.0% |
School Enrollment by Age by Funding Source in Emanuel County
Out of a total of 5,306 students who are enrolled in schools in Emanuel County, 891 (16.8%) attend a private institution, while the remaining 4,415 (83.2%) are enrolled in public schools. The age group of 3 to 4 year olds has the highest likelihood of being enrolled in private schools, with 162 (58.3% in the age bracket) enrolled. Conversely, the age group of 18 to 19 year olds has the lowest likelihood of being enrolled in a private school, with 390 (98.5% in the age bracket) attending a public institution.
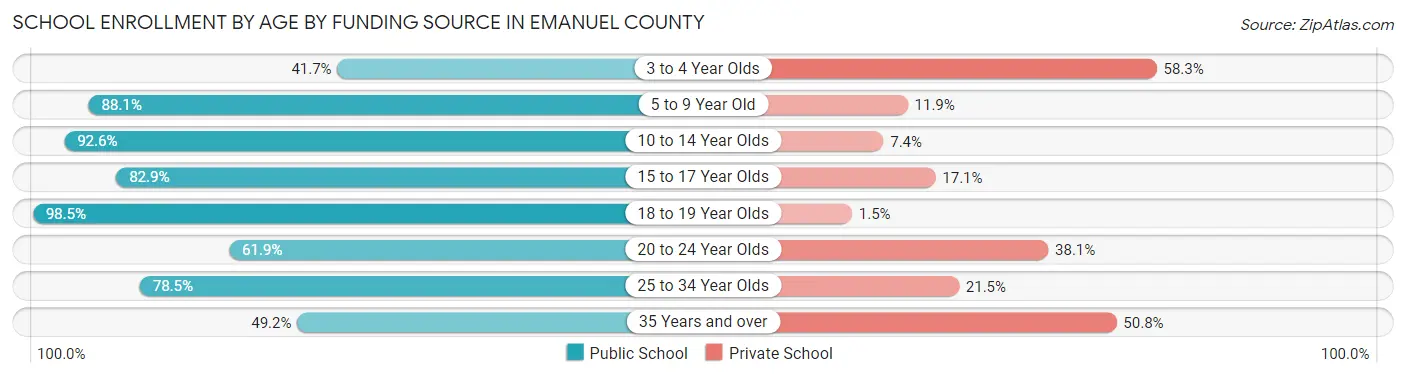
| Age Bracket | Public School | Private School |
| 3 to 4 Year Olds | 116 (41.7%) | 162 (58.3%) |
| 5 to 9 Year Old | 1,006 (88.1%) | 136 (11.9%) |
| 10 to 14 Year Olds | 1,682 (92.6%) | 134 (7.4%) |
| 15 to 17 Year Olds | 733 (82.9%) | 151 (17.1%) |
| 18 to 19 Year Olds | 390 (98.5%) | 6 (1.5%) |
| 20 to 24 Year Olds | 161 (61.9%) | 99 (38.1%) |
| 25 to 34 Year Olds | 172 (78.5%) | 47 (21.5%) |
| 35 Years and over | 153 (49.2%) | 158 (50.8%) |
| Total | 4,415 (83.2%) | 891 (16.8%) |
Educational Attainment by Field of Study in Emanuel County
Education (543 | 28.0%), business (365 | 18.8%), science & technology (295 | 15.2%), arts & humanities (148 | 7.6%), and liberal arts & history (130 | 6.7%) are the most common fields of study among 1,939 individuals in Emanuel County who have obtained a bachelor's degree or higher.
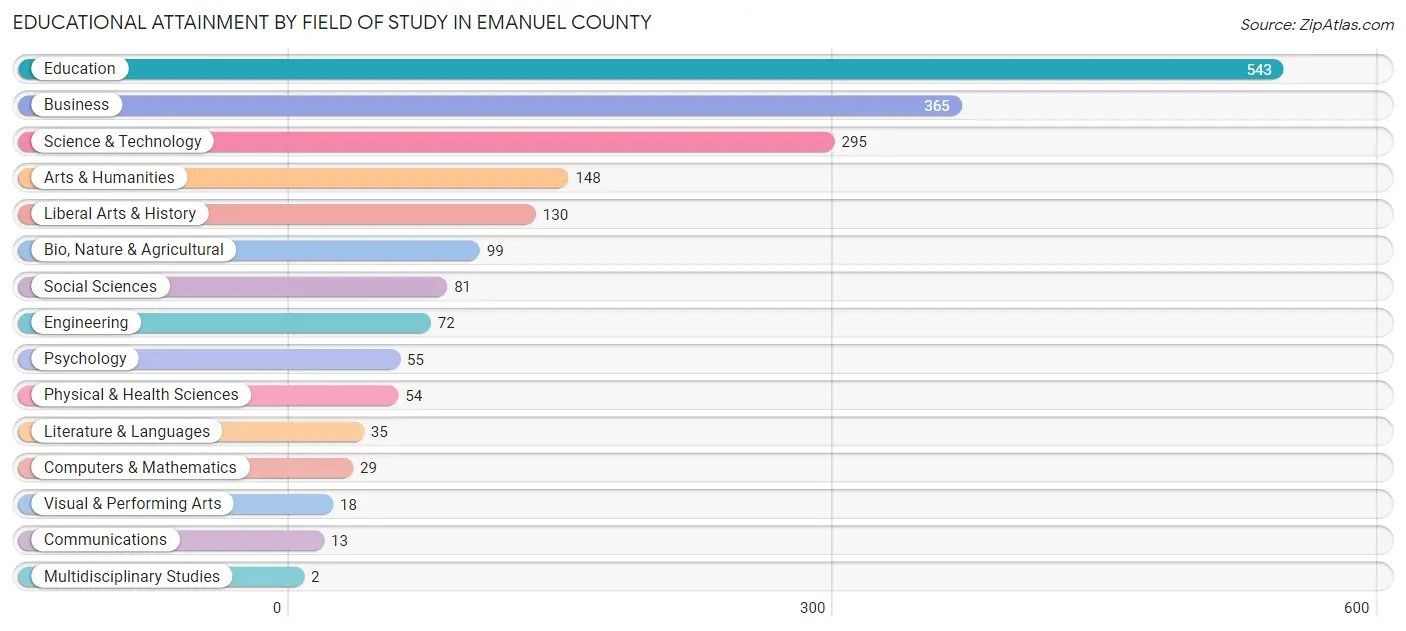
| Field of Study | # Graduates | % Graduates |
| Computers & Mathematics | 29 | 1.5% |
| Bio, Nature & Agricultural | 99 | 5.1% |
| Physical & Health Sciences | 54 | 2.8% |
| Psychology | 55 | 2.8% |
| Social Sciences | 81 | 4.2% |
| Engineering | 72 | 3.7% |
| Multidisciplinary Studies | 2 | 0.1% |
| Science & Technology | 295 | 15.2% |
| Business | 365 | 18.8% |
| Education | 543 | 28.0% |
| Literature & Languages | 35 | 1.8% |
| Liberal Arts & History | 130 | 6.7% |
| Visual & Performing Arts | 18 | 0.9% |
| Communications | 13 | 0.7% |
| Arts & Humanities | 148 | 7.6% |
| Total | 1,939 | 100.0% |
Transportation & Commute in Emanuel County
Vehicle Availability by Sex in Emanuel County
The most prevalent vehicle ownership categories in Emanuel County are males with 2 vehicles (2,100, accounting for 43.1%) and females with 2 vehicles (1,647, making up 52.9%).
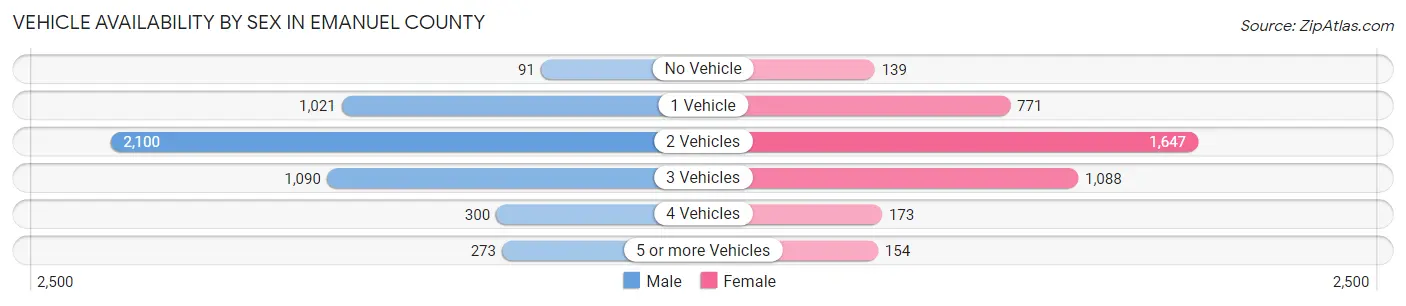
| Vehicles Available | Male | Female |
| No Vehicle | 91 (1.9%) | 139 (3.5%) |
| 1 Vehicle | 1,021 (20.9%) | 771 (19.4%) |
| 2 Vehicles | 2,100 (43.1%) | 1,647 (41.5%) |
| 3 Vehicles | 1,090 (22.4%) | 1,088 (27.4%) |
| 4 Vehicles | 300 (6.1%) | 173 (4.4%) |
| 5 or more Vehicles | 273 (5.6%) | 154 (3.9%) |
| Total | 4,875 (100.0%) | 3,972 (100.0%) |
Commute Time in Emanuel County
The most frequently occuring commute durations in Emanuel County are 5 to 9 minutes (1,270 commuters, 15.1%), 20 to 24 minutes (1,180 commuters, 14.1%), and 60 to 89 minutes (942 commuters, 11.2%).
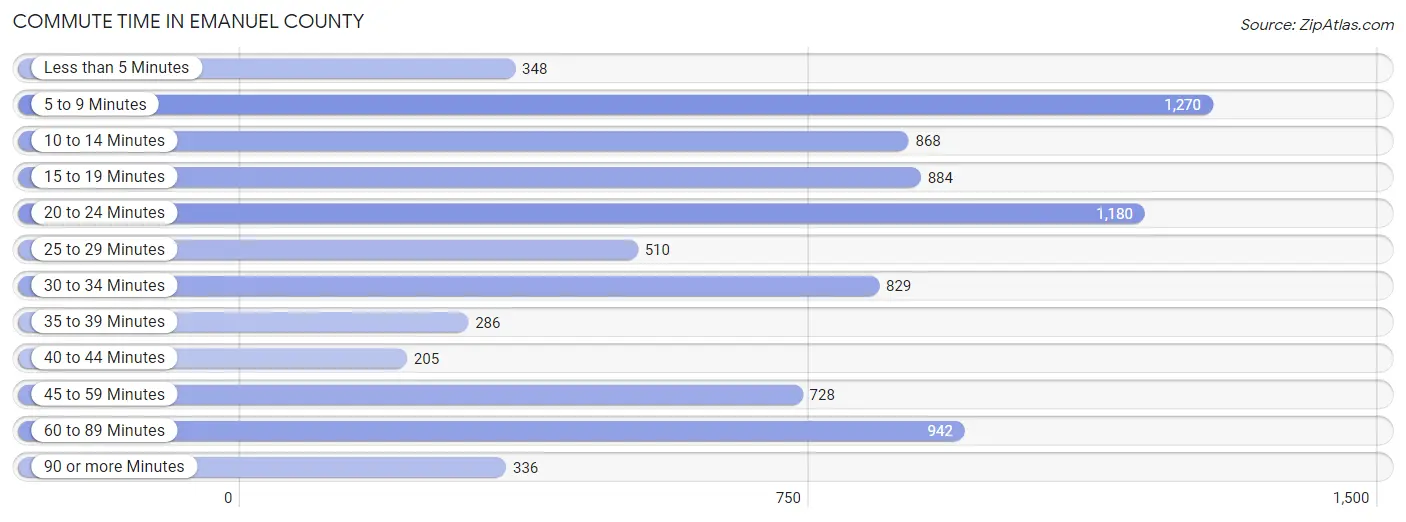
| Commute Time | # Commuters | % Commuters |
| Less than 5 Minutes | 348 | 4.2% |
| 5 to 9 Minutes | 1,270 | 15.1% |
| 10 to 14 Minutes | 868 | 10.3% |
| 15 to 19 Minutes | 884 | 10.5% |
| 20 to 24 Minutes | 1,180 | 14.1% |
| 25 to 29 Minutes | 510 | 6.1% |
| 30 to 34 Minutes | 829 | 9.9% |
| 35 to 39 Minutes | 286 | 3.4% |
| 40 to 44 Minutes | 205 | 2.4% |
| 45 to 59 Minutes | 728 | 8.7% |
| 60 to 89 Minutes | 942 | 11.2% |
| 90 or more Minutes | 336 | 4.0% |
Commute Time by Sex in Emanuel County
The most common commute times in Emanuel County are 60 to 89 minutes (803 commuters, 17.2%) for males and 5 to 9 minutes (662 commuters, 17.8%) for females.

| Commute Time | Male | Female |
| Less than 5 Minutes | 230 (4.9%) | 118 (3.2%) |
| 5 to 9 Minutes | 608 (13.0%) | 662 (17.8%) |
| 10 to 14 Minutes | 361 (7.7%) | 507 (13.6%) |
| 15 to 19 Minutes | 412 (8.8%) | 472 (12.7%) |
| 20 to 24 Minutes | 602 (12.9%) | 578 (15.5%) |
| 25 to 29 Minutes | 287 (6.1%) | 223 (6.0%) |
| 30 to 34 Minutes | 405 (8.7%) | 424 (11.4%) |
| 35 to 39 Minutes | 127 (2.7%) | 159 (4.3%) |
| 40 to 44 Minutes | 134 (2.9%) | 71 (1.9%) |
| 45 to 59 Minutes | 387 (8.3%) | 341 (9.2%) |
| 60 to 89 Minutes | 803 (17.2%) | 139 (3.7%) |
| 90 or more Minutes | 308 (6.6%) | 28 (0.7%) |
Time of Departure to Work by Sex in Emanuel County
The most frequent times of departure to work in Emanuel County are 12:00 AM to 4:59 AM (665, 14.3%) for males and 7:00 AM to 7:29 AM (550, 14.8%) for females.
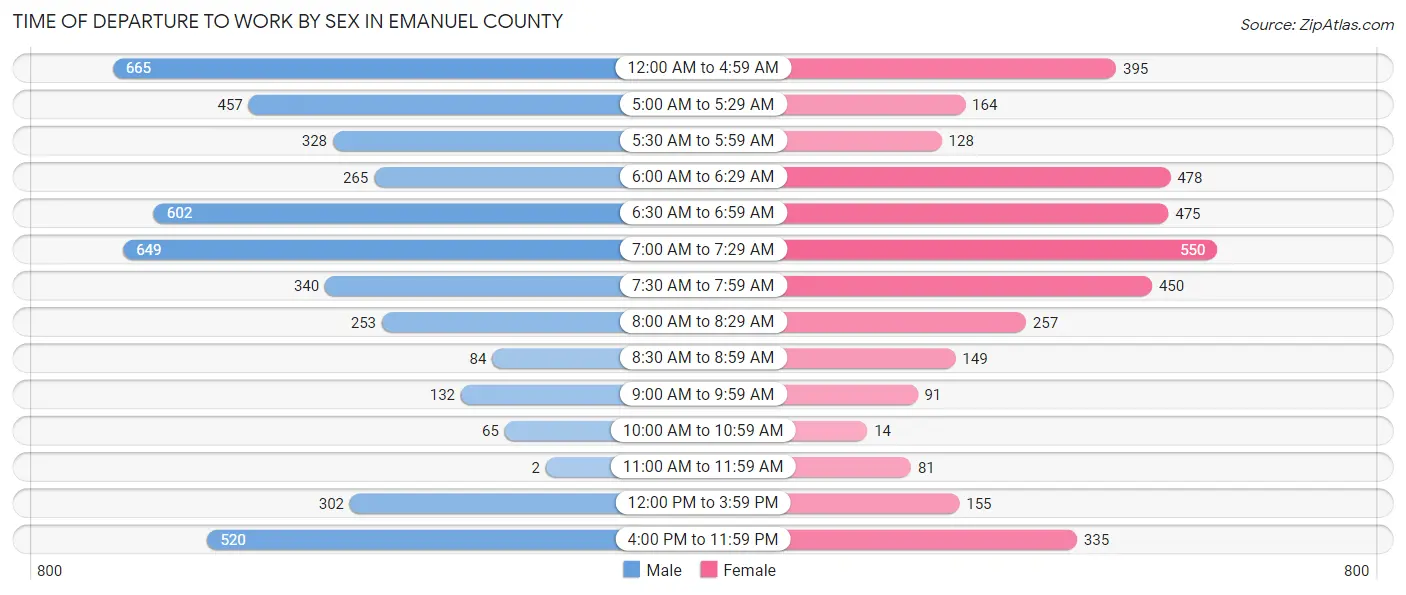
| Time of Departure | Male | Female |
| 12:00 AM to 4:59 AM | 665 (14.3%) | 395 (10.6%) |
| 5:00 AM to 5:29 AM | 457 (9.8%) | 164 (4.4%) |
| 5:30 AM to 5:59 AM | 328 (7.0%) | 128 (3.4%) |
| 6:00 AM to 6:29 AM | 265 (5.7%) | 478 (12.8%) |
| 6:30 AM to 6:59 AM | 602 (12.9%) | 475 (12.8%) |
| 7:00 AM to 7:29 AM | 649 (13.9%) | 550 (14.8%) |
| 7:30 AM to 7:59 AM | 340 (7.3%) | 450 (12.1%) |
| 8:00 AM to 8:29 AM | 253 (5.4%) | 257 (6.9%) |
| 8:30 AM to 8:59 AM | 84 (1.8%) | 149 (4.0%) |
| 9:00 AM to 9:59 AM | 132 (2.8%) | 91 (2.4%) |
| 10:00 AM to 10:59 AM | 65 (1.4%) | 14 (0.4%) |
| 11:00 AM to 11:59 AM | 2 (0.0%) | 81 (2.2%) |
| 12:00 PM to 3:59 PM | 302 (6.5%) | 155 (4.2%) |
| 4:00 PM to 11:59 PM | 520 (11.2%) | 335 (9.0%) |
| Total | 4,664 (100.0%) | 3,722 (100.0%) |
Housing Occupancy in Emanuel County
Occupancy by Ownership in Emanuel County
Of the total 8,321 dwellings in Emanuel County, owner-occupied units account for 4,705 (56.5%), while renter-occupied units make up 3,616 (43.5%).
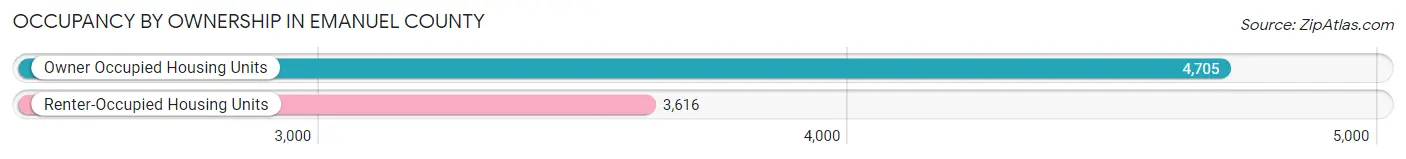
| Occupancy | # Housing Units | % Housing Units |
| Owner Occupied Housing Units | 4,705 | 56.5% |
| Renter-Occupied Housing Units | 3,616 | 43.5% |
| Total Occupied Housing Units | 8,321 | 100.0% |
Occupancy by Household Size in Emanuel County
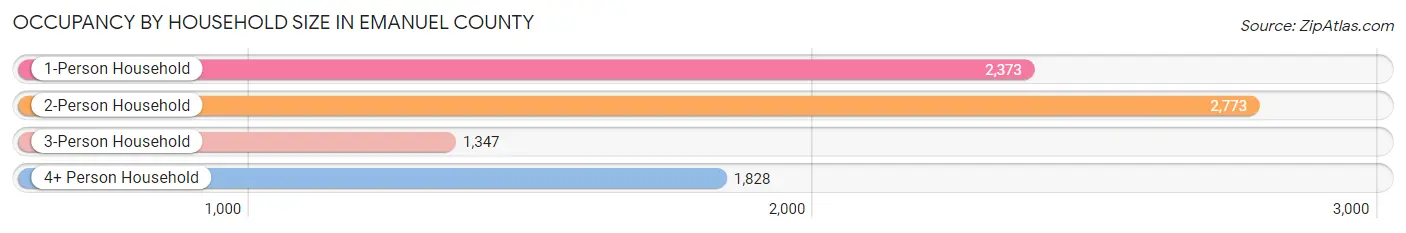
| Household Size | # Housing Units | % Housing Units |
| 1-Person Household | 2,373 | 28.5% |
| 2-Person Household | 2,773 | 33.3% |
| 3-Person Household | 1,347 | 16.2% |
| 4+ Person Household | 1,828 | 22.0% |
| Total Housing Units | 8,321 | 100.0% |
Occupancy by Ownership by Household Size in Emanuel County
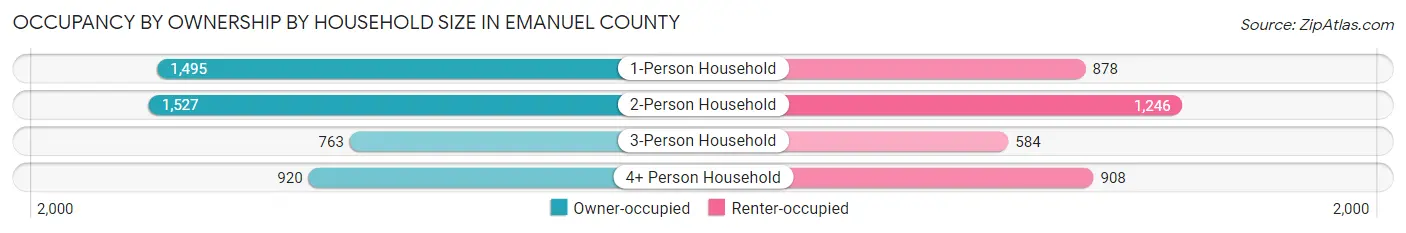
| Household Size | Owner-occupied | Renter-occupied |
| 1-Person Household | 1,495 (63.0%) | 878 (37.0%) |
| 2-Person Household | 1,527 (55.1%) | 1,246 (44.9%) |
| 3-Person Household | 763 (56.6%) | 584 (43.4%) |
| 4+ Person Household | 920 (50.3%) | 908 (49.7%) |
| Total Housing Units | 4,705 (56.5%) | 3,616 (43.5%) |
Occupancy by Educational Attainment in Emanuel County
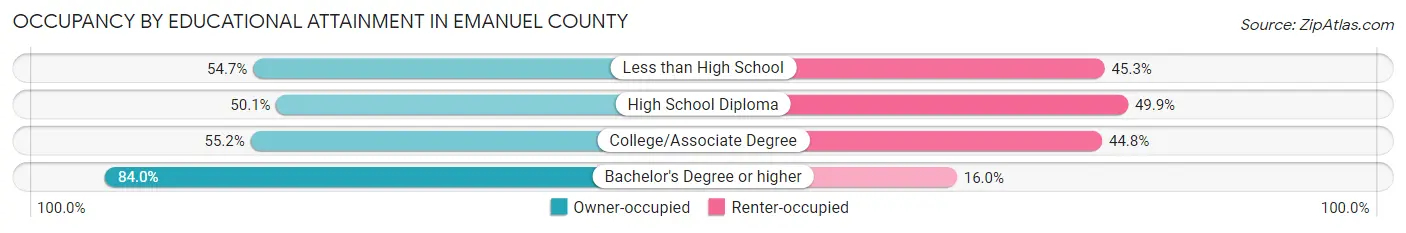
| Household Size | Owner-occupied | Renter-occupied |
| Less than High School | 849 (54.7%) | 703 (45.3%) |
| High School Diploma | 1,584 (50.1%) | 1,579 (49.9%) |
| College/Associate Degree | 1,452 (55.2%) | 1,178 (44.8%) |
| Bachelor's Degree or higher | 820 (84.0%) | 156 (16.0%) |
Occupancy by Age of Householder in Emanuel County
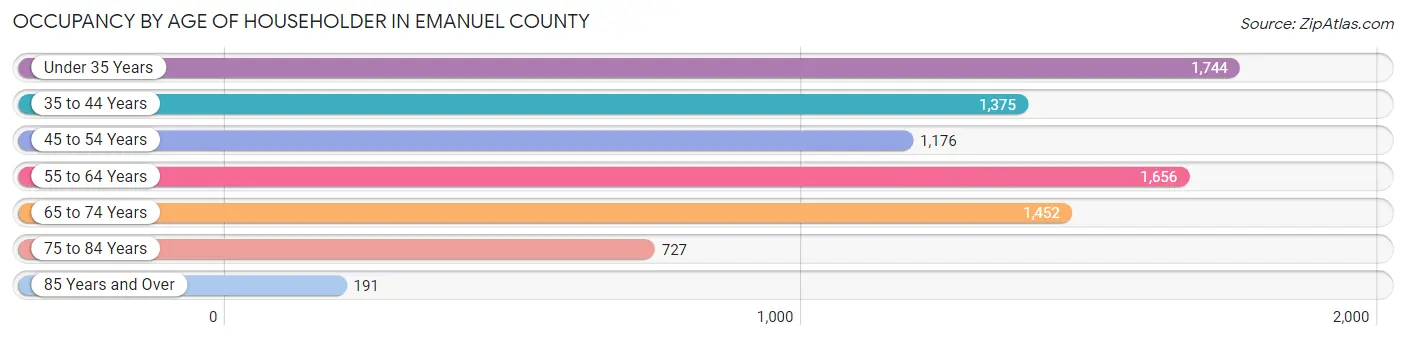
| Age Bracket | # Households | % Households |
| Under 35 Years | 1,744 | 21.0% |
| 35 to 44 Years | 1,375 | 16.5% |
| 45 to 54 Years | 1,176 | 14.1% |
| 55 to 64 Years | 1,656 | 19.9% |
| 65 to 74 Years | 1,452 | 17.4% |
| 75 to 84 Years | 727 | 8.7% |
| 85 Years and Over | 191 | 2.3% |
| Total | 8,321 | 100.0% |
Housing Finances in Emanuel County
Median Income by Occupancy in Emanuel County
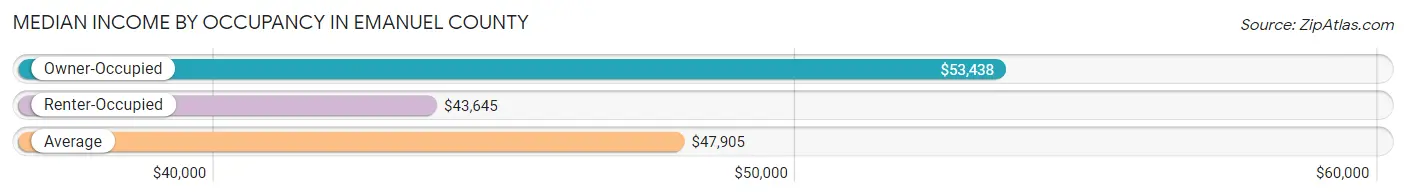
| Occupancy Type | # Households | Median Income |
| Owner-Occupied | 4,705 (56.5%) | $53,438 |
| Renter-Occupied | 3,616 (43.5%) | $43,645 |
| Average | 8,321 (100.0%) | $47,905 |
Occupancy by Householder Income Bracket in Emanuel County
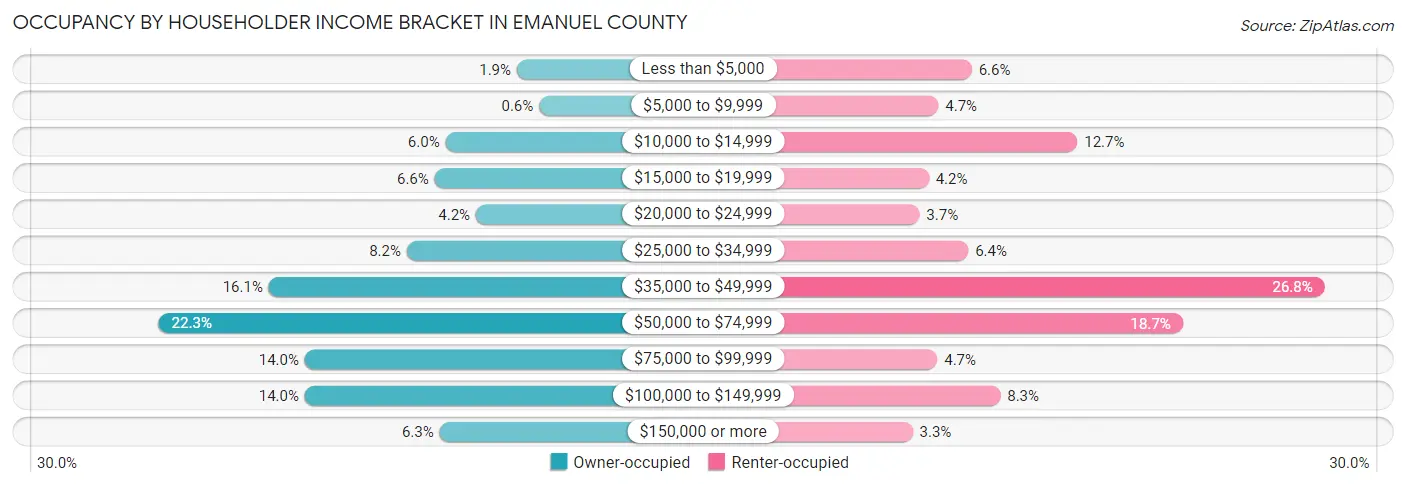
| Income Bracket | Owner-occupied | Renter-occupied |
| Less than $5,000 | 88 (1.9%) | 240 (6.6%) |
| $5,000 to $9,999 | 28 (0.6%) | 171 (4.7%) |
| $10,000 to $14,999 | 280 (5.9%) | 458 (12.7%) |
| $15,000 to $19,999 | 309 (6.6%) | 151 (4.2%) |
| $20,000 to $24,999 | 198 (4.2%) | 132 (3.6%) |
| $25,000 to $34,999 | 384 (8.2%) | 233 (6.4%) |
| $35,000 to $49,999 | 755 (16.1%) | 969 (26.8%) |
| $50,000 to $74,999 | 1,051 (22.3%) | 676 (18.7%) |
| $75,000 to $99,999 | 658 (14.0%) | 169 (4.7%) |
| $100,000 to $149,999 | 658 (14.0%) | 299 (8.3%) |
| $150,000 or more | 296 (6.3%) | 118 (3.3%) |
| Total | 4,705 (100.0%) | 3,616 (100.0%) |
Monthly Housing Cost Tiers in Emanuel County
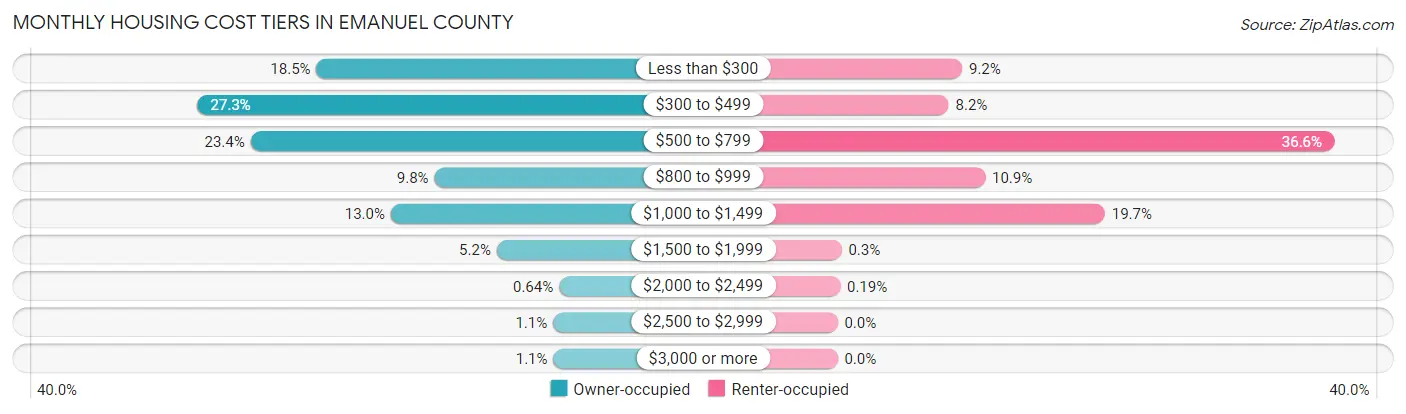
| Monthly Cost | Owner-occupied | Renter-occupied |
| Less than $300 | 871 (18.5%) | 332 (9.2%) |
| $300 to $499 | 1,283 (27.3%) | 296 (8.2%) |
| $500 to $799 | 1,099 (23.4%) | 1,322 (36.6%) |
| $800 to $999 | 462 (9.8%) | 393 (10.9%) |
| $1,000 to $1,499 | 613 (13.0%) | 712 (19.7%) |
| $1,500 to $1,999 | 246 (5.2%) | 11 (0.3%) |
| $2,000 to $2,499 | 30 (0.6%) | 7 (0.2%) |
| $2,500 to $2,999 | 51 (1.1%) | 0 (0.0%) |
| $3,000 or more | 50 (1.1%) | 0 (0.0%) |
| Total | 4,705 (100.0%) | 3,616 (100.0%) |
Physical Housing Characteristics in Emanuel County
Housing Structures in Emanuel County
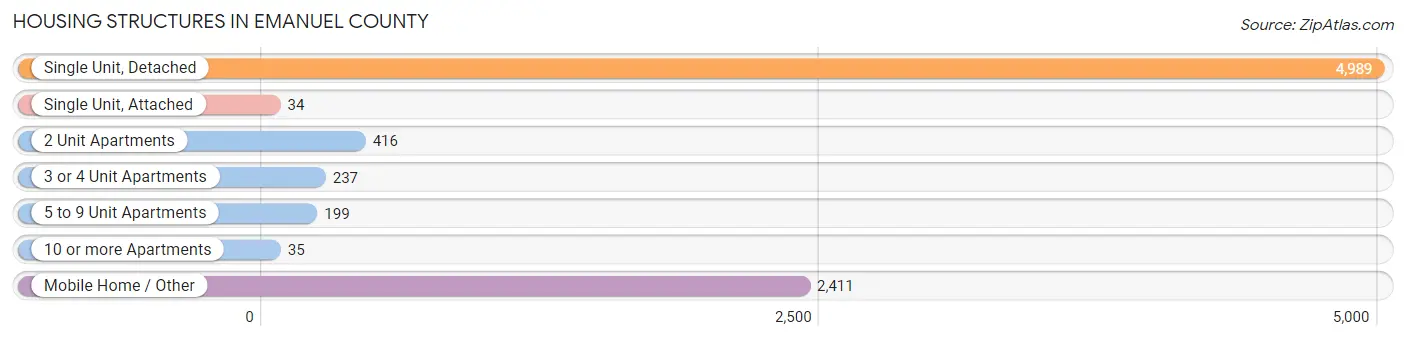
| Structure Type | # Housing Units | % Housing Units |
| Single Unit, Detached | 4,989 | 60.0% |
| Single Unit, Attached | 34 | 0.4% |
| 2 Unit Apartments | 416 | 5.0% |
| 3 or 4 Unit Apartments | 237 | 2.9% |
| 5 to 9 Unit Apartments | 199 | 2.4% |
| 10 or more Apartments | 35 | 0.4% |
| Mobile Home / Other | 2,411 | 29.0% |
| Total | 8,321 | 100.0% |
Housing Structures by Occupancy in Emanuel County
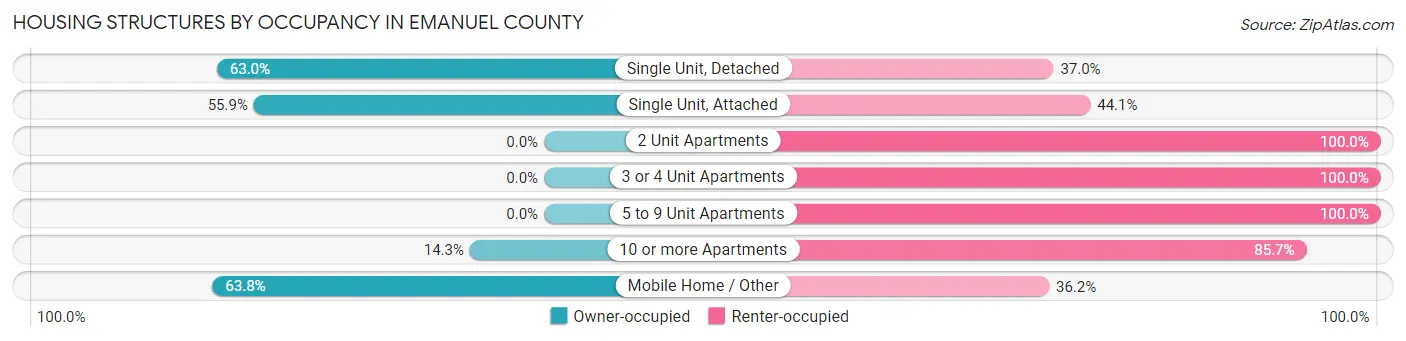
| Structure Type | Owner-occupied | Renter-occupied |
| Single Unit, Detached | 3,142 (63.0%) | 1,847 (37.0%) |
| Single Unit, Attached | 19 (55.9%) | 15 (44.1%) |
| 2 Unit Apartments | 0 (0.0%) | 416 (100.0%) |
| 3 or 4 Unit Apartments | 0 (0.0%) | 237 (100.0%) |
| 5 to 9 Unit Apartments | 0 (0.0%) | 199 (100.0%) |
| 10 or more Apartments | 5 (14.3%) | 30 (85.7%) |
| Mobile Home / Other | 1,539 (63.8%) | 872 (36.2%) |
| Total | 4,705 (56.5%) | 3,616 (43.5%) |
Housing Structures by Number of Rooms in Emanuel County
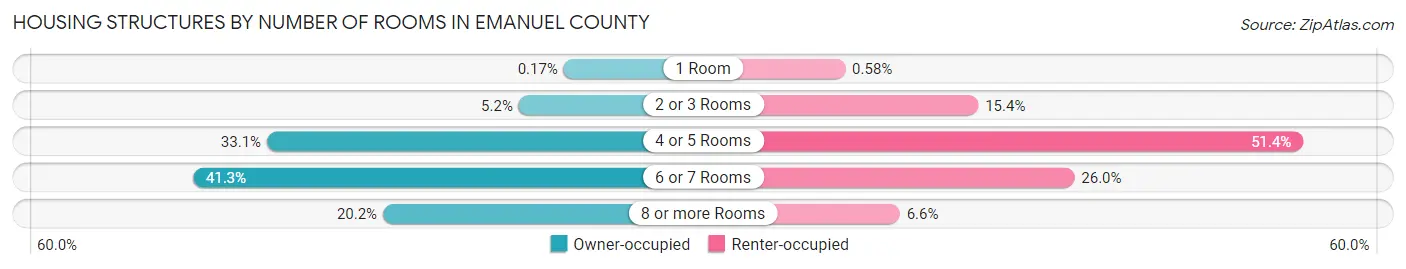
| Number of Rooms | Owner-occupied | Renter-occupied |
| 1 Room | 8 (0.2%) | 21 (0.6%) |
| 2 or 3 Rooms | 243 (5.2%) | 555 (15.3%) |
| 4 or 5 Rooms | 1,558 (33.1%) | 1,859 (51.4%) |
| 6 or 7 Rooms | 1,944 (41.3%) | 941 (26.0%) |
| 8 or more Rooms | 952 (20.2%) | 240 (6.6%) |
| Total | 4,705 (100.0%) | 3,616 (100.0%) |
Housing Structure by Heating Type in Emanuel County
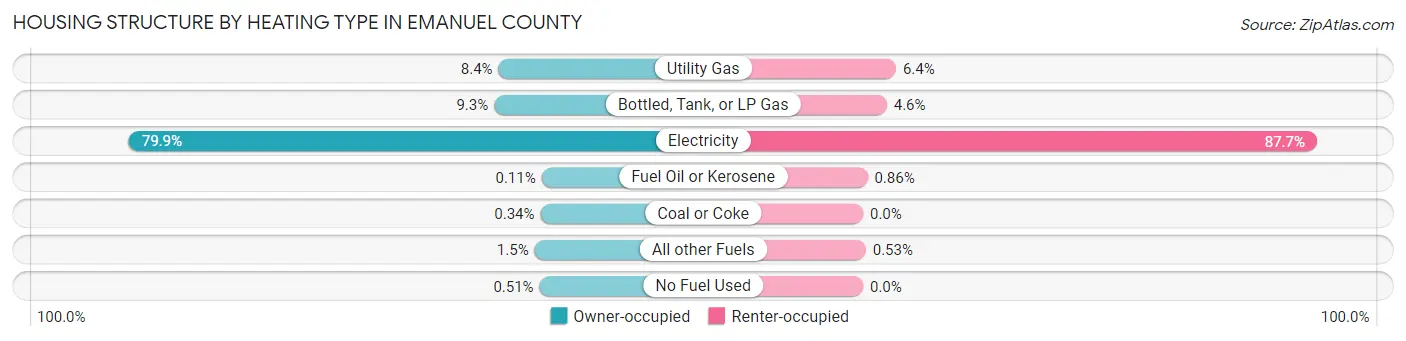
| Heating Type | Owner-occupied | Renter-occupied |
| Utility Gas | 397 (8.4%) | 230 (6.4%) |
| Bottled, Tank, or LP Gas | 437 (9.3%) | 166 (4.6%) |
| Electricity | 3,757 (79.8%) | 3,170 (87.7%) |
| Fuel Oil or Kerosene | 5 (0.1%) | 31 (0.9%) |
| Coal or Coke | 16 (0.3%) | 0 (0.0%) |
| All other Fuels | 69 (1.5%) | 19 (0.5%) |
| No Fuel Used | 24 (0.5%) | 0 (0.0%) |
| Total | 4,705 (100.0%) | 3,616 (100.0%) |
Household Vehicle Usage in Emanuel County
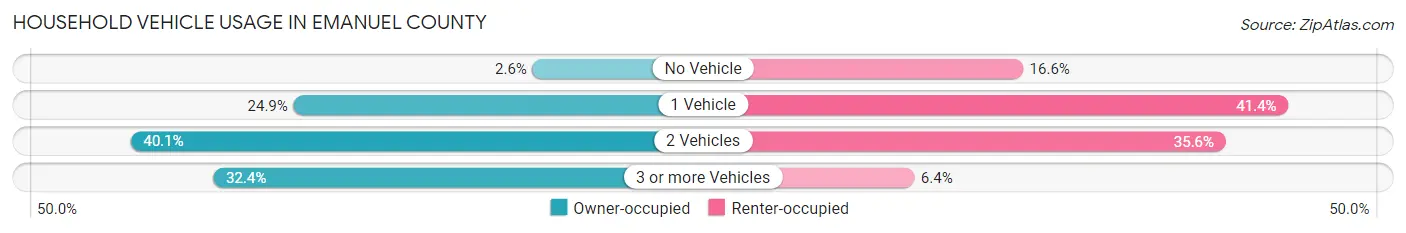
| Vehicles per Household | Owner-occupied | Renter-occupied |
| No Vehicle | 121 (2.6%) | 600 (16.6%) |
| 1 Vehicle | 1,171 (24.9%) | 1,497 (41.4%) |
| 2 Vehicles | 1,888 (40.1%) | 1,286 (35.6%) |
| 3 or more Vehicles | 1,525 (32.4%) | 233 (6.4%) |
| Total | 4,705 (100.0%) | 3,616 (100.0%) |
Real Estate & Mortgages in Emanuel County
Real Estate and Mortgage Overview in Emanuel County
| Characteristic | Without Mortgage | With Mortgage |
| Housing Units | 2,818 | 1,887 |
| Median Property Value | $79,400 | $94,600 |
| Median Household Income | $46,111 | $109 |
| Monthly Housing Costs | $386 | $45 |
| Real Estate Taxes | $703 | $63 |
Property Value by Mortgage Status in Emanuel County
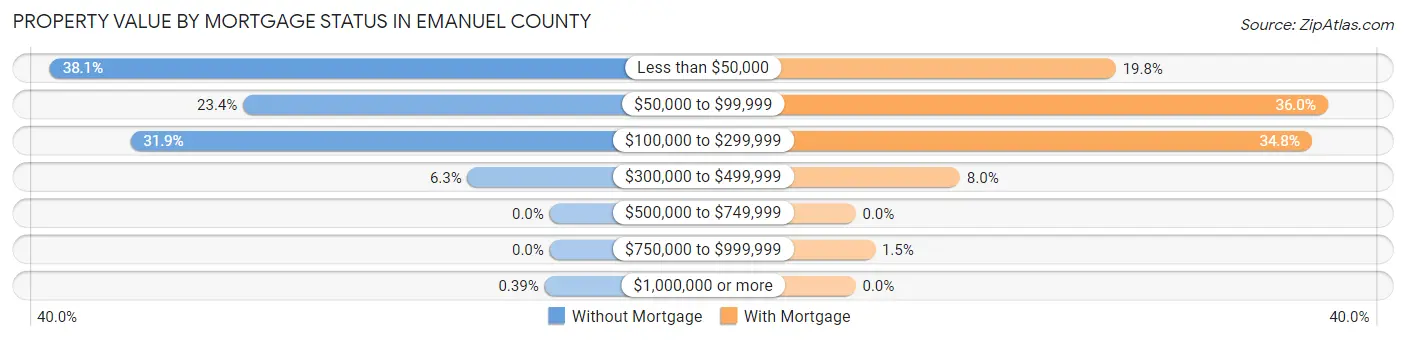
| Property Value | Without Mortgage | With Mortgage |
| Less than $50,000 | 1,073 (38.1%) | 374 (19.8%) |
| $50,000 to $99,999 | 658 (23.4%) | 679 (36.0%) |
| $100,000 to $299,999 | 900 (31.9%) | 656 (34.8%) |
| $300,000 to $499,999 | 176 (6.2%) | 150 (8.0%) |
| $500,000 to $749,999 | 0 (0.0%) | 0 (0.0%) |
| $750,000 to $999,999 | 0 (0.0%) | 28 (1.5%) |
| $1,000,000 or more | 11 (0.4%) | 0 (0.0%) |
| Total | 2,818 (100.0%) | 1,887 (100.0%) |
Household Income by Mortgage Status in Emanuel County

| Household Income | Without Mortgage | With Mortgage |
| Less than $10,000 | 95 (3.4%) | 51 (2.7%) |
| $10,000 to $24,999 | 554 (19.7%) | 21 (1.1%) |
| $25,000 to $34,999 | 285 (10.1%) | 233 (12.3%) |
| $35,000 to $49,999 | 568 (20.2%) | 99 (5.2%) |
| $50,000 to $74,999 | 650 (23.1%) | 187 (9.9%) |
| $75,000 to $99,999 | 272 (9.7%) | 401 (21.2%) |
| $100,000 to $149,999 | 207 (7.3%) | 386 (20.5%) |
| $150,000 or more | 187 (6.6%) | 451 (23.9%) |
| Total | 2,818 (100.0%) | 1,887 (100.0%) |
Property Value to Household Income Ratio in Emanuel County
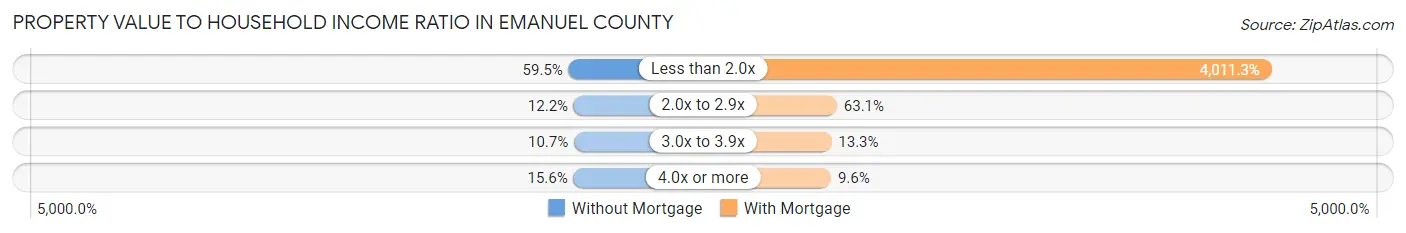
| Value-to-Income Ratio | Without Mortgage | With Mortgage |
| Less than 2.0x | 1,676 (59.5%) | 75,694 (4,011.3%) |
| 2.0x to 2.9x | 344 (12.2%) | 1,191 (63.1%) |
| 3.0x to 3.9x | 302 (10.7%) | 250 (13.3%) |
| 4.0x or more | 439 (15.6%) | 182 (9.6%) |
| Total | 2,818 (100.0%) | 1,887 (100.0%) |
Real Estate Taxes by Mortgage Status in Emanuel County
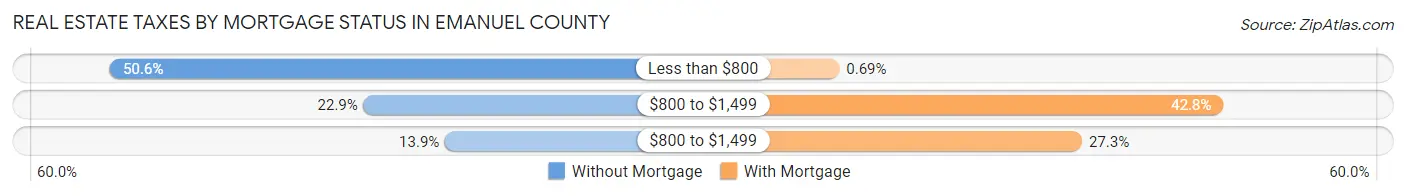
| Property Taxes | Without Mortgage | With Mortgage |
| Less than $800 | 1,427 (50.6%) | 13 (0.7%) |
| $800 to $1,499 | 644 (22.9%) | 807 (42.8%) |
| $800 to $1,499 | 392 (13.9%) | 515 (27.3%) |
| Total | 2,818 (100.0%) | 1,887 (100.0%) |
Health & Disability in Emanuel County
Health Insurance Coverage by Age in Emanuel County

| Age Bracket | With Coverage | Without Coverage |
| Under 6 Years | 1,753 (97.7%) | 41 (2.3%) |
| 6 to 18 Years | 4,043 (95.3%) | 200 (4.7%) |
| 19 to 25 Years | 1,279 (69.6%) | 559 (30.4%) |
| 26 to 34 Years | 2,047 (73.8%) | 726 (26.2%) |
| 35 to 44 Years | 1,854 (71.2%) | 749 (28.8%) |
| 45 to 54 Years | 1,711 (68.5%) | 787 (31.5%) |
| 55 to 64 Years | 2,199 (78.6%) | 600 (21.4%) |
| 65 to 74 Years | 2,196 (98.8%) | 26 (1.2%) |
| 75 Years and older | 1,275 (100.0%) | 0 (0.0%) |
| Total | 18,357 (83.3%) | 3,688 (16.7%) |
Health Insurance Coverage by Citizenship Status in Emanuel County
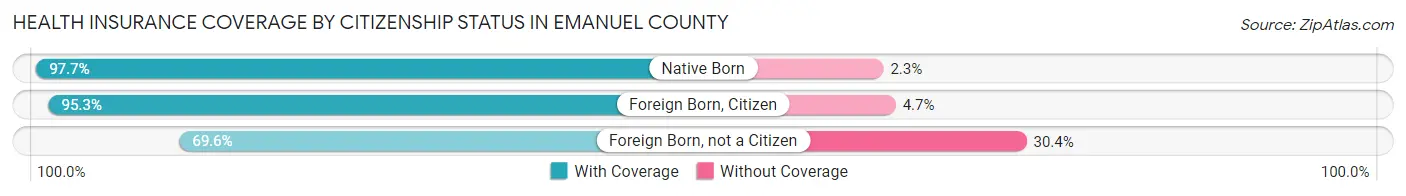
| Citizenship Status | With Coverage | Without Coverage |
| Native Born | 1,753 (97.7%) | 41 (2.3%) |
| Foreign Born, Citizen | 4,043 (95.3%) | 200 (4.7%) |
| Foreign Born, not a Citizen | 1,279 (69.6%) | 559 (30.4%) |
Health Insurance Coverage by Household Income in Emanuel County
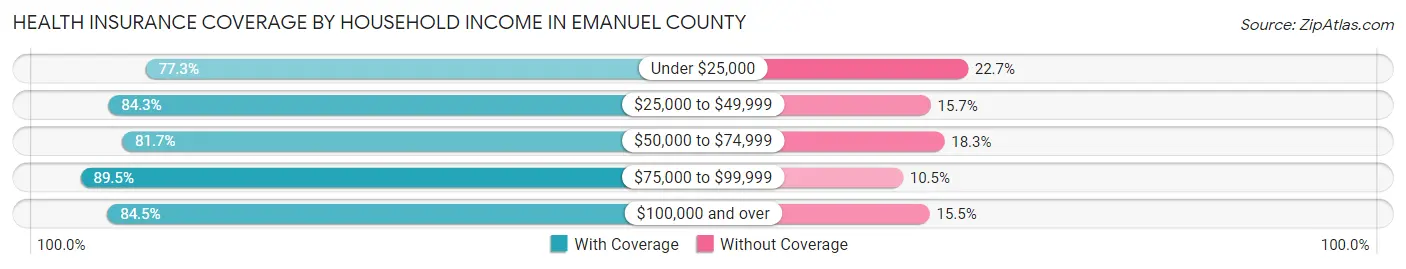
| Household Income | With Coverage | Without Coverage |
| Under $25,000 | 3,070 (77.3%) | 900 (22.7%) |
| $25,000 to $49,999 | 4,466 (84.3%) | 832 (15.7%) |
| $50,000 to $74,999 | 4,114 (81.7%) | 919 (18.3%) |
| $75,000 to $99,999 | 2,951 (89.5%) | 346 (10.5%) |
| $100,000 and over | 3,673 (84.5%) | 674 (15.5%) |
Public vs Private Health Insurance Coverage by Age in Emanuel County

| Age Bracket | Public Insurance | Private Insurance |
| Under 6 | 1,289 (71.9%) | 598 (33.3%) |
| 6 to 18 Years | 2,822 (66.5%) | 1,477 (34.8%) |
| 19 to 25 Years | 461 (25.1%) | 853 (46.4%) |
| 25 to 34 Years | 690 (24.9%) | 1,430 (51.6%) |
| 35 to 44 Years | 369 (14.2%) | 1,671 (64.2%) |
| 45 to 54 Years | 388 (15.5%) | 1,377 (55.1%) |
| 55 to 64 Years | 617 (22.0%) | 1,708 (61.0%) |
| 65 to 74 Years | 2,149 (96.7%) | 1,173 (52.8%) |
| 75 Years and over | 1,242 (97.4%) | 611 (47.9%) |
| Total | 10,027 (45.5%) | 10,898 (49.4%) |
Disability Status by Sex by Age in Emanuel County
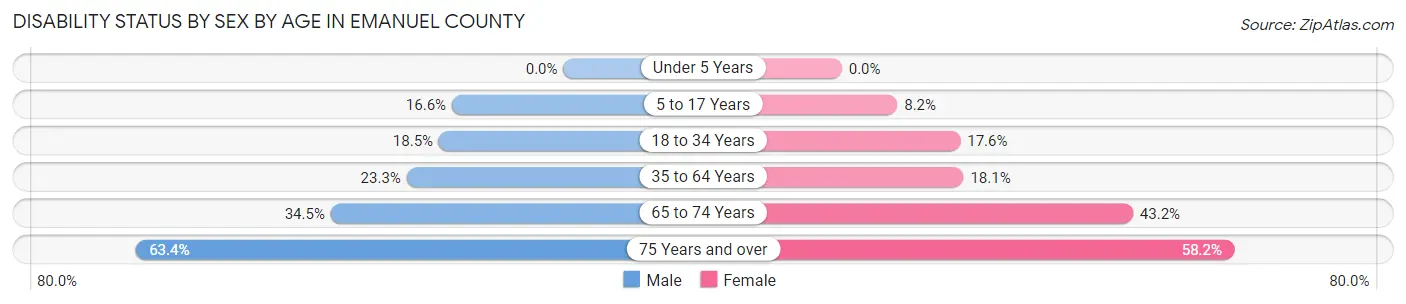
| Age Bracket | Male | Female |
| Under 5 Years | 0 (0.0%) | 0 (0.0%) |
| 5 to 17 Years | 362 (16.6%) | 160 (8.2%) |
| 18 to 34 Years | 491 (18.5%) | 401 (17.6%) |
| 35 to 64 Years | 915 (23.3%) | 717 (18.1%) |
| 65 to 74 Years | 352 (34.5%) | 520 (43.2%) |
| 75 Years and over | 326 (63.4%) | 443 (58.2%) |
Disability Class by Sex by Age in Emanuel County
Disability Class: Hearing Difficulty
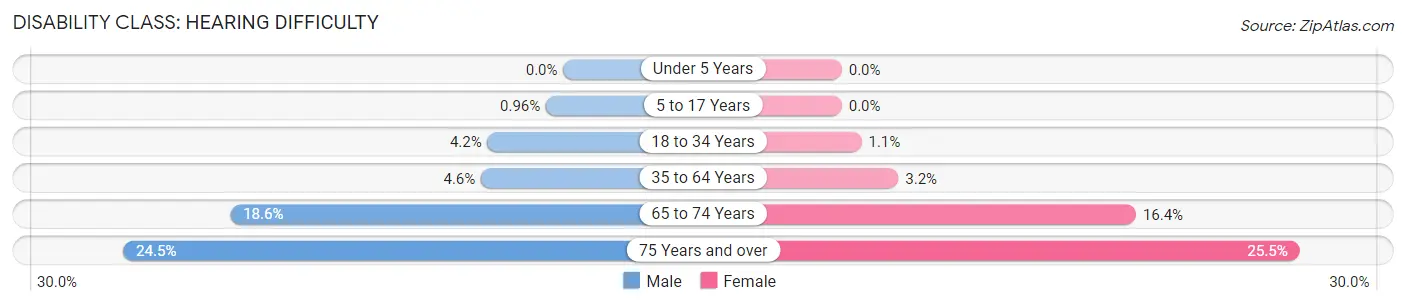
| Age Bracket | Male | Female |
| Under 5 Years | 0 (0.0%) | 0 (0.0%) |
| 5 to 17 Years | 21 (1.0%) | 0 (0.0%) |
| 18 to 34 Years | 112 (4.2%) | 25 (1.1%) |
| 35 to 64 Years | 180 (4.6%) | 125 (3.2%) |
| 65 to 74 Years | 189 (18.5%) | 197 (16.4%) |
| 75 Years and over | 126 (24.5%) | 194 (25.5%) |
Disability Class: Vision Difficulty
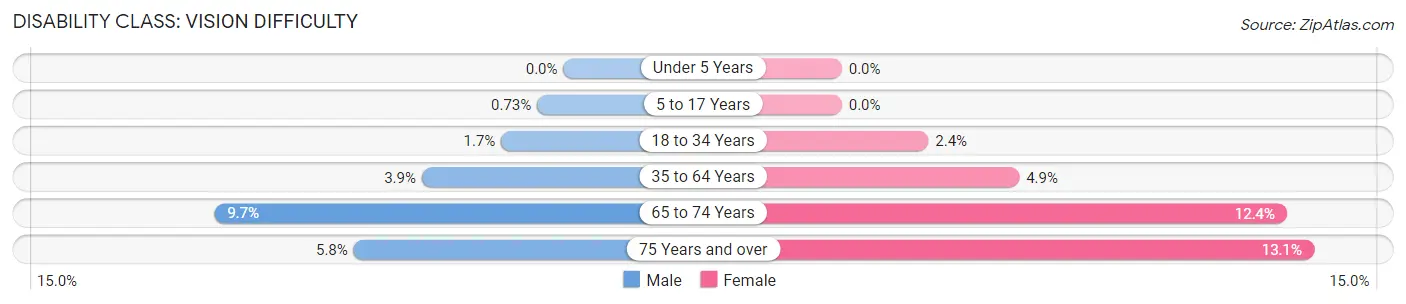
| Age Bracket | Male | Female |
| Under 5 Years | 0 (0.0%) | 0 (0.0%) |
| 5 to 17 Years | 16 (0.7%) | 0 (0.0%) |
| 18 to 34 Years | 46 (1.7%) | 55 (2.4%) |
| 35 to 64 Years | 155 (3.9%) | 196 (4.9%) |
| 65 to 74 Years | 99 (9.7%) | 149 (12.4%) |
| 75 Years and over | 30 (5.8%) | 100 (13.1%) |
Disability Class: Cognitive Difficulty

| Age Bracket | Male | Female |
| 5 to 17 Years | 328 (15.0%) | 160 (8.2%) |
| 18 to 34 Years | 289 (10.9%) | 258 (11.3%) |
| 35 to 64 Years | 225 (5.7%) | 225 (5.7%) |
| 65 to 74 Years | 62 (6.1%) | 80 (6.7%) |
| 75 Years and over | 39 (7.6%) | 162 (21.3%) |
Disability Class: Ambulatory Difficulty
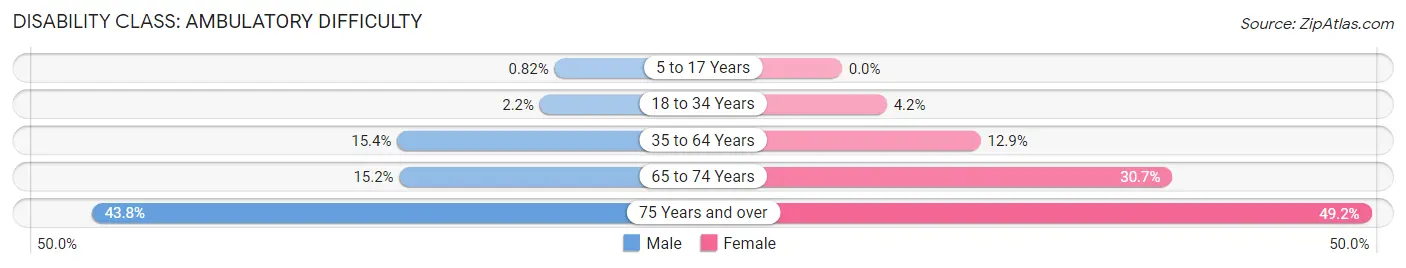
| Age Bracket | Male | Female |
| 5 to 17 Years | 18 (0.8%) | 0 (0.0%) |
| 18 to 34 Years | 58 (2.2%) | 95 (4.2%) |
| 35 to 64 Years | 606 (15.4%) | 511 (12.9%) |
| 65 to 74 Years | 155 (15.2%) | 369 (30.7%) |
| 75 Years and over | 225 (43.8%) | 374 (49.1%) |
Disability Class: Self-Care Difficulty

| Age Bracket | Male | Female |
| 5 to 17 Years | 18 (0.8%) | 13 (0.7%) |
| 18 to 34 Years | 114 (4.3%) | 27 (1.2%) |
| 35 to 64 Years | 171 (4.3%) | 67 (1.7%) |
| 65 to 74 Years | 37 (3.6%) | 8 (0.7%) |
| 75 Years and over | 79 (15.4%) | 134 (17.6%) |
Technology Access in Emanuel County
Computing Device Access in Emanuel County

| Device Type | # Households | % Households |
| Desktop or Laptop | 5,233 | 62.9% |
| Smartphone | 6,936 | 83.4% |
| Tablet | 4,227 | 50.8% |
| No Computing Device | 970 | 11.7% |
| Total | 8,321 | 100.0% |
Internet Access in Emanuel County
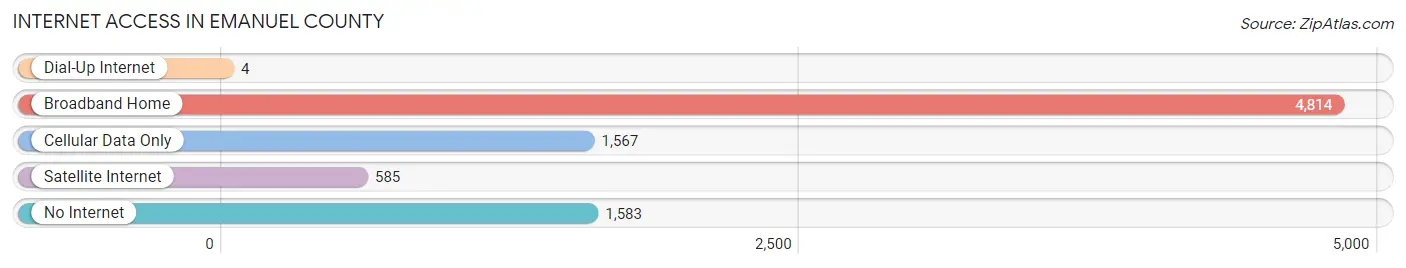
| Internet Type | # Households | % Households |
| Dial-Up Internet | 4 | 0.1% |
| Broadband Home | 4,814 | 57.9% |
| Cellular Data Only | 1,567 | 18.8% |
| Satellite Internet | 585 | 7.0% |
| No Internet | 1,583 | 19.0% |
| Total | 8,321 | 100.0% |
Emanuel County Summary
Emanuel County is located in the east central part of the state of Georgia, in the United States. It is part of the Augusta-Richmond County Metropolitan Statistical Area. The county seat is Swainsboro. As of the 2010 census, the population was 22,598.
Geography
Emanuel County is located in the east central part of the state of Georgia, in the United States. It is part of the Augusta-Richmond County Metropolitan Statistical Area. The county seat is Swainsboro. The county has a total area of 441 square miles, of which 439 square miles is land and 2.2 square miles (0.5%) is water.
The county is located in the Piedmont region of the state, and is bordered by Candler County to the north, Bulloch County to the east, Jenkins County to the south, and Laurens and Johnson counties to the west. The Ogeechee River forms the eastern border of the county.
History
Emanuel County was created in 1812 from parts of Bulloch, Montgomery, and Washington counties. It was named for David Emanuel, the first governor of Georgia.
The county was largely rural until the late 20th century, when the population began to grow rapidly due to the influx of people from other parts of the state and the country.
Economy
Emanuel County’s economy is largely based on agriculture, forestry, and manufacturing. The county is home to several large poultry processing plants, as well as a number of smaller businesses.
The county is also home to several large timber companies, which harvest and process timber for use in the construction industry.
Demographics
As of the 2010 census, there were 22,598 people, 8,717 households, and 6,072 families residing in the county. The population density was 51.3 people per square mile. There were 9,845 housing units at an average density of 22.3 per square mile.
The racial makeup of the county was 68.2% White, 28.2% Black or African American, 0.3% Native American, 0.5% Asian, 0.1% Pacific Islander, 1.2% from other races, and 1.5% from two or more races. 2.7% of the population were Hispanic or Latino of any race.
The median income for a household in the county was $30,945, and the median income for a family was $37,945. The per capita income for the county was $16,845. About 19.2% of families and 23.2% of the population were below the poverty line, including 33.2% of those under age 18 and 17.2% of those age 65 or over.
Conclusion
Emanuel County is located in the east central part of the state of Georgia, in the United States. It is part of the Augusta-Richmond County Metropolitan Statistical Area. The county was created in 1812 from parts of Bulloch, Montgomery, and Washington counties. The county’s economy is largely based on agriculture, forestry, and manufacturing. As of the 2010 census, there were 22,598 people, 8,717 households, and 6,072 families residing in the county. The median income for a household in the county was $30,945, and the median income for a family was $37,945. Emanuel County is a rural county with a diverse economy and a growing population.
Common Questions
What is the Total Population of Emanuel County?
Total Population of Emanuel County is 22,907.
What is the Total Male Population of Emanuel County?
Total Male Population of Emanuel County is 11,621.
What is the Total Female Population of Emanuel County?
Total Female Population of Emanuel County is 11,286.
What is the Ratio of Males per 100 Females in Emanuel County?
There are 102.97 Males per 100 Females in Emanuel County.
What is the Ratio of Females per 100 Males in Emanuel County?
There are 97.12 Females per 100 Males in Emanuel County.
What is the Median Population Age in Emanuel County?
Median Population Age in Emanuel County is 37.4 Years.
What is the Average Family Size in Emanuel County
Average Family Size in Emanuel County is 3.2 People.
What is the Average Household Size in Emanuel County
Average Household Size in Emanuel County is 2.6 People.
What is Per Capita Income in Emanuel County?
Per Capita income in Emanuel County is $24,696.
What is the Median Family Income in Emanuel County?
Median Family Income in Emanuel County is $53,973.
What is the Median Household income in Emanuel County?
Median Household Income in Emanuel County is $47,905.
What is Income or Wage Gap in Emanuel County?
Income or Wage Gap in Emanuel County is 28.5%.
Women in Emanuel County earn 71.5 cents for every dollar earned by a man.
What is Family Income Deficit in Emanuel County?
Family Income Deficit in Emanuel County is $8,934.
Families that are below poverty line in Emanuel County earn $8,934 less on average than the poverty threshold level.
What is Inequality or Gini Index in Emanuel County?
Inequality or Gini Index in Emanuel County is 0.45.
How Large is the Labor Force in Emanuel County?
There are 10,096 People in the Labor Forcein in Emanuel County.
What is the Percentage of People in the Labor Force in Emanuel County?
56.9% of People are in the Labor Force in Emanuel County.
What is the Unemployment Rate in Emanuel County?
Unemployment Rate in Emanuel County is 8.9%.