Decatur County, GA
Decatur County Map
Decatur County Overview
29,063
TOTAL POPULATION
14,097
MALE POPULATION
14,966
FEMALE POPULATION
94.19
MALES / 100 FEMALES
106.16
FEMALES / 100 MALES
38.3
MEDIAN AGE
3.3
AVG FAMILY SIZE
2.7
AVG HOUSEHOLD SIZE
$24,974
PER CAPITA INCOME
$55,947
AVG FAMILY INCOME
$47,383
AVG HOUSEHOLD INCOME
26.1%
WAGE / INCOME GAP [ % ]
73.9¢/ $1
WAGE / INCOME GAP [ $ ]
$14,687
FAMILY INCOME DEFICIT
0.47
INEQUALITY / GINI INDEX
11,959
LABOR FORCE [ PEOPLE ]
53.0%
PERCENT IN LABOR FORCE
6.4%
UNEMPLOYMENT RATE
Decatur County Area Codes
Race in Decatur County
The most populous races in Decatur County are White / Caucasian (15,237 | 52.4%), Black / African American (11,685 | 40.2%), and Hispanic or Latino (1,940 | 6.7%).

| Race | # Population | % Population |
| Asian | 141 | 0.5% |
| Black / African American | 11,685 | 40.2% |
| Hawaiian / Pacific | 0 | 0.0% |
| Hispanic or Latino | 1,940 | 6.7% |
| Native / Alaskan | 93 | 0.3% |
| White / Caucasian | 15,237 | 52.4% |
| Two or more Races | 781 | 2.7% |
| Some other Race | 1,126 | 3.9% |
| Total | 29,063 | 100.0% |
Ancestry in Decatur County
The most populous ancestries reported in Decatur County are English (2,323 | 8.0%), American (2,065 | 7.1%), Mexican (1,627 | 5.6%), Irish (1,148 | 4.0%), and German (644 | 2.2%), together accounting for 26.9% of all Decatur County residents.

| Ancestry | # Population | % Population |
| African | 100 | 0.3% |
| American | 2,065 | 7.1% |
| Arab | 1 | 0.0% |
| Argentinean | 25 | 0.1% |
| Austrian | 4 | 0.0% |
| Blackfeet | 6 | 0.0% |
| British | 7 | 0.0% |
| Celtic | 122 | 0.4% |
| Central American | 62 | 0.2% |
| Cherokee | 45 | 0.2% |
| Choctaw | 3 | 0.0% |
| Creek | 39 | 0.1% |
| Cuban | 13 | 0.0% |
| Czech | 7 | 0.0% |
| Danish | 25 | 0.1% |
| Dutch | 113 | 0.4% |
| English | 2,323 | 8.0% |
| Ethiopian | 23 | 0.1% |
| European | 142 | 0.5% |
| Finnish | 23 | 0.1% |
| French | 132 | 0.4% |
| French Canadian | 11 | 0.0% |
| German | 644 | 2.2% |
| Greek | 21 | 0.1% |
| Guatemalan | 62 | 0.2% |
| Hungarian | 19 | 0.1% |
| Icelander | 3 | 0.0% |
| Indian (Asian) | 13 | 0.0% |
| Iranian | 7 | 0.0% |
| Irish | 1,148 | 4.0% |
| Italian | 161 | 0.5% |
| Korean | 50 | 0.2% |
| Lebanese | 1 | 0.0% |
| Mexican | 1,627 | 5.6% |
| Mexican American Indian | 6 | 0.0% |
| Northern European | 20 | 0.1% |
| Pakistani | 4 | 0.0% |
| Polish | 114 | 0.4% |
| Puerto Rican | 76 | 0.3% |
| Romanian | 30 | 0.1% |
| Scandinavian | 50 | 0.2% |
| Scotch-Irish | 500 | 1.7% |
| Scottish | 232 | 0.8% |
| South American | 47 | 0.2% |
| Spaniard | 2 | 0.0% |
| Subsaharan African | 123 | 0.4% |
| Swedish | 16 | 0.1% |
| Swiss | 4 | 0.0% |
| Thai | 78 | 0.3% |
| Trinidadian and Tobagonian | 22 | 0.1% |
| Venezuelan | 22 | 0.1% |
| Welsh | 7 | 0.0% | View All 52 Rows |
Immigrants in Decatur County
The most numerous immigrant groups reported in Decatur County came from Latin America (692 | 2.4%), Central America (427 | 1.5%), Mexico (372 | 1.3%), South America (262 | 0.9%), and Colombia (228 | 0.8%), together accounting for 6.8% of all Decatur County residents.

| Immigration Origin | # Population | % Population |
| Africa | 29 | 0.1% |
| Argentina | 25 | 0.1% |
| Asia | 132 | 0.4% |
| Caribbean | 3 | 0.0% |
| Central America | 427 | 1.5% |
| China | 13 | 0.0% |
| Colombia | 228 | 0.8% |
| Cuba | 3 | 0.0% |
| Eastern Africa | 23 | 0.1% |
| Eastern Asia | 13 | 0.0% |
| Ethiopia | 23 | 0.1% |
| Europe | 51 | 0.2% |
| France | 15 | 0.1% |
| Germany | 12 | 0.0% |
| Guatemala | 55 | 0.2% |
| Guyana | 9 | 0.0% |
| India | 69 | 0.2% |
| Latin America | 692 | 2.4% |
| Mexico | 372 | 1.3% |
| Morocco | 6 | 0.0% |
| Northern Africa | 6 | 0.0% |
| Northern Europe | 24 | 0.1% |
| Philippines | 50 | 0.2% |
| Scotland | 15 | 0.1% |
| South America | 262 | 0.9% |
| South Central Asia | 69 | 0.2% |
| South Eastern Asia | 50 | 0.2% |
| Taiwan | 13 | 0.0% |
| Western Europe | 27 | 0.1% | View All 29 Rows |
Sex and Age in Decatur County
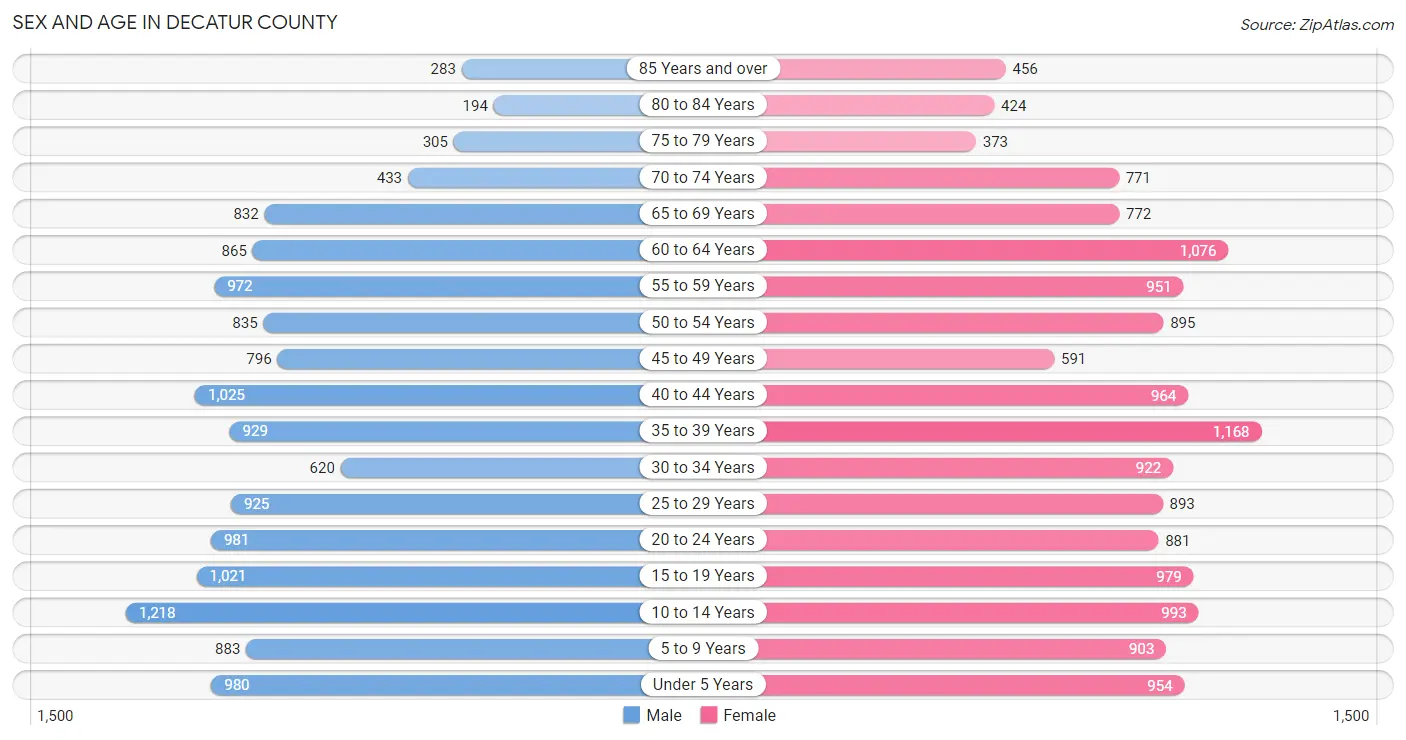
Sex and Age in Decatur County
The most populous age groups in Decatur County are 10 to 14 Years (1,218 | 8.6%) for men and 35 to 39 Years (1,168 | 7.8%) for women.
| Age Bracket | Male | Female |
| Under 5 Years | 980 (7.0%) | 954 (6.4%) |
| 5 to 9 Years | 883 (6.3%) | 903 (6.0%) |
| 10 to 14 Years | 1,218 (8.6%) | 993 (6.6%) |
| 15 to 19 Years | 1,021 (7.2%) | 979 (6.5%) |
| 20 to 24 Years | 981 (7.0%) | 881 (5.9%) |
| 25 to 29 Years | 925 (6.6%) | 893 (6.0%) |
| 30 to 34 Years | 620 (4.4%) | 922 (6.2%) |
| 35 to 39 Years | 929 (6.6%) | 1,168 (7.8%) |
| 40 to 44 Years | 1,025 (7.3%) | 964 (6.4%) |
| 45 to 49 Years | 796 (5.7%) | 591 (4.0%) |
| 50 to 54 Years | 835 (5.9%) | 895 (6.0%) |
| 55 to 59 Years | 972 (6.9%) | 951 (6.4%) |
| 60 to 64 Years | 865 (6.1%) | 1,076 (7.2%) |
| 65 to 69 Years | 832 (5.9%) | 772 (5.2%) |
| 70 to 74 Years | 433 (3.1%) | 771 (5.1%) |
| 75 to 79 Years | 305 (2.2%) | 373 (2.5%) |
| 80 to 84 Years | 194 (1.4%) | 424 (2.8%) |
| 85 Years and over | 283 (2.0%) | 456 (3.0%) |
| Total | 14,097 (100.0%) | 14,966 (100.0%) |
Families and Households in Decatur County
Median Family Size in Decatur County
The median family size in Decatur County is 3.34 persons per family, with single female/mother families (1,884 | 27.0%) accounting for the largest median family size of 3.65 persons per family. On the other hand, single male/father families (682 | 9.8%) represent the smallest median family size with 3.20 persons per family.

| Family Type | # Families | Family Size |
| Married-Couple | 4,426 (63.3%) | 3.23 |
| Single Male/Father | 682 (9.8%) | 3.20 |
| Single Female/Mother | 1,884 (27.0%) | 3.65 |
| Total Families | 6,992 (100.0%) | 3.34 |
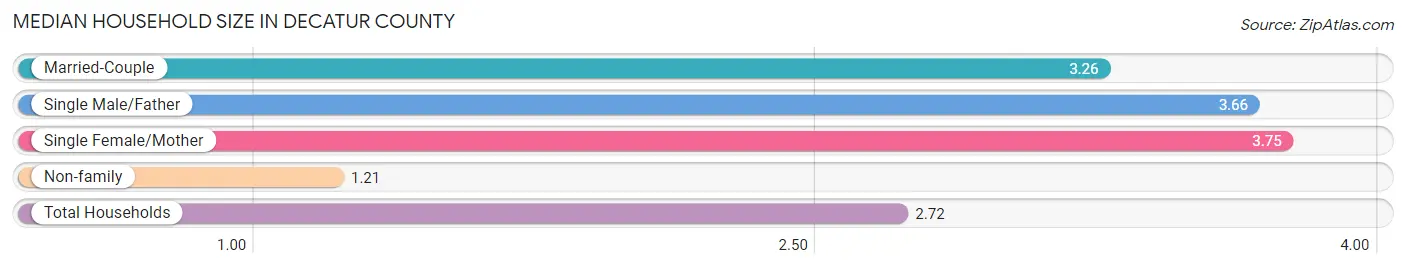
Median Household Size in Decatur County
The median household size in Decatur County is 2.72 persons per household, with single female/mother households (1,884 | 18.3%) accounting for the largest median household size of 3.75 persons per household. non-family households (3,303 | 32.1%) represent the smallest median household size with 1.21 persons per household.
| Household Type | # Households | Household Size |
| Married-Couple | 4,426 (43.0%) | 3.26 |
| Single Male/Father | 682 (6.6%) | 3.66 |
| Single Female/Mother | 1,884 (18.3%) | 3.75 |
| Non-family | 3,303 (32.1%) | 1.21 |
| Total Households | 10,295 (100.0%) | 2.72 |
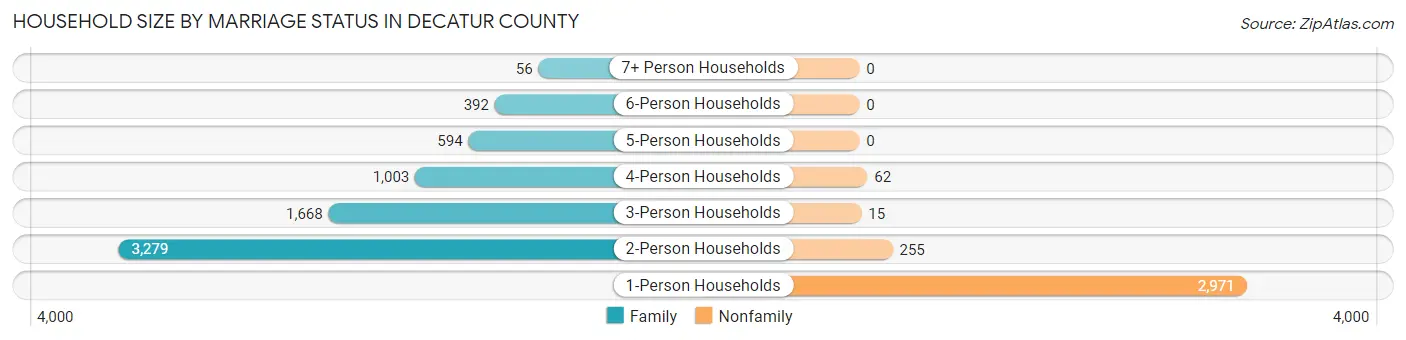
Household Size by Marriage Status in Decatur County
Out of a total of 10,295 households in Decatur County, 6,992 (67.9%) are family households, while 3,303 (32.1%) are nonfamily households. The most numerous type of family households are 2-person households, comprising 3,279, and the most common type of nonfamily households are 1-person households, comprising 2,971.
| Household Size | Family Households | Nonfamily Households |
| 1-Person Households | - | 2,971 (28.9%) |
| 2-Person Households | 3,279 (31.9%) | 255 (2.5%) |
| 3-Person Households | 1,668 (16.2%) | 15 (0.2%) |
| 4-Person Households | 1,003 (9.7%) | 62 (0.6%) |
| 5-Person Households | 594 (5.8%) | 0 (0.0%) |
| 6-Person Households | 392 (3.8%) | 0 (0.0%) |
| 7+ Person Households | 56 (0.5%) | 0 (0.0%) |
| Total | 6,992 (67.9%) | 3,303 (32.1%) |
Female Fertility in Decatur County
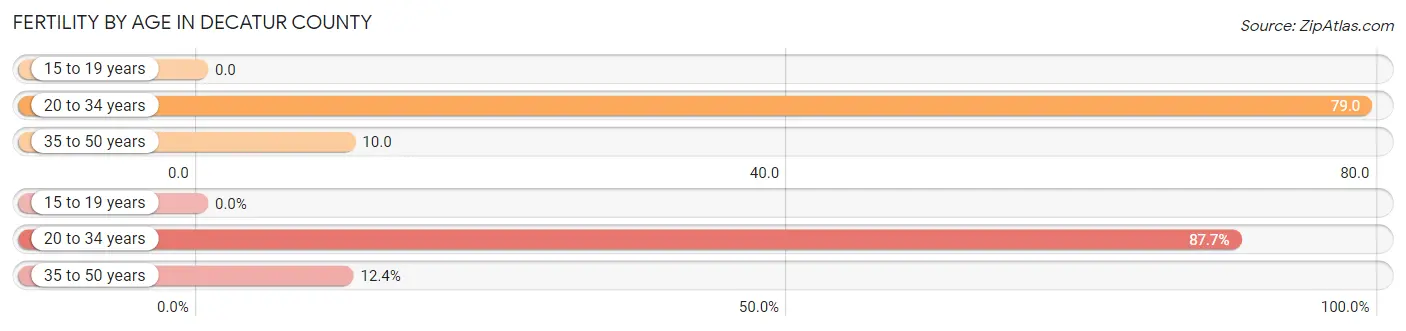
Fertility by Age in Decatur County
Average fertility rate in Decatur County is 37.0 births per 1,000 women. Women in the age bracket of 20 to 34 years have the highest fertility rate with 79.0 births per 1,000 women. Women in the age bracket of 20 to 34 years acount for 87.6% of all women with births.
| Age Bracket | Women with Births | Births / 1,000 Women |
| 15 to 19 years | 0 (0.0%) | 0.0 |
| 20 to 34 years | 213 (87.6%) | 79.0 |
| 35 to 50 years | 30 (12.3%) | 10.0 |
| Total | 243 (100.0%) | 37.0 |
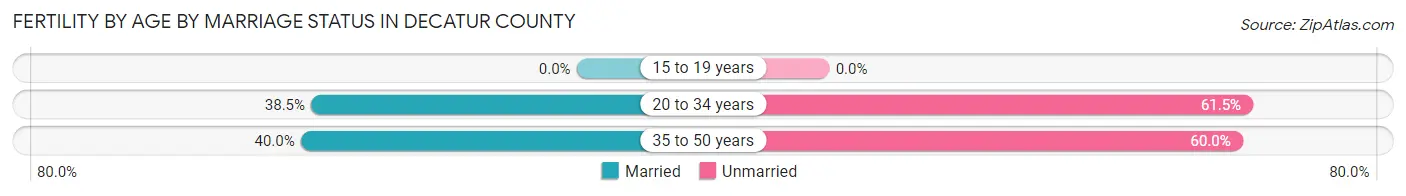
Fertility by Age by Marriage Status in Decatur County
38.7% of women with births (243) in Decatur County are married. The highest percentage of unmarried women with births falls into 20 to 34 years age bracket with 61.5% of them unmarried at the time of birth, while the lowest percentage of unmarried women with births belong to 35 to 50 years age bracket with 60.0% of them unmarried.
| Age Bracket | Married | Unmarried |
| 15 to 19 years | 0 (0.0%) | 0 (0.0%) |
| 20 to 34 years | 82 (38.5%) | 131 (61.5%) |
| 35 to 50 years | 12 (40.0%) | 18 (60.0%) |
| Total | 94 (38.7%) | 149 (61.3%) |
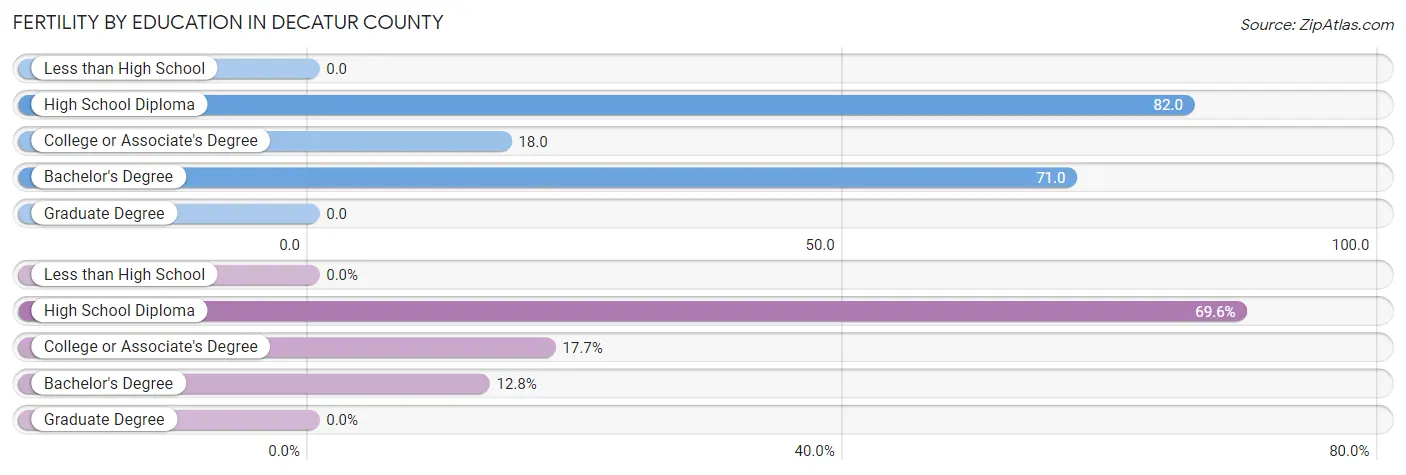
Fertility by Education in Decatur County
| Educational Attainment | Women with Births | Births / 1,000 Women |
| Less than High School | 0 (0.0%) | 0.0 |
| High School Diploma | 169 (69.6%) | 82.0 |
| College or Associate's Degree | 43 (17.7%) | 18.0 |
| Bachelor's Degree | 31 (12.8%) | 71.0 |
| Graduate Degree | 0 (0.0%) | 0.0 |
| Total | 243 (100.0%) | 37.0 |
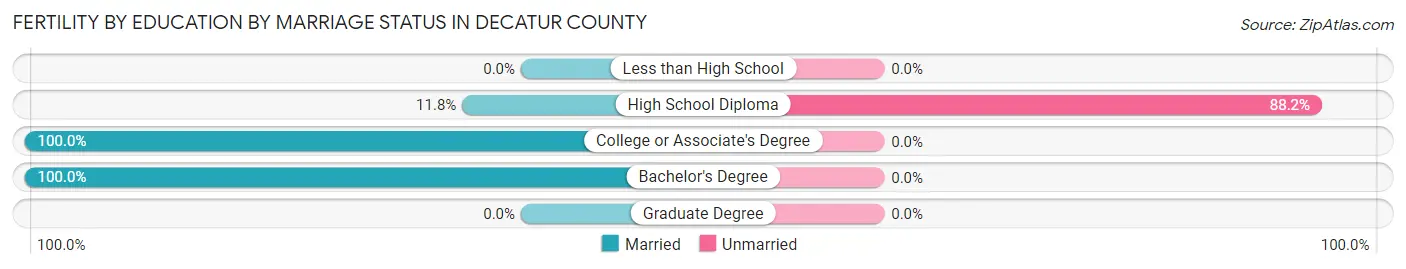
Fertility by Education by Marriage Status in Decatur County
61.3% of women with births in Decatur County are unmarried. Women with the educational attainment of college or associate's degree are most likely to be married with 100.0% of them married at childbirth, while women with the educational attainment of high school diploma are least likely to be married with 88.2% of them unmarried at childbirth.
| Educational Attainment | Married | Unmarried |
| Less than High School | 0 (0.0%) | 0 (0.0%) |
| High School Diploma | 20 (11.8%) | 149 (88.2%) |
| College or Associate's Degree | 43 (100.0%) | 0 (0.0%) |
| Bachelor's Degree | 31 (100.0%) | 0 (0.0%) |
| Graduate Degree | 0 (0.0%) | 0 (0.0%) |
| Total | 94 (38.7%) | 149 (61.3%) |
Income in Decatur County
Income Overview in Decatur County
Per Capita Income in Decatur County is $24,974, while median incomes of families and households are $55,947 and $47,383 respectively.
| Characteristic | Number | Measure |
| Per Capita Income | 29,063 | $24,974 |
| Median Family Income | 6,992 | $55,947 |
| Mean Family Income | 6,992 | $74,437 |
| Median Household Income | 10,295 | $47,383 |
| Mean Household Income | 10,295 | $63,648 |
| Income Deficit | 6,992 | $14,687 |
| Wage / Income Gap (%) | 29,063 | 26.05% |
| Wage / Income Gap ($) | 29,063 | 73.95¢ per $1 |
| Gini / Inequality Index | 29,063 | 0.47 |
Earnings by Sex in Decatur County
Average Earnings in Decatur County are $34,886, $39,507 for men and $29,215 for women, a difference of 26.1%.
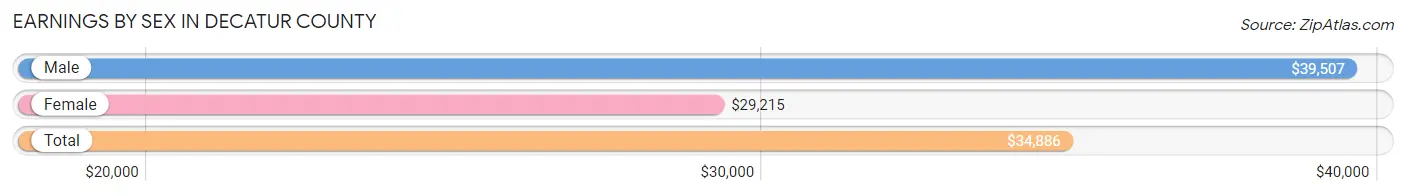
| Sex | Number | Average Earnings |
| Male | 6,318 (52.1%) | $39,507 |
| Female | 5,804 (47.9%) | $29,215 |
| Total | 12,122 (100.0%) | $34,886 |
Earnings by Sex by Income Bracket in Decatur County
The most common earnings brackets in Decatur County are $100,000+ for men (624 | 9.9%) and $25,000 to $29,999 for women (756 | 13.0%).
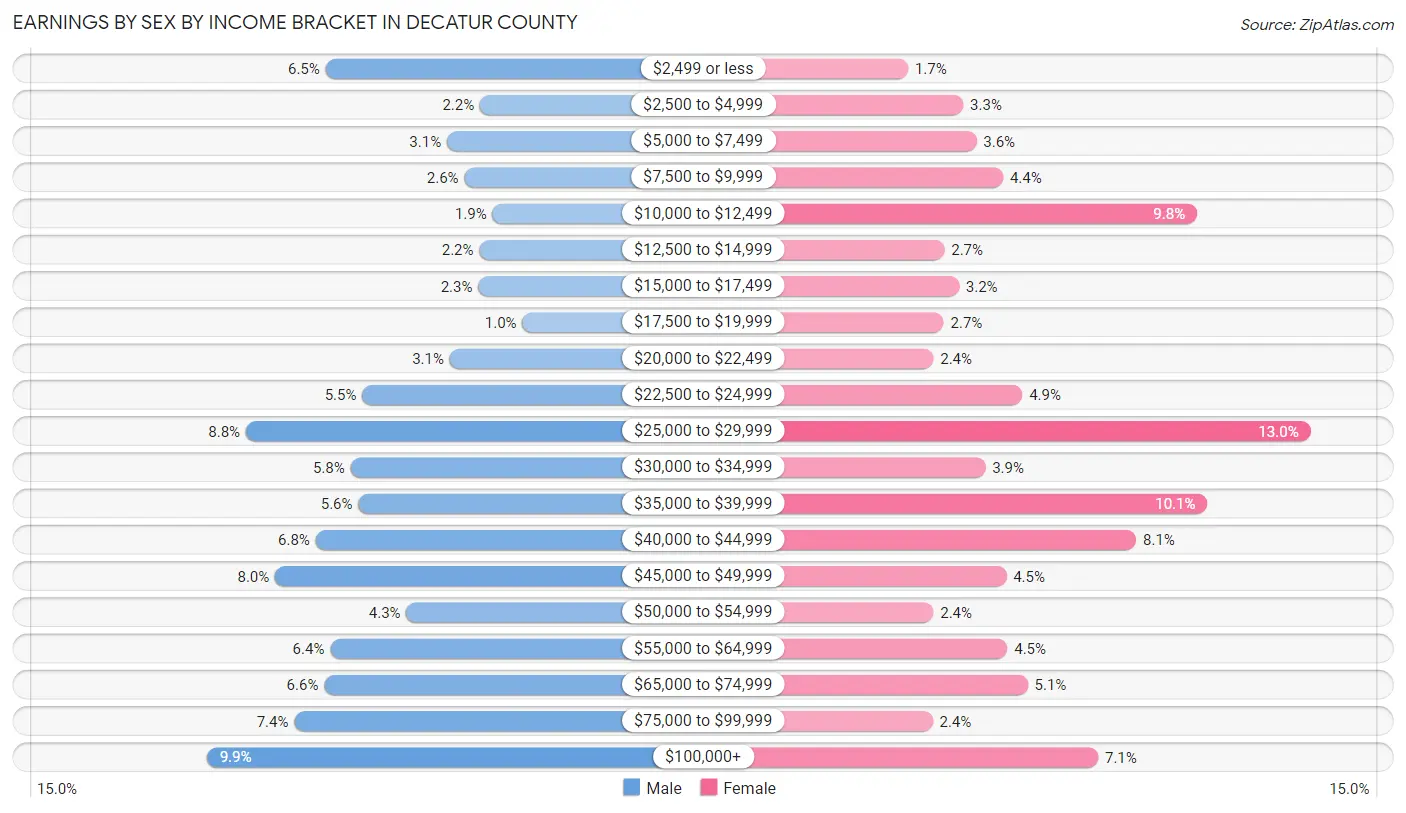
| Income | Male | Female |
| $2,499 or less | 413 (6.5%) | 100 (1.7%) |
| $2,500 to $4,999 | 139 (2.2%) | 190 (3.3%) |
| $5,000 to $7,499 | 198 (3.1%) | 211 (3.6%) |
| $7,500 to $9,999 | 167 (2.6%) | 255 (4.4%) |
| $10,000 to $12,499 | 117 (1.8%) | 571 (9.8%) |
| $12,500 to $14,999 | 140 (2.2%) | 159 (2.7%) |
| $15,000 to $17,499 | 142 (2.2%) | 183 (3.2%) |
| $17,500 to $19,999 | 64 (1.0%) | 158 (2.7%) |
| $20,000 to $22,499 | 193 (3.0%) | 141 (2.4%) |
| $22,500 to $24,999 | 348 (5.5%) | 286 (4.9%) |
| $25,000 to $29,999 | 555 (8.8%) | 756 (13.0%) |
| $30,000 to $34,999 | 369 (5.8%) | 226 (3.9%) |
| $35,000 to $39,999 | 355 (5.6%) | 588 (10.1%) |
| $40,000 to $44,999 | 431 (6.8%) | 472 (8.1%) |
| $45,000 to $49,999 | 503 (8.0%) | 260 (4.5%) |
| $50,000 to $54,999 | 270 (4.3%) | 141 (2.4%) |
| $55,000 to $64,999 | 405 (6.4%) | 262 (4.5%) |
| $65,000 to $74,999 | 416 (6.6%) | 295 (5.1%) |
| $75,000 to $99,999 | 469 (7.4%) | 140 (2.4%) |
| $100,000+ | 624 (9.9%) | 410 (7.1%) |
| Total | 6,318 (100.0%) | 5,804 (100.0%) |
Earnings by Sex by Educational Attainment in Decatur County
Average earnings in Decatur County are $42,820 for men and $34,856 for women, a difference of 18.6%. Men with an educational attainment of graduate degree enjoy the highest average annual earnings of $75,347, while those with less than high school education earn the least with $23,051. Women with an educational attainment of graduate degree earn the most with the average annual earnings of $69,028, while those with less than high school education have the smallest earnings of $20,440.
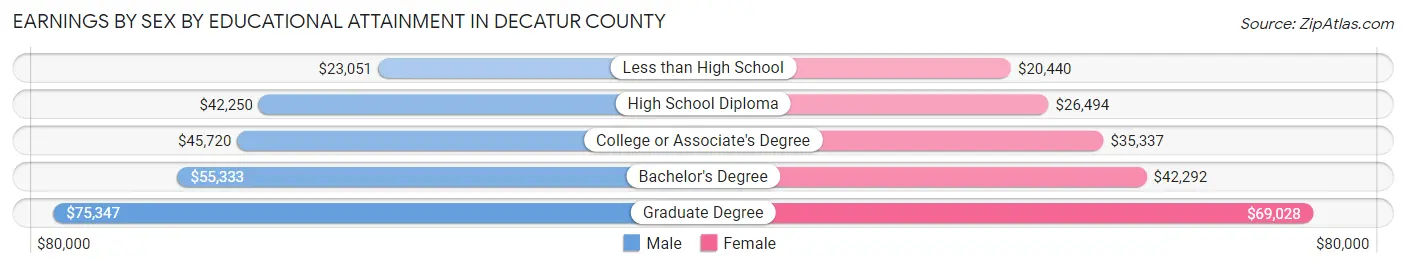
| Educational Attainment | Male Income | Female Income |
| Less than High School | $23,051 | $20,440 |
| High School Diploma | $42,250 | $26,494 |
| College or Associate's Degree | $45,720 | $35,337 |
| Bachelor's Degree | $55,333 | $42,292 |
| Graduate Degree | $75,347 | $69,028 |
| Total | $42,820 | $34,856 |
Family Income in Decatur County
Family Income Brackets in Decatur County
According to the Decatur County family income data, there are 1,196 families falling into the $50,000 to $74,999 income range, which is the most common income bracket and makes up 17.1% of all families. Conversely, the $10,000 to $14,999 income bracket is the least frequent group with only 147 families (2.1%) belonging to this category.
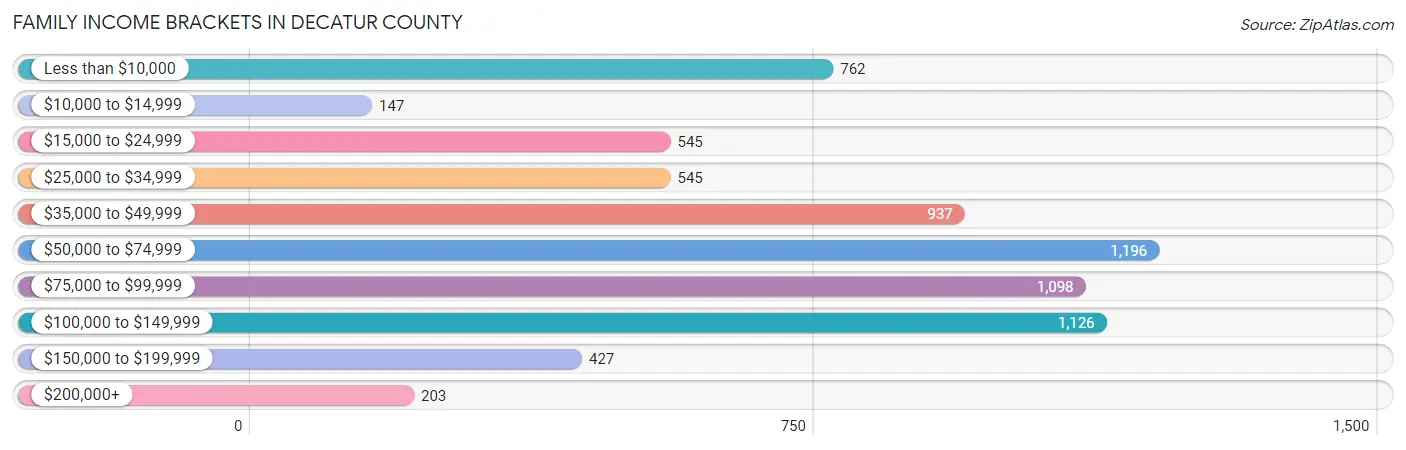
| Income Bracket | # Families | % Families |
| Less than $10,000 | 762 | 10.9% |
| $10,000 to $14,999 | 147 | 2.1% |
| $15,000 to $24,999 | 545 | 7.8% |
| $25,000 to $34,999 | 545 | 7.8% |
| $35,000 to $49,999 | 937 | 13.4% |
| $50,000 to $74,999 | 1,196 | 17.1% |
| $75,000 to $99,999 | 1,098 | 15.7% |
| $100,000 to $149,999 | 1,126 | 16.1% |
| $150,000 to $199,999 | 427 | 6.1% |
| $200,000+ | 203 | 2.9% |
Family Income by Famaliy Size in Decatur County
3-person families (1,612 | 23.1%) account for the highest median family income in Decatur County with $79,857 per family, while 2-person families (3,437 | 49.2%) have the highest median income of $28,049 per family member.

| Income Bracket | # Families | Median Income |
| 2-Person Families | 3,437 (49.2%) | $56,098 |
| 3-Person Families | 1,612 (23.1%) | $79,857 |
| 4-Person Families | 985 (14.1%) | $51,103 |
| 5-Person Families | 682 (9.8%) | $54,250 |
| 6-Person Families | 220 (3.2%) | $16,010 |
| 7+ Person Families | 56 (0.8%) | $0 |
| Total | 6,992 (100.0%) | $55,947 |
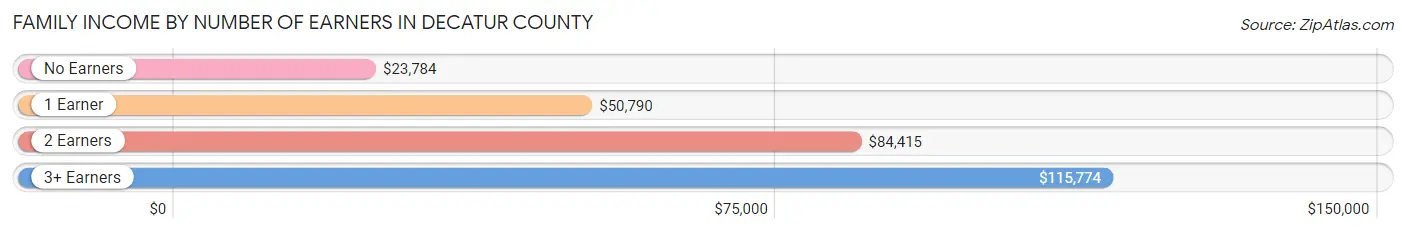
Family Income by Number of Earners in Decatur County
The median family income in Decatur County is $55,947, with families comprising 3+ earners (269) having the highest median family income of $115,774, while families with no earners (1,518) have the lowest median family income of $23,784, accounting for 3.8% and 21.7% of families, respectively.
| Number of Earners | # Families | Median Income |
| No Earners | 1,518 (21.7%) | $23,784 |
| 1 Earner | 2,561 (36.6%) | $50,790 |
| 2 Earners | 2,644 (37.8%) | $84,415 |
| 3+ Earners | 269 (3.8%) | $115,774 |
| Total | 6,992 (100.0%) | $55,947 |
Household Income in Decatur County
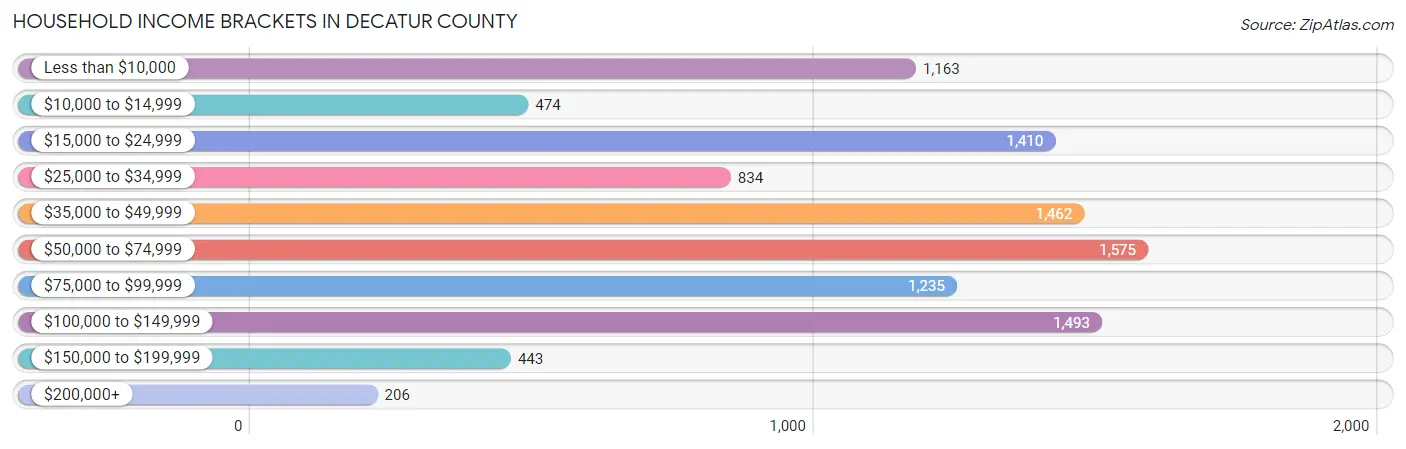
Household Income Brackets in Decatur County
With 1,575 households falling in the category, the $50,000 to $74,999 income range is the most frequent in Decatur County, accounting for 15.3% of all households. In contrast, only 206 households (2.0%) fall into the $200,000+ income bracket, making it the least populous group.
| Income Bracket | # Households | % Households |
| Less than $10,000 | 1,163 | 11.3% |
| $10,000 to $14,999 | 474 | 4.6% |
| $15,000 to $24,999 | 1,410 | 13.7% |
| $25,000 to $34,999 | 834 | 8.1% |
| $35,000 to $49,999 | 1,462 | 14.2% |
| $50,000 to $74,999 | 1,575 | 15.3% |
| $75,000 to $99,999 | 1,235 | 12.0% |
| $100,000 to $149,999 | 1,493 | 14.5% |
| $150,000 to $199,999 | 443 | 4.3% |
| $200,000+ | 206 | 2.0% |
Household Income by Householder Age in Decatur County
The median household income in Decatur County is $47,383, with the highest median household income of $56,875 found in the 45 to 64 years age bracket for the primary householder. A total of 3,511 households (34.1%) fall into this category. Meanwhile, the 65+ years age bracket for the primary householder has the lowest median household income of $37,017, with 3,044 households (29.6%) in this group.

| Income Bracket | # Households | Median Income |
| 15 to 24 Years | 600 (5.8%) | $50,972 |
| 25 to 44 Years | 3,140 (30.5%) | $48,558 |
| 45 to 64 Years | 3,511 (34.1%) | $56,875 |
| 65+ Years | 3,044 (29.6%) | $37,017 |
| Total | 10,295 (100.0%) | $47,383 |
Poverty in Decatur County
Income Below Poverty by Sex and Age in Decatur County
With 21.2% poverty level for males and 27.2% for females among the residents of Decatur County, 5 year old males and 5 year old females are the most vulnerable to poverty, with 204 males (75.6%) and 117 females (52.5%) in their respective age groups living below the poverty level.

| Age Bracket | Male | Female |
| Under 5 Years | 338 (34.5%) | 479 (50.2%) |
| 5 Years | 204 (75.6%) | 117 (52.5%) |
| 6 to 11 Years | 476 (39.8%) | 335 (38.6%) |
| 12 to 14 Years | 260 (41.0%) | 301 (44.1%) |
| 15 Years | 0 (0.0%) | 55 (28.2%) |
| 16 and 17 Years | 90 (48.9%) | 41 (10.6%) |
| 18 to 24 Years | 186 (13.6%) | 353 (27.6%) |
| 25 to 34 Years | 246 (21.4%) | 626 (34.5%) |
| 35 to 44 Years | 395 (22.4%) | 616 (28.9%) |
| 45 to 54 Years | 223 (14.4%) | 288 (19.4%) |
| 55 to 64 Years | 294 (16.5%) | 264 (13.1%) |
| 65 to 74 Years | 27 (2.2%) | 291 (18.9%) |
| 75 Years and over | 59 (8.1%) | 241 (20.5%) |
| Total | 2,798 (21.2%) | 4,007 (27.2%) |
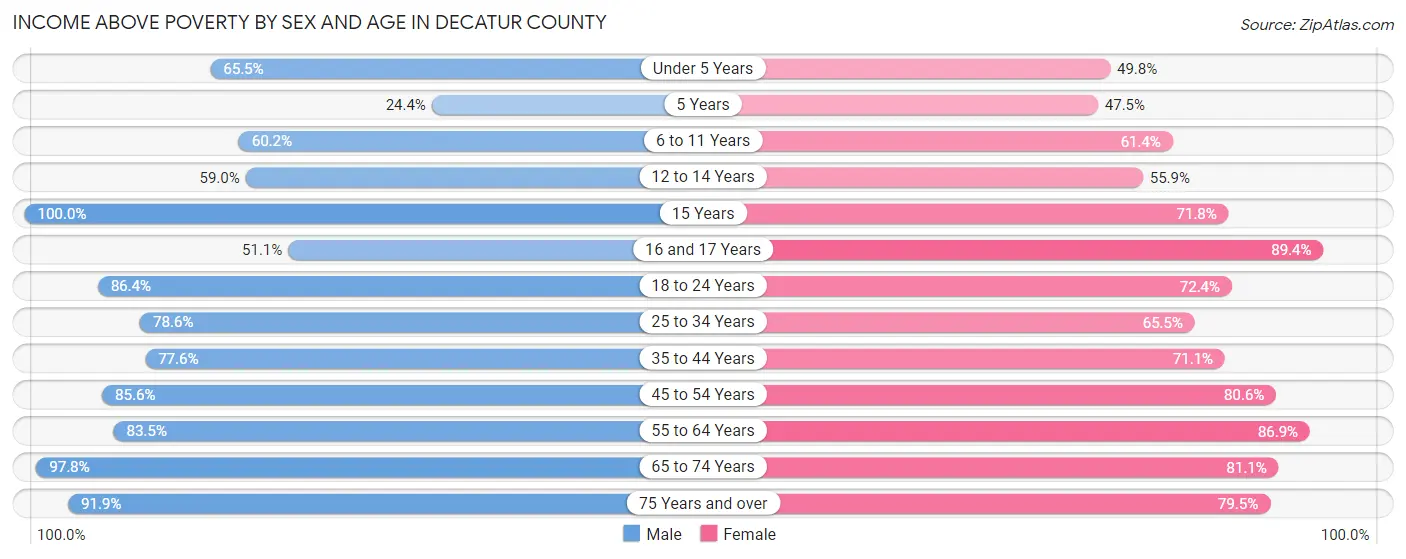
Income Above Poverty by Sex and Age in Decatur County
According to the poverty statistics in Decatur County, males aged 15 years and females aged 16 and 17 years are the age groups that are most secure financially, with 100.0% of males and 89.4% of females in these age groups living above the poverty line.
| Age Bracket | Male | Female |
| Under 5 Years | 642 (65.5%) | 475 (49.8%) |
| 5 Years | 66 (24.4%) | 106 (47.5%) |
| 6 to 11 Years | 721 (60.2%) | 533 (61.4%) |
| 12 to 14 Years | 374 (59.0%) | 381 (55.9%) |
| 15 Years | 372 (100.0%) | 140 (71.8%) |
| 16 and 17 Years | 94 (51.1%) | 345 (89.4%) |
| 18 to 24 Years | 1,185 (86.4%) | 926 (72.4%) |
| 25 to 34 Years | 901 (78.5%) | 1,189 (65.5%) |
| 35 to 44 Years | 1,368 (77.6%) | 1,516 (71.1%) |
| 45 to 54 Years | 1,326 (85.6%) | 1,198 (80.6%) |
| 55 to 64 Years | 1,487 (83.5%) | 1,749 (86.9%) |
| 65 to 74 Years | 1,204 (97.8%) | 1,247 (81.1%) |
| 75 Years and over | 671 (91.9%) | 934 (79.5%) |
| Total | 10,411 (78.8%) | 10,739 (72.8%) |
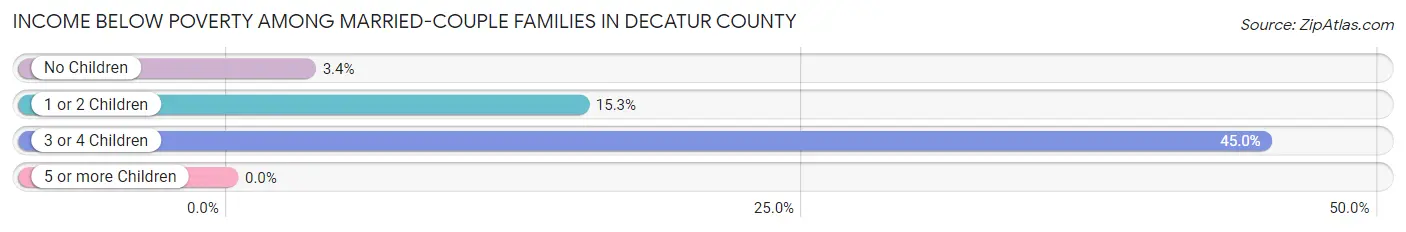
Income Below Poverty Among Married-Couple Families in Decatur County
The poverty statistics for married-couple families in Decatur County show that 10.3% or 457 of the total 4,426 families live below the poverty line. Families with 3 or 4 children have the highest poverty rate of 45.0%, comprising of 190 families. On the other hand, families with 5 or more children have the lowest poverty rate of 0.0%, which includes 0 families.
| Children | Above Poverty | Below Poverty |
| No Children | 2,747 (96.6%) | 96 (3.4%) |
| 1 or 2 Children | 949 (84.7%) | 171 (15.3%) |
| 3 or 4 Children | 232 (55.0%) | 190 (45.0%) |
| 5 or more Children | 41 (100.0%) | 0 (0.0%) |
| Total | 3,969 (89.7%) | 457 (10.3%) |
Income Below Poverty Among Single-Parent Households in Decatur County
According to the poverty data in Decatur County, 20.7% or 141 single-father households and 40.6% or 764 single-mother households are living below the poverty line. Among single-father households, those with 1 or 2 children have the highest poverty rate, with 95 households (34.8%) experiencing poverty. Likewise, among single-mother households, those with 5 or more children have the highest poverty rate, with 24 households (100.0%) falling below the poverty line.

| Children | Single Father | Single Mother |
| No Children | 39 (10.7%) | 106 (18.3%) |
| 1 or 2 Children | 95 (34.8%) | 451 (48.5%) |
| 3 or 4 Children | 7 (15.2%) | 183 (51.8%) |
| 5 or more Children | 0 (0.0%) | 24 (100.0%) |
| Total | 141 (20.7%) | 764 (40.6%) |
Income Below Poverty Among Married-Couple vs Single-Parent Households in Decatur County
The poverty data for Decatur County shows that 457 of the married-couple family households (10.3%) and 905 of the single-parent households (35.3%) are living below the poverty level. Within the married-couple family households, those with 3 or 4 children have the highest poverty rate, with 190 households (45.0%) falling below the poverty line. Among the single-parent households, those with 5 or more children have the highest poverty rate, with 24 household (100.0%) living below poverty.
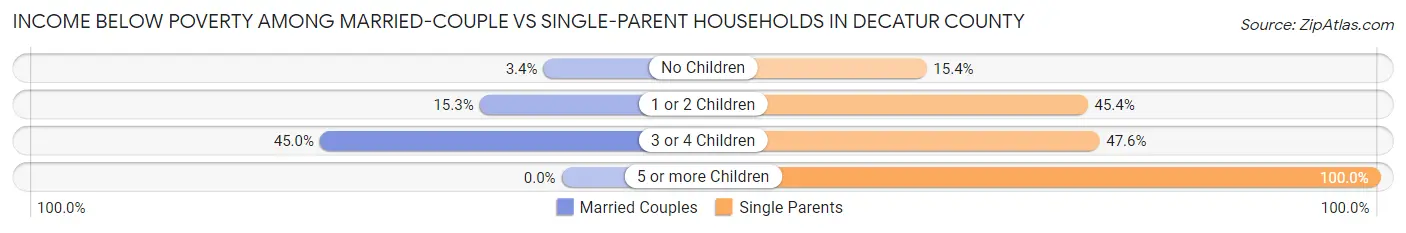
| Children | Married-Couple Families | Single-Parent Households |
| No Children | 96 (3.4%) | 145 (15.4%) |
| 1 or 2 Children | 171 (15.3%) | 546 (45.4%) |
| 3 or 4 Children | 190 (45.0%) | 190 (47.6%) |
| 5 or more Children | 0 (0.0%) | 24 (100.0%) |
| Total | 457 (10.3%) | 905 (35.3%) |
Employment Characteristics in Decatur County
Employment by Class of Employer in Decatur County
Among the 10,902 employed individuals in Decatur County, private company employees (7,251 | 66.5%), local government employees (866 | 7.9%), and state government employees (801 | 7.3%) make up the most common classes of employment.
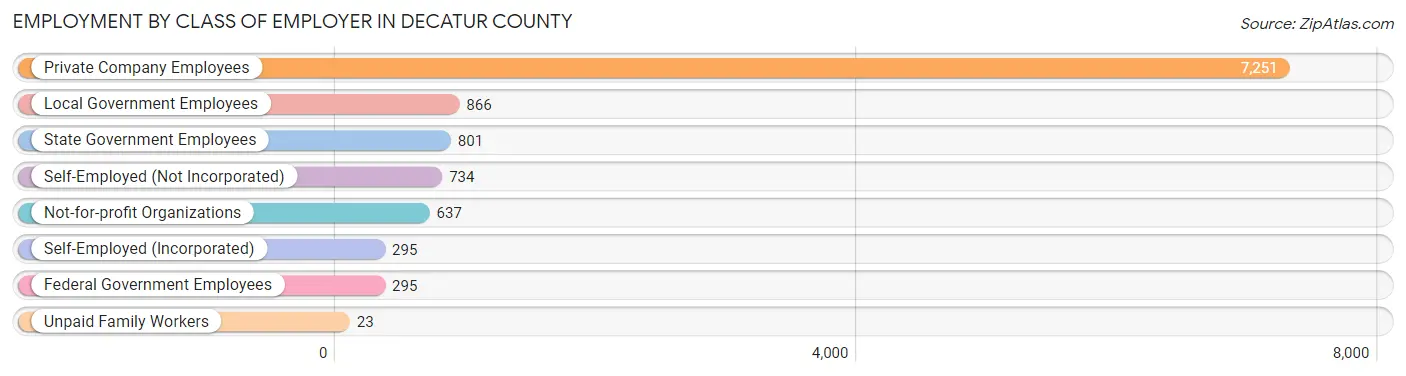
| Employer Class | # Employees | % Employees |
| Private Company Employees | 7,251 | 66.5% |
| Self-Employed (Incorporated) | 295 | 2.7% |
| Self-Employed (Not Incorporated) | 734 | 6.7% |
| Not-for-profit Organizations | 637 | 5.8% |
| Local Government Employees | 866 | 7.9% |
| State Government Employees | 801 | 7.3% |
| Federal Government Employees | 295 | 2.7% |
| Unpaid Family Workers | 23 | 0.2% |
| Total | 10,902 | 100.0% |
Employment Status by Age in Decatur County
According to the labor force statistics for Decatur County, out of the total population over 16 years of age (22,565), 53.0% or 11,959 individuals are in the labor force, with 6.4% or 765 of them unemployed. The age group with the highest labor force participation rate is 20 to 24 years, with 75.1% or 1,398 individuals in the labor force. Within the labor force, the 16 to 19 years age range has the highest percentage of unemployed individuals, with 34.0% or 128 of them being unemployed.
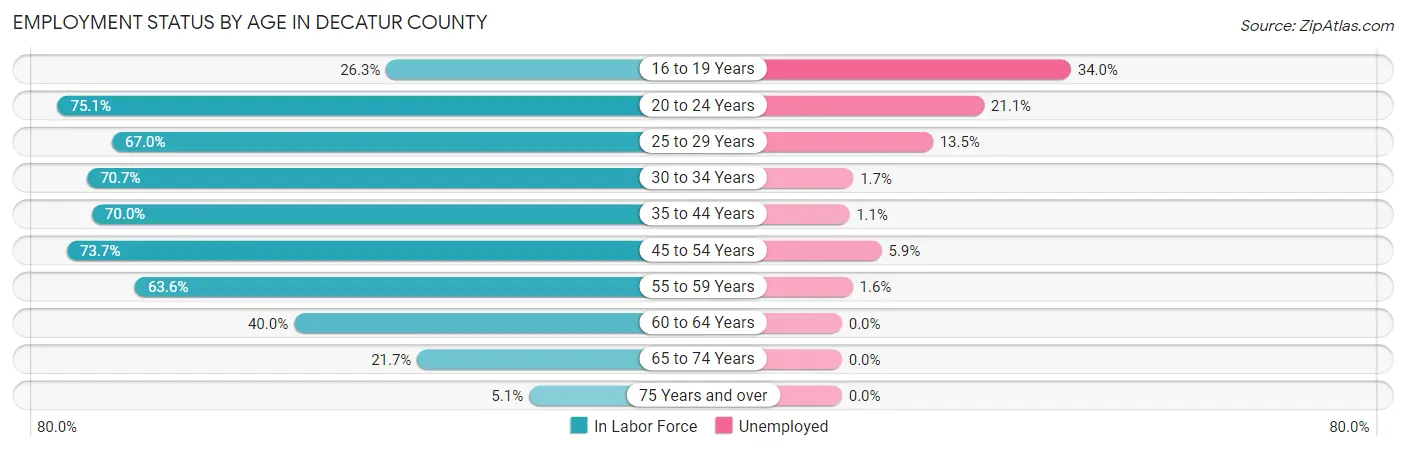
| Age Bracket | In Labor Force | Unemployed |
| 16 to 19 Years | 377 (26.3%) | 128 (34.0%) |
| 20 to 24 Years | 1,398 (75.1%) | 295 (21.1%) |
| 25 to 29 Years | 1,218 (67.0%) | 164 (13.5%) |
| 30 to 34 Years | 1,090 (70.7%) | 19 (1.7%) |
| 35 to 44 Years | 2,860 (70.0%) | 31 (1.1%) |
| 45 to 54 Years | 2,297 (73.7%) | 136 (5.9%) |
| 55 to 59 Years | 1,223 (63.6%) | 20 (1.6%) |
| 60 to 64 Years | 776 (40.0%) | 0 (0.0%) |
| 65 to 74 Years | 609 (21.7%) | 0 (0.0%) |
| 75 Years and over | 104 (5.1%) | 0 (0.0%) |
| Total | 11,959 (53.0%) | 765 (6.4%) |
Employment Status by Educational Attainment in Decatur County
According to labor force statistics for Decatur County, 65.6% of individuals (9,464) out of the total population between 25 and 64 years of age (14,427) are in the labor force, with 3.9% or 369 of them being unemployed. The group with the highest labor force participation rate are those with the educational attainment of bachelor's degree or higher, with 85.4% or 1,651 individuals in the labor force. Within the labor force, individuals with less than high school education have the highest percentage of unemployment, with 19.8% or 114 of them being unemployed.
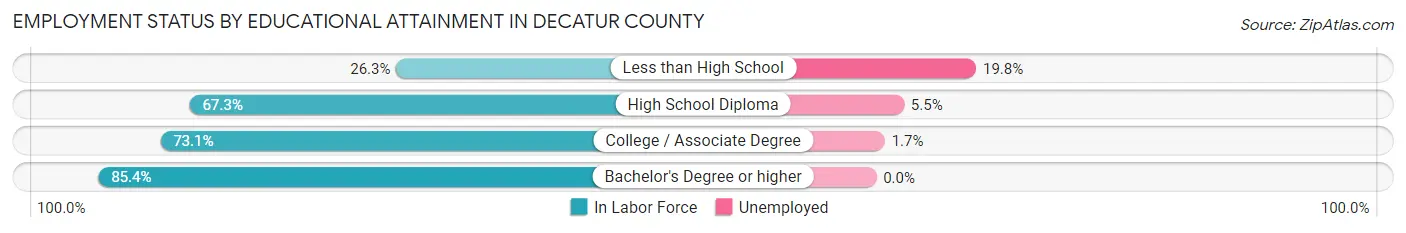
| Educational Attainment | In Labor Force | Unemployed |
| Less than High School | 577 (26.3%) | 434 (19.8%) |
| High School Diploma | 3,405 (67.3%) | 278 (5.5%) |
| College / Associate Degree | 3,830 (73.1%) | 89 (1.7%) |
| Bachelor's Degree or higher | 1,651 (85.4%) | 0 (0.0%) |
| Total | 9,464 (65.6%) | 563 (3.9%) |
Employment Occupations by Sex in Decatur County
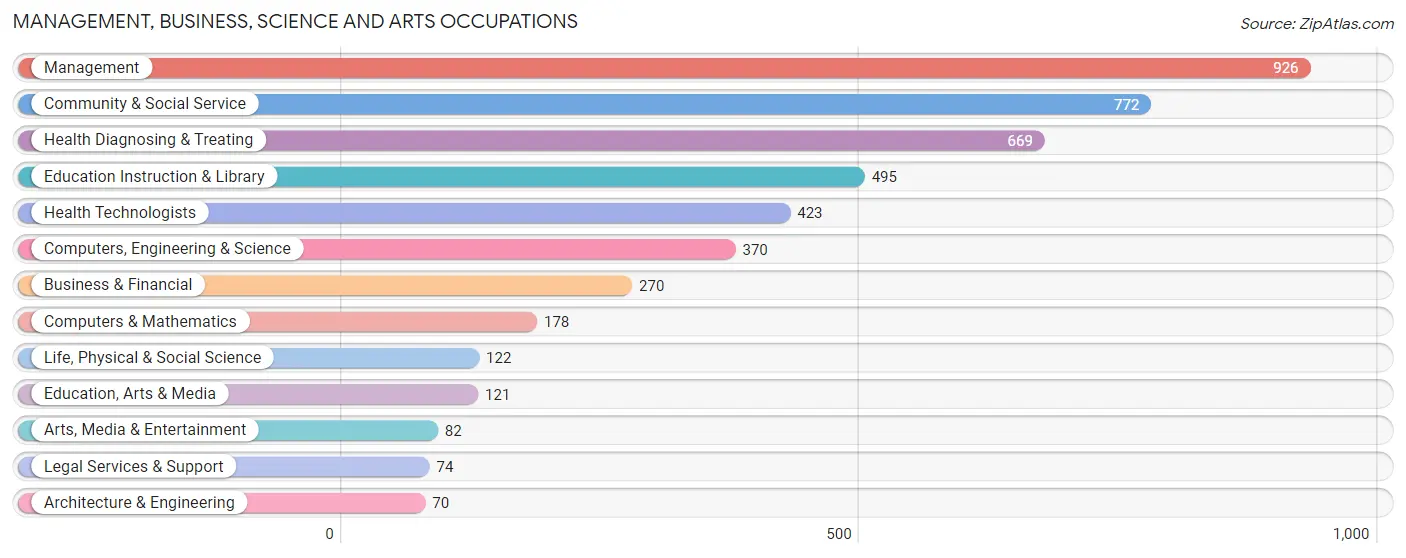
Management, Business, Science and Arts Occupations
The most common Management, Business, Science and Arts occupations in Decatur County are Management (926 | 8.4%), Community & Social Service (772 | 7.0%), Health Diagnosing & Treating (669 | 6.1%), Education Instruction & Library (495 | 4.5%), and Health Technologists (423 | 3.8%).
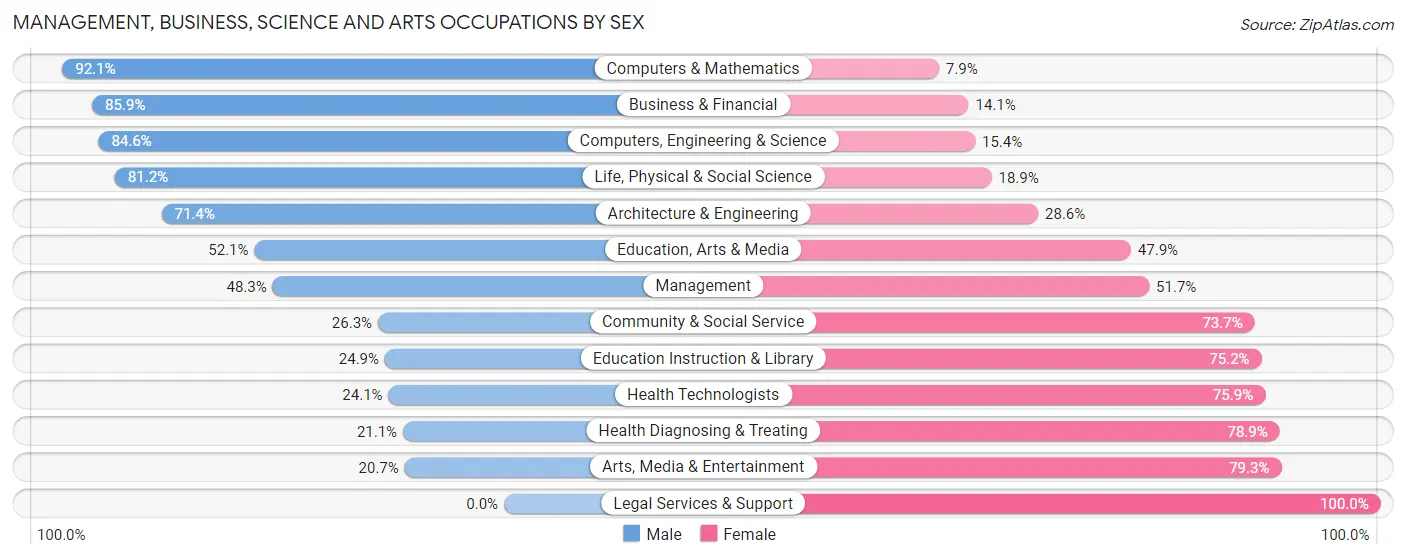
Management, Business, Science and Arts Occupations by Sex
Within the Management, Business, Science and Arts occupations in Decatur County, the most male-oriented occupations are Computers & Mathematics (92.1%), Business & Financial (85.9%), and Computers, Engineering & Science (84.6%), while the most female-oriented occupations are Legal Services & Support (100.0%), Arts, Media & Entertainment (79.3%), and Health Diagnosing & Treating (78.9%).
| Occupation | Male | Female |
| Management | 447 (48.3%) | 479 (51.7%) |
| Business & Financial | 232 (85.9%) | 38 (14.1%) |
| Computers, Engineering & Science | 313 (84.6%) | 57 (15.4%) |
| Computers & Mathematics | 164 (92.1%) | 14 (7.9%) |
| Architecture & Engineering | 50 (71.4%) | 20 (28.6%) |
| Life, Physical & Social Science | 99 (81.1%) | 23 (18.9%) |
| Community & Social Service | 203 (26.3%) | 569 (73.7%) |
| Education, Arts & Media | 63 (52.1%) | 58 (47.9%) |
| Legal Services & Support | 0 (0.0%) | 74 (100.0%) |
| Education Instruction & Library | 123 (24.8%) | 372 (75.1%) |
| Arts, Media & Entertainment | 17 (20.7%) | 65 (79.3%) |
| Health Diagnosing & Treating | 141 (21.1%) | 528 (78.9%) |
| Health Technologists | 102 (24.1%) | 321 (75.9%) |
| Total (Category) | 1,336 (44.4%) | 1,671 (55.6%) |
| Total (Overall) | 5,631 (51.0%) | 5,412 (49.0%) |
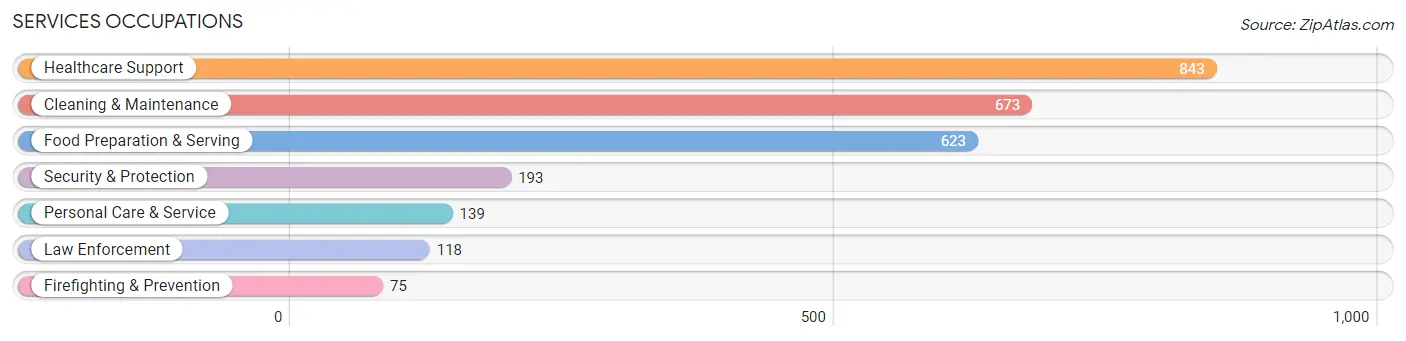
Services Occupations
The most common Services occupations in Decatur County are Healthcare Support (843 | 7.6%), Cleaning & Maintenance (673 | 6.1%), Food Preparation & Serving (623 | 5.6%), Security & Protection (193 | 1.8%), and Personal Care & Service (139 | 1.3%).
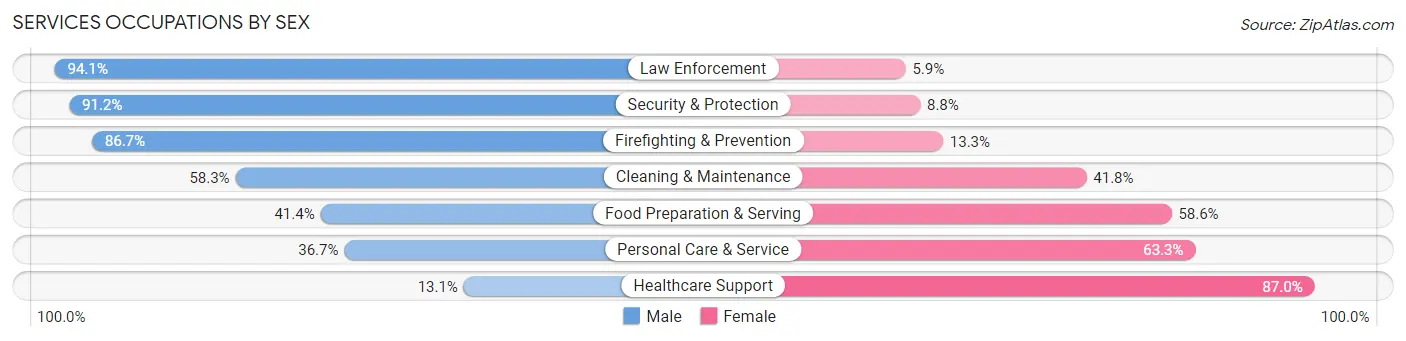
Services Occupations by Sex
Within the Services occupations in Decatur County, the most male-oriented occupations are Law Enforcement (94.1%), Security & Protection (91.2%), and Firefighting & Prevention (86.7%), while the most female-oriented occupations are Healthcare Support (87.0%), Personal Care & Service (63.3%), and Food Preparation & Serving (58.6%).
| Occupation | Male | Female |
| Healthcare Support | 110 (13.1%) | 733 (87.0%) |
| Security & Protection | 176 (91.2%) | 17 (8.8%) |
| Firefighting & Prevention | 65 (86.7%) | 10 (13.3%) |
| Law Enforcement | 111 (94.1%) | 7 (5.9%) |
| Food Preparation & Serving | 258 (41.4%) | 365 (58.6%) |
| Cleaning & Maintenance | 392 (58.3%) | 281 (41.7%) |
| Personal Care & Service | 51 (36.7%) | 88 (63.3%) |
| Total (Category) | 987 (39.9%) | 1,484 (60.1%) |
| Total (Overall) | 5,631 (51.0%) | 5,412 (49.0%) |
Sales and Office Occupations
The most common Sales and Office occupations in Decatur County are Sales & Related (1,143 | 10.3%), and Office & Administration (993 | 9.0%).

Sales and Office Occupations by Sex

| Occupation | Male | Female |
| Sales & Related | 545 (47.7%) | 598 (52.3%) |
| Office & Administration | 130 (13.1%) | 863 (86.9%) |
| Total (Category) | 675 (31.6%) | 1,461 (68.4%) |
| Total (Overall) | 5,631 (51.0%) | 5,412 (49.0%) |
Natural Resources, Construction and Maintenance Occupations
The most common Natural Resources, Construction and Maintenance occupations in Decatur County are Construction & Extraction (519 | 4.7%), Installation, Maintenance & Repair (455 | 4.1%), and Farming, Fishing & Forestry (142 | 1.3%).

Natural Resources, Construction and Maintenance Occupations by Sex
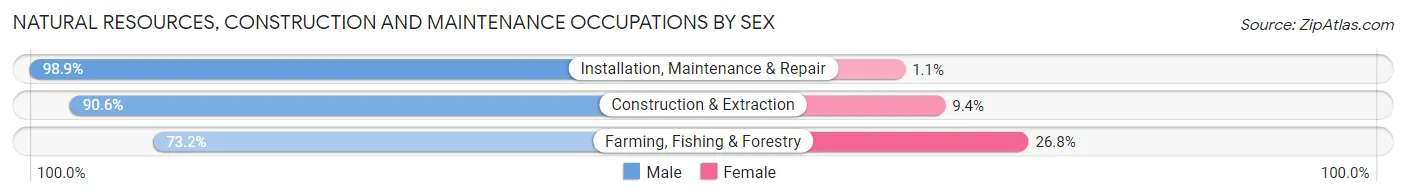
| Occupation | Male | Female |
| Farming, Fishing & Forestry | 104 (73.2%) | 38 (26.8%) |
| Construction & Extraction | 470 (90.6%) | 49 (9.4%) |
| Installation, Maintenance & Repair | 450 (98.9%) | 5 (1.1%) |
| Total (Category) | 1,024 (91.8%) | 92 (8.2%) |
| Total (Overall) | 5,631 (51.0%) | 5,412 (49.0%) |
Production, Transportation and Moving Occupations
The most common Production, Transportation and Moving occupations in Decatur County are Production (983 | 8.9%), Material Moving (783 | 7.1%), and Transportation (547 | 5.0%).

Production, Transportation and Moving Occupations by Sex
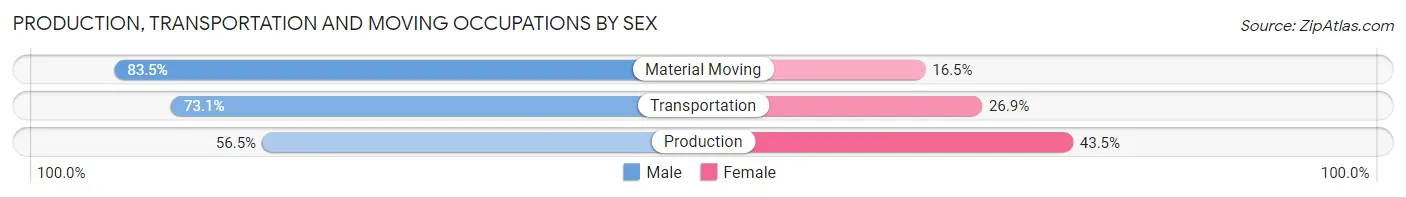
| Occupation | Male | Female |
| Production | 555 (56.5%) | 428 (43.5%) |
| Transportation | 400 (73.1%) | 147 (26.9%) |
| Material Moving | 654 (83.5%) | 129 (16.5%) |
| Total (Category) | 1,609 (69.6%) | 704 (30.4%) |
| Total (Overall) | 5,631 (51.0%) | 5,412 (49.0%) |
Employment Industries by Sex in Decatur County
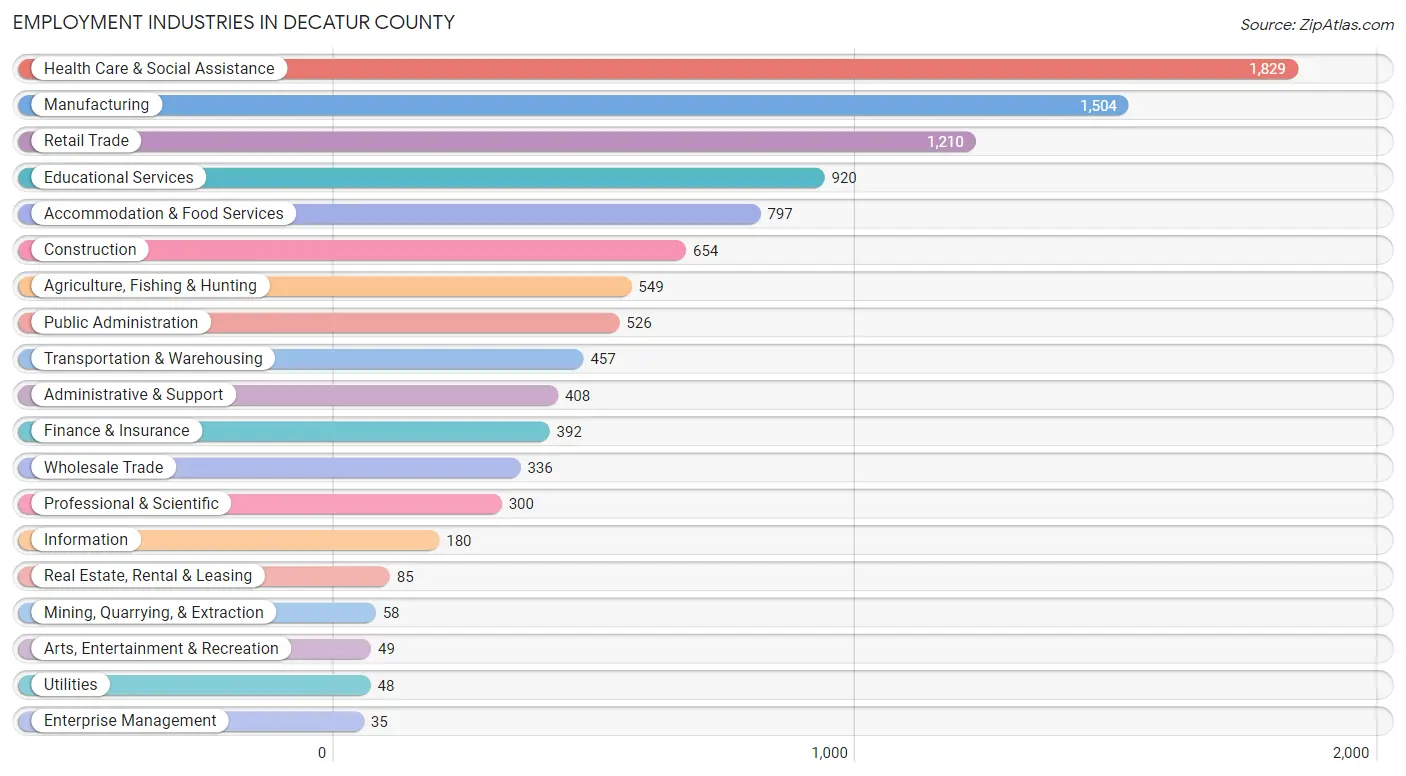
Employment Industries in Decatur County
The major employment industries in Decatur County include Health Care & Social Assistance (1,829 | 16.6%), Manufacturing (1,504 | 13.6%), Retail Trade (1,210 | 11.0%), Educational Services (920 | 8.3%), and Accommodation & Food Services (797 | 7.2%).
Employment Industries by Sex in Decatur County
The Decatur County industries that see more men than women are Mining, Quarrying, & Extraction (100.0%), Utilities (100.0%), and Arts, Entertainment & Recreation (100.0%), whereas the industries that tend to have a higher number of women are Enterprise Management (100.0%), Health Care & Social Assistance (78.5%), and Educational Services (77.6%).
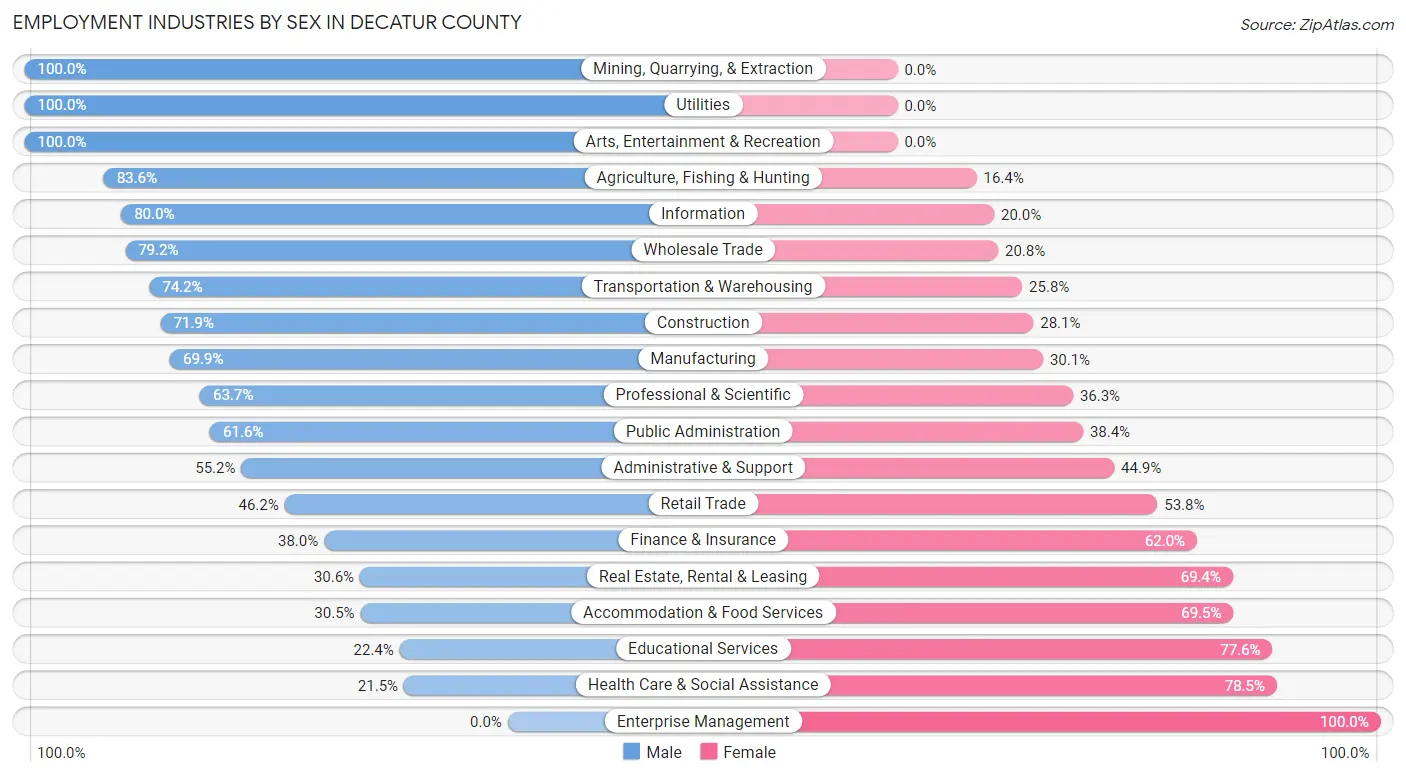
| Industry | Male | Female |
| Agriculture, Fishing & Hunting | 459 (83.6%) | 90 (16.4%) |
| Mining, Quarrying, & Extraction | 58 (100.0%) | 0 (0.0%) |
| Construction | 470 (71.9%) | 184 (28.1%) |
| Manufacturing | 1,051 (69.9%) | 453 (30.1%) |
| Wholesale Trade | 266 (79.2%) | 70 (20.8%) |
| Retail Trade | 559 (46.2%) | 651 (53.8%) |
| Transportation & Warehousing | 339 (74.2%) | 118 (25.8%) |
| Utilities | 48 (100.0%) | 0 (0.0%) |
| Information | 144 (80.0%) | 36 (20.0%) |
| Finance & Insurance | 149 (38.0%) | 243 (62.0%) |
| Real Estate, Rental & Leasing | 26 (30.6%) | 59 (69.4%) |
| Professional & Scientific | 191 (63.7%) | 109 (36.3%) |
| Enterprise Management | 0 (0.0%) | 35 (100.0%) |
| Administrative & Support | 225 (55.1%) | 183 (44.9%) |
| Educational Services | 206 (22.4%) | 714 (77.6%) |
| Health Care & Social Assistance | 393 (21.5%) | 1,436 (78.5%) |
| Arts, Entertainment & Recreation | 49 (100.0%) | 0 (0.0%) |
| Accommodation & Food Services | 243 (30.5%) | 554 (69.5%) |
| Public Administration | 324 (61.6%) | 202 (38.4%) |
| Total | 5,631 (51.0%) | 5,412 (49.0%) |
Education in Decatur County
School Enrollment in Decatur County
The most common levels of schooling among the 6,042 students in Decatur County are high school (1,597 | 26.4%), middle school (1,498 | 24.8%), and elementary school (1,442 | 23.9%).

| School Level | # Students | % Students |
| Nursery / Preschool | 455 | 7.5% |
| Kindergarten | 505 | 8.4% |
| Elementary School | 1,442 | 23.9% |
| Middle School | 1,498 | 24.8% |
| High School | 1,597 | 26.4% |
| College / Undergraduate | 453 | 7.5% |
| Graduate / Professional | 92 | 1.5% |
| Total | 6,042 | 100.0% |
School Enrollment by Age by Funding Source in Decatur County
Out of a total of 6,042 students who are enrolled in schools in Decatur County, 453 (7.5%) attend a private institution, while the remaining 5,589 (92.5%) are enrolled in public schools. The age group of 25 to 34 year olds has the highest likelihood of being enrolled in private schools, with 103 (58.5% in the age bracket) enrolled. Conversely, the age group of 20 to 24 year olds has the lowest likelihood of being enrolled in a private school, with 184 (100.0% in the age bracket) attending a public institution.
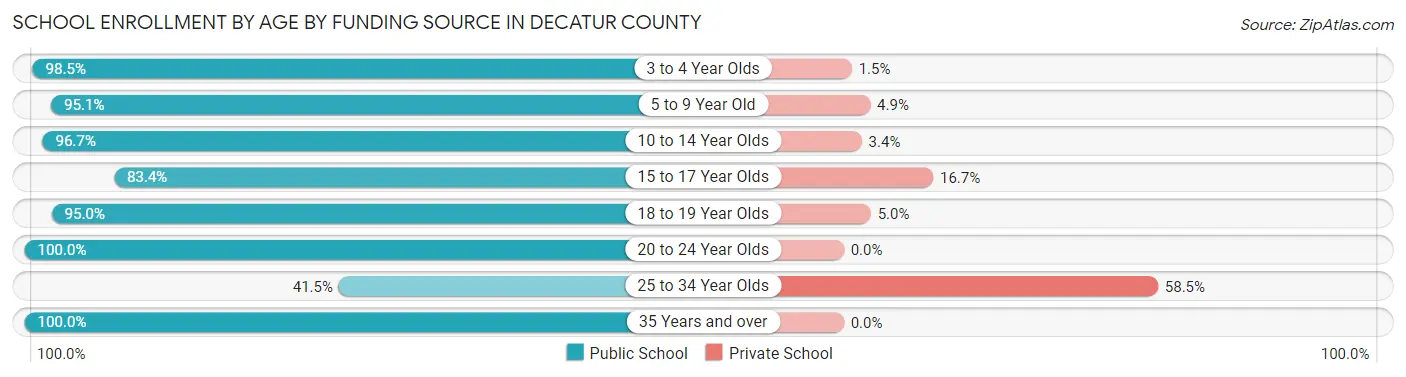
| Age Bracket | Public School | Private School |
| 3 to 4 Year Olds | 328 (98.5%) | 5 (1.5%) |
| 5 to 9 Year Old | 1,600 (95.1%) | 83 (4.9%) |
| 10 to 14 Year Olds | 2,107 (96.7%) | 73 (3.4%) |
| 15 to 17 Year Olds | 856 (83.4%) | 171 (16.7%) |
| 18 to 19 Year Olds | 358 (95.0%) | 19 (5.0%) |
| 20 to 24 Year Olds | 184 (100.0%) | 0 (0.0%) |
| 25 to 34 Year Olds | 73 (41.5%) | 103 (58.5%) |
| 35 Years and over | 82 (100.0%) | 0 (0.0%) |
| Total | 5,589 (92.5%) | 453 (7.5%) |
Educational Attainment by Field of Study in Decatur County
Education (548 | 18.3%), business (529 | 17.6%), science & technology (368 | 12.3%), bio, nature & agricultural (362 | 12.1%), and liberal arts & history (275 | 9.2%) are the most common fields of study among 2,999 individuals in Decatur County who have obtained a bachelor's degree or higher.
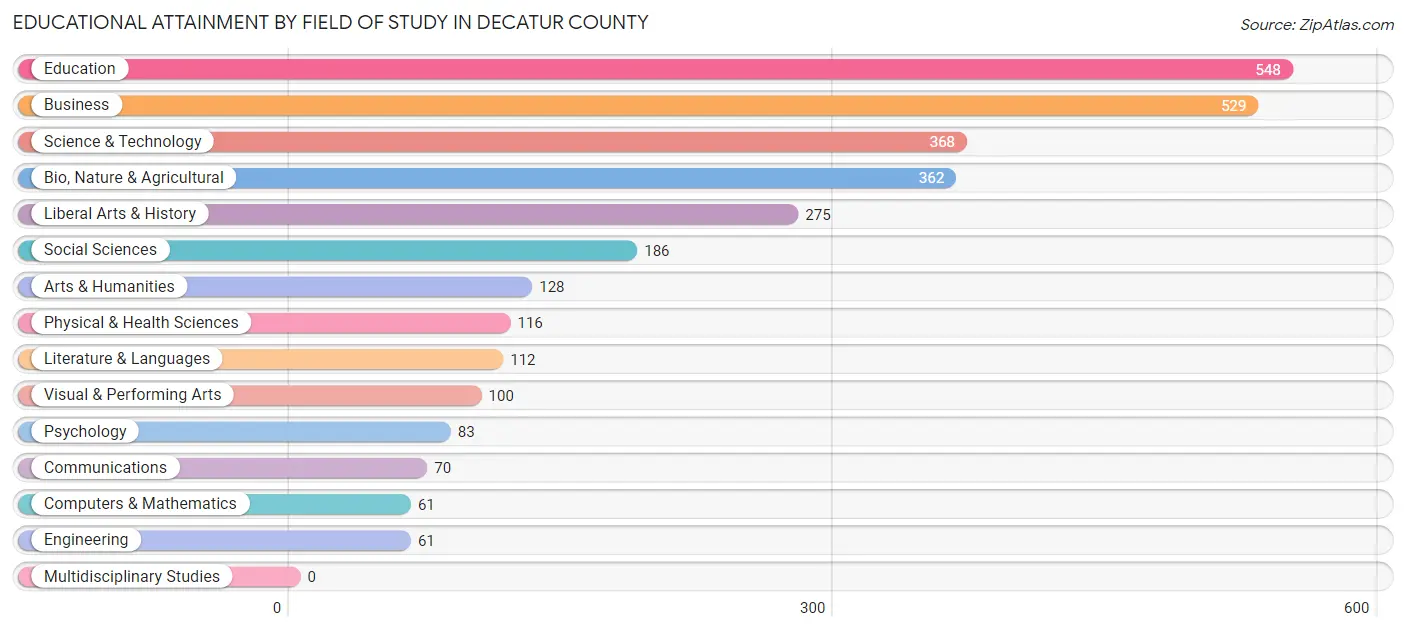
| Field of Study | # Graduates | % Graduates |
| Computers & Mathematics | 61 | 2.0% |
| Bio, Nature & Agricultural | 362 | 12.1% |
| Physical & Health Sciences | 116 | 3.9% |
| Psychology | 83 | 2.8% |
| Social Sciences | 186 | 6.2% |
| Engineering | 61 | 2.0% |
| Multidisciplinary Studies | 0 | 0.0% |
| Science & Technology | 368 | 12.3% |
| Business | 529 | 17.6% |
| Education | 548 | 18.3% |
| Literature & Languages | 112 | 3.7% |
| Liberal Arts & History | 275 | 9.2% |
| Visual & Performing Arts | 100 | 3.3% |
| Communications | 70 | 2.3% |
| Arts & Humanities | 128 | 4.3% |
| Total | 2,999 | 100.0% |
Transportation & Commute in Decatur County
Vehicle Availability by Sex in Decatur County
The most prevalent vehicle ownership categories in Decatur County are males with 2 vehicles (2,494, accounting for 44.5%) and females with 2 vehicles (2,104, making up 47.4%).

| Vehicles Available | Male | Female |
| No Vehicle | 91 (1.6%) | 394 (7.5%) |
| 1 Vehicle | 966 (17.2%) | 1,297 (24.7%) |
| 2 Vehicles | 2,494 (44.5%) | 2,104 (40.0%) |
| 3 Vehicles | 1,322 (23.6%) | 817 (15.5%) |
| 4 Vehicles | 514 (9.2%) | 432 (8.2%) |
| 5 or more Vehicles | 221 (3.9%) | 212 (4.0%) |
| Total | 5,608 (100.0%) | 5,256 (100.0%) |
Commute Time in Decatur County
The most frequently occuring commute durations in Decatur County are 10 to 14 minutes (2,252 commuters, 21.1%), 15 to 19 minutes (1,965 commuters, 18.4%), and 5 to 9 minutes (1,788 commuters, 16.8%).
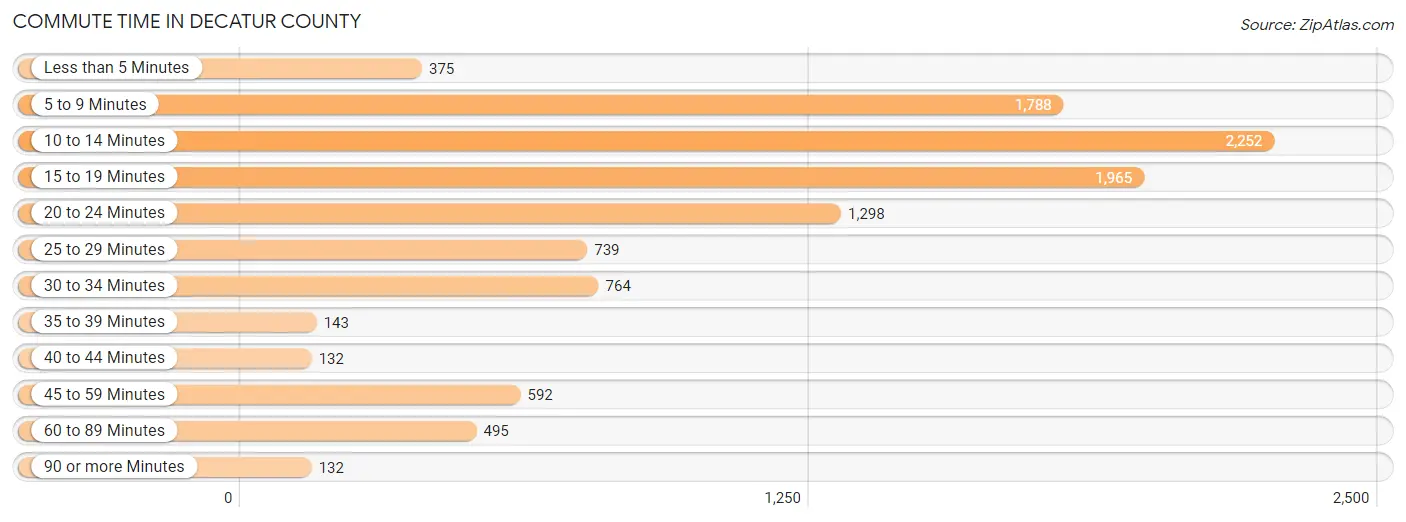
| Commute Time | # Commuters | % Commuters |
| Less than 5 Minutes | 375 | 3.5% |
| 5 to 9 Minutes | 1,788 | 16.8% |
| 10 to 14 Minutes | 2,252 | 21.1% |
| 15 to 19 Minutes | 1,965 | 18.4% |
| 20 to 24 Minutes | 1,298 | 12.2% |
| 25 to 29 Minutes | 739 | 6.9% |
| 30 to 34 Minutes | 764 | 7.2% |
| 35 to 39 Minutes | 143 | 1.3% |
| 40 to 44 Minutes | 132 | 1.2% |
| 45 to 59 Minutes | 592 | 5.6% |
| 60 to 89 Minutes | 495 | 4.6% |
| 90 or more Minutes | 132 | 1.2% |
Commute Time by Sex in Decatur County
The most common commute times in Decatur County are 5 to 9 minutes (1,085 commuters, 19.7%) for males and 10 to 14 minutes (1,572 commuters, 30.4%) for females.
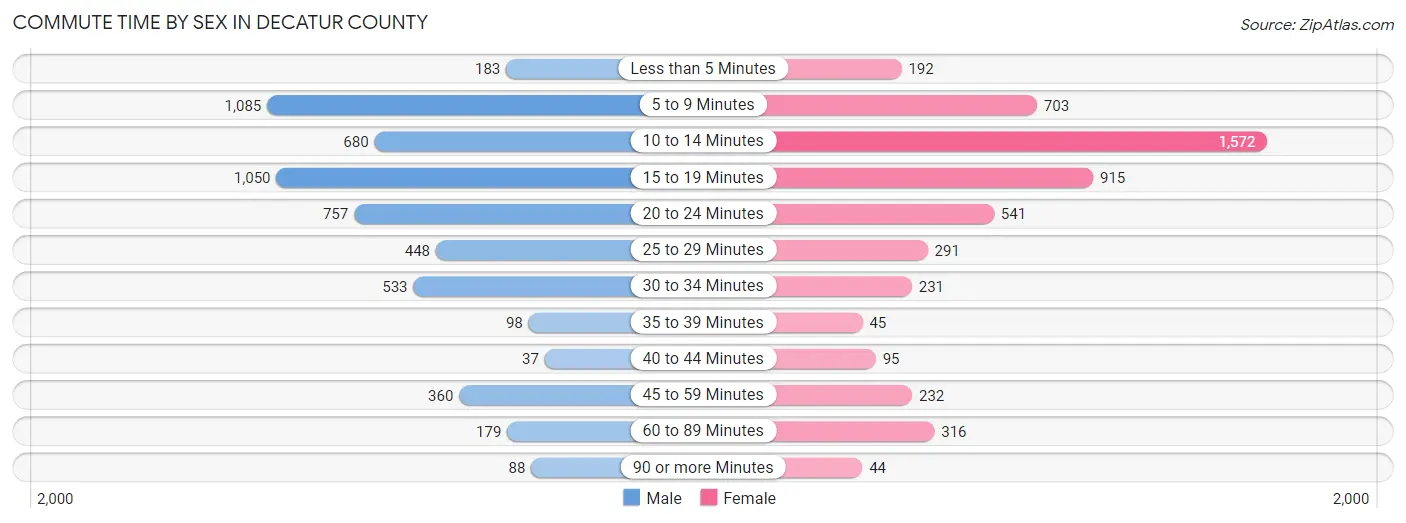
| Commute Time | Male | Female |
| Less than 5 Minutes | 183 (3.3%) | 192 (3.7%) |
| 5 to 9 Minutes | 1,085 (19.7%) | 703 (13.6%) |
| 10 to 14 Minutes | 680 (12.4%) | 1,572 (30.4%) |
| 15 to 19 Minutes | 1,050 (19.1%) | 915 (17.7%) |
| 20 to 24 Minutes | 757 (13.8%) | 541 (10.4%) |
| 25 to 29 Minutes | 448 (8.2%) | 291 (5.6%) |
| 30 to 34 Minutes | 533 (9.7%) | 231 (4.5%) |
| 35 to 39 Minutes | 98 (1.8%) | 45 (0.9%) |
| 40 to 44 Minutes | 37 (0.7%) | 95 (1.8%) |
| 45 to 59 Minutes | 360 (6.6%) | 232 (4.5%) |
| 60 to 89 Minutes | 179 (3.3%) | 316 (6.1%) |
| 90 or more Minutes | 88 (1.6%) | 44 (0.9%) |
Time of Departure to Work by Sex in Decatur County
The most frequent times of departure to work in Decatur County are 7:00 AM to 7:29 AM (1,027, 18.7%) for males and 7:30 AM to 7:59 AM (1,203, 23.2%) for females.
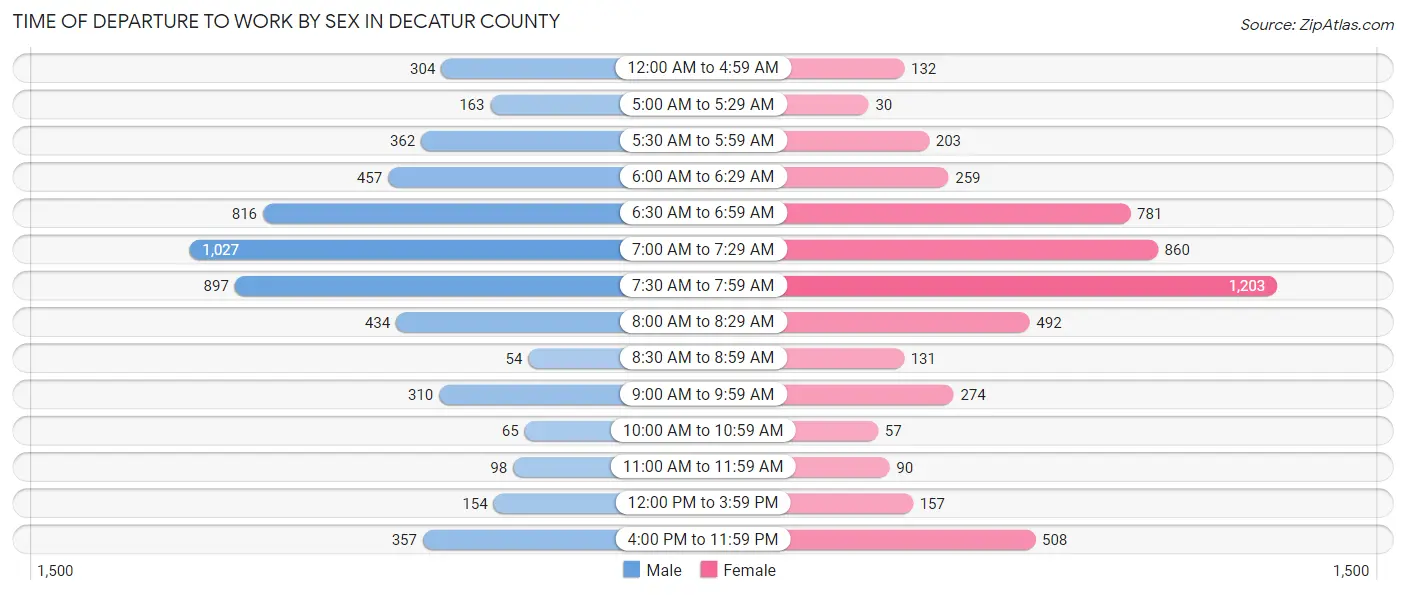
| Time of Departure | Male | Female |
| 12:00 AM to 4:59 AM | 304 (5.5%) | 132 (2.5%) |
| 5:00 AM to 5:29 AM | 163 (3.0%) | 30 (0.6%) |
| 5:30 AM to 5:59 AM | 362 (6.6%) | 203 (3.9%) |
| 6:00 AM to 6:29 AM | 457 (8.3%) | 259 (5.0%) |
| 6:30 AM to 6:59 AM | 816 (14.8%) | 781 (15.1%) |
| 7:00 AM to 7:29 AM | 1,027 (18.7%) | 860 (16.6%) |
| 7:30 AM to 7:59 AM | 897 (16.3%) | 1,203 (23.2%) |
| 8:00 AM to 8:29 AM | 434 (7.9%) | 492 (9.5%) |
| 8:30 AM to 8:59 AM | 54 (1.0%) | 131 (2.5%) |
| 9:00 AM to 9:59 AM | 310 (5.6%) | 274 (5.3%) |
| 10:00 AM to 10:59 AM | 65 (1.2%) | 57 (1.1%) |
| 11:00 AM to 11:59 AM | 98 (1.8%) | 90 (1.7%) |
| 12:00 PM to 3:59 PM | 154 (2.8%) | 157 (3.0%) |
| 4:00 PM to 11:59 PM | 357 (6.5%) | 508 (9.8%) |
| Total | 5,498 (100.0%) | 5,177 (100.0%) |
Housing Occupancy in Decatur County
Occupancy by Ownership in Decatur County
Of the total 10,295 dwellings in Decatur County, owner-occupied units account for 6,243 (60.6%), while renter-occupied units make up 4,052 (39.4%).
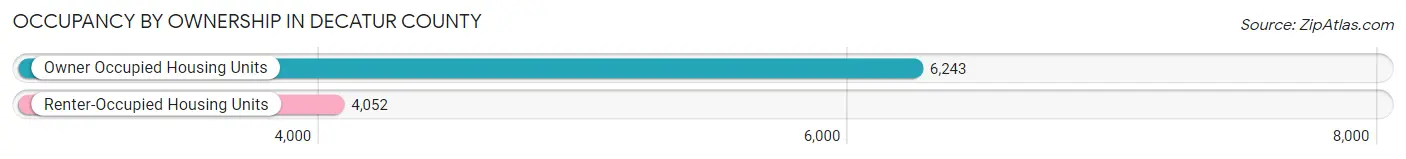
| Occupancy | # Housing Units | % Housing Units |
| Owner Occupied Housing Units | 6,243 | 60.6% |
| Renter-Occupied Housing Units | 4,052 | 39.4% |
| Total Occupied Housing Units | 10,295 | 100.0% |
Occupancy by Household Size in Decatur County
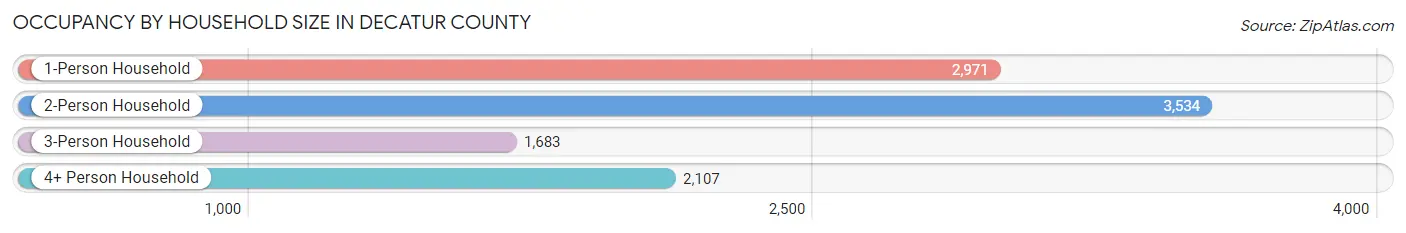
| Household Size | # Housing Units | % Housing Units |
| 1-Person Household | 2,971 | 28.9% |
| 2-Person Household | 3,534 | 34.3% |
| 3-Person Household | 1,683 | 16.4% |
| 4+ Person Household | 2,107 | 20.5% |
| Total Housing Units | 10,295 | 100.0% |
Occupancy by Ownership by Household Size in Decatur County
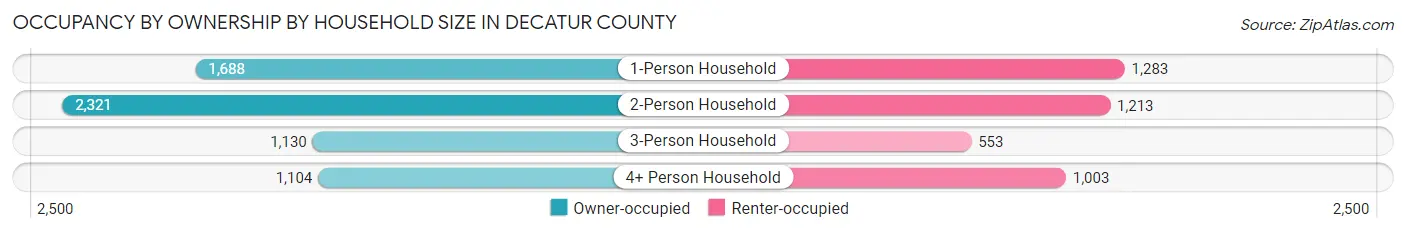
| Household Size | Owner-occupied | Renter-occupied |
| 1-Person Household | 1,688 (56.8%) | 1,283 (43.2%) |
| 2-Person Household | 2,321 (65.7%) | 1,213 (34.3%) |
| 3-Person Household | 1,130 (67.1%) | 553 (32.9%) |
| 4+ Person Household | 1,104 (52.4%) | 1,003 (47.6%) |
| Total Housing Units | 6,243 (60.6%) | 4,052 (39.4%) |
Occupancy by Educational Attainment in Decatur County
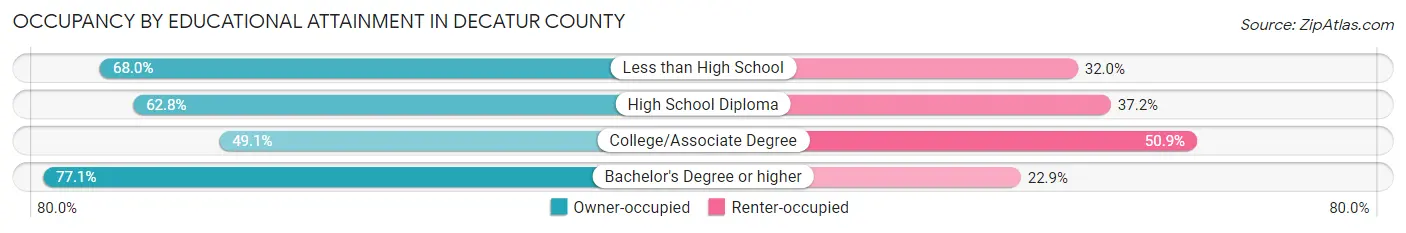
| Household Size | Owner-occupied | Renter-occupied |
| Less than High School | 957 (68.0%) | 450 (32.0%) |
| High School Diploma | 2,141 (62.8%) | 1,270 (37.2%) |
| College/Associate Degree | 1,892 (49.1%) | 1,959 (50.9%) |
| Bachelor's Degree or higher | 1,253 (77.1%) | 373 (22.9%) |
Occupancy by Age of Householder in Decatur County
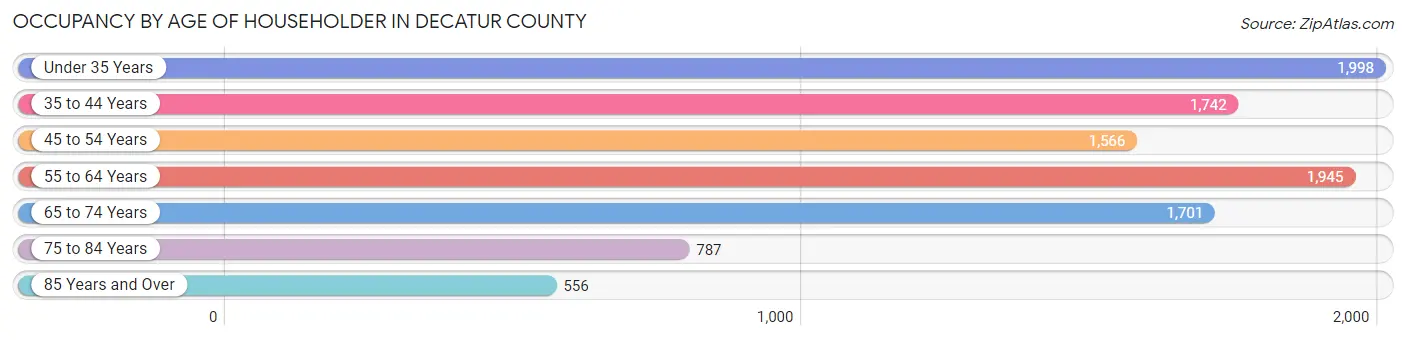
| Age Bracket | # Households | % Households |
| Under 35 Years | 1,998 | 19.4% |
| 35 to 44 Years | 1,742 | 16.9% |
| 45 to 54 Years | 1,566 | 15.2% |
| 55 to 64 Years | 1,945 | 18.9% |
| 65 to 74 Years | 1,701 | 16.5% |
| 75 to 84 Years | 787 | 7.6% |
| 85 Years and Over | 556 | 5.4% |
| Total | 10,295 | 100.0% |
Housing Finances in Decatur County
Median Income by Occupancy in Decatur County
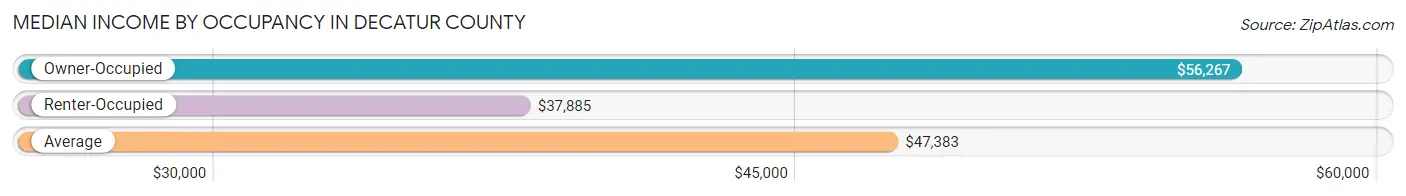
| Occupancy Type | # Households | Median Income |
| Owner-Occupied | 6,243 (60.6%) | $56,267 |
| Renter-Occupied | 4,052 (39.4%) | $37,885 |
| Average | 10,295 (100.0%) | $47,383 |
Occupancy by Householder Income Bracket in Decatur County
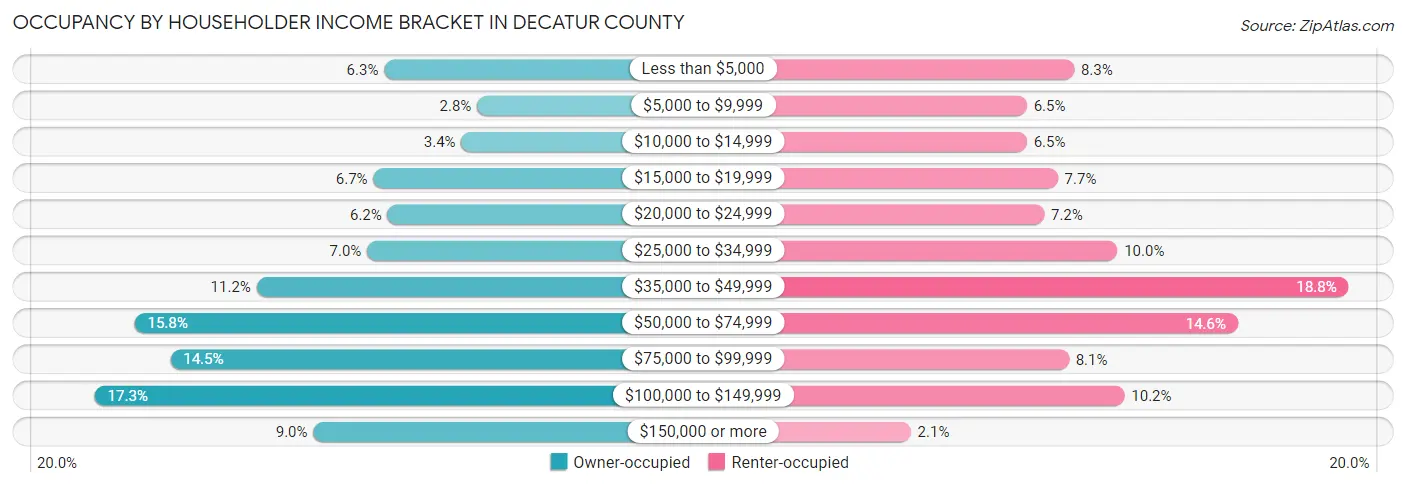
| Income Bracket | Owner-occupied | Renter-occupied |
| Less than $5,000 | 393 (6.3%) | 337 (8.3%) |
| $5,000 to $9,999 | 172 (2.8%) | 264 (6.5%) |
| $10,000 to $14,999 | 210 (3.4%) | 264 (6.5%) |
| $15,000 to $19,999 | 419 (6.7%) | 312 (7.7%) |
| $20,000 to $24,999 | 385 (6.2%) | 291 (7.2%) |
| $25,000 to $34,999 | 434 (7.0%) | 404 (10.0%) |
| $35,000 to $49,999 | 697 (11.2%) | 761 (18.8%) |
| $50,000 to $74,999 | 987 (15.8%) | 590 (14.6%) |
| $75,000 to $99,999 | 902 (14.4%) | 329 (8.1%) |
| $100,000 to $149,999 | 1,082 (17.3%) | 415 (10.2%) |
| $150,000 or more | 562 (9.0%) | 85 (2.1%) |
| Total | 6,243 (100.0%) | 4,052 (100.0%) |
Monthly Housing Cost Tiers in Decatur County
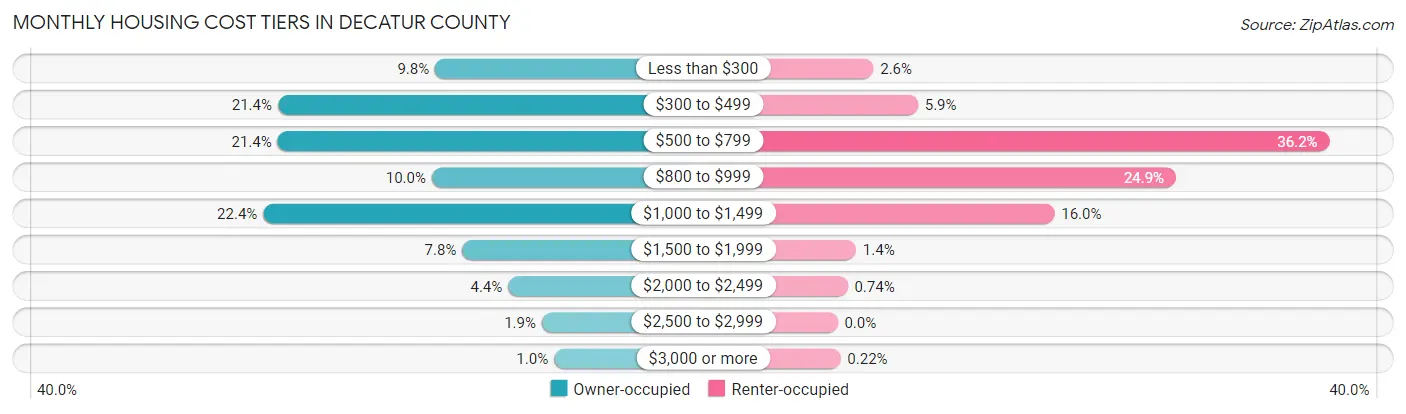
| Monthly Cost | Owner-occupied | Renter-occupied |
| Less than $300 | 610 (9.8%) | 107 (2.6%) |
| $300 to $499 | 1,333 (21.3%) | 240 (5.9%) |
| $500 to $799 | 1,334 (21.4%) | 1,468 (36.2%) |
| $800 to $999 | 625 (10.0%) | 1,010 (24.9%) |
| $1,000 to $1,499 | 1,400 (22.4%) | 647 (16.0%) |
| $1,500 to $1,999 | 485 (7.8%) | 55 (1.4%) |
| $2,000 to $2,499 | 274 (4.4%) | 30 (0.7%) |
| $2,500 to $2,999 | 119 (1.9%) | 0 (0.0%) |
| $3,000 or more | 63 (1.0%) | 9 (0.2%) |
| Total | 6,243 (100.0%) | 4,052 (100.0%) |
Physical Housing Characteristics in Decatur County
Housing Structures in Decatur County

| Structure Type | # Housing Units | % Housing Units |
| Single Unit, Detached | 7,045 | 68.4% |
| Single Unit, Attached | 34 | 0.3% |
| 2 Unit Apartments | 362 | 3.5% |
| 3 or 4 Unit Apartments | 397 | 3.9% |
| 5 to 9 Unit Apartments | 192 | 1.9% |
| 10 or more Apartments | 145 | 1.4% |
| Mobile Home / Other | 2,120 | 20.6% |
| Total | 10,295 | 100.0% |
Housing Structures by Occupancy in Decatur County

| Structure Type | Owner-occupied | Renter-occupied |
| Single Unit, Detached | 4,909 (69.7%) | 2,136 (30.3%) |
| Single Unit, Attached | 26 (76.5%) | 8 (23.5%) |
| 2 Unit Apartments | 0 (0.0%) | 362 (100.0%) |
| 3 or 4 Unit Apartments | 31 (7.8%) | 366 (92.2%) |
| 5 to 9 Unit Apartments | 0 (0.0%) | 192 (100.0%) |
| 10 or more Apartments | 0 (0.0%) | 145 (100.0%) |
| Mobile Home / Other | 1,277 (60.2%) | 843 (39.8%) |
| Total | 6,243 (60.6%) | 4,052 (39.4%) |
Housing Structures by Number of Rooms in Decatur County
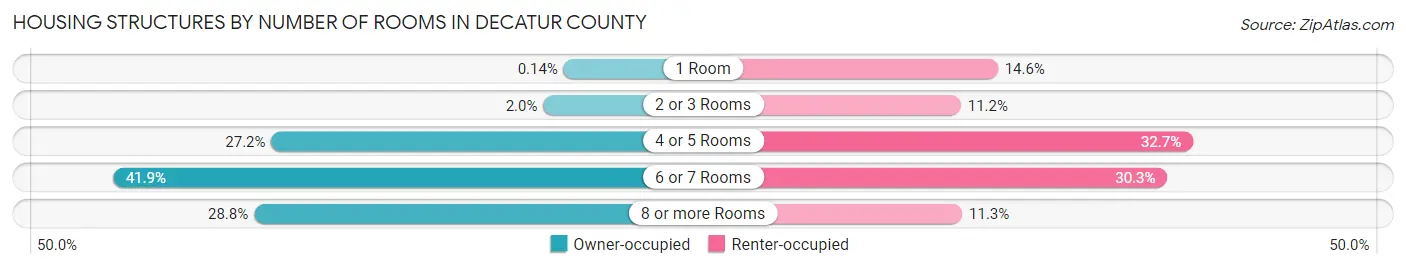
| Number of Rooms | Owner-occupied | Renter-occupied |
| 1 Room | 9 (0.1%) | 591 (14.6%) |
| 2 or 3 Rooms | 127 (2.0%) | 453 (11.2%) |
| 4 or 5 Rooms | 1,697 (27.2%) | 1,323 (32.7%) |
| 6 or 7 Rooms | 2,613 (41.8%) | 1,227 (30.3%) |
| 8 or more Rooms | 1,797 (28.8%) | 458 (11.3%) |
| Total | 6,243 (100.0%) | 4,052 (100.0%) |
Housing Structure by Heating Type in Decatur County

| Heating Type | Owner-occupied | Renter-occupied |
| Utility Gas | 333 (5.3%) | 272 (6.7%) |
| Bottled, Tank, or LP Gas | 243 (3.9%) | 31 (0.8%) |
| Electricity | 5,629 (90.2%) | 3,608 (89.0%) |
| Fuel Oil or Kerosene | 9 (0.1%) | 0 (0.0%) |
| Coal or Coke | 0 (0.0%) | 0 (0.0%) |
| All other Fuels | 20 (0.3%) | 64 (1.6%) |
| No Fuel Used | 9 (0.1%) | 77 (1.9%) |
| Total | 6,243 (100.0%) | 4,052 (100.0%) |
Household Vehicle Usage in Decatur County
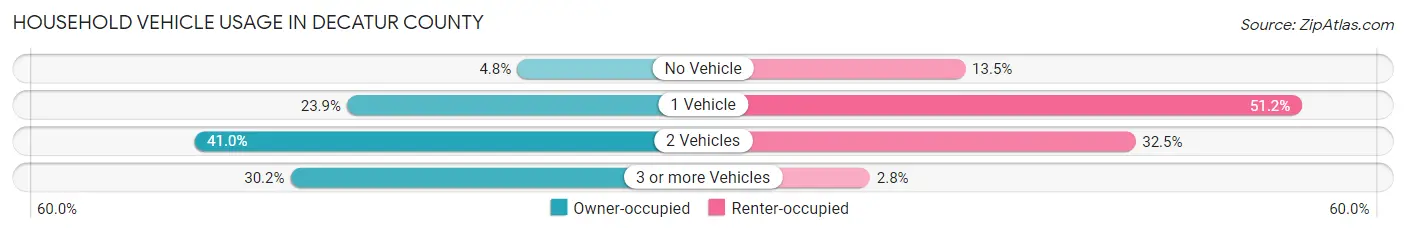
| Vehicles per Household | Owner-occupied | Renter-occupied |
| No Vehicle | 302 (4.8%) | 546 (13.5%) |
| 1 Vehicle | 1,493 (23.9%) | 2,075 (51.2%) |
| 2 Vehicles | 2,560 (41.0%) | 1,318 (32.5%) |
| 3 or more Vehicles | 1,888 (30.2%) | 113 (2.8%) |
| Total | 6,243 (100.0%) | 4,052 (100.0%) |
Real Estate & Mortgages in Decatur County
Real Estate and Mortgage Overview in Decatur County
| Characteristic | Without Mortgage | With Mortgage |
| Housing Units | 3,126 | 3,117 |
| Median Property Value | $115,200 | $152,800 |
| Median Household Income | $43,378 | $315 |
| Monthly Housing Costs | $444 | $63 |
| Real Estate Taxes | $1,194 | $69 |
Property Value by Mortgage Status in Decatur County
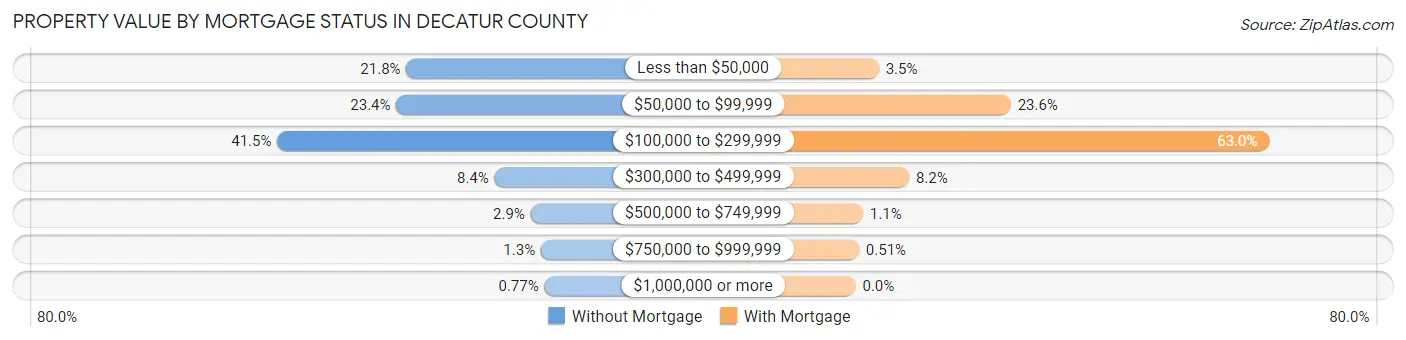
| Property Value | Without Mortgage | With Mortgage |
| Less than $50,000 | 682 (21.8%) | 110 (3.5%) |
| $50,000 to $99,999 | 730 (23.4%) | 737 (23.6%) |
| $100,000 to $299,999 | 1,297 (41.5%) | 1,965 (63.0%) |
| $300,000 to $499,999 | 262 (8.4%) | 254 (8.2%) |
| $500,000 to $749,999 | 90 (2.9%) | 35 (1.1%) |
| $750,000 to $999,999 | 41 (1.3%) | 16 (0.5%) |
| $1,000,000 or more | 24 (0.8%) | 0 (0.0%) |
| Total | 3,126 (100.0%) | 3,117 (100.0%) |
Household Income by Mortgage Status in Decatur County

| Household Income | Without Mortgage | With Mortgage |
| Less than $10,000 | 494 (15.8%) | 10 (0.3%) |
| $10,000 to $24,999 | 627 (20.1%) | 71 (2.3%) |
| $25,000 to $34,999 | 230 (7.4%) | 387 (12.4%) |
| $35,000 to $49,999 | 486 (15.5%) | 204 (6.5%) |
| $50,000 to $74,999 | 357 (11.4%) | 211 (6.8%) |
| $75,000 to $99,999 | 359 (11.5%) | 630 (20.2%) |
| $100,000 to $149,999 | 326 (10.4%) | 543 (17.4%) |
| $150,000 or more | 247 (7.9%) | 756 (24.2%) |
| Total | 3,126 (100.0%) | 3,117 (100.0%) |
Property Value to Household Income Ratio in Decatur County
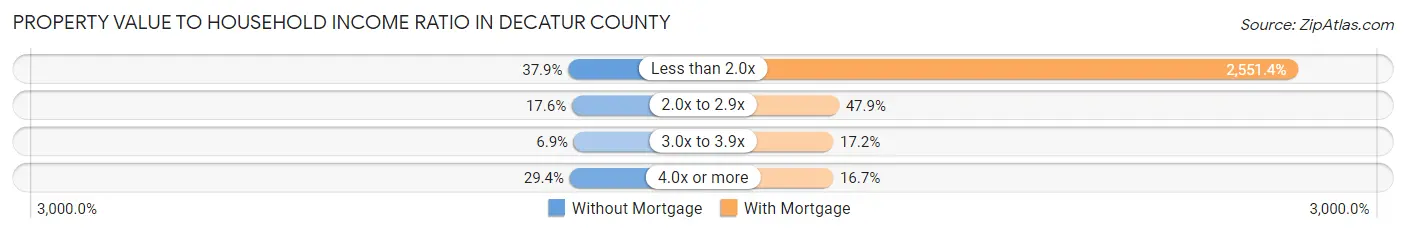
| Value-to-Income Ratio | Without Mortgage | With Mortgage |
| Less than 2.0x | 1,185 (37.9%) | 79,526 (2,551.4%) |
| 2.0x to 2.9x | 549 (17.6%) | 1,494 (47.9%) |
| 3.0x to 3.9x | 217 (6.9%) | 537 (17.2%) |
| 4.0x or more | 919 (29.4%) | 521 (16.7%) |
| Total | 3,126 (100.0%) | 3,117 (100.0%) |
Real Estate Taxes by Mortgage Status in Decatur County
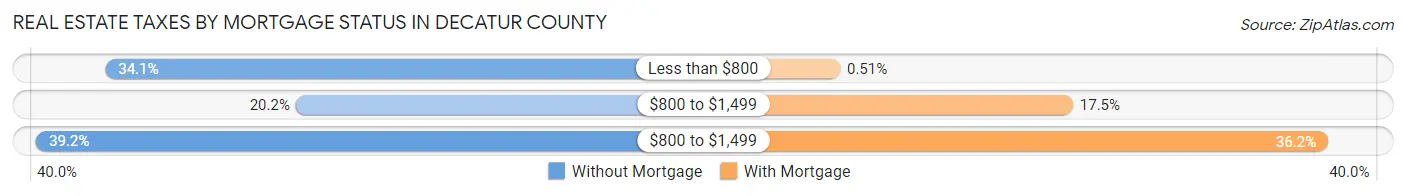
| Property Taxes | Without Mortgage | With Mortgage |
| Less than $800 | 1,066 (34.1%) | 16 (0.5%) |
| $800 to $1,499 | 631 (20.2%) | 546 (17.5%) |
| $800 to $1,499 | 1,224 (39.2%) | 1,127 (36.2%) |
| Total | 3,126 (100.0%) | 3,117 (100.0%) |
Health & Disability in Decatur County
Health Insurance Coverage by Age in Decatur County
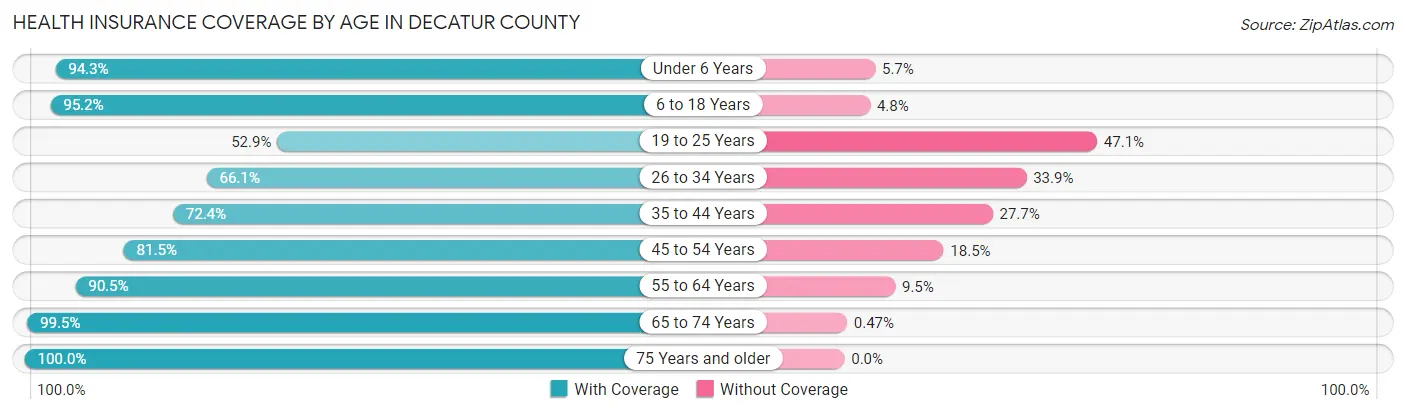
| Age Bracket | With Coverage | Without Coverage |
| Under 6 Years | 2,288 (94.3%) | 139 (5.7%) |
| 6 to 18 Years | 5,028 (95.2%) | 253 (4.8%) |
| 19 to 25 Years | 1,300 (52.9%) | 1,158 (47.1%) |
| 26 to 34 Years | 1,562 (66.1%) | 802 (33.9%) |
| 35 to 44 Years | 2,818 (72.4%) | 1,077 (27.7%) |
| 45 to 54 Years | 2,474 (81.5%) | 561 (18.5%) |
| 55 to 64 Years | 3,435 (90.5%) | 359 (9.5%) |
| 65 to 74 Years | 2,756 (99.5%) | 13 (0.5%) |
| 75 Years and older | 1,905 (100.0%) | 0 (0.0%) |
| Total | 23,566 (84.4%) | 4,362 (15.6%) |
Health Insurance Coverage by Citizenship Status in Decatur County
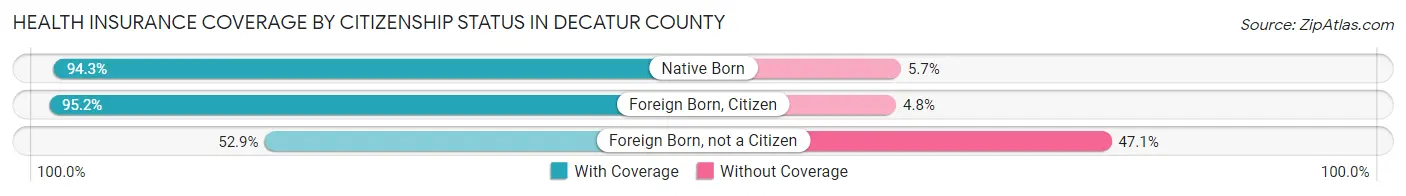
| Citizenship Status | With Coverage | Without Coverage |
| Native Born | 2,288 (94.3%) | 139 (5.7%) |
| Foreign Born, Citizen | 5,028 (95.2%) | 253 (4.8%) |
| Foreign Born, not a Citizen | 1,300 (52.9%) | 1,158 (47.1%) |
Health Insurance Coverage by Household Income in Decatur County

| Household Income | With Coverage | Without Coverage |
| Under $25,000 | 6,056 (88.0%) | 823 (12.0%) |
| $25,000 to $49,999 | 4,259 (75.8%) | 1,359 (24.2%) |
| $50,000 to $74,999 | 4,135 (85.0%) | 730 (15.0%) |
| $75,000 to $99,999 | 3,178 (89.3%) | 380 (10.7%) |
| $100,000 and over | 5,868 (84.8%) | 1,055 (15.2%) |
Public vs Private Health Insurance Coverage by Age in Decatur County
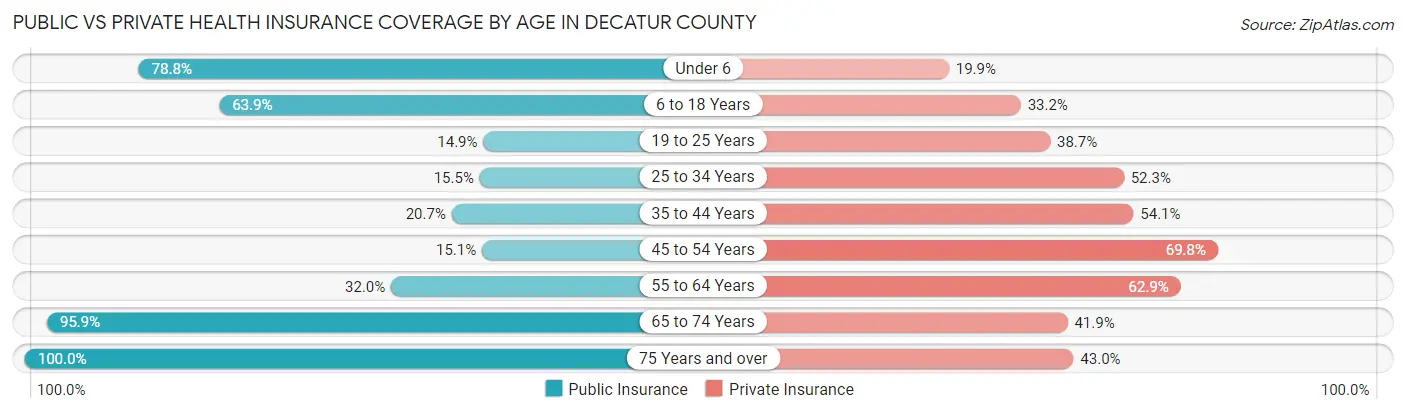
| Age Bracket | Public Insurance | Private Insurance |
| Under 6 | 1,913 (78.8%) | 482 (19.9%) |
| 6 to 18 Years | 3,373 (63.9%) | 1,754 (33.2%) |
| 19 to 25 Years | 365 (14.8%) | 950 (38.7%) |
| 25 to 34 Years | 367 (15.5%) | 1,237 (52.3%) |
| 35 to 44 Years | 807 (20.7%) | 2,108 (54.1%) |
| 45 to 54 Years | 458 (15.1%) | 2,118 (69.8%) |
| 55 to 64 Years | 1,213 (32.0%) | 2,386 (62.9%) |
| 65 to 74 Years | 2,655 (95.9%) | 1,160 (41.9%) |
| 75 Years and over | 1,904 (100.0%) | 819 (43.0%) |
| Total | 13,055 (46.8%) | 13,014 (46.6%) |
Disability Status by Sex by Age in Decatur County
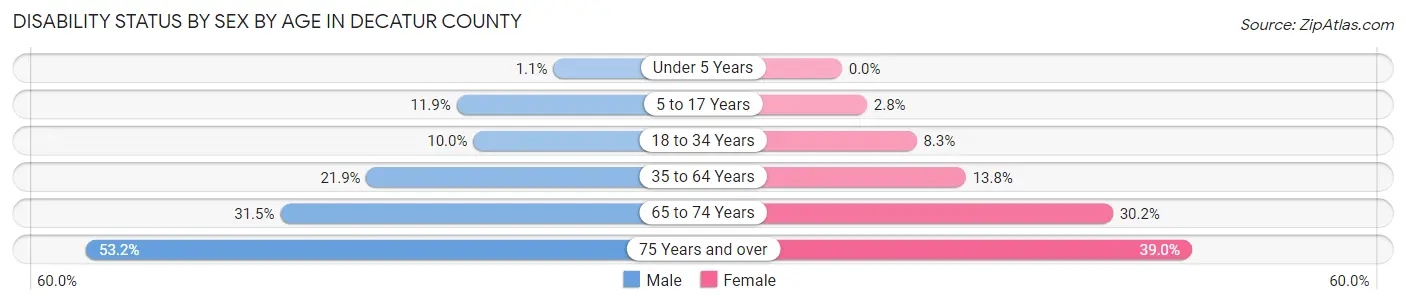
| Age Bracket | Male | Female |
| Under 5 Years | 11 (1.1%) | 0 (0.0%) |
| 5 to 17 Years | 316 (11.9%) | 69 (2.8%) |
| 18 to 34 Years | 238 (10.0%) | 257 (8.3%) |
| 35 to 64 Years | 1,117 (21.9%) | 777 (13.8%) |
| 65 to 74 Years | 388 (31.5%) | 464 (30.2%) |
| 75 Years and over | 388 (53.1%) | 458 (39.0%) |
Disability Class by Sex by Age in Decatur County
Disability Class: Hearing Difficulty
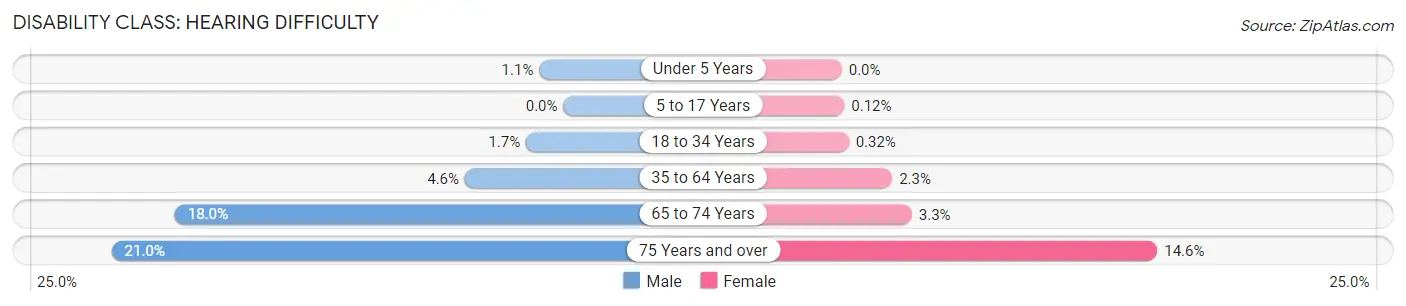
| Age Bracket | Male | Female |
| Under 5 Years | 11 (1.1%) | 0 (0.0%) |
| 5 to 17 Years | 0 (0.0%) | 3 (0.1%) |
| 18 to 34 Years | 41 (1.7%) | 10 (0.3%) |
| 35 to 64 Years | 233 (4.6%) | 132 (2.3%) |
| 65 to 74 Years | 222 (18.0%) | 50 (3.3%) |
| 75 Years and over | 153 (21.0%) | 172 (14.6%) |
Disability Class: Vision Difficulty
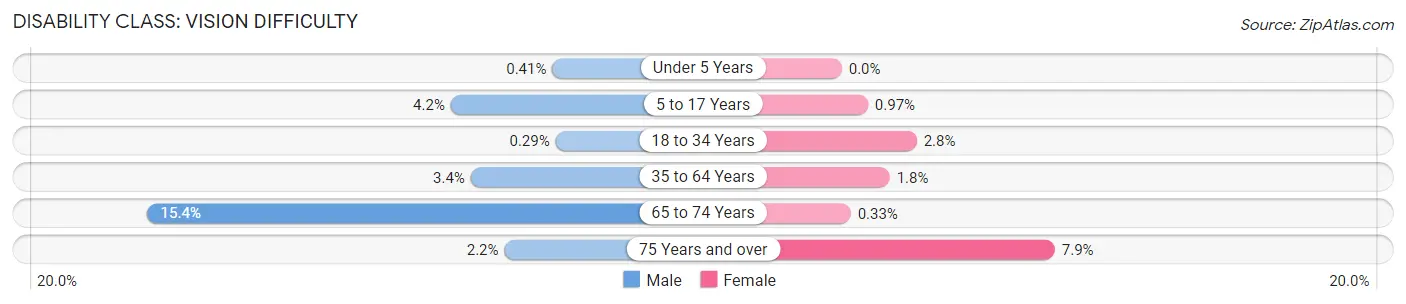
| Age Bracket | Male | Female |
| Under 5 Years | 4 (0.4%) | 0 (0.0%) |
| 5 to 17 Years | 111 (4.2%) | 24 (1.0%) |
| 18 to 34 Years | 7 (0.3%) | 86 (2.8%) |
| 35 to 64 Years | 175 (3.4%) | 100 (1.8%) |
| 65 to 74 Years | 190 (15.4%) | 5 (0.3%) |
| 75 Years and over | 16 (2.2%) | 93 (7.9%) |
Disability Class: Cognitive Difficulty
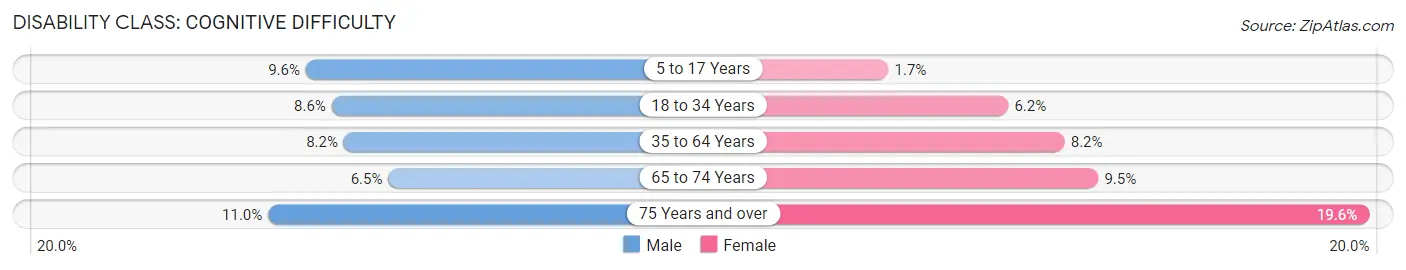
| Age Bracket | Male | Female |
| 5 to 17 Years | 254 (9.6%) | 42 (1.7%) |
| 18 to 34 Years | 204 (8.6%) | 190 (6.1%) |
| 35 to 64 Years | 415 (8.2%) | 464 (8.2%) |
| 65 to 74 Years | 80 (6.5%) | 146 (9.5%) |
| 75 Years and over | 80 (11.0%) | 230 (19.6%) |
Disability Class: Ambulatory Difficulty
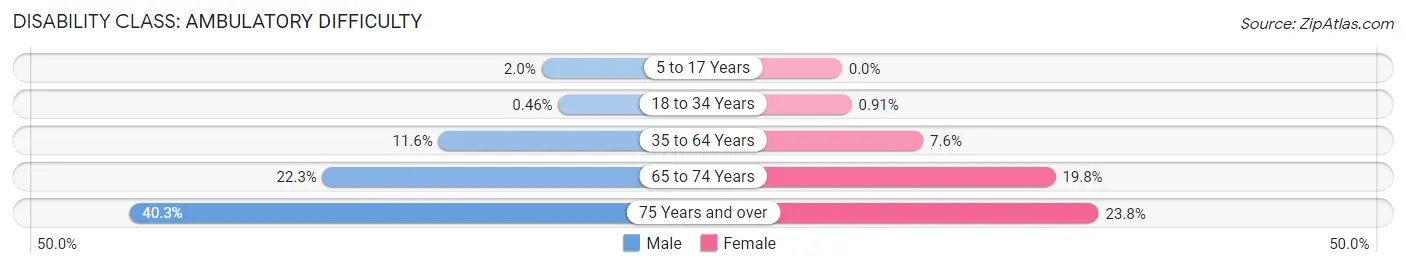
| Age Bracket | Male | Female |
| 5 to 17 Years | 54 (2.0%) | 0 (0.0%) |
| 18 to 34 Years | 11 (0.5%) | 28 (0.9%) |
| 35 to 64 Years | 590 (11.6%) | 425 (7.5%) |
| 65 to 74 Years | 275 (22.3%) | 305 (19.8%) |
| 75 Years and over | 294 (40.3%) | 280 (23.8%) |
Disability Class: Self-Care Difficulty
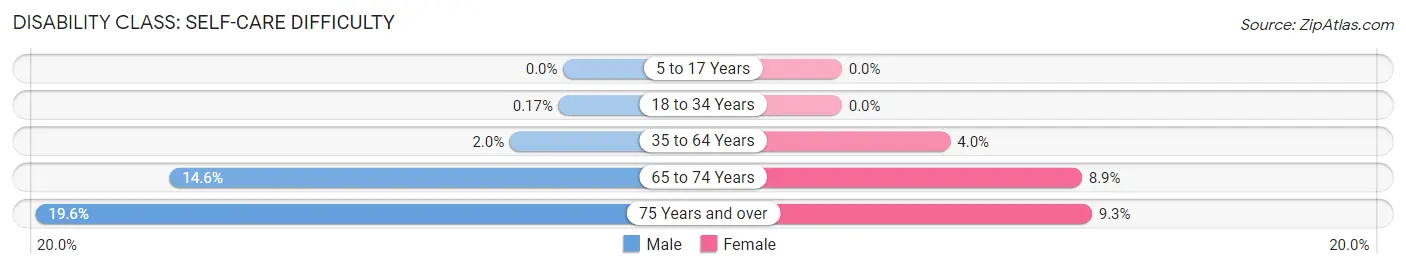
| Age Bracket | Male | Female |
| 5 to 17 Years | 0 (0.0%) | 0 (0.0%) |
| 18 to 34 Years | 4 (0.2%) | 0 (0.0%) |
| 35 to 64 Years | 101 (2.0%) | 227 (4.0%) |
| 65 to 74 Years | 180 (14.6%) | 137 (8.9%) |
| 75 Years and over | 143 (19.6%) | 109 (9.3%) |
Technology Access in Decatur County
Computing Device Access in Decatur County
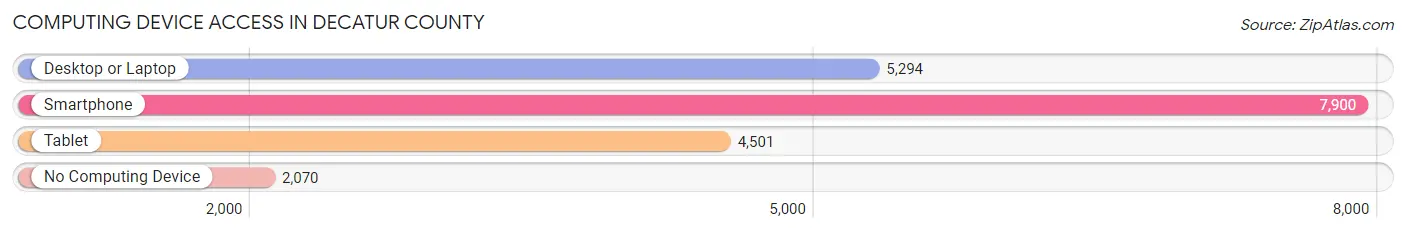
| Device Type | # Households | % Households |
| Desktop or Laptop | 5,294 | 51.4% |
| Smartphone | 7,900 | 76.7% |
| Tablet | 4,501 | 43.7% |
| No Computing Device | 2,070 | 20.1% |
| Total | 10,295 | 100.0% |
Internet Access in Decatur County
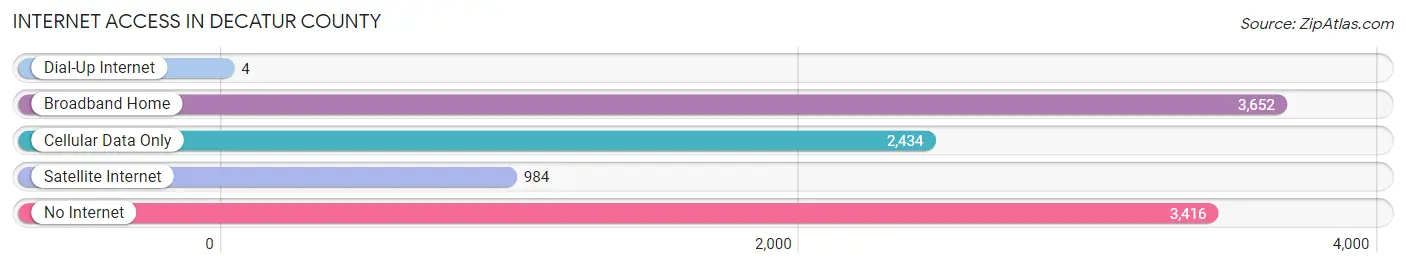
| Internet Type | # Households | % Households |
| Dial-Up Internet | 4 | 0.0% |
| Broadband Home | 3,652 | 35.5% |
| Cellular Data Only | 2,434 | 23.6% |
| Satellite Internet | 984 | 9.6% |
| No Internet | 3,416 | 33.2% |
| Total | 10,295 | 100.0% |
Decatur County Summary
Decatur County, Georgia is located in the southwestern corner of the state, bordered by Florida to the south and Alabama to the west. It is part of the Georgia-Florida-Alabama tri-state area. The county seat is Bainbridge, and the county is named for Stephen Decatur, a naval hero of the War of 1812.
History
Decatur County was created in 1823 from a portion of Early County. It was named for Stephen Decatur, a naval hero of the War of 1812. The county was originally part of the Creek Nation, and the area was home to many Native American tribes. The first European settlers arrived in the area in the early 1800s, and the county was officially established in 1823.
The county was largely agricultural in its early years, with cotton being the main crop. The county was also home to several sawmills and gristmills, which provided lumber and grain for the local population. The county was also home to several small towns, including Bainbridge, which was established in 1825 and became the county seat in 1826.
In the late 1800s, the county began to experience a period of growth and development. The county was home to several railroads, which connected the county to the rest of the state and the nation. The county also experienced a period of industrialization, with several factories being established in the area.
Geography
Decatur County is located in the southwestern corner of the state, bordered by Florida to the south and Alabama to the west. It is part of the Georgia-Florida-Alabama tri-state area. The county covers an area of 545 square miles, and is home to several rivers, including the Flint, Chattahoochee, and Ochlockonee. The county is mostly flat, with some rolling hills in the northern part of the county. The county is home to several state parks, including Seminole State Park and Ochlockonee River State Park.
Economy
Decatur County has a diverse economy, with agriculture, manufacturing, and tourism being the main industries. The county is home to several large farms, which produce cotton, peanuts, corn, and soybeans. The county is also home to several manufacturing plants, including a paper mill and a poultry processing plant. Tourism is also an important part of the county’s economy, with several state parks and historic sites drawing visitors from around the region.
Demographics
As of the 2010 census, Decatur County had a population of 27,842. The population is mostly white (77.3%), with African Americans (19.2%) and Hispanics (2.3%) making up the remainder of the population. The median household income is $37,845, and the median age is 38.7. The county has a poverty rate of 22.3%, and the unemployment rate is 6.2%.
Decatur County is a rural county with a diverse economy and a rich history. The county is home to several state parks and historic sites, and is a popular destination for tourists from around the region. The county is also home to several large farms and manufacturing plants, which provide jobs and economic stability to the area.
Common Questions
What is the Total Population of Decatur County?
Total Population of Decatur County is 29,063.
What is the Total Male Population of Decatur County?
Total Male Population of Decatur County is 14,097.
What is the Total Female Population of Decatur County?
Total Female Population of Decatur County is 14,966.
What is the Ratio of Males per 100 Females in Decatur County?
There are 94.19 Males per 100 Females in Decatur County.
What is the Ratio of Females per 100 Males in Decatur County?
There are 106.16 Females per 100 Males in Decatur County.
What is the Median Population Age in Decatur County?
Median Population Age in Decatur County is 38.3 Years.
What is the Average Family Size in Decatur County
Average Family Size in Decatur County is 3.3 People.
What is the Average Household Size in Decatur County
Average Household Size in Decatur County is 2.7 People.
What is Per Capita Income in Decatur County?
Per Capita income in Decatur County is $24,974.
What is the Median Family Income in Decatur County?
Median Family Income in Decatur County is $55,947.
What is the Median Household income in Decatur County?
Median Household Income in Decatur County is $47,383.
What is Income or Wage Gap in Decatur County?
Income or Wage Gap in Decatur County is 26.1%.
Women in Decatur County earn 73.9 cents for every dollar earned by a man.
What is Family Income Deficit in Decatur County?
Family Income Deficit in Decatur County is $14,687.
Families that are below poverty line in Decatur County earn $14,687 less on average than the poverty threshold level.
What is Inequality or Gini Index in Decatur County?
Inequality or Gini Index in Decatur County is 0.47.
How Large is the Labor Force in Decatur County?
There are 11,959 People in the Labor Forcein in Decatur County.
What is the Percentage of People in the Labor Force in Decatur County?
53.0% of People are in the Labor Force in Decatur County.
What is the Unemployment Rate in Decatur County?
Unemployment Rate in Decatur County is 6.4%.