Cook County, GA
Cook County Map
Cook County Overview
17,242
TOTAL POPULATION
8,337
MALE POPULATION
8,905
FEMALE POPULATION
93.62
MALES / 100 FEMALES
106.81
FEMALES / 100 MALES
37.3
MEDIAN AGE
3.4
AVG FAMILY SIZE
2.8
AVG HOUSEHOLD SIZE
$24,060
PER CAPITA INCOME
$54,115
AVG FAMILY INCOME
$46,706
AVG HOUSEHOLD INCOME
32.4%
WAGE / INCOME GAP [ % ]
67.6¢/ $1
WAGE / INCOME GAP [ $ ]
$10,926
FAMILY INCOME DEFICIT
0.49
INEQUALITY / GINI INDEX
8,182
LABOR FORCE [ PEOPLE ]
61.1%
PERCENT IN LABOR FORCE
5.5%
UNEMPLOYMENT RATE
Cook County Area Codes
Race in Cook County
The most populous races in Cook County are White / Caucasian (11,068 | 64.2%), Black / African American (4,655 | 27.0%), and Two or more Races (1,224 | 7.1%).

| Race | # Population | % Population |
| Asian | 42 | 0.2% |
| Black / African American | 4,655 | 27.0% |
| Hawaiian / Pacific | 0 | 0.0% |
| Hispanic or Latino | 1,138 | 6.6% |
| Native / Alaskan | 102 | 0.6% |
| White / Caucasian | 11,068 | 64.2% |
| Two or more Races | 1,224 | 7.1% |
| Some other Race | 151 | 0.9% |
| Total | 17,242 | 100.0% |
Ancestry in Cook County
The most populous ancestries reported in Cook County are American (1,964 | 11.4%), Irish (1,180 | 6.8%), English (965 | 5.6%), Mexican (816 | 4.7%), and German (810 | 4.7%), together accounting for 33.3% of all Cook County residents.

| Ancestry | # Population | % Population |
| African | 227 | 1.3% |
| American | 1,964 | 11.4% |
| Bhutanese | 41 | 0.2% |
| Blackfeet | 1 | 0.0% |
| British | 6 | 0.0% |
| Central American | 184 | 1.1% |
| Cuban | 92 | 0.5% |
| Czechoslovakian | 10 | 0.1% |
| Dutch | 61 | 0.4% |
| Eastern European | 4 | 0.0% |
| English | 965 | 5.6% |
| European | 74 | 0.4% |
| French | 157 | 0.9% |
| German | 810 | 4.7% |
| Greek | 11 | 0.1% |
| Guatemalan | 184 | 1.1% |
| Guyanese | 5 | 0.0% |
| Haitian | 213 | 1.2% |
| Hungarian | 13 | 0.1% |
| Irish | 1,180 | 6.8% |
| Italian | 172 | 1.0% |
| Jamaican | 91 | 0.5% |
| Korean | 283 | 1.6% |
| Mexican | 816 | 4.7% |
| Native Hawaiian | 55 | 0.3% |
| Norwegian | 60 | 0.4% |
| Polish | 52 | 0.3% |
| Puerto Rican | 46 | 0.3% |
| Scandinavian | 63 | 0.4% |
| Scotch-Irish | 153 | 0.9% |
| Scottish | 561 | 3.3% |
| Sri Lankan | 24 | 0.1% |
| Subsaharan African | 227 | 1.3% |
| Swedish | 14 | 0.1% |
| Trinidadian and Tobagonian | 39 | 0.2% |
| Welsh | 19 | 0.1% | View All 36 Rows |
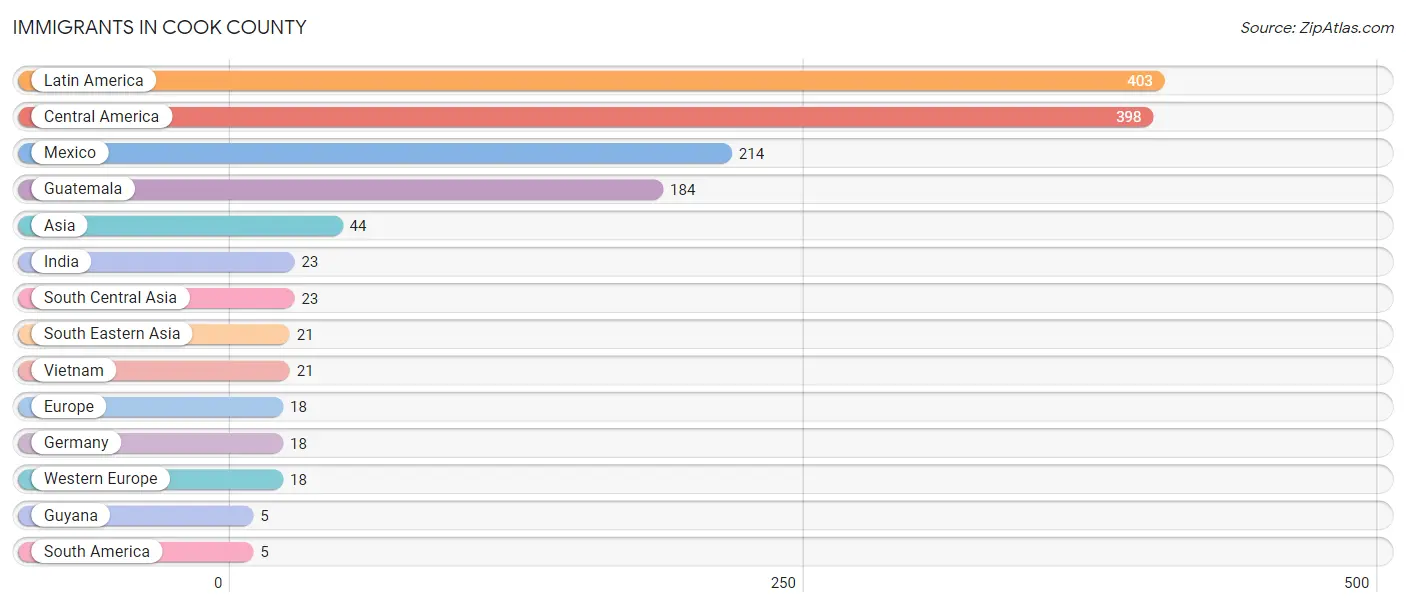
Immigrants in Cook County
The most numerous immigrant groups reported in Cook County came from Latin America (403 | 2.3%), Central America (398 | 2.3%), Mexico (214 | 1.2%), Guatemala (184 | 1.1%), and Asia (44 | 0.3%), together accounting for 7.2% of all Cook County residents.
| Immigration Origin | # Population | % Population |
| Asia | 44 | 0.3% |
| Central America | 398 | 2.3% |
| Europe | 18 | 0.1% |
| Germany | 18 | 0.1% |
| Guatemala | 184 | 1.1% |
| Guyana | 5 | 0.0% |
| India | 23 | 0.1% |
| Latin America | 403 | 2.3% |
| Mexico | 214 | 1.2% |
| South America | 5 | 0.0% |
| South Central Asia | 23 | 0.1% |
| South Eastern Asia | 21 | 0.1% |
| Vietnam | 21 | 0.1% |
| Western Europe | 18 | 0.1% | View All 14 Rows |
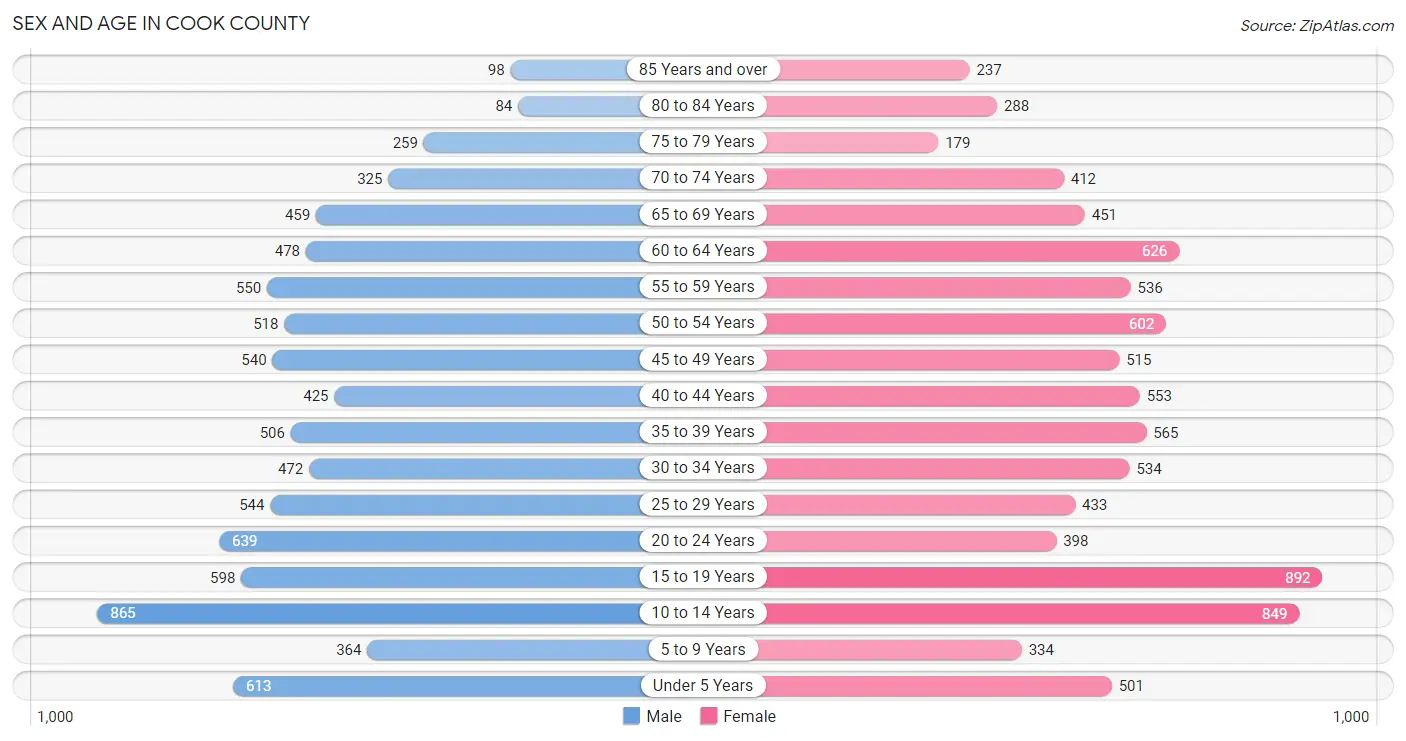
Sex and Age in Cook County
Sex and Age in Cook County
The most populous age groups in Cook County are 10 to 14 Years (865 | 10.4%) for men and 15 to 19 Years (892 | 10.0%) for women.
| Age Bracket | Male | Female |
| Under 5 Years | 613 (7.3%) | 501 (5.6%) |
| 5 to 9 Years | 364 (4.4%) | 334 (3.7%) |
| 10 to 14 Years | 865 (10.4%) | 849 (9.5%) |
| 15 to 19 Years | 598 (7.2%) | 892 (10.0%) |
| 20 to 24 Years | 639 (7.7%) | 398 (4.5%) |
| 25 to 29 Years | 544 (6.5%) | 433 (4.9%) |
| 30 to 34 Years | 472 (5.7%) | 534 (6.0%) |
| 35 to 39 Years | 506 (6.1%) | 565 (6.3%) |
| 40 to 44 Years | 425 (5.1%) | 553 (6.2%) |
| 45 to 49 Years | 540 (6.5%) | 515 (5.8%) |
| 50 to 54 Years | 518 (6.2%) | 602 (6.8%) |
| 55 to 59 Years | 550 (6.6%) | 536 (6.0%) |
| 60 to 64 Years | 478 (5.7%) | 626 (7.0%) |
| 65 to 69 Years | 459 (5.5%) | 451 (5.1%) |
| 70 to 74 Years | 325 (3.9%) | 412 (4.6%) |
| 75 to 79 Years | 259 (3.1%) | 179 (2.0%) |
| 80 to 84 Years | 84 (1.0%) | 288 (3.2%) |
| 85 Years and over | 98 (1.2%) | 237 (2.7%) |
| Total | 8,337 (100.0%) | 8,905 (100.0%) |
Families and Households in Cook County
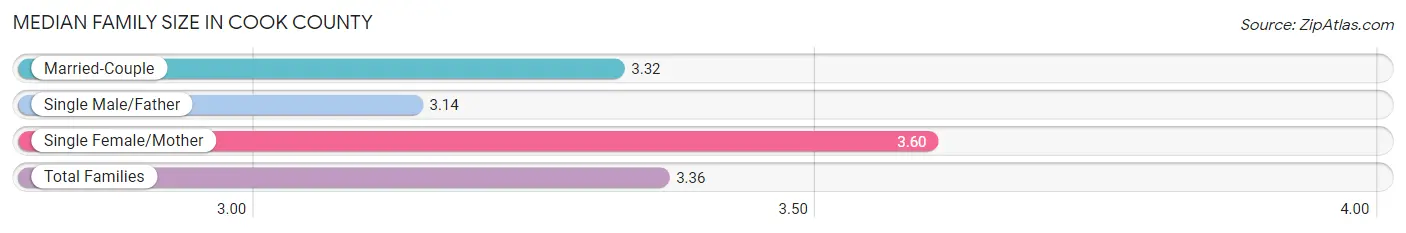
Median Family Size in Cook County
The median family size in Cook County is 3.36 persons per family, with single female/mother families (919 | 21.7%) accounting for the largest median family size of 3.6 persons per family. On the other hand, single male/father families (476 | 11.2%) represent the smallest median family size with 3.14 persons per family.
| Family Type | # Families | Family Size |
| Married-Couple | 2,842 (67.1%) | 3.32 |
| Single Male/Father | 476 (11.2%) | 3.14 |
| Single Female/Mother | 919 (21.7%) | 3.60 |
| Total Families | 4,237 (100.0%) | 3.36 |
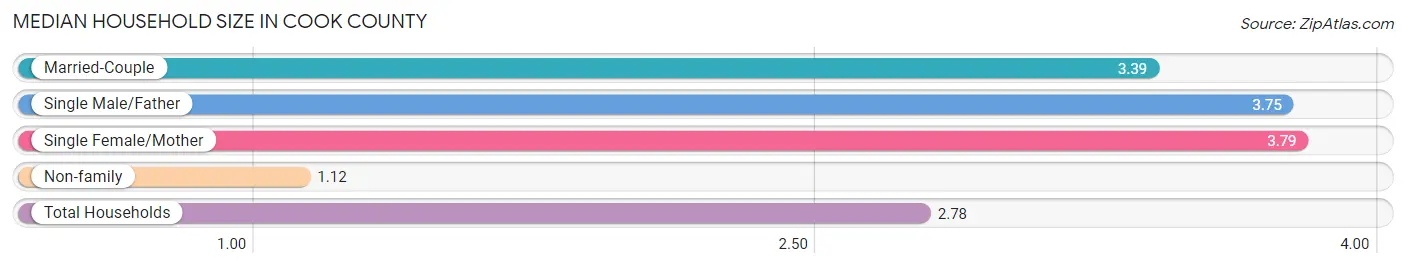
Median Household Size in Cook County
The median household size in Cook County is 2.78 persons per household, with single female/mother households (919 | 15.0%) accounting for the largest median household size of 3.79 persons per household. non-family households (1,879 | 30.7%) represent the smallest median household size with 1.12 persons per household.
| Household Type | # Households | Household Size |
| Married-Couple | 2,842 (46.5%) | 3.39 |
| Single Male/Father | 476 (7.8%) | 3.75 |
| Single Female/Mother | 919 (15.0%) | 3.79 |
| Non-family | 1,879 (30.7%) | 1.12 |
| Total Households | 6,116 (100.0%) | 2.78 |
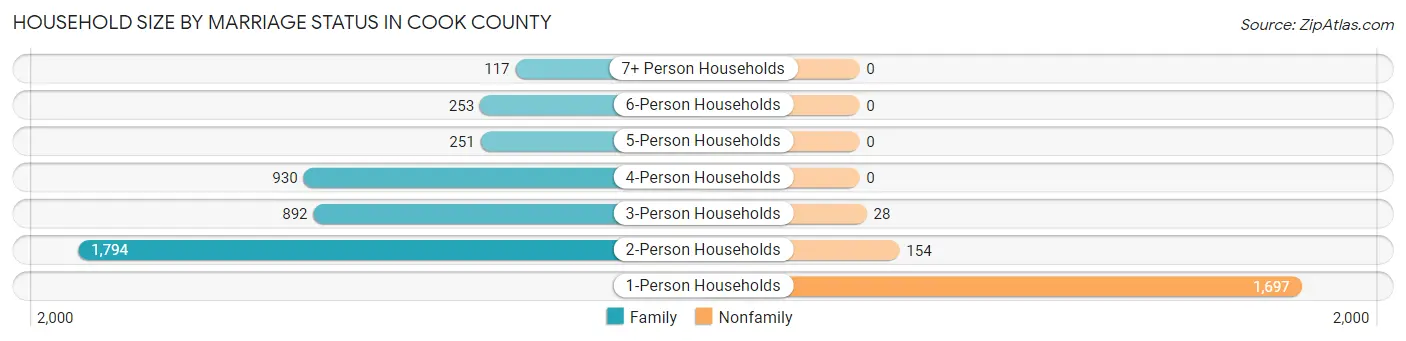
Household Size by Marriage Status in Cook County
Out of a total of 6,116 households in Cook County, 4,237 (69.3%) are family households, while 1,879 (30.7%) are nonfamily households. The most numerous type of family households are 2-person households, comprising 1,794, and the most common type of nonfamily households are 1-person households, comprising 1,697.
| Household Size | Family Households | Nonfamily Households |
| 1-Person Households | - | 1,697 (27.8%) |
| 2-Person Households | 1,794 (29.3%) | 154 (2.5%) |
| 3-Person Households | 892 (14.6%) | 28 (0.5%) |
| 4-Person Households | 930 (15.2%) | 0 (0.0%) |
| 5-Person Households | 251 (4.1%) | 0 (0.0%) |
| 6-Person Households | 253 (4.1%) | 0 (0.0%) |
| 7+ Person Households | 117 (1.9%) | 0 (0.0%) |
| Total | 4,237 (69.3%) | 1,879 (30.7%) |
Female Fertility in Cook County
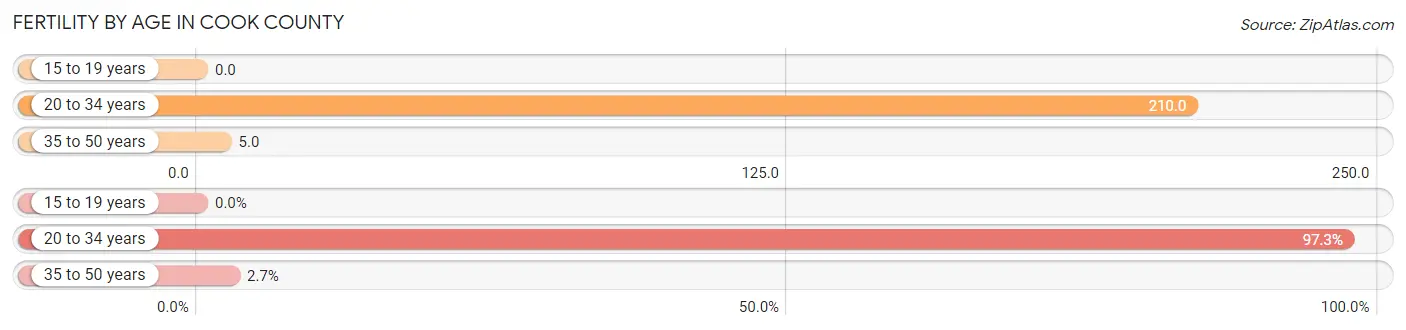
Fertility by Age in Cook County
Average fertility rate in Cook County is 75.0 births per 1,000 women. Women in the age bracket of 20 to 34 years have the highest fertility rate with 210.0 births per 1,000 women. Women in the age bracket of 20 to 34 years acount for 97.3% of all women with births.
| Age Bracket | Women with Births | Births / 1,000 Women |
| 15 to 19 years | 0 (0.0%) | 0.0 |
| 20 to 34 years | 286 (97.3%) | 210.0 |
| 35 to 50 years | 8 (2.7%) | 5.0 |
| Total | 294 (100.0%) | 75.0 |
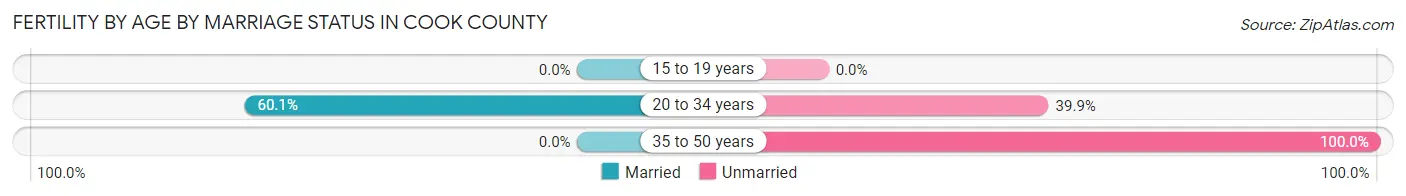
Fertility by Age by Marriage Status in Cook County
58.5% of women with births (294) in Cook County are married. The highest percentage of unmarried women with births falls into 35 to 50 years age bracket with 100.0% of them unmarried at the time of birth, while the lowest percentage of unmarried women with births belong to 20 to 34 years age bracket with 39.9% of them unmarried.
| Age Bracket | Married | Unmarried |
| 15 to 19 years | 0 (0.0%) | 0 (0.0%) |
| 20 to 34 years | 172 (60.1%) | 114 (39.9%) |
| 35 to 50 years | 0 (0.0%) | 8 (100.0%) |
| Total | 172 (58.5%) | 122 (41.5%) |
Fertility by Education in Cook County

| Educational Attainment | Women with Births | Births / 1,000 Women |
| Less than High School | 0 (0.0%) | 0.0 |
| High School Diploma | 78 (26.5%) | 75.0 |
| College or Associate's Degree | 103 (35.0%) | 82.0 |
| Bachelor's Degree | 113 (38.4%) | 274.0 |
| Graduate Degree | 0 (0.0%) | 0.0 |
| Total | 294 (100.0%) | 75.0 |
Fertility by Education by Marriage Status in Cook County
41.5% of women with births in Cook County are unmarried. Women with the educational attainment of bachelor's degree are most likely to be married with 100.0% of them married at childbirth, while women with the educational attainment of high school diploma are least likely to be married with 76.9% of them unmarried at childbirth.
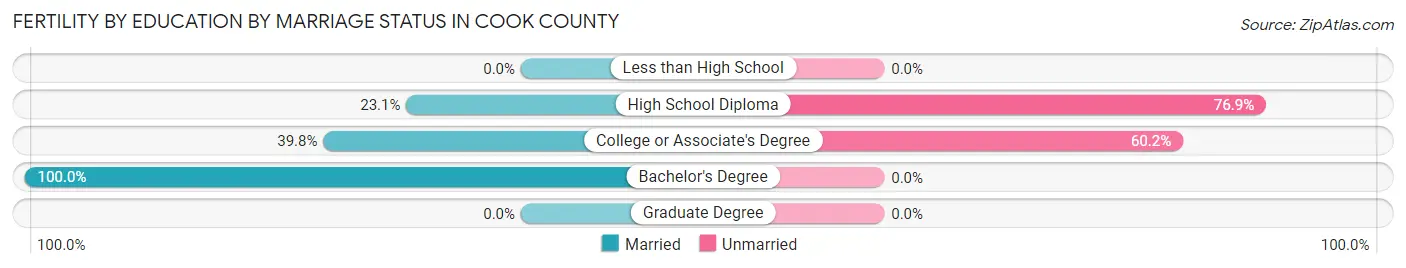
| Educational Attainment | Married | Unmarried |
| Less than High School | 0 (0.0%) | 0 (0.0%) |
| High School Diploma | 18 (23.1%) | 60 (76.9%) |
| College or Associate's Degree | 41 (39.8%) | 62 (60.2%) |
| Bachelor's Degree | 113 (100.0%) | 0 (0.0%) |
| Graduate Degree | 0 (0.0%) | 0 (0.0%) |
| Total | 172 (58.5%) | 122 (41.5%) |
Income in Cook County
Income Overview in Cook County
Per Capita Income in Cook County is $24,060, while median incomes of families and households are $54,115 and $46,706 respectively.
| Characteristic | Number | Measure |
| Per Capita Income | 17,242 | $24,060 |
| Median Family Income | 4,237 | $54,115 |
| Mean Family Income | 4,237 | $75,123 |
| Median Household Income | 6,116 | $46,706 |
| Mean Household Income | 6,116 | $65,744 |
| Income Deficit | 4,237 | $10,926 |
| Wage / Income Gap (%) | 17,242 | 32.42% |
| Wage / Income Gap ($) | 17,242 | 67.58¢ per $1 |
| Gini / Inequality Index | 17,242 | 0.49 |
Earnings by Sex in Cook County
Average Earnings in Cook County are $32,695, $40,504 for men and $27,372 for women, a difference of 32.4%.
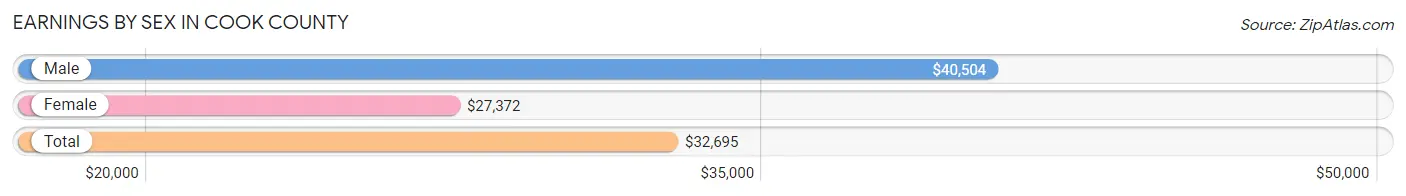
| Sex | Number | Average Earnings |
| Male | 4,303 (52.9%) | $40,504 |
| Female | 3,827 (47.1%) | $27,372 |
| Total | 8,130 (100.0%) | $32,695 |
Earnings by Sex by Income Bracket in Cook County
The most common earnings brackets in Cook County are $100,000+ for men (417 | 9.7%) and $30,000 to $34,999 for women (379 | 9.9%).
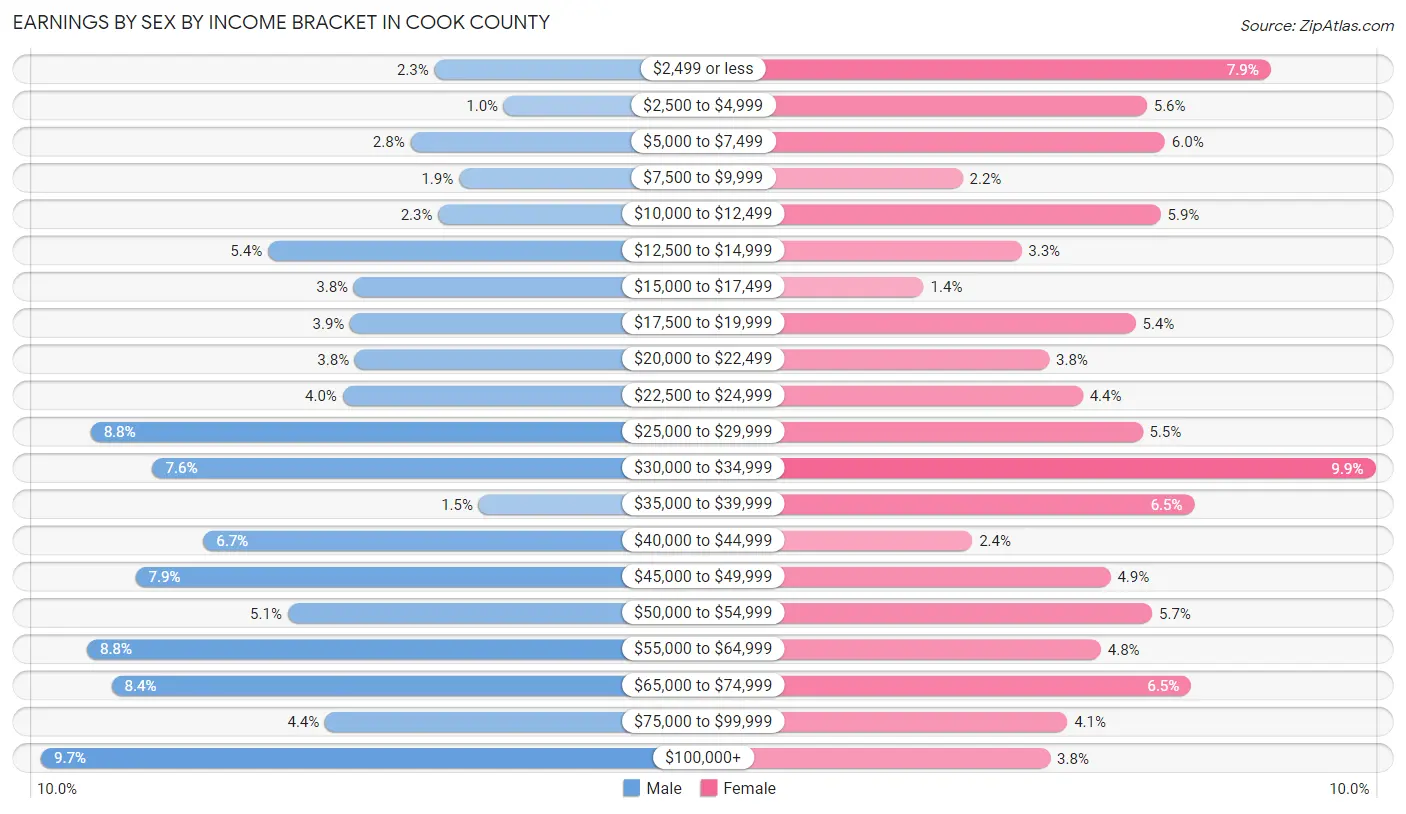
| Income | Male | Female |
| $2,499 or less | 100 (2.3%) | 304 (7.9%) |
| $2,500 to $4,999 | 44 (1.0%) | 215 (5.6%) |
| $5,000 to $7,499 | 119 (2.8%) | 228 (6.0%) |
| $7,500 to $9,999 | 80 (1.9%) | 83 (2.2%) |
| $10,000 to $12,499 | 97 (2.2%) | 225 (5.9%) |
| $12,500 to $14,999 | 234 (5.4%) | 125 (3.3%) |
| $15,000 to $17,499 | 165 (3.8%) | 55 (1.4%) |
| $17,500 to $19,999 | 168 (3.9%) | 207 (5.4%) |
| $20,000 to $22,499 | 164 (3.8%) | 145 (3.8%) |
| $22,500 to $24,999 | 174 (4.0%) | 169 (4.4%) |
| $25,000 to $29,999 | 377 (8.8%) | 212 (5.5%) |
| $30,000 to $34,999 | 327 (7.6%) | 379 (9.9%) |
| $35,000 to $39,999 | 64 (1.5%) | 249 (6.5%) |
| $40,000 to $44,999 | 286 (6.7%) | 90 (2.4%) |
| $45,000 to $49,999 | 341 (7.9%) | 189 (4.9%) |
| $50,000 to $54,999 | 218 (5.1%) | 219 (5.7%) |
| $55,000 to $64,999 | 380 (8.8%) | 182 (4.8%) |
| $65,000 to $74,999 | 360 (8.4%) | 247 (6.5%) |
| $75,000 to $99,999 | 188 (4.4%) | 158 (4.1%) |
| $100,000+ | 417 (9.7%) | 146 (3.8%) |
| Total | 4,303 (100.0%) | 3,827 (100.0%) |
Earnings by Sex by Educational Attainment in Cook County
Average earnings in Cook County are $46,042 for men and $34,069 for women, a difference of 26.0%. Men with an educational attainment of bachelor's degree enjoy the highest average annual earnings of $73,356, while those with high school diploma education earn the least with $40,584. Women with an educational attainment of graduate degree earn the most with the average annual earnings of $52,750, while those with high school diploma education have the smallest earnings of $23,306.
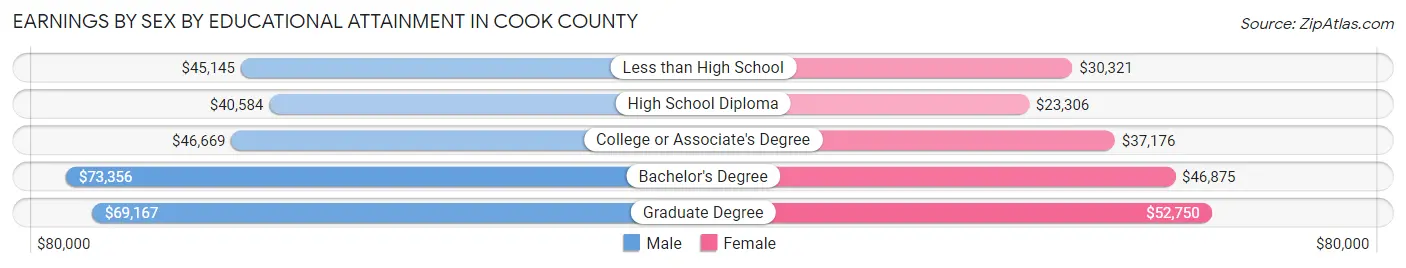
| Educational Attainment | Male Income | Female Income |
| Less than High School | $45,145 | $30,321 |
| High School Diploma | $40,584 | $23,306 |
| College or Associate's Degree | $46,669 | $37,176 |
| Bachelor's Degree | $73,356 | $46,875 |
| Graduate Degree | $69,167 | $52,750 |
| Total | $46,042 | $34,069 |
Family Income in Cook County
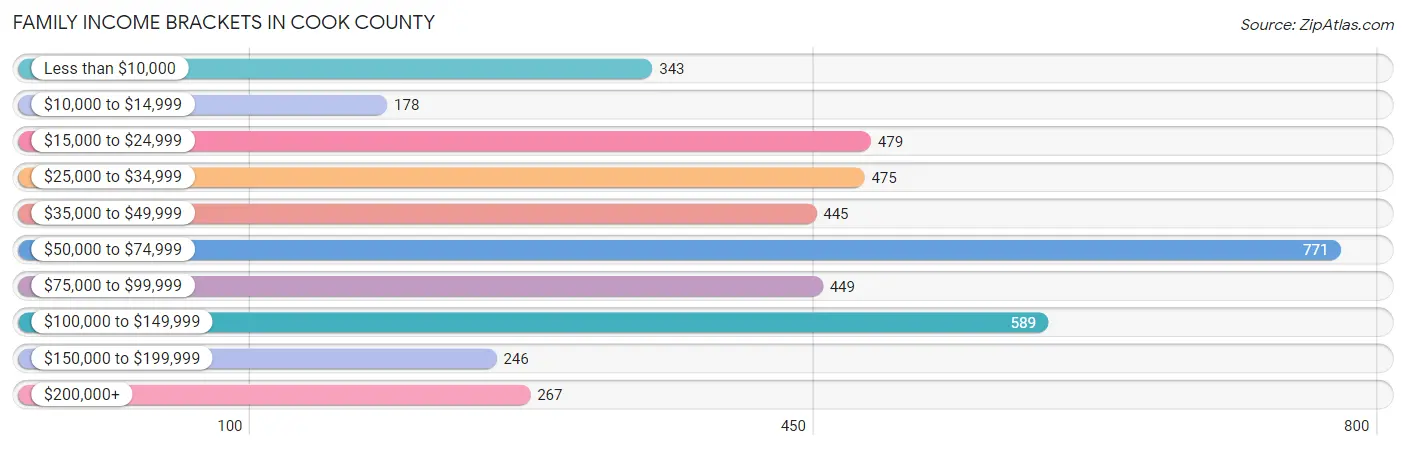
Family Income Brackets in Cook County
According to the Cook County family income data, there are 771 families falling into the $50,000 to $74,999 income range, which is the most common income bracket and makes up 18.2% of all families. Conversely, the $10,000 to $14,999 income bracket is the least frequent group with only 178 families (4.2%) belonging to this category.
| Income Bracket | # Families | % Families |
| Less than $10,000 | 343 | 8.1% |
| $10,000 to $14,999 | 178 | 4.2% |
| $15,000 to $24,999 | 479 | 11.3% |
| $25,000 to $34,999 | 475 | 11.2% |
| $35,000 to $49,999 | 445 | 10.5% |
| $50,000 to $74,999 | 771 | 18.2% |
| $75,000 to $99,999 | 449 | 10.6% |
| $100,000 to $149,999 | 589 | 13.9% |
| $150,000 to $199,999 | 246 | 5.8% |
| $200,000+ | 267 | 6.3% |
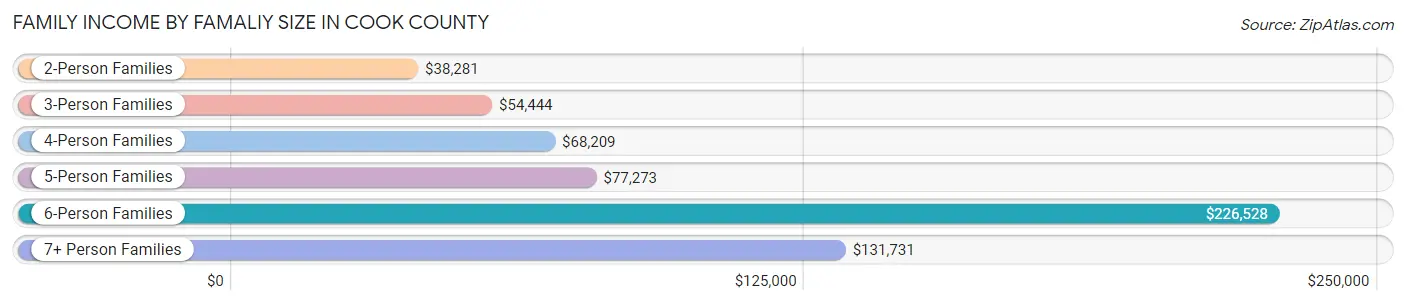
Family Income by Famaliy Size in Cook County
6-person families (233 | 5.5%) account for the highest median family income in Cook County with $226,528 per family, while 6-person families (233 | 5.5%) have the highest median income of $37,755 per family member.
| Income Bracket | # Families | Median Income |
| 2-Person Families | 1,890 (44.6%) | $38,281 |
| 3-Person Families | 1,078 (25.4%) | $54,444 |
| 4-Person Families | 748 (17.6%) | $68,209 |
| 5-Person Families | 208 (4.9%) | $77,273 |
| 6-Person Families | 233 (5.5%) | $226,528 |
| 7+ Person Families | 80 (1.9%) | $131,731 |
| Total | 4,237 (100.0%) | $54,115 |
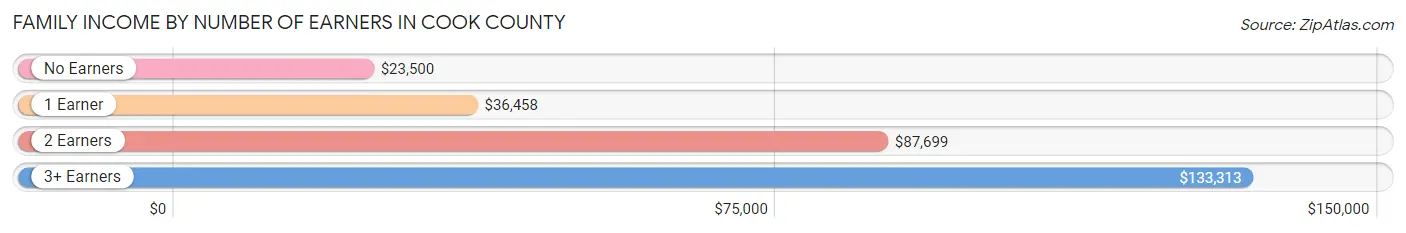
Family Income by Number of Earners in Cook County
The median family income in Cook County is $54,115, with families comprising 3+ earners (575) having the highest median family income of $133,313, while families with no earners (862) have the lowest median family income of $23,500, accounting for 13.6% and 20.3% of families, respectively.
| Number of Earners | # Families | Median Income |
| No Earners | 862 (20.3%) | $23,500 |
| 1 Earner | 1,371 (32.4%) | $36,458 |
| 2 Earners | 1,429 (33.7%) | $87,699 |
| 3+ Earners | 575 (13.6%) | $133,313 |
| Total | 4,237 (100.0%) | $54,115 |
Household Income in Cook County
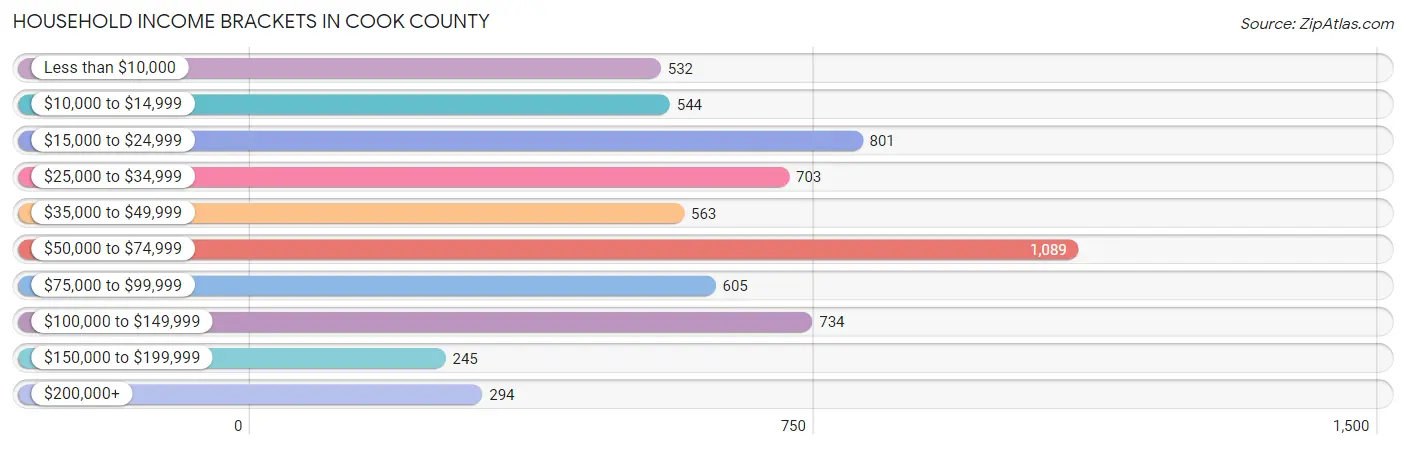
Household Income Brackets in Cook County
With 1,089 households falling in the category, the $50,000 to $74,999 income range is the most frequent in Cook County, accounting for 17.8% of all households. In contrast, only 245 households (4.0%) fall into the $150,000 to $199,999 income bracket, making it the least populous group.
| Income Bracket | # Households | % Households |
| Less than $10,000 | 532 | 8.7% |
| $10,000 to $14,999 | 544 | 8.9% |
| $15,000 to $24,999 | 801 | 13.1% |
| $25,000 to $34,999 | 703 | 11.5% |
| $35,000 to $49,999 | 563 | 9.2% |
| $50,000 to $74,999 | 1,089 | 17.8% |
| $75,000 to $99,999 | 605 | 9.9% |
| $100,000 to $149,999 | 734 | 12.0% |
| $150,000 to $199,999 | 245 | 4.0% |
| $200,000+ | 294 | 4.8% |
Household Income by Householder Age in Cook County
The median household income in Cook County is $46,706, with the highest median household income of $65,192 found in the 25 to 44 years age bracket for the primary householder. A total of 1,982 households (32.4%) fall into this category. Meanwhile, the 65+ years age bracket for the primary householder has the lowest median household income of $26,213, with 1,855 households (30.3%) in this group.

| Income Bracket | # Households | Median Income |
| 15 to 24 Years | 134 (2.2%) | $26,316 |
| 25 to 44 Years | 1,982 (32.4%) | $65,192 |
| 45 to 64 Years | 2,145 (35.1%) | $55,328 |
| 65+ Years | 1,855 (30.3%) | $26,213 |
| Total | 6,116 (100.0%) | $46,706 |
Poverty in Cook County
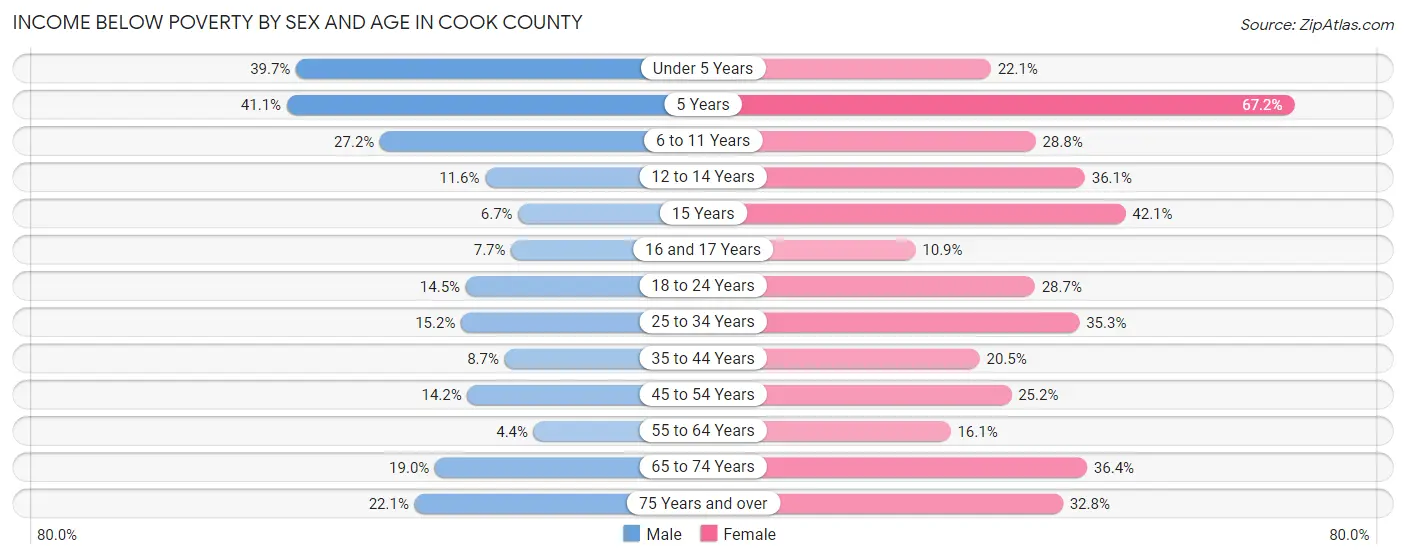
Income Below Poverty by Sex and Age in Cook County
With 15.8% poverty level for males and 27.4% for females among the residents of Cook County, 5 year old males and 5 year old females are the most vulnerable to poverty, with 39 males (41.0%) and 43 females (67.2%) in their respective age groups living below the poverty level.
| Age Bracket | Male | Female |
| Under 5 Years | 240 (39.7%) | 109 (22.1%) |
| 5 Years | 39 (41.0%) | 43 (67.2%) |
| 6 to 11 Years | 133 (27.2%) | 199 (28.8%) |
| 12 to 14 Years | 65 (11.6%) | 140 (36.1%) |
| 15 Years | 9 (6.7%) | 80 (42.1%) |
| 16 and 17 Years | 20 (7.7%) | 26 (10.9%) |
| 18 to 24 Years | 121 (14.5%) | 247 (28.6%) |
| 25 to 34 Years | 154 (15.2%) | 341 (35.3%) |
| 35 to 44 Years | 81 (8.7%) | 227 (20.4%) |
| 45 to 54 Years | 150 (14.2%) | 281 (25.2%) |
| 55 to 64 Years | 45 (4.4%) | 184 (16.1%) |
| 65 to 74 Years | 147 (19.0%) | 309 (36.4%) |
| 75 Years and over | 94 (22.1%) | 210 (32.8%) |
| Total | 1,298 (15.8%) | 2,396 (27.4%) |
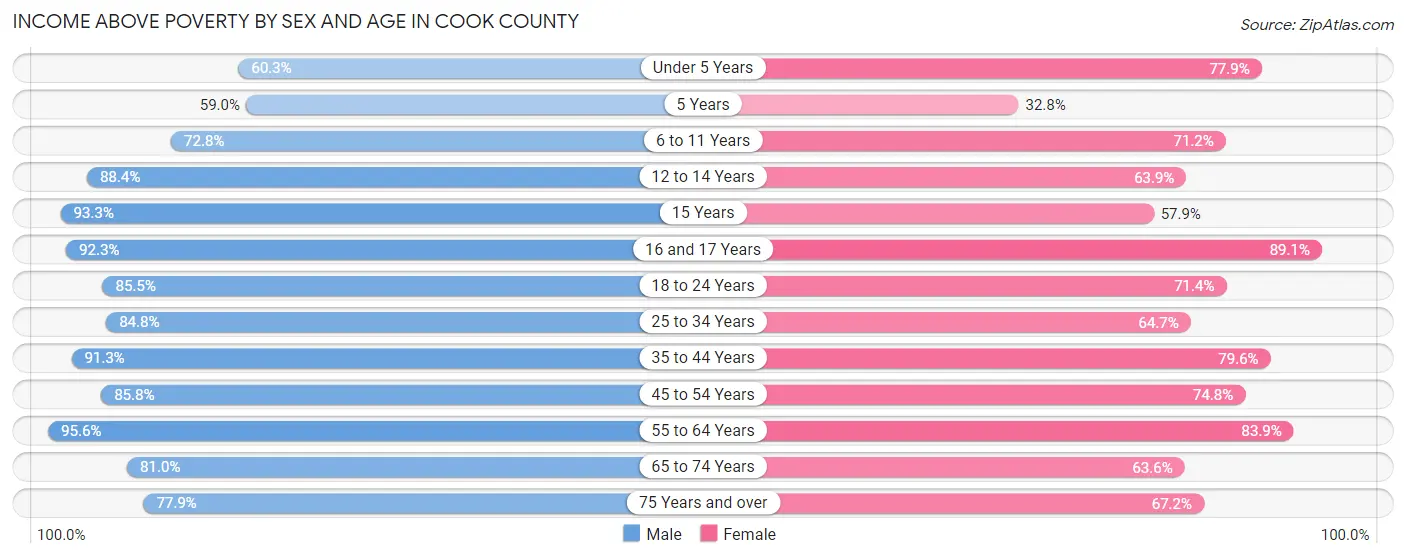
Income Above Poverty by Sex and Age in Cook County
According to the poverty statistics in Cook County, males aged 55 to 64 years and females aged 16 and 17 years are the age groups that are most secure financially, with 95.6% of males and 89.1% of females in these age groups living above the poverty line.
| Age Bracket | Male | Female |
| Under 5 Years | 365 (60.3%) | 384 (77.9%) |
| 5 Years | 56 (59.0%) | 21 (32.8%) |
| 6 to 11 Years | 356 (72.8%) | 493 (71.2%) |
| 12 to 14 Years | 496 (88.4%) | 248 (63.9%) |
| 15 Years | 126 (93.3%) | 110 (57.9%) |
| 16 and 17 Years | 239 (92.3%) | 212 (89.1%) |
| 18 to 24 Years | 715 (85.5%) | 615 (71.4%) |
| 25 to 34 Years | 862 (84.8%) | 626 (64.7%) |
| 35 to 44 Years | 850 (91.3%) | 883 (79.5%) |
| 45 to 54 Years | 904 (85.8%) | 836 (74.8%) |
| 55 to 64 Years | 983 (95.6%) | 956 (83.9%) |
| 65 to 74 Years | 625 (81.0%) | 540 (63.6%) |
| 75 Years and over | 332 (77.9%) | 430 (67.2%) |
| Total | 6,909 (84.2%) | 6,354 (72.6%) |
Income Below Poverty Among Married-Couple Families in Cook County
The poverty statistics for married-couple families in Cook County show that 12.4% or 352 of the total 2,842 families live below the poverty line. Families with 3 or 4 children have the highest poverty rate of 16.0%, comprising of 31 families. On the other hand, families with 5 or more children have the lowest poverty rate of 0.0%, which includes 0 families.

| Children | Above Poverty | Below Poverty |
| No Children | 1,344 (87.4%) | 194 (12.6%) |
| 1 or 2 Children | 957 (88.3%) | 127 (11.7%) |
| 3 or 4 Children | 163 (84.0%) | 31 (16.0%) |
| 5 or more Children | 26 (100.0%) | 0 (0.0%) |
| Total | 2,490 (87.6%) | 352 (12.4%) |
Income Below Poverty Among Single-Parent Households in Cook County
According to the poverty data in Cook County, 18.9% or 90 single-father households and 41.1% or 378 single-mother households are living below the poverty line. Among single-father households, those with 1 or 2 children have the highest poverty rate, with 84 households (50.6%) experiencing poverty. Likewise, among single-mother households, those with 5 or more children have the highest poverty rate, with 22 households (100.0%) falling below the poverty line.

| Children | Single Father | Single Mother |
| No Children | 6 (2.1%) | 122 (32.6%) |
| 1 or 2 Children | 84 (50.6%) | 194 (44.5%) |
| 3 or 4 Children | 0 (0.0%) | 40 (46.0%) |
| 5 or more Children | 0 (0.0%) | 22 (100.0%) |
| Total | 90 (18.9%) | 378 (41.1%) |
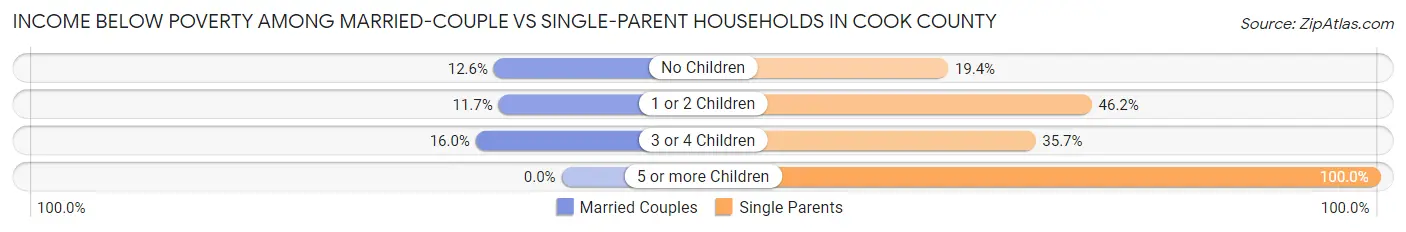
Income Below Poverty Among Married-Couple vs Single-Parent Households in Cook County
The poverty data for Cook County shows that 352 of the married-couple family households (12.4%) and 468 of the single-parent households (33.6%) are living below the poverty level. Within the married-couple family households, those with 3 or 4 children have the highest poverty rate, with 31 households (16.0%) falling below the poverty line. Among the single-parent households, those with 5 or more children have the highest poverty rate, with 22 household (100.0%) living below poverty.
| Children | Married-Couple Families | Single-Parent Households |
| No Children | 194 (12.6%) | 128 (19.4%) |
| 1 or 2 Children | 127 (11.7%) | 278 (46.2%) |
| 3 or 4 Children | 31 (16.0%) | 40 (35.7%) |
| 5 or more Children | 0 (0.0%) | 22 (100.0%) |
| Total | 352 (12.4%) | 468 (33.6%) |
Employment Characteristics in Cook County
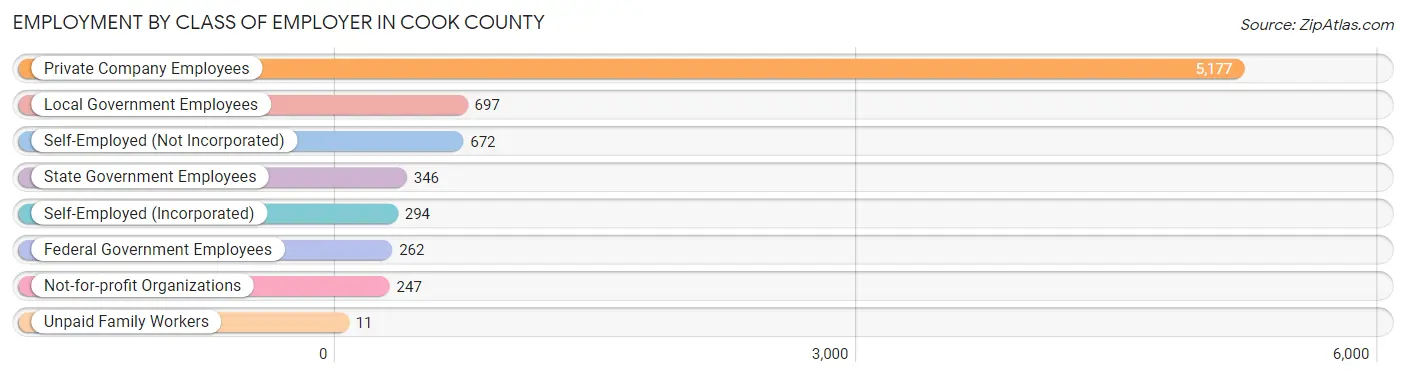
Employment by Class of Employer in Cook County
Among the 7,706 employed individuals in Cook County, private company employees (5,177 | 67.2%), local government employees (697 | 9.0%), and self-employed (not incorporated) (672 | 8.7%) make up the most common classes of employment.
| Employer Class | # Employees | % Employees |
| Private Company Employees | 5,177 | 67.2% |
| Self-Employed (Incorporated) | 294 | 3.8% |
| Self-Employed (Not Incorporated) | 672 | 8.7% |
| Not-for-profit Organizations | 247 | 3.2% |
| Local Government Employees | 697 | 9.0% |
| State Government Employees | 346 | 4.5% |
| Federal Government Employees | 262 | 3.4% |
| Unpaid Family Workers | 11 | 0.1% |
| Total | 7,706 | 100.0% |
Employment Status by Age in Cook County
According to the labor force statistics for Cook County, out of the total population over 16 years of age (13,391), 61.1% or 8,182 individuals are in the labor force, with 5.5% or 450 of them unemployed. The age group with the highest labor force participation rate is 20 to 24 years, with 87.9% or 912 individuals in the labor force. Within the labor force, the 25 to 29 years age range has the highest percentage of unemployed individuals, with 13.2% or 96 of them being unemployed.
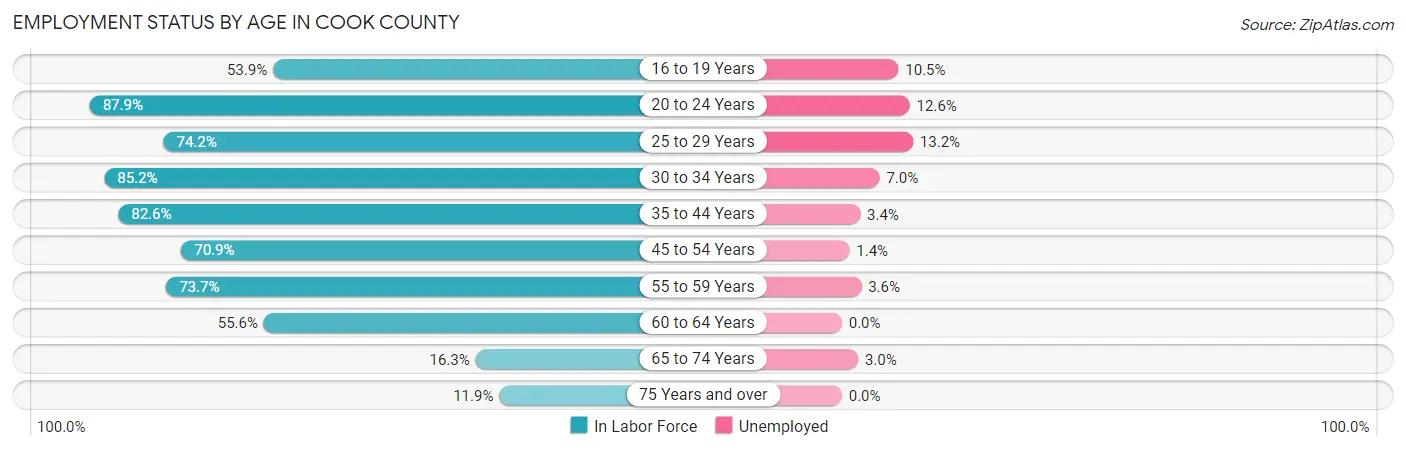
| Age Bracket | In Labor Force | Unemployed |
| 16 to 19 Years | 628 (53.9%) | 66 (10.5%) |
| 20 to 24 Years | 912 (87.9%) | 115 (12.6%) |
| 25 to 29 Years | 725 (74.2%) | 96 (13.2%) |
| 30 to 34 Years | 857 (85.2%) | 60 (7.0%) |
| 35 to 44 Years | 1,692 (82.6%) | 58 (3.4%) |
| 45 to 54 Years | 1,542 (70.9%) | 22 (1.4%) |
| 55 to 59 Years | 800 (73.7%) | 29 (3.6%) |
| 60 to 64 Years | 614 (55.6%) | 0 (0.0%) |
| 65 to 74 Years | 268 (16.3%) | 8 (3.0%) |
| 75 Years and over | 136 (11.9%) | 0 (0.0%) |
| Total | 8,182 (61.1%) | 450 (5.5%) |
Employment Status by Educational Attainment in Cook County
According to labor force statistics for Cook County, 74.2% of individuals (6,231) out of the total population between 25 and 64 years of age (8,397) are in the labor force, with 4.2% or 262 of them being unemployed. The group with the highest labor force participation rate are those with the educational attainment of college / associate degree, with 83.6% or 2,278 individuals in the labor force. Within the labor force, individuals with high school diploma education have the highest percentage of unemployment, with 6.8% or 137 of them being unemployed.
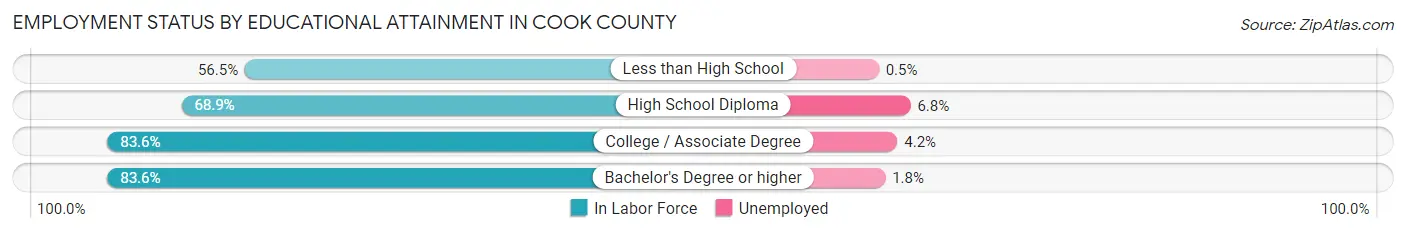
| Educational Attainment | In Labor Force | Unemployed |
| Less than High School | 747 (56.5%) | 7 (0.5%) |
| High School Diploma | 2,015 (68.9%) | 199 (6.8%) |
| College / Associate Degree | 2,278 (83.6%) | 114 (4.2%) |
| Bachelor's Degree or higher | 1,190 (83.6%) | 26 (1.8%) |
| Total | 6,231 (74.2%) | 353 (4.2%) |
Employment Occupations by Sex in Cook County
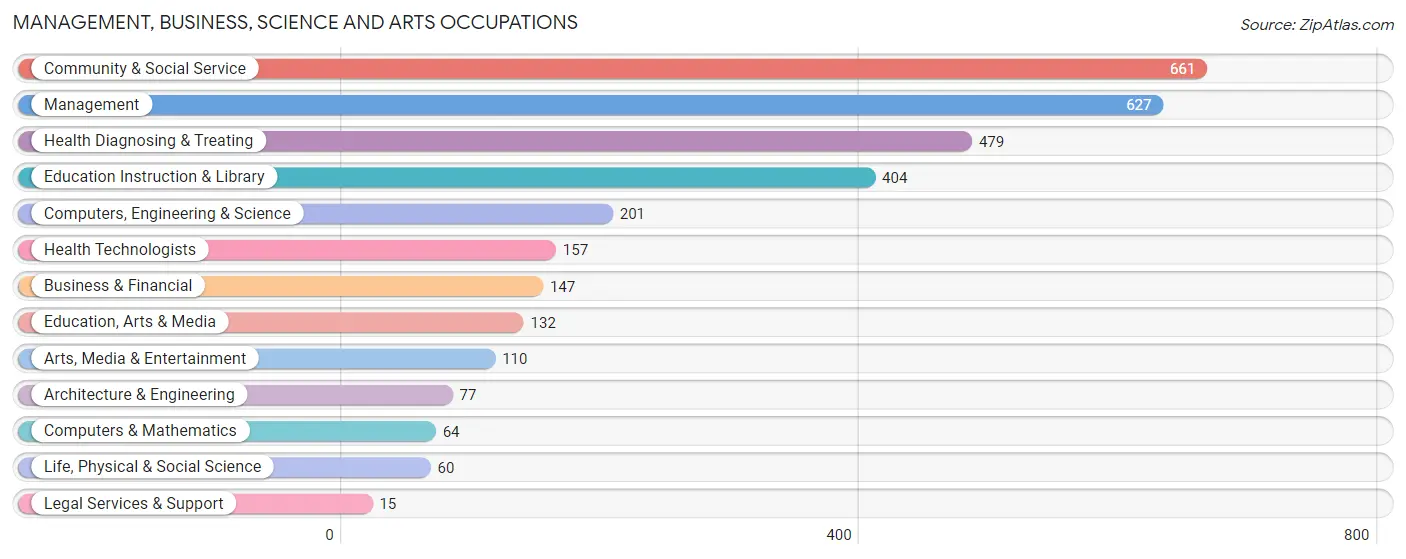
Management, Business, Science and Arts Occupations
The most common Management, Business, Science and Arts occupations in Cook County are Community & Social Service (661 | 8.7%), Management (627 | 8.3%), Health Diagnosing & Treating (479 | 6.3%), Education Instruction & Library (404 | 5.3%), and Computers, Engineering & Science (201 | 2.7%).
Management, Business, Science and Arts Occupations by Sex
Within the Management, Business, Science and Arts occupations in Cook County, the most male-oriented occupations are Life, Physical & Social Science (100.0%), Architecture & Engineering (97.4%), and Computers, Engineering & Science (83.1%), while the most female-oriented occupations are Legal Services & Support (100.0%), Health Diagnosing & Treating (91.2%), and Arts, Media & Entertainment (90.9%).
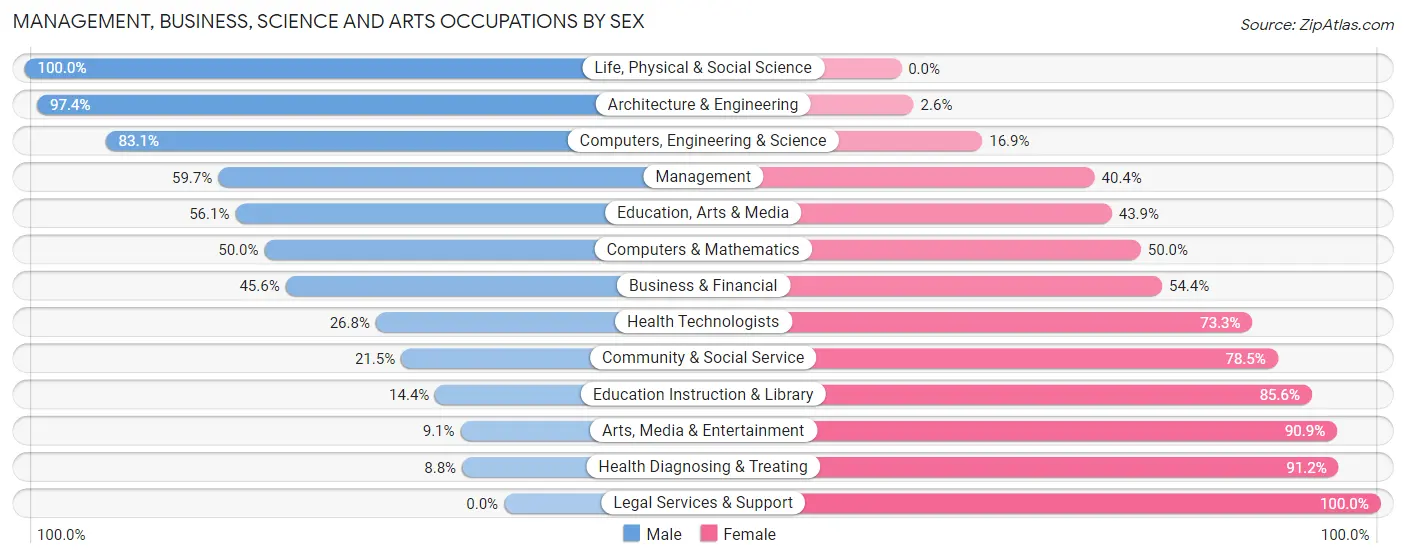
| Occupation | Male | Female |
| Management | 374 (59.7%) | 253 (40.4%) |
| Business & Financial | 67 (45.6%) | 80 (54.4%) |
| Computers, Engineering & Science | 167 (83.1%) | 34 (16.9%) |
| Computers & Mathematics | 32 (50.0%) | 32 (50.0%) |
| Architecture & Engineering | 75 (97.4%) | 2 (2.6%) |
| Life, Physical & Social Science | 60 (100.0%) | 0 (0.0%) |
| Community & Social Service | 142 (21.5%) | 519 (78.5%) |
| Education, Arts & Media | 74 (56.1%) | 58 (43.9%) |
| Legal Services & Support | 0 (0.0%) | 15 (100.0%) |
| Education Instruction & Library | 58 (14.4%) | 346 (85.6%) |
| Arts, Media & Entertainment | 10 (9.1%) | 100 (90.9%) |
| Health Diagnosing & Treating | 42 (8.8%) | 437 (91.2%) |
| Health Technologists | 42 (26.8%) | 115 (73.3%) |
| Total (Category) | 792 (37.4%) | 1,323 (62.5%) |
| Total (Overall) | 4,039 (53.5%) | 3,512 (46.5%) |
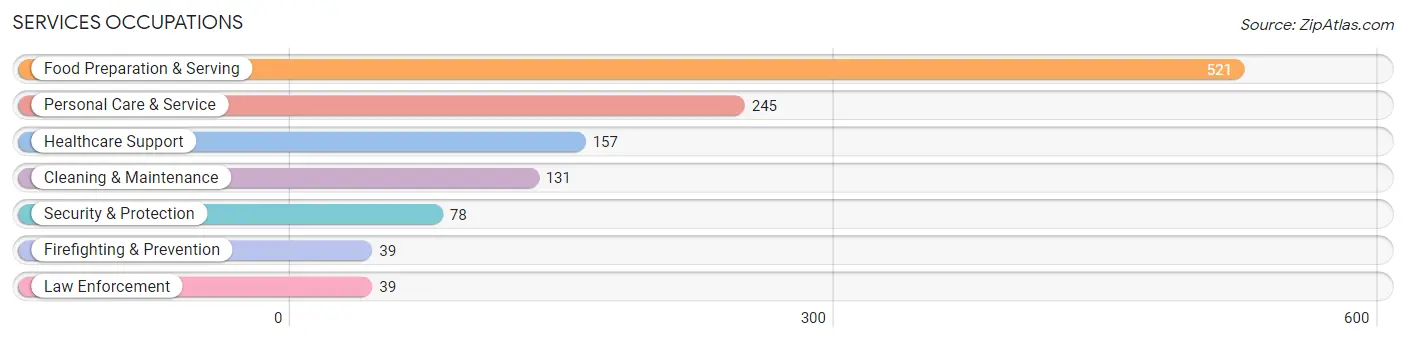
Services Occupations
The most common Services occupations in Cook County are Food Preparation & Serving (521 | 6.9%), Personal Care & Service (245 | 3.2%), Healthcare Support (157 | 2.1%), Cleaning & Maintenance (131 | 1.7%), and Security & Protection (78 | 1.0%).
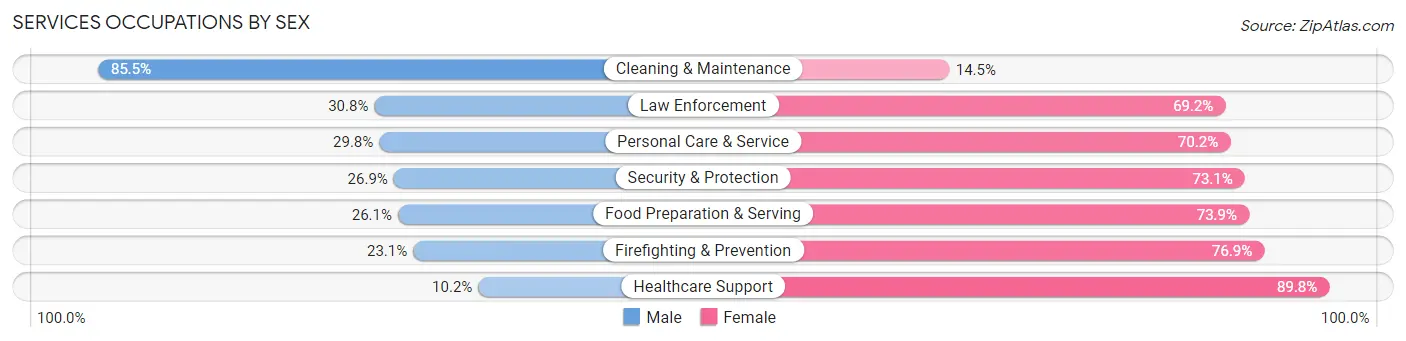
Services Occupations by Sex
Within the Services occupations in Cook County, the most male-oriented occupations are Cleaning & Maintenance (85.5%), Law Enforcement (30.8%), and Personal Care & Service (29.8%), while the most female-oriented occupations are Healthcare Support (89.8%), Firefighting & Prevention (76.9%), and Food Preparation & Serving (73.9%).
| Occupation | Male | Female |
| Healthcare Support | 16 (10.2%) | 141 (89.8%) |
| Security & Protection | 21 (26.9%) | 57 (73.1%) |
| Firefighting & Prevention | 9 (23.1%) | 30 (76.9%) |
| Law Enforcement | 12 (30.8%) | 27 (69.2%) |
| Food Preparation & Serving | 136 (26.1%) | 385 (73.9%) |
| Cleaning & Maintenance | 112 (85.5%) | 19 (14.5%) |
| Personal Care & Service | 73 (29.8%) | 172 (70.2%) |
| Total (Category) | 358 (31.6%) | 774 (68.4%) |
| Total (Overall) | 4,039 (53.5%) | 3,512 (46.5%) |
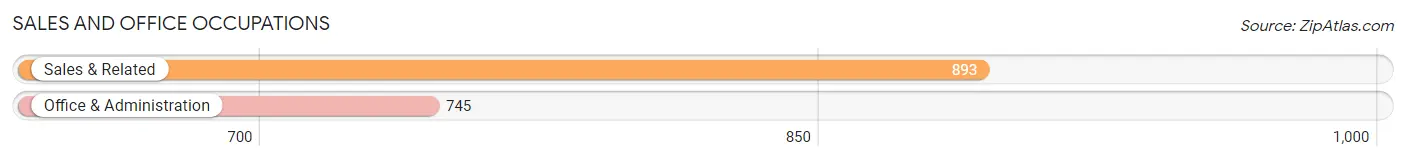
Sales and Office Occupations
The most common Sales and Office occupations in Cook County are Sales & Related (893 | 11.8%), and Office & Administration (745 | 9.9%).
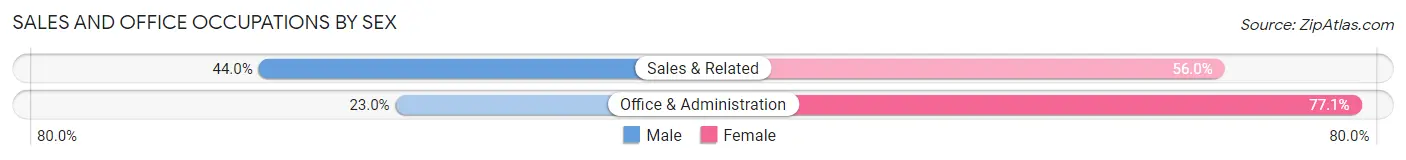
Sales and Office Occupations by Sex
| Occupation | Male | Female |
| Sales & Related | 393 (44.0%) | 500 (56.0%) |
| Office & Administration | 171 (23.0%) | 574 (77.0%) |
| Total (Category) | 564 (34.4%) | 1,074 (65.6%) |
| Total (Overall) | 4,039 (53.5%) | 3,512 (46.5%) |
Natural Resources, Construction and Maintenance Occupations
The most common Natural Resources, Construction and Maintenance occupations in Cook County are Construction & Extraction (791 | 10.5%), Installation, Maintenance & Repair (227 | 3.0%), and Farming, Fishing & Forestry (65 | 0.9%).

Natural Resources, Construction and Maintenance Occupations by Sex

| Occupation | Male | Female |
| Farming, Fishing & Forestry | 53 (81.5%) | 12 (18.5%) |
| Construction & Extraction | 682 (86.2%) | 109 (13.8%) |
| Installation, Maintenance & Repair | 227 (100.0%) | 0 (0.0%) |
| Total (Category) | 962 (88.8%) | 121 (11.2%) |
| Total (Overall) | 4,039 (53.5%) | 3,512 (46.5%) |
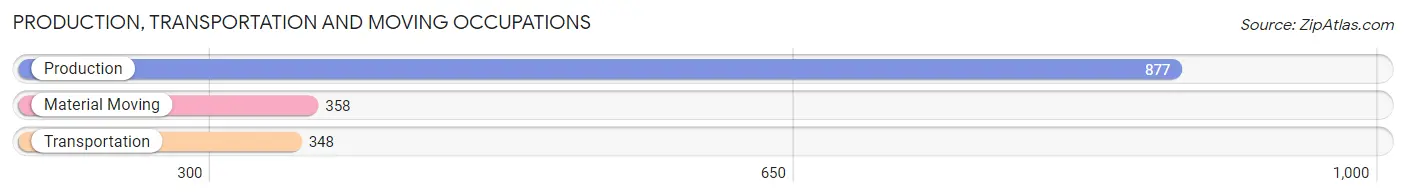
Production, Transportation and Moving Occupations
The most common Production, Transportation and Moving occupations in Cook County are Production (877 | 11.6%), Material Moving (358 | 4.7%), and Transportation (348 | 4.6%).
Production, Transportation and Moving Occupations by Sex

| Occupation | Male | Female |
| Production | 728 (83.0%) | 149 (17.0%) |
| Transportation | 290 (83.3%) | 58 (16.7%) |
| Material Moving | 345 (96.4%) | 13 (3.6%) |
| Total (Category) | 1,363 (86.1%) | 220 (13.9%) |
| Total (Overall) | 4,039 (53.5%) | 3,512 (46.5%) |
Employment Industries by Sex in Cook County
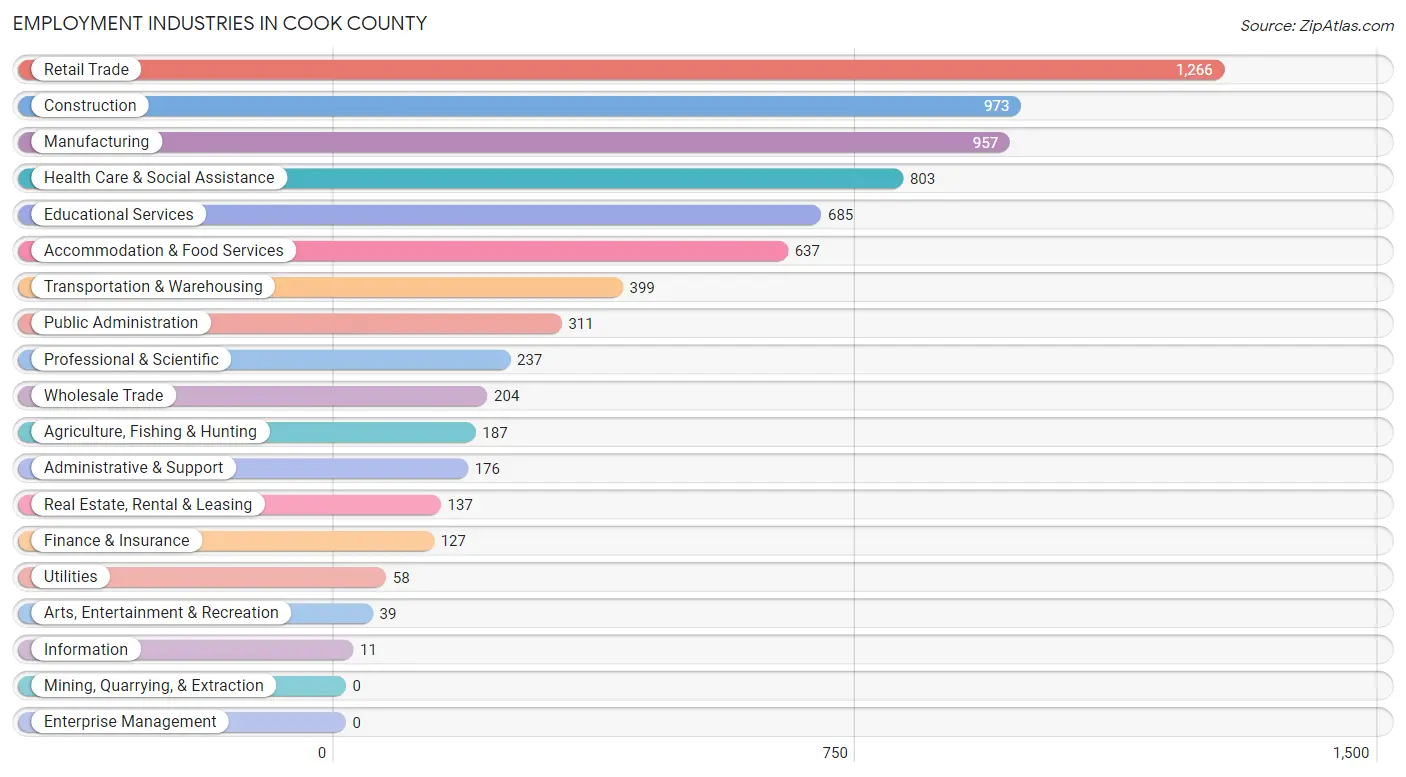
Employment Industries in Cook County
The major employment industries in Cook County include Retail Trade (1,266 | 16.8%), Construction (973 | 12.9%), Manufacturing (957 | 12.7%), Health Care & Social Assistance (803 | 10.6%), and Educational Services (685 | 9.1%).
Employment Industries by Sex in Cook County
The Cook County industries that see more men than women are Utilities (100.0%), Information (100.0%), and Administrative & Support (95.5%), whereas the industries that tend to have a higher number of women are Real Estate, Rental & Leasing (94.9%), Educational Services (82.8%), and Health Care & Social Assistance (82.4%).

| Industry | Male | Female |
| Agriculture, Fishing & Hunting | 143 (76.5%) | 44 (23.5%) |
| Mining, Quarrying, & Extraction | 0 (0.0%) | 0 (0.0%) |
| Construction | 789 (81.1%) | 184 (18.9%) |
| Manufacturing | 755 (78.9%) | 202 (21.1%) |
| Wholesale Trade | 120 (58.8%) | 84 (41.2%) |
| Retail Trade | 656 (51.8%) | 610 (48.2%) |
| Transportation & Warehousing | 284 (71.2%) | 115 (28.8%) |
| Utilities | 58 (100.0%) | 0 (0.0%) |
| Information | 11 (100.0%) | 0 (0.0%) |
| Finance & Insurance | 55 (43.3%) | 72 (56.7%) |
| Real Estate, Rental & Leasing | 7 (5.1%) | 130 (94.9%) |
| Professional & Scientific | 140 (59.1%) | 97 (40.9%) |
| Enterprise Management | 0 (0.0%) | 0 (0.0%) |
| Administrative & Support | 168 (95.5%) | 8 (4.5%) |
| Educational Services | 118 (17.2%) | 567 (82.8%) |
| Health Care & Social Assistance | 141 (17.6%) | 662 (82.4%) |
| Arts, Entertainment & Recreation | 18 (46.2%) | 21 (53.8%) |
| Accommodation & Food Services | 196 (30.8%) | 441 (69.2%) |
| Public Administration | 121 (38.9%) | 190 (61.1%) |
| Total | 4,039 (53.5%) | 3,512 (46.5%) |
Education in Cook County
School Enrollment in Cook County
The most common levels of schooling among the 4,259 students in Cook County are high school (1,223 | 28.7%), middle school (1,031 | 24.2%), and college / undergraduate (833 | 19.6%).

| School Level | # Students | % Students |
| Nursery / Preschool | 236 | 5.5% |
| Kindergarten | 125 | 2.9% |
| Elementary School | 766 | 18.0% |
| Middle School | 1,031 | 24.2% |
| High School | 1,223 | 28.7% |
| College / Undergraduate | 833 | 19.6% |
| Graduate / Professional | 45 | 1.1% |
| Total | 4,259 | 100.0% |
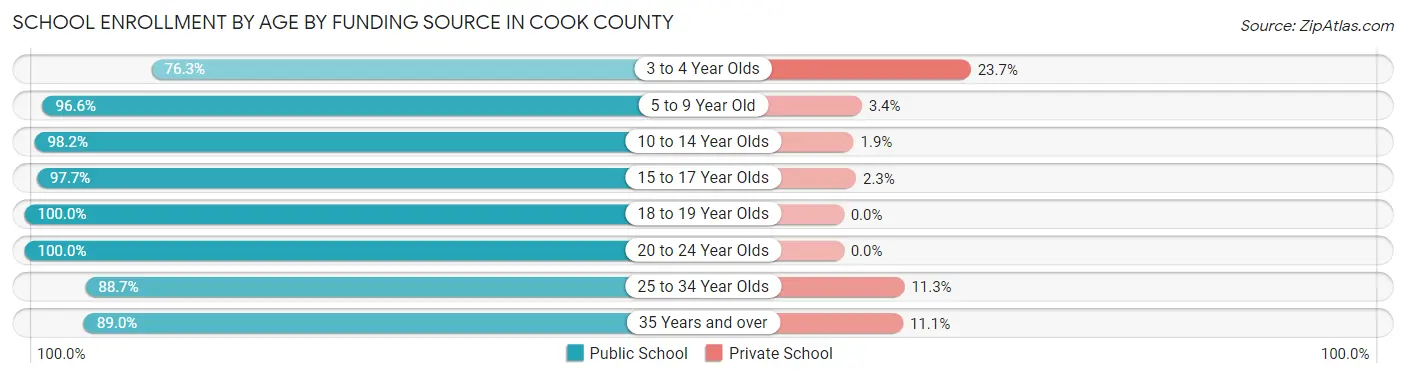
School Enrollment by Age by Funding Source in Cook County
Out of a total of 4,259 students who are enrolled in schools in Cook County, 166 (3.9%) attend a private institution, while the remaining 4,093 (96.1%) are enrolled in public schools. The age group of 3 to 4 year olds has the highest likelihood of being enrolled in private schools, with 49 (23.7% in the age bracket) enrolled. Conversely, the age group of 18 to 19 year olds has the lowest likelihood of being enrolled in a private school, with 345 (100.0% in the age bracket) attending a public institution.
| Age Bracket | Public School | Private School |
| 3 to 4 Year Olds | 158 (76.3%) | 49 (23.7%) |
| 5 to 9 Year Old | 631 (96.6%) | 22 (3.4%) |
| 10 to 14 Year Olds | 1,535 (98.2%) | 29 (1.8%) |
| 15 to 17 Year Olds | 764 (97.7%) | 18 (2.3%) |
| 18 to 19 Year Olds | 345 (100.0%) | 0 (0.0%) |
| 20 to 24 Year Olds | 271 (100.0%) | 0 (0.0%) |
| 25 to 34 Year Olds | 235 (88.7%) | 30 (11.3%) |
| 35 Years and over | 153 (88.9%) | 19 (11.1%) |
| Total | 4,093 (96.1%) | 166 (3.9%) |
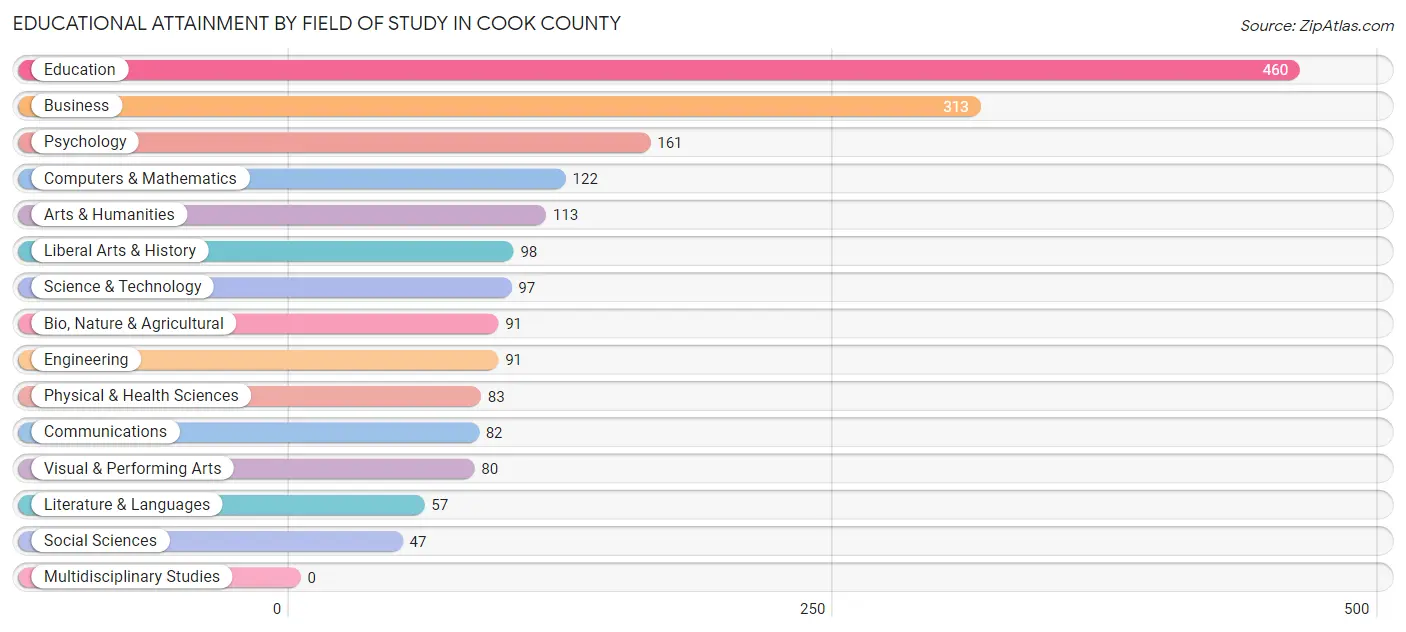
Educational Attainment by Field of Study in Cook County
Education (460 | 24.3%), business (313 | 16.5%), psychology (161 | 8.5%), computers & mathematics (122 | 6.4%), and arts & humanities (113 | 6.0%) are the most common fields of study among 1,895 individuals in Cook County who have obtained a bachelor's degree or higher.
| Field of Study | # Graduates | % Graduates |
| Computers & Mathematics | 122 | 6.4% |
| Bio, Nature & Agricultural | 91 | 4.8% |
| Physical & Health Sciences | 83 | 4.4% |
| Psychology | 161 | 8.5% |
| Social Sciences | 47 | 2.5% |
| Engineering | 91 | 4.8% |
| Multidisciplinary Studies | 0 | 0.0% |
| Science & Technology | 97 | 5.1% |
| Business | 313 | 16.5% |
| Education | 460 | 24.3% |
| Literature & Languages | 57 | 3.0% |
| Liberal Arts & History | 98 | 5.2% |
| Visual & Performing Arts | 80 | 4.2% |
| Communications | 82 | 4.3% |
| Arts & Humanities | 113 | 6.0% |
| Total | 1,895 | 100.0% |
Transportation & Commute in Cook County
Vehicle Availability by Sex in Cook County
The most prevalent vehicle ownership categories in Cook County are males with 2 vehicles (1,181, accounting for 28.8%) and females with 2 vehicles (1,148, making up 32.9%).

| Vehicles Available | Male | Female |
| No Vehicle | 125 (3.0%) | 75 (2.1%) |
| 1 Vehicle | 683 (16.7%) | 608 (17.0%) |
| 2 Vehicles | 1,181 (28.8%) | 1,148 (32.0%) |
| 3 Vehicles | 1,052 (25.6%) | 884 (24.7%) |
| 4 Vehicles | 395 (9.6%) | 411 (11.5%) |
| 5 or more Vehicles | 667 (16.3%) | 459 (12.8%) |
| Total | 4,103 (100.0%) | 3,585 (100.0%) |
Commute Time in Cook County
The most frequently occuring commute durations in Cook County are 10 to 14 minutes (1,831 commuters, 24.2%), 30 to 34 minutes (1,175 commuters, 15.6%), and 15 to 19 minutes (849 commuters, 11.3%).

| Commute Time | # Commuters | % Commuters |
| Less than 5 Minutes | 116 | 1.5% |
| 5 to 9 Minutes | 551 | 7.3% |
| 10 to 14 Minutes | 1,831 | 24.2% |
| 15 to 19 Minutes | 849 | 11.3% |
| 20 to 24 Minutes | 727 | 9.6% |
| 25 to 29 Minutes | 787 | 10.4% |
| 30 to 34 Minutes | 1,175 | 15.6% |
| 35 to 39 Minutes | 231 | 3.1% |
| 40 to 44 Minutes | 99 | 1.3% |
| 45 to 59 Minutes | 641 | 8.5% |
| 60 to 89 Minutes | 289 | 3.8% |
| 90 or more Minutes | 254 | 3.4% |
Commute Time by Sex in Cook County
The most common commute times in Cook County are 10 to 14 minutes (1,035 commuters, 25.6%) for males and 10 to 14 minutes (796 commuters, 22.7%) for females.

| Commute Time | Male | Female |
| Less than 5 Minutes | 37 (0.9%) | 79 (2.2%) |
| 5 to 9 Minutes | 185 (4.6%) | 366 (10.4%) |
| 10 to 14 Minutes | 1,035 (25.6%) | 796 (22.7%) |
| 15 to 19 Minutes | 221 (5.5%) | 628 (17.9%) |
| 20 to 24 Minutes | 436 (10.8%) | 291 (8.3%) |
| 25 to 29 Minutes | 385 (9.5%) | 402 (11.4%) |
| 30 to 34 Minutes | 638 (15.8%) | 537 (15.3%) |
| 35 to 39 Minutes | 181 (4.5%) | 50 (1.4%) |
| 40 to 44 Minutes | 35 (0.9%) | 64 (1.8%) |
| 45 to 59 Minutes | 542 (13.4%) | 99 (2.8%) |
| 60 to 89 Minutes | 152 (3.8%) | 137 (3.9%) |
| 90 or more Minutes | 189 (4.7%) | 65 (1.8%) |
Time of Departure to Work by Sex in Cook County
The most frequent times of departure to work in Cook County are 7:00 AM to 7:29 AM (903, 22.4%) for males and 7:30 AM to 7:59 AM (745, 21.2%) for females.

| Time of Departure | Male | Female |
| 12:00 AM to 4:59 AM | 340 (8.4%) | 176 (5.0%) |
| 5:00 AM to 5:29 AM | 169 (4.2%) | 64 (1.8%) |
| 5:30 AM to 5:59 AM | 213 (5.3%) | 97 (2.8%) |
| 6:00 AM to 6:29 AM | 390 (9.7%) | 301 (8.6%) |
| 6:30 AM to 6:59 AM | 359 (8.9%) | 408 (11.6%) |
| 7:00 AM to 7:29 AM | 903 (22.4%) | 351 (10.0%) |
| 7:30 AM to 7:59 AM | 464 (11.5%) | 745 (21.2%) |
| 8:00 AM to 8:29 AM | 540 (13.4%) | 453 (12.9%) |
| 8:30 AM to 8:59 AM | 206 (5.1%) | 209 (5.9%) |
| 9:00 AM to 9:59 AM | 70 (1.7%) | 33 (0.9%) |
| 10:00 AM to 10:59 AM | 13 (0.3%) | 46 (1.3%) |
| 11:00 AM to 11:59 AM | 4 (0.1%) | 36 (1.0%) |
| 12:00 PM to 3:59 PM | 145 (3.6%) | 283 (8.1%) |
| 4:00 PM to 11:59 PM | 220 (5.4%) | 312 (8.9%) |
| Total | 4,036 (100.0%) | 3,514 (100.0%) |
Housing Occupancy in Cook County
Occupancy by Ownership in Cook County
Of the total 6,116 dwellings in Cook County, owner-occupied units account for 3,881 (63.5%), while renter-occupied units make up 2,235 (36.5%).
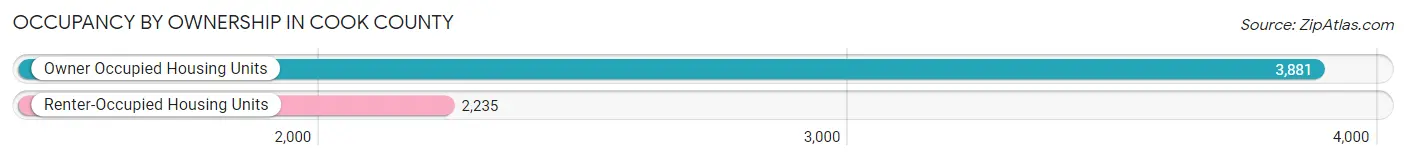
| Occupancy | # Housing Units | % Housing Units |
| Owner Occupied Housing Units | 3,881 | 63.5% |
| Renter-Occupied Housing Units | 2,235 | 36.5% |
| Total Occupied Housing Units | 6,116 | 100.0% |
Occupancy by Household Size in Cook County
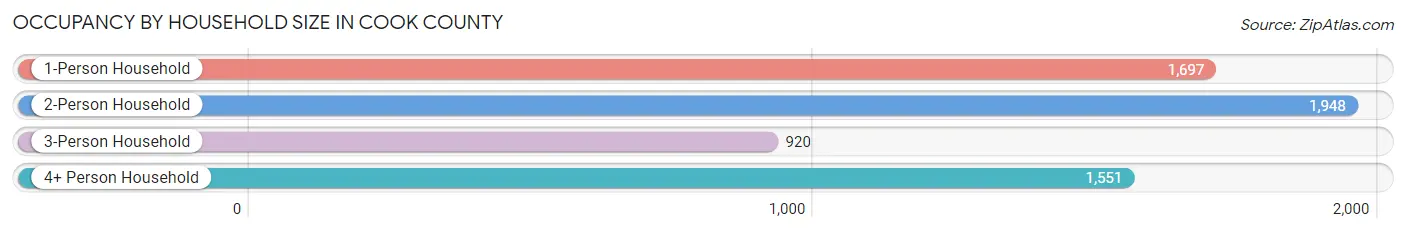
| Household Size | # Housing Units | % Housing Units |
| 1-Person Household | 1,697 | 27.8% |
| 2-Person Household | 1,948 | 31.9% |
| 3-Person Household | 920 | 15.0% |
| 4+ Person Household | 1,551 | 25.4% |
| Total Housing Units | 6,116 | 100.0% |
Occupancy by Ownership by Household Size in Cook County
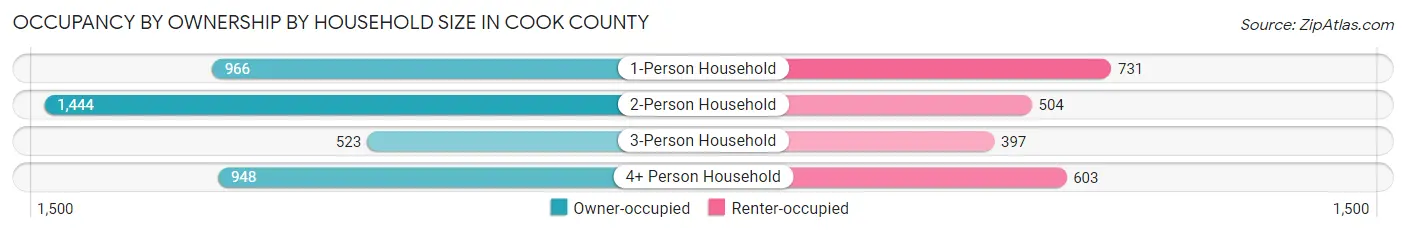
| Household Size | Owner-occupied | Renter-occupied |
| 1-Person Household | 966 (56.9%) | 731 (43.1%) |
| 2-Person Household | 1,444 (74.1%) | 504 (25.9%) |
| 3-Person Household | 523 (56.9%) | 397 (43.1%) |
| 4+ Person Household | 948 (61.1%) | 603 (38.9%) |
| Total Housing Units | 3,881 (63.5%) | 2,235 (36.5%) |
Occupancy by Educational Attainment in Cook County
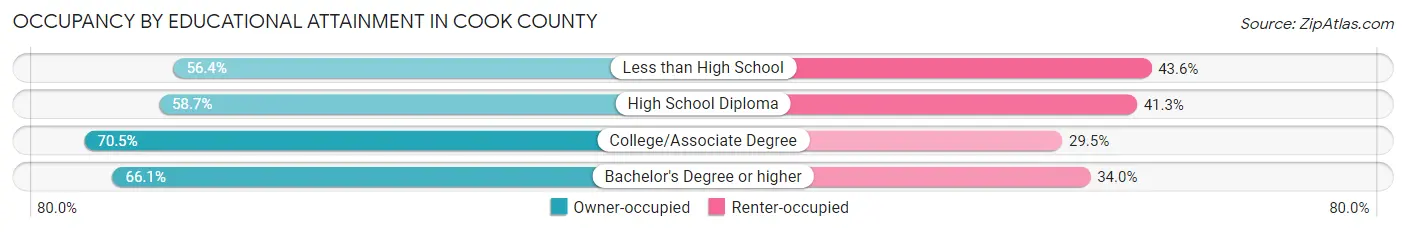
| Household Size | Owner-occupied | Renter-occupied |
| Less than High School | 570 (56.4%) | 441 (43.6%) |
| High School Diploma | 1,156 (58.7%) | 814 (41.3%) |
| College/Associate Degree | 1,330 (70.5%) | 556 (29.5%) |
| Bachelor's Degree or higher | 825 (66.0%) | 424 (34.0%) |
Occupancy by Age of Householder in Cook County
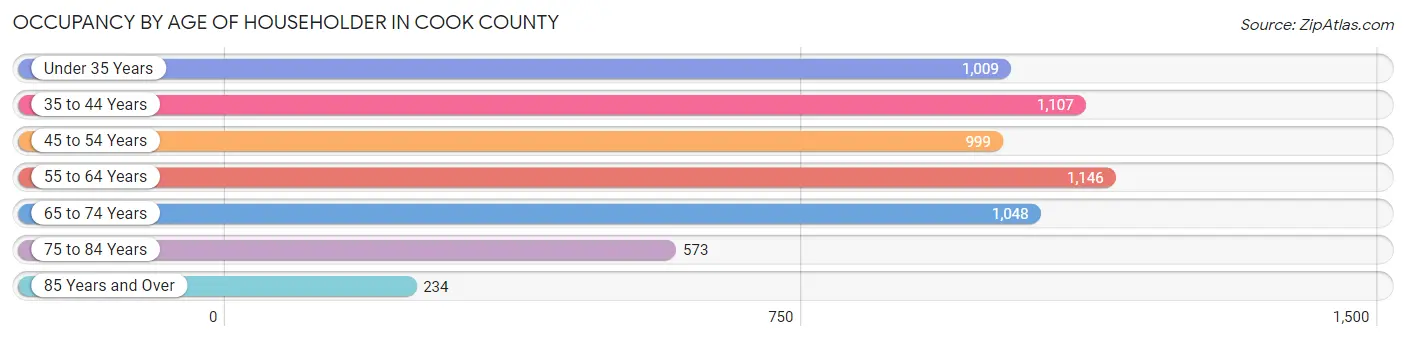
| Age Bracket | # Households | % Households |
| Under 35 Years | 1,009 | 16.5% |
| 35 to 44 Years | 1,107 | 18.1% |
| 45 to 54 Years | 999 | 16.3% |
| 55 to 64 Years | 1,146 | 18.7% |
| 65 to 74 Years | 1,048 | 17.1% |
| 75 to 84 Years | 573 | 9.4% |
| 85 Years and Over | 234 | 3.8% |
| Total | 6,116 | 100.0% |
Housing Finances in Cook County
Median Income by Occupancy in Cook County
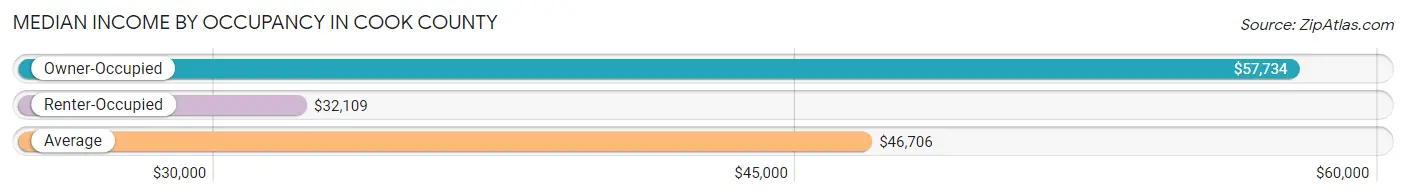
| Occupancy Type | # Households | Median Income |
| Owner-Occupied | 3,881 (63.5%) | $57,734 |
| Renter-Occupied | 2,235 (36.5%) | $32,109 |
| Average | 6,116 (100.0%) | $46,706 |
Occupancy by Householder Income Bracket in Cook County
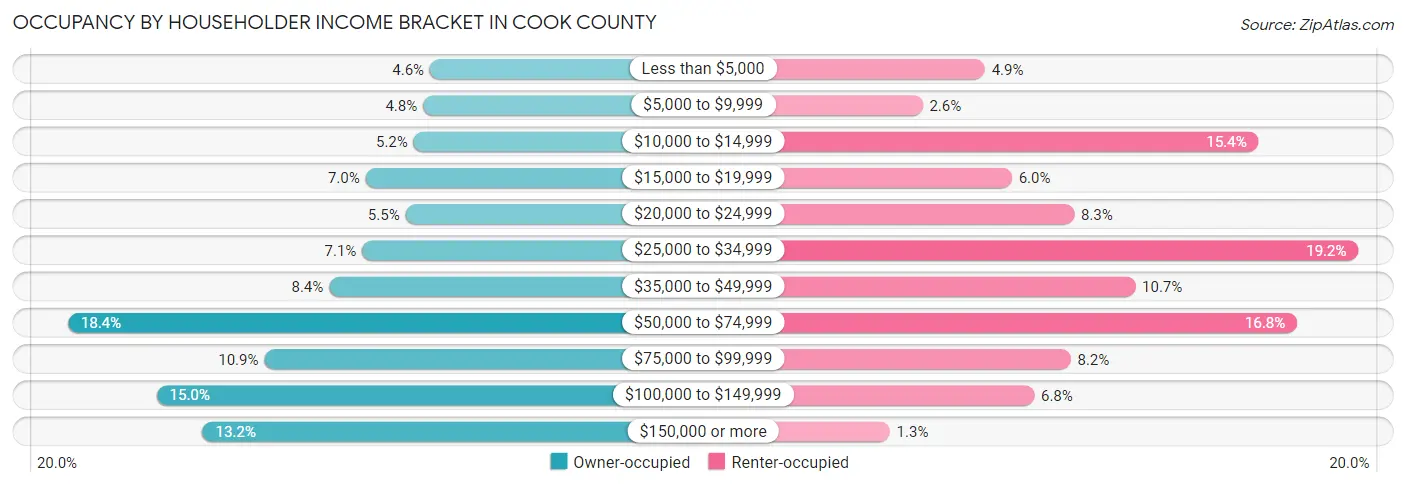
| Income Bracket | Owner-occupied | Renter-occupied |
| Less than $5,000 | 177 (4.6%) | 110 (4.9%) |
| $5,000 to $9,999 | 187 (4.8%) | 57 (2.5%) |
| $10,000 to $14,999 | 201 (5.2%) | 343 (15.3%) |
| $15,000 to $19,999 | 272 (7.0%) | 133 (5.9%) |
| $20,000 to $24,999 | 213 (5.5%) | 186 (8.3%) |
| $25,000 to $34,999 | 277 (7.1%) | 428 (19.2%) |
| $35,000 to $49,999 | 326 (8.4%) | 238 (10.6%) |
| $50,000 to $74,999 | 712 (18.3%) | 376 (16.8%) |
| $75,000 to $99,999 | 422 (10.9%) | 183 (8.2%) |
| $100,000 to $149,999 | 581 (15.0%) | 152 (6.8%) |
| $150,000 or more | 513 (13.2%) | 29 (1.3%) |
| Total | 3,881 (100.0%) | 2,235 (100.0%) |
Monthly Housing Cost Tiers in Cook County
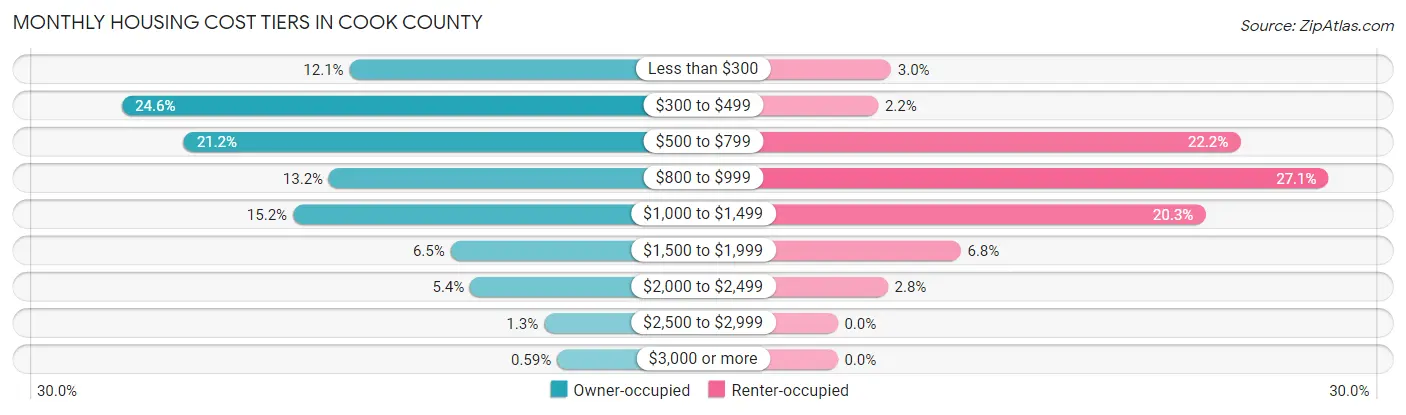
| Monthly Cost | Owner-occupied | Renter-occupied |
| Less than $300 | 468 (12.1%) | 66 (2.9%) |
| $300 to $499 | 955 (24.6%) | 50 (2.2%) |
| $500 to $799 | 823 (21.2%) | 497 (22.2%) |
| $800 to $999 | 512 (13.2%) | 606 (27.1%) |
| $1,000 to $1,499 | 589 (15.2%) | 454 (20.3%) |
| $1,500 to $1,999 | 251 (6.5%) | 152 (6.8%) |
| $2,000 to $2,499 | 209 (5.4%) | 62 (2.8%) |
| $2,500 to $2,999 | 51 (1.3%) | 0 (0.0%) |
| $3,000 or more | 23 (0.6%) | 0 (0.0%) |
| Total | 3,881 (100.0%) | 2,235 (100.0%) |
Physical Housing Characteristics in Cook County
Housing Structures in Cook County

| Structure Type | # Housing Units | % Housing Units |
| Single Unit, Detached | 3,887 | 63.5% |
| Single Unit, Attached | 109 | 1.8% |
| 2 Unit Apartments | 31 | 0.5% |
| 3 or 4 Unit Apartments | 23 | 0.4% |
| 5 to 9 Unit Apartments | 198 | 3.2% |
| 10 or more Apartments | 215 | 3.5% |
| Mobile Home / Other | 1,653 | 27.0% |
| Total | 6,116 | 100.0% |
Housing Structures by Occupancy in Cook County

| Structure Type | Owner-occupied | Renter-occupied |
| Single Unit, Detached | 2,800 (72.0%) | 1,087 (28.0%) |
| Single Unit, Attached | 89 (81.7%) | 20 (18.3%) |
| 2 Unit Apartments | 12 (38.7%) | 19 (61.3%) |
| 3 or 4 Unit Apartments | 0 (0.0%) | 23 (100.0%) |
| 5 to 9 Unit Apartments | 0 (0.0%) | 198 (100.0%) |
| 10 or more Apartments | 0 (0.0%) | 215 (100.0%) |
| Mobile Home / Other | 980 (59.3%) | 673 (40.7%) |
| Total | 3,881 (63.5%) | 2,235 (36.5%) |
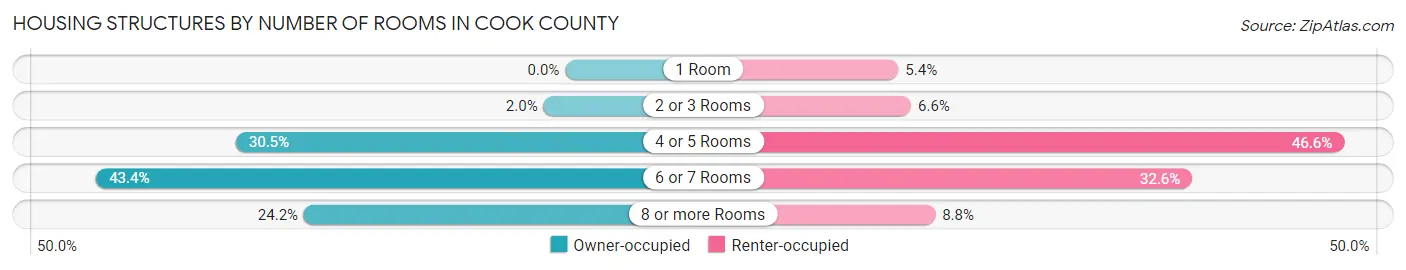
Housing Structures by Number of Rooms in Cook County
| Number of Rooms | Owner-occupied | Renter-occupied |
| 1 Room | 0 (0.0%) | 121 (5.4%) |
| 2 or 3 Rooms | 78 (2.0%) | 147 (6.6%) |
| 4 or 5 Rooms | 1,182 (30.5%) | 1,042 (46.6%) |
| 6 or 7 Rooms | 1,683 (43.4%) | 728 (32.6%) |
| 8 or more Rooms | 938 (24.2%) | 197 (8.8%) |
| Total | 3,881 (100.0%) | 2,235 (100.0%) |
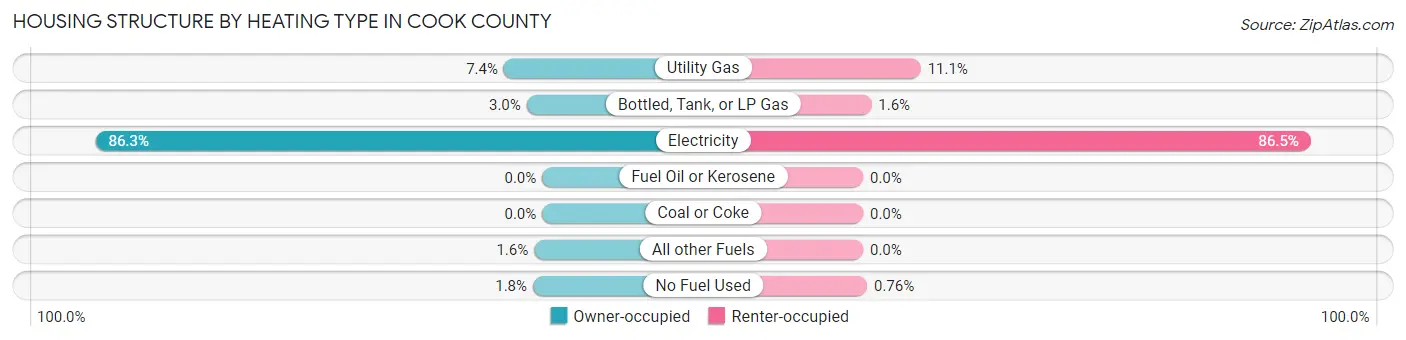
Housing Structure by Heating Type in Cook County
| Heating Type | Owner-occupied | Renter-occupied |
| Utility Gas | 287 (7.4%) | 249 (11.1%) |
| Bottled, Tank, or LP Gas | 116 (3.0%) | 36 (1.6%) |
| Electricity | 3,349 (86.3%) | 1,933 (86.5%) |
| Fuel Oil or Kerosene | 0 (0.0%) | 0 (0.0%) |
| Coal or Coke | 0 (0.0%) | 0 (0.0%) |
| All other Fuels | 60 (1.5%) | 0 (0.0%) |
| No Fuel Used | 69 (1.8%) | 17 (0.8%) |
| Total | 3,881 (100.0%) | 2,235 (100.0%) |
Household Vehicle Usage in Cook County

| Vehicles per Household | Owner-occupied | Renter-occupied |
| No Vehicle | 132 (3.4%) | 327 (14.6%) |
| 1 Vehicle | 1,027 (26.5%) | 921 (41.2%) |
| 2 Vehicles | 1,343 (34.6%) | 623 (27.9%) |
| 3 or more Vehicles | 1,379 (35.5%) | 364 (16.3%) |
| Total | 3,881 (100.0%) | 2,235 (100.0%) |
Real Estate & Mortgages in Cook County
Real Estate and Mortgage Overview in Cook County
| Characteristic | Without Mortgage | With Mortgage |
| Housing Units | 2,096 | 1,785 |
| Median Property Value | $82,600 | $138,900 |
| Median Household Income | $41,638 | $294 |
| Monthly Housing Costs | $406 | $23 |
| Real Estate Taxes | $765 | $67 |
Property Value by Mortgage Status in Cook County

| Property Value | Without Mortgage | With Mortgage |
| Less than $50,000 | 560 (26.7%) | 165 (9.2%) |
| $50,000 to $99,999 | 657 (31.4%) | 374 (20.9%) |
| $100,000 to $299,999 | 673 (32.1%) | 1,086 (60.8%) |
| $300,000 to $499,999 | 148 (7.1%) | 49 (2.8%) |
| $500,000 to $749,999 | 40 (1.9%) | 106 (5.9%) |
| $750,000 to $999,999 | 0 (0.0%) | 5 (0.3%) |
| $1,000,000 or more | 18 (0.9%) | 0 (0.0%) |
| Total | 2,096 (100.0%) | 1,785 (100.0%) |
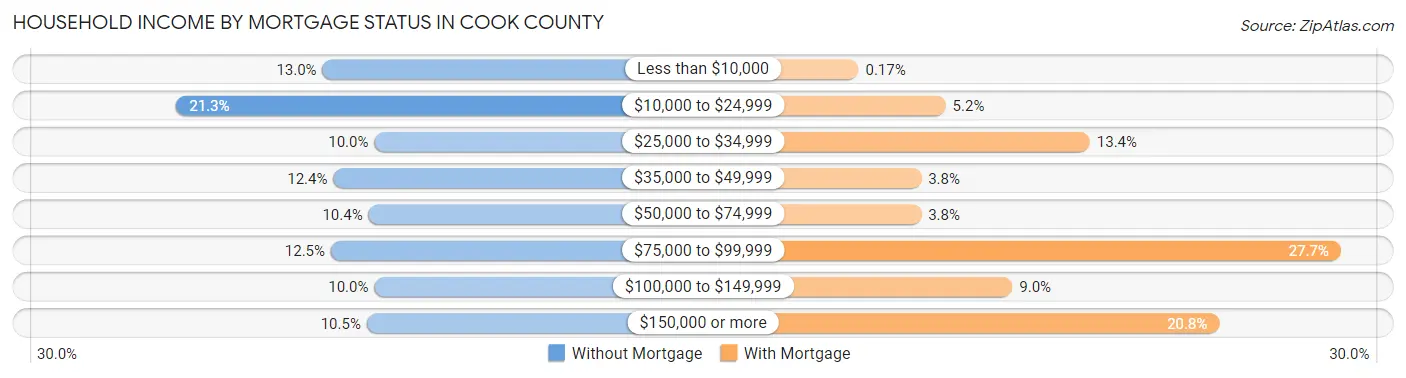
Household Income by Mortgage Status in Cook County
| Household Income | Without Mortgage | With Mortgage |
| Less than $10,000 | 272 (13.0%) | 3 (0.2%) |
| $10,000 to $24,999 | 447 (21.3%) | 92 (5.1%) |
| $25,000 to $34,999 | 210 (10.0%) | 239 (13.4%) |
| $35,000 to $49,999 | 259 (12.4%) | 67 (3.7%) |
| $50,000 to $74,999 | 217 (10.3%) | 67 (3.7%) |
| $75,000 to $99,999 | 262 (12.5%) | 495 (27.7%) |
| $100,000 to $149,999 | 210 (10.0%) | 160 (9.0%) |
| $150,000 or more | 219 (10.4%) | 371 (20.8%) |
| Total | 2,096 (100.0%) | 1,785 (100.0%) |
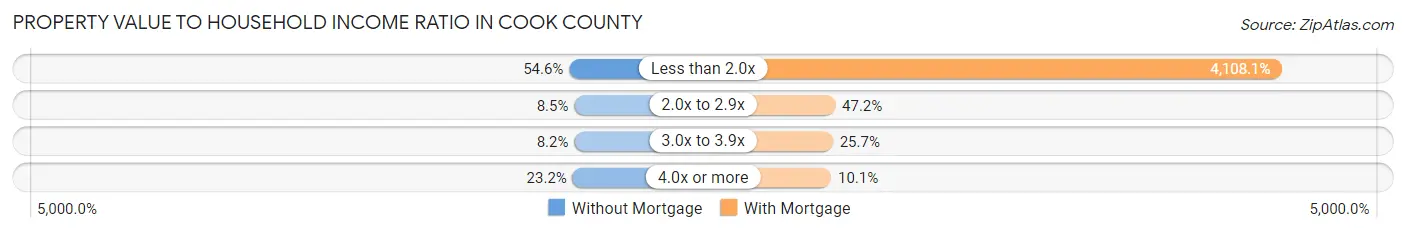
Property Value to Household Income Ratio in Cook County
| Value-to-Income Ratio | Without Mortgage | With Mortgage |
| Less than 2.0x | 1,145 (54.6%) | 73,329 (4,108.1%) |
| 2.0x to 2.9x | 178 (8.5%) | 843 (47.2%) |
| 3.0x to 3.9x | 172 (8.2%) | 458 (25.7%) |
| 4.0x or more | 487 (23.2%) | 180 (10.1%) |
| Total | 2,096 (100.0%) | 1,785 (100.0%) |
Real Estate Taxes by Mortgage Status in Cook County
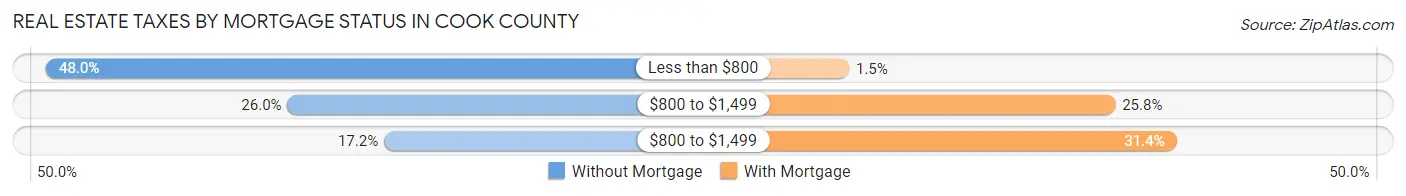
| Property Taxes | Without Mortgage | With Mortgage |
| Less than $800 | 1,007 (48.0%) | 26 (1.5%) |
| $800 to $1,499 | 545 (26.0%) | 460 (25.8%) |
| $800 to $1,499 | 360 (17.2%) | 560 (31.4%) |
| Total | 2,096 (100.0%) | 1,785 (100.0%) |
Health & Disability in Cook County
Health Insurance Coverage by Age in Cook County
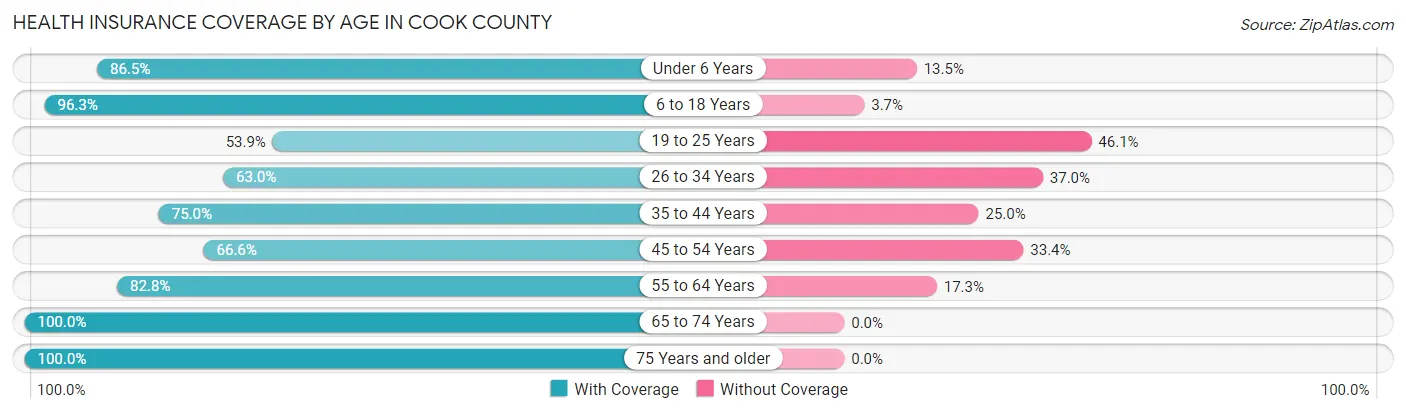
| Age Bracket | With Coverage | Without Coverage |
| Under 6 Years | 1,101 (86.5%) | 172 (13.5%) |
| 6 to 18 Years | 3,304 (96.3%) | 128 (3.7%) |
| 19 to 25 Years | 797 (53.9%) | 681 (46.1%) |
| 26 to 34 Years | 1,046 (63.0%) | 615 (37.0%) |
| 35 to 44 Years | 1,530 (75.0%) | 511 (25.0%) |
| 45 to 54 Years | 1,446 (66.6%) | 725 (33.4%) |
| 55 to 64 Years | 1,794 (82.8%) | 374 (17.2%) |
| 65 to 74 Years | 1,621 (100.0%) | 0 (0.0%) |
| 75 Years and older | 1,066 (100.0%) | 0 (0.0%) |
| Total | 13,705 (81.0%) | 3,206 (19.0%) |
Health Insurance Coverage by Citizenship Status in Cook County
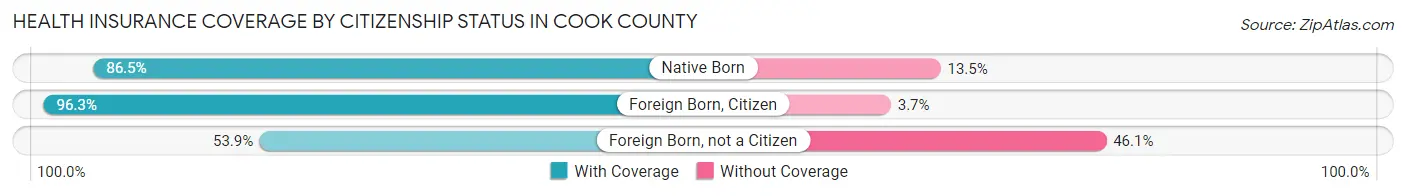
| Citizenship Status | With Coverage | Without Coverage |
| Native Born | 1,101 (86.5%) | 172 (13.5%) |
| Foreign Born, Citizen | 3,304 (96.3%) | 128 (3.7%) |
| Foreign Born, not a Citizen | 797 (53.9%) | 681 (46.1%) |
Health Insurance Coverage by Household Income in Cook County
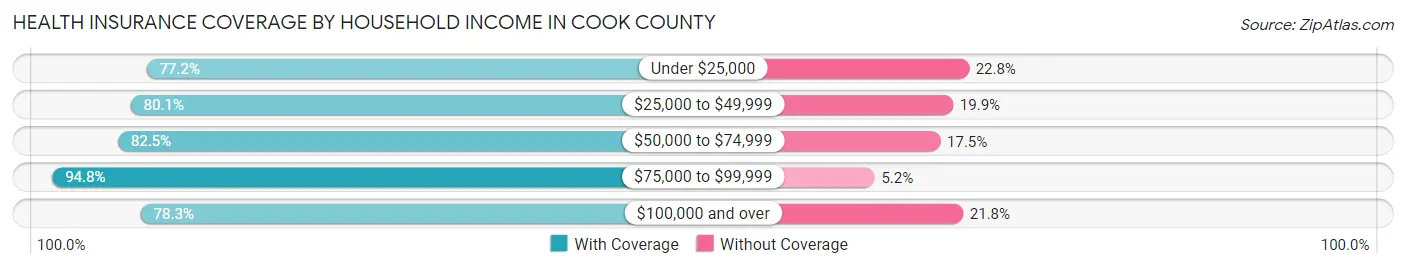
| Household Income | With Coverage | Without Coverage |
| Under $25,000 | 2,757 (77.2%) | 816 (22.8%) |
| $25,000 to $49,999 | 2,854 (80.1%) | 708 (19.9%) |
| $50,000 to $74,999 | 2,493 (82.5%) | 528 (17.5%) |
| $75,000 to $99,999 | 1,739 (94.8%) | 95 (5.2%) |
| $100,000 and over | 3,781 (78.2%) | 1,051 (21.7%) |
Public vs Private Health Insurance Coverage by Age in Cook County
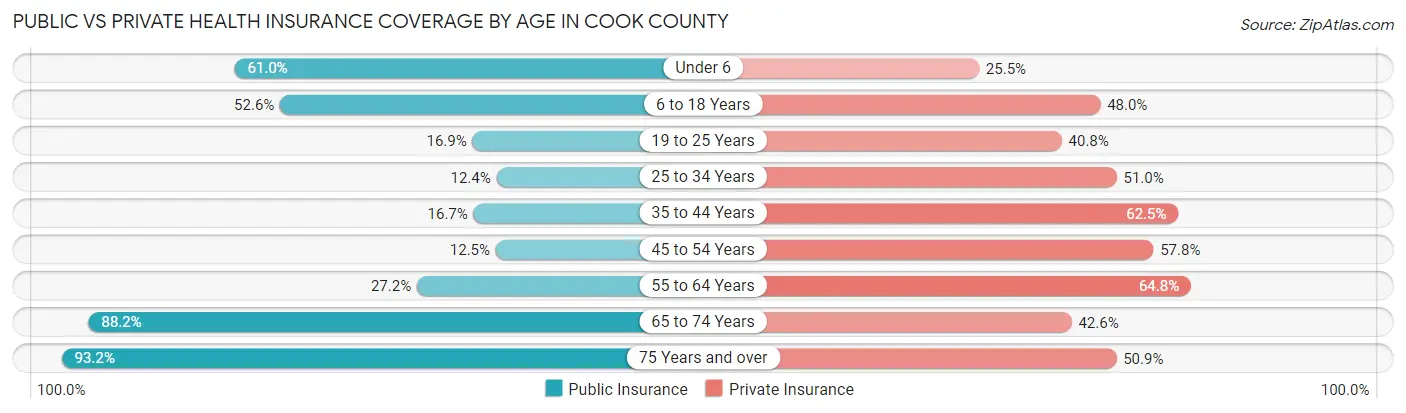
| Age Bracket | Public Insurance | Private Insurance |
| Under 6 | 777 (61.0%) | 324 (25.5%) |
| 6 to 18 Years | 1,804 (52.6%) | 1,646 (48.0%) |
| 19 to 25 Years | 249 (16.9%) | 603 (40.8%) |
| 25 to 34 Years | 206 (12.4%) | 847 (51.0%) |
| 35 to 44 Years | 340 (16.7%) | 1,275 (62.5%) |
| 45 to 54 Years | 272 (12.5%) | 1,255 (57.8%) |
| 55 to 64 Years | 589 (27.2%) | 1,405 (64.8%) |
| 65 to 74 Years | 1,429 (88.2%) | 691 (42.6%) |
| 75 Years and over | 993 (93.1%) | 543 (50.9%) |
| Total | 6,659 (39.4%) | 8,589 (50.8%) |
Disability Status by Sex by Age in Cook County
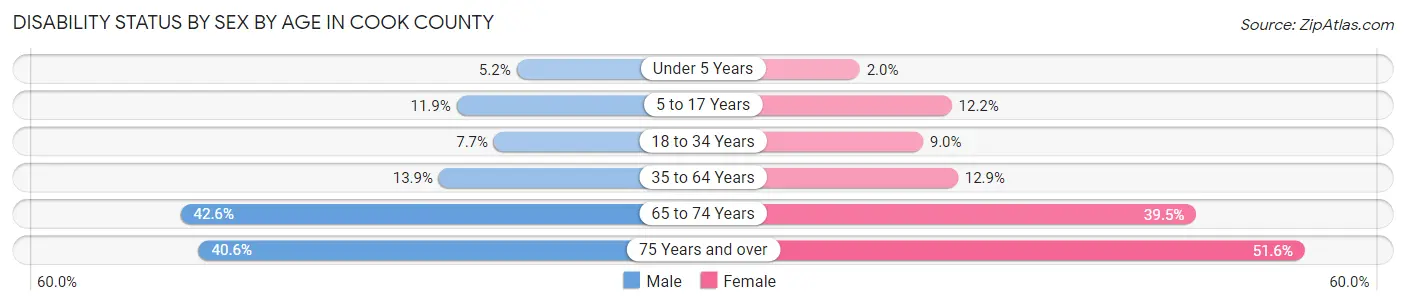
| Age Bracket | Male | Female |
| Under 5 Years | 32 (5.2%) | 10 (2.0%) |
| 5 to 17 Years | 193 (11.9%) | 197 (12.2%) |
| 18 to 34 Years | 136 (7.7%) | 157 (9.0%) |
| 35 to 64 Years | 418 (13.9%) | 435 (12.9%) |
| 65 to 74 Years | 329 (42.6%) | 335 (39.5%) |
| 75 Years and over | 173 (40.6%) | 330 (51.6%) |
Disability Class by Sex by Age in Cook County
Disability Class: Hearing Difficulty
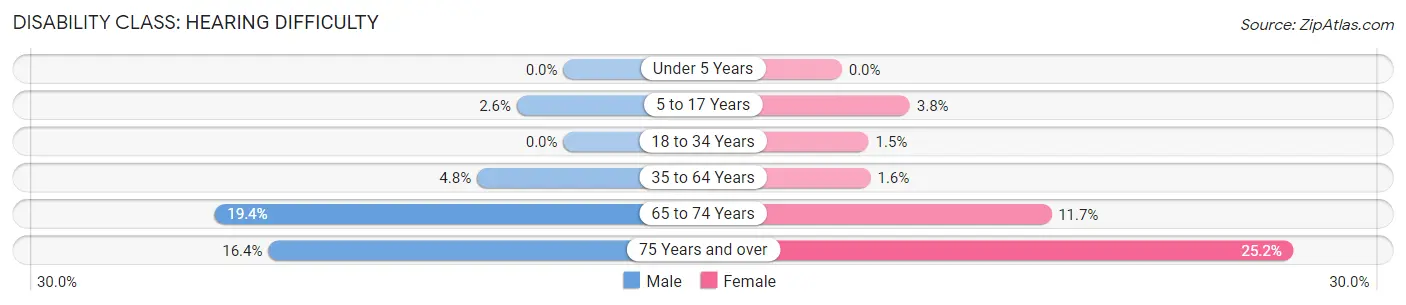
| Age Bracket | Male | Female |
| Under 5 Years | 0 (0.0%) | 0 (0.0%) |
| 5 to 17 Years | 42 (2.6%) | 61 (3.8%) |
| 18 to 34 Years | 0 (0.0%) | 26 (1.5%) |
| 35 to 64 Years | 145 (4.8%) | 54 (1.6%) |
| 65 to 74 Years | 150 (19.4%) | 99 (11.7%) |
| 75 Years and over | 70 (16.4%) | 161 (25.2%) |
Disability Class: Vision Difficulty
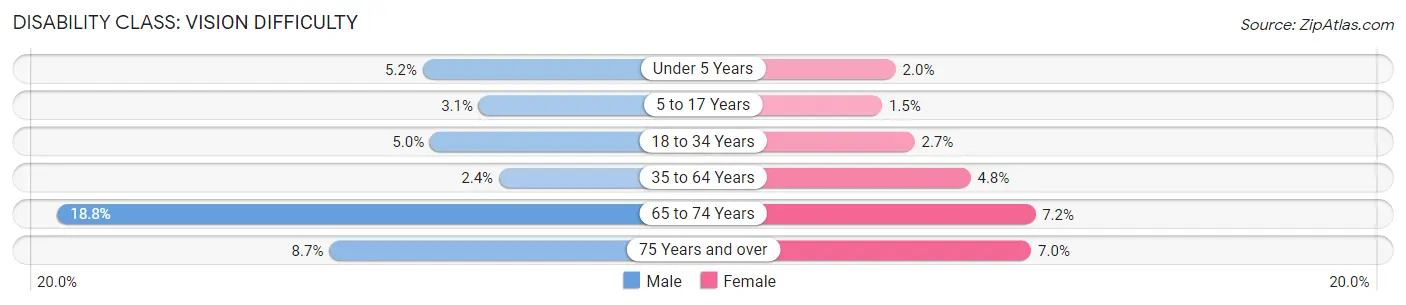
| Age Bracket | Male | Female |
| Under 5 Years | 32 (5.2%) | 10 (2.0%) |
| 5 to 17 Years | 51 (3.1%) | 24 (1.5%) |
| 18 to 34 Years | 87 (5.0%) | 47 (2.7%) |
| 35 to 64 Years | 72 (2.4%) | 161 (4.8%) |
| 65 to 74 Years | 145 (18.8%) | 61 (7.2%) |
| 75 Years and over | 37 (8.7%) | 45 (7.0%) |
Disability Class: Cognitive Difficulty

| Age Bracket | Male | Female |
| 5 to 17 Years | 184 (11.3%) | 160 (9.9%) |
| 18 to 34 Years | 45 (2.6%) | 78 (4.5%) |
| 35 to 64 Years | 31 (1.0%) | 134 (4.0%) |
| 65 to 74 Years | 96 (12.4%) | 55 (6.5%) |
| 75 Years and over | 111 (26.1%) | 123 (19.2%) |
Disability Class: Ambulatory Difficulty
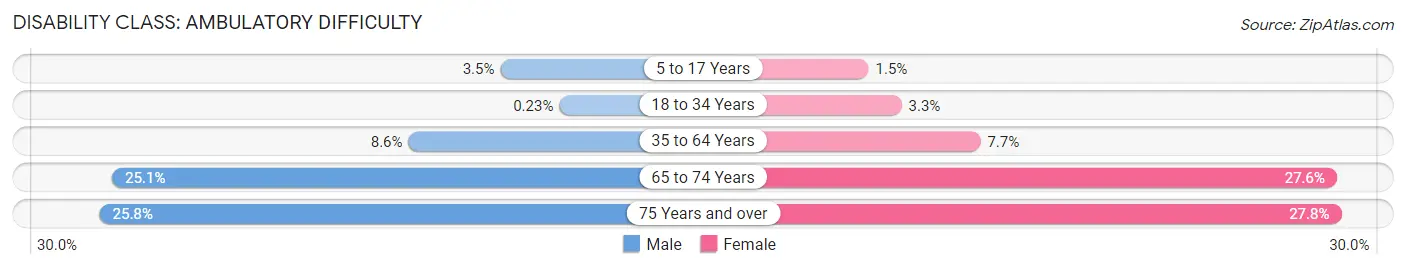
| Age Bracket | Male | Female |
| 5 to 17 Years | 57 (3.5%) | 24 (1.5%) |
| 18 to 34 Years | 4 (0.2%) | 58 (3.3%) |
| 35 to 64 Years | 260 (8.6%) | 260 (7.7%) |
| 65 to 74 Years | 194 (25.1%) | 234 (27.6%) |
| 75 Years and over | 110 (25.8%) | 178 (27.8%) |
Disability Class: Self-Care Difficulty
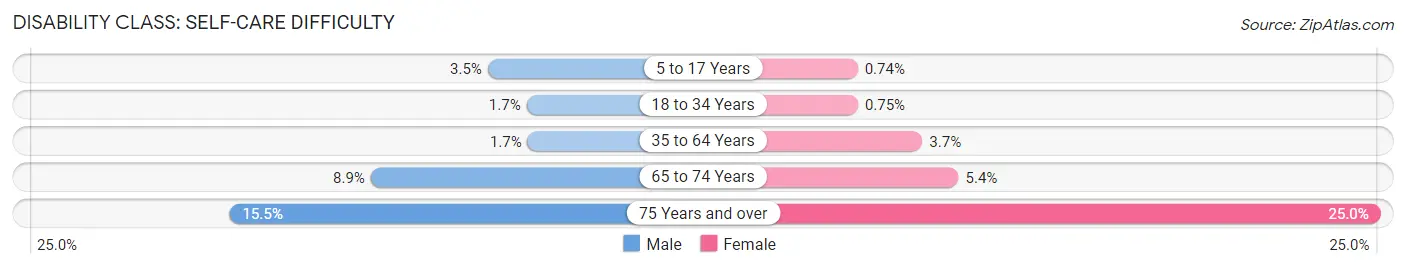
| Age Bracket | Male | Female |
| 5 to 17 Years | 57 (3.5%) | 12 (0.7%) |
| 18 to 34 Years | 30 (1.7%) | 13 (0.7%) |
| 35 to 64 Years | 50 (1.7%) | 126 (3.7%) |
| 65 to 74 Years | 69 (8.9%) | 46 (5.4%) |
| 75 Years and over | 66 (15.5%) | 160 (25.0%) |
Technology Access in Cook County
Computing Device Access in Cook County
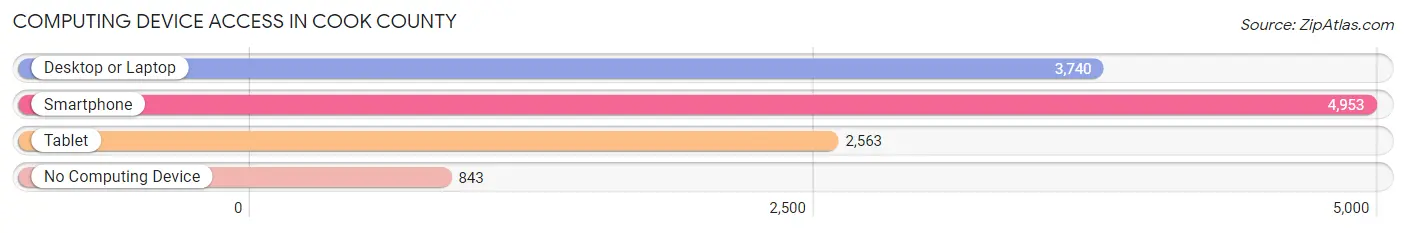
| Device Type | # Households | % Households |
| Desktop or Laptop | 3,740 | 61.2% |
| Smartphone | 4,953 | 81.0% |
| Tablet | 2,563 | 41.9% |
| No Computing Device | 843 | 13.8% |
| Total | 6,116 | 100.0% |
Internet Access in Cook County

| Internet Type | # Households | % Households |
| Dial-Up Internet | 14 | 0.2% |
| Broadband Home | 3,242 | 53.0% |
| Cellular Data Only | 883 | 14.4% |
| Satellite Internet | 547 | 8.9% |
| No Internet | 1,614 | 26.4% |
| Total | 6,116 | 100.0% |
Cook County Summary
County History
Cook County, Georgia is located in the southeastern part of the state and is part of the Valdosta Metropolitan Statistical Area. The county was created in 1918 from parts of Berrien and Lowndes counties and was named for General Philip Cook, a Confederate general from Georgia. The county seat is Adel, which was named for Adeline Smith, the daughter of a local landowner.
The area that is now Cook County was originally inhabited by the Creek Indians. The first European settlers arrived in the area in the early 1800s, and the county was officially established in 1918. The county was largely agricultural, with cotton and peanuts being the main crops. The county also had a thriving timber industry, and the town of Sparks was once the largest timber producer in the state.
The county experienced significant growth in the late 20th century, as the population increased from around 10,000 in 1970 to over 20,000 in 2000. This growth was largely due to the influx of retirees and other people seeking a rural lifestyle.
Geography
Cook County is located in the southeastern part of the state, and is bordered by Berrien County to the north, Lowndes County to the east, Tift County to the south, and Irwin County to the west. The county covers an area of 441 square miles, and is mostly rural, with the majority of the land being used for agriculture. The county is located in the Coastal Plain region of Georgia, and is characterized by flat terrain and sandy soils. The county is drained by the Alapaha River, which flows through the county from north to south.
The county seat is Adel, which is located in the center of the county. Other towns in the county include Sparks, Cecil, and Lenox.
Economy
Cook County’s economy is largely based on agriculture, with cotton and peanuts being the main crops. The county also has a thriving timber industry, and the town of Sparks is one of the largest timber producers in the state.
The county also has a growing tourism industry, with several popular attractions, including the Georgia Museum of Agriculture and Historic Village, the Sparks Museum and Cultural Center, and the Lenox Wildlife Management Area.
Demographics
As of the 2010 census, the population of Cook County was 21,937, an increase of 11.3% from the 2000 census. The population is spread out with a median age of 38.7 years. The racial makeup of the county is 73.3% White, 22.2% African American, 0.4% Native American, 0.7% Asian, 0.1% Pacific Islander, 1.7% from other races, and 1.6% from two or more races.
The median household income in the county is $37,845, and the median family income is $45,945. The per capita income is $18,945. The poverty rate is 19.3%, and the unemployment rate is 6.2%.
Conclusion
Cook County, Georgia is a rural county located in the southeastern part of the state. The county was created in 1918 and is largely agricultural, with cotton and peanuts being the main crops. The county also has a thriving timber industry, and the town of Sparks is one of the largest timber producers in the state. The county has experienced significant growth in the late 20th century, and the population is now over 21,000. The economy is largely based on agriculture, with a growing tourism industry. The population is mostly white, with a median age of 38.7 years. The median household income is $37,845, and the poverty rate is 19.3%.
Common Questions
What is the Total Population of Cook County?
Total Population of Cook County is 17,242.
What is the Total Male Population of Cook County?
Total Male Population of Cook County is 8,337.
What is the Total Female Population of Cook County?
Total Female Population of Cook County is 8,905.
What is the Ratio of Males per 100 Females in Cook County?
There are 93.62 Males per 100 Females in Cook County.
What is the Ratio of Females per 100 Males in Cook County?
There are 106.81 Females per 100 Males in Cook County.
What is the Median Population Age in Cook County?
Median Population Age in Cook County is 37.3 Years.
What is the Average Family Size in Cook County
Average Family Size in Cook County is 3.4 People.
What is the Average Household Size in Cook County
Average Household Size in Cook County is 2.8 People.
What is Per Capita Income in Cook County?
Per Capita income in Cook County is $24,060.
What is the Median Family Income in Cook County?
Median Family Income in Cook County is $54,115.
What is the Median Household income in Cook County?
Median Household Income in Cook County is $46,706.
What is Income or Wage Gap in Cook County?
Income or Wage Gap in Cook County is 32.4%.
Women in Cook County earn 67.6 cents for every dollar earned by a man.
What is Family Income Deficit in Cook County?
Family Income Deficit in Cook County is $10,926.
Families that are below poverty line in Cook County earn $10,926 less on average than the poverty threshold level.
What is Inequality or Gini Index in Cook County?
Inequality or Gini Index in Cook County is 0.49.
How Large is the Labor Force in Cook County?
There are 8,182 People in the Labor Forcein in Cook County.
What is the Percentage of People in the Labor Force in Cook County?
61.1% of People are in the Labor Force in Cook County.
What is the Unemployment Rate in Cook County?
Unemployment Rate in Cook County is 5.5%.