Chattooga County, GA
Chattooga County Map

Chattooga County Overview
24,902
TOTAL POPULATION
12,763
MALE POPULATION
12,139
FEMALE POPULATION
105.14
MALES / 100 FEMALES
95.11
FEMALES / 100 MALES
40.2
MEDIAN AGE
3.1
AVG FAMILY SIZE
2.5
AVG HOUSEHOLD SIZE
$21,576
PER CAPITA INCOME
$50,661
AVG FAMILY INCOME
$43,556
AVG HOUSEHOLD INCOME
26.1%
WAGE / INCOME GAP [ % ]
73.9¢/ $1
WAGE / INCOME GAP [ $ ]
$9,473
FAMILY INCOME DEFICIT
0.42
INEQUALITY / GINI INDEX
9,613
LABOR FORCE [ PEOPLE ]
48.5%
PERCENT IN LABOR FORCE
4.7%
UNEMPLOYMENT RATE
Chattooga County Area Codes
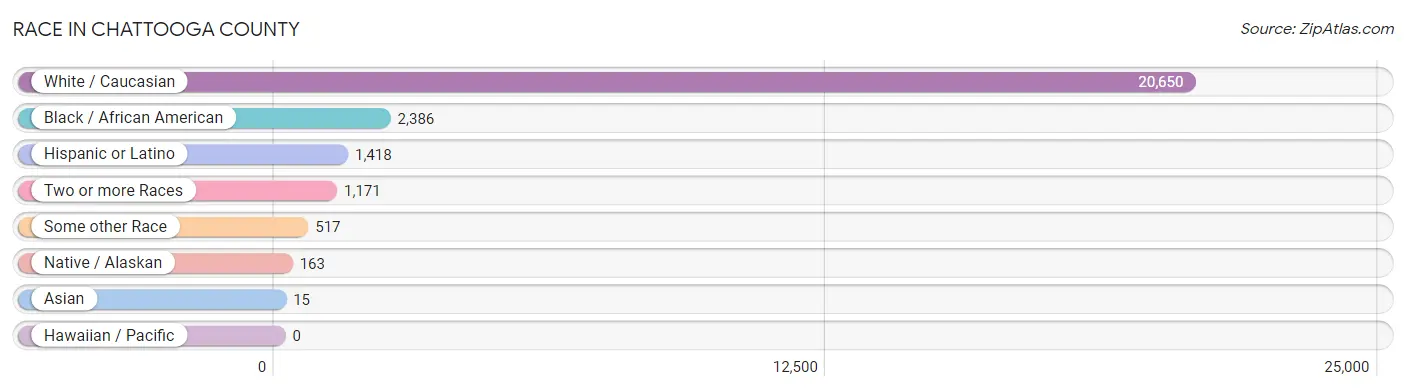
Race in Chattooga County
The most populous races in Chattooga County are White / Caucasian (20,650 | 82.9%), Black / African American (2,386 | 9.6%), and Hispanic or Latino (1,418 | 5.7%).
| Race | # Population | % Population |
| Asian | 15 | 0.1% |
| Black / African American | 2,386 | 9.6% |
| Hawaiian / Pacific | 0 | 0.0% |
| Hispanic or Latino | 1,418 | 5.7% |
| Native / Alaskan | 163 | 0.6% |
| White / Caucasian | 20,650 | 82.9% |
| Two or more Races | 1,171 | 4.7% |
| Some other Race | 517 | 2.1% |
| Total | 24,902 | 100.0% |
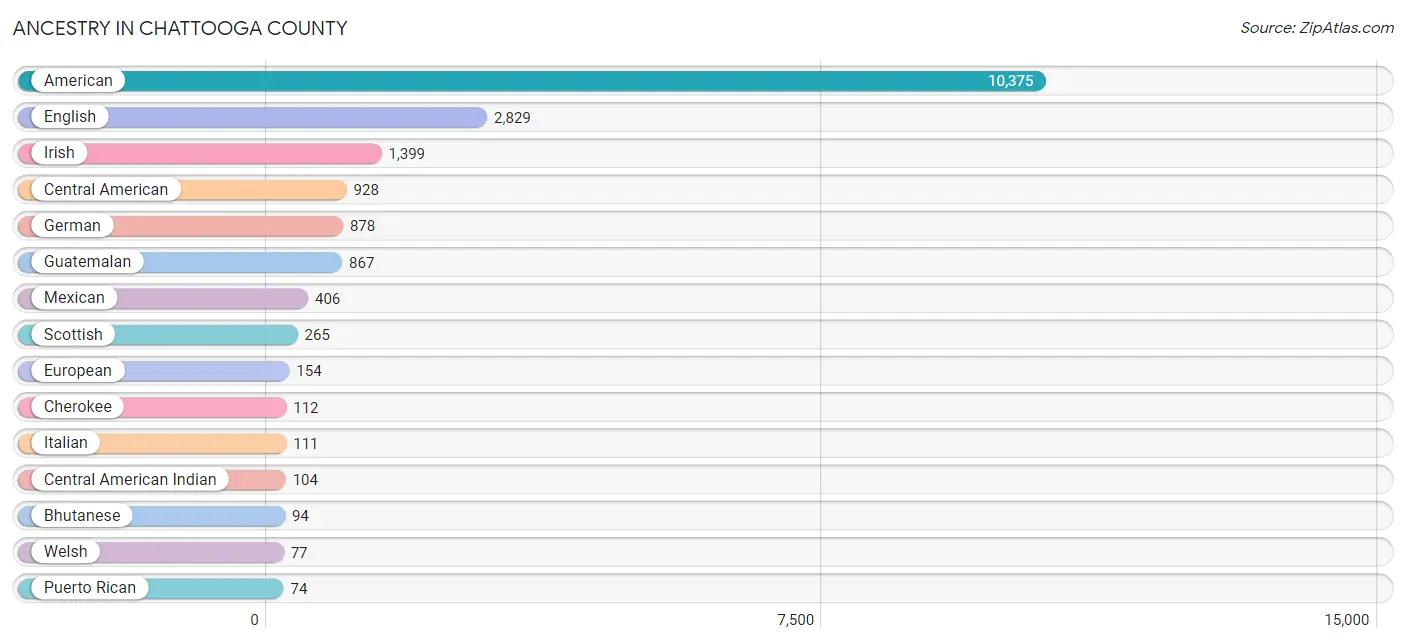
Ancestry in Chattooga County
The most populous ancestries reported in Chattooga County are American (10,375 | 41.7%), English (2,829 | 11.4%), Irish (1,399 | 5.6%), Central American (928 | 3.7%), and German (878 | 3.5%), together accounting for 65.9% of all Chattooga County residents.
| Ancestry | # Population | % Population |
| African | 15 | 0.1% |
| American | 10,375 | 41.7% |
| Arab | 32 | 0.1% |
| Armenian | 6 | 0.0% |
| Australian | 14 | 0.1% |
| Bhutanese | 94 | 0.4% |
| Blackfeet | 1 | 0.0% |
| British | 54 | 0.2% |
| Burmese | 4 | 0.0% |
| Cajun | 23 | 0.1% |
| Central American | 928 | 3.7% |
| Central American Indian | 104 | 0.4% |
| Cherokee | 112 | 0.4% |
| Chippewa | 1 | 0.0% |
| Choctaw | 1 | 0.0% |
| Dutch | 35 | 0.1% |
| Eastern European | 12 | 0.1% |
| English | 2,829 | 11.4% |
| European | 154 | 0.6% |
| French | 64 | 0.3% |
| French Canadian | 3 | 0.0% |
| German | 878 | 3.5% |
| Guatemalan | 867 | 3.5% |
| Hungarian | 13 | 0.1% |
| Irish | 1,399 | 5.6% |
| Israeli | 17 | 0.1% |
| Italian | 111 | 0.4% |
| Jamaican | 9 | 0.0% |
| Lithuanian | 7 | 0.0% |
| Mexican | 406 | 1.6% |
| Mexican American Indian | 10 | 0.0% |
| Northern European | 5 | 0.0% |
| Norwegian | 27 | 0.1% |
| Panamanian | 6 | 0.0% |
| Polish | 17 | 0.1% |
| Puerto Rican | 74 | 0.3% |
| Russian | 59 | 0.2% |
| Salvadoran | 55 | 0.2% |
| Scotch-Irish | 73 | 0.3% |
| Scottish | 265 | 1.1% |
| Spaniard | 9 | 0.0% |
| Sri Lankan | 10 | 0.0% |
| Subsaharan African | 15 | 0.1% |
| Swedish | 18 | 0.1% |
| Syrian | 32 | 0.1% |
| Trinidadian and Tobagonian | 3 | 0.0% |
| Ukrainian | 55 | 0.2% |
| Welsh | 77 | 0.3% |
| Yugoslavian | 25 | 0.1% |
| Yup'ik | 6 | 0.0% | View All 50 Rows |
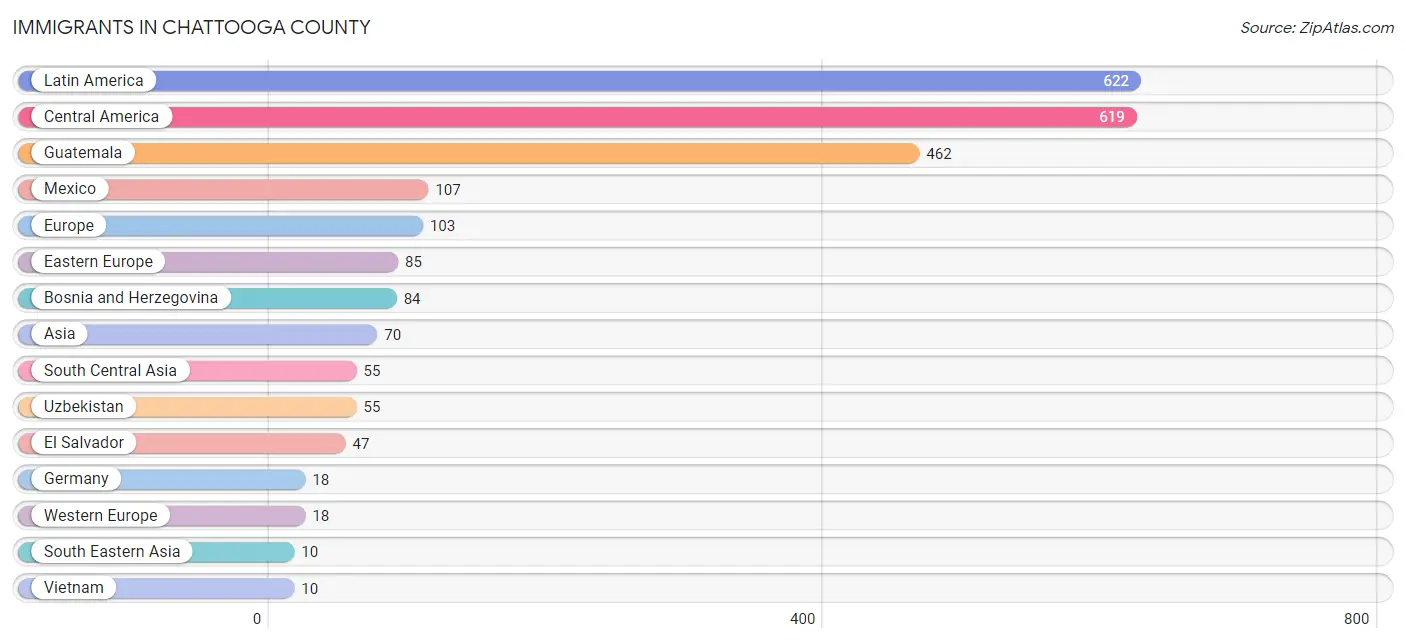
Immigrants in Chattooga County
The most numerous immigrant groups reported in Chattooga County came from Latin America (622 | 2.5%), Central America (619 | 2.5%), Guatemala (462 | 1.9%), Mexico (107 | 0.4%), and Europe (103 | 0.4%), together accounting for 7.7% of all Chattooga County residents.
| Immigration Origin | # Population | % Population |
| Asia | 70 | 0.3% |
| Bosnia and Herzegovina | 84 | 0.3% |
| Canada | 1 | 0.0% |
| Caribbean | 3 | 0.0% |
| Central America | 619 | 2.5% |
| Eastern Asia | 5 | 0.0% |
| Eastern Europe | 85 | 0.3% |
| El Salvador | 47 | 0.2% |
| Europe | 103 | 0.4% |
| Germany | 18 | 0.1% |
| Guatemala | 462 | 1.9% |
| Jamaica | 3 | 0.0% |
| Japan | 1 | 0.0% |
| Korea | 4 | 0.0% |
| Latin America | 622 | 2.5% |
| Mexico | 107 | 0.4% |
| Panama | 3 | 0.0% |
| Russia | 1 | 0.0% |
| South Central Asia | 55 | 0.2% |
| South Eastern Asia | 10 | 0.0% |
| Uzbekistan | 55 | 0.2% |
| Vietnam | 10 | 0.0% |
| Western Europe | 18 | 0.1% | View All 23 Rows |
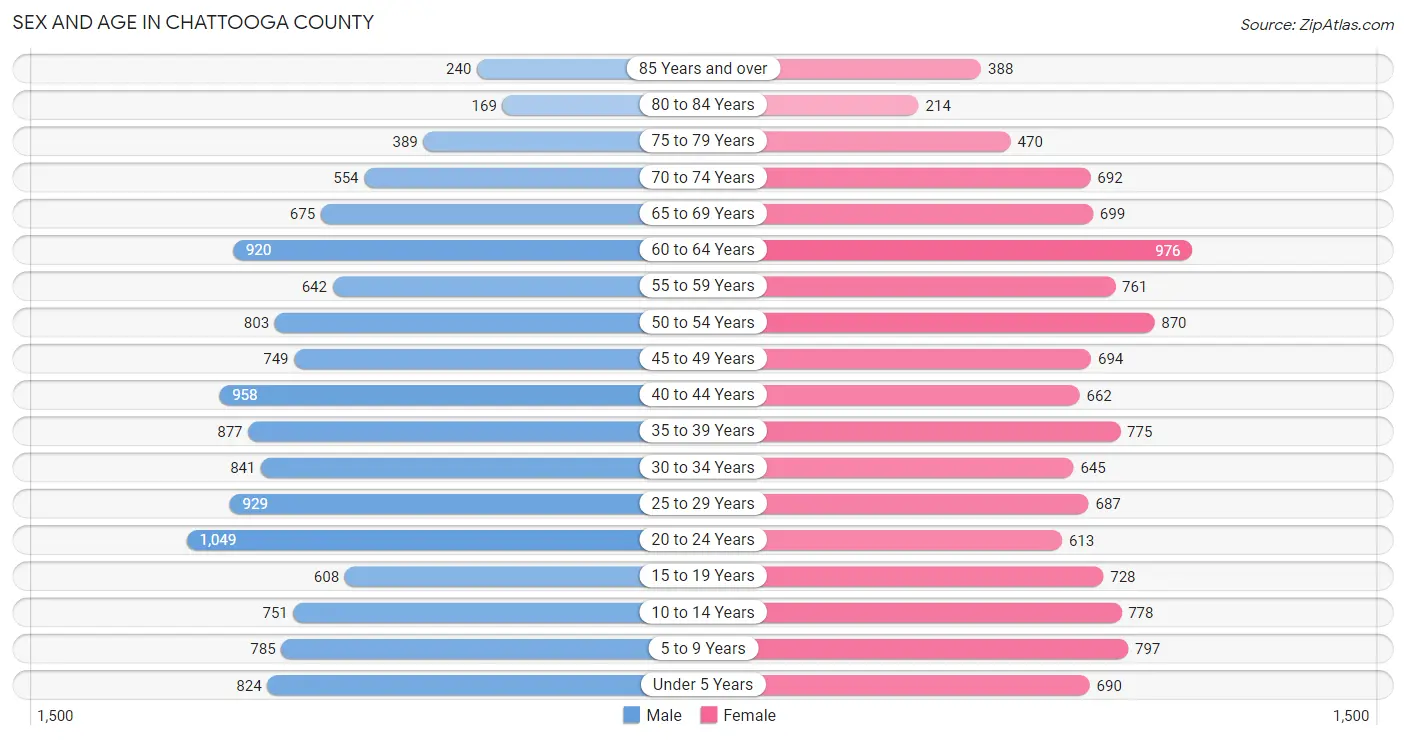
Sex and Age in Chattooga County
Sex and Age in Chattooga County
The most populous age groups in Chattooga County are 20 to 24 Years (1,049 | 8.2%) for men and 60 to 64 Years (976 | 8.0%) for women.
| Age Bracket | Male | Female |
| Under 5 Years | 824 (6.5%) | 690 (5.7%) |
| 5 to 9 Years | 785 (6.1%) | 797 (6.6%) |
| 10 to 14 Years | 751 (5.9%) | 778 (6.4%) |
| 15 to 19 Years | 608 (4.8%) | 728 (6.0%) |
| 20 to 24 Years | 1,049 (8.2%) | 613 (5.1%) |
| 25 to 29 Years | 929 (7.3%) | 687 (5.7%) |
| 30 to 34 Years | 841 (6.6%) | 645 (5.3%) |
| 35 to 39 Years | 877 (6.9%) | 775 (6.4%) |
| 40 to 44 Years | 958 (7.5%) | 662 (5.4%) |
| 45 to 49 Years | 749 (5.9%) | 694 (5.7%) |
| 50 to 54 Years | 803 (6.3%) | 870 (7.2%) |
| 55 to 59 Years | 642 (5.0%) | 761 (6.3%) |
| 60 to 64 Years | 920 (7.2%) | 976 (8.0%) |
| 65 to 69 Years | 675 (5.3%) | 699 (5.8%) |
| 70 to 74 Years | 554 (4.3%) | 692 (5.7%) |
| 75 to 79 Years | 389 (3.0%) | 470 (3.9%) |
| 80 to 84 Years | 169 (1.3%) | 214 (1.8%) |
| 85 Years and over | 240 (1.9%) | 388 (3.2%) |
| Total | 12,763 (100.0%) | 12,139 (100.0%) |
Families and Households in Chattooga County
Median Family Size in Chattooga County
The median family size in Chattooga County is 3.13 persons per family, with single male/father families (654 | 11.0%) accounting for the largest median family size of 3.2 persons per family. On the other hand, single female/mother families (1,378 | 23.2%) represent the smallest median family size with 2.97 persons per family.

| Family Type | # Families | Family Size |
| Married-Couple | 3,909 (65.8%) | 3.17 |
| Single Male/Father | 654 (11.0%) | 3.20 |
| Single Female/Mother | 1,378 (23.2%) | 2.97 |
| Total Families | 5,941 (100.0%) | 3.13 |
Median Household Size in Chattooga County
The median household size in Chattooga County is 2.50 persons per household, with single male/father households (654 | 7.0%) accounting for the largest median household size of 4.04 persons per household. non-family households (3,351 | 36.1%) represent the smallest median household size with 1.15 persons per household.
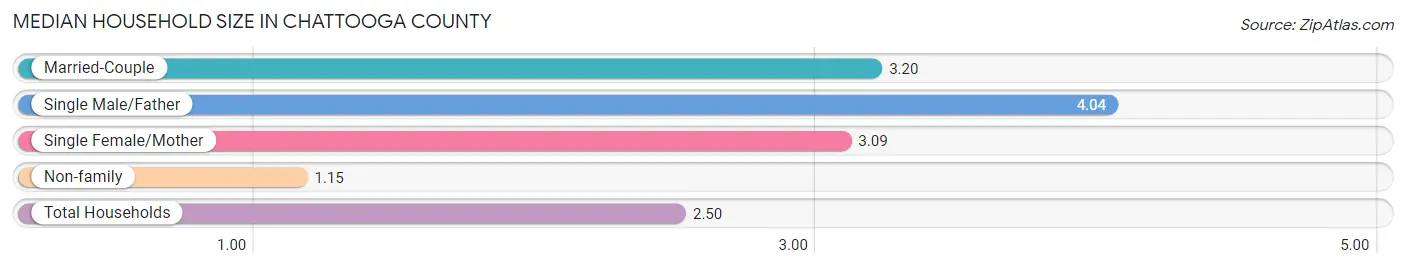
| Household Type | # Households | Household Size |
| Married-Couple | 3,909 (42.1%) | 3.20 |
| Single Male/Father | 654 (7.0%) | 4.04 |
| Single Female/Mother | 1,378 (14.8%) | 3.09 |
| Non-family | 3,351 (36.1%) | 1.15 |
| Total Households | 9,292 (100.0%) | 2.50 |
Household Size by Marriage Status in Chattooga County
Out of a total of 9,292 households in Chattooga County, 5,941 (63.9%) are family households, while 3,351 (36.1%) are nonfamily households. The most numerous type of family households are 2-person households, comprising 2,770, and the most common type of nonfamily households are 1-person households, comprising 3,108.
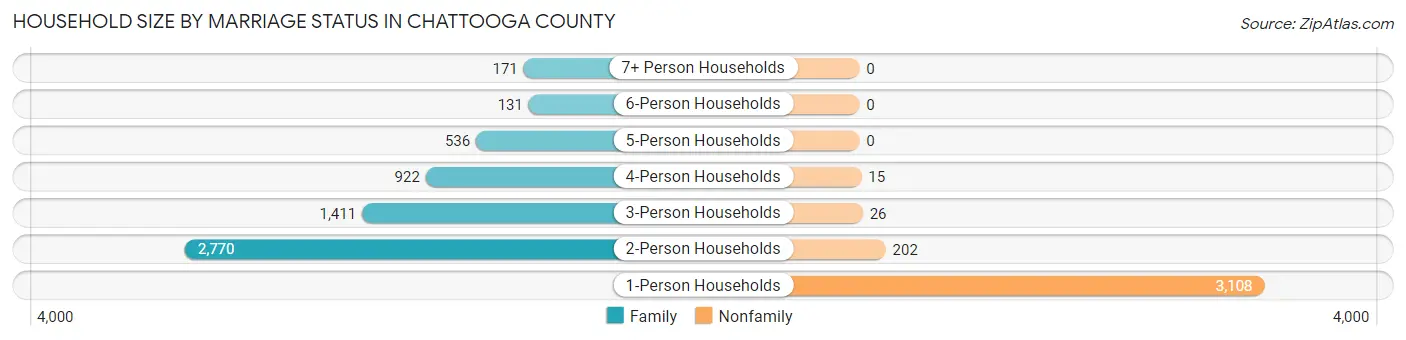
| Household Size | Family Households | Nonfamily Households |
| 1-Person Households | - | 3,108 (33.5%) |
| 2-Person Households | 2,770 (29.8%) | 202 (2.2%) |
| 3-Person Households | 1,411 (15.2%) | 26 (0.3%) |
| 4-Person Households | 922 (9.9%) | 15 (0.2%) |
| 5-Person Households | 536 (5.8%) | 0 (0.0%) |
| 6-Person Households | 131 (1.4%) | 0 (0.0%) |
| 7+ Person Households | 171 (1.8%) | 0 (0.0%) |
| Total | 5,941 (63.9%) | 3,351 (36.1%) |
Female Fertility in Chattooga County
Fertility by Age in Chattooga County
Average fertility rate in Chattooga County is 76.0 births per 1,000 women. Women in the age bracket of 20 to 34 years have the highest fertility rate with 171.0 births per 1,000 women. Women in the age bracket of 20 to 34 years acount for 88.5% of all women with births.
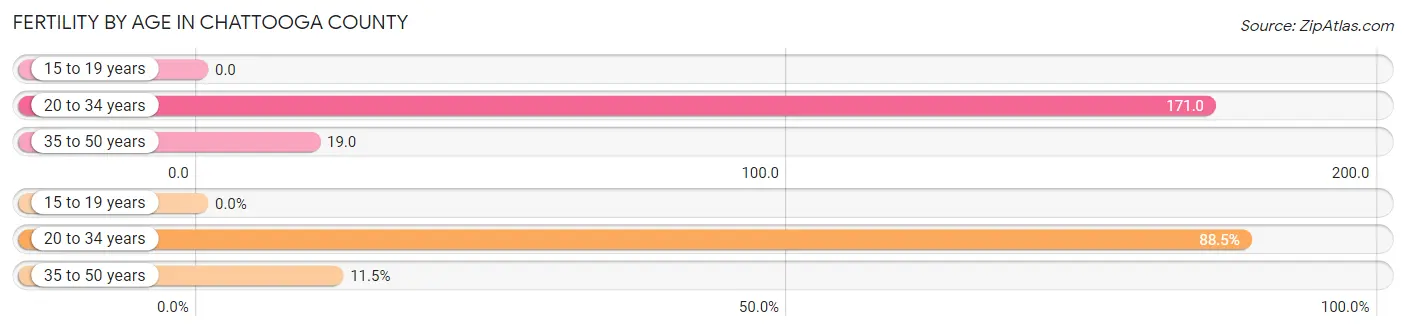
| Age Bracket | Women with Births | Births / 1,000 Women |
| 15 to 19 years | 0 (0.0%) | 0.0 |
| 20 to 34 years | 332 (88.5%) | 171.0 |
| 35 to 50 years | 43 (11.5%) | 19.0 |
| Total | 375 (100.0%) | 76.0 |
Fertility by Age by Marriage Status in Chattooga County
61.9% of women with births (375) in Chattooga County are married. The highest percentage of unmarried women with births falls into 20 to 34 years age bracket with 43.1% of them unmarried at the time of birth, while the lowest percentage of unmarried women with births belong to 35 to 50 years age bracket with 0.0% of them unmarried.

| Age Bracket | Married | Unmarried |
| 15 to 19 years | 0 (0.0%) | 0 (0.0%) |
| 20 to 34 years | 189 (56.9%) | 143 (43.1%) |
| 35 to 50 years | 43 (100.0%) | 0 (0.0%) |
| Total | 232 (61.9%) | 143 (38.1%) |
Fertility by Education in Chattooga County
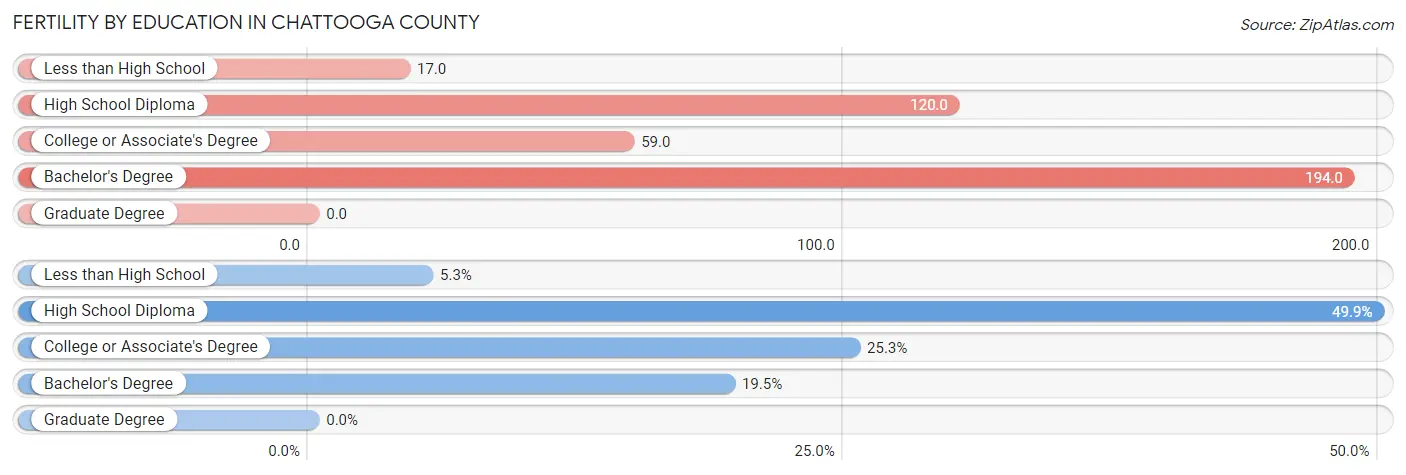
| Educational Attainment | Women with Births | Births / 1,000 Women |
| Less than High School | 20 (5.3%) | 17.0 |
| High School Diploma | 187 (49.9%) | 120.0 |
| College or Associate's Degree | 95 (25.3%) | 59.0 |
| Bachelor's Degree | 73 (19.5%) | 194.0 |
| Graduate Degree | 0 (0.0%) | 0.0 |
| Total | 375 (100.0%) | 76.0 |
Fertility by Education by Marriage Status in Chattooga County
38.1% of women with births in Chattooga County are unmarried. Women with the educational attainment of bachelor's degree are most likely to be married with 100.0% of them married at childbirth, while women with the educational attainment of high school diploma are least likely to be married with 62.6% of them unmarried at childbirth.
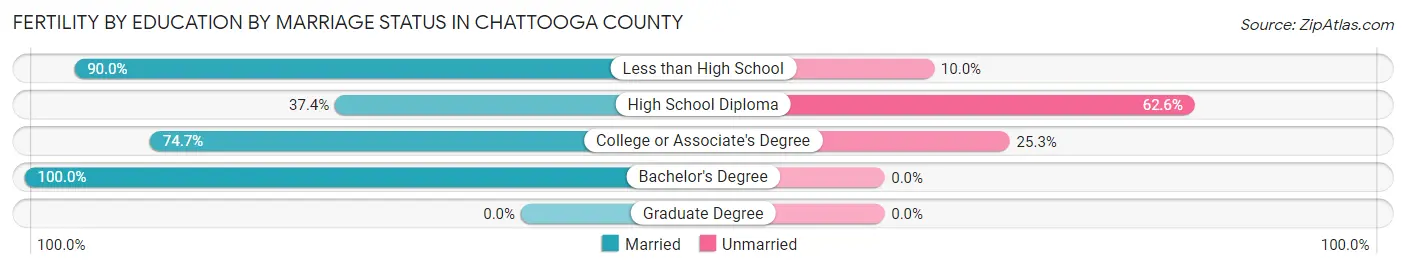
| Educational Attainment | Married | Unmarried |
| Less than High School | 18 (90.0%) | 2 (10.0%) |
| High School Diploma | 70 (37.4%) | 117 (62.6%) |
| College or Associate's Degree | 71 (74.7%) | 24 (25.3%) |
| Bachelor's Degree | 73 (100.0%) | 0 (0.0%) |
| Graduate Degree | 0 (0.0%) | 0 (0.0%) |
| Total | 232 (61.9%) | 143 (38.1%) |
Income in Chattooga County
Income Overview in Chattooga County
Per Capita Income in Chattooga County is $21,576, while median incomes of families and households are $50,661 and $43,556 respectively.
| Characteristic | Number | Measure |
| Per Capita Income | 24,902 | $21,576 |
| Median Family Income | 5,941 | $50,661 |
| Mean Family Income | 5,941 | $64,712 |
| Median Household Income | 9,292 | $43,556 |
| Mean Household Income | 9,292 | $54,605 |
| Income Deficit | 5,941 | $9,473 |
| Wage / Income Gap (%) | 24,902 | 26.06% |
| Wage / Income Gap ($) | 24,902 | 73.94¢ per $1 |
| Gini / Inequality Index | 24,902 | 0.42 |
Earnings by Sex in Chattooga County
Average Earnings in Chattooga County are $32,474, $35,749 for men and $26,434 for women, a difference of 26.1%.
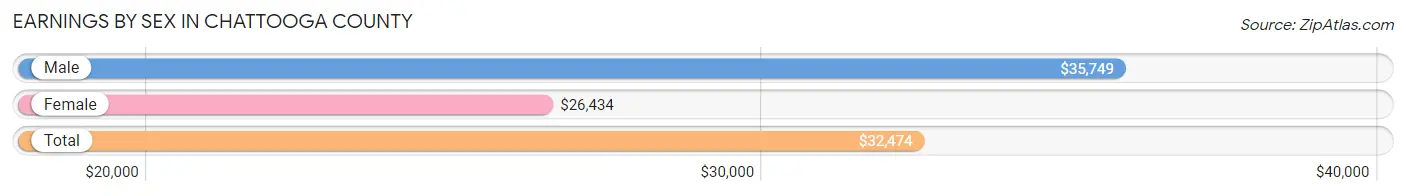
| Sex | Number | Average Earnings |
| Male | 5,150 (51.3%) | $35,749 |
| Female | 4,887 (48.7%) | $26,434 |
| Total | 10,037 (100.0%) | $32,474 |
Earnings by Sex by Income Bracket in Chattooga County
The most common earnings brackets in Chattooga County are $35,000 to $39,999 for men (565 | 11.0%) and $30,000 to $34,999 for women (506 | 10.3%).
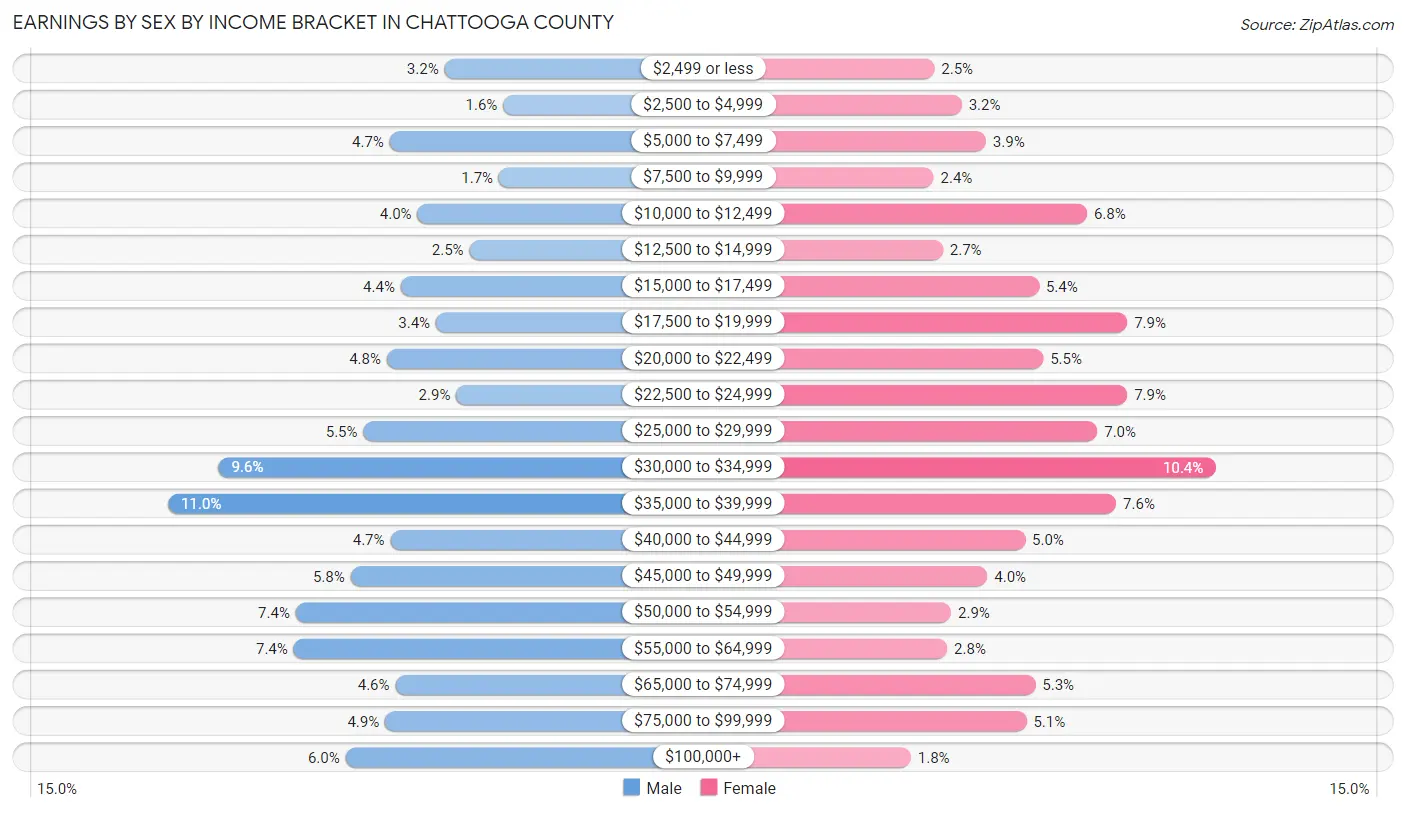
| Income | Male | Female |
| $2,499 or less | 165 (3.2%) | 120 (2.5%) |
| $2,500 to $4,999 | 80 (1.5%) | 158 (3.2%) |
| $5,000 to $7,499 | 244 (4.7%) | 191 (3.9%) |
| $7,500 to $9,999 | 86 (1.7%) | 119 (2.4%) |
| $10,000 to $12,499 | 204 (4.0%) | 330 (6.8%) |
| $12,500 to $14,999 | 129 (2.5%) | 132 (2.7%) |
| $15,000 to $17,499 | 228 (4.4%) | 264 (5.4%) |
| $17,500 to $19,999 | 177 (3.4%) | 385 (7.9%) |
| $20,000 to $22,499 | 248 (4.8%) | 270 (5.5%) |
| $22,500 to $24,999 | 148 (2.9%) | 385 (7.9%) |
| $25,000 to $29,999 | 282 (5.5%) | 344 (7.0%) |
| $30,000 to $34,999 | 492 (9.6%) | 506 (10.3%) |
| $35,000 to $39,999 | 565 (11.0%) | 370 (7.6%) |
| $40,000 to $44,999 | 243 (4.7%) | 245 (5.0%) |
| $45,000 to $49,999 | 301 (5.8%) | 193 (4.0%) |
| $50,000 to $54,999 | 380 (7.4%) | 143 (2.9%) |
| $55,000 to $64,999 | 383 (7.4%) | 138 (2.8%) |
| $65,000 to $74,999 | 236 (4.6%) | 259 (5.3%) |
| $75,000 to $99,999 | 251 (4.9%) | 247 (5.1%) |
| $100,000+ | 308 (6.0%) | 88 (1.8%) |
| Total | 5,150 (100.0%) | 4,887 (100.0%) |
Earnings by Sex by Educational Attainment in Chattooga County
Average earnings in Chattooga County are $39,194 for men and $29,900 for women, a difference of 23.7%. Men with an educational attainment of graduate degree enjoy the highest average annual earnings of $118,897, while those with less than high school education earn the least with $27,900. Women with an educational attainment of graduate degree earn the most with the average annual earnings of $73,438, while those with less than high school education have the smallest earnings of $21,803.

| Educational Attainment | Male Income | Female Income |
| Less than High School | $27,900 | $21,803 |
| High School Diploma | $36,124 | $23,934 |
| College or Associate's Degree | $49,490 | $34,670 |
| Bachelor's Degree | $59,745 | $34,476 |
| Graduate Degree | $118,897 | $73,438 |
| Total | $39,194 | $29,900 |
Family Income in Chattooga County
Family Income Brackets in Chattooga County
According to the Chattooga County family income data, there are 1,360 families falling into the $50,000 to $74,999 income range, which is the most common income bracket and makes up 22.9% of all families. Conversely, the $200,000+ income bracket is the least frequent group with only 101 families (1.7%) belonging to this category.
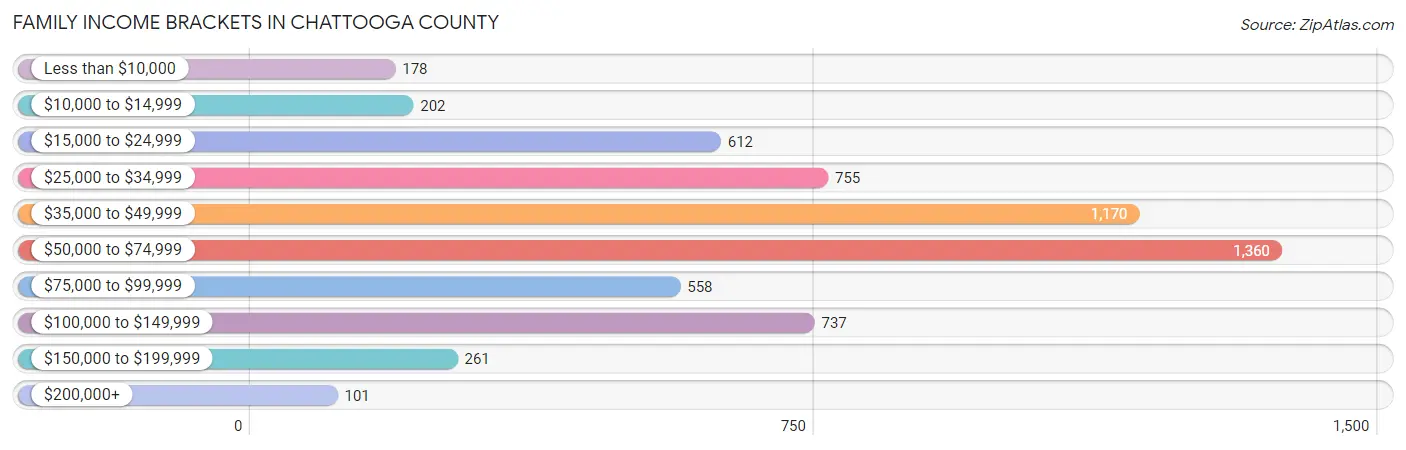
| Income Bracket | # Families | % Families |
| Less than $10,000 | 178 | 3.0% |
| $10,000 to $14,999 | 202 | 3.4% |
| $15,000 to $24,999 | 612 | 10.3% |
| $25,000 to $34,999 | 755 | 12.7% |
| $35,000 to $49,999 | 1,170 | 19.7% |
| $50,000 to $74,999 | 1,360 | 22.9% |
| $75,000 to $99,999 | 558 | 9.4% |
| $100,000 to $149,999 | 737 | 12.4% |
| $150,000 to $199,999 | 261 | 4.4% |
| $200,000+ | 101 | 1.7% |
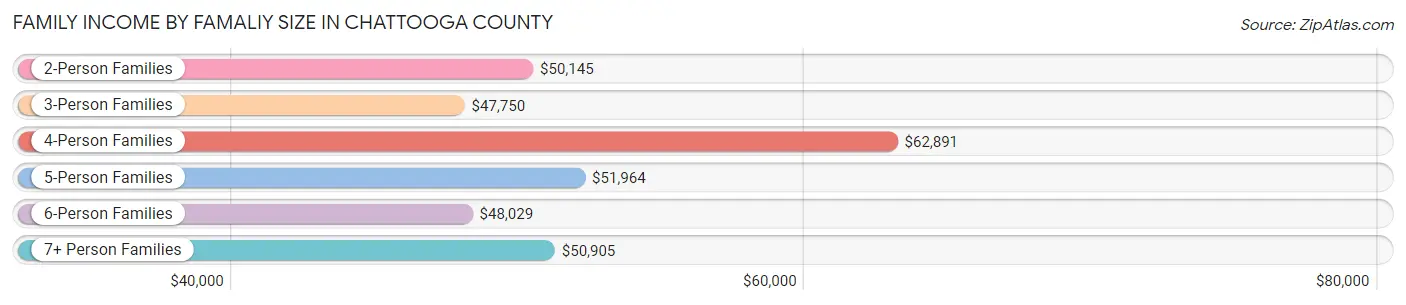
Family Income by Famaliy Size in Chattooga County
4-person families (821 | 13.8%) account for the highest median family income in Chattooga County with $62,891 per family, while 2-person families (3,001 | 50.5%) have the highest median income of $25,072 per family member.
| Income Bracket | # Families | Median Income |
| 2-Person Families | 3,001 (50.5%) | $50,145 |
| 3-Person Families | 1,384 (23.3%) | $47,750 |
| 4-Person Families | 821 (13.8%) | $62,891 |
| 5-Person Families | 511 (8.6%) | $51,964 |
| 6-Person Families | 95 (1.6%) | $48,029 |
| 7+ Person Families | 129 (2.2%) | $50,905 |
| Total | 5,941 (100.0%) | $50,661 |
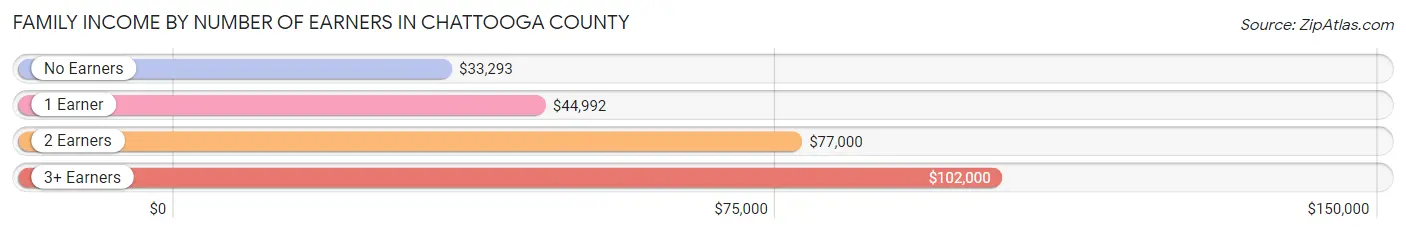
Family Income by Number of Earners in Chattooga County
The median family income in Chattooga County is $50,661, with families comprising 3+ earners (200) having the highest median family income of $102,000, while families with no earners (1,052) have the lowest median family income of $33,293, accounting for 3.4% and 17.7% of families, respectively.
| Number of Earners | # Families | Median Income |
| No Earners | 1,052 (17.7%) | $33,293 |
| 1 Earner | 2,653 (44.7%) | $44,992 |
| 2 Earners | 2,036 (34.3%) | $77,000 |
| 3+ Earners | 200 (3.4%) | $102,000 |
| Total | 5,941 (100.0%) | $50,661 |
Household Income in Chattooga County
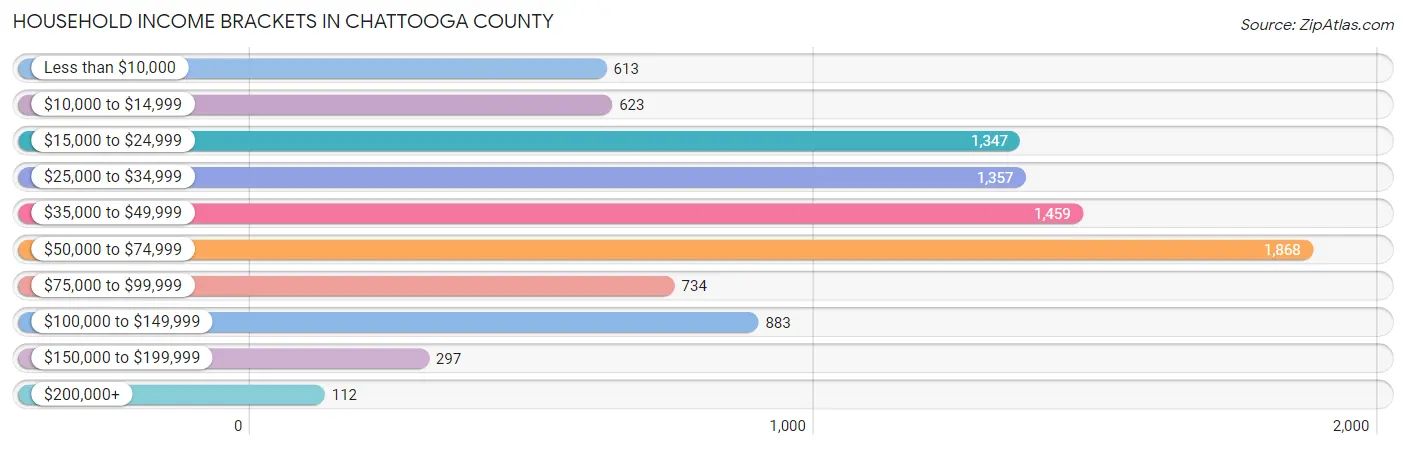
Household Income Brackets in Chattooga County
With 1,868 households falling in the category, the $50,000 to $74,999 income range is the most frequent in Chattooga County, accounting for 20.1% of all households. In contrast, only 112 households (1.2%) fall into the $200,000+ income bracket, making it the least populous group.
| Income Bracket | # Households | % Households |
| Less than $10,000 | 613 | 6.6% |
| $10,000 to $14,999 | 623 | 6.7% |
| $15,000 to $24,999 | 1,347 | 14.5% |
| $25,000 to $34,999 | 1,357 | 14.6% |
| $35,000 to $49,999 | 1,459 | 15.7% |
| $50,000 to $74,999 | 1,868 | 20.1% |
| $75,000 to $99,999 | 734 | 7.9% |
| $100,000 to $149,999 | 883 | 9.5% |
| $150,000 to $199,999 | 297 | 3.2% |
| $200,000+ | 112 | 1.2% |
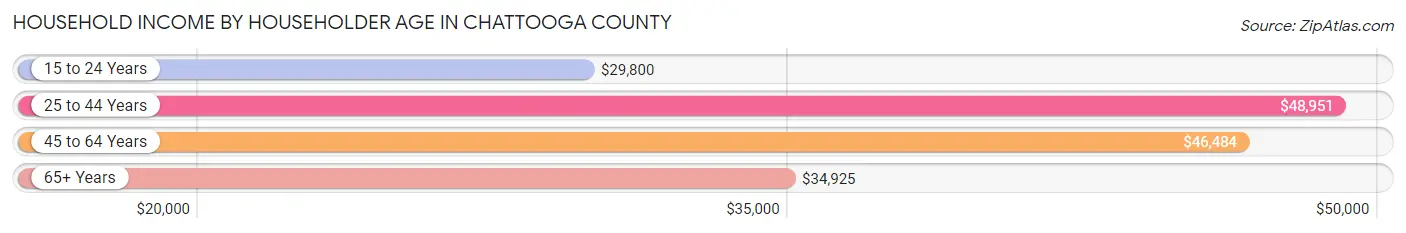
Household Income by Householder Age in Chattooga County
The median household income in Chattooga County is $43,556, with the highest median household income of $48,951 found in the 25 to 44 years age bracket for the primary householder. A total of 2,346 households (25.3%) fall into this category. Meanwhile, the 15 to 24 years age bracket for the primary householder has the lowest median household income of $29,800, with 314 households (3.4%) in this group.
| Income Bracket | # Households | Median Income |
| 15 to 24 Years | 314 (3.4%) | $29,800 |
| 25 to 44 Years | 2,346 (25.3%) | $48,951 |
| 45 to 64 Years | 3,606 (38.8%) | $46,484 |
| 65+ Years | 3,026 (32.6%) | $34,925 |
| Total | 9,292 (100.0%) | $43,556 |
Poverty in Chattooga County
Income Below Poverty by Sex and Age in Chattooga County
With 18.9% poverty level for males and 20.9% for females among the residents of Chattooga County, under 5 year old males and 5 year old females are the most vulnerable to poverty, with 320 males (39.1%) and 107 females (57.2%) in their respective age groups living below the poverty level.

| Age Bracket | Male | Female |
| Under 5 Years | 320 (39.1%) | 224 (34.0%) |
| 5 Years | 41 (22.5%) | 107 (57.2%) |
| 6 to 11 Years | 239 (29.6%) | 259 (30.0%) |
| 12 to 14 Years | 108 (21.6%) | 49 (14.2%) |
| 15 Years | 69 (25.9%) | 23 (12.1%) |
| 16 and 17 Years | 58 (30.7%) | 51 (18.7%) |
| 18 to 24 Years | 317 (31.7%) | 287 (32.7%) |
| 25 to 34 Years | 99 (8.4%) | 411 (30.9%) |
| 35 to 44 Years | 179 (13.1%) | 249 (17.4%) |
| 45 to 54 Years | 219 (15.5%) | 224 (14.4%) |
| 55 to 64 Years | 229 (15.0%) | 346 (20.0%) |
| 65 to 74 Years | 178 (14.8%) | 158 (11.4%) |
| 75 Years and over | 70 (8.9%) | 79 (7.9%) |
| Total | 2,126 (18.9%) | 2,467 (20.9%) |
Income Above Poverty by Sex and Age in Chattooga County
According to the poverty statistics in Chattooga County, males aged 25 to 34 years and females aged 75 years and over are the age groups that are most secure financially, with 91.6% of males and 92.1% of females in these age groups living above the poverty line.
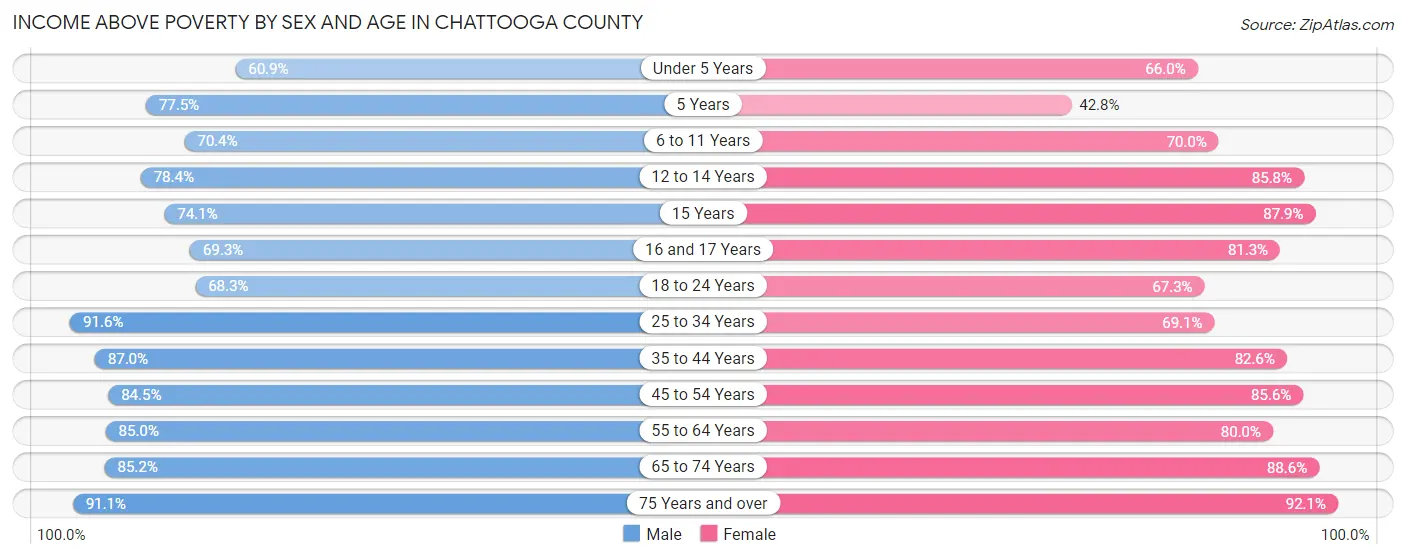
| Age Bracket | Male | Female |
| Under 5 Years | 498 (60.9%) | 435 (66.0%) |
| 5 Years | 141 (77.5%) | 80 (42.8%) |
| 6 to 11 Years | 567 (70.4%) | 603 (70.0%) |
| 12 to 14 Years | 393 (78.4%) | 295 (85.8%) |
| 15 Years | 197 (74.1%) | 167 (87.9%) |
| 16 and 17 Years | 131 (69.3%) | 222 (81.3%) |
| 18 to 24 Years | 684 (68.3%) | 591 (67.3%) |
| 25 to 34 Years | 1,074 (91.6%) | 921 (69.1%) |
| 35 to 44 Years | 1,193 (87.0%) | 1,180 (82.6%) |
| 45 to 54 Years | 1,191 (84.5%) | 1,335 (85.6%) |
| 55 to 64 Years | 1,294 (85.0%) | 1,384 (80.0%) |
| 65 to 74 Years | 1,021 (85.2%) | 1,226 (88.6%) |
| 75 Years and over | 714 (91.1%) | 916 (92.1%) |
| Total | 9,098 (81.1%) | 9,355 (79.1%) |
Income Below Poverty Among Married-Couple Families in Chattooga County
The poverty statistics for married-couple families in Chattooga County show that 7.5% or 295 of the total 3,909 families live below the poverty line. Families with 5 or more children have the highest poverty rate of 82.5%, comprising of 33 families. On the other hand, families with no children have the lowest poverty rate of 3.5%, which includes 90 families.
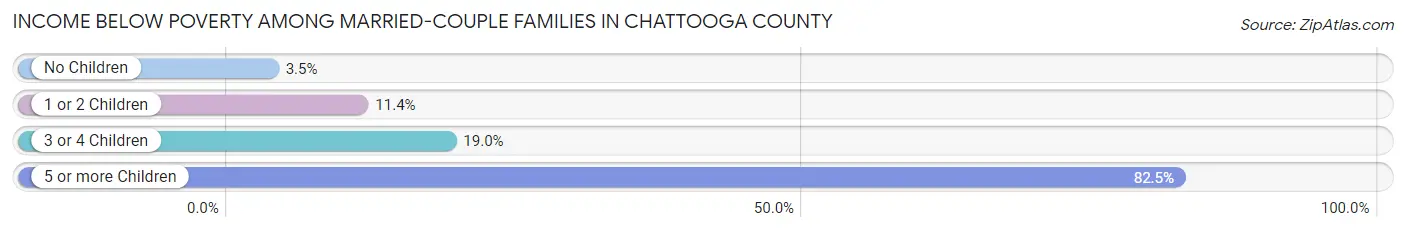
| Children | Above Poverty | Below Poverty |
| No Children | 2,455 (96.5%) | 90 (3.5%) |
| 1 or 2 Children | 922 (88.6%) | 118 (11.4%) |
| 3 or 4 Children | 230 (81.0%) | 54 (19.0%) |
| 5 or more Children | 7 (17.5%) | 33 (82.5%) |
| Total | 3,614 (92.4%) | 295 (7.5%) |
Income Below Poverty Among Single-Parent Households in Chattooga County
According to the poverty data in Chattooga County, 28.1% or 184 single-father households and 34.4% or 474 single-mother households are living below the poverty line. Among single-father households, those with 1 or 2 children have the highest poverty rate, with 149 households (34.3%) experiencing poverty. Likewise, among single-mother households, those with 3 or 4 children have the highest poverty rate, with 199 households (82.2%) falling below the poverty line.
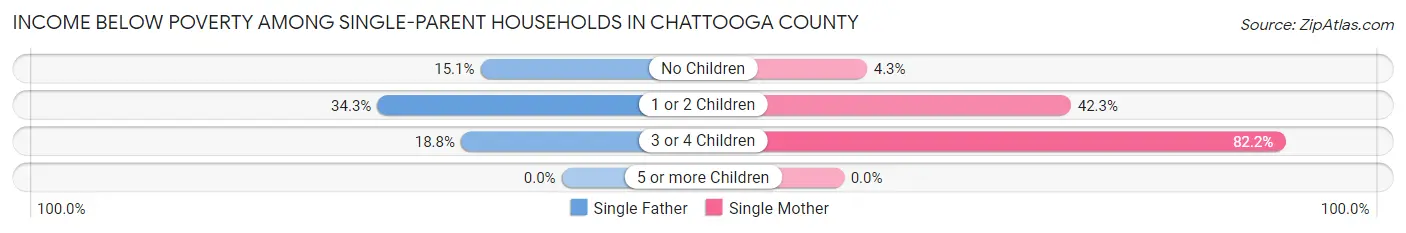
| Children | Single Father | Single Mother |
| No Children | 26 (15.1%) | 22 (4.3%) |
| 1 or 2 Children | 149 (34.3%) | 253 (42.3%) |
| 3 or 4 Children | 9 (18.8%) | 199 (82.2%) |
| 5 or more Children | 0 (0.0%) | 0 (0.0%) |
| Total | 184 (28.1%) | 474 (34.4%) |
Income Below Poverty Among Married-Couple vs Single-Parent Households in Chattooga County
The poverty data for Chattooga County shows that 295 of the married-couple family households (7.5%) and 658 of the single-parent households (32.4%) are living below the poverty level. Within the married-couple family households, those with 5 or more children have the highest poverty rate, with 33 households (82.5%) falling below the poverty line. Among the single-parent households, those with 3 or 4 children have the highest poverty rate, with 208 household (71.7%) living below poverty.
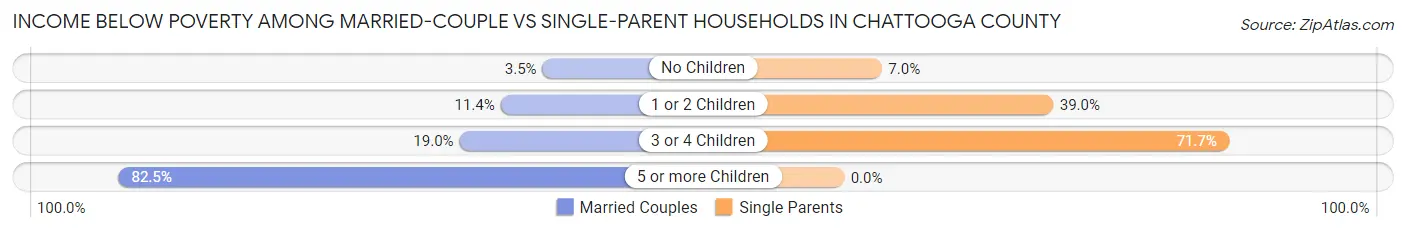
| Children | Married-Couple Families | Single-Parent Households |
| No Children | 90 (3.5%) | 48 (7.0%) |
| 1 or 2 Children | 118 (11.4%) | 402 (39.0%) |
| 3 or 4 Children | 54 (19.0%) | 208 (71.7%) |
| 5 or more Children | 33 (82.5%) | 0 (0.0%) |
| Total | 295 (7.5%) | 658 (32.4%) |
Employment Characteristics in Chattooga County
Employment by Class of Employer in Chattooga County
Among the 8,879 employed individuals in Chattooga County, private company employees (6,781 | 76.4%), self-employed (not incorporated) (611 | 6.9%), and local government employees (545 | 6.1%) make up the most common classes of employment.

| Employer Class | # Employees | % Employees |
| Private Company Employees | 6,781 | 76.4% |
| Self-Employed (Incorporated) | 282 | 3.2% |
| Self-Employed (Not Incorporated) | 611 | 6.9% |
| Not-for-profit Organizations | 215 | 2.4% |
| Local Government Employees | 545 | 6.1% |
| State Government Employees | 408 | 4.6% |
| Federal Government Employees | 37 | 0.4% |
| Unpaid Family Workers | 0 | 0.0% |
| Total | 8,879 | 100.0% |
Employment Status by Age in Chattooga County
According to the labor force statistics for Chattooga County, out of the total population over 16 years of age (19,821), 48.5% or 9,613 individuals are in the labor force, with 4.7% or 452 of them unemployed. The age group with the highest labor force participation rate is 25 to 29 years, with 72.5% or 1,172 individuals in the labor force. Within the labor force, the 16 to 19 years age range has the highest percentage of unemployed individuals, with 13.9% or 46 of them being unemployed.
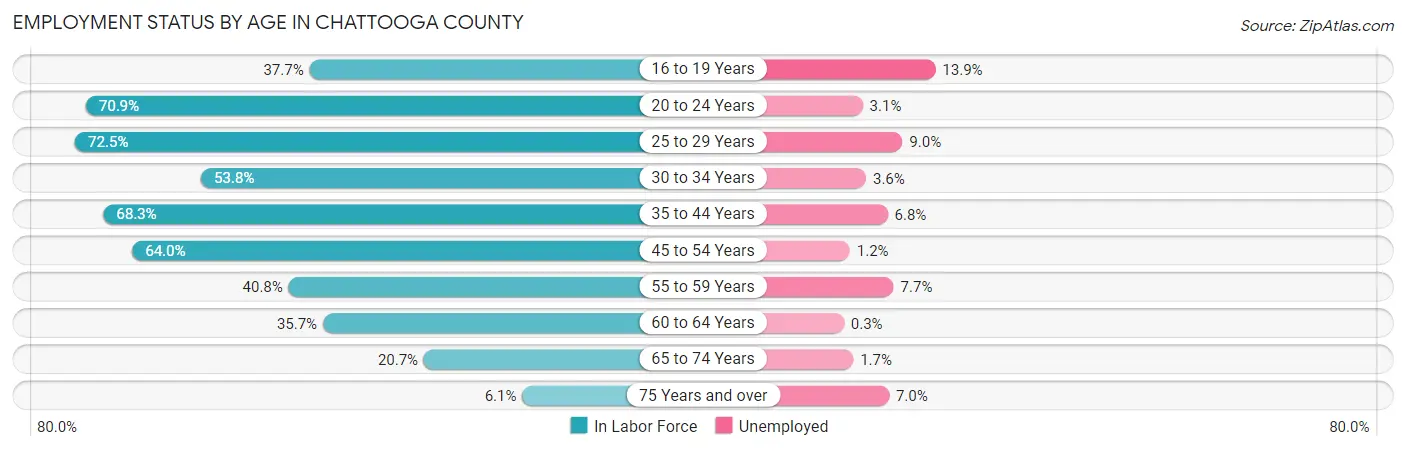
| Age Bracket | In Labor Force | Unemployed |
| 16 to 19 Years | 332 (37.7%) | 46 (13.9%) |
| 20 to 24 Years | 1,178 (70.9%) | 37 (3.1%) |
| 25 to 29 Years | 1,172 (72.5%) | 105 (9.0%) |
| 30 to 34 Years | 799 (53.8%) | 29 (3.6%) |
| 35 to 44 Years | 2,235 (68.3%) | 152 (6.8%) |
| 45 to 54 Years | 1,994 (64.0%) | 24 (1.2%) |
| 55 to 59 Years | 572 (40.8%) | 44 (7.7%) |
| 60 to 64 Years | 677 (35.7%) | 2 (0.3%) |
| 65 to 74 Years | 542 (20.7%) | 9 (1.7%) |
| 75 Years and over | 114 (6.1%) | 8 (7.0%) |
| Total | 9,613 (48.5%) | 452 (4.7%) |
Employment Status by Educational Attainment in Chattooga County
According to labor force statistics for Chattooga County, 58.2% of individuals (7,443) out of the total population between 25 and 64 years of age (12,789) are in the labor force, with 4.8% or 357 of them being unemployed. The group with the highest labor force participation rate are those with the educational attainment of bachelor's degree or higher, with 84.5% or 999 individuals in the labor force. Within the labor force, individuals with less than high school education have the highest percentage of unemployment, with 12.8% or 153 of them being unemployed.

| Educational Attainment | In Labor Force | Unemployed |
| Less than High School | 1,199 (34.5%) | 445 (12.8%) |
| High School Diploma | 2,765 (58.6%) | 175 (3.7%) |
| College / Associate Degree | 2,485 (72.8%) | 126 (3.7%) |
| Bachelor's Degree or higher | 999 (84.5%) | 9 (0.8%) |
| Total | 7,443 (58.2%) | 614 (4.8%) |
Employment Occupations by Sex in Chattooga County
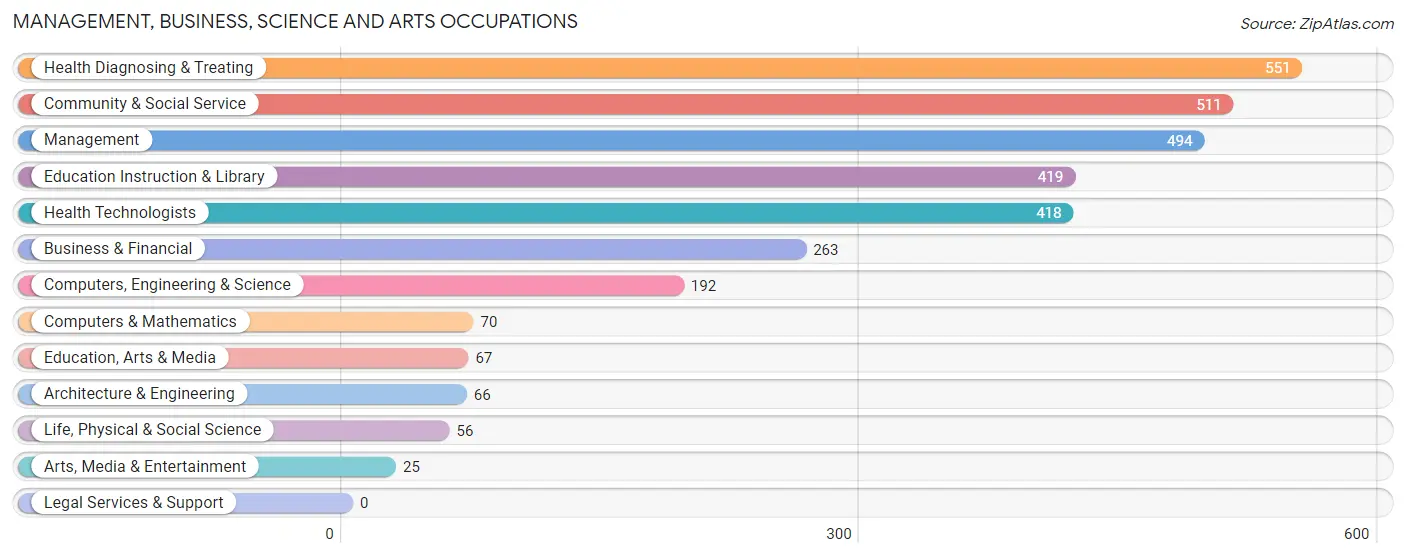
Management, Business, Science and Arts Occupations
The most common Management, Business, Science and Arts occupations in Chattooga County are Health Diagnosing & Treating (551 | 6.0%), Community & Social Service (511 | 5.6%), Management (494 | 5.4%), Education Instruction & Library (419 | 4.6%), and Health Technologists (418 | 4.6%).
Management, Business, Science and Arts Occupations by Sex
Within the Management, Business, Science and Arts occupations in Chattooga County, the most male-oriented occupations are Architecture & Engineering (90.9%), Computers, Engineering & Science (66.7%), and Education, Arts & Media (62.7%), while the most female-oriented occupations are Health Technologists (83.7%), Health Diagnosing & Treating (82.0%), and Education Instruction & Library (67.1%).

| Occupation | Male | Female |
| Management | 232 (47.0%) | 262 (53.0%) |
| Business & Financial | 130 (49.4%) | 133 (50.6%) |
| Computers, Engineering & Science | 128 (66.7%) | 64 (33.3%) |
| Computers & Mathematics | 43 (61.4%) | 27 (38.6%) |
| Architecture & Engineering | 60 (90.9%) | 6 (9.1%) |
| Life, Physical & Social Science | 25 (44.6%) | 31 (55.4%) |
| Community & Social Service | 194 (38.0%) | 317 (62.0%) |
| Education, Arts & Media | 42 (62.7%) | 25 (37.3%) |
| Legal Services & Support | 0 (0.0%) | 0 (0.0%) |
| Education Instruction & Library | 138 (32.9%) | 281 (67.1%) |
| Arts, Media & Entertainment | 14 (56.0%) | 11 (44.0%) |
| Health Diagnosing & Treating | 99 (18.0%) | 452 (82.0%) |
| Health Technologists | 68 (16.3%) | 350 (83.7%) |
| Total (Category) | 783 (38.9%) | 1,228 (61.1%) |
| Total (Overall) | 4,582 (50.0%) | 4,574 (50.0%) |
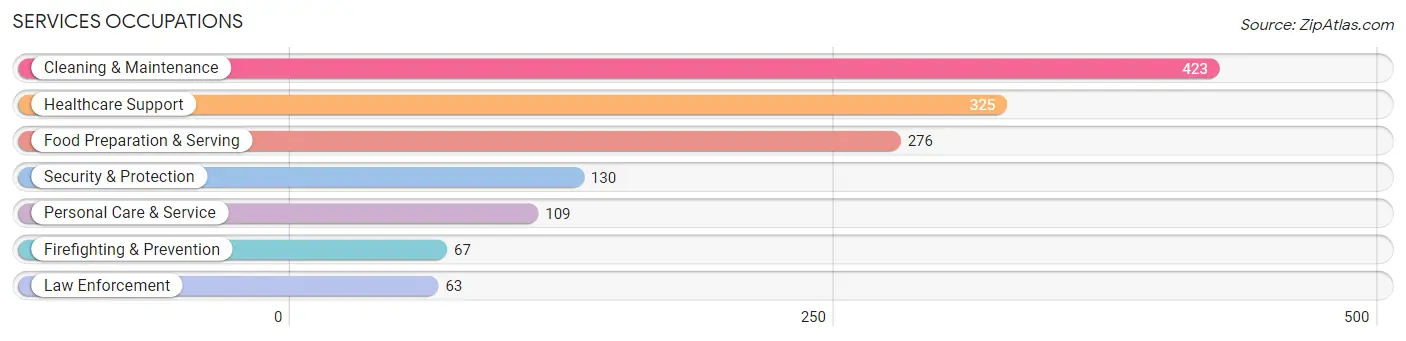
Services Occupations
The most common Services occupations in Chattooga County are Cleaning & Maintenance (423 | 4.6%), Healthcare Support (325 | 3.5%), Food Preparation & Serving (276 | 3.0%), Security & Protection (130 | 1.4%), and Personal Care & Service (109 | 1.2%).
Services Occupations by Sex
Within the Services occupations in Chattooga County, the most male-oriented occupations are Law Enforcement (74.6%), Security & Protection (57.7%), and Cleaning & Maintenance (45.4%), while the most female-oriented occupations are Healthcare Support (98.8%), Personal Care & Service (87.2%), and Food Preparation & Serving (75.4%).

| Occupation | Male | Female |
| Healthcare Support | 4 (1.2%) | 321 (98.8%) |
| Security & Protection | 75 (57.7%) | 55 (42.3%) |
| Firefighting & Prevention | 28 (41.8%) | 39 (58.2%) |
| Law Enforcement | 47 (74.6%) | 16 (25.4%) |
| Food Preparation & Serving | 68 (24.6%) | 208 (75.4%) |
| Cleaning & Maintenance | 192 (45.4%) | 231 (54.6%) |
| Personal Care & Service | 14 (12.8%) | 95 (87.2%) |
| Total (Category) | 353 (28.0%) | 910 (72.1%) |
| Total (Overall) | 4,582 (50.0%) | 4,574 (50.0%) |
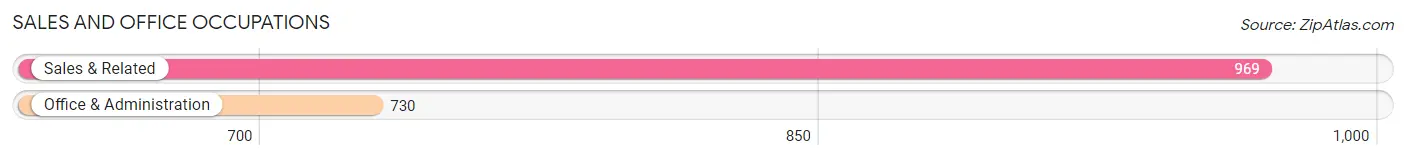
Sales and Office Occupations
The most common Sales and Office occupations in Chattooga County are Sales & Related (969 | 10.6%), and Office & Administration (730 | 8.0%).
Sales and Office Occupations by Sex
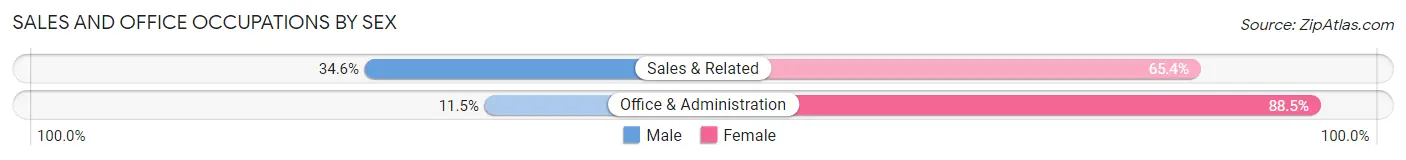
| Occupation | Male | Female |
| Sales & Related | 335 (34.6%) | 634 (65.4%) |
| Office & Administration | 84 (11.5%) | 646 (88.5%) |
| Total (Category) | 419 (24.7%) | 1,280 (75.3%) |
| Total (Overall) | 4,582 (50.0%) | 4,574 (50.0%) |
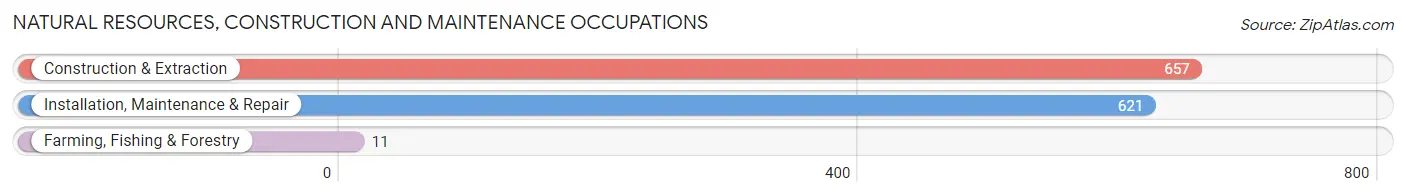
Natural Resources, Construction and Maintenance Occupations
The most common Natural Resources, Construction and Maintenance occupations in Chattooga County are Construction & Extraction (657 | 7.2%), Installation, Maintenance & Repair (621 | 6.8%), and Farming, Fishing & Forestry (11 | 0.1%).
Natural Resources, Construction and Maintenance Occupations by Sex
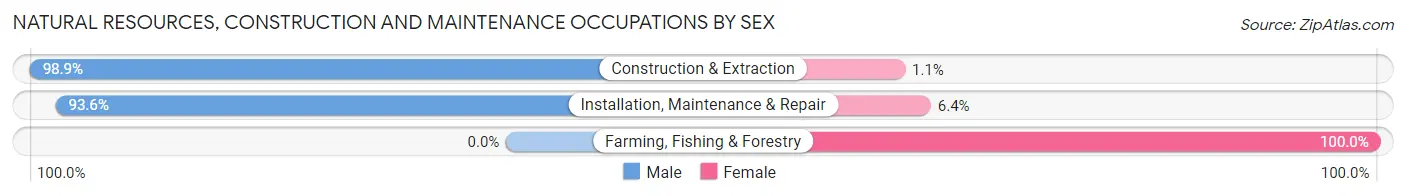
| Occupation | Male | Female |
| Farming, Fishing & Forestry | 0 (0.0%) | 11 (100.0%) |
| Construction & Extraction | 650 (98.9%) | 7 (1.1%) |
| Installation, Maintenance & Repair | 581 (93.6%) | 40 (6.4%) |
| Total (Category) | 1,231 (95.5%) | 58 (4.5%) |
| Total (Overall) | 4,582 (50.0%) | 4,574 (50.0%) |
Production, Transportation and Moving Occupations
The most common Production, Transportation and Moving occupations in Chattooga County are Production (1,747 | 19.1%), Material Moving (797 | 8.7%), and Transportation (350 | 3.8%).

Production, Transportation and Moving Occupations by Sex

| Occupation | Male | Female |
| Production | 913 (52.3%) | 834 (47.7%) |
| Transportation | 314 (89.7%) | 36 (10.3%) |
| Material Moving | 569 (71.4%) | 228 (28.6%) |
| Total (Category) | 1,796 (62.1%) | 1,098 (37.9%) |
| Total (Overall) | 4,582 (50.0%) | 4,574 (50.0%) |
Employment Industries by Sex in Chattooga County
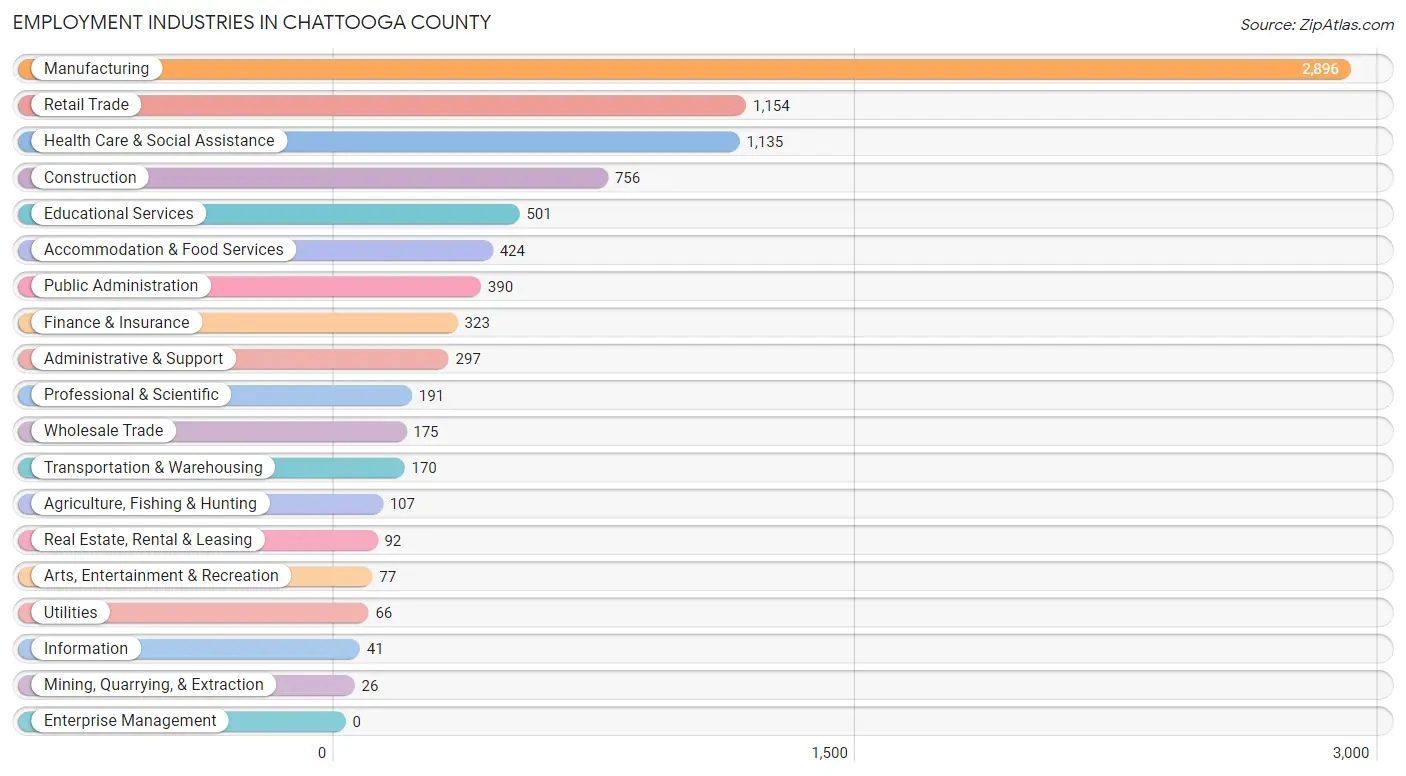
Employment Industries in Chattooga County
The major employment industries in Chattooga County include Manufacturing (2,896 | 31.6%), Retail Trade (1,154 | 12.6%), Health Care & Social Assistance (1,135 | 12.4%), Construction (756 | 8.3%), and Educational Services (501 | 5.5%).
Employment Industries by Sex in Chattooga County
The Chattooga County industries that see more men than women are Mining, Quarrying, & Extraction (100.0%), Utilities (100.0%), and Construction (97.2%), whereas the industries that tend to have a higher number of women are Professional & Scientific (92.1%), Health Care & Social Assistance (83.7%), and Accommodation & Food Services (79.2%).
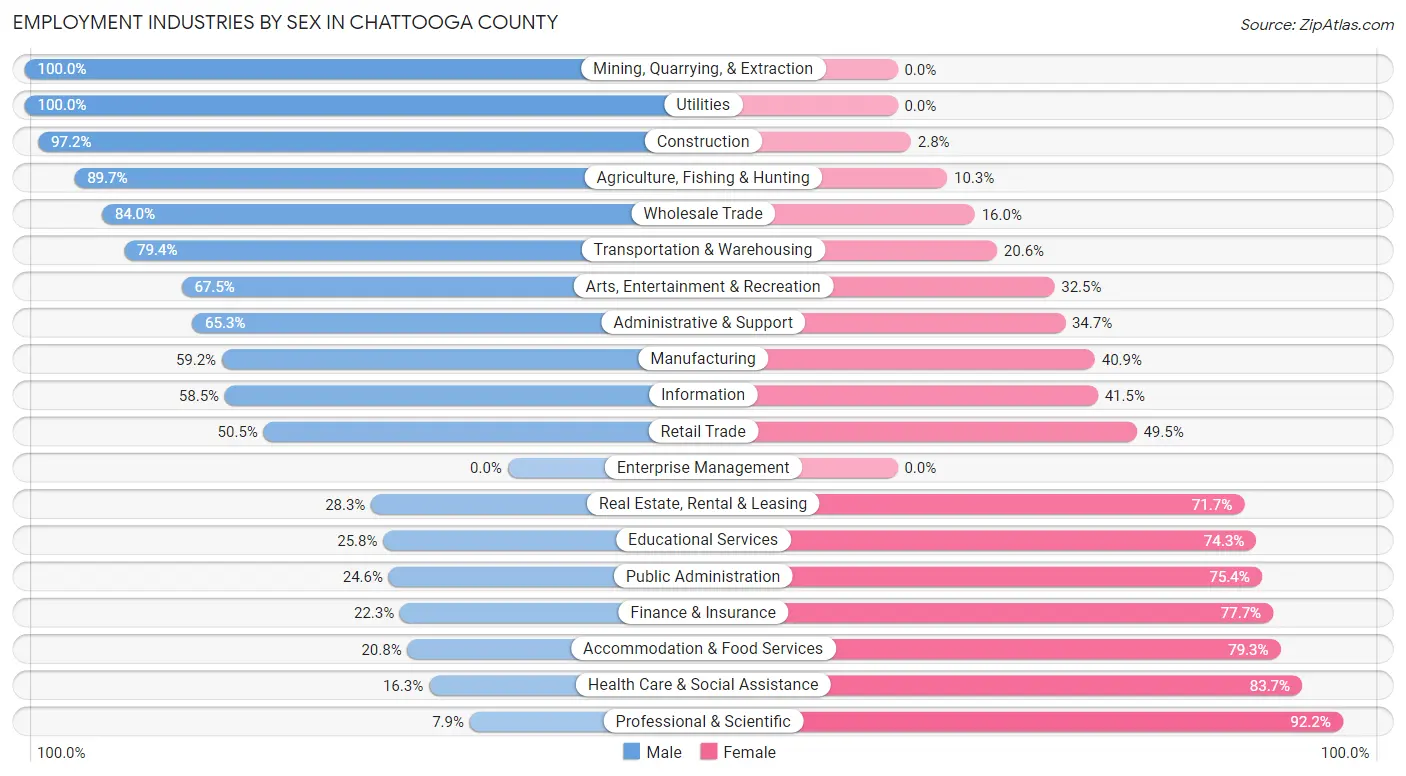
| Industry | Male | Female |
| Agriculture, Fishing & Hunting | 96 (89.7%) | 11 (10.3%) |
| Mining, Quarrying, & Extraction | 26 (100.0%) | 0 (0.0%) |
| Construction | 735 (97.2%) | 21 (2.8%) |
| Manufacturing | 1,713 (59.2%) | 1,183 (40.8%) |
| Wholesale Trade | 147 (84.0%) | 28 (16.0%) |
| Retail Trade | 583 (50.5%) | 571 (49.5%) |
| Transportation & Warehousing | 135 (79.4%) | 35 (20.6%) |
| Utilities | 66 (100.0%) | 0 (0.0%) |
| Information | 24 (58.5%) | 17 (41.5%) |
| Finance & Insurance | 72 (22.3%) | 251 (77.7%) |
| Real Estate, Rental & Leasing | 26 (28.3%) | 66 (71.7%) |
| Professional & Scientific | 15 (7.9%) | 176 (92.1%) |
| Enterprise Management | 0 (0.0%) | 0 (0.0%) |
| Administrative & Support | 194 (65.3%) | 103 (34.7%) |
| Educational Services | 129 (25.8%) | 372 (74.3%) |
| Health Care & Social Assistance | 185 (16.3%) | 950 (83.7%) |
| Arts, Entertainment & Recreation | 52 (67.5%) | 25 (32.5%) |
| Accommodation & Food Services | 88 (20.7%) | 336 (79.2%) |
| Public Administration | 96 (24.6%) | 294 (75.4%) |
| Total | 4,582 (50.0%) | 4,574 (50.0%) |
Education in Chattooga County
School Enrollment in Chattooga County
The most common levels of schooling among the 4,928 students in Chattooga County are elementary school (1,263 | 25.6%), high school (1,148 | 23.3%), and middle school (1,138 | 23.1%).
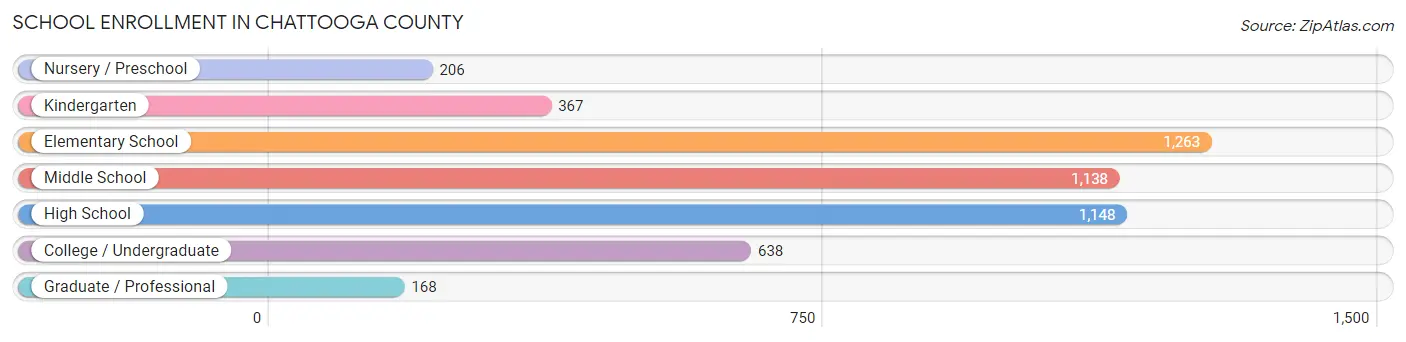
| School Level | # Students | % Students |
| Nursery / Preschool | 206 | 4.2% |
| Kindergarten | 367 | 7.4% |
| Elementary School | 1,263 | 25.6% |
| Middle School | 1,138 | 23.1% |
| High School | 1,148 | 23.3% |
| College / Undergraduate | 638 | 13.0% |
| Graduate / Professional | 168 | 3.4% |
| Total | 4,928 | 100.0% |
School Enrollment by Age by Funding Source in Chattooga County
Out of a total of 4,928 students who are enrolled in schools in Chattooga County, 310 (6.3%) attend a private institution, while the remaining 4,618 (93.7%) are enrolled in public schools. The age group of 18 to 19 year olds has the highest likelihood of being enrolled in private schools, with 26 (27.1% in the age bracket) enrolled. Conversely, the age group of 3 to 4 year olds has the lowest likelihood of being enrolled in a private school, with 119 (99.2% in the age bracket) attending a public institution.
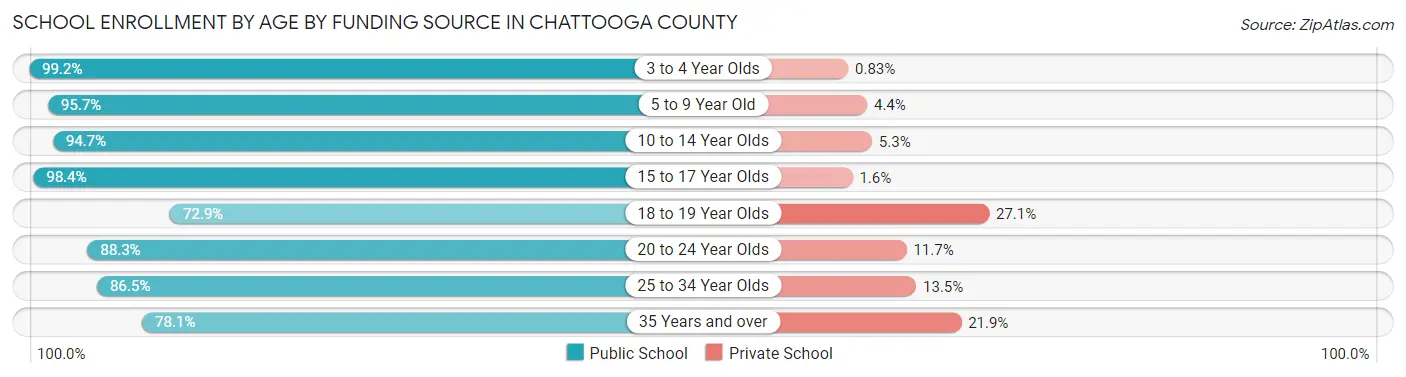
| Age Bracket | Public School | Private School |
| 3 to 4 Year Olds | 119 (99.2%) | 1 (0.8%) |
| 5 to 9 Year Old | 1,429 (95.7%) | 65 (4.3%) |
| 10 to 14 Year Olds | 1,422 (94.7%) | 79 (5.3%) |
| 15 to 17 Year Olds | 903 (98.4%) | 15 (1.6%) |
| 18 to 19 Year Olds | 70 (72.9%) | 26 (27.1%) |
| 20 to 24 Year Olds | 249 (88.3%) | 33 (11.7%) |
| 25 to 34 Year Olds | 218 (86.5%) | 34 (13.5%) |
| 35 Years and over | 207 (78.1%) | 58 (21.9%) |
| Total | 4,618 (93.7%) | 310 (6.3%) |
Educational Attainment by Field of Study in Chattooga County
Business (300 | 17.7%), education (246 | 14.5%), science & technology (192 | 11.3%), arts & humanities (165 | 9.7%), and engineering (149 | 8.8%) are the most common fields of study among 1,694 individuals in Chattooga County who have obtained a bachelor's degree or higher.
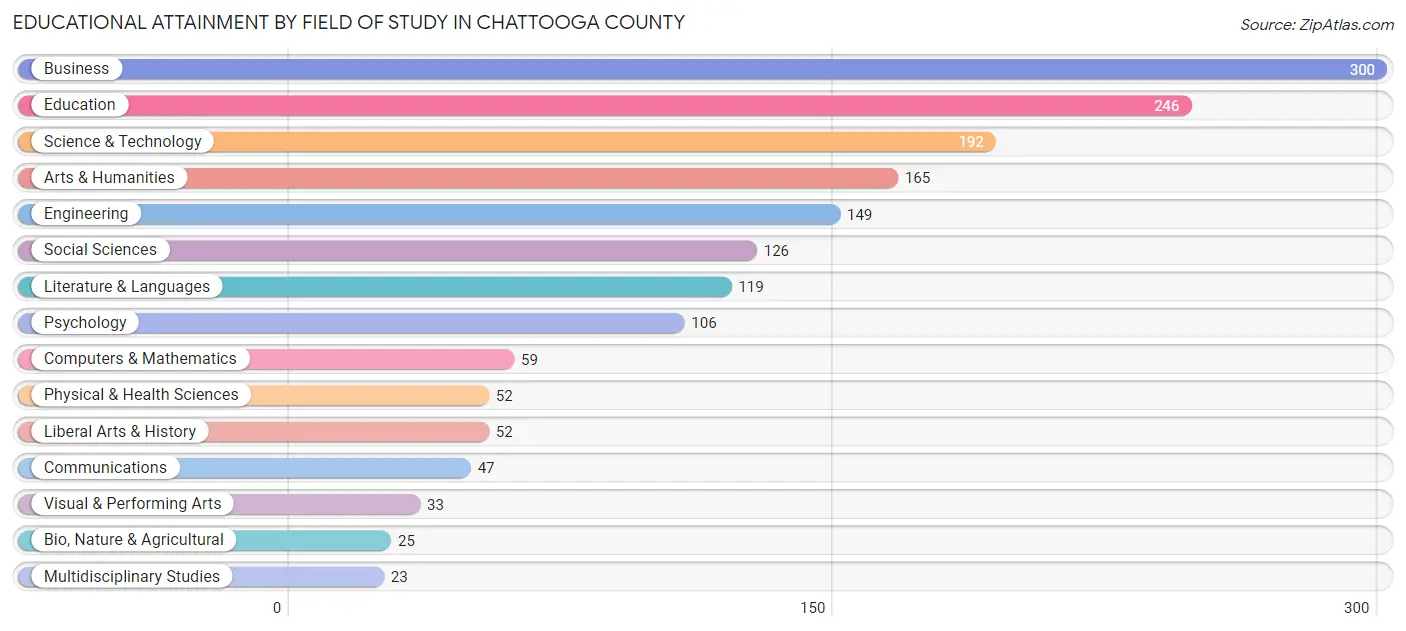
| Field of Study | # Graduates | % Graduates |
| Computers & Mathematics | 59 | 3.5% |
| Bio, Nature & Agricultural | 25 | 1.5% |
| Physical & Health Sciences | 52 | 3.1% |
| Psychology | 106 | 6.3% |
| Social Sciences | 126 | 7.4% |
| Engineering | 149 | 8.8% |
| Multidisciplinary Studies | 23 | 1.4% |
| Science & Technology | 192 | 11.3% |
| Business | 300 | 17.7% |
| Education | 246 | 14.5% |
| Literature & Languages | 119 | 7.0% |
| Liberal Arts & History | 52 | 3.1% |
| Visual & Performing Arts | 33 | 1.9% |
| Communications | 47 | 2.8% |
| Arts & Humanities | 165 | 9.7% |
| Total | 1,694 | 100.0% |
Transportation & Commute in Chattooga County
Vehicle Availability by Sex in Chattooga County
The most prevalent vehicle ownership categories in Chattooga County are males with 2 vehicles (1,702, accounting for 38.3%) and females with 2 vehicles (1,845, making up 38.5%).
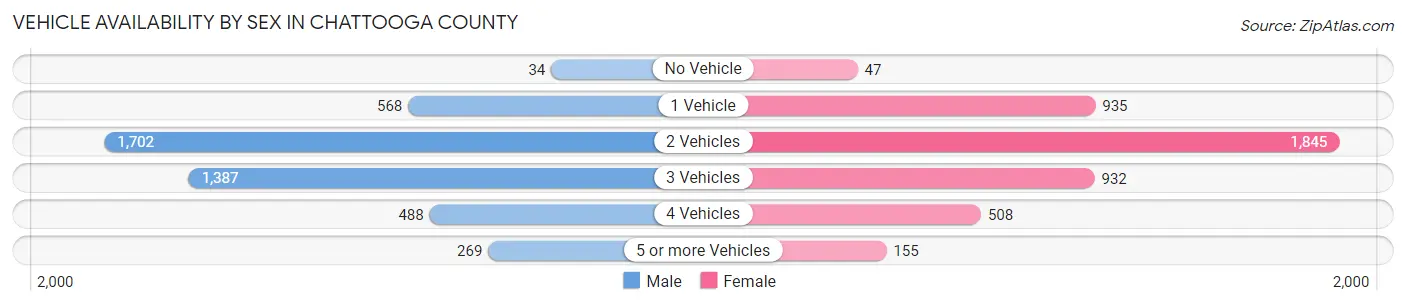
| Vehicles Available | Male | Female |
| No Vehicle | 34 (0.8%) | 47 (1.1%) |
| 1 Vehicle | 568 (12.8%) | 935 (21.1%) |
| 2 Vehicles | 1,702 (38.3%) | 1,845 (41.7%) |
| 3 Vehicles | 1,387 (31.2%) | 932 (21.1%) |
| 4 Vehicles | 488 (11.0%) | 508 (11.5%) |
| 5 or more Vehicles | 269 (6.0%) | 155 (3.5%) |
| Total | 4,448 (100.0%) | 4,422 (100.0%) |
Commute Time in Chattooga County
The most frequently occuring commute durations in Chattooga County are 15 to 19 minutes (1,391 commuters, 16.1%), 20 to 24 minutes (1,215 commuters, 14.1%), and 30 to 34 minutes (1,209 commuters, 14.0%).
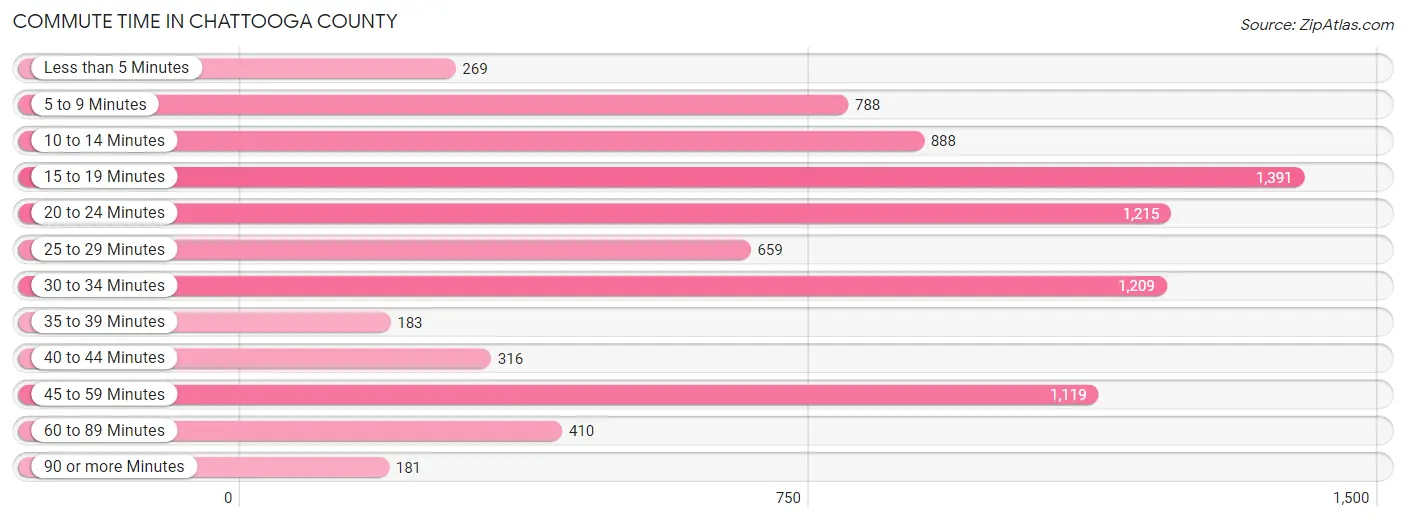
| Commute Time | # Commuters | % Commuters |
| Less than 5 Minutes | 269 | 3.1% |
| 5 to 9 Minutes | 788 | 9.1% |
| 10 to 14 Minutes | 888 | 10.3% |
| 15 to 19 Minutes | 1,391 | 16.1% |
| 20 to 24 Minutes | 1,215 | 14.1% |
| 25 to 29 Minutes | 659 | 7.6% |
| 30 to 34 Minutes | 1,209 | 14.0% |
| 35 to 39 Minutes | 183 | 2.1% |
| 40 to 44 Minutes | 316 | 3.7% |
| 45 to 59 Minutes | 1,119 | 13.0% |
| 60 to 89 Minutes | 410 | 4.8% |
| 90 or more Minutes | 181 | 2.1% |
Commute Time by Sex in Chattooga County
The most common commute times in Chattooga County are 15 to 19 minutes (675 commuters, 15.5%) for males and 30 to 34 minutes (731 commuters, 17.2%) for females.

| Commute Time | Male | Female |
| Less than 5 Minutes | 130 (3.0%) | 139 (3.3%) |
| 5 to 9 Minutes | 302 (6.9%) | 486 (11.4%) |
| 10 to 14 Minutes | 498 (11.4%) | 390 (9.1%) |
| 15 to 19 Minutes | 675 (15.5%) | 716 (16.8%) |
| 20 to 24 Minutes | 666 (15.3%) | 549 (12.9%) |
| 25 to 29 Minutes | 330 (7.6%) | 329 (7.7%) |
| 30 to 34 Minutes | 478 (11.0%) | 731 (17.2%) |
| 35 to 39 Minutes | 122 (2.8%) | 61 (1.4%) |
| 40 to 44 Minutes | 177 (4.1%) | 139 (3.3%) |
| 45 to 59 Minutes | 603 (13.8%) | 516 (12.1%) |
| 60 to 89 Minutes | 285 (6.5%) | 125 (2.9%) |
| 90 or more Minutes | 99 (2.3%) | 82 (1.9%) |
Time of Departure to Work by Sex in Chattooga County
The most frequent times of departure to work in Chattooga County are 7:00 AM to 7:29 AM (1,144, 26.2%) for males and 7:00 AM to 7:29 AM (1,186, 27.8%) for females.
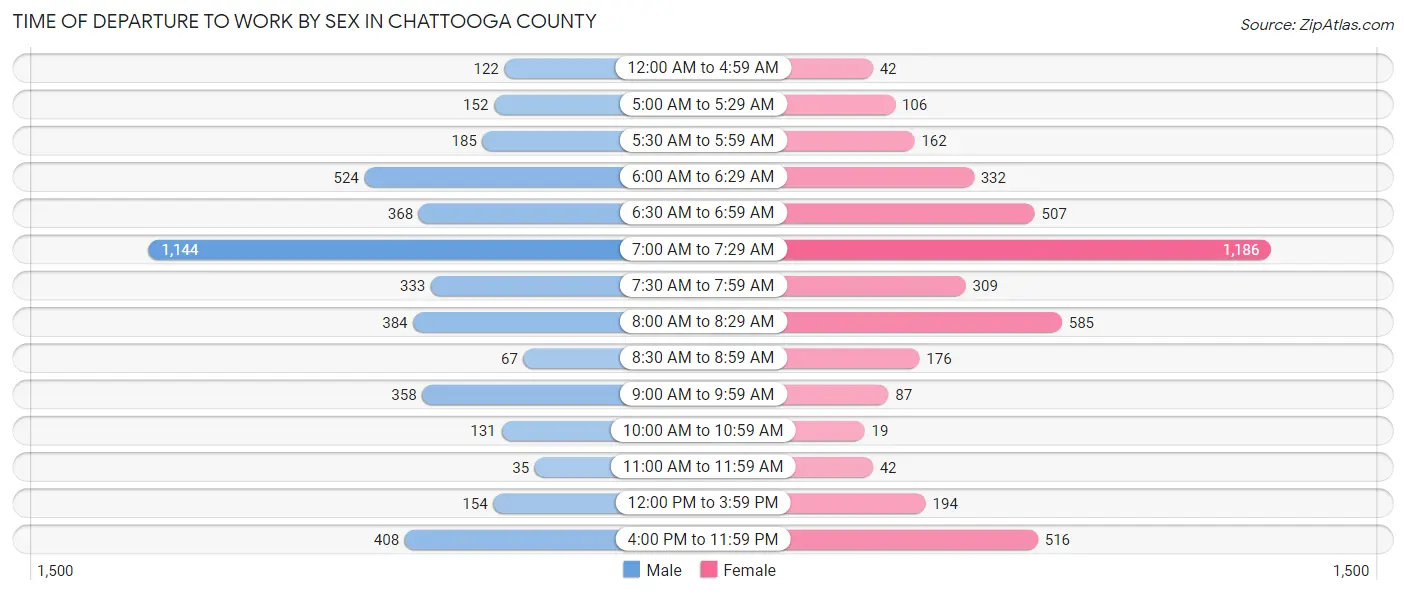
| Time of Departure | Male | Female |
| 12:00 AM to 4:59 AM | 122 (2.8%) | 42 (1.0%) |
| 5:00 AM to 5:29 AM | 152 (3.5%) | 106 (2.5%) |
| 5:30 AM to 5:59 AM | 185 (4.2%) | 162 (3.8%) |
| 6:00 AM to 6:29 AM | 524 (12.0%) | 332 (7.8%) |
| 6:30 AM to 6:59 AM | 368 (8.4%) | 507 (11.9%) |
| 7:00 AM to 7:29 AM | 1,144 (26.2%) | 1,186 (27.8%) |
| 7:30 AM to 7:59 AM | 333 (7.6%) | 309 (7.2%) |
| 8:00 AM to 8:29 AM | 384 (8.8%) | 585 (13.7%) |
| 8:30 AM to 8:59 AM | 67 (1.5%) | 176 (4.1%) |
| 9:00 AM to 9:59 AM | 358 (8.2%) | 87 (2.0%) |
| 10:00 AM to 10:59 AM | 131 (3.0%) | 19 (0.4%) |
| 11:00 AM to 11:59 AM | 35 (0.8%) | 42 (1.0%) |
| 12:00 PM to 3:59 PM | 154 (3.5%) | 194 (4.5%) |
| 4:00 PM to 11:59 PM | 408 (9.3%) | 516 (12.1%) |
| Total | 4,365 (100.0%) | 4,263 (100.0%) |
Housing Occupancy in Chattooga County
Occupancy by Ownership in Chattooga County
Of the total 9,292 dwellings in Chattooga County, owner-occupied units account for 6,286 (67.6%), while renter-occupied units make up 3,006 (32.4%).
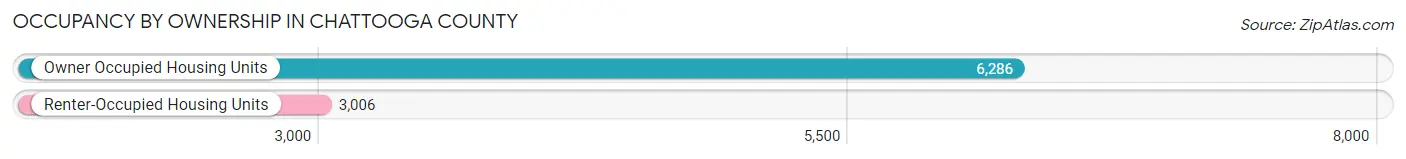
| Occupancy | # Housing Units | % Housing Units |
| Owner Occupied Housing Units | 6,286 | 67.6% |
| Renter-Occupied Housing Units | 3,006 | 32.4% |
| Total Occupied Housing Units | 9,292 | 100.0% |
Occupancy by Household Size in Chattooga County
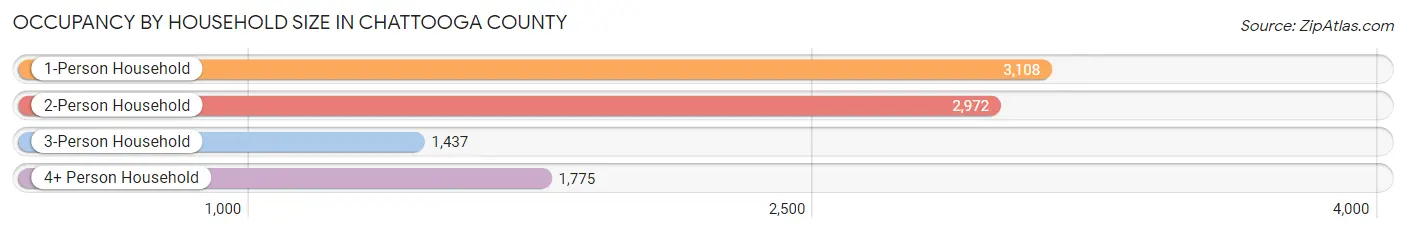
| Household Size | # Housing Units | % Housing Units |
| 1-Person Household | 3,108 | 33.5% |
| 2-Person Household | 2,972 | 32.0% |
| 3-Person Household | 1,437 | 15.5% |
| 4+ Person Household | 1,775 | 19.1% |
| Total Housing Units | 9,292 | 100.0% |
Occupancy by Ownership by Household Size in Chattooga County
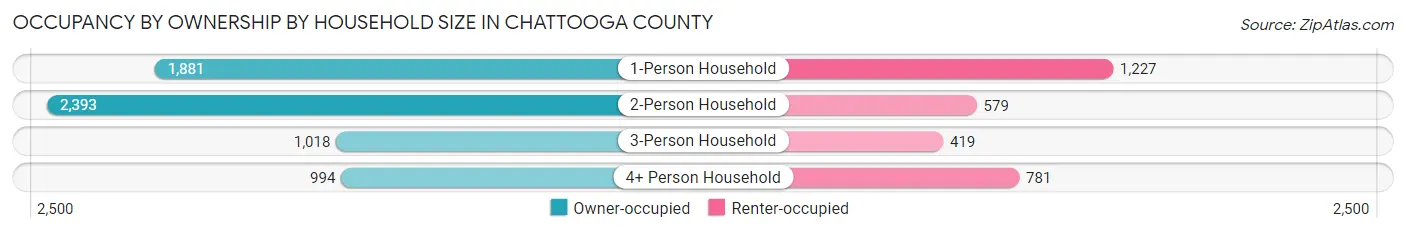
| Household Size | Owner-occupied | Renter-occupied |
| 1-Person Household | 1,881 (60.5%) | 1,227 (39.5%) |
| 2-Person Household | 2,393 (80.5%) | 579 (19.5%) |
| 3-Person Household | 1,018 (70.8%) | 419 (29.2%) |
| 4+ Person Household | 994 (56.0%) | 781 (44.0%) |
| Total Housing Units | 6,286 (67.6%) | 3,006 (32.4%) |
Occupancy by Educational Attainment in Chattooga County
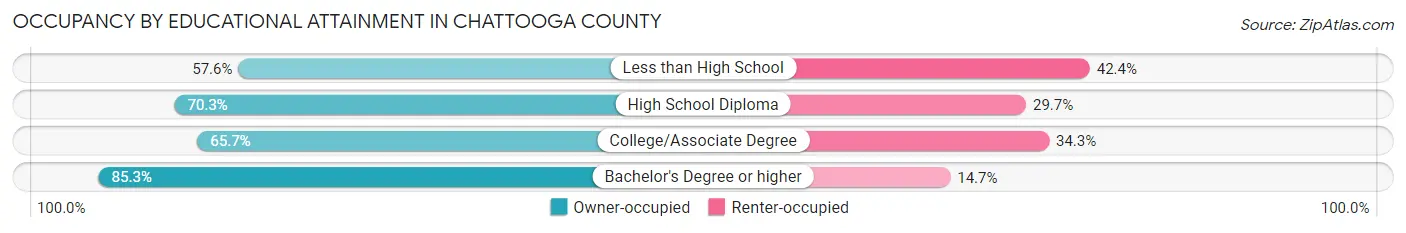
| Household Size | Owner-occupied | Renter-occupied |
| Less than High School | 1,233 (57.6%) | 906 (42.4%) |
| High School Diploma | 2,464 (70.3%) | 1,042 (29.7%) |
| College/Associate Degree | 1,753 (65.7%) | 914 (34.3%) |
| Bachelor's Degree or higher | 836 (85.3%) | 144 (14.7%) |
Occupancy by Age of Householder in Chattooga County

| Age Bracket | # Households | % Households |
| Under 35 Years | 1,418 | 15.3% |
| 35 to 44 Years | 1,242 | 13.4% |
| 45 to 54 Years | 1,498 | 16.1% |
| 55 to 64 Years | 2,108 | 22.7% |
| 65 to 74 Years | 1,783 | 19.2% |
| 75 to 84 Years | 794 | 8.5% |
| 85 Years and Over | 449 | 4.8% |
| Total | 9,292 | 100.0% |
Housing Finances in Chattooga County
Median Income by Occupancy in Chattooga County
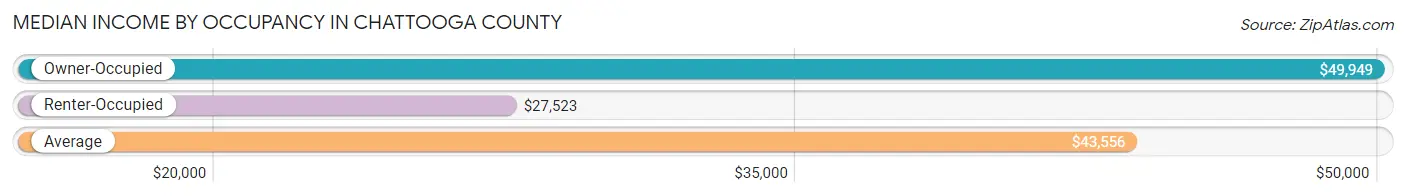
| Occupancy Type | # Households | Median Income |
| Owner-Occupied | 6,286 (67.6%) | $49,949 |
| Renter-Occupied | 3,006 (32.4%) | $27,523 |
| Average | 9,292 (100.0%) | $43,556 |
Occupancy by Householder Income Bracket in Chattooga County
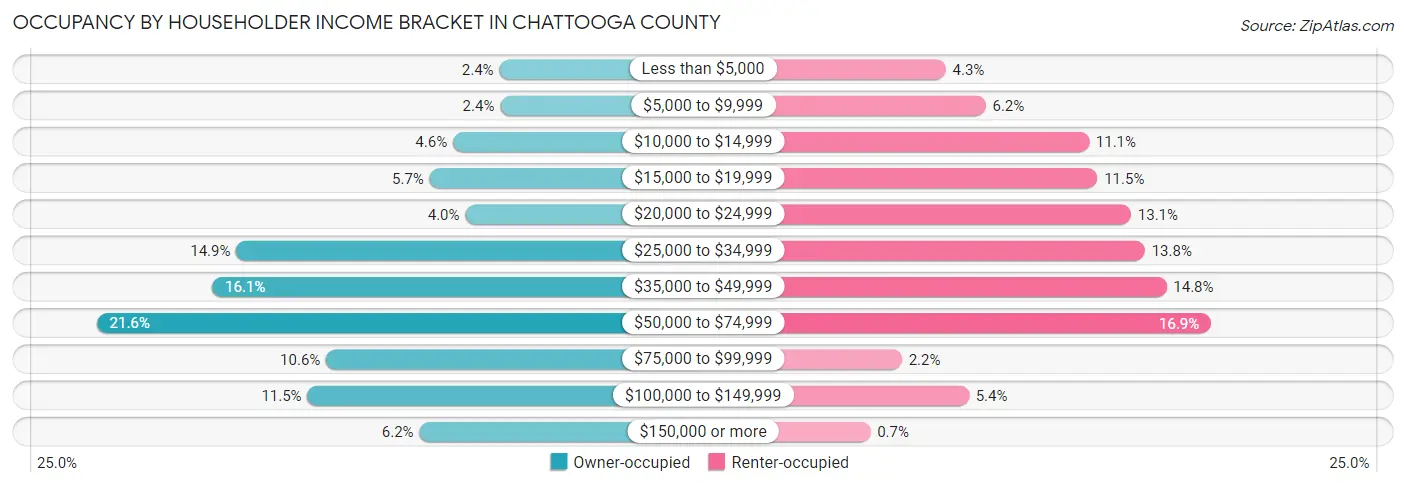
| Income Bracket | Owner-occupied | Renter-occupied |
| Less than $5,000 | 150 (2.4%) | 129 (4.3%) |
| $5,000 to $9,999 | 148 (2.4%) | 186 (6.2%) |
| $10,000 to $14,999 | 289 (4.6%) | 334 (11.1%) |
| $15,000 to $19,999 | 359 (5.7%) | 346 (11.5%) |
| $20,000 to $24,999 | 252 (4.0%) | 394 (13.1%) |
| $25,000 to $34,999 | 938 (14.9%) | 414 (13.8%) |
| $35,000 to $49,999 | 1,010 (16.1%) | 445 (14.8%) |
| $50,000 to $74,999 | 1,356 (21.6%) | 509 (16.9%) |
| $75,000 to $99,999 | 669 (10.6%) | 66 (2.2%) |
| $100,000 to $149,999 | 725 (11.5%) | 162 (5.4%) |
| $150,000 or more | 390 (6.2%) | 21 (0.7%) |
| Total | 6,286 (100.0%) | 3,006 (100.0%) |
Monthly Housing Cost Tiers in Chattooga County
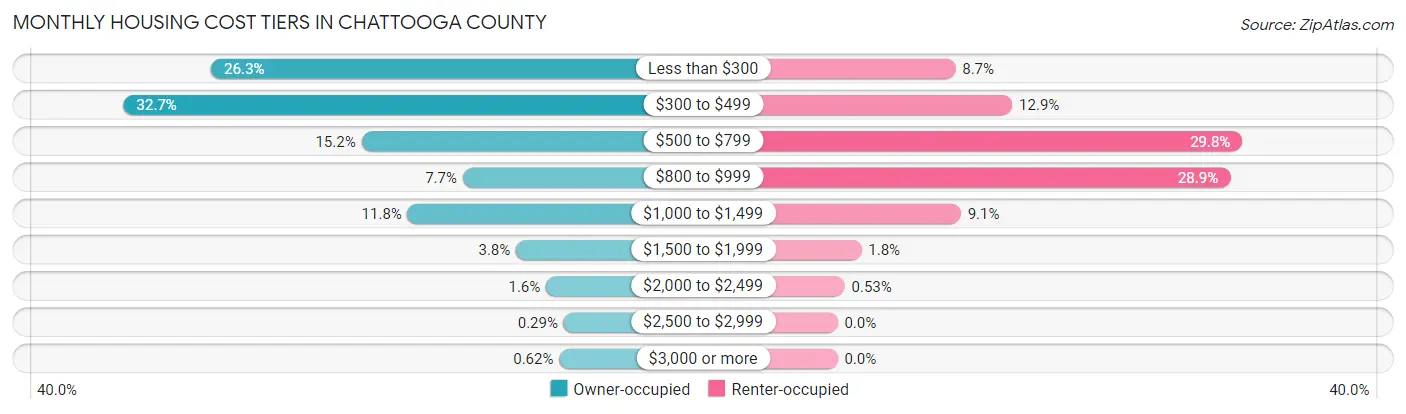
| Monthly Cost | Owner-occupied | Renter-occupied |
| Less than $300 | 1,651 (26.3%) | 261 (8.7%) |
| $300 to $499 | 2,057 (32.7%) | 387 (12.9%) |
| $500 to $799 | 955 (15.2%) | 896 (29.8%) |
| $800 to $999 | 486 (7.7%) | 869 (28.9%) |
| $1,000 to $1,499 | 741 (11.8%) | 273 (9.1%) |
| $1,500 to $1,999 | 239 (3.8%) | 53 (1.8%) |
| $2,000 to $2,499 | 100 (1.6%) | 16 (0.5%) |
| $2,500 to $2,999 | 18 (0.3%) | 0 (0.0%) |
| $3,000 or more | 39 (0.6%) | 0 (0.0%) |
| Total | 6,286 (100.0%) | 3,006 (100.0%) |
Physical Housing Characteristics in Chattooga County
Housing Structures in Chattooga County
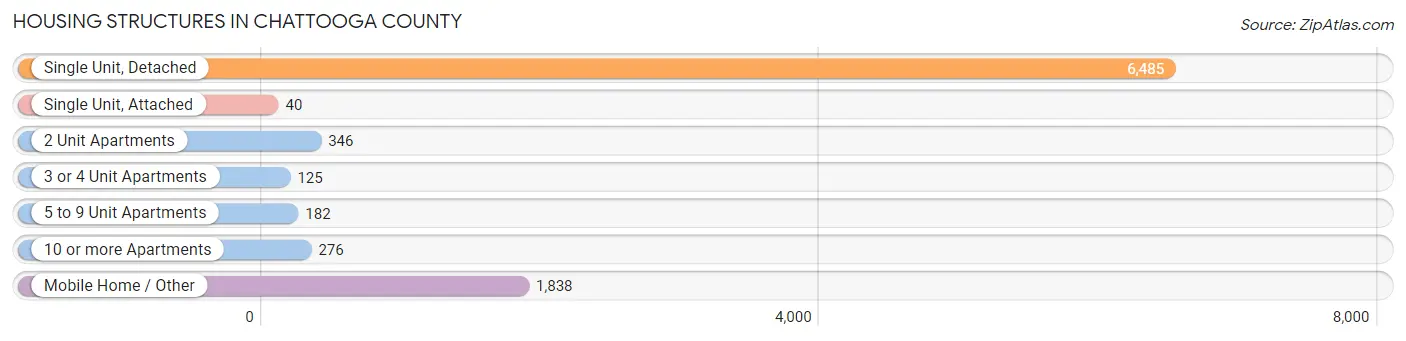
| Structure Type | # Housing Units | % Housing Units |
| Single Unit, Detached | 6,485 | 69.8% |
| Single Unit, Attached | 40 | 0.4% |
| 2 Unit Apartments | 346 | 3.7% |
| 3 or 4 Unit Apartments | 125 | 1.3% |
| 5 to 9 Unit Apartments | 182 | 2.0% |
| 10 or more Apartments | 276 | 3.0% |
| Mobile Home / Other | 1,838 | 19.8% |
| Total | 9,292 | 100.0% |
Housing Structures by Occupancy in Chattooga County
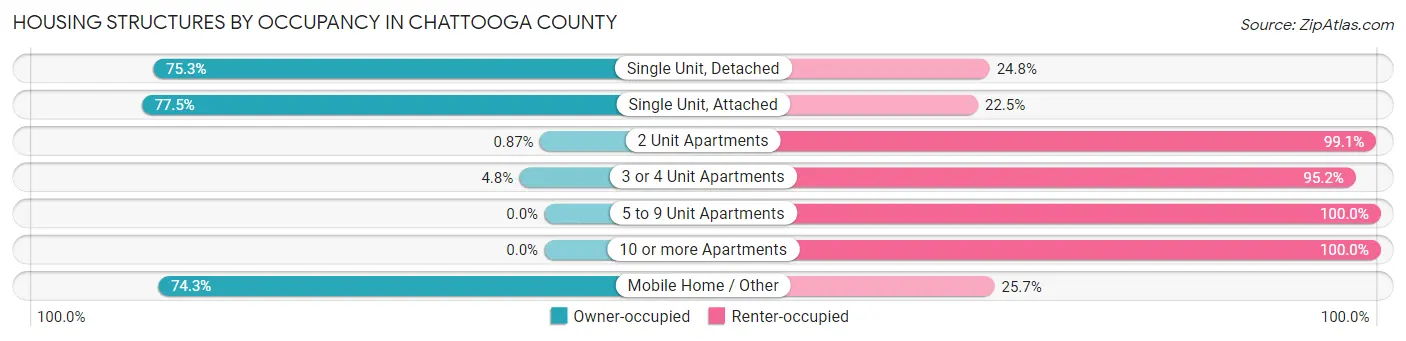
| Structure Type | Owner-occupied | Renter-occupied |
| Single Unit, Detached | 4,880 (75.2%) | 1,605 (24.7%) |
| Single Unit, Attached | 31 (77.5%) | 9 (22.5%) |
| 2 Unit Apartments | 3 (0.9%) | 343 (99.1%) |
| 3 or 4 Unit Apartments | 6 (4.8%) | 119 (95.2%) |
| 5 to 9 Unit Apartments | 0 (0.0%) | 182 (100.0%) |
| 10 or more Apartments | 0 (0.0%) | 276 (100.0%) |
| Mobile Home / Other | 1,366 (74.3%) | 472 (25.7%) |
| Total | 6,286 (67.6%) | 3,006 (32.4%) |
Housing Structures by Number of Rooms in Chattooga County
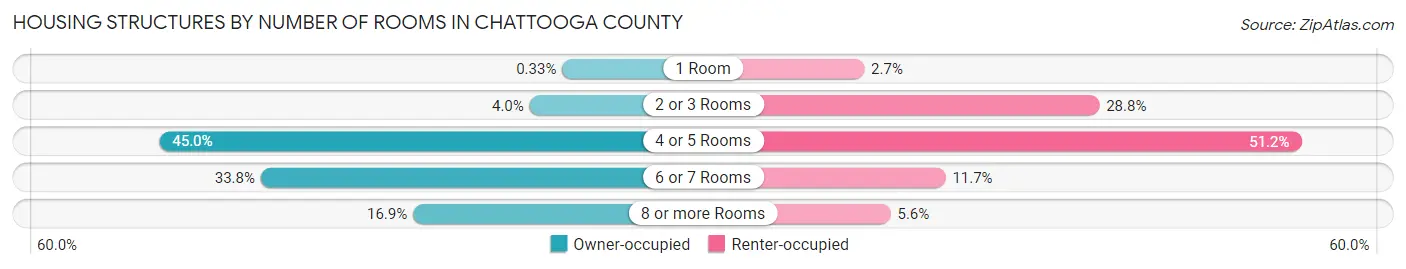
| Number of Rooms | Owner-occupied | Renter-occupied |
| 1 Room | 21 (0.3%) | 81 (2.7%) |
| 2 or 3 Rooms | 248 (4.0%) | 865 (28.8%) |
| 4 or 5 Rooms | 2,831 (45.0%) | 1,539 (51.2%) |
| 6 or 7 Rooms | 2,124 (33.8%) | 352 (11.7%) |
| 8 or more Rooms | 1,062 (16.9%) | 169 (5.6%) |
| Total | 6,286 (100.0%) | 3,006 (100.0%) |
Housing Structure by Heating Type in Chattooga County
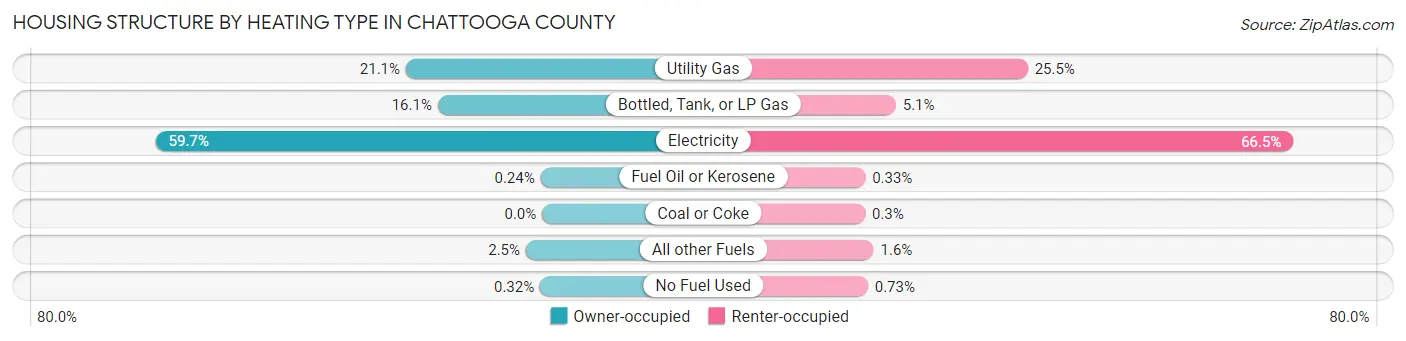
| Heating Type | Owner-occupied | Renter-occupied |
| Utility Gas | 1,324 (21.1%) | 765 (25.5%) |
| Bottled, Tank, or LP Gas | 1,014 (16.1%) | 152 (5.1%) |
| Electricity | 3,755 (59.7%) | 1,999 (66.5%) |
| Fuel Oil or Kerosene | 15 (0.2%) | 10 (0.3%) |
| Coal or Coke | 0 (0.0%) | 9 (0.3%) |
| All other Fuels | 158 (2.5%) | 49 (1.6%) |
| No Fuel Used | 20 (0.3%) | 22 (0.7%) |
| Total | 6,286 (100.0%) | 3,006 (100.0%) |
Household Vehicle Usage in Chattooga County

| Vehicles per Household | Owner-occupied | Renter-occupied |
| No Vehicle | 105 (1.7%) | 411 (13.7%) |
| 1 Vehicle | 1,440 (22.9%) | 1,382 (46.0%) |
| 2 Vehicles | 2,395 (38.1%) | 816 (27.2%) |
| 3 or more Vehicles | 2,346 (37.3%) | 397 (13.2%) |
| Total | 6,286 (100.0%) | 3,006 (100.0%) |
Real Estate & Mortgages in Chattooga County
Real Estate and Mortgage Overview in Chattooga County
| Characteristic | Without Mortgage | With Mortgage |
| Housing Units | 4,365 | 1,921 |
| Median Property Value | $71,100 | $115,900 |
| Median Household Income | $46,153 | $199 |
| Monthly Housing Costs | $358 | $39 |
| Real Estate Taxes | $631 | $28 |
Property Value by Mortgage Status in Chattooga County
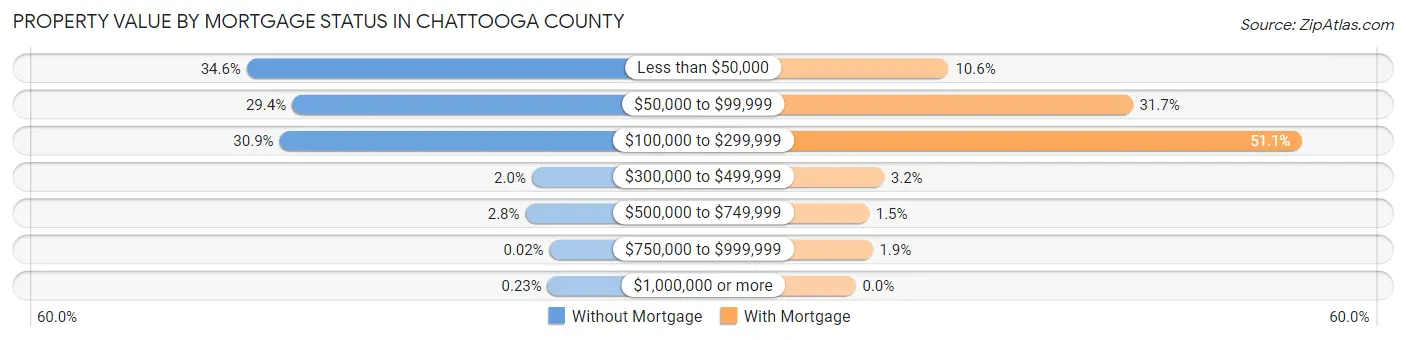
| Property Value | Without Mortgage | With Mortgage |
| Less than $50,000 | 1,511 (34.6%) | 204 (10.6%) |
| $50,000 to $99,999 | 1,285 (29.4%) | 608 (31.7%) |
| $100,000 to $299,999 | 1,348 (30.9%) | 981 (51.1%) |
| $300,000 to $499,999 | 89 (2.0%) | 62 (3.2%) |
| $500,000 to $749,999 | 121 (2.8%) | 29 (1.5%) |
| $750,000 to $999,999 | 1 (0.0%) | 37 (1.9%) |
| $1,000,000 or more | 10 (0.2%) | 0 (0.0%) |
| Total | 4,365 (100.0%) | 1,921 (100.0%) |
Household Income by Mortgage Status in Chattooga County

| Household Income | Without Mortgage | With Mortgage |
| Less than $10,000 | 263 (6.0%) | 68 (3.5%) |
| $10,000 to $24,999 | 725 (16.6%) | 35 (1.8%) |
| $25,000 to $34,999 | 661 (15.1%) | 175 (9.1%) |
| $35,000 to $49,999 | 708 (16.2%) | 277 (14.4%) |
| $50,000 to $74,999 | 1,099 (25.2%) | 302 (15.7%) |
| $75,000 to $99,999 | 398 (9.1%) | 257 (13.4%) |
| $100,000 to $149,999 | 320 (7.3%) | 271 (14.1%) |
| $150,000 or more | 191 (4.4%) | 405 (21.1%) |
| Total | 4,365 (100.0%) | 1,921 (100.0%) |
Property Value to Household Income Ratio in Chattooga County
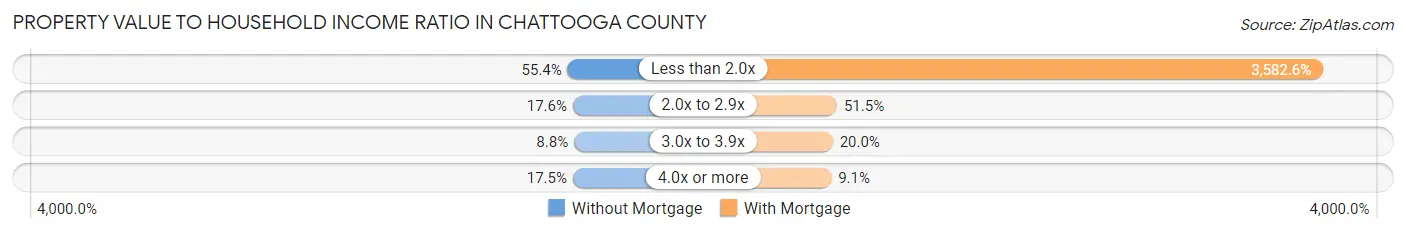
| Value-to-Income Ratio | Without Mortgage | With Mortgage |
| Less than 2.0x | 2,418 (55.4%) | 68,821 (3,582.6%) |
| 2.0x to 2.9x | 769 (17.6%) | 989 (51.5%) |
| 3.0x to 3.9x | 385 (8.8%) | 385 (20.0%) |
| 4.0x or more | 765 (17.5%) | 175 (9.1%) |
| Total | 4,365 (100.0%) | 1,921 (100.0%) |
Real Estate Taxes by Mortgage Status in Chattooga County
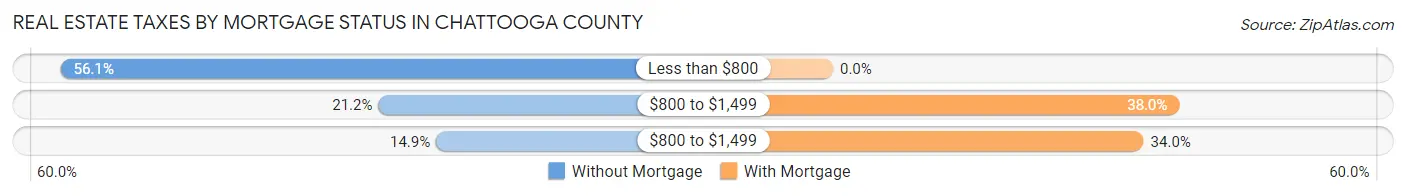
| Property Taxes | Without Mortgage | With Mortgage |
| Less than $800 | 2,447 (56.1%) | 0 (0.0%) |
| $800 to $1,499 | 927 (21.2%) | 729 (38.0%) |
| $800 to $1,499 | 651 (14.9%) | 654 (34.0%) |
| Total | 4,365 (100.0%) | 1,921 (100.0%) |
Health & Disability in Chattooga County
Health Insurance Coverage by Age in Chattooga County
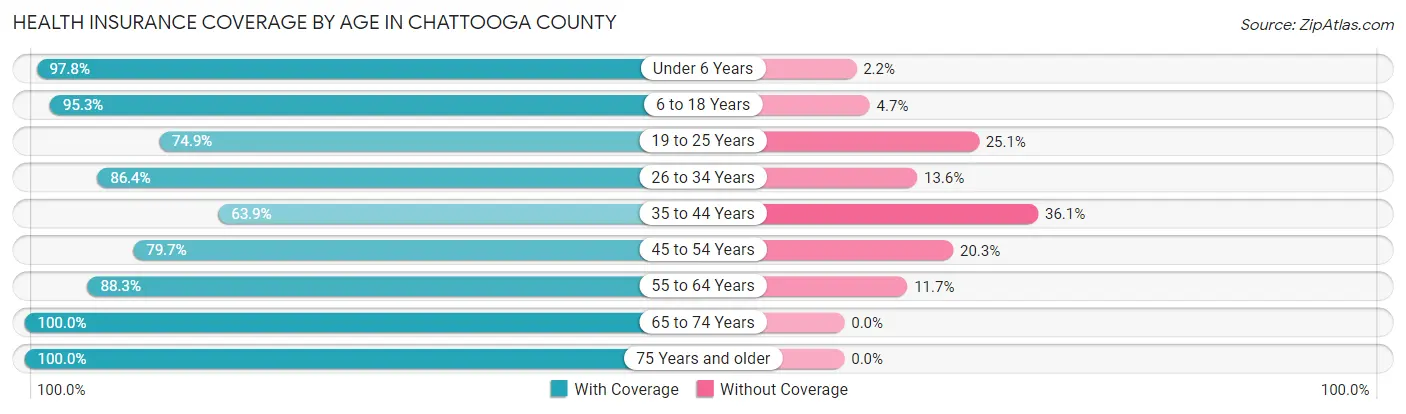
| Age Bracket | With Coverage | Without Coverage |
| Under 6 Years | 1,852 (97.8%) | 42 (2.2%) |
| 6 to 18 Years | 3,602 (95.3%) | 179 (4.7%) |
| 19 to 25 Years | 1,483 (74.9%) | 496 (25.1%) |
| 26 to 34 Years | 1,961 (86.4%) | 308 (13.6%) |
| 35 to 44 Years | 1,789 (63.9%) | 1,012 (36.1%) |
| 45 to 54 Years | 2,367 (79.7%) | 602 (20.3%) |
| 55 to 64 Years | 2,871 (88.3%) | 382 (11.7%) |
| 65 to 74 Years | 2,583 (100.0%) | 0 (0.0%) |
| 75 Years and older | 1,779 (100.0%) | 0 (0.0%) |
| Total | 20,287 (87.0%) | 3,021 (13.0%) |
Health Insurance Coverage by Citizenship Status in Chattooga County
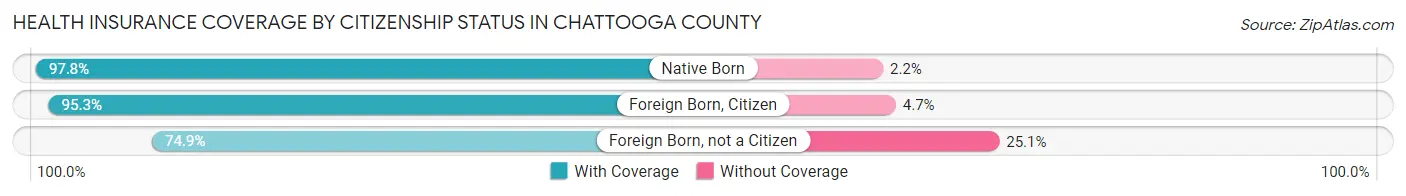
| Citizenship Status | With Coverage | Without Coverage |
| Native Born | 1,852 (97.8%) | 42 (2.2%) |
| Foreign Born, Citizen | 3,602 (95.3%) | 179 (4.7%) |
| Foreign Born, not a Citizen | 1,483 (74.9%) | 496 (25.1%) |
Health Insurance Coverage by Household Income in Chattooga County
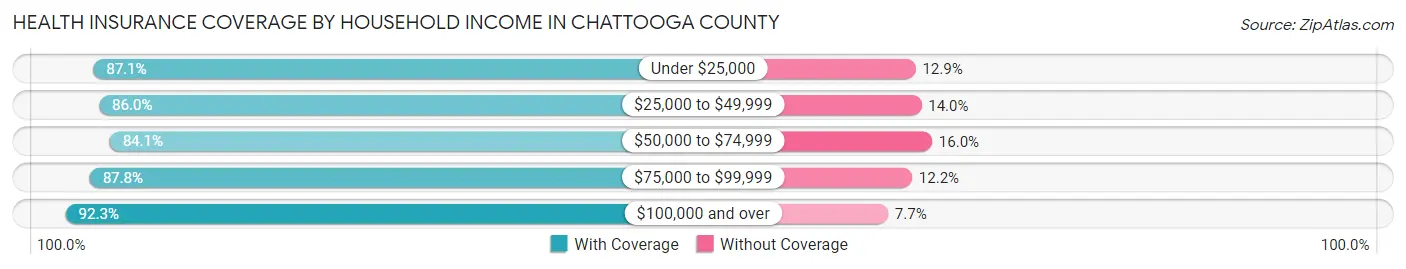
| Household Income | With Coverage | Without Coverage |
| Under $25,000 | 3,601 (87.1%) | 532 (12.9%) |
| $25,000 to $49,999 | 6,368 (86.0%) | 1,033 (14.0%) |
| $50,000 to $74,999 | 4,332 (84.1%) | 822 (16.0%) |
| $75,000 to $99,999 | 2,123 (87.8%) | 295 (12.2%) |
| $100,000 and over | 3,838 (92.3%) | 320 (7.7%) |
Public vs Private Health Insurance Coverage by Age in Chattooga County
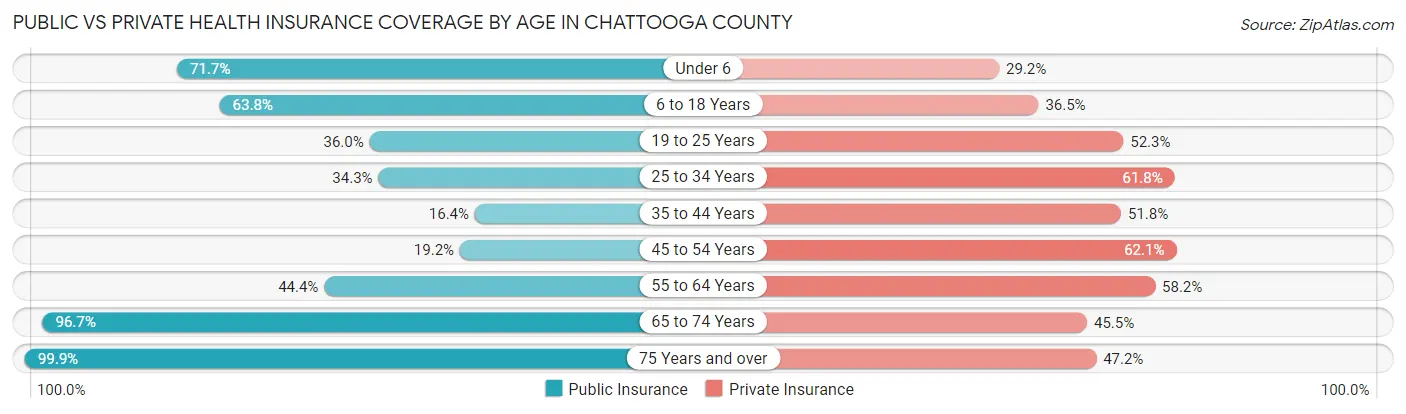
| Age Bracket | Public Insurance | Private Insurance |
| Under 6 | 1,358 (71.7%) | 553 (29.2%) |
| 6 to 18 Years | 2,412 (63.8%) | 1,380 (36.5%) |
| 19 to 25 Years | 712 (36.0%) | 1,034 (52.2%) |
| 25 to 34 Years | 779 (34.3%) | 1,401 (61.8%) |
| 35 to 44 Years | 460 (16.4%) | 1,452 (51.8%) |
| 45 to 54 Years | 570 (19.2%) | 1,843 (62.1%) |
| 55 to 64 Years | 1,444 (44.4%) | 1,892 (58.2%) |
| 65 to 74 Years | 2,497 (96.7%) | 1,176 (45.5%) |
| 75 Years and over | 1,778 (99.9%) | 840 (47.2%) |
| Total | 12,010 (51.5%) | 11,571 (49.6%) |
Disability Status by Sex by Age in Chattooga County
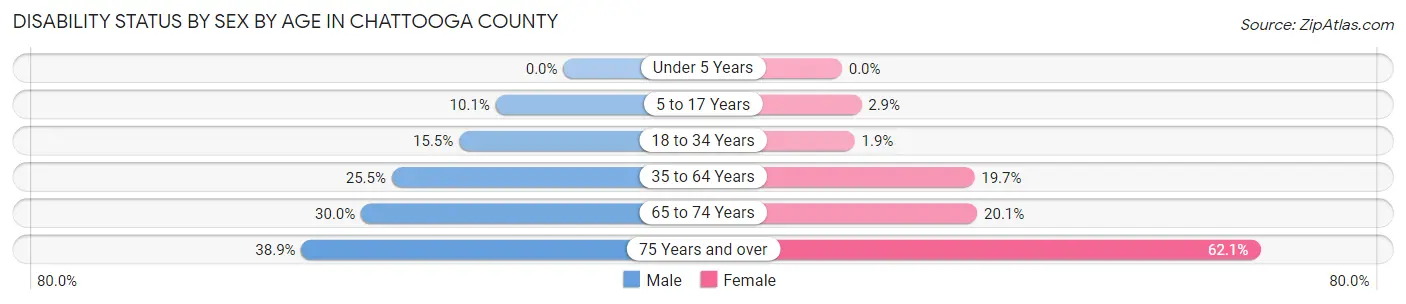
| Age Bracket | Male | Female |
| Under 5 Years | 0 (0.0%) | 0 (0.0%) |
| 5 to 17 Years | 200 (10.1%) | 59 (2.9%) |
| 18 to 34 Years | 336 (15.5%) | 42 (1.9%) |
| 35 to 64 Years | 1,097 (25.5%) | 928 (19.7%) |
| 65 to 74 Years | 360 (30.0%) | 278 (20.1%) |
| 75 Years and over | 305 (38.9%) | 618 (62.1%) |
Disability Class by Sex by Age in Chattooga County
Disability Class: Hearing Difficulty
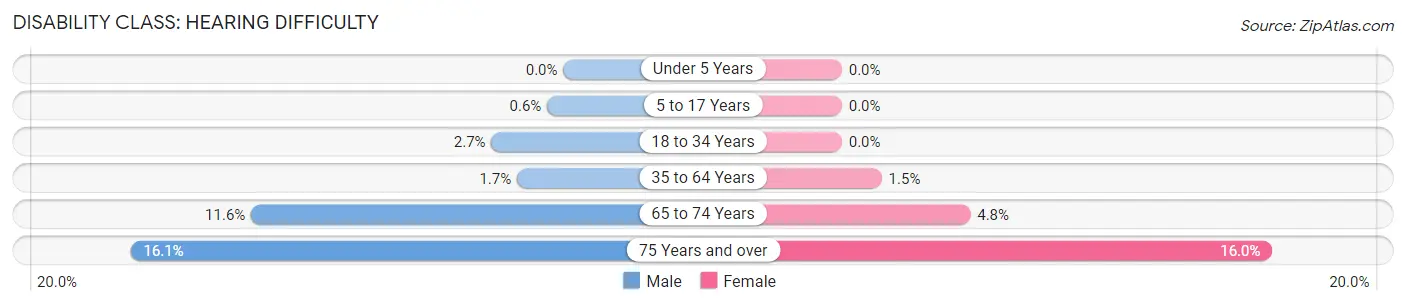
| Age Bracket | Male | Female |
| Under 5 Years | 0 (0.0%) | 0 (0.0%) |
| 5 to 17 Years | 12 (0.6%) | 0 (0.0%) |
| 18 to 34 Years | 58 (2.7%) | 0 (0.0%) |
| 35 to 64 Years | 74 (1.7%) | 70 (1.5%) |
| 65 to 74 Years | 139 (11.6%) | 66 (4.8%) |
| 75 Years and over | 126 (16.1%) | 159 (16.0%) |
Disability Class: Vision Difficulty
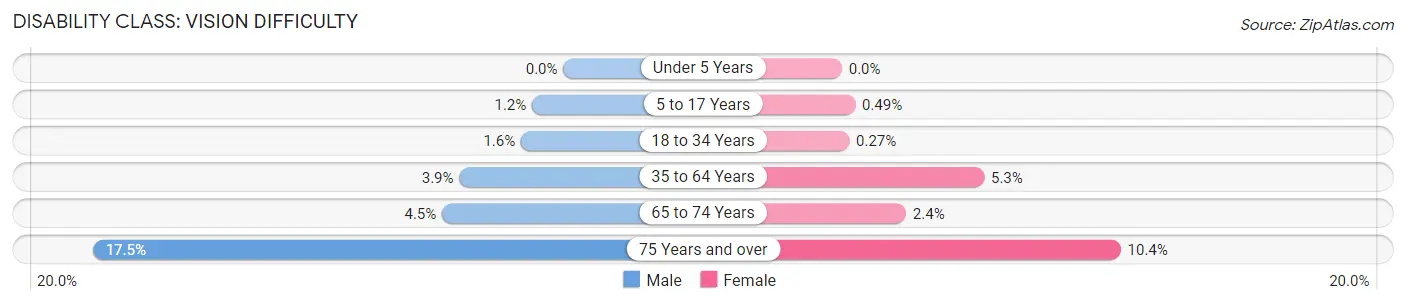
| Age Bracket | Male | Female |
| Under 5 Years | 0 (0.0%) | 0 (0.0%) |
| 5 to 17 Years | 23 (1.2%) | 10 (0.5%) |
| 18 to 34 Years | 34 (1.6%) | 6 (0.3%) |
| 35 to 64 Years | 166 (3.9%) | 249 (5.3%) |
| 65 to 74 Years | 54 (4.5%) | 33 (2.4%) |
| 75 Years and over | 137 (17.5%) | 103 (10.3%) |
Disability Class: Cognitive Difficulty
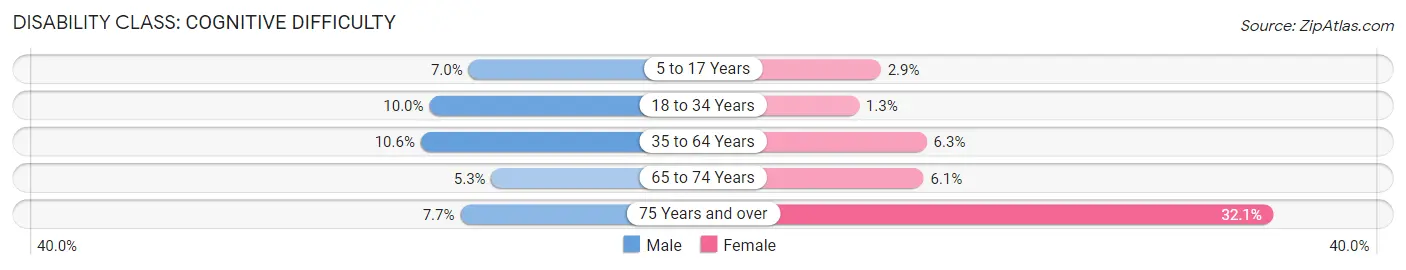
| Age Bracket | Male | Female |
| 5 to 17 Years | 140 (7.0%) | 59 (2.9%) |
| 18 to 34 Years | 216 (10.0%) | 28 (1.3%) |
| 35 to 64 Years | 456 (10.6%) | 297 (6.3%) |
| 65 to 74 Years | 64 (5.3%) | 84 (6.1%) |
| 75 Years and over | 60 (7.6%) | 319 (32.1%) |
Disability Class: Ambulatory Difficulty

| Age Bracket | Male | Female |
| 5 to 17 Years | 71 (3.6%) | 0 (0.0%) |
| 18 to 34 Years | 46 (2.1%) | 10 (0.4%) |
| 35 to 64 Years | 650 (15.1%) | 569 (12.1%) |
| 65 to 74 Years | 225 (18.8%) | 215 (15.5%) |
| 75 Years and over | 129 (16.5%) | 459 (46.1%) |
Disability Class: Self-Care Difficulty
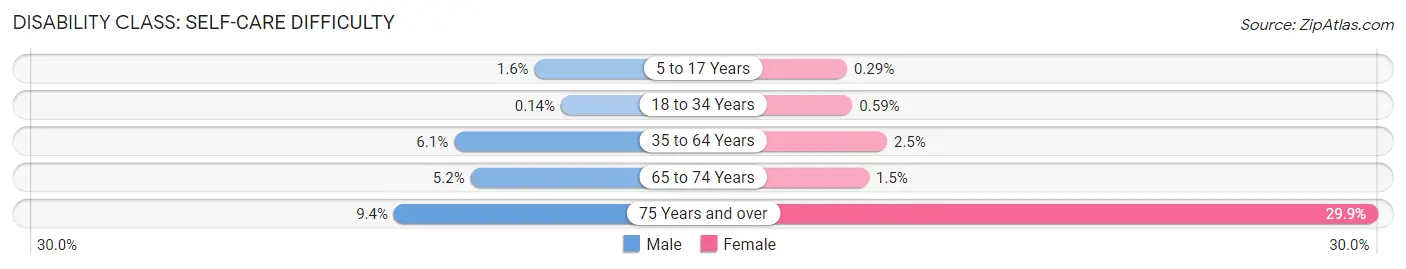
| Age Bracket | Male | Female |
| 5 to 17 Years | 32 (1.6%) | 6 (0.3%) |
| 18 to 34 Years | 3 (0.1%) | 13 (0.6%) |
| 35 to 64 Years | 262 (6.1%) | 119 (2.5%) |
| 65 to 74 Years | 62 (5.2%) | 21 (1.5%) |
| 75 Years and over | 74 (9.4%) | 297 (29.8%) |
Technology Access in Chattooga County
Computing Device Access in Chattooga County
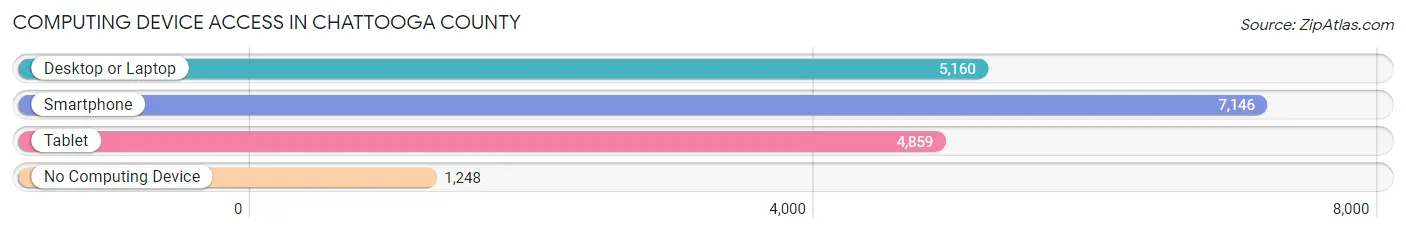
| Device Type | # Households | % Households |
| Desktop or Laptop | 5,160 | 55.5% |
| Smartphone | 7,146 | 76.9% |
| Tablet | 4,859 | 52.3% |
| No Computing Device | 1,248 | 13.4% |
| Total | 9,292 | 100.0% |
Internet Access in Chattooga County
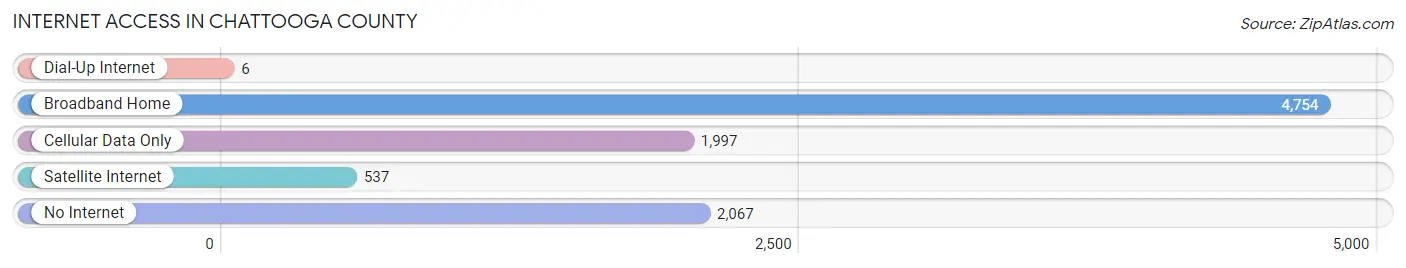
| Internet Type | # Households | % Households |
| Dial-Up Internet | 6 | 0.1% |
| Broadband Home | 4,754 | 51.2% |
| Cellular Data Only | 1,997 | 21.5% |
| Satellite Internet | 537 | 5.8% |
| No Internet | 2,067 | 22.2% |
| Total | 9,292 | 100.0% |
Chattooga County Summary
Chattooga County, Georgia is located in the northwest corner of the state, bordering both Alabama and South Carolina. It is part of the Chattanooga, TN-GA Metropolitan Statistical Area and is home to approximately 26,000 people. The county seat is Summerville, and the largest city is Trion.
Geography
Chattooga County is located in the foothills of the Appalachian Mountains and is part of the Ridge and Valley region of Georgia. The county is mostly mountainous, with elevations ranging from 600 to 1,800 feet above sea level. The highest point in the county is Lookout Mountain, which rises to 2,400 feet. The county is drained by the Chattooga River, which flows through the county from north to south. Other major waterways include the Coosawattee River, which forms the county’s western border, and the Conasauga River, which forms the county’s eastern border.
The county is mostly forested, with the majority of the land being used for timber production. There are also several small farms in the county, mostly producing hay, corn, and soybeans.
History
Chattooga County was created in 1838 from parts of Walker and Floyd counties. It was named for the Chattooga River, which was named by the Cherokee Indians who once lived in the area. The county was originally part of the Cherokee Nation, but was ceded to the United States in 1817.
The county was largely rural until the late 19th century, when the railroad was built through the area. This brought an influx of new settlers and businesses, and the county’s population began to grow. The county’s economy was largely based on agriculture and timber production until the early 20th century, when the textile industry began to take hold. The county’s population continued to grow throughout the 20th century, and today it is home to a diverse mix of people and industries.
Economy
The economy of Chattooga County is largely based on manufacturing and agriculture. The county is home to several large manufacturing plants, including a carpet mill, a paper mill, and a furniture factory. The county is also home to several small businesses, including restaurants, retail stores, and service providers.
Agriculture is still an important part of the county’s economy, with hay, corn, and soybeans being the main crops. The county is also home to several large poultry farms, which produce eggs and chicken for the local market.
Demographics
As of the 2010 census, the population of Chattooga County was 26,015. The population is largely white (86.3%), with African Americans making up 8.3% of the population and Hispanics making up 4.2%. The median household income is $37,845, and the median age is 40.
Chattooga County is home to several small towns and communities, including Summerville, Trion, Lyerly, and Menlo. The county is served by the Chattooga County School System, which consists of seven elementary schools, two middle schools, and one high school. The county is also home to several private schools, including a Christian school and a Montessori school.
Conclusion
Chattooga County, Georgia is a rural county located in the northwest corner of the state. It is home to a diverse population and a variety of industries, including manufacturing, agriculture, and timber production. The county is served by the Chattooga County School System and is home to several small towns and communities. With its rich history and beautiful scenery, Chattooga County is a great place to live and work.
Common Questions
What is the Total Population of Chattooga County?
Total Population of Chattooga County is 24,902.
What is the Total Male Population of Chattooga County?
Total Male Population of Chattooga County is 12,763.
What is the Total Female Population of Chattooga County?
Total Female Population of Chattooga County is 12,139.
What is the Ratio of Males per 100 Females in Chattooga County?
There are 105.14 Males per 100 Females in Chattooga County.
What is the Ratio of Females per 100 Males in Chattooga County?
There are 95.11 Females per 100 Males in Chattooga County.
What is the Median Population Age in Chattooga County?
Median Population Age in Chattooga County is 40.2 Years.
What is the Average Family Size in Chattooga County
Average Family Size in Chattooga County is 3.1 People.
What is the Average Household Size in Chattooga County
Average Household Size in Chattooga County is 2.5 People.
What is Per Capita Income in Chattooga County?
Per Capita income in Chattooga County is $21,576.
What is the Median Family Income in Chattooga County?
Median Family Income in Chattooga County is $50,661.
What is the Median Household income in Chattooga County?
Median Household Income in Chattooga County is $43,556.
What is Income or Wage Gap in Chattooga County?
Income or Wage Gap in Chattooga County is 26.1%.
Women in Chattooga County earn 73.9 cents for every dollar earned by a man.
What is Family Income Deficit in Chattooga County?
Family Income Deficit in Chattooga County is $9,473.
Families that are below poverty line in Chattooga County earn $9,473 less on average than the poverty threshold level.
What is Inequality or Gini Index in Chattooga County?
Inequality or Gini Index in Chattooga County is 0.42.
How Large is the Labor Force in Chattooga County?
There are 9,613 People in the Labor Forcein in Chattooga County.
What is the Percentage of People in the Labor Force in Chattooga County?
48.5% of People are in the Labor Force in Chattooga County.
What is the Unemployment Rate in Chattooga County?
Unemployment Rate in Chattooga County is 4.7%.