Burke County, GA
Burke County Map
Burke County Overview
24,337
TOTAL POPULATION
11,944
MALE POPULATION
12,393
FEMALE POPULATION
96.38
MALES / 100 FEMALES
103.76
FEMALES / 100 MALES
38.8
MEDIAN AGE
3.5
AVG FAMILY SIZE
2.7
AVG HOUSEHOLD SIZE
$29,735
PER CAPITA INCOME
$60,368
AVG FAMILY INCOME
$50,321
AVG HOUSEHOLD INCOME
44.5%
WAGE / INCOME GAP [ % ]
55.5¢/ $1
WAGE / INCOME GAP [ $ ]
0.52
INEQUALITY / GINI INDEX
11,145
LABOR FORCE [ PEOPLE ]
58.3%
PERCENT IN LABOR FORCE
5.2%
UNEMPLOYMENT RATE
Race in Burke County
The most populous races in Burke County are White / Caucasian (12,127 | 49.8%), Black / African American (11,095 | 45.6%), and Hispanic or Latino (863 | 3.5%).

| Race | # Population | % Population |
| Asian | 122 | 0.5% |
| Black / African American | 11,095 | 45.6% |
| Hawaiian / Pacific | 0 | 0.0% |
| Hispanic or Latino | 863 | 3.5% |
| Native / Alaskan | 0 | 0.0% |
| White / Caucasian | 12,127 | 49.8% |
| Two or more Races | 670 | 2.8% |
| Some other Race | 323 | 1.3% |
| Total | 24,337 | 100.0% |
Ancestry in Burke County
The most populous ancestries reported in Burke County are English (1,583 | 6.5%), Irish (1,447 | 5.9%), American (1,220 | 5.0%), German (753 | 3.1%), and Mexican (595 | 2.4%), together accounting for 23.0% of all Burke County residents.

| Ancestry | # Population | % Population |
| African | 523 | 2.1% |
| American | 1,220 | 5.0% |
| Arab | 20 | 0.1% |
| Bhutanese | 8 | 0.0% |
| Blackfeet | 24 | 0.1% |
| British | 62 | 0.3% |
| Burmese | 108 | 0.4% |
| Central American | 37 | 0.2% |
| Cherokee | 139 | 0.6% |
| Creek | 2 | 0.0% |
| Cuban | 3 | 0.0% |
| Dominican | 69 | 0.3% |
| Dutch | 171 | 0.7% |
| English | 1,583 | 6.5% |
| European | 347 | 1.4% |
| Finnish | 12 | 0.1% |
| French | 343 | 1.4% |
| German | 753 | 3.1% |
| Guyanese | 71 | 0.3% |
| Haitian | 5 | 0.0% |
| Hungarian | 11 | 0.1% |
| Irish | 1,447 | 5.9% |
| Italian | 524 | 2.1% |
| Jamaican | 6 | 0.0% |
| Korean | 18 | 0.1% |
| Lebanese | 20 | 0.1% |
| Mexican | 595 | 2.4% |
| Northern European | 31 | 0.1% |
| Norwegian | 52 | 0.2% |
| Polish | 161 | 0.7% |
| Portuguese | 11 | 0.1% |
| Puerto Rican | 131 | 0.5% |
| Russian | 38 | 0.2% |
| Salvadoran | 37 | 0.2% |
| Scandinavian | 77 | 0.3% |
| Scotch-Irish | 193 | 0.8% |
| Scottish | 271 | 1.1% |
| Shoshone | 2 | 0.0% |
| Slavic | 2 | 0.0% |
| Spaniard | 27 | 0.1% |
| Spanish | 1 | 0.0% |
| Subsaharan African | 523 | 2.1% |
| Swedish | 183 | 0.7% |
| Swiss | 29 | 0.1% |
| Thai | 75 | 0.3% |
| Trinidadian and Tobagonian | 6 | 0.0% |
| Welsh | 4 | 0.0% | View All 47 Rows |
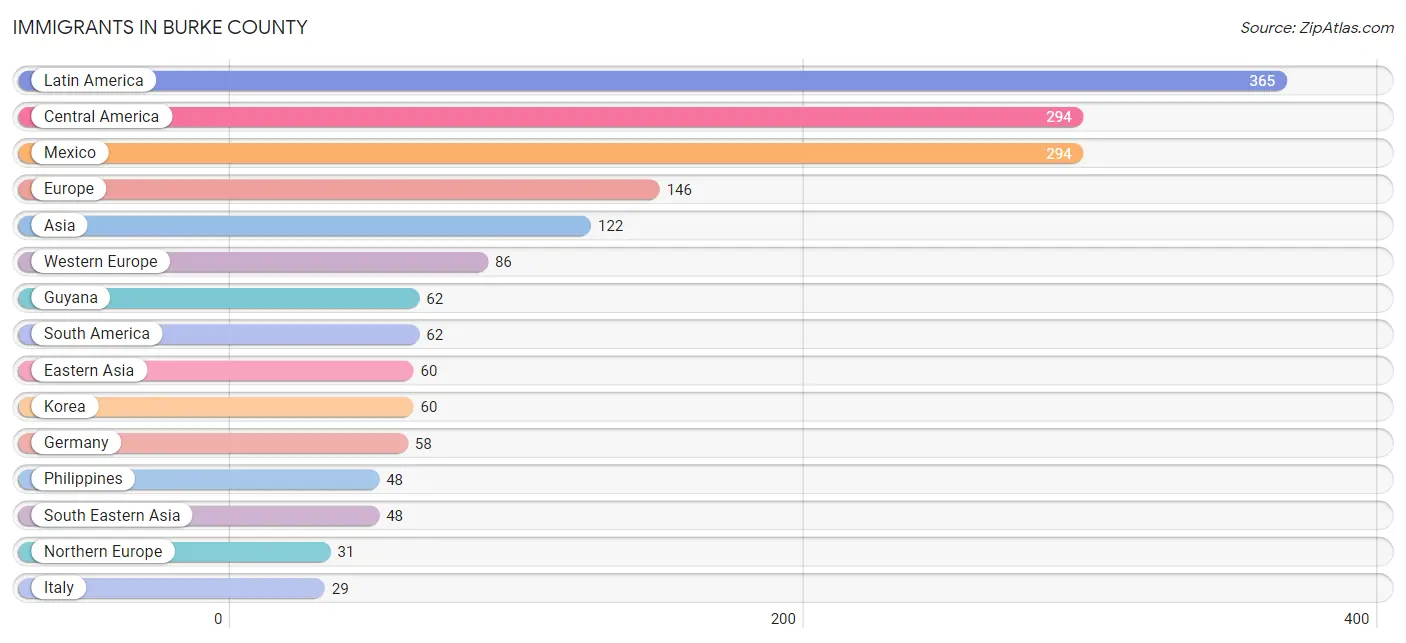
Immigrants in Burke County
The most numerous immigrant groups reported in Burke County came from Latin America (365 | 1.5%), Central America (294 | 1.2%), Mexico (294 | 1.2%), Europe (146 | 0.6%), and Asia (122 | 0.5%), together accounting for 5.0% of all Burke County residents.
| Immigration Origin | # Population | % Population |
| Asia | 122 | 0.5% |
| Caribbean | 9 | 0.0% |
| Central America | 294 | 1.2% |
| Cuba | 3 | 0.0% |
| Eastern Asia | 60 | 0.3% |
| England | 14 | 0.1% |
| Europe | 146 | 0.6% |
| France | 28 | 0.1% |
| Germany | 58 | 0.2% |
| Guyana | 62 | 0.3% |
| India | 7 | 0.0% |
| Ireland | 17 | 0.1% |
| Italy | 29 | 0.1% |
| Jamaica | 6 | 0.0% |
| Korea | 60 | 0.3% |
| Latin America | 365 | 1.5% |
| Mexico | 294 | 1.2% |
| Northern Europe | 31 | 0.1% |
| Pakistan | 7 | 0.0% |
| Philippines | 48 | 0.2% |
| South America | 62 | 0.3% |
| South Central Asia | 14 | 0.1% |
| South Eastern Asia | 48 | 0.2% |
| Southern Europe | 29 | 0.1% |
| Western Europe | 86 | 0.4% | View All 25 Rows |
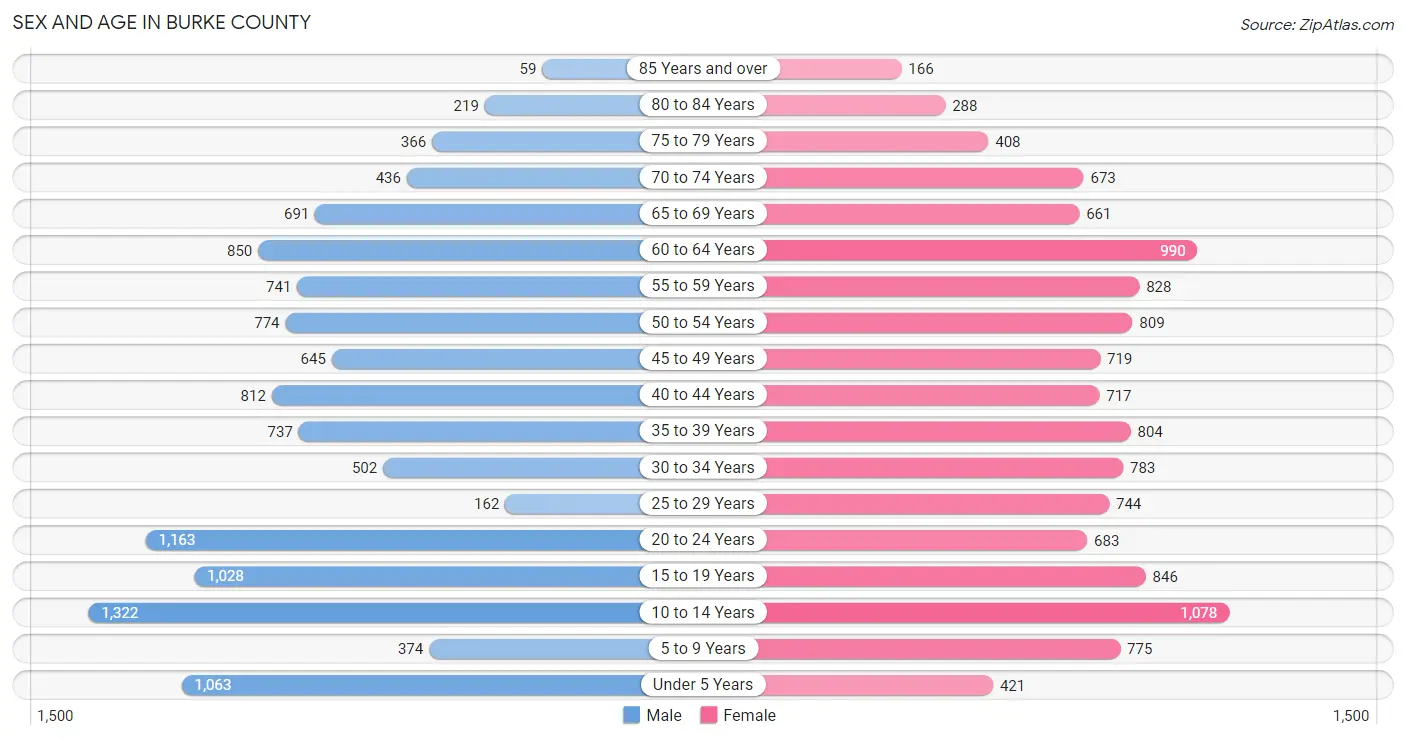
Sex and Age in Burke County
Sex and Age in Burke County
The most populous age groups in Burke County are 10 to 14 Years (1,322 | 11.1%) for men and 10 to 14 Years (1,078 | 8.7%) for women.
| Age Bracket | Male | Female |
| Under 5 Years | 1,063 (8.9%) | 421 (3.4%) |
| 5 to 9 Years | 374 (3.1%) | 775 (6.2%) |
| 10 to 14 Years | 1,322 (11.1%) | 1,078 (8.7%) |
| 15 to 19 Years | 1,028 (8.6%) | 846 (6.8%) |
| 20 to 24 Years | 1,163 (9.7%) | 683 (5.5%) |
| 25 to 29 Years | 162 (1.4%) | 744 (6.0%) |
| 30 to 34 Years | 502 (4.2%) | 783 (6.3%) |
| 35 to 39 Years | 737 (6.2%) | 804 (6.5%) |
| 40 to 44 Years | 812 (6.8%) | 717 (5.8%) |
| 45 to 49 Years | 645 (5.4%) | 719 (5.8%) |
| 50 to 54 Years | 774 (6.5%) | 809 (6.5%) |
| 55 to 59 Years | 741 (6.2%) | 828 (6.7%) |
| 60 to 64 Years | 850 (7.1%) | 990 (8.0%) |
| 65 to 69 Years | 691 (5.8%) | 661 (5.3%) |
| 70 to 74 Years | 436 (3.6%) | 673 (5.4%) |
| 75 to 79 Years | 366 (3.1%) | 408 (3.3%) |
| 80 to 84 Years | 219 (1.8%) | 288 (2.3%) |
| 85 Years and over | 59 (0.5%) | 166 (1.3%) |
| Total | 11,944 (100.0%) | 12,393 (100.0%) |
Families and Households in Burke County
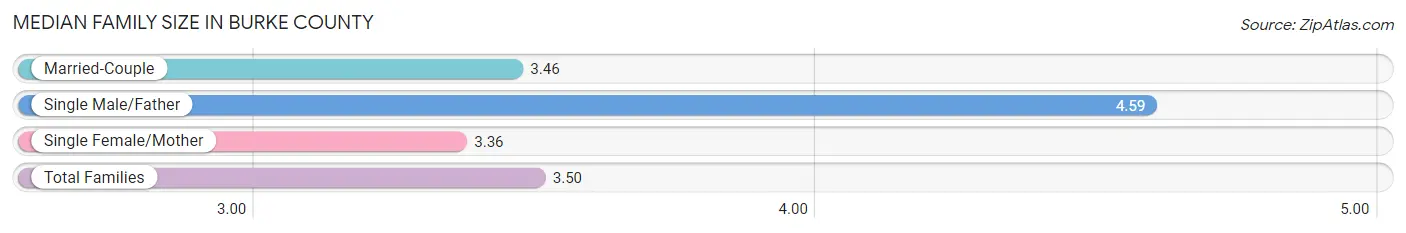
Median Family Size in Burke County
The median family size in Burke County is 3.50 persons per family, with single male/father families (356 | 6.2%) accounting for the largest median family size of 4.59 persons per family. On the other hand, single female/mother families (1,543 | 27.0%) represent the smallest median family size with 3.36 persons per family.
| Family Type | # Families | Family Size |
| Married-Couple | 3,822 (66.8%) | 3.46 |
| Single Male/Father | 356 (6.2%) | 4.59 |
| Single Female/Mother | 1,543 (27.0%) | 3.36 |
| Total Families | 5,721 (100.0%) | 3.50 |
Median Household Size in Burke County
The median household size in Burke County is 2.70 persons per household, with single male/father households (356 | 4.0%) accounting for the largest median household size of 4.79 persons per household. non-family households (3,192 | 35.8%) represent the smallest median household size with 1.07 persons per household.

| Household Type | # Households | Household Size |
| Married-Couple | 3,822 (42.9%) | 3.55 |
| Single Male/Father | 356 (4.0%) | 4.79 |
| Single Female/Mother | 1,543 (17.3%) | 3.52 |
| Non-family | 3,192 (35.8%) | 1.07 |
| Total Households | 8,913 (100.0%) | 2.70 |
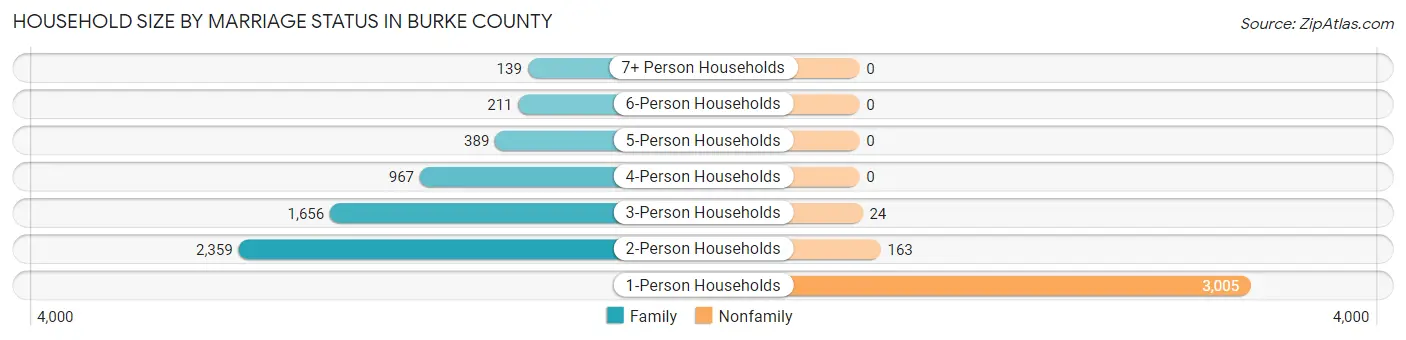
Household Size by Marriage Status in Burke County
Out of a total of 8,913 households in Burke County, 5,721 (64.2%) are family households, while 3,192 (35.8%) are nonfamily households. The most numerous type of family households are 2-person households, comprising 2,359, and the most common type of nonfamily households are 1-person households, comprising 3,005.
| Household Size | Family Households | Nonfamily Households |
| 1-Person Households | - | 3,005 (33.7%) |
| 2-Person Households | 2,359 (26.5%) | 163 (1.8%) |
| 3-Person Households | 1,656 (18.6%) | 24 (0.3%) |
| 4-Person Households | 967 (10.8%) | 0 (0.0%) |
| 5-Person Households | 389 (4.4%) | 0 (0.0%) |
| 6-Person Households | 211 (2.4%) | 0 (0.0%) |
| 7+ Person Households | 139 (1.6%) | 0 (0.0%) |
| Total | 5,721 (64.2%) | 3,192 (35.8%) |
Female Fertility in Burke County
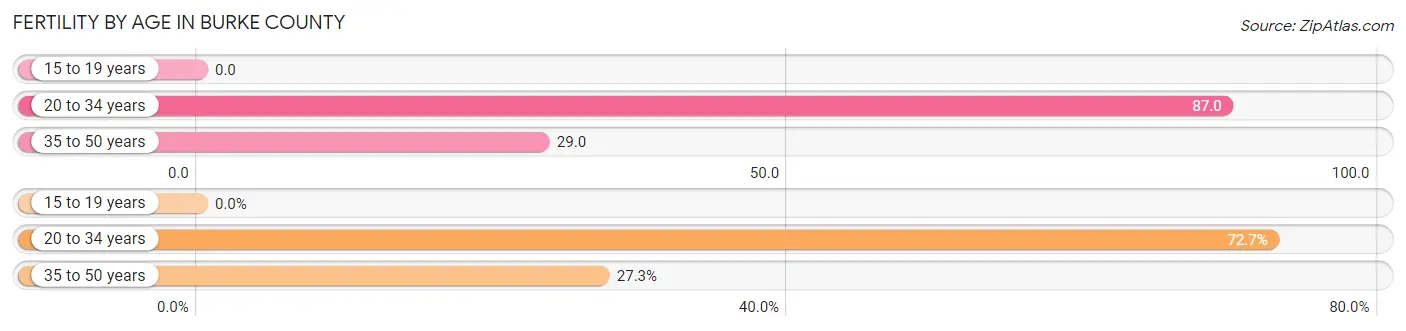
Fertility by Age in Burke County
Average fertility rate in Burke County is 48.0 births per 1,000 women. Women in the age bracket of 20 to 34 years have the highest fertility rate with 87.0 births per 1,000 women. Women in the age bracket of 20 to 34 years acount for 72.7% of all women with births.
| Age Bracket | Women with Births | Births / 1,000 Women |
| 15 to 19 years | 0 (0.0%) | 0.0 |
| 20 to 34 years | 192 (72.7%) | 87.0 |
| 35 to 50 years | 72 (27.3%) | 29.0 |
| Total | 264 (100.0%) | 48.0 |
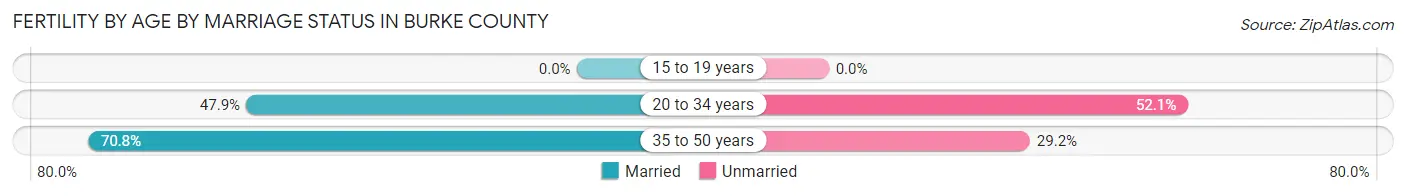
Fertility by Age by Marriage Status in Burke County
54.2% of women with births (264) in Burke County are married. The highest percentage of unmarried women with births falls into 20 to 34 years age bracket with 52.1% of them unmarried at the time of birth, while the lowest percentage of unmarried women with births belong to 35 to 50 years age bracket with 29.2% of them unmarried.
| Age Bracket | Married | Unmarried |
| 15 to 19 years | 0 (0.0%) | 0 (0.0%) |
| 20 to 34 years | 92 (47.9%) | 100 (52.1%) |
| 35 to 50 years | 51 (70.8%) | 21 (29.2%) |
| Total | 143 (54.2%) | 121 (45.8%) |
Fertility by Education in Burke County
Average fertility rate in Burke County is 48.0 births per 1,000 women. Women with the education attainment of bachelor's degree have the highest fertility rate of 85.0 births per 1,000 women, while women with the education attainment of less than high school have the lowest fertility at 39.0 births per 1,000 women. Women with the education attainment of high school diploma represent 30.3% of all women with births.

| Educational Attainment | Women with Births | Births / 1,000 Women |
| Less than High School | 38 (14.4%) | 39.0 |
| High School Diploma | 80 (30.3%) | 45.0 |
| College or Associate's Degree | 76 (28.8%) | 40.0 |
| Bachelor's Degree | 59 (22.4%) | 85.0 |
| Graduate Degree | 11 (4.2%) | 64.0 |
| Total | 264 (100.0%) | 48.0 |
Fertility by Education by Marriage Status in Burke County
45.8% of women with births in Burke County are unmarried. Women with the educational attainment of bachelor's degree are most likely to be married with 100.0% of them married at childbirth, while women with the educational attainment of less than high school are least likely to be married with 100.0% of them unmarried at childbirth.

| Educational Attainment | Married | Unmarried |
| Less than High School | 0 (0.0%) | 38 (100.0%) |
| High School Diploma | 18 (22.5%) | 62 (77.5%) |
| College or Associate's Degree | 55 (72.4%) | 21 (27.6%) |
| Bachelor's Degree | 59 (100.0%) | 0 (0.0%) |
| Graduate Degree | 11 (100.0%) | 0 (0.0%) |
| Total | 143 (54.2%) | 121 (45.8%) |
Income in Burke County
Income Overview in Burke County
Per Capita Income in Burke County is $29,735, while median incomes of families and households are $60,368 and $50,321 respectively.
| Characteristic | Number | Measure |
| Per Capita Income | 24,337 | $29,735 |
| Median Family Income | 5,721 | $60,368 |
| Mean Family Income | 5,721 | $84,035 |
| Median Household Income | 8,913 | $50,321 |
| Mean Household Income | 8,913 | $77,372 |
| Income Deficit | 5,721 | $0 |
| Wage / Income Gap (%) | 24,337 | 44.54% |
| Wage / Income Gap ($) | 24,337 | 55.46¢ per $1 |
| Gini / Inequality Index | 24,337 | 0.52 |
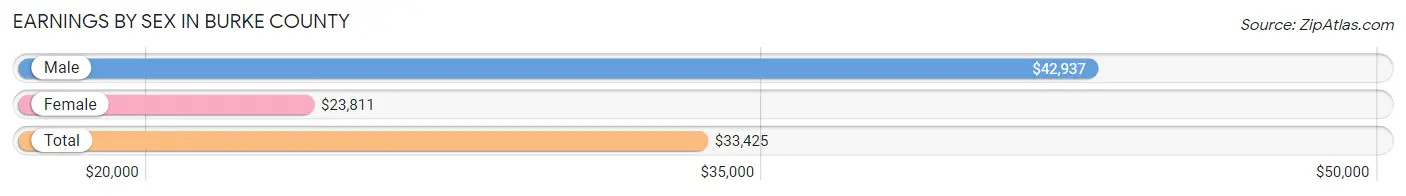
Earnings by Sex in Burke County
Average Earnings in Burke County are $33,425, $42,937 for men and $23,811 for women, a difference of 44.5%.
| Sex | Number | Average Earnings |
| Male | 5,827 (52.3%) | $42,937 |
| Female | 5,305 (47.7%) | $23,811 |
| Total | 11,132 (100.0%) | $33,425 |
Earnings by Sex by Income Bracket in Burke County
The most common earnings brackets in Burke County are $100,000+ for men (719 | 12.3%) and $35,000 to $39,999 for women (455 | 8.6%).
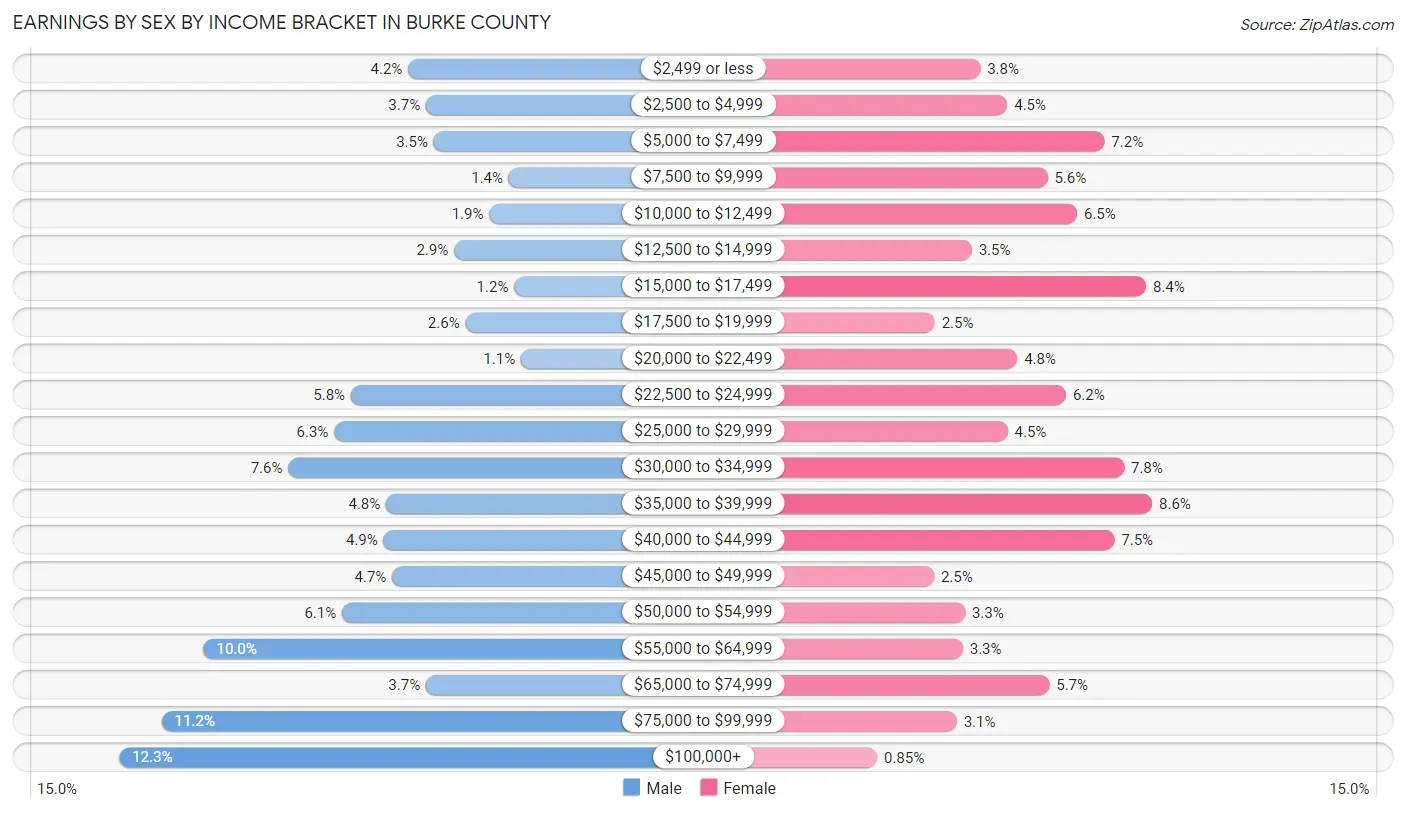
| Income | Male | Female |
| $2,499 or less | 246 (4.2%) | 199 (3.7%) |
| $2,500 to $4,999 | 217 (3.7%) | 239 (4.5%) |
| $5,000 to $7,499 | 204 (3.5%) | 384 (7.2%) |
| $7,500 to $9,999 | 81 (1.4%) | 299 (5.6%) |
| $10,000 to $12,499 | 113 (1.9%) | 343 (6.5%) |
| $12,500 to $14,999 | 171 (2.9%) | 186 (3.5%) |
| $15,000 to $17,499 | 72 (1.2%) | 446 (8.4%) |
| $17,500 to $19,999 | 152 (2.6%) | 131 (2.5%) |
| $20,000 to $22,499 | 61 (1.1%) | 254 (4.8%) |
| $22,500 to $24,999 | 340 (5.8%) | 327 (6.2%) |
| $25,000 to $29,999 | 367 (6.3%) | 240 (4.5%) |
| $30,000 to $34,999 | 442 (7.6%) | 413 (7.8%) |
| $35,000 to $39,999 | 282 (4.8%) | 455 (8.6%) |
| $40,000 to $44,999 | 286 (4.9%) | 399 (7.5%) |
| $45,000 to $49,999 | 272 (4.7%) | 130 (2.5%) |
| $50,000 to $54,999 | 354 (6.1%) | 176 (3.3%) |
| $55,000 to $64,999 | 581 (10.0%) | 173 (3.3%) |
| $65,000 to $74,999 | 217 (3.7%) | 302 (5.7%) |
| $75,000 to $99,999 | 650 (11.2%) | 164 (3.1%) |
| $100,000+ | 719 (12.3%) | 45 (0.9%) |
| Total | 5,827 (100.0%) | 5,305 (100.0%) |
Earnings by Sex by Educational Attainment in Burke County
Average earnings in Burke County are $52,039 for men and $30,223 for women, a difference of 41.9%. Men with an educational attainment of bachelor's degree enjoy the highest average annual earnings of $94,418, while those with less than high school education earn the least with $32,639. Women with an educational attainment of bachelor's degree earn the most with the average annual earnings of $40,826, while those with less than high school education have the smallest earnings of $16,290.

| Educational Attainment | Male Income | Female Income |
| Less than High School | $32,639 | $16,290 |
| High School Diploma | $48,074 | $33,624 |
| College or Associate's Degree | $55,717 | $24,488 |
| Bachelor's Degree | $94,418 | $40,826 |
| Graduate Degree | - | - |
| Total | $52,039 | $30,223 |
Family Income in Burke County
Family Income Brackets in Burke County
According to the Burke County family income data, there are 1,219 families falling into the $100,000 to $149,999 income range, which is the most common income bracket and makes up 21.3% of all families. Conversely, the $200,000+ income bracket is the least frequent group with only 297 families (5.2%) belonging to this category.
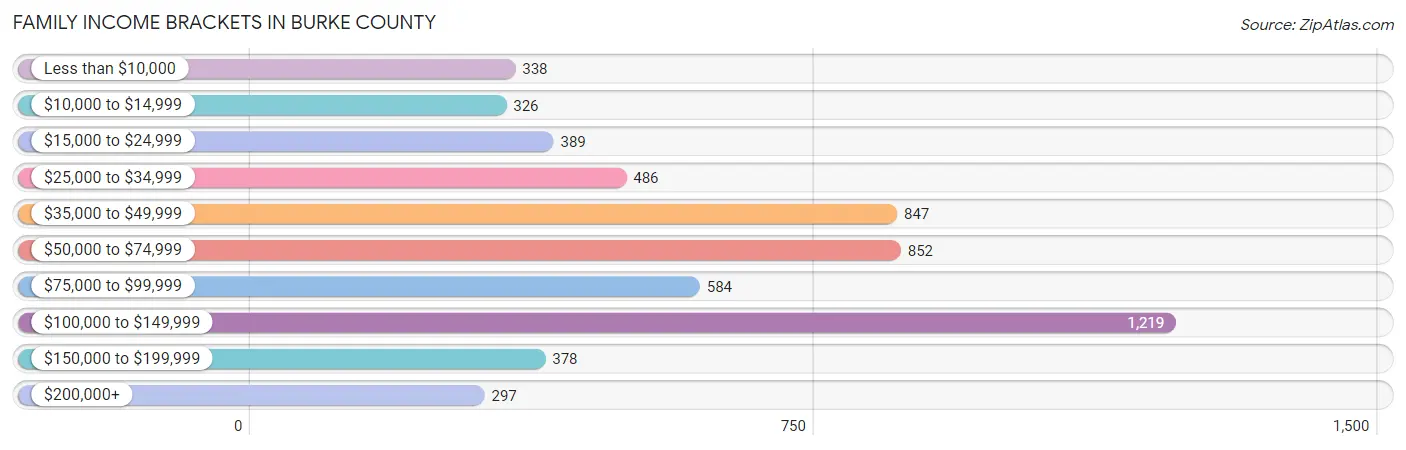
| Income Bracket | # Families | % Families |
| Less than $10,000 | 338 | 5.9% |
| $10,000 to $14,999 | 326 | 5.7% |
| $15,000 to $24,999 | 389 | 6.8% |
| $25,000 to $34,999 | 486 | 8.5% |
| $35,000 to $49,999 | 847 | 14.8% |
| $50,000 to $74,999 | 852 | 14.9% |
| $75,000 to $99,999 | 584 | 10.2% |
| $100,000 to $149,999 | 1,219 | 21.3% |
| $150,000 to $199,999 | 378 | 6.6% |
| $200,000+ | 297 | 5.2% |
Family Income by Famaliy Size in Burke County
4-person families (866 | 15.1%) account for the highest median family income in Burke County with $113,354 per family, while 4-person families (866 | 15.1%) have the highest median income of $28,338 per family member.
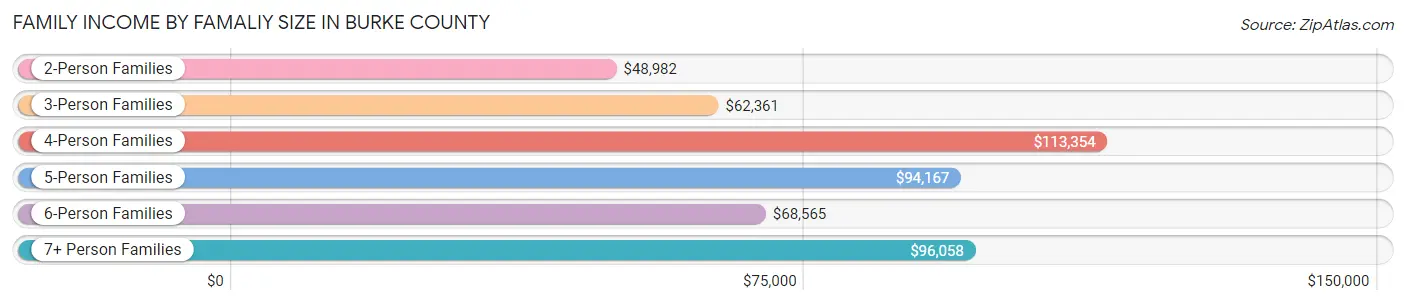
| Income Bracket | # Families | Median Income |
| 2-Person Families | 2,554 (44.6%) | $48,982 |
| 3-Person Families | 1,609 (28.1%) | $62,361 |
| 4-Person Families | 866 (15.1%) | $113,354 |
| 5-Person Families | 354 (6.2%) | $94,167 |
| 6-Person Families | 242 (4.2%) | $68,565 |
| 7+ Person Families | 96 (1.7%) | $96,058 |
| Total | 5,721 (100.0%) | $60,368 |
Family Income by Number of Earners in Burke County
The median family income in Burke County is $60,368, with families comprising 3+ earners (814) having the highest median family income of $117,373, while families with 1 earner (2,171) have the lowest median family income of $41,191, accounting for 14.2% and 38.0% of families, respectively.
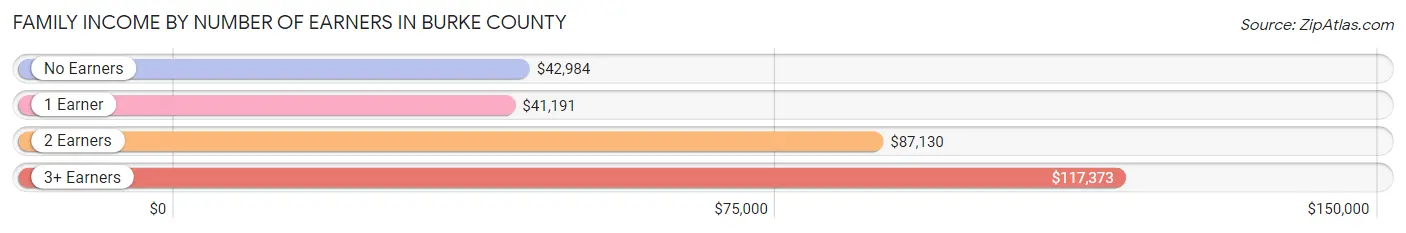
| Number of Earners | # Families | Median Income |
| No Earners | 1,076 (18.8%) | $42,984 |
| 1 Earner | 2,171 (38.0%) | $41,191 |
| 2 Earners | 1,660 (29.0%) | $87,130 |
| 3+ Earners | 814 (14.2%) | $117,373 |
| Total | 5,721 (100.0%) | $60,368 |
Household Income in Burke County
Household Income Brackets in Burke County
With 1,471 households falling in the category, the $50,000 to $74,999 income range is the most frequent in Burke County, accounting for 16.5% of all households. In contrast, only 401 households (4.5%) fall into the $200,000+ income bracket, making it the least populous group.
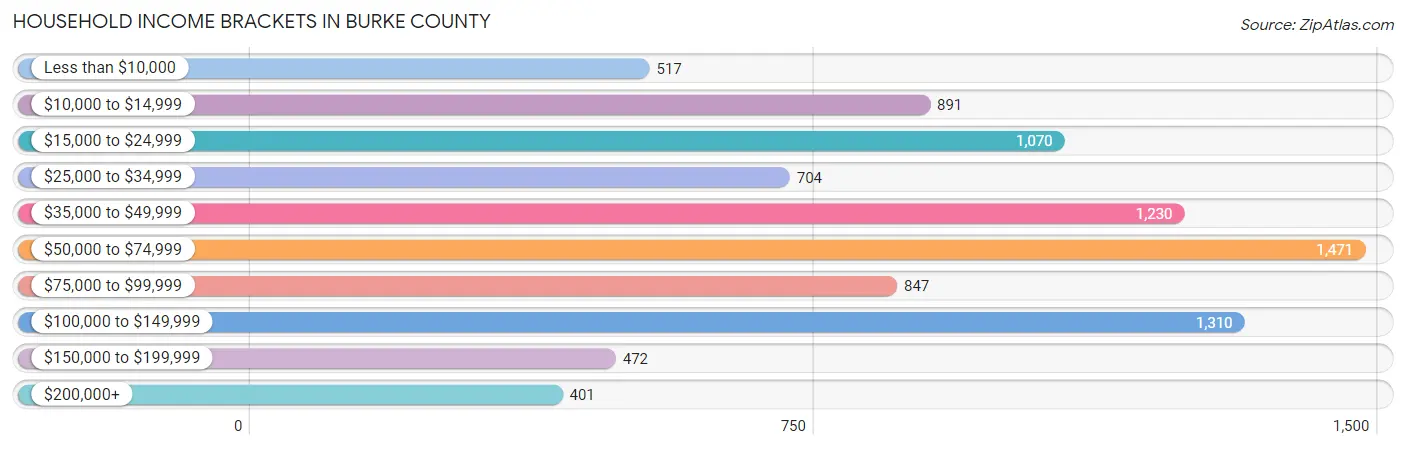
| Income Bracket | # Households | % Households |
| Less than $10,000 | 517 | 5.8% |
| $10,000 to $14,999 | 891 | 10.0% |
| $15,000 to $24,999 | 1,070 | 12.0% |
| $25,000 to $34,999 | 704 | 7.9% |
| $35,000 to $49,999 | 1,230 | 13.8% |
| $50,000 to $74,999 | 1,471 | 16.5% |
| $75,000 to $99,999 | 847 | 9.5% |
| $100,000 to $149,999 | 1,310 | 14.7% |
| $150,000 to $199,999 | 472 | 5.3% |
| $200,000+ | 401 | 4.5% |
Household Income by Householder Age in Burke County
The median household income in Burke County is $50,321, with the highest median household income of $69,724 found in the 45 to 64 years age bracket for the primary householder. A total of 3,846 households (43.1%) fall into this category. Meanwhile, the 65+ years age bracket for the primary householder has the lowest median household income of $35,994, with 2,598 households (29.1%) in this group.

| Income Bracket | # Households | Median Income |
| 15 to 24 Years | 176 (2.0%) | $61,089 |
| 25 to 44 Years | 2,293 (25.7%) | $50,333 |
| 45 to 64 Years | 3,846 (43.1%) | $69,724 |
| 65+ Years | 2,598 (29.1%) | $35,994 |
| Total | 8,913 (100.0%) | $50,321 |
Poverty in Burke County
Income Below Poverty by Sex and Age in Burke County
With 16.8% poverty level for males and 17.8% for females among the residents of Burke County, 15 year old males and 15 year old females are the most vulnerable to poverty, with 61 males (45.9%) and 20 females (36.4%) in their respective age groups living below the poverty level.
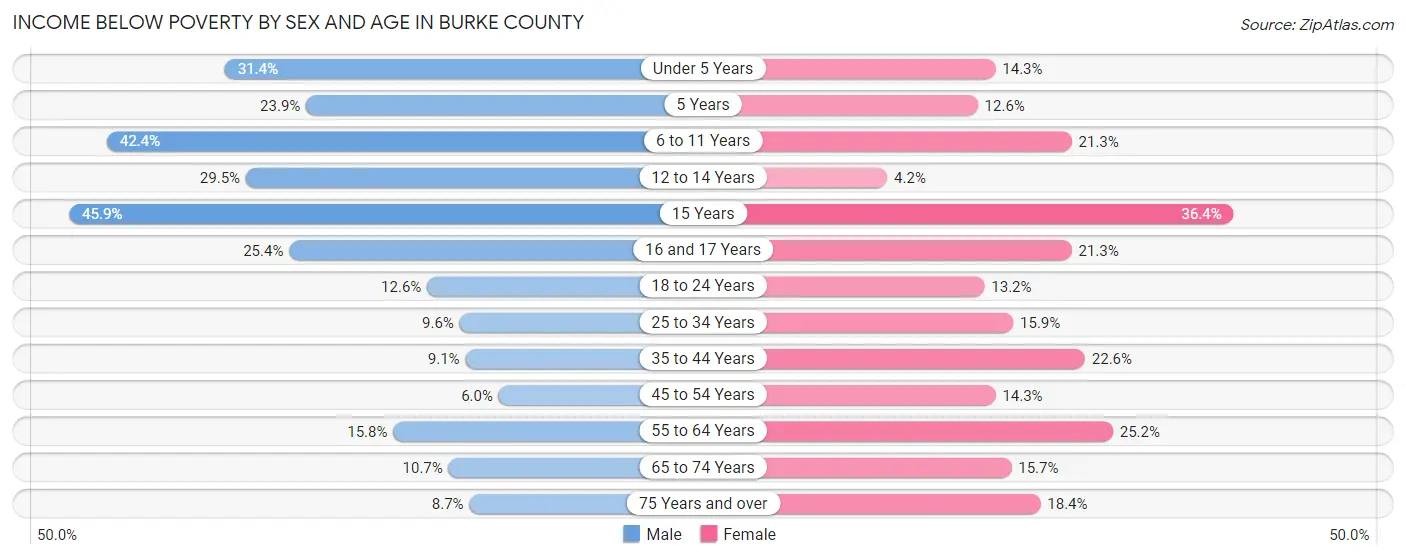
| Age Bracket | Male | Female |
| Under 5 Years | 334 (31.4%) | 60 (14.2%) |
| 5 Years | 37 (23.9%) | 14 (12.6%) |
| 6 to 11 Years | 336 (42.4%) | 206 (21.3%) |
| 12 to 14 Years | 190 (29.5%) | 29 (4.2%) |
| 15 Years | 61 (45.9%) | 20 (36.4%) |
| 16 and 17 Years | 102 (25.4%) | 100 (21.3%) |
| 18 to 24 Years | 207 (12.6%) | 133 (13.2%) |
| 25 to 34 Years | 60 (9.6%) | 242 (15.9%) |
| 35 to 44 Years | 139 (9.1%) | 342 (22.6%) |
| 45 to 54 Years | 84 (6.0%) | 217 (14.3%) |
| 55 to 64 Years | 251 (15.8%) | 454 (25.2%) |
| 65 to 74 Years | 119 (10.6%) | 207 (15.7%) |
| 75 Years and over | 56 (8.7%) | 150 (18.4%) |
| Total | 1,976 (16.8%) | 2,174 (17.8%) |
Income Above Poverty by Sex and Age in Burke County
According to the poverty statistics in Burke County, males aged 45 to 54 years and females aged 12 to 14 years are the age groups that are most secure financially, with 94.0% of males and 95.8% of females in these age groups living above the poverty line.
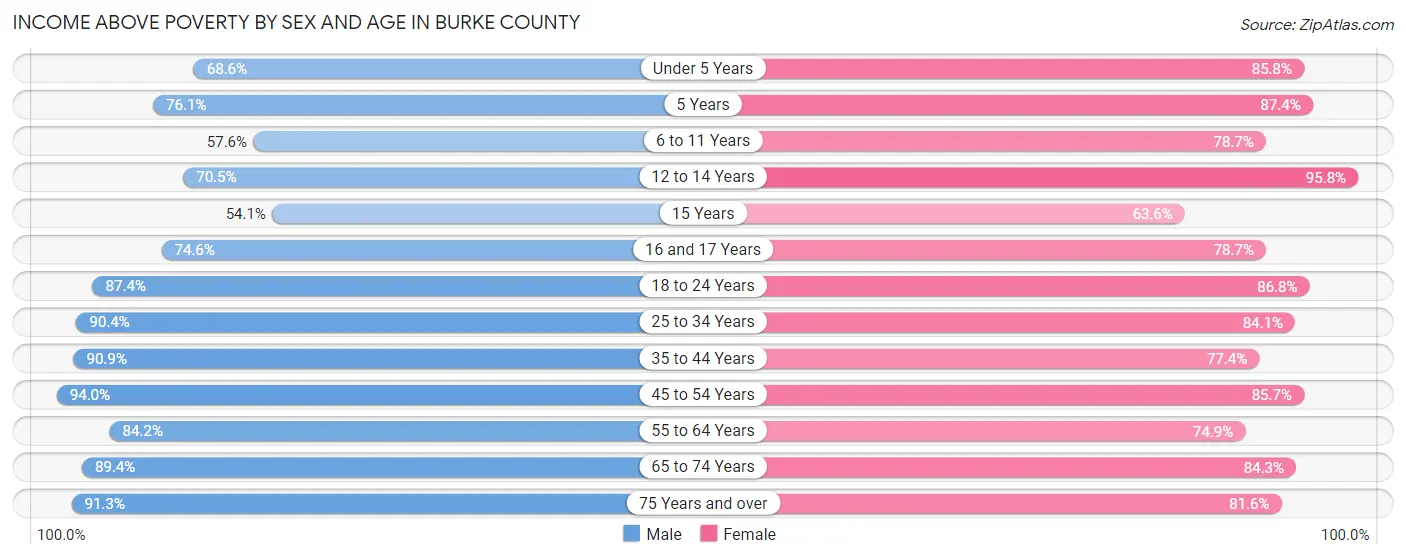
| Age Bracket | Male | Female |
| Under 5 Years | 729 (68.6%) | 361 (85.8%) |
| 5 Years | 118 (76.1%) | 97 (87.4%) |
| 6 to 11 Years | 457 (57.6%) | 760 (78.7%) |
| 12 to 14 Years | 455 (70.5%) | 660 (95.8%) |
| 15 Years | 72 (54.1%) | 35 (63.6%) |
| 16 and 17 Years | 299 (74.6%) | 369 (78.7%) |
| 18 to 24 Years | 1,431 (87.4%) | 872 (86.8%) |
| 25 to 34 Years | 564 (90.4%) | 1,280 (84.1%) |
| 35 to 44 Years | 1,390 (90.9%) | 1,174 (77.4%) |
| 45 to 54 Years | 1,318 (94.0%) | 1,305 (85.7%) |
| 55 to 64 Years | 1,340 (84.2%) | 1,351 (74.9%) |
| 65 to 74 Years | 998 (89.3%) | 1,109 (84.3%) |
| 75 Years and over | 586 (91.3%) | 664 (81.6%) |
| Total | 9,757 (83.2%) | 10,037 (82.2%) |
Income Below Poverty Among Married-Couple Families in Burke County
The poverty statistics for married-couple families in Burke County show that 9.6% or 365 of the total 3,822 families live below the poverty line. Families with 5 or more children have the highest poverty rate of 100.0%, comprising of 15 families. On the other hand, families with 3 or 4 children have the lowest poverty rate of 6.0%, which includes 18 families.
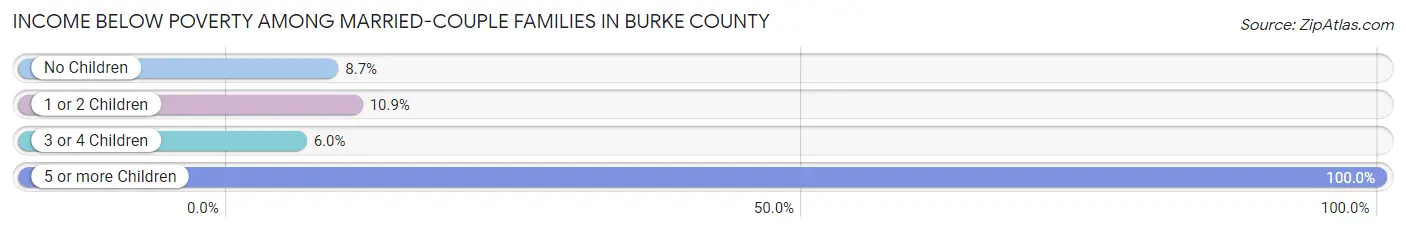
| Children | Above Poverty | Below Poverty |
| No Children | 2,081 (91.3%) | 199 (8.7%) |
| 1 or 2 Children | 1,093 (89.1%) | 133 (10.8%) |
| 3 or 4 Children | 283 (94.0%) | 18 (6.0%) |
| 5 or more Children | 0 (0.0%) | 15 (100.0%) |
| Total | 3,457 (90.4%) | 365 (9.6%) |
Income Below Poverty Among Single-Parent Households in Burke County
According to the poverty data in Burke County, 9.6% or 34 single-father households and 39.2% or 605 single-mother households are living below the poverty line. Among single-father households, those with 3 or 4 children have the highest poverty rate, with 28 households (100.0%) experiencing poverty. Likewise, among single-mother households, those with 5 or more children have the highest poverty rate, with 43 households (100.0%) falling below the poverty line.

| Children | Single Father | Single Mother |
| No Children | 6 (2.8%) | 107 (19.0%) |
| 1 or 2 Children | 0 (0.0%) | 417 (50.4%) |
| 3 or 4 Children | 28 (100.0%) | 38 (34.2%) |
| 5 or more Children | 0 (0.0%) | 43 (100.0%) |
| Total | 34 (9.6%) | 605 (39.2%) |
Income Below Poverty Among Married-Couple vs Single-Parent Households in Burke County
The poverty data for Burke County shows that 365 of the married-couple family households (9.6%) and 639 of the single-parent households (33.7%) are living below the poverty level. Within the married-couple family households, those with 5 or more children have the highest poverty rate, with 15 households (100.0%) falling below the poverty line. Among the single-parent households, those with 5 or more children have the highest poverty rate, with 43 household (100.0%) living below poverty.
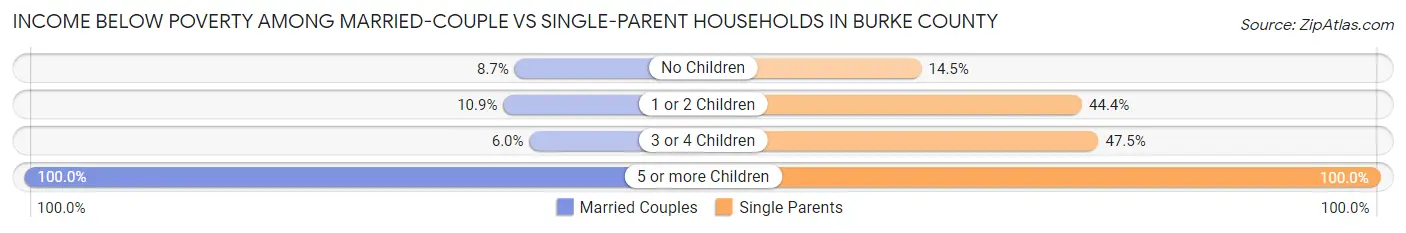
| Children | Married-Couple Families | Single-Parent Households |
| No Children | 199 (8.7%) | 113 (14.5%) |
| 1 or 2 Children | 133 (10.8%) | 417 (44.4%) |
| 3 or 4 Children | 18 (6.0%) | 66 (47.5%) |
| 5 or more Children | 15 (100.0%) | 43 (100.0%) |
| Total | 365 (9.6%) | 639 (33.7%) |
Employment Characteristics in Burke County
Employment by Class of Employer in Burke County
Among the 10,318 employed individuals in Burke County, private company employees (6,966 | 67.5%), self-employed (not incorporated) (830 | 8.0%), and state government employees (735 | 7.1%) make up the most common classes of employment.
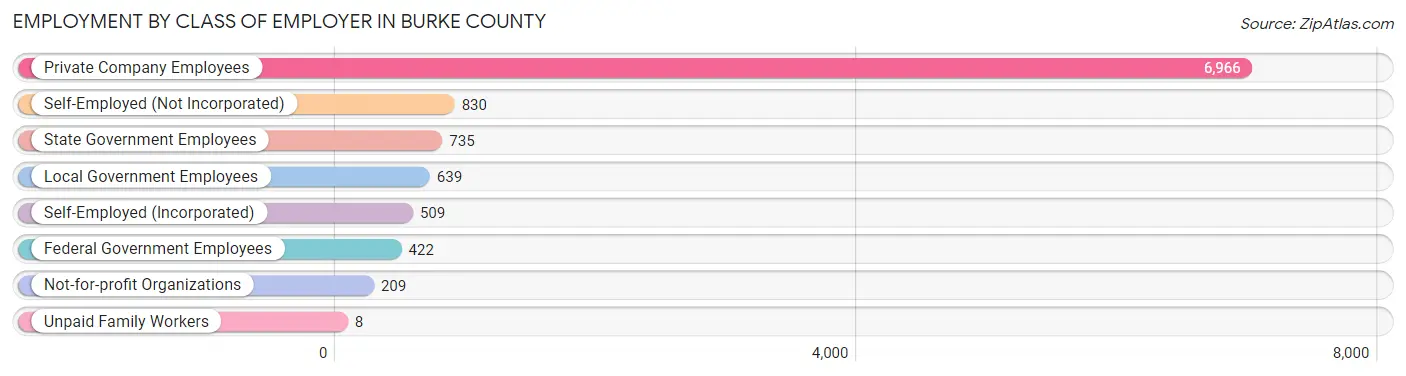
| Employer Class | # Employees | % Employees |
| Private Company Employees | 6,966 | 67.5% |
| Self-Employed (Incorporated) | 509 | 4.9% |
| Self-Employed (Not Incorporated) | 830 | 8.0% |
| Not-for-profit Organizations | 209 | 2.0% |
| Local Government Employees | 639 | 6.2% |
| State Government Employees | 735 | 7.1% |
| Federal Government Employees | 422 | 4.1% |
| Unpaid Family Workers | 8 | 0.1% |
| Total | 10,318 | 100.0% |
Employment Status by Age in Burke County
According to the labor force statistics for Burke County, out of the total population over 16 years of age (19,116), 58.3% or 11,145 individuals are in the labor force, with 5.2% or 580 of them unemployed. The age group with the highest labor force participation rate is 35 to 44 years, with 84.3% or 2,588 individuals in the labor force. Within the labor force, the 25 to 29 years age range has the highest percentage of unemployed individuals, with 16.1% or 120 of them being unemployed.
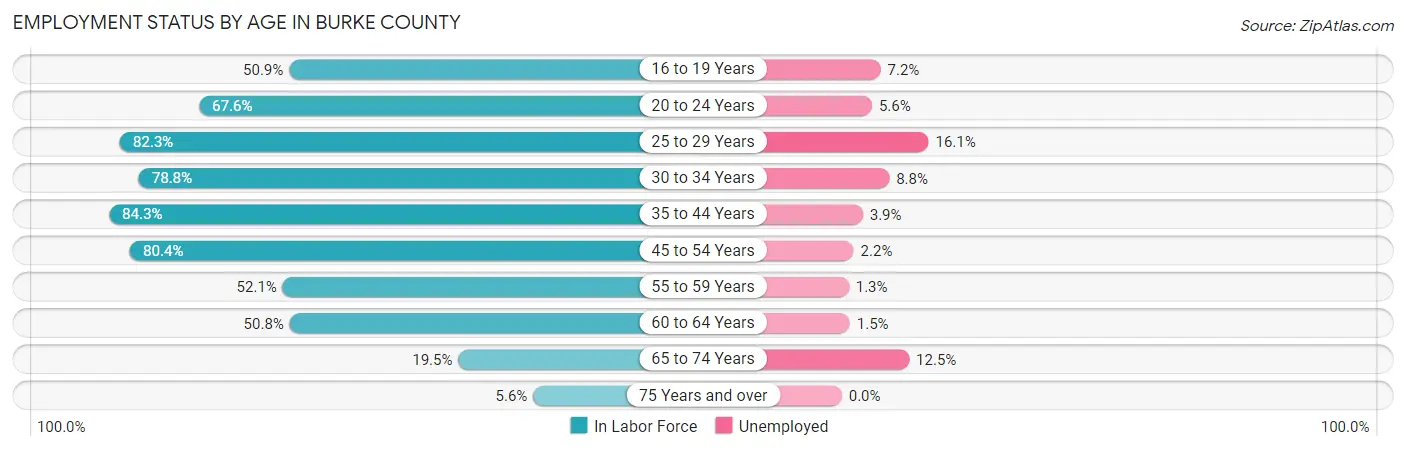
| Age Bracket | In Labor Force | Unemployed |
| 16 to 19 Years | 858 (50.9%) | 62 (7.2%) |
| 20 to 24 Years | 1,248 (67.6%) | 70 (5.6%) |
| 25 to 29 Years | 746 (82.3%) | 120 (16.1%) |
| 30 to 34 Years | 1,013 (78.8%) | 89 (8.8%) |
| 35 to 44 Years | 2,588 (84.3%) | 101 (3.9%) |
| 45 to 54 Years | 2,369 (80.4%) | 52 (2.2%) |
| 55 to 59 Years | 817 (52.1%) | 11 (1.3%) |
| 60 to 64 Years | 935 (50.8%) | 14 (1.5%) |
| 65 to 74 Years | 480 (19.5%) | 60 (12.5%) |
| 75 Years and over | 84 (5.6%) | 0 (0.0%) |
| Total | 11,145 (58.3%) | 580 (5.2%) |
Employment Status by Educational Attainment in Burke County
According to labor force statistics for Burke County, 72.9% of individuals (8,469) out of the total population between 25 and 64 years of age (11,617) are in the labor force, with 4.6% or 390 of them being unemployed. The group with the highest labor force participation rate are those with the educational attainment of bachelor's degree or higher, with 84.7% or 1,570 individuals in the labor force. Within the labor force, individuals with less than high school education have the highest percentage of unemployment, with 7.5% or 47 of them being unemployed.

| Educational Attainment | In Labor Force | Unemployed |
| Less than High School | 629 (48.0%) | 98 (7.5%) |
| High School Diploma | 3,390 (76.8%) | 124 (2.8%) |
| College / Associate Degree | 2,880 (71.3%) | 299 (7.4%) |
| Bachelor's Degree or higher | 1,570 (84.7%) | 37 (2.0%) |
| Total | 8,469 (72.9%) | 534 (4.6%) |
Employment Occupations by Sex in Burke County
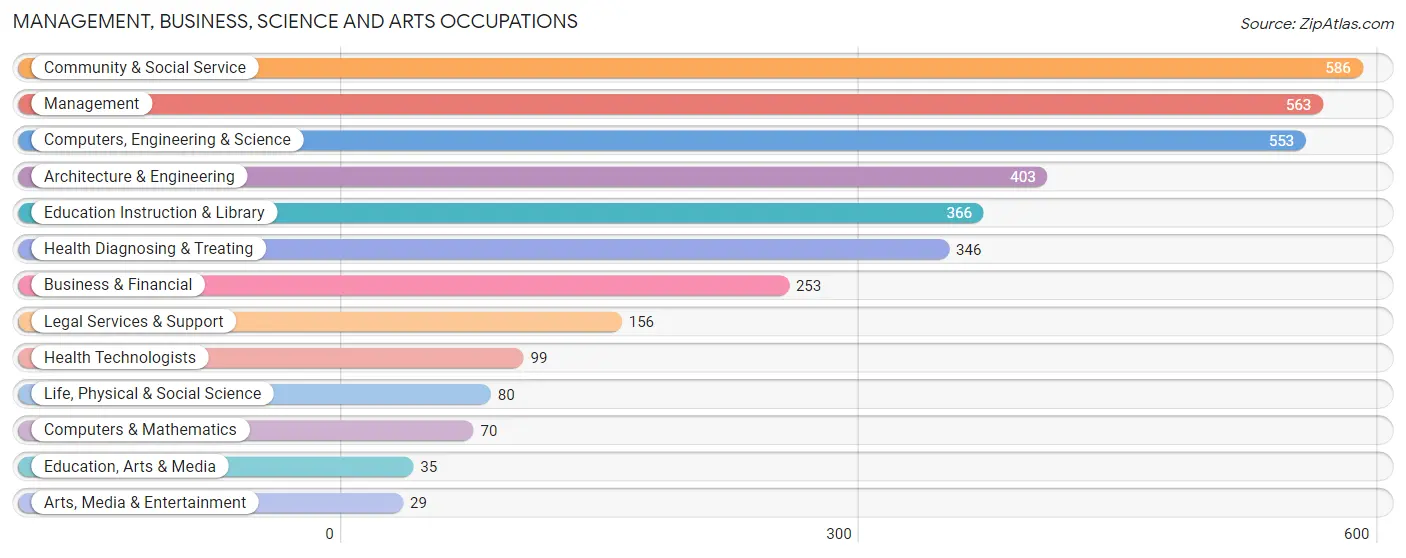
Management, Business, Science and Arts Occupations
The most common Management, Business, Science and Arts occupations in Burke County are Community & Social Service (586 | 5.6%), Management (563 | 5.3%), Computers, Engineering & Science (553 | 5.2%), Architecture & Engineering (403 | 3.8%), and Education Instruction & Library (366 | 3.5%).
Management, Business, Science and Arts Occupations by Sex
Within the Management, Business, Science and Arts occupations in Burke County, the most male-oriented occupations are Legal Services & Support (100.0%), Architecture & Engineering (88.6%), and Life, Physical & Social Science (81.2%), while the most female-oriented occupations are Arts, Media & Entertainment (100.0%), Education Instruction & Library (86.1%), and Health Diagnosing & Treating (85.6%).
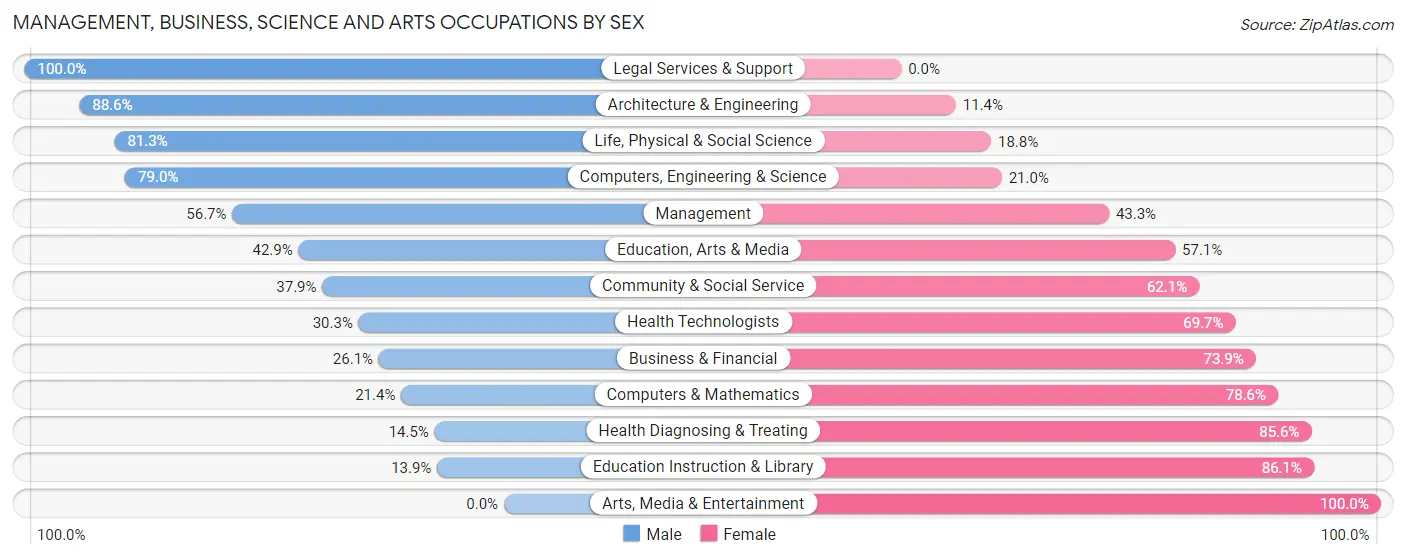
| Occupation | Male | Female |
| Management | 319 (56.7%) | 244 (43.3%) |
| Business & Financial | 66 (26.1%) | 187 (73.9%) |
| Computers, Engineering & Science | 437 (79.0%) | 116 (21.0%) |
| Computers & Mathematics | 15 (21.4%) | 55 (78.6%) |
| Architecture & Engineering | 357 (88.6%) | 46 (11.4%) |
| Life, Physical & Social Science | 65 (81.2%) | 15 (18.8%) |
| Community & Social Service | 222 (37.9%) | 364 (62.1%) |
| Education, Arts & Media | 15 (42.9%) | 20 (57.1%) |
| Legal Services & Support | 156 (100.0%) | 0 (0.0%) |
| Education Instruction & Library | 51 (13.9%) | 315 (86.1%) |
| Arts, Media & Entertainment | 0 (0.0%) | 29 (100.0%) |
| Health Diagnosing & Treating | 50 (14.4%) | 296 (85.6%) |
| Health Technologists | 30 (30.3%) | 69 (69.7%) |
| Total (Category) | 1,094 (47.5%) | 1,207 (52.5%) |
| Total (Overall) | 5,586 (52.9%) | 4,972 (47.1%) |
Services Occupations
The most common Services occupations in Burke County are Food Preparation & Serving (737 | 7.0%), Cleaning & Maintenance (510 | 4.8%), Healthcare Support (442 | 4.2%), Security & Protection (341 | 3.2%), and Personal Care & Service (248 | 2.4%).

Services Occupations by Sex
Within the Services occupations in Burke County, the most male-oriented occupations are Law Enforcement (73.7%), Security & Protection (71.3%), and Firefighting & Prevention (69.0%), while the most female-oriented occupations are Healthcare Support (100.0%), Personal Care & Service (75.0%), and Food Preparation & Serving (65.0%).
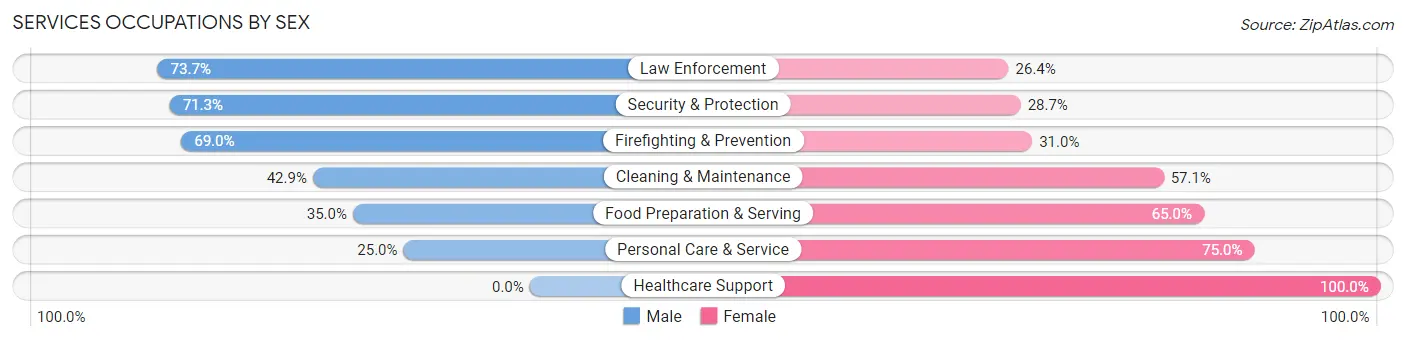
| Occupation | Male | Female |
| Healthcare Support | 0 (0.0%) | 442 (100.0%) |
| Security & Protection | 243 (71.3%) | 98 (28.7%) |
| Firefighting & Prevention | 120 (69.0%) | 54 (31.0%) |
| Law Enforcement | 123 (73.7%) | 44 (26.4%) |
| Food Preparation & Serving | 258 (35.0%) | 479 (65.0%) |
| Cleaning & Maintenance | 219 (42.9%) | 291 (57.1%) |
| Personal Care & Service | 62 (25.0%) | 186 (75.0%) |
| Total (Category) | 782 (34.3%) | 1,496 (65.7%) |
| Total (Overall) | 5,586 (52.9%) | 4,972 (47.1%) |
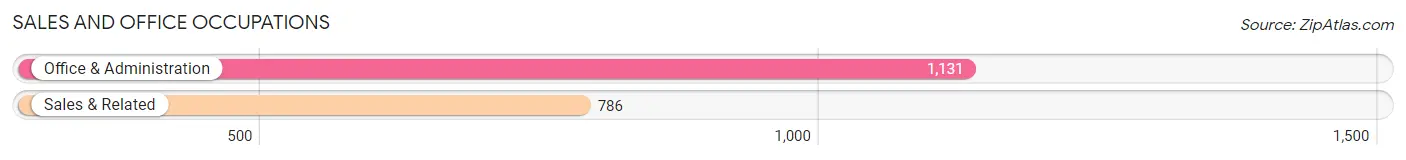
Sales and Office Occupations
The most common Sales and Office occupations in Burke County are Office & Administration (1,131 | 10.7%), and Sales & Related (786 | 7.4%).
Sales and Office Occupations by Sex

| Occupation | Male | Female |
| Sales & Related | 184 (23.4%) | 602 (76.6%) |
| Office & Administration | 256 (22.6%) | 875 (77.4%) |
| Total (Category) | 440 (23.0%) | 1,477 (77.0%) |
| Total (Overall) | 5,586 (52.9%) | 4,972 (47.1%) |
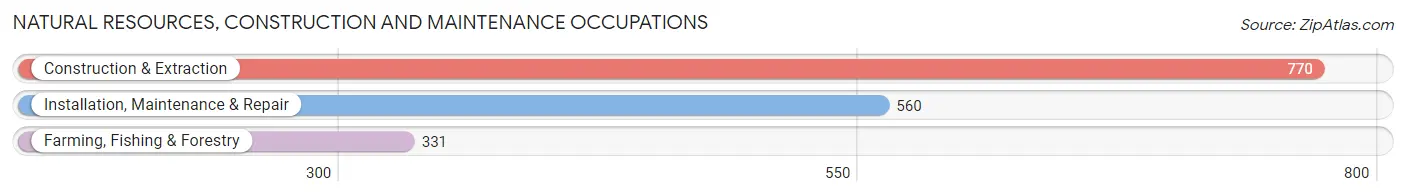
Natural Resources, Construction and Maintenance Occupations
The most common Natural Resources, Construction and Maintenance occupations in Burke County are Construction & Extraction (770 | 7.3%), Installation, Maintenance & Repair (560 | 5.3%), and Farming, Fishing & Forestry (331 | 3.1%).
Natural Resources, Construction and Maintenance Occupations by Sex

| Occupation | Male | Female |
| Farming, Fishing & Forestry | 294 (88.8%) | 37 (11.2%) |
| Construction & Extraction | 716 (93.0%) | 54 (7.0%) |
| Installation, Maintenance & Repair | 550 (98.2%) | 10 (1.8%) |
| Total (Category) | 1,560 (93.9%) | 101 (6.1%) |
| Total (Overall) | 5,586 (52.9%) | 4,972 (47.1%) |
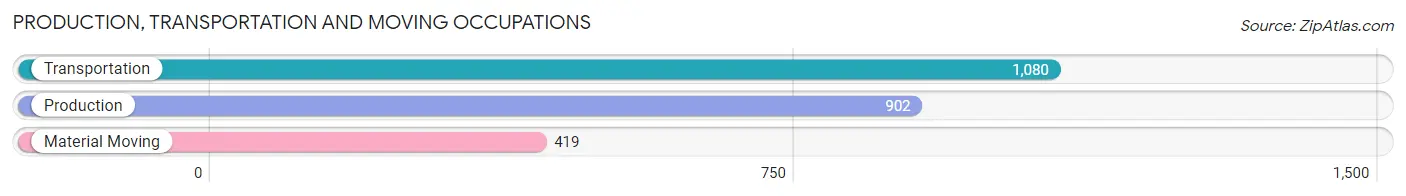
Production, Transportation and Moving Occupations
The most common Production, Transportation and Moving occupations in Burke County are Transportation (1,080 | 10.2%), Production (902 | 8.5%), and Material Moving (419 | 4.0%).
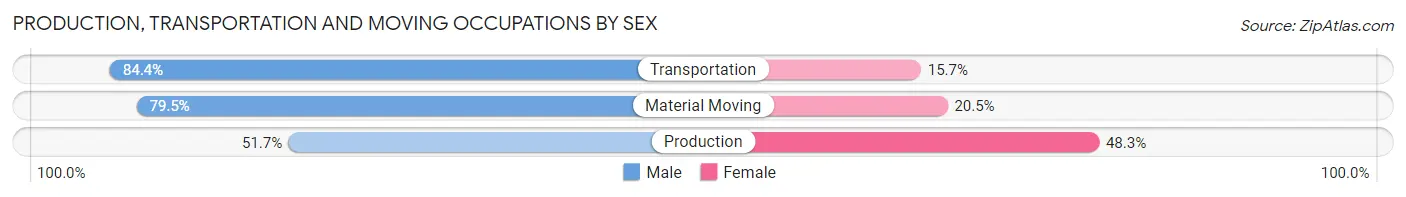
Production, Transportation and Moving Occupations by Sex
| Occupation | Male | Female |
| Production | 466 (51.7%) | 436 (48.3%) |
| Transportation | 911 (84.4%) | 169 (15.7%) |
| Material Moving | 333 (79.5%) | 86 (20.5%) |
| Total (Category) | 1,710 (71.2%) | 691 (28.8%) |
| Total (Overall) | 5,586 (52.9%) | 4,972 (47.1%) |
Employment Industries by Sex in Burke County
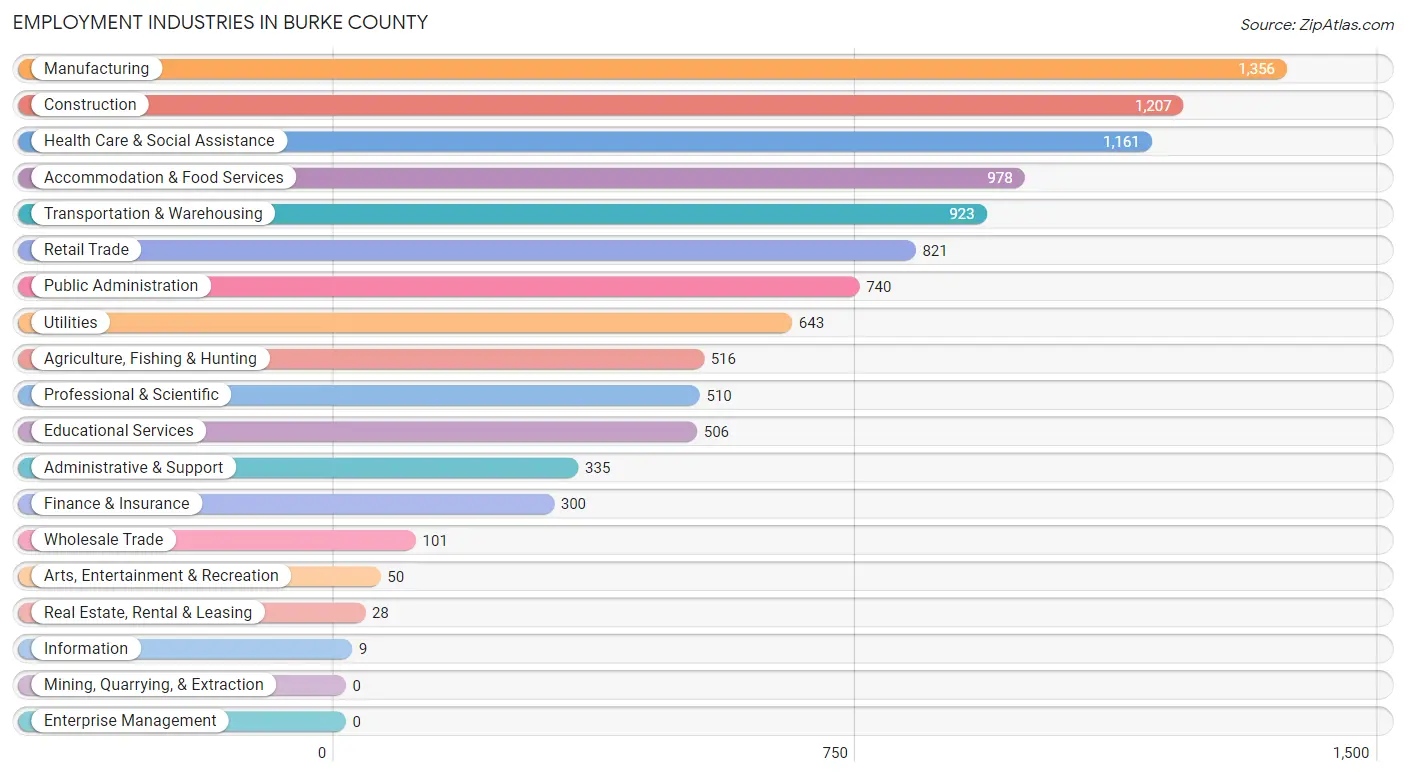
Employment Industries in Burke County
The major employment industries in Burke County include Manufacturing (1,356 | 12.8%), Construction (1,207 | 11.4%), Health Care & Social Assistance (1,161 | 11.0%), Accommodation & Food Services (978 | 9.3%), and Transportation & Warehousing (923 | 8.7%).
Employment Industries by Sex in Burke County
The Burke County industries that see more men than women are Information (100.0%), Agriculture, Fishing & Hunting (89.9%), and Construction (89.5%), whereas the industries that tend to have a higher number of women are Finance & Insurance (96.0%), Health Care & Social Assistance (89.4%), and Educational Services (87.0%).

| Industry | Male | Female |
| Agriculture, Fishing & Hunting | 464 (89.9%) | 52 (10.1%) |
| Mining, Quarrying, & Extraction | 0 (0.0%) | 0 (0.0%) |
| Construction | 1,080 (89.5%) | 127 (10.5%) |
| Manufacturing | 812 (59.9%) | 544 (40.1%) |
| Wholesale Trade | 85 (84.2%) | 16 (15.8%) |
| Retail Trade | 235 (28.6%) | 586 (71.4%) |
| Transportation & Warehousing | 777 (84.2%) | 146 (15.8%) |
| Utilities | 529 (82.3%) | 114 (17.7%) |
| Information | 9 (100.0%) | 0 (0.0%) |
| Finance & Insurance | 12 (4.0%) | 288 (96.0%) |
| Real Estate, Rental & Leasing | 11 (39.3%) | 17 (60.7%) |
| Professional & Scientific | 415 (81.4%) | 95 (18.6%) |
| Enterprise Management | 0 (0.0%) | 0 (0.0%) |
| Administrative & Support | 96 (28.7%) | 239 (71.3%) |
| Educational Services | 66 (13.0%) | 440 (87.0%) |
| Health Care & Social Assistance | 123 (10.6%) | 1,038 (89.4%) |
| Arts, Entertainment & Recreation | 19 (38.0%) | 31 (62.0%) |
| Accommodation & Food Services | 327 (33.4%) | 651 (66.6%) |
| Public Administration | 398 (53.8%) | 342 (46.2%) |
| Total | 5,586 (52.9%) | 4,972 (47.1%) |
Education in Burke County
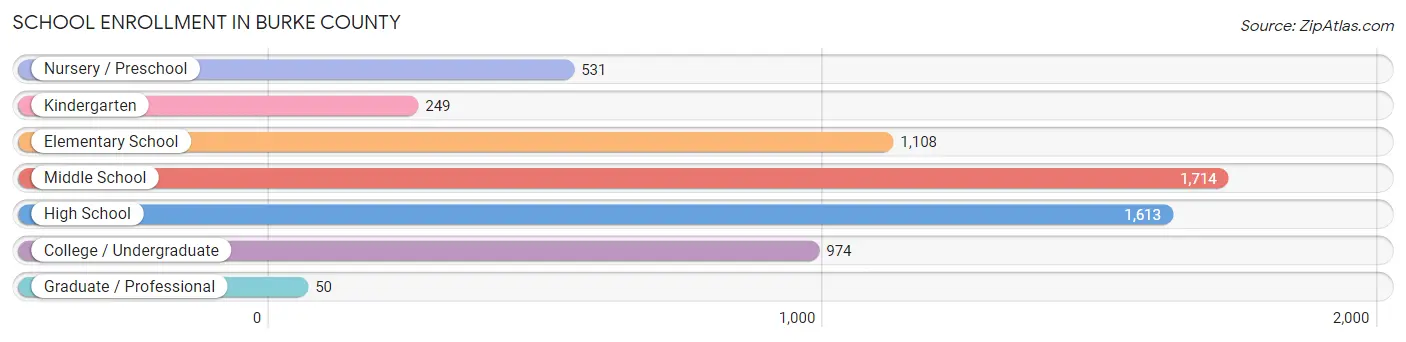
School Enrollment in Burke County
The most common levels of schooling among the 6,239 students in Burke County are middle school (1,714 | 27.5%), high school (1,613 | 25.9%), and elementary school (1,108 | 17.8%).
| School Level | # Students | % Students |
| Nursery / Preschool | 531 | 8.5% |
| Kindergarten | 249 | 4.0% |
| Elementary School | 1,108 | 17.8% |
| Middle School | 1,714 | 27.5% |
| High School | 1,613 | 25.9% |
| College / Undergraduate | 974 | 15.6% |
| Graduate / Professional | 50 | 0.8% |
| Total | 6,239 | 100.0% |
School Enrollment by Age by Funding Source in Burke County
Out of a total of 6,239 students who are enrolled in schools in Burke County, 1,472 (23.6%) attend a private institution, while the remaining 4,767 (76.4%) are enrolled in public schools. The age group of 25 to 34 year olds has the highest likelihood of being enrolled in private schools, with 47 (85.5% in the age bracket) enrolled. Conversely, the age group of 3 to 4 year olds has the lowest likelihood of being enrolled in a private school, with 394 (90.8% in the age bracket) attending a public institution.
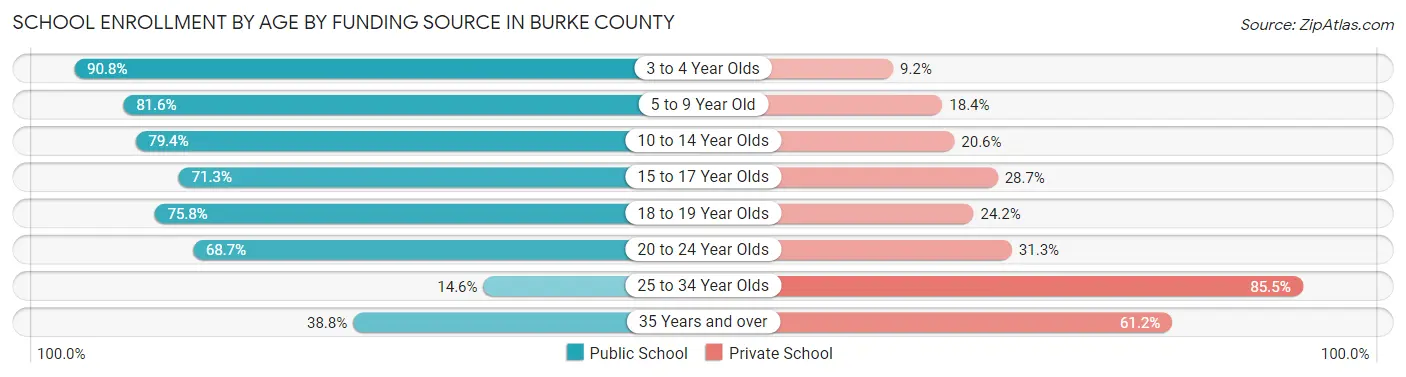
| Age Bracket | Public School | Private School |
| 3 to 4 Year Olds | 394 (90.8%) | 40 (9.2%) |
| 5 to 9 Year Old | 919 (81.6%) | 207 (18.4%) |
| 10 to 14 Year Olds | 1,905 (79.4%) | 495 (20.6%) |
| 15 to 17 Year Olds | 706 (71.3%) | 284 (28.7%) |
| 18 to 19 Year Olds | 351 (75.8%) | 112 (24.2%) |
| 20 to 24 Year Olds | 425 (68.7%) | 194 (31.3%) |
| 25 to 34 Year Olds | 8 (14.5%) | 47 (85.5%) |
| 35 Years and over | 59 (38.8%) | 93 (61.2%) |
| Total | 4,767 (76.4%) | 1,472 (23.6%) |
Educational Attainment by Field of Study in Burke County
Business (587 | 24.6%), education (438 | 18.3%), arts & humanities (296 | 12.4%), engineering (248 | 10.4%), and social sciences (236 | 9.9%) are the most common fields of study among 2,388 individuals in Burke County who have obtained a bachelor's degree or higher.
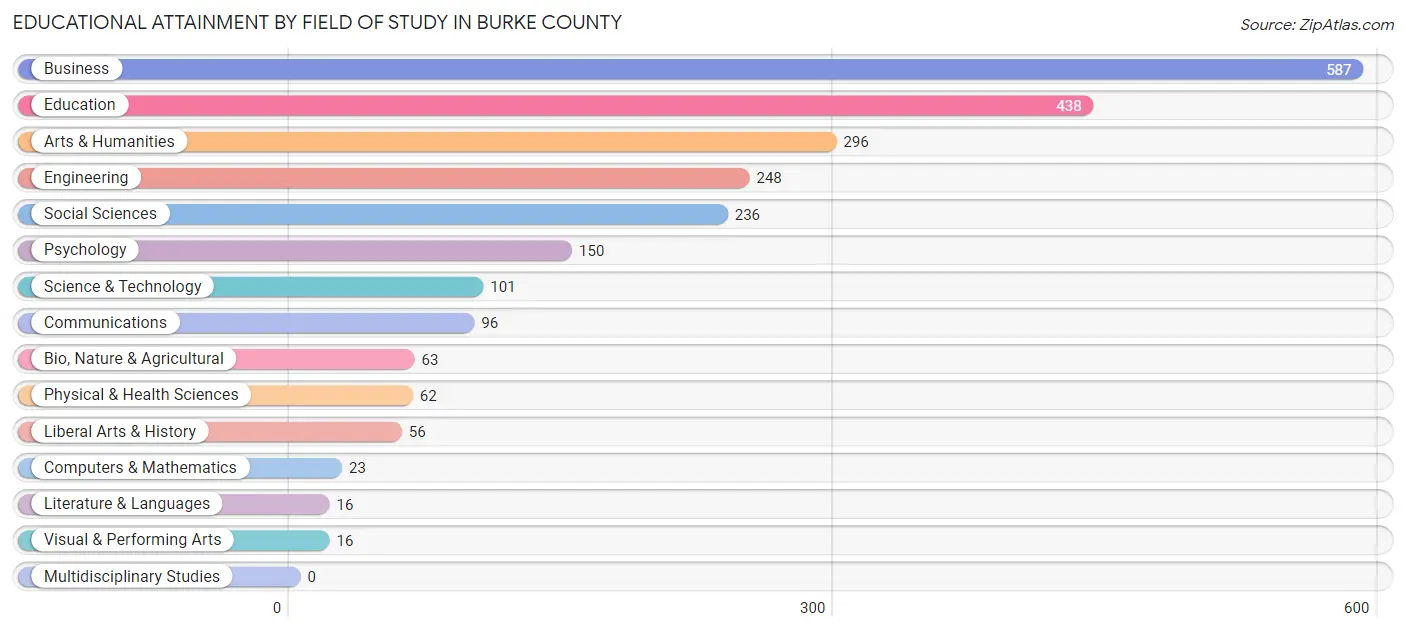
| Field of Study | # Graduates | % Graduates |
| Computers & Mathematics | 23 | 1.0% |
| Bio, Nature & Agricultural | 63 | 2.6% |
| Physical & Health Sciences | 62 | 2.6% |
| Psychology | 150 | 6.3% |
| Social Sciences | 236 | 9.9% |
| Engineering | 248 | 10.4% |
| Multidisciplinary Studies | 0 | 0.0% |
| Science & Technology | 101 | 4.2% |
| Business | 587 | 24.6% |
| Education | 438 | 18.3% |
| Literature & Languages | 16 | 0.7% |
| Liberal Arts & History | 56 | 2.4% |
| Visual & Performing Arts | 16 | 0.7% |
| Communications | 96 | 4.0% |
| Arts & Humanities | 296 | 12.4% |
| Total | 2,388 | 100.0% |
Transportation & Commute in Burke County
Vehicle Availability by Sex in Burke County
The most prevalent vehicle ownership categories in Burke County are males with 2 vehicles (1,672, accounting for 30.6%) and females with 2 vehicles (1,295, making up 34.5%).
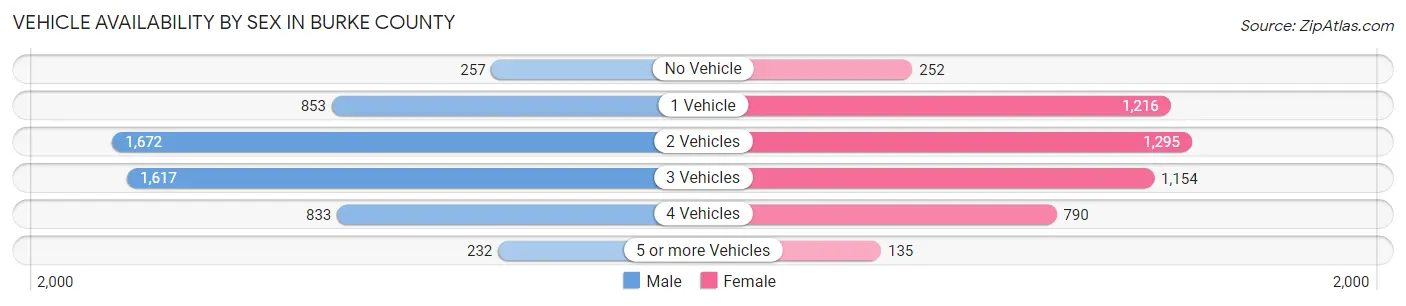
| Vehicles Available | Male | Female |
| No Vehicle | 257 (4.7%) | 252 (5.2%) |
| 1 Vehicle | 853 (15.6%) | 1,216 (25.1%) |
| 2 Vehicles | 1,672 (30.6%) | 1,295 (26.8%) |
| 3 Vehicles | 1,617 (29.6%) | 1,154 (23.8%) |
| 4 Vehicles | 833 (15.2%) | 790 (16.3%) |
| 5 or more Vehicles | 232 (4.3%) | 135 (2.8%) |
| Total | 5,464 (100.0%) | 4,842 (100.0%) |
Commute Time in Burke County
The most frequently occuring commute durations in Burke County are 10 to 14 minutes (1,258 commuters, 13.3%), 30 to 34 minutes (1,245 commuters, 13.1%), and 20 to 24 minutes (1,119 commuters, 11.8%).

| Commute Time | # Commuters | % Commuters |
| Less than 5 Minutes | 591 | 6.2% |
| 5 to 9 Minutes | 1,071 | 11.3% |
| 10 to 14 Minutes | 1,258 | 13.3% |
| 15 to 19 Minutes | 939 | 9.9% |
| 20 to 24 Minutes | 1,119 | 11.8% |
| 25 to 29 Minutes | 505 | 5.3% |
| 30 to 34 Minutes | 1,245 | 13.1% |
| 35 to 39 Minutes | 428 | 4.5% |
| 40 to 44 Minutes | 398 | 4.2% |
| 45 to 59 Minutes | 975 | 10.3% |
| 60 to 89 Minutes | 730 | 7.7% |
| 90 or more Minutes | 229 | 2.4% |
Commute Time by Sex in Burke County
The most common commute times in Burke County are 30 to 34 minutes (736 commuters, 14.4%) for males and 20 to 24 minutes (650 commuters, 14.8%) for females.
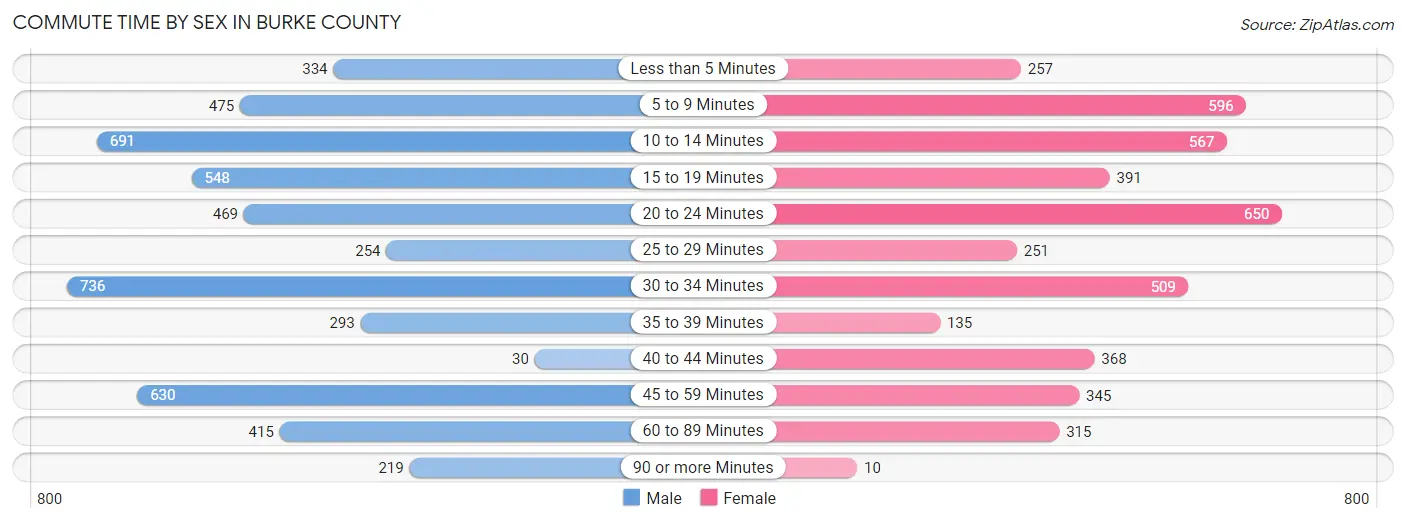
| Commute Time | Male | Female |
| Less than 5 Minutes | 334 (6.6%) | 257 (5.9%) |
| 5 to 9 Minutes | 475 (9.3%) | 596 (13.6%) |
| 10 to 14 Minutes | 691 (13.6%) | 567 (12.9%) |
| 15 to 19 Minutes | 548 (10.8%) | 391 (8.9%) |
| 20 to 24 Minutes | 469 (9.2%) | 650 (14.8%) |
| 25 to 29 Minutes | 254 (5.0%) | 251 (5.7%) |
| 30 to 34 Minutes | 736 (14.4%) | 509 (11.6%) |
| 35 to 39 Minutes | 293 (5.8%) | 135 (3.1%) |
| 40 to 44 Minutes | 30 (0.6%) | 368 (8.4%) |
| 45 to 59 Minutes | 630 (12.4%) | 345 (7.9%) |
| 60 to 89 Minutes | 415 (8.2%) | 315 (7.2%) |
| 90 or more Minutes | 219 (4.3%) | 10 (0.2%) |
Time of Departure to Work by Sex in Burke County
The most frequent times of departure to work in Burke County are 12:00 AM to 4:59 AM (856, 16.8%) for males and 7:00 AM to 7:29 AM (879, 20.0%) for females.
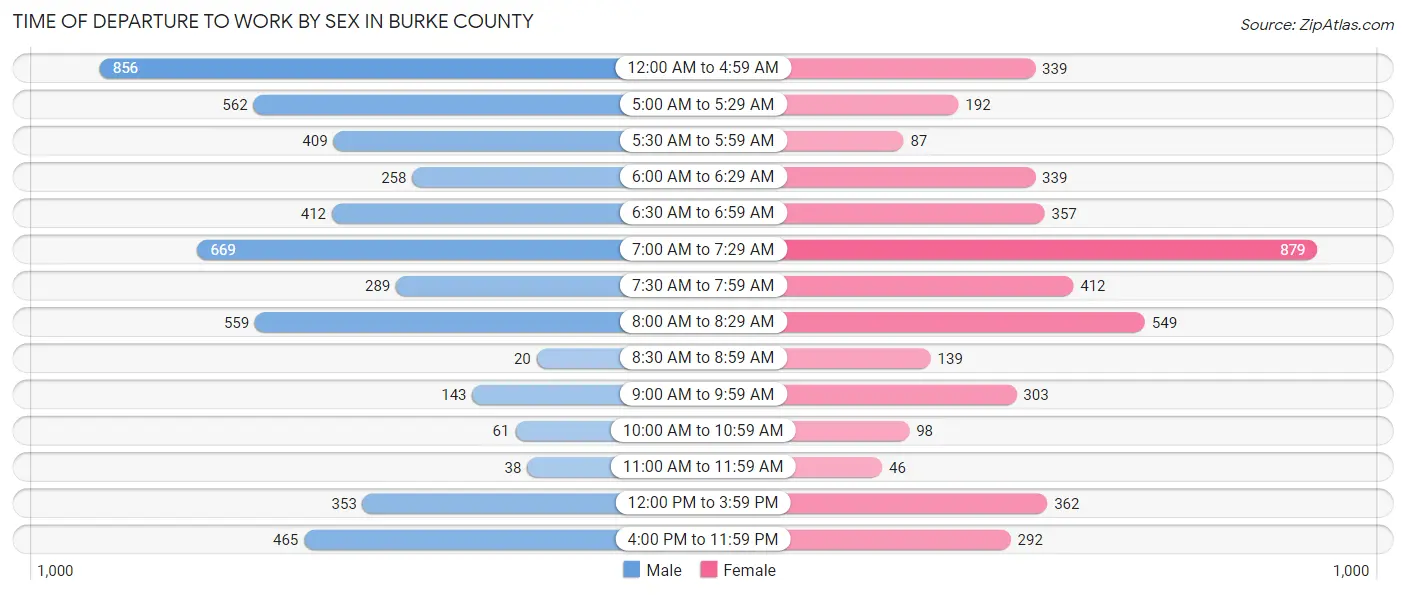
| Time of Departure | Male | Female |
| 12:00 AM to 4:59 AM | 856 (16.8%) | 339 (7.7%) |
| 5:00 AM to 5:29 AM | 562 (11.0%) | 192 (4.4%) |
| 5:30 AM to 5:59 AM | 409 (8.0%) | 87 (2.0%) |
| 6:00 AM to 6:29 AM | 258 (5.1%) | 339 (7.7%) |
| 6:30 AM to 6:59 AM | 412 (8.1%) | 357 (8.1%) |
| 7:00 AM to 7:29 AM | 669 (13.1%) | 879 (20.0%) |
| 7:30 AM to 7:59 AM | 289 (5.7%) | 412 (9.4%) |
| 8:00 AM to 8:29 AM | 559 (11.0%) | 549 (12.5%) |
| 8:30 AM to 8:59 AM | 20 (0.4%) | 139 (3.2%) |
| 9:00 AM to 9:59 AM | 143 (2.8%) | 303 (6.9%) |
| 10:00 AM to 10:59 AM | 61 (1.2%) | 98 (2.2%) |
| 11:00 AM to 11:59 AM | 38 (0.7%) | 46 (1.1%) |
| 12:00 PM to 3:59 PM | 353 (6.9%) | 362 (8.2%) |
| 4:00 PM to 11:59 PM | 465 (9.1%) | 292 (6.7%) |
| Total | 5,094 (100.0%) | 4,394 (100.0%) |
Housing Occupancy in Burke County
Occupancy by Ownership in Burke County
Of the total 8,913 dwellings in Burke County, owner-occupied units account for 6,469 (72.6%), while renter-occupied units make up 2,444 (27.4%).

| Occupancy | # Housing Units | % Housing Units |
| Owner Occupied Housing Units | 6,469 | 72.6% |
| Renter-Occupied Housing Units | 2,444 | 27.4% |
| Total Occupied Housing Units | 8,913 | 100.0% |
Occupancy by Household Size in Burke County
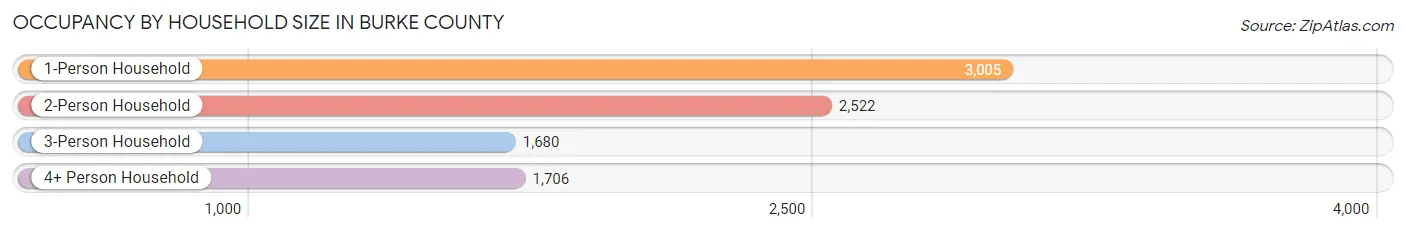
| Household Size | # Housing Units | % Housing Units |
| 1-Person Household | 3,005 | 33.7% |
| 2-Person Household | 2,522 | 28.3% |
| 3-Person Household | 1,680 | 18.9% |
| 4+ Person Household | 1,706 | 19.1% |
| Total Housing Units | 8,913 | 100.0% |
Occupancy by Ownership by Household Size in Burke County
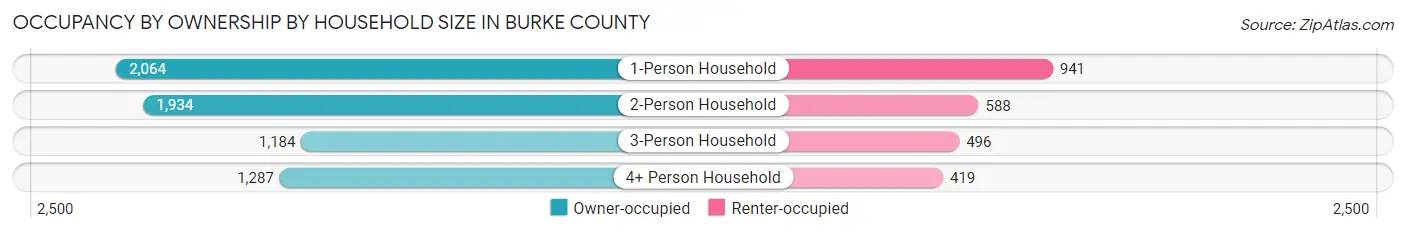
| Household Size | Owner-occupied | Renter-occupied |
| 1-Person Household | 2,064 (68.7%) | 941 (31.3%) |
| 2-Person Household | 1,934 (76.7%) | 588 (23.3%) |
| 3-Person Household | 1,184 (70.5%) | 496 (29.5%) |
| 4+ Person Household | 1,287 (75.4%) | 419 (24.6%) |
| Total Housing Units | 6,469 (72.6%) | 2,444 (27.4%) |
Occupancy by Educational Attainment in Burke County
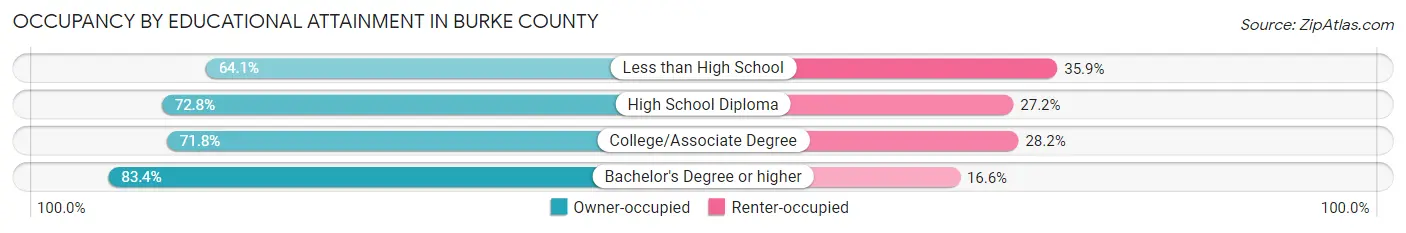
| Household Size | Owner-occupied | Renter-occupied |
| Less than High School | 796 (64.1%) | 446 (35.9%) |
| High School Diploma | 2,404 (72.8%) | 898 (27.2%) |
| College/Associate Degree | 2,315 (71.8%) | 910 (28.2%) |
| Bachelor's Degree or higher | 954 (83.4%) | 190 (16.6%) |
Occupancy by Age of Householder in Burke County
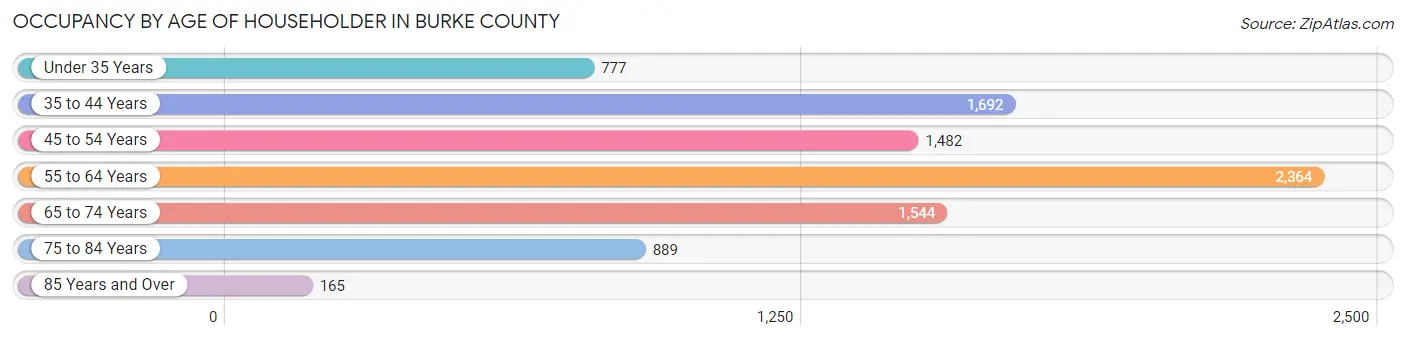
| Age Bracket | # Households | % Households |
| Under 35 Years | 777 | 8.7% |
| 35 to 44 Years | 1,692 | 19.0% |
| 45 to 54 Years | 1,482 | 16.6% |
| 55 to 64 Years | 2,364 | 26.5% |
| 65 to 74 Years | 1,544 | 17.3% |
| 75 to 84 Years | 889 | 10.0% |
| 85 Years and Over | 165 | 1.8% |
| Total | 8,913 | 100.0% |
Housing Finances in Burke County
Median Income by Occupancy in Burke County
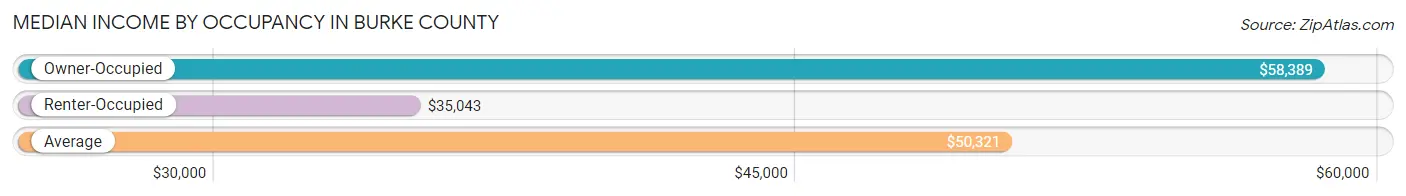
| Occupancy Type | # Households | Median Income |
| Owner-Occupied | 6,469 (72.6%) | $58,389 |
| Renter-Occupied | 2,444 (27.4%) | $35,043 |
| Average | 8,913 (100.0%) | $50,321 |
Occupancy by Householder Income Bracket in Burke County
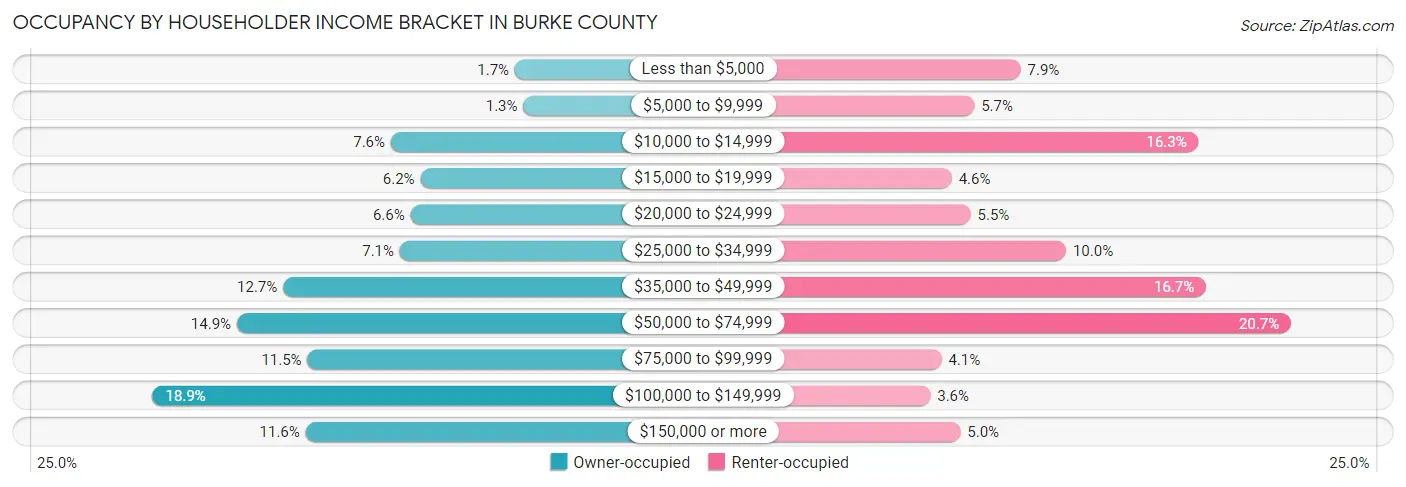
| Income Bracket | Owner-occupied | Renter-occupied |
| Less than $5,000 | 107 (1.7%) | 192 (7.9%) |
| $5,000 to $9,999 | 81 (1.3%) | 138 (5.7%) |
| $10,000 to $14,999 | 489 (7.6%) | 399 (16.3%) |
| $15,000 to $19,999 | 398 (6.1%) | 112 (4.6%) |
| $20,000 to $24,999 | 428 (6.6%) | 134 (5.5%) |
| $25,000 to $34,999 | 461 (7.1%) | 245 (10.0%) |
| $35,000 to $49,999 | 821 (12.7%) | 408 (16.7%) |
| $50,000 to $74,999 | 963 (14.9%) | 507 (20.7%) |
| $75,000 to $99,999 | 746 (11.5%) | 100 (4.1%) |
| $100,000 to $149,999 | 1,223 (18.9%) | 87 (3.6%) |
| $150,000 or more | 752 (11.6%) | 122 (5.0%) |
| Total | 6,469 (100.0%) | 2,444 (100.0%) |
Monthly Housing Cost Tiers in Burke County
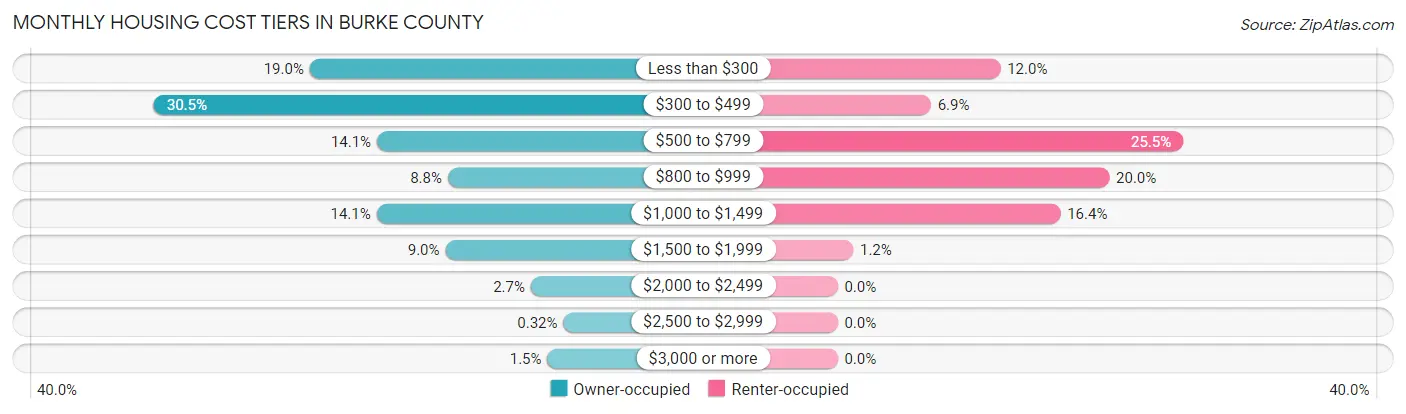
| Monthly Cost | Owner-occupied | Renter-occupied |
| Less than $300 | 1,229 (19.0%) | 293 (12.0%) |
| $300 to $499 | 1,972 (30.5%) | 168 (6.9%) |
| $500 to $799 | 909 (14.1%) | 622 (25.5%) |
| $800 to $999 | 571 (8.8%) | 489 (20.0%) |
| $1,000 to $1,499 | 911 (14.1%) | 401 (16.4%) |
| $1,500 to $1,999 | 583 (9.0%) | 28 (1.1%) |
| $2,000 to $2,499 | 176 (2.7%) | 0 (0.0%) |
| $2,500 to $2,999 | 21 (0.3%) | 0 (0.0%) |
| $3,000 or more | 97 (1.5%) | 0 (0.0%) |
| Total | 6,469 (100.0%) | 2,444 (100.0%) |
Physical Housing Characteristics in Burke County
Housing Structures in Burke County
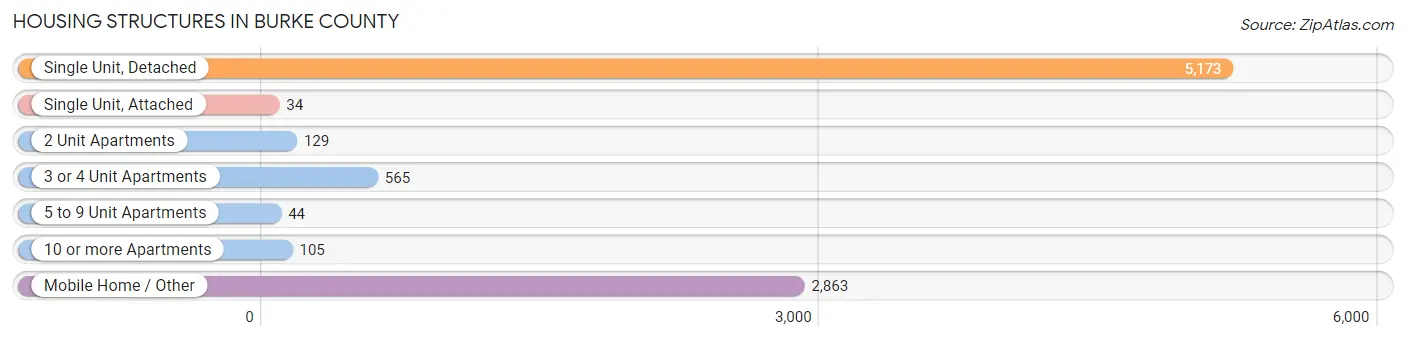
| Structure Type | # Housing Units | % Housing Units |
| Single Unit, Detached | 5,173 | 58.0% |
| Single Unit, Attached | 34 | 0.4% |
| 2 Unit Apartments | 129 | 1.5% |
| 3 or 4 Unit Apartments | 565 | 6.3% |
| 5 to 9 Unit Apartments | 44 | 0.5% |
| 10 or more Apartments | 105 | 1.2% |
| Mobile Home / Other | 2,863 | 32.1% |
| Total | 8,913 | 100.0% |
Housing Structures by Occupancy in Burke County
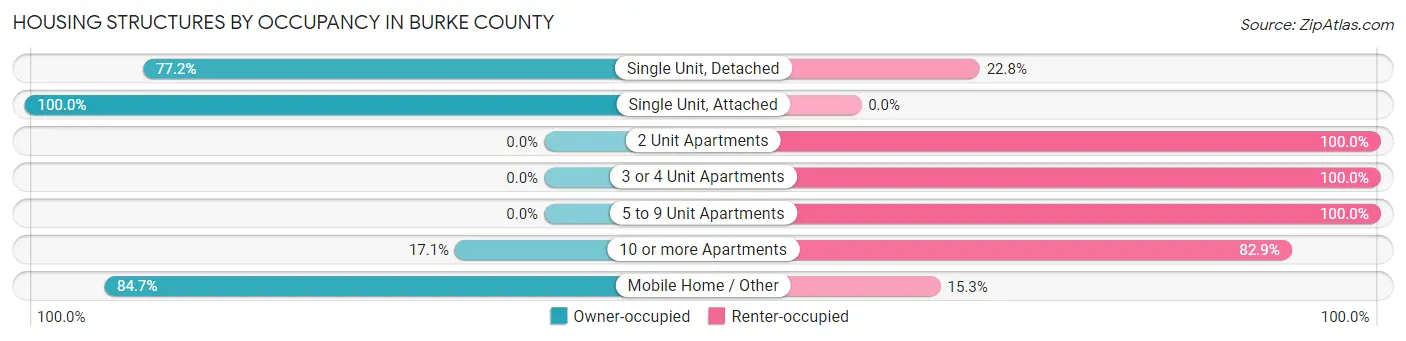
| Structure Type | Owner-occupied | Renter-occupied |
| Single Unit, Detached | 3,992 (77.2%) | 1,181 (22.8%) |
| Single Unit, Attached | 34 (100.0%) | 0 (0.0%) |
| 2 Unit Apartments | 0 (0.0%) | 129 (100.0%) |
| 3 or 4 Unit Apartments | 0 (0.0%) | 565 (100.0%) |
| 5 to 9 Unit Apartments | 0 (0.0%) | 44 (100.0%) |
| 10 or more Apartments | 18 (17.1%) | 87 (82.9%) |
| Mobile Home / Other | 2,425 (84.7%) | 438 (15.3%) |
| Total | 6,469 (72.6%) | 2,444 (27.4%) |
Housing Structures by Number of Rooms in Burke County

| Number of Rooms | Owner-occupied | Renter-occupied |
| 1 Room | 12 (0.2%) | 0 (0.0%) |
| 2 or 3 Rooms | 216 (3.3%) | 178 (7.3%) |
| 4 or 5 Rooms | 1,814 (28.0%) | 1,447 (59.2%) |
| 6 or 7 Rooms | 2,770 (42.8%) | 623 (25.5%) |
| 8 or more Rooms | 1,657 (25.6%) | 196 (8.0%) |
| Total | 6,469 (100.0%) | 2,444 (100.0%) |
Housing Structure by Heating Type in Burke County
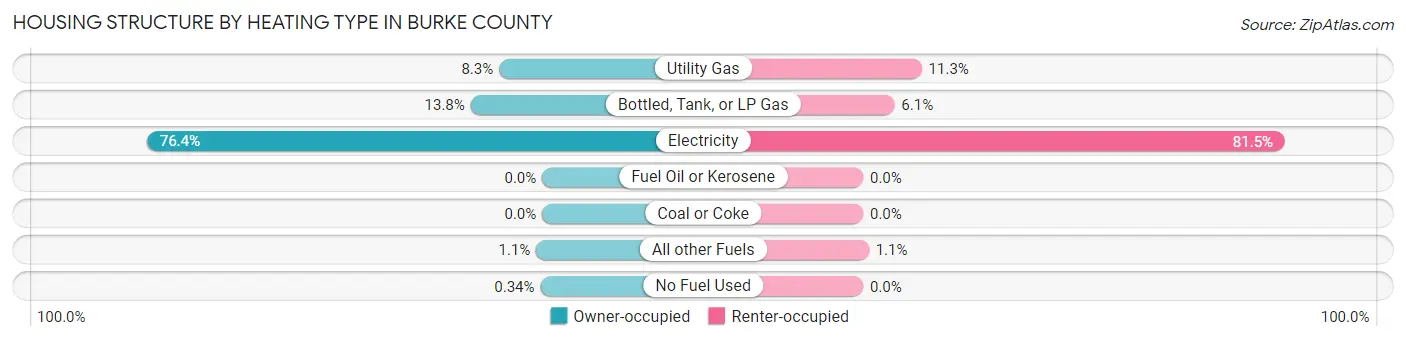
| Heating Type | Owner-occupied | Renter-occupied |
| Utility Gas | 538 (8.3%) | 277 (11.3%) |
| Bottled, Tank, or LP Gas | 894 (13.8%) | 148 (6.1%) |
| Electricity | 4,941 (76.4%) | 1,992 (81.5%) |
| Fuel Oil or Kerosene | 0 (0.0%) | 0 (0.0%) |
| Coal or Coke | 0 (0.0%) | 0 (0.0%) |
| All other Fuels | 74 (1.1%) | 27 (1.1%) |
| No Fuel Used | 22 (0.3%) | 0 (0.0%) |
| Total | 6,469 (100.0%) | 2,444 (100.0%) |
Household Vehicle Usage in Burke County
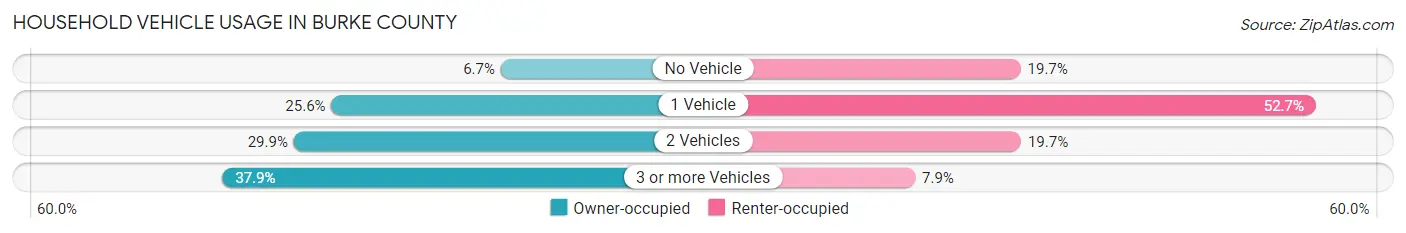
| Vehicles per Household | Owner-occupied | Renter-occupied |
| No Vehicle | 431 (6.7%) | 481 (19.7%) |
| 1 Vehicle | 1,658 (25.6%) | 1,289 (52.7%) |
| 2 Vehicles | 1,931 (29.8%) | 482 (19.7%) |
| 3 or more Vehicles | 2,449 (37.9%) | 192 (7.9%) |
| Total | 6,469 (100.0%) | 2,444 (100.0%) |
Real Estate & Mortgages in Burke County
Real Estate and Mortgage Overview in Burke County
| Characteristic | Without Mortgage | With Mortgage |
| Housing Units | 3,927 | 2,542 |
| Median Property Value | $84,400 | $155,000 |
| Median Household Income | $50,890 | $415 |
| Monthly Housing Costs | $372 | $96 |
| Real Estate Taxes | $627 | $226 |
Property Value by Mortgage Status in Burke County
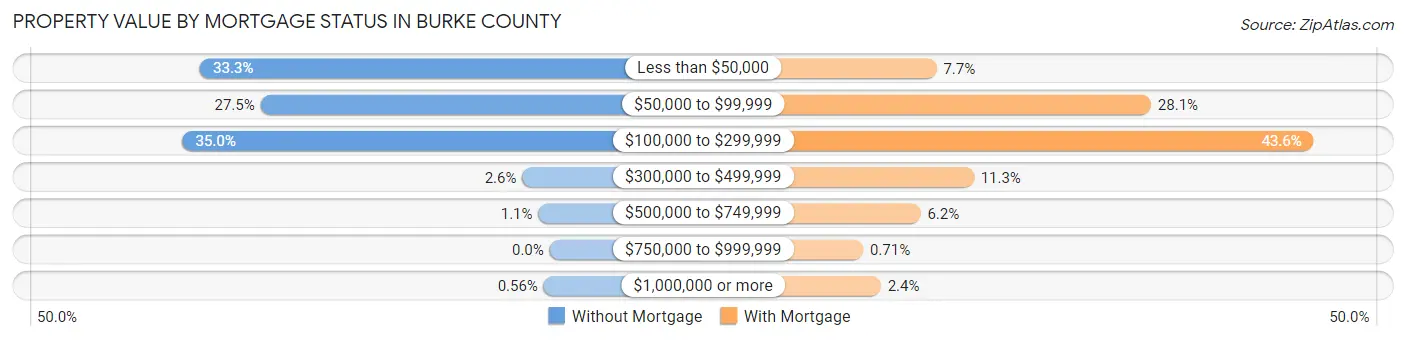
| Property Value | Without Mortgage | With Mortgage |
| Less than $50,000 | 1,307 (33.3%) | 196 (7.7%) |
| $50,000 to $99,999 | 1,081 (27.5%) | 715 (28.1%) |
| $100,000 to $299,999 | 1,373 (35.0%) | 1,109 (43.6%) |
| $300,000 to $499,999 | 102 (2.6%) | 286 (11.3%) |
| $500,000 to $749,999 | 42 (1.1%) | 157 (6.2%) |
| $750,000 to $999,999 | 0 (0.0%) | 18 (0.7%) |
| $1,000,000 or more | 22 (0.6%) | 61 (2.4%) |
| Total | 3,927 (100.0%) | 2,542 (100.0%) |
Household Income by Mortgage Status in Burke County
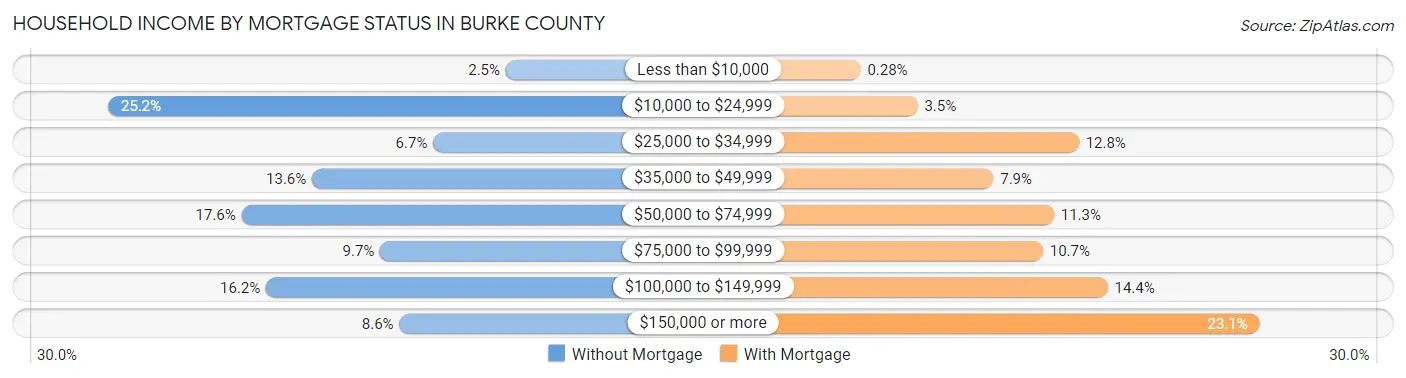
| Household Income | Without Mortgage | With Mortgage |
| Less than $10,000 | 98 (2.5%) | 7 (0.3%) |
| $10,000 to $24,999 | 991 (25.2%) | 90 (3.5%) |
| $25,000 to $34,999 | 261 (6.7%) | 324 (12.8%) |
| $35,000 to $49,999 | 533 (13.6%) | 200 (7.9%) |
| $50,000 to $74,999 | 691 (17.6%) | 288 (11.3%) |
| $75,000 to $99,999 | 380 (9.7%) | 272 (10.7%) |
| $100,000 to $149,999 | 636 (16.2%) | 366 (14.4%) |
| $150,000 or more | 337 (8.6%) | 587 (23.1%) |
| Total | 3,927 (100.0%) | 2,542 (100.0%) |
Property Value to Household Income Ratio in Burke County
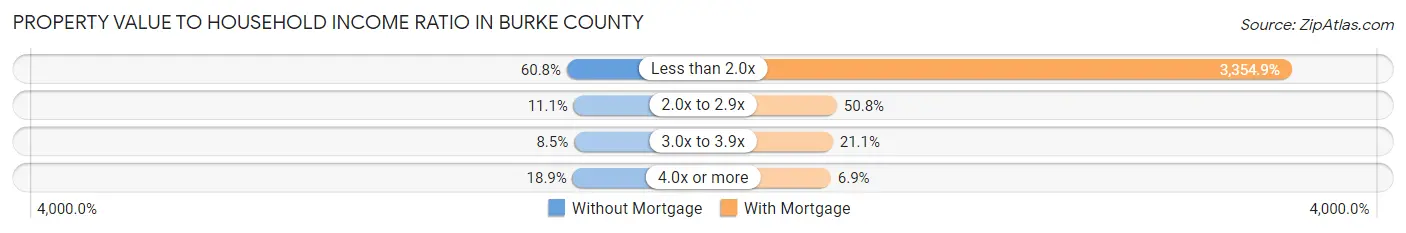
| Value-to-Income Ratio | Without Mortgage | With Mortgage |
| Less than 2.0x | 2,386 (60.8%) | 85,281 (3,354.9%) |
| 2.0x to 2.9x | 434 (11.1%) | 1,292 (50.8%) |
| 3.0x to 3.9x | 332 (8.5%) | 537 (21.1%) |
| 4.0x or more | 742 (18.9%) | 175 (6.9%) |
| Total | 3,927 (100.0%) | 2,542 (100.0%) |
Real Estate Taxes by Mortgage Status in Burke County
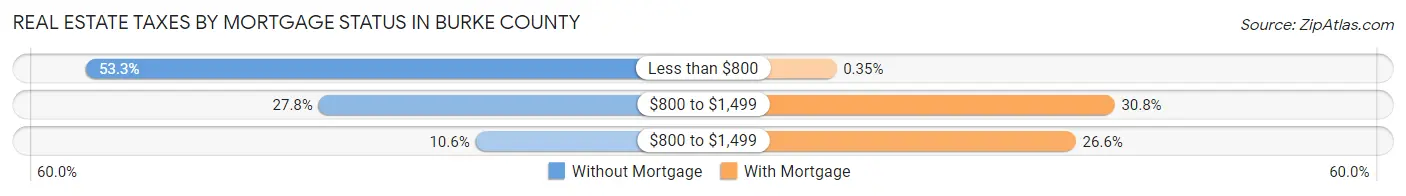
| Property Taxes | Without Mortgage | With Mortgage |
| Less than $800 | 2,092 (53.3%) | 9 (0.4%) |
| $800 to $1,499 | 1,091 (27.8%) | 784 (30.8%) |
| $800 to $1,499 | 416 (10.6%) | 676 (26.6%) |
| Total | 3,927 (100.0%) | 2,542 (100.0%) |
Health & Disability in Burke County
Health Insurance Coverage by Age in Burke County
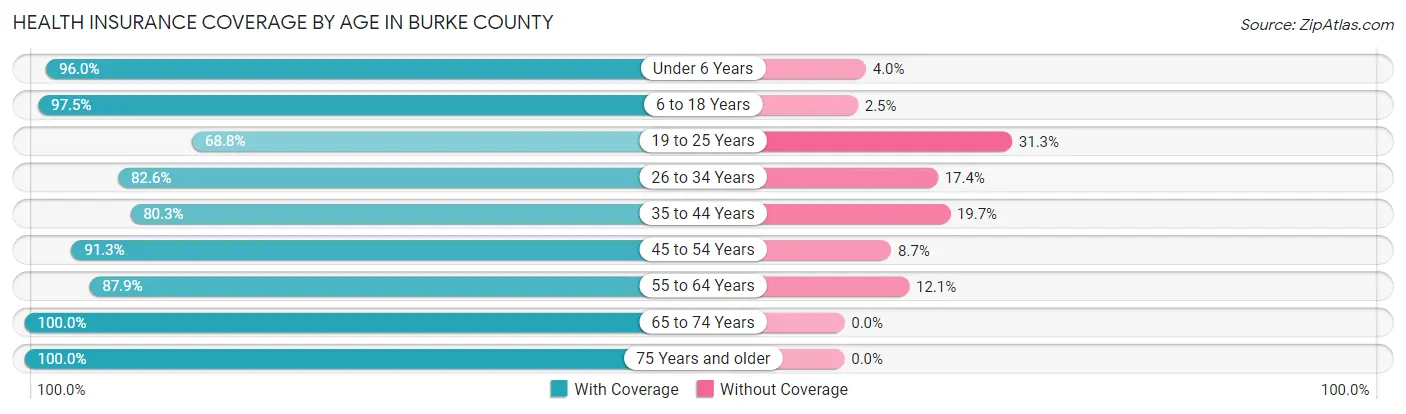
| Age Bracket | With Coverage | Without Coverage |
| Under 6 Years | 1,700 (96.0%) | 71 (4.0%) |
| 6 to 18 Years | 4,747 (97.5%) | 122 (2.5%) |
| 19 to 25 Years | 1,553 (68.8%) | 706 (31.2%) |
| 26 to 34 Years | 1,636 (82.6%) | 345 (17.4%) |
| 35 to 44 Years | 2,445 (80.3%) | 600 (19.7%) |
| 45 to 54 Years | 2,669 (91.3%) | 255 (8.7%) |
| 55 to 64 Years | 2,986 (87.9%) | 410 (12.1%) |
| 65 to 74 Years | 2,433 (100.0%) | 0 (0.0%) |
| 75 Years and older | 1,456 (100.0%) | 0 (0.0%) |
| Total | 21,625 (89.6%) | 2,509 (10.4%) |
Health Insurance Coverage by Citizenship Status in Burke County

| Citizenship Status | With Coverage | Without Coverage |
| Native Born | 1,700 (96.0%) | 71 (4.0%) |
| Foreign Born, Citizen | 4,747 (97.5%) | 122 (2.5%) |
| Foreign Born, not a Citizen | 1,553 (68.8%) | 706 (31.2%) |
Health Insurance Coverage by Household Income in Burke County
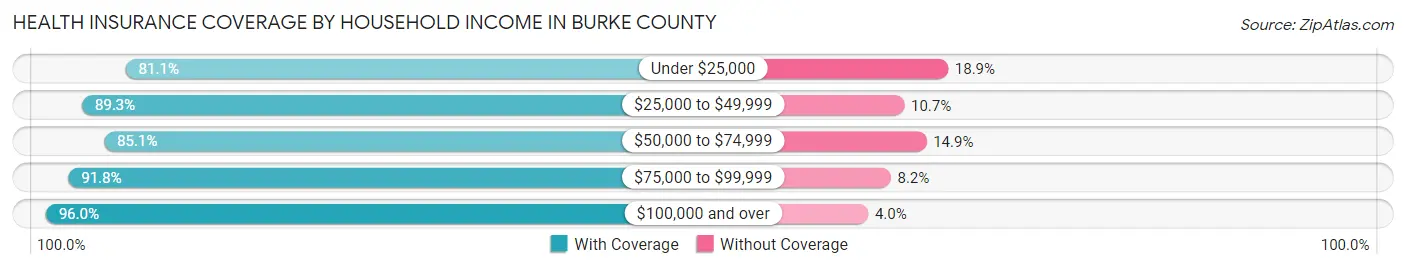
| Household Income | With Coverage | Without Coverage |
| Under $25,000 | 3,347 (81.1%) | 782 (18.9%) |
| $25,000 to $49,999 | 4,933 (89.3%) | 593 (10.7%) |
| $50,000 to $74,999 | 3,542 (85.1%) | 619 (14.9%) |
| $75,000 to $99,999 | 2,051 (91.8%) | 183 (8.2%) |
| $100,000 and over | 7,735 (96.0%) | 320 (4.0%) |
Public vs Private Health Insurance Coverage by Age in Burke County
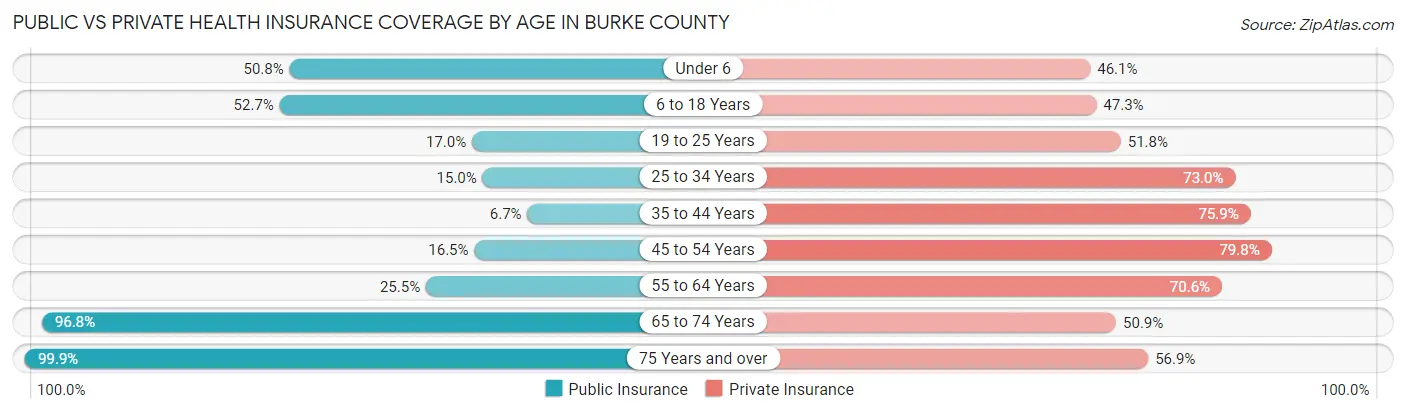
| Age Bracket | Public Insurance | Private Insurance |
| Under 6 | 900 (50.8%) | 817 (46.1%) |
| 6 to 18 Years | 2,564 (52.7%) | 2,301 (47.3%) |
| 19 to 25 Years | 383 (17.0%) | 1,170 (51.8%) |
| 25 to 34 Years | 297 (15.0%) | 1,447 (73.0%) |
| 35 to 44 Years | 203 (6.7%) | 2,310 (75.9%) |
| 45 to 54 Years | 483 (16.5%) | 2,332 (79.7%) |
| 55 to 64 Years | 866 (25.5%) | 2,396 (70.6%) |
| 65 to 74 Years | 2,355 (96.8%) | 1,239 (50.9%) |
| 75 Years and over | 1,455 (99.9%) | 828 (56.9%) |
| Total | 9,506 (39.4%) | 14,840 (61.5%) |
Disability Status by Sex by Age in Burke County
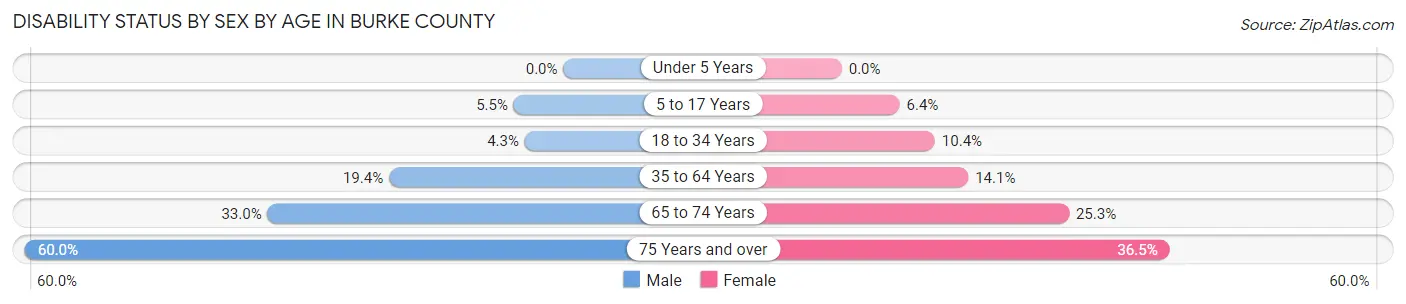
| Age Bracket | Male | Female |
| Under 5 Years | 0 (0.0%) | 0 (0.0%) |
| 5 to 17 Years | 123 (5.5%) | 153 (6.4%) |
| 18 to 34 Years | 97 (4.3%) | 262 (10.4%) |
| 35 to 64 Years | 878 (19.4%) | 682 (14.1%) |
| 65 to 74 Years | 368 (33.0%) | 333 (25.3%) |
| 75 Years and over | 385 (60.0%) | 297 (36.5%) |
Disability Class by Sex by Age in Burke County
Disability Class: Hearing Difficulty
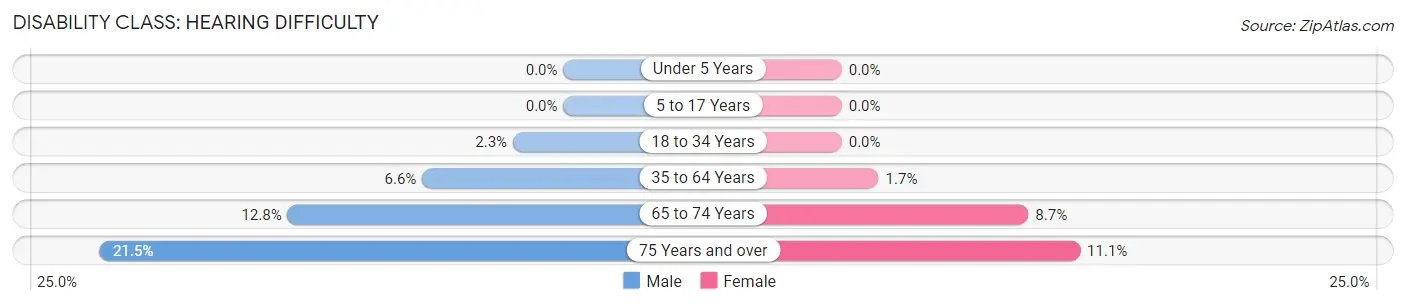
| Age Bracket | Male | Female |
| Under 5 Years | 0 (0.0%) | 0 (0.0%) |
| 5 to 17 Years | 0 (0.0%) | 0 (0.0%) |
| 18 to 34 Years | 53 (2.3%) | 0 (0.0%) |
| 35 to 64 Years | 296 (6.6%) | 83 (1.7%) |
| 65 to 74 Years | 143 (12.8%) | 114 (8.7%) |
| 75 Years and over | 138 (21.5%) | 90 (11.1%) |
Disability Class: Vision Difficulty
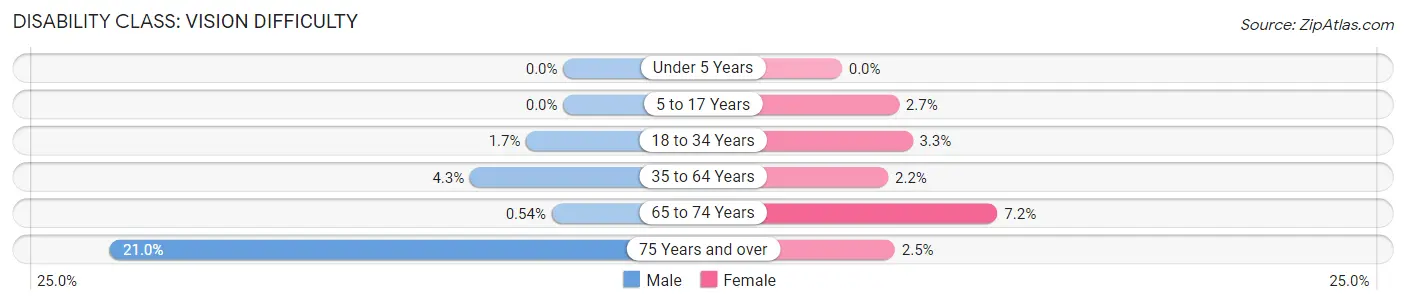
| Age Bracket | Male | Female |
| Under 5 Years | 0 (0.0%) | 0 (0.0%) |
| 5 to 17 Years | 0 (0.0%) | 63 (2.6%) |
| 18 to 34 Years | 39 (1.7%) | 83 (3.3%) |
| 35 to 64 Years | 196 (4.3%) | 104 (2.1%) |
| 65 to 74 Years | 6 (0.5%) | 95 (7.2%) |
| 75 Years and over | 135 (21.0%) | 20 (2.5%) |
Disability Class: Cognitive Difficulty
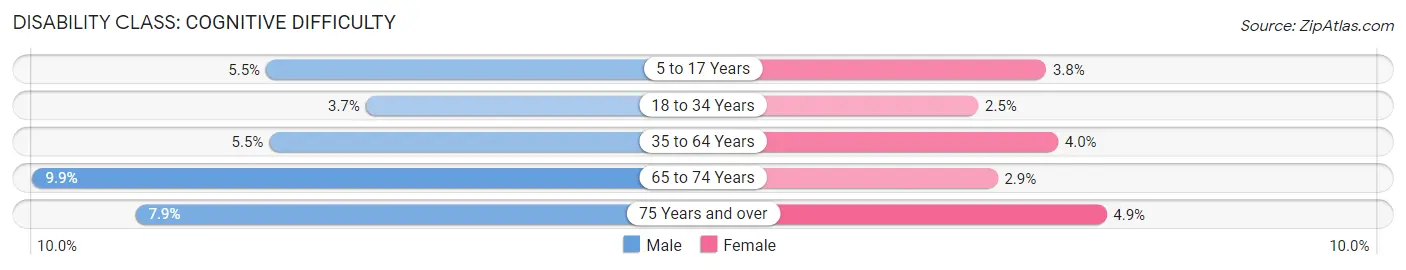
| Age Bracket | Male | Female |
| 5 to 17 Years | 123 (5.5%) | 90 (3.8%) |
| 18 to 34 Years | 83 (3.7%) | 64 (2.5%) |
| 35 to 64 Years | 247 (5.5%) | 194 (4.0%) |
| 65 to 74 Years | 110 (9.9%) | 38 (2.9%) |
| 75 Years and over | 51 (7.9%) | 40 (4.9%) |
Disability Class: Ambulatory Difficulty
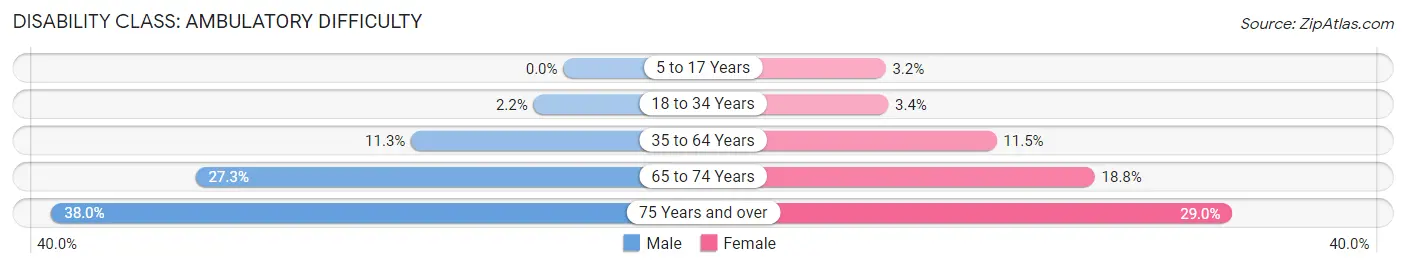
| Age Bracket | Male | Female |
| 5 to 17 Years | 0 (0.0%) | 77 (3.2%) |
| 18 to 34 Years | 50 (2.2%) | 87 (3.4%) |
| 35 to 64 Years | 511 (11.3%) | 556 (11.5%) |
| 65 to 74 Years | 305 (27.3%) | 247 (18.8%) |
| 75 Years and over | 244 (38.0%) | 236 (29.0%) |
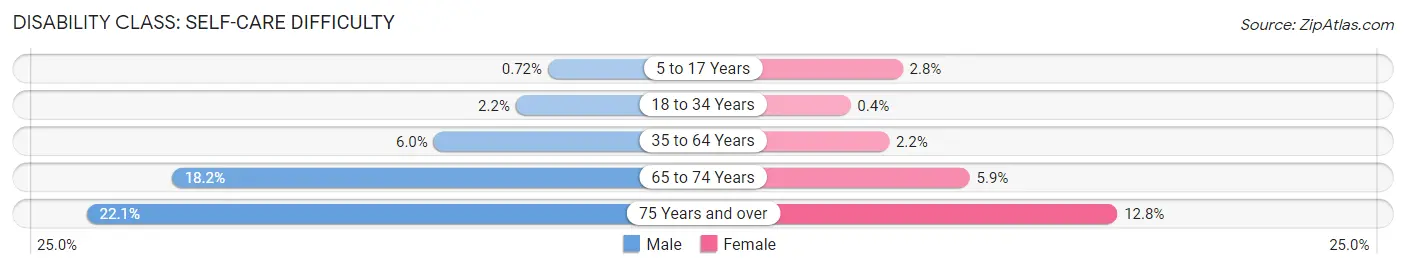
Disability Class: Self-Care Difficulty
| Age Bracket | Male | Female |
| 5 to 17 Years | 16 (0.7%) | 67 (2.8%) |
| 18 to 34 Years | 50 (2.2%) | 10 (0.4%) |
| 35 to 64 Years | 272 (6.0%) | 106 (2.2%) |
| 65 to 74 Years | 203 (18.2%) | 78 (5.9%) |
| 75 Years and over | 142 (22.1%) | 104 (12.8%) |
Technology Access in Burke County
Computing Device Access in Burke County
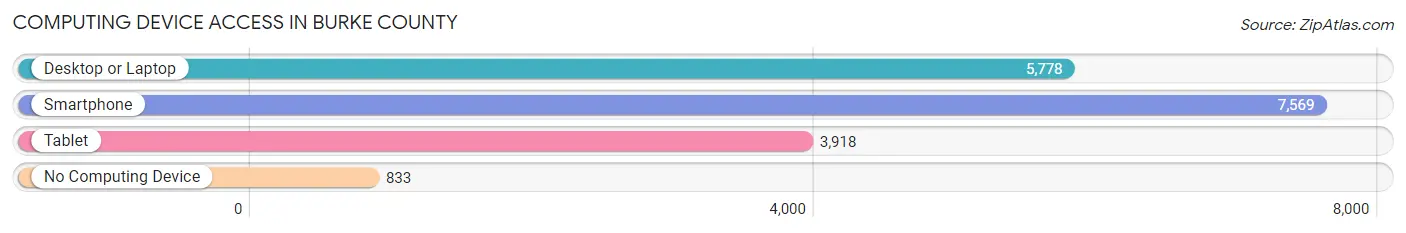
| Device Type | # Households | % Households |
| Desktop or Laptop | 5,778 | 64.8% |
| Smartphone | 7,569 | 84.9% |
| Tablet | 3,918 | 44.0% |
| No Computing Device | 833 | 9.3% |
| Total | 8,913 | 100.0% |
Internet Access in Burke County
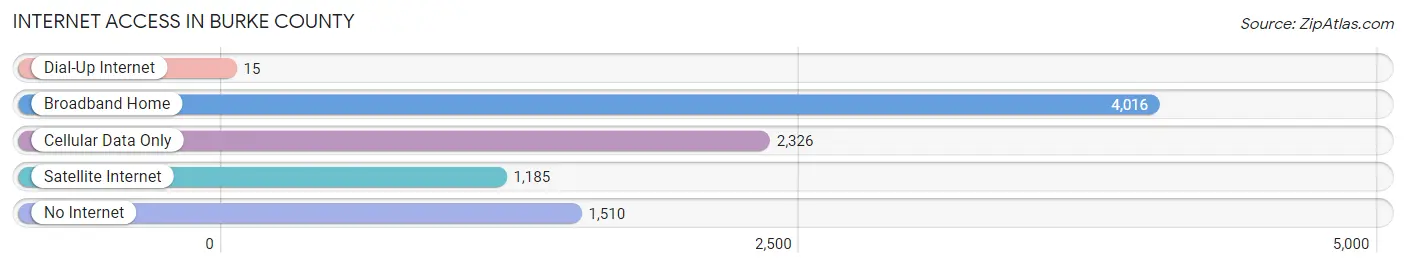
| Internet Type | # Households | % Households |
| Dial-Up Internet | 15 | 0.2% |
| Broadband Home | 4,016 | 45.1% |
| Cellular Data Only | 2,326 | 26.1% |
| Satellite Internet | 1,185 | 13.3% |
| No Internet | 1,510 | 16.9% |
| Total | 8,913 | 100.0% |
Burke County Summary
Burke County is located in the east central part of the state of Georgia, in the United States. It is part of the Augusta-Richmond County Metropolitan Statistical Area. The county seat is Waynesboro. As of the 2010 census, the population was 23,316.
History
Burke County was created in 1777 from a portion of St. George Parish. It was named for Edmund Burke, a prominent British statesman and member of Parliament. The county was originally part of the colonial parishes of St. George and St. Paul. In 1779, Burke County was divided into two parts, with the northern part becoming Richmond County and the southern part remaining Burke County.
In the early 19th century, Burke County was home to a large number of Native Americans, including the Creek, Cherokee, and Chickasaw tribes. The county was also home to a number of African American slaves. In 1820, the county had a population of 8,845, of which 4,845 were slaves.
Geography
Burke County is located in the east central part of the state of Georgia. It is bordered by Jefferson County to the north, Richmond County to the east, Screven County to the south, and McDuffie County to the west. The county has a total area of 517 square miles, of which 514 square miles is land and 3 square miles (0.6%) is water.
The county is located in the Piedmont region of Georgia, and is characterized by rolling hills and valleys. The Ogeechee River forms the western border of the county, and the Little Ogeechee River forms the eastern border. The county is home to several small lakes, including Lake Sinclair, Lake Tignall, and Lake Oconee.
Economy
Burke County has a diversified economy, with a mix of agriculture, manufacturing, and services. The county is home to several large employers, including John Deere, Georgia-Pacific, and Caterpillar.
Agriculture is an important part of the county's economy. The county is home to several large farms, including the Burke County Farm Bureau, which is the largest farm in the county. The county is also home to several small farms, which produce a variety of crops, including corn, soybeans, cotton, and peanuts.
Manufacturing is also an important part of the county's economy. The county is home to several large manufacturing plants, including a John Deere plant, a Georgia-Pacific plant, and a Caterpillar plant.
Demographics
As of the 2010 census, there were 23,316 people, 8,845 households, and 6,093 families residing in the county. The population density was 45.3 people per square mile. There were 9,845 housing units at an average density of 19.2 per square mile. The racial makeup of the county was 68.2% White, 28.2% Black or African American, 0.3% Native American, 0.5% Asian, 0.1% Pacific Islander, 1.2% from other races, and 1.5% from two or more races. 2.7% of the population were Hispanic or Latino of any race.
The median income for a household in the county was $35,945, and the median income for a family was $43,945. The per capita income for the county was $17,945. About 17.2% of families and 21.2% of the population were below the poverty line, including 28.2% of those under age 18 and 16.2% of those age 65 or over.
Common Questions
What is the Total Population of Burke County?
Total Population of Burke County is 24,337.
What is the Total Male Population of Burke County?
Total Male Population of Burke County is 11,944.
What is the Total Female Population of Burke County?
Total Female Population of Burke County is 12,393.
What is the Ratio of Males per 100 Females in Burke County?
There are 96.38 Males per 100 Females in Burke County.
What is the Ratio of Females per 100 Males in Burke County?
There are 103.76 Females per 100 Males in Burke County.
What is the Median Population Age in Burke County?
Median Population Age in Burke County is 38.8 Years.
What is the Average Family Size in Burke County
Average Family Size in Burke County is 3.5 People.
What is the Average Household Size in Burke County
Average Household Size in Burke County is 2.7 People.
What is Per Capita Income in Burke County?
Per Capita income in Burke County is $29,735.
What is the Median Family Income in Burke County?
Median Family Income in Burke County is $60,368.
What is the Median Household income in Burke County?
Median Household Income in Burke County is $50,321.
What is Income or Wage Gap in Burke County?
Income or Wage Gap in Burke County is 44.5%.
Women in Burke County earn 55.5 cents for every dollar earned by a man.
What is Inequality or Gini Index in Burke County?
Inequality or Gini Index in Burke County is 0.52.
How Large is the Labor Force in Burke County?
There are 11,145 People in the Labor Forcein in Burke County.
What is the Percentage of People in the Labor Force in Burke County?
58.3% of People are in the Labor Force in Burke County.
What is the Unemployment Rate in Burke County?
Unemployment Rate in Burke County is 5.2%.