Berrien County, GA
Berrien County Map
Berrien County Overview
18,187
TOTAL POPULATION
9,046
MALE POPULATION
9,141
FEMALE POPULATION
98.96
MALES / 100 FEMALES
101.05
FEMALES / 100 MALES
39.8
MEDIAN AGE
3.2
AVG FAMILY SIZE
2.7
AVG HOUSEHOLD SIZE
$25,100
PER CAPITA INCOME
$61,384
AVG FAMILY INCOME
$48,670
AVG HOUSEHOLD INCOME
27.4%
WAGE / INCOME GAP [ % ]
72.6¢/ $1
WAGE / INCOME GAP [ $ ]
$11,848
FAMILY INCOME DEFICIT
0.46
INEQUALITY / GINI INDEX
7,685
LABOR FORCE [ PEOPLE ]
53.4%
PERCENT IN LABOR FORCE
4.6%
UNEMPLOYMENT RATE
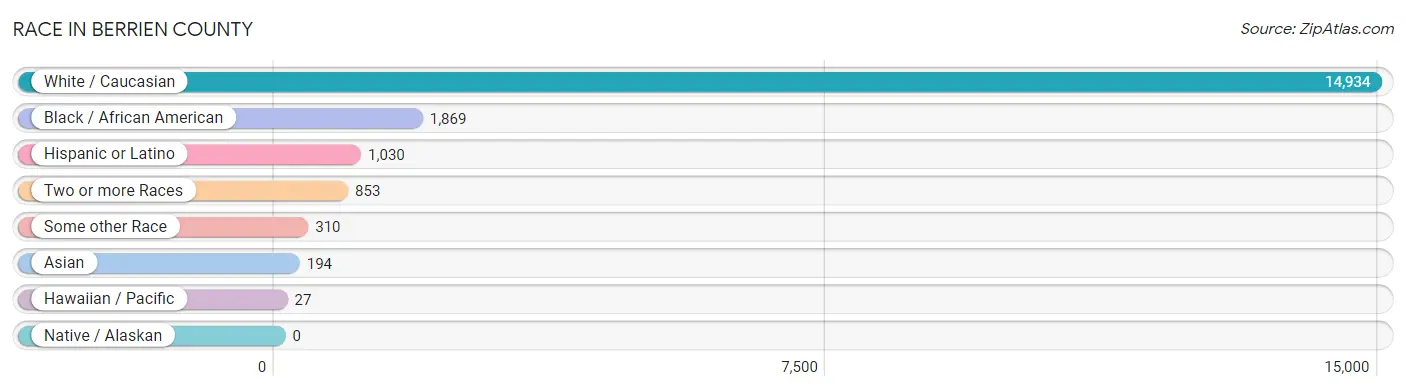
Race in Berrien County
The most populous races in Berrien County are White / Caucasian (14,934 | 82.1%), Black / African American (1,869 | 10.3%), and Hispanic or Latino (1,030 | 5.7%).
| Race | # Population | % Population |
| Asian | 194 | 1.1% |
| Black / African American | 1,869 | 10.3% |
| Hawaiian / Pacific | 27 | 0.2% |
| Hispanic or Latino | 1,030 | 5.7% |
| Native / Alaskan | 0 | 0.0% |
| White / Caucasian | 14,934 | 82.1% |
| Two or more Races | 853 | 4.7% |
| Some other Race | 310 | 1.7% |
| Total | 18,187 | 100.0% |
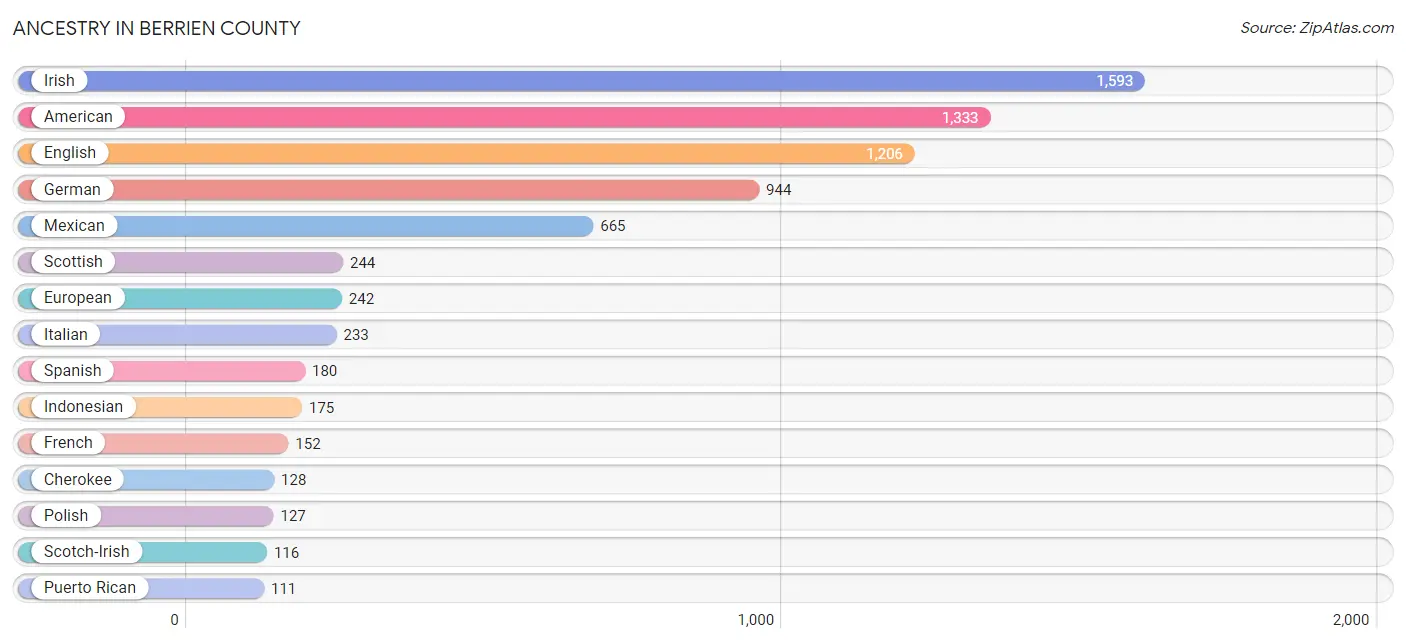
Ancestry in Berrien County
The most populous ancestries reported in Berrien County are Irish (1,593 | 8.8%), American (1,333 | 7.3%), English (1,206 | 6.6%), German (944 | 5.2%), and Mexican (665 | 3.7%), together accounting for 31.6% of all Berrien County residents.
| Ancestry | # Population | % Population |
| African | 9 | 0.1% |
| American | 1,333 | 7.3% |
| Austrian | 51 | 0.3% |
| British | 20 | 0.1% |
| Burmese | 81 | 0.4% |
| Cajun | 8 | 0.0% |
| Central American | 64 | 0.4% |
| Cherokee | 128 | 0.7% |
| Czech | 7 | 0.0% |
| Danish | 12 | 0.1% |
| Dominican | 2 | 0.0% |
| Dutch | 30 | 0.2% |
| Eastern European | 10 | 0.1% |
| Ecuadorian | 8 | 0.0% |
| English | 1,206 | 6.6% |
| European | 242 | 1.3% |
| French | 152 | 0.8% |
| French Canadian | 11 | 0.1% |
| German | 944 | 5.2% |
| Guatemalan | 1 | 0.0% |
| Honduran | 63 | 0.4% |
| Hungarian | 63 | 0.4% |
| Indonesian | 175 | 1.0% |
| Irish | 1,593 | 8.8% |
| Italian | 233 | 1.3% |
| Korean | 10 | 0.1% |
| Lithuanian | 13 | 0.1% |
| Mexican | 665 | 3.7% |
| Native Hawaiian | 27 | 0.2% |
| Norwegian | 31 | 0.2% |
| Polish | 127 | 0.7% |
| Puerto Rican | 111 | 0.6% |
| Russian | 9 | 0.1% |
| Scandinavian | 17 | 0.1% |
| Scotch-Irish | 116 | 0.6% |
| Scottish | 244 | 1.3% |
| Sioux | 4 | 0.0% |
| Slovak | 11 | 0.1% |
| South American | 8 | 0.0% |
| Spanish | 180 | 1.0% |
| Sri Lankan | 51 | 0.3% |
| Subsaharan African | 9 | 0.1% |
| Swedish | 1 | 0.0% |
| Swiss | 17 | 0.1% |
| Welsh | 34 | 0.2% | View All 45 Rows |
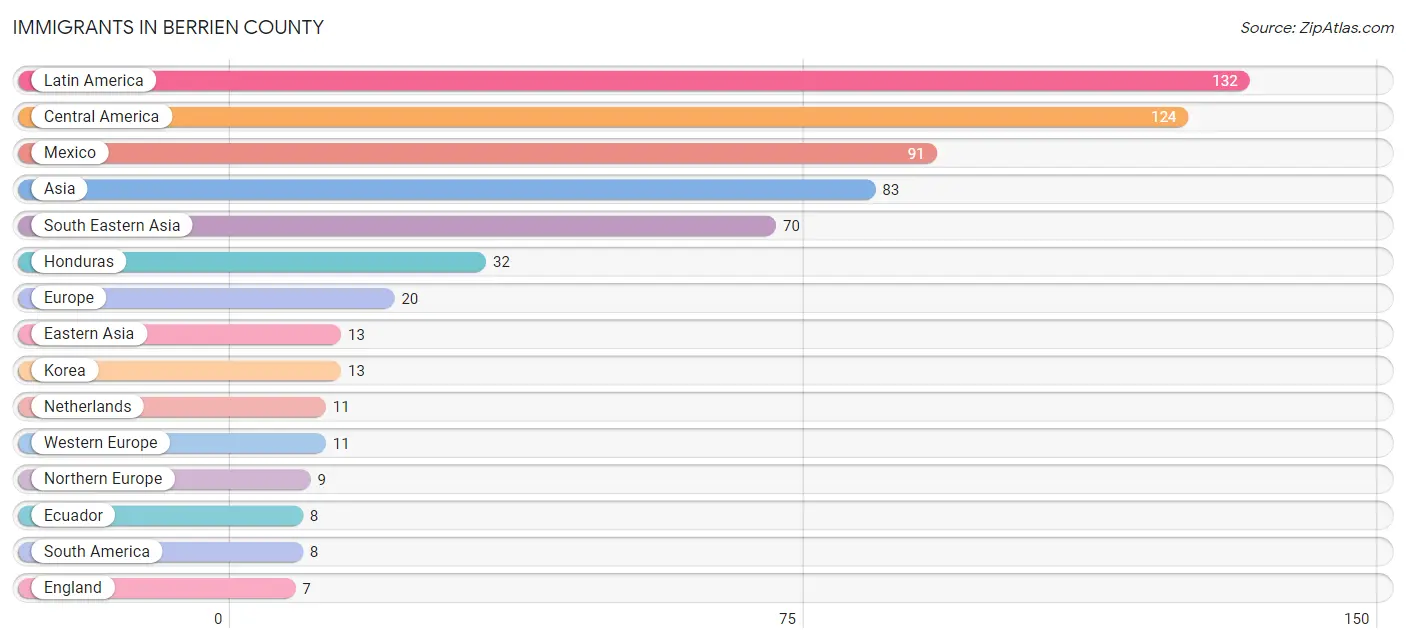
Immigrants in Berrien County
The most numerous immigrant groups reported in Berrien County came from Latin America (132 | 0.7%), Central America (124 | 0.7%), Mexico (91 | 0.5%), Asia (83 | 0.5%), and South Eastern Asia (70 | 0.4%), together accounting for 2.8% of all Berrien County residents.
| Immigration Origin | # Population | % Population |
| Asia | 83 | 0.5% |
| Australia | 4 | 0.0% |
| Central America | 124 | 0.7% |
| Eastern Asia | 13 | 0.1% |
| Ecuador | 8 | 0.0% |
| England | 7 | 0.0% |
| Europe | 20 | 0.1% |
| Guatemala | 1 | 0.0% |
| Honduras | 32 | 0.2% |
| Korea | 13 | 0.1% |
| Latin America | 132 | 0.7% |
| Mexico | 91 | 0.5% |
| Netherlands | 11 | 0.1% |
| Northern Europe | 9 | 0.1% |
| Oceania | 4 | 0.0% |
| South America | 8 | 0.0% |
| South Eastern Asia | 70 | 0.4% |
| Western Europe | 11 | 0.1% | View All 18 Rows |
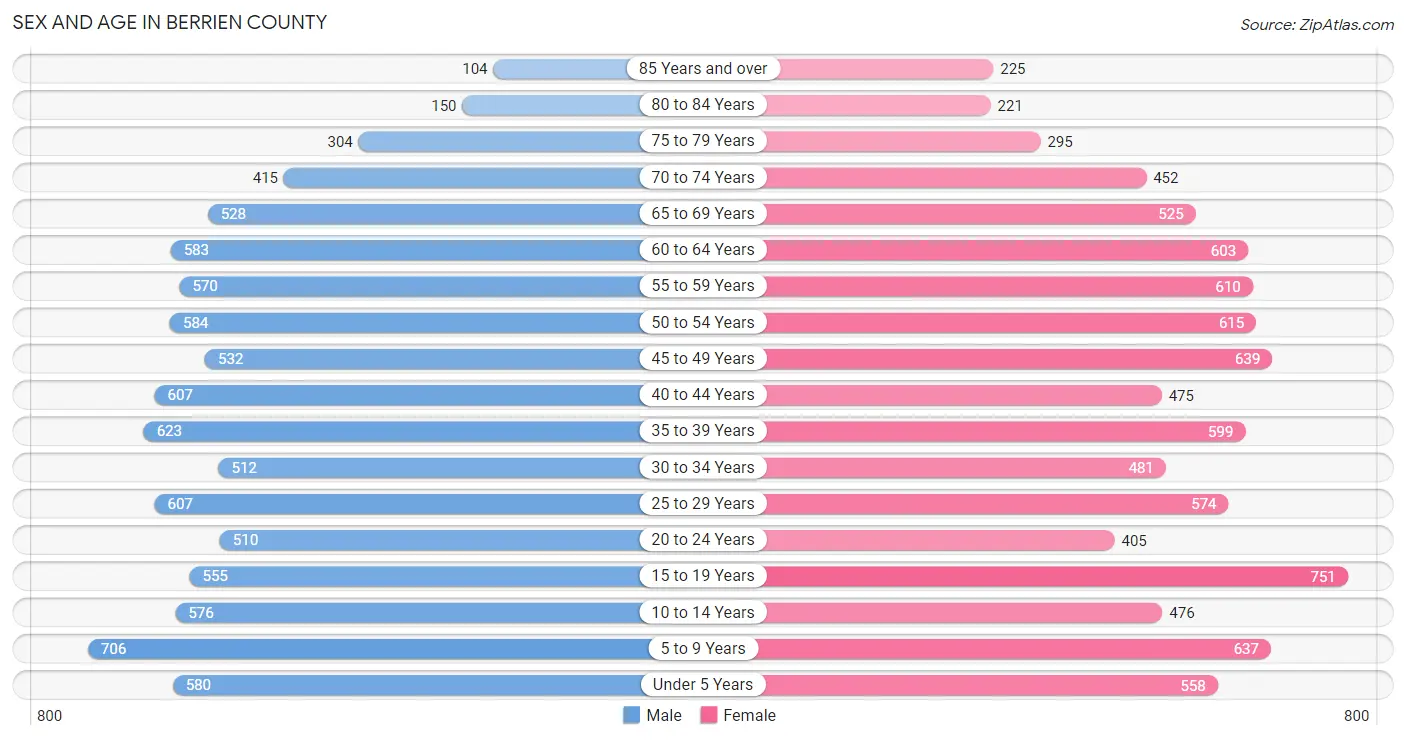
Sex and Age in Berrien County
Sex and Age in Berrien County
The most populous age groups in Berrien County are 5 to 9 Years (706 | 7.8%) for men and 15 to 19 Years (751 | 8.2%) for women.
| Age Bracket | Male | Female |
| Under 5 Years | 580 (6.4%) | 558 (6.1%) |
| 5 to 9 Years | 706 (7.8%) | 637 (7.0%) |
| 10 to 14 Years | 576 (6.4%) | 476 (5.2%) |
| 15 to 19 Years | 555 (6.1%) | 751 (8.2%) |
| 20 to 24 Years | 510 (5.6%) | 405 (4.4%) |
| 25 to 29 Years | 607 (6.7%) | 574 (6.3%) |
| 30 to 34 Years | 512 (5.7%) | 481 (5.3%) |
| 35 to 39 Years | 623 (6.9%) | 599 (6.6%) |
| 40 to 44 Years | 607 (6.7%) | 475 (5.2%) |
| 45 to 49 Years | 532 (5.9%) | 639 (7.0%) |
| 50 to 54 Years | 584 (6.5%) | 615 (6.7%) |
| 55 to 59 Years | 570 (6.3%) | 610 (6.7%) |
| 60 to 64 Years | 583 (6.4%) | 603 (6.6%) |
| 65 to 69 Years | 528 (5.8%) | 525 (5.7%) |
| 70 to 74 Years | 415 (4.6%) | 452 (4.9%) |
| 75 to 79 Years | 304 (3.4%) | 295 (3.2%) |
| 80 to 84 Years | 150 (1.7%) | 221 (2.4%) |
| 85 Years and over | 104 (1.1%) | 225 (2.5%) |
| Total | 9,046 (100.0%) | 9,141 (100.0%) |
Families and Households in Berrien County
Median Family Size in Berrien County
The median family size in Berrien County is 3.21 persons per family, with single female/mother families (1,060 | 22.5%) accounting for the largest median family size of 3.45 persons per family. On the other hand, single male/father families (206 | 4.4%) represent the smallest median family size with 2.53 persons per family.
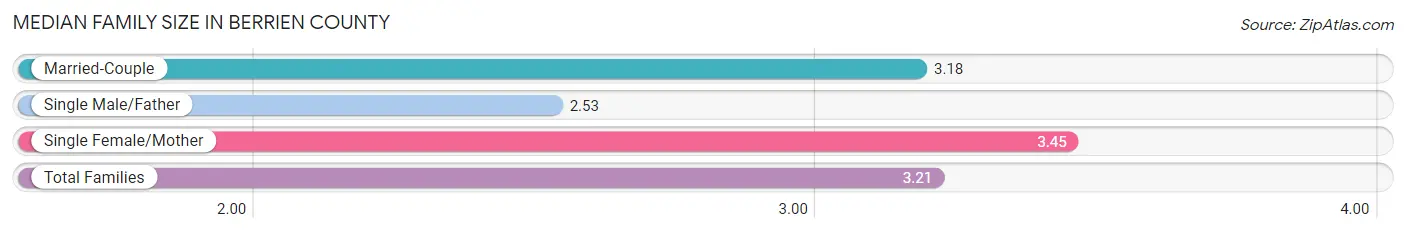
| Family Type | # Families | Family Size |
| Married-Couple | 3,445 (73.1%) | 3.18 |
| Single Male/Father | 206 (4.4%) | 2.53 |
| Single Female/Mother | 1,060 (22.5%) | 3.45 |
| Total Families | 4,711 (100.0%) | 3.21 |
Median Household Size in Berrien County
The median household size in Berrien County is 2.66 persons per household, with single female/mother households (1,060 | 15.7%) accounting for the largest median household size of 3.66 persons per household. non-family households (2,062 | 30.4%) represent the smallest median household size with 1.23 persons per household.
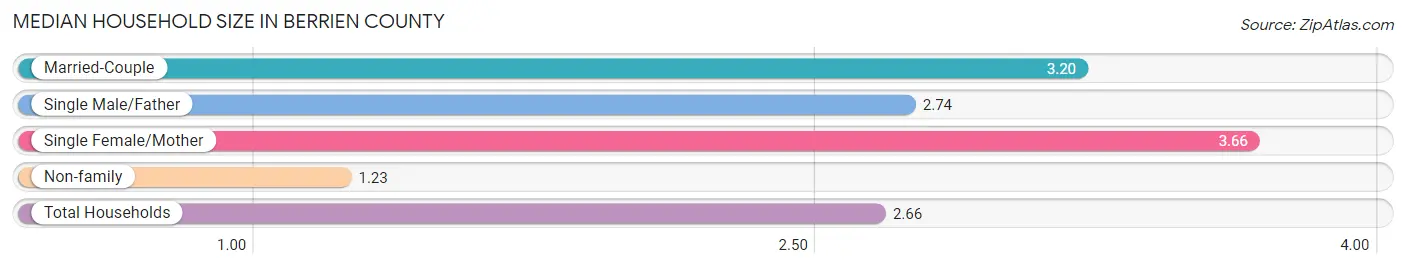
| Household Type | # Households | Household Size |
| Married-Couple | 3,445 (50.9%) | 3.20 |
| Single Male/Father | 206 (3.0%) | 2.74 |
| Single Female/Mother | 1,060 (15.7%) | 3.66 |
| Non-family | 2,062 (30.4%) | 1.23 |
| Total Households | 6,773 (100.0%) | 2.66 |
Household Size by Marriage Status in Berrien County
Out of a total of 6,773 households in Berrien County, 4,711 (69.6%) are family households, while 2,062 (30.4%) are nonfamily households. The most numerous type of family households are 2-person households, comprising 2,181, and the most common type of nonfamily households are 1-person households, comprising 1,686.
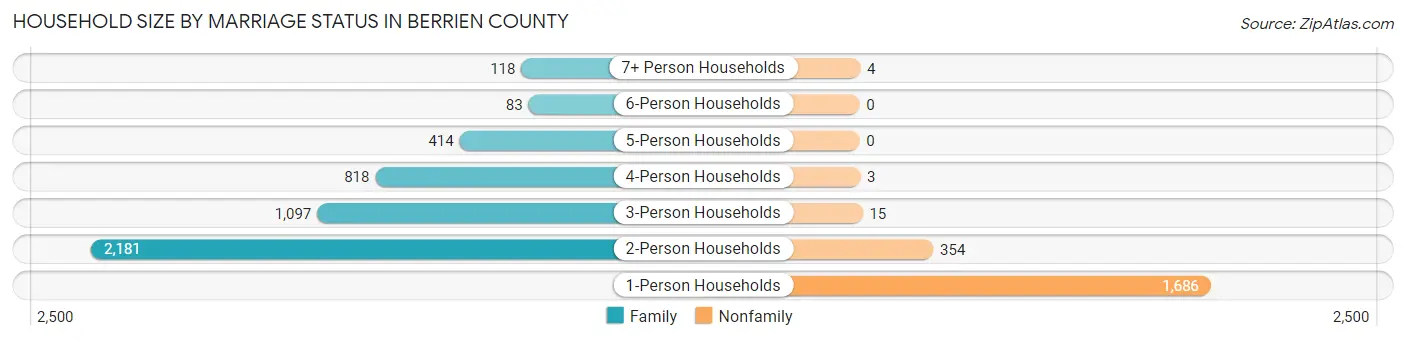
| Household Size | Family Households | Nonfamily Households |
| 1-Person Households | - | 1,686 (24.9%) |
| 2-Person Households | 2,181 (32.2%) | 354 (5.2%) |
| 3-Person Households | 1,097 (16.2%) | 15 (0.2%) |
| 4-Person Households | 818 (12.1%) | 3 (0.0%) |
| 5-Person Households | 414 (6.1%) | 0 (0.0%) |
| 6-Person Households | 83 (1.2%) | 0 (0.0%) |
| 7+ Person Households | 118 (1.7%) | 4 (0.1%) |
| Total | 4,711 (69.6%) | 2,062 (30.4%) |
Female Fertility in Berrien County
Fertility by Age in Berrien County
Average fertility rate in Berrien County is 71.0 births per 1,000 women. Women in the age bracket of 20 to 34 years have the highest fertility rate with 195.0 births per 1,000 women. Women in the age bracket of 20 to 34 years acount for 98.6% of all women with births.
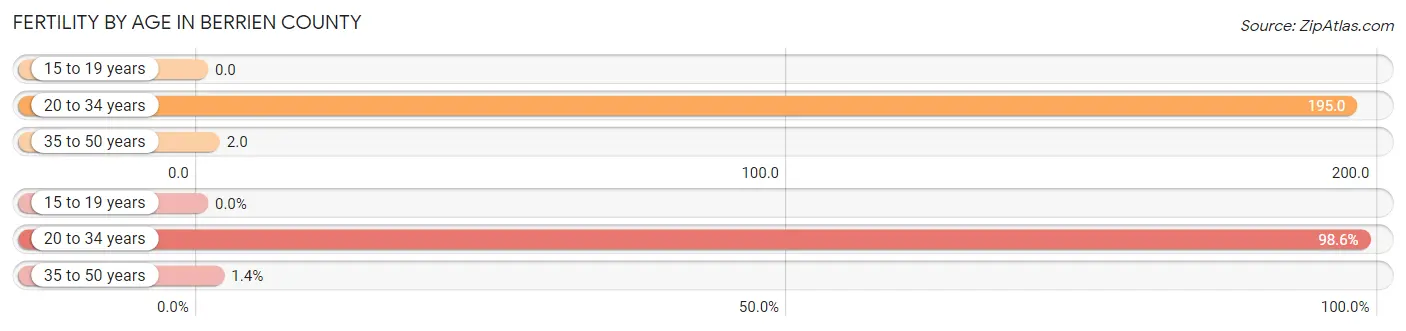
| Age Bracket | Women with Births | Births / 1,000 Women |
| 15 to 19 years | 0 (0.0%) | 0.0 |
| 20 to 34 years | 284 (98.6%) | 195.0 |
| 35 to 50 years | 4 (1.4%) | 2.0 |
| Total | 288 (100.0%) | 71.0 |
Fertility by Age by Marriage Status in Berrien County
85.4% of women with births (288) in Berrien County are married. The highest percentage of unmarried women with births falls into 20 to 34 years age bracket with 14.8% of them unmarried at the time of birth, while the lowest percentage of unmarried women with births belong to 35 to 50 years age bracket with 0.0% of them unmarried.

| Age Bracket | Married | Unmarried |
| 15 to 19 years | 0 (0.0%) | 0 (0.0%) |
| 20 to 34 years | 242 (85.2%) | 42 (14.8%) |
| 35 to 50 years | 4 (100.0%) | 0 (0.0%) |
| Total | 246 (85.4%) | 42 (14.6%) |
Fertility by Education in Berrien County

| Educational Attainment | Women with Births | Births / 1,000 Women |
| Less than High School | 9 (3.1%) | 9.0 |
| High School Diploma | 109 (37.9%) | 89.0 |
| College or Associate's Degree | 120 (41.7%) | 92.0 |
| Bachelor's Degree | 50 (17.4%) | 157.0 |
| Graduate Degree | 0 (0.0%) | 0.0 |
| Total | 288 (100.0%) | 71.0 |
Fertility by Education by Marriage Status in Berrien County
14.6% of women with births in Berrien County are unmarried. Women with the educational attainment of less than high school are most likely to be married with 100.0% of them married at childbirth, while women with the educational attainment of high school diploma are least likely to be married with 38.5% of them unmarried at childbirth.
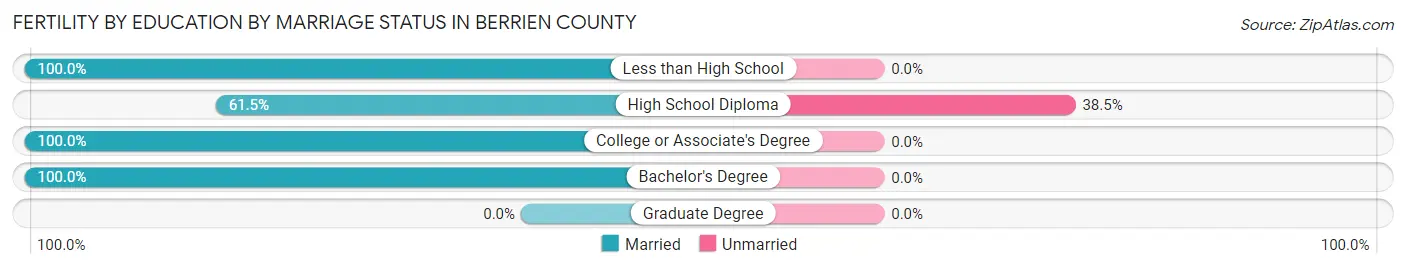
| Educational Attainment | Married | Unmarried |
| Less than High School | 9 (100.0%) | 0 (0.0%) |
| High School Diploma | 67 (61.5%) | 42 (38.5%) |
| College or Associate's Degree | 120 (100.0%) | 0 (0.0%) |
| Bachelor's Degree | 50 (100.0%) | 0 (0.0%) |
| Graduate Degree | 0 (0.0%) | 0 (0.0%) |
| Total | 246 (85.4%) | 42 (14.6%) |
Income in Berrien County
Income Overview in Berrien County
Per Capita Income in Berrien County is $25,100, while median incomes of families and households are $61,384 and $48,670 respectively.
| Characteristic | Number | Measure |
| Per Capita Income | 18,187 | $25,100 |
| Median Family Income | 4,711 | $61,384 |
| Mean Family Income | 4,711 | $73,609 |
| Median Household Income | 6,773 | $48,670 |
| Mean Household Income | 6,773 | $63,731 |
| Income Deficit | 4,711 | $11,848 |
| Wage / Income Gap (%) | 18,187 | 27.44% |
| Wage / Income Gap ($) | 18,187 | 72.56¢ per $1 |
| Gini / Inequality Index | 18,187 | 0.46 |
Earnings by Sex in Berrien County
Average Earnings in Berrien County are $36,337, $42,331 for men and $30,714 for women, a difference of 27.4%.
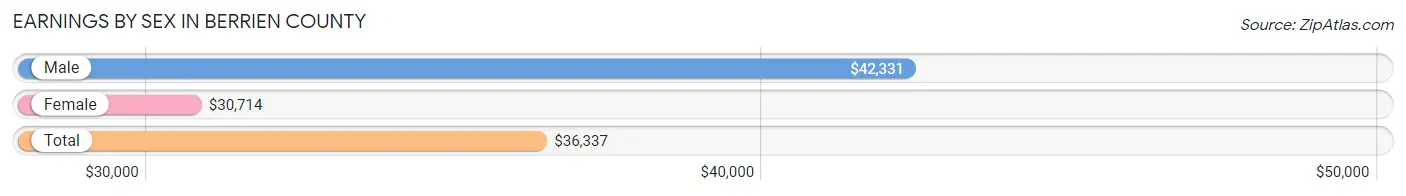
| Sex | Number | Average Earnings |
| Male | 4,338 (56.1%) | $42,331 |
| Female | 3,398 (43.9%) | $30,714 |
| Total | 7,736 (100.0%) | $36,337 |
Earnings by Sex by Income Bracket in Berrien County
The most common earnings brackets in Berrien County are $55,000 to $64,999 for men (416 | 9.6%) and $30,000 to $34,999 for women (328 | 9.7%).
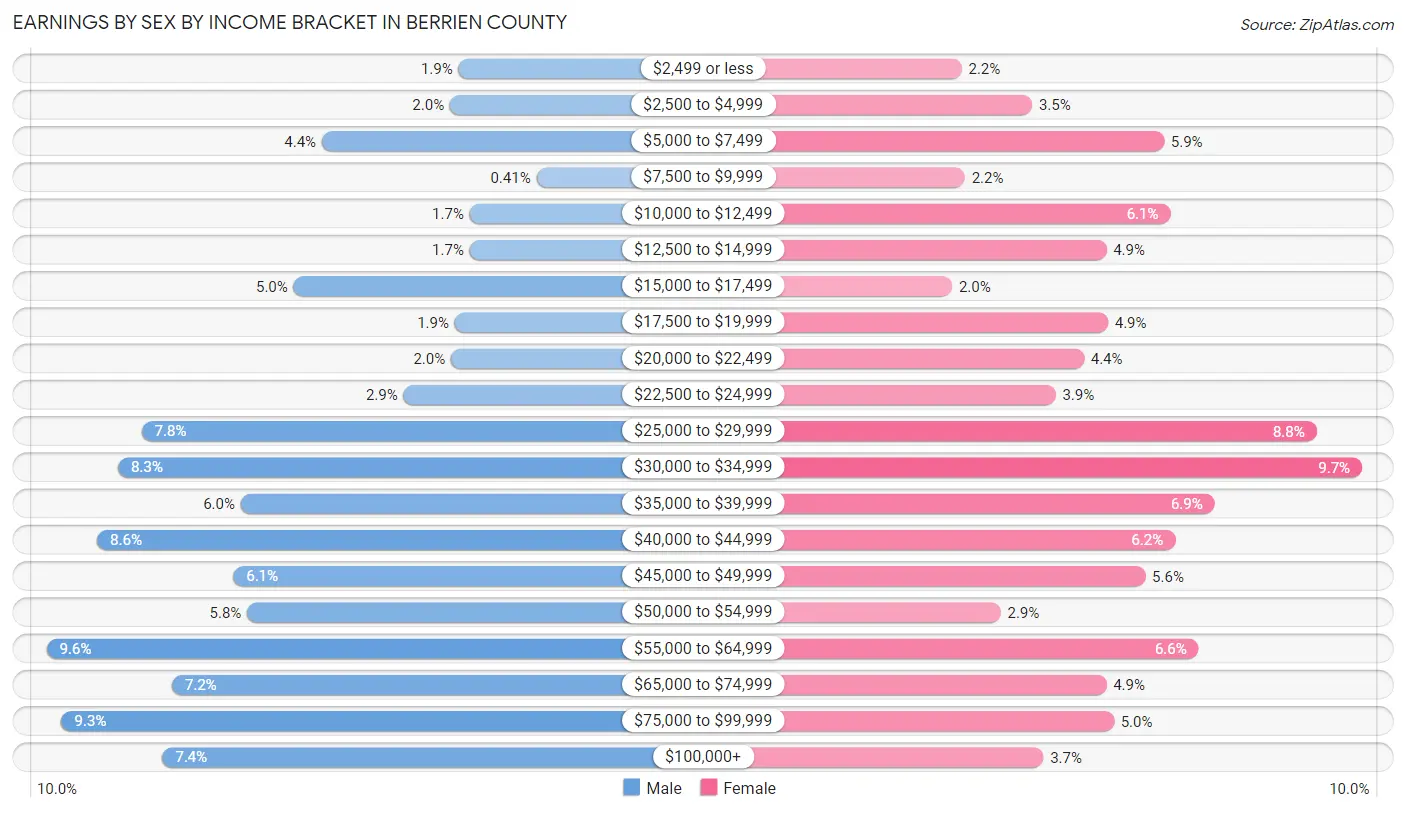
| Income | Male | Female |
| $2,499 or less | 81 (1.9%) | 73 (2.1%) |
| $2,500 to $4,999 | 88 (2.0%) | 118 (3.5%) |
| $5,000 to $7,499 | 192 (4.4%) | 202 (5.9%) |
| $7,500 to $9,999 | 18 (0.4%) | 75 (2.2%) |
| $10,000 to $12,499 | 72 (1.7%) | 206 (6.1%) |
| $12,500 to $14,999 | 72 (1.7%) | 165 (4.9%) |
| $15,000 to $17,499 | 215 (5.0%) | 67 (2.0%) |
| $17,500 to $19,999 | 84 (1.9%) | 166 (4.9%) |
| $20,000 to $22,499 | 87 (2.0%) | 151 (4.4%) |
| $22,500 to $24,999 | 126 (2.9%) | 133 (3.9%) |
| $25,000 to $29,999 | 339 (7.8%) | 299 (8.8%) |
| $30,000 to $34,999 | 358 (8.3%) | 328 (9.7%) |
| $35,000 to $39,999 | 258 (5.9%) | 234 (6.9%) |
| $40,000 to $44,999 | 375 (8.6%) | 209 (6.1%) |
| $45,000 to $49,999 | 264 (6.1%) | 190 (5.6%) |
| $50,000 to $54,999 | 253 (5.8%) | 98 (2.9%) |
| $55,000 to $64,999 | 416 (9.6%) | 224 (6.6%) |
| $65,000 to $74,999 | 314 (7.2%) | 165 (4.9%) |
| $75,000 to $99,999 | 404 (9.3%) | 170 (5.0%) |
| $100,000+ | 322 (7.4%) | 125 (3.7%) |
| Total | 4,338 (100.0%) | 3,398 (100.0%) |
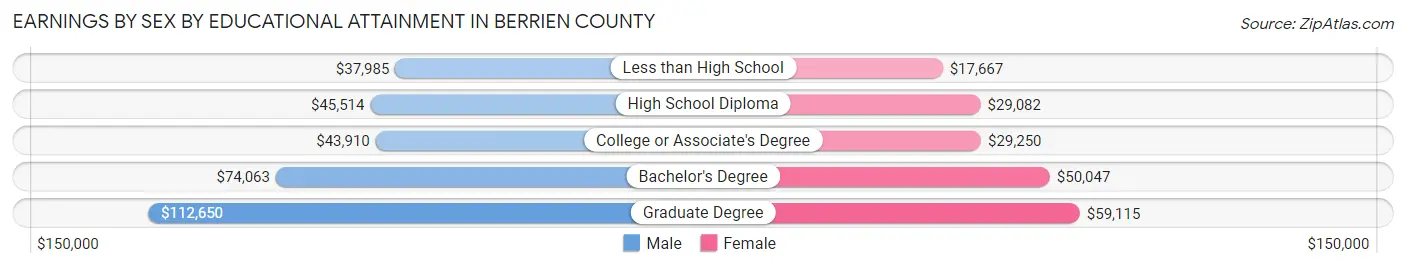
Earnings by Sex by Educational Attainment in Berrien County
Average earnings in Berrien County are $44,813 for men and $32,938 for women, a difference of 26.5%. Men with an educational attainment of graduate degree enjoy the highest average annual earnings of $112,650, while those with less than high school education earn the least with $37,985. Women with an educational attainment of graduate degree earn the most with the average annual earnings of $59,115, while those with less than high school education have the smallest earnings of $17,667.
| Educational Attainment | Male Income | Female Income |
| Less than High School | $37,985 | $17,667 |
| High School Diploma | $45,514 | $29,082 |
| College or Associate's Degree | $43,910 | $29,250 |
| Bachelor's Degree | $74,063 | $50,047 |
| Graduate Degree | $112,650 | $59,115 |
| Total | $44,813 | $32,938 |
Family Income in Berrien County
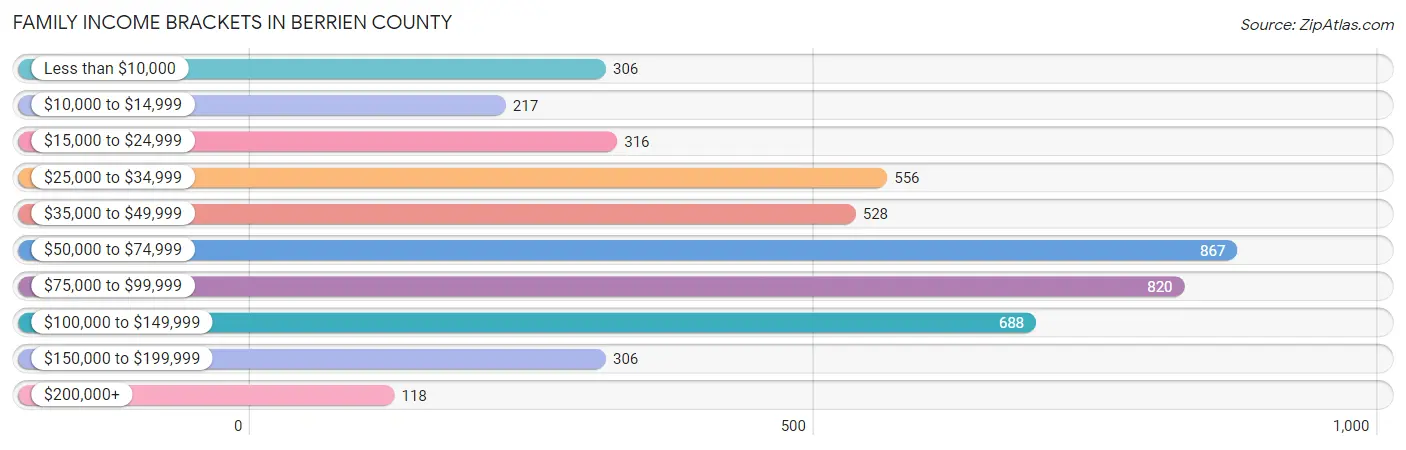
Family Income Brackets in Berrien County
According to the Berrien County family income data, there are 867 families falling into the $50,000 to $74,999 income range, which is the most common income bracket and makes up 18.4% of all families. Conversely, the $200,000+ income bracket is the least frequent group with only 118 families (2.5%) belonging to this category.
| Income Bracket | # Families | % Families |
| Less than $10,000 | 306 | 6.5% |
| $10,000 to $14,999 | 217 | 4.6% |
| $15,000 to $24,999 | 316 | 6.7% |
| $25,000 to $34,999 | 556 | 11.8% |
| $35,000 to $49,999 | 528 | 11.2% |
| $50,000 to $74,999 | 867 | 18.4% |
| $75,000 to $99,999 | 820 | 17.4% |
| $100,000 to $149,999 | 688 | 14.6% |
| $150,000 to $199,999 | 306 | 6.5% |
| $200,000+ | 118 | 2.5% |
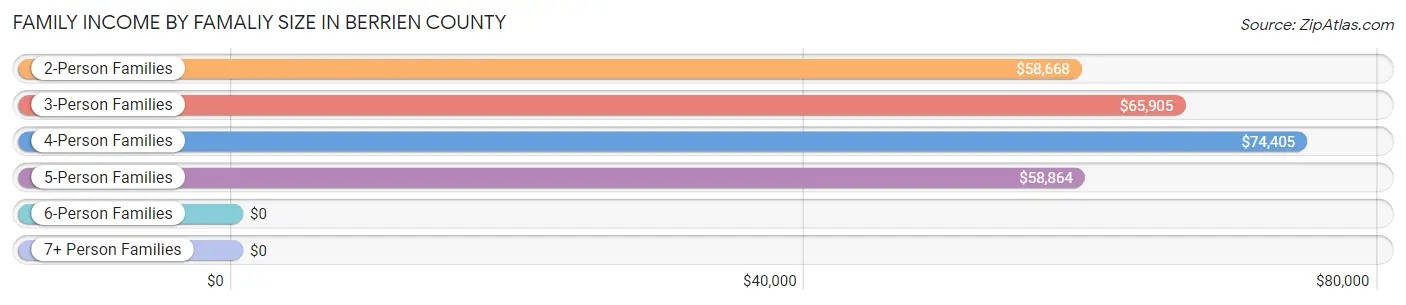
Family Income by Famaliy Size in Berrien County
4-person families (764 | 16.2%) account for the highest median family income in Berrien County with $74,405 per family, while 2-person families (2,263 | 48.0%) have the highest median income of $29,334 per family member.
| Income Bracket | # Families | Median Income |
| 2-Person Families | 2,263 (48.0%) | $58,668 |
| 3-Person Families | 1,107 (23.5%) | $65,905 |
| 4-Person Families | 764 (16.2%) | $74,405 |
| 5-Person Families | 440 (9.3%) | $58,864 |
| 6-Person Families | 53 (1.1%) | $0 |
| 7+ Person Families | 84 (1.8%) | $0 |
| Total | 4,711 (100.0%) | $61,384 |
Family Income by Number of Earners in Berrien County
The median family income in Berrien County is $61,384, with families comprising 3+ earners (298) having the highest median family income of $125,556, while families with no earners (1,136) have the lowest median family income of $25,927, accounting for 6.3% and 24.1% of families, respectively.

| Number of Earners | # Families | Median Income |
| No Earners | 1,136 (24.1%) | $25,927 |
| 1 Earner | 1,699 (36.1%) | $53,224 |
| 2 Earners | 1,578 (33.5%) | $88,889 |
| 3+ Earners | 298 (6.3%) | $125,556 |
| Total | 4,711 (100.0%) | $61,384 |
Household Income in Berrien County
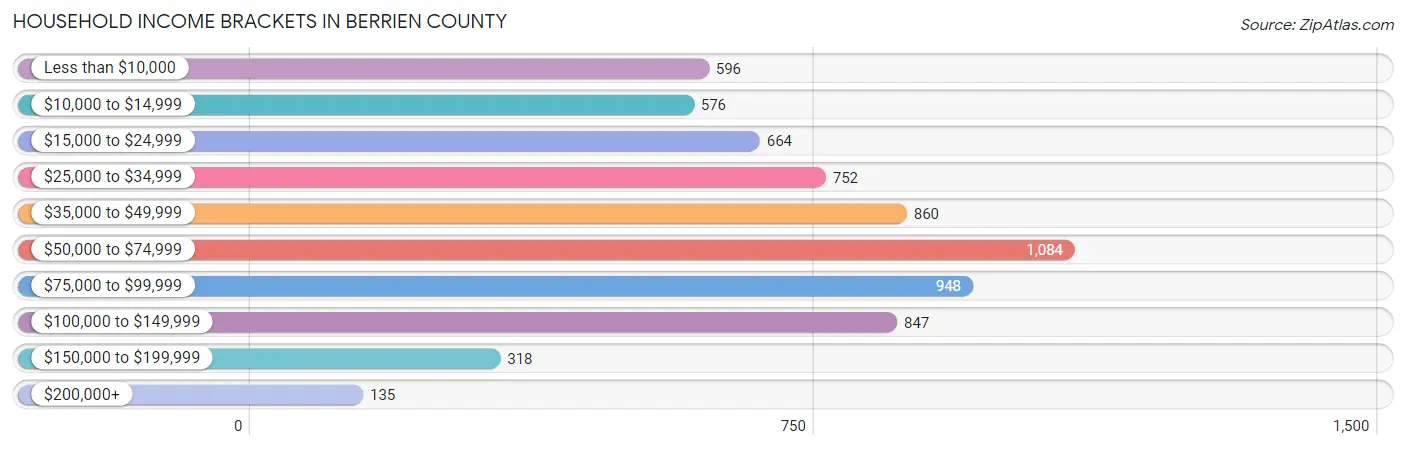
Household Income Brackets in Berrien County
With 1,084 households falling in the category, the $50,000 to $74,999 income range is the most frequent in Berrien County, accounting for 16.0% of all households. In contrast, only 135 households (2.0%) fall into the $200,000+ income bracket, making it the least populous group.
| Income Bracket | # Households | % Households |
| Less than $10,000 | 596 | 8.8% |
| $10,000 to $14,999 | 576 | 8.5% |
| $15,000 to $24,999 | 664 | 9.8% |
| $25,000 to $34,999 | 752 | 11.1% |
| $35,000 to $49,999 | 860 | 12.7% |
| $50,000 to $74,999 | 1,084 | 16.0% |
| $75,000 to $99,999 | 948 | 14.0% |
| $100,000 to $149,999 | 847 | 12.5% |
| $150,000 to $199,999 | 318 | 4.7% |
| $200,000+ | 135 | 2.0% |
Household Income by Householder Age in Berrien County
The median household income in Berrien County is $48,670, with the highest median household income of $57,703 found in the 15 to 24 years age bracket for the primary householder. A total of 235 households (3.5%) fall into this category. Meanwhile, the 65+ years age bracket for the primary householder has the lowest median household income of $36,088, with 1,941 households (28.7%) in this group.
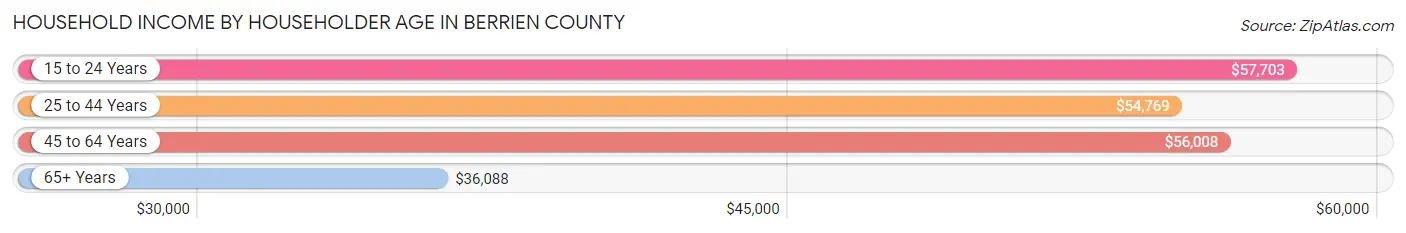
| Income Bracket | # Households | Median Income |
| 15 to 24 Years | 235 (3.5%) | $57,703 |
| 25 to 44 Years | 1,924 (28.4%) | $54,769 |
| 45 to 64 Years | 2,673 (39.5%) | $56,008 |
| 65+ Years | 1,941 (28.7%) | $36,088 |
| Total | 6,773 (100.0%) | $48,670 |
Poverty in Berrien County
Income Below Poverty by Sex and Age in Berrien County
With 20.3% poverty level for males and 26.1% for females among the residents of Berrien County, 12 to 14 year old males and 16 and 17 year old females are the most vulnerable to poverty, with 151 males (46.5%) and 137 females (44.6%) in their respective age groups living below the poverty level.
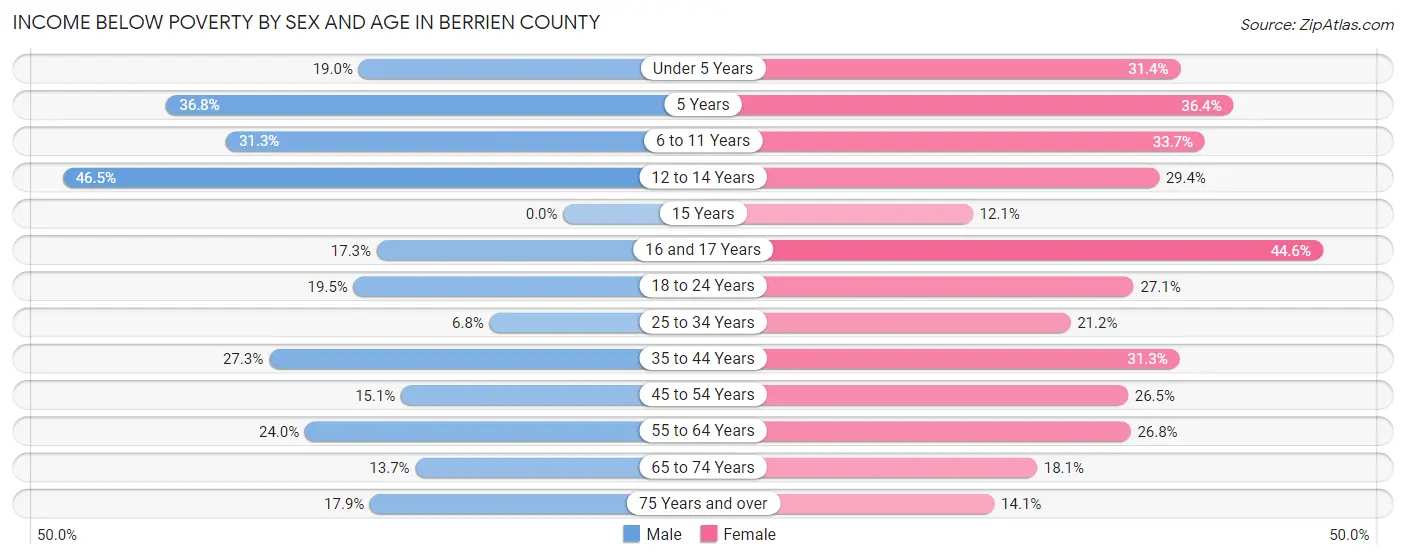
| Age Bracket | Male | Female |
| Under 5 Years | 109 (19.0%) | 174 (31.4%) |
| 5 Years | 14 (36.8%) | 28 (36.4%) |
| 6 to 11 Years | 278 (31.3%) | 249 (33.7%) |
| 12 to 14 Years | 151 (46.5%) | 85 (29.4%) |
| 15 Years | 0 (0.0%) | 21 (12.1%) |
| 16 and 17 Years | 45 (17.3%) | 137 (44.6%) |
| 18 to 24 Years | 137 (19.5%) | 183 (27.1%) |
| 25 to 34 Years | 75 (6.8%) | 223 (21.2%) |
| 35 to 44 Years | 327 (27.3%) | 336 (31.3%) |
| 45 to 54 Years | 167 (15.0%) | 332 (26.5%) |
| 55 to 64 Years | 273 (24.0%) | 325 (26.8%) |
| 65 to 74 Years | 127 (13.7%) | 173 (18.1%) |
| 75 Years and over | 99 (17.9%) | 99 (14.1%) |
| Total | 1,802 (20.3%) | 2,365 (26.1%) |
Income Above Poverty by Sex and Age in Berrien County
According to the poverty statistics in Berrien County, males aged 15 years and females aged 15 years are the age groups that are most secure financially, with 100.0% of males and 87.9% of females in these age groups living above the poverty line.
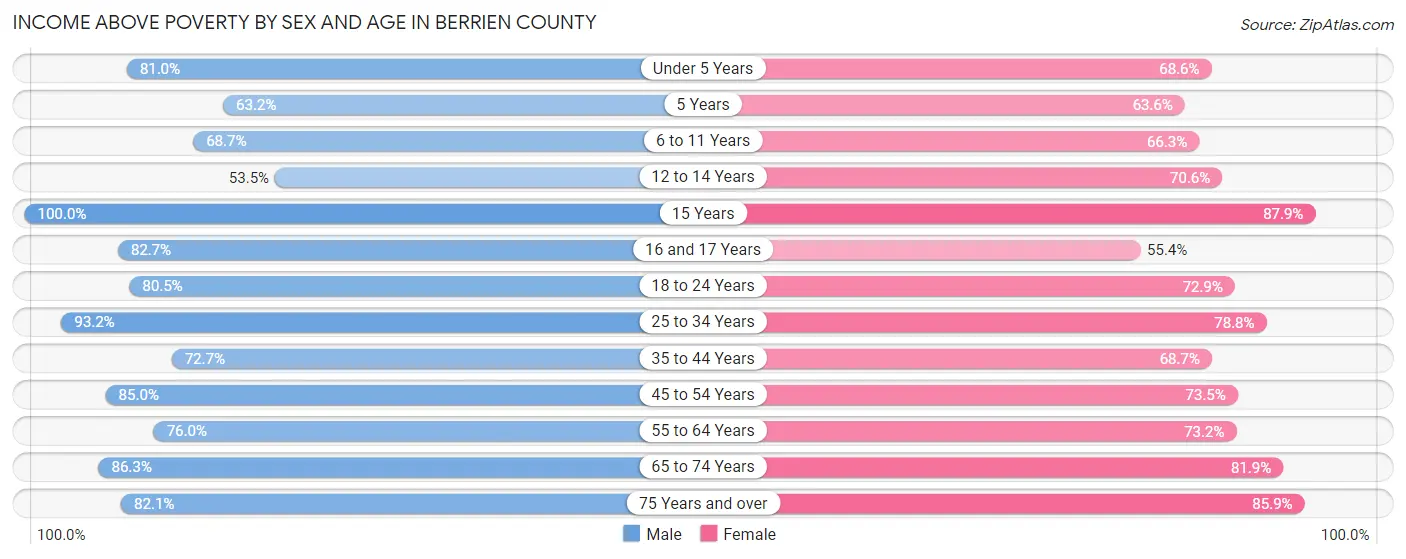
| Age Bracket | Male | Female |
| Under 5 Years | 465 (81.0%) | 380 (68.6%) |
| 5 Years | 24 (63.2%) | 49 (63.6%) |
| 6 to 11 Years | 610 (68.7%) | 490 (66.3%) |
| 12 to 14 Years | 174 (53.5%) | 204 (70.6%) |
| 15 Years | 89 (100.0%) | 152 (87.9%) |
| 16 and 17 Years | 215 (82.7%) | 170 (55.4%) |
| 18 to 24 Years | 567 (80.5%) | 493 (72.9%) |
| 25 to 34 Years | 1,021 (93.2%) | 829 (78.8%) |
| 35 to 44 Years | 870 (72.7%) | 736 (68.7%) |
| 45 to 54 Years | 943 (85.0%) | 919 (73.5%) |
| 55 to 64 Years | 866 (76.0%) | 888 (73.2%) |
| 65 to 74 Years | 798 (86.3%) | 783 (81.9%) |
| 75 Years and over | 453 (82.1%) | 601 (85.9%) |
| Total | 7,095 (79.7%) | 6,694 (73.9%) |
Income Below Poverty Among Married-Couple Families in Berrien County
The poverty statistics for married-couple families in Berrien County show that 14.9% or 515 of the total 3,445 families live below the poverty line. Families with 5 or more children have the highest poverty rate of 60.0%, comprising of 6 families. On the other hand, families with no children have the lowest poverty rate of 9.9%, which includes 204 families.

| Children | Above Poverty | Below Poverty |
| No Children | 1,865 (90.1%) | 204 (9.9%) |
| 1 or 2 Children | 853 (81.2%) | 198 (18.8%) |
| 3 or 4 Children | 208 (66.0%) | 107 (34.0%) |
| 5 or more Children | 4 (40.0%) | 6 (60.0%) |
| Total | 2,930 (85.1%) | 515 (14.9%) |
Income Below Poverty Among Single-Parent Households in Berrien County

| Children | Single Father | Single Mother |
| No Children | 0 (0.0%) | 133 (28.2%) |
| 1 or 2 Children | 0 (0.0%) | 160 (34.7%) |
| 3 or 4 Children | 0 (0.0%) | 83 (69.8%) |
| 5 or more Children | 0 (0.0%) | 9 (100.0%) |
| Total | 0 (0.0%) | 385 (36.3%) |
Income Below Poverty Among Married-Couple vs Single-Parent Households in Berrien County
The poverty data for Berrien County shows that 515 of the married-couple family households (14.9%) and 385 of the single-parent households (30.4%) are living below the poverty level. Within the married-couple family households, those with 5 or more children have the highest poverty rate, with 6 households (60.0%) falling below the poverty line. Among the single-parent households, those with 5 or more children have the highest poverty rate, with 9 household (100.0%) living below poverty.
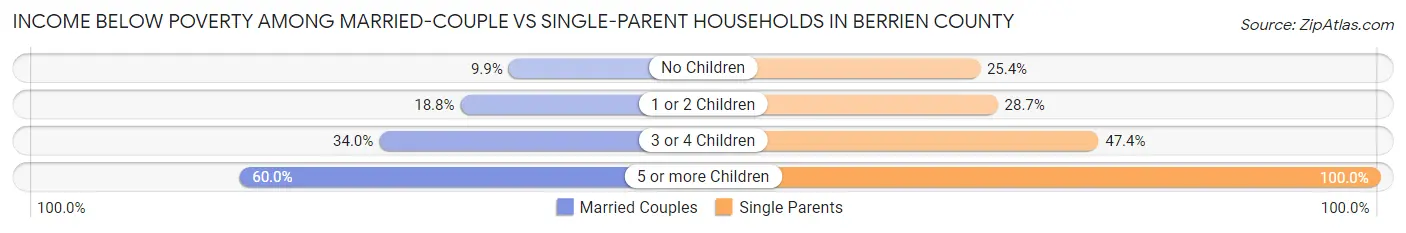
| Children | Married-Couple Families | Single-Parent Households |
| No Children | 204 (9.9%) | 133 (25.4%) |
| 1 or 2 Children | 198 (18.8%) | 160 (28.7%) |
| 3 or 4 Children | 107 (34.0%) | 83 (47.4%) |
| 5 or more Children | 6 (60.0%) | 9 (100.0%) |
| Total | 515 (14.9%) | 385 (30.4%) |
Employment Characteristics in Berrien County
Employment by Class of Employer in Berrien County
Among the 7,206 employed individuals in Berrien County, private company employees (4,414 | 61.3%), local government employees (872 | 12.1%), and self-employed (not incorporated) (566 | 7.9%) make up the most common classes of employment.

| Employer Class | # Employees | % Employees |
| Private Company Employees | 4,414 | 61.3% |
| Self-Employed (Incorporated) | 234 | 3.3% |
| Self-Employed (Not Incorporated) | 566 | 7.9% |
| Not-for-profit Organizations | 355 | 4.9% |
| Local Government Employees | 872 | 12.1% |
| State Government Employees | 455 | 6.3% |
| Federal Government Employees | 289 | 4.0% |
| Unpaid Family Workers | 21 | 0.3% |
| Total | 7,206 | 100.0% |
Employment Status by Age in Berrien County
According to the labor force statistics for Berrien County, out of the total population over 16 years of age (14,392), 53.4% or 7,685 individuals are in the labor force, with 4.6% or 354 of them unemployed. The age group with the highest labor force participation rate is 25 to 29 years, with 84.4% or 997 individuals in the labor force. Within the labor force, the 55 to 59 years age range has the highest percentage of unemployed individuals, with 10.9% or 66 of them being unemployed.
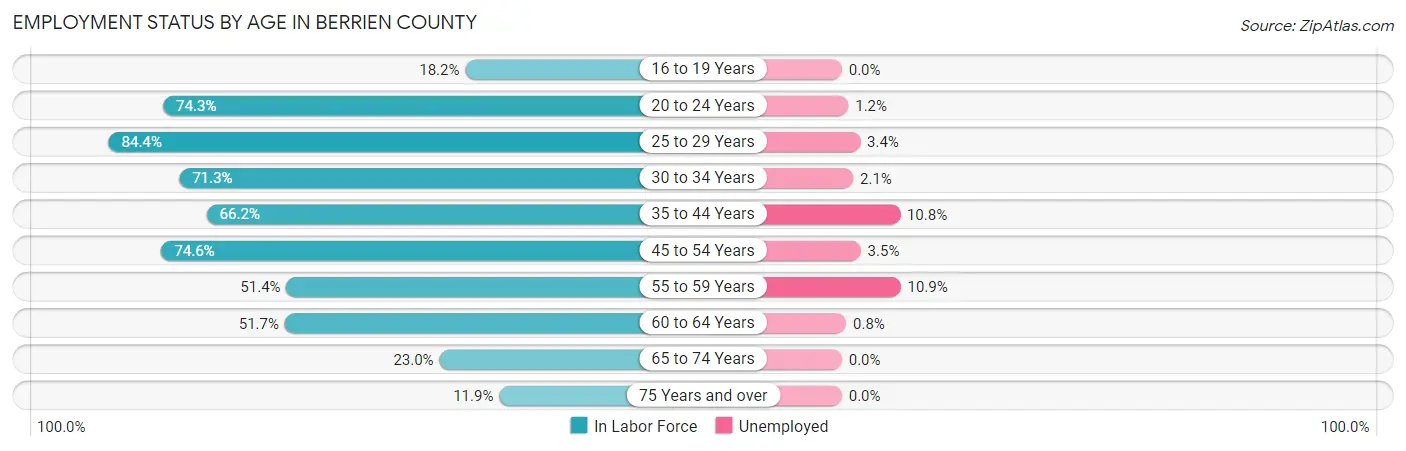
| Age Bracket | In Labor Force | Unemployed |
| 16 to 19 Years | 190 (18.2%) | 0 (0.0%) |
| 20 to 24 Years | 680 (74.3%) | 8 (1.2%) |
| 25 to 29 Years | 997 (84.4%) | 34 (3.4%) |
| 30 to 34 Years | 708 (71.3%) | 15 (2.1%) |
| 35 to 44 Years | 1,525 (66.2%) | 165 (10.8%) |
| 45 to 54 Years | 1,768 (74.6%) | 62 (3.5%) |
| 55 to 59 Years | 607 (51.4%) | 66 (10.9%) |
| 60 to 64 Years | 613 (51.7%) | 5 (0.8%) |
| 65 to 74 Years | 442 (23.0%) | 0 (0.0%) |
| 75 Years and over | 155 (11.9%) | 0 (0.0%) |
| Total | 7,685 (53.4%) | 354 (4.6%) |
Employment Status by Educational Attainment in Berrien County
According to labor force statistics for Berrien County, 67.5% of individuals (6,219) out of the total population between 25 and 64 years of age (9,214) are in the labor force, with 5.6% or 348 of them being unemployed. The group with the highest labor force participation rate are those with the educational attainment of bachelor's degree or higher, with 81.0% or 1,192 individuals in the labor force. Within the labor force, individuals with less than high school education have the highest percentage of unemployment, with 16.6% or 133 of them being unemployed.
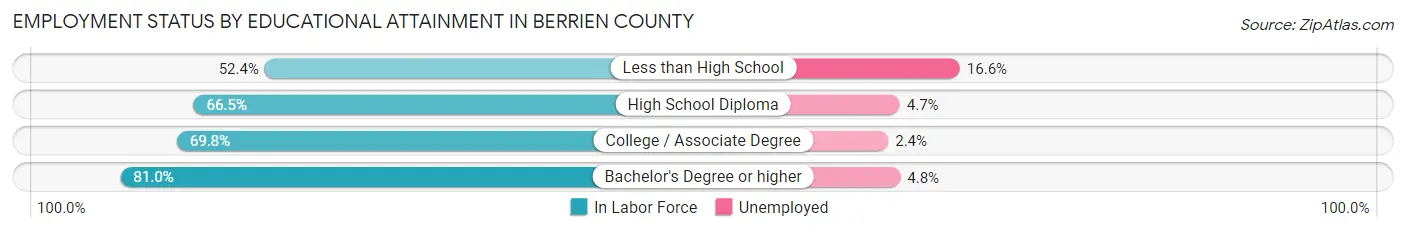
| Educational Attainment | In Labor Force | Unemployed |
| Less than High School | 801 (52.4%) | 254 (16.6%) |
| High School Diploma | 2,286 (66.5%) | 162 (4.7%) |
| College / Associate Degree | 1,938 (69.8%) | 67 (2.4%) |
| Bachelor's Degree or higher | 1,192 (81.0%) | 71 (4.8%) |
| Total | 6,219 (67.5%) | 516 (5.6%) |
Employment Occupations by Sex in Berrien County
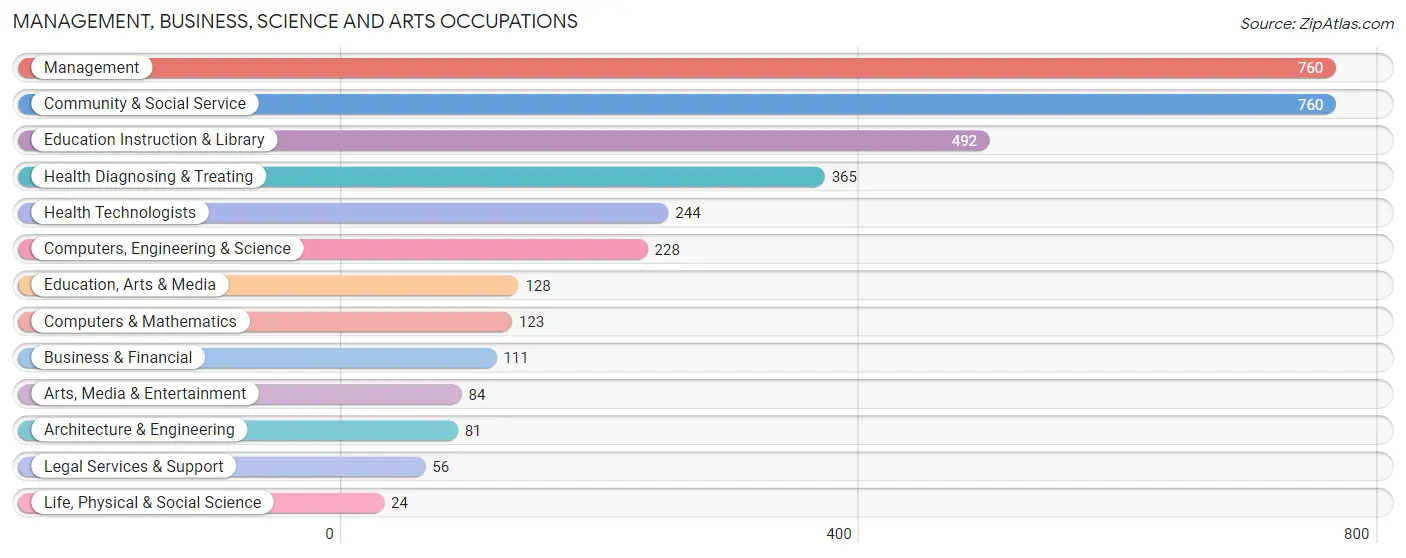
Management, Business, Science and Arts Occupations
The most common Management, Business, Science and Arts occupations in Berrien County are Management (760 | 10.5%), Community & Social Service (760 | 10.5%), Education Instruction & Library (492 | 6.8%), Health Diagnosing & Treating (365 | 5.0%), and Health Technologists (244 | 3.4%).
Management, Business, Science and Arts Occupations by Sex
Within the Management, Business, Science and Arts occupations in Berrien County, the most male-oriented occupations are Architecture & Engineering (100.0%), Life, Physical & Social Science (100.0%), and Computers, Engineering & Science (99.1%), while the most female-oriented occupations are Health Technologists (89.3%), Health Diagnosing & Treating (87.4%), and Education Instruction & Library (80.5%).

| Occupation | Male | Female |
| Management | 556 (73.2%) | 204 (26.8%) |
| Business & Financial | 26 (23.4%) | 85 (76.6%) |
| Computers, Engineering & Science | 226 (99.1%) | 2 (0.9%) |
| Computers & Mathematics | 121 (98.4%) | 2 (1.6%) |
| Architecture & Engineering | 81 (100.0%) | 0 (0.0%) |
| Life, Physical & Social Science | 24 (100.0%) | 0 (0.0%) |
| Community & Social Service | 271 (35.7%) | 489 (64.3%) |
| Education, Arts & Media | 82 (64.1%) | 46 (35.9%) |
| Legal Services & Support | 32 (57.1%) | 24 (42.9%) |
| Education Instruction & Library | 96 (19.5%) | 396 (80.5%) |
| Arts, Media & Entertainment | 61 (72.6%) | 23 (27.4%) |
| Health Diagnosing & Treating | 46 (12.6%) | 319 (87.4%) |
| Health Technologists | 26 (10.7%) | 218 (89.3%) |
| Total (Category) | 1,125 (50.6%) | 1,099 (49.4%) |
| Total (Overall) | 4,045 (55.7%) | 3,212 (44.3%) |
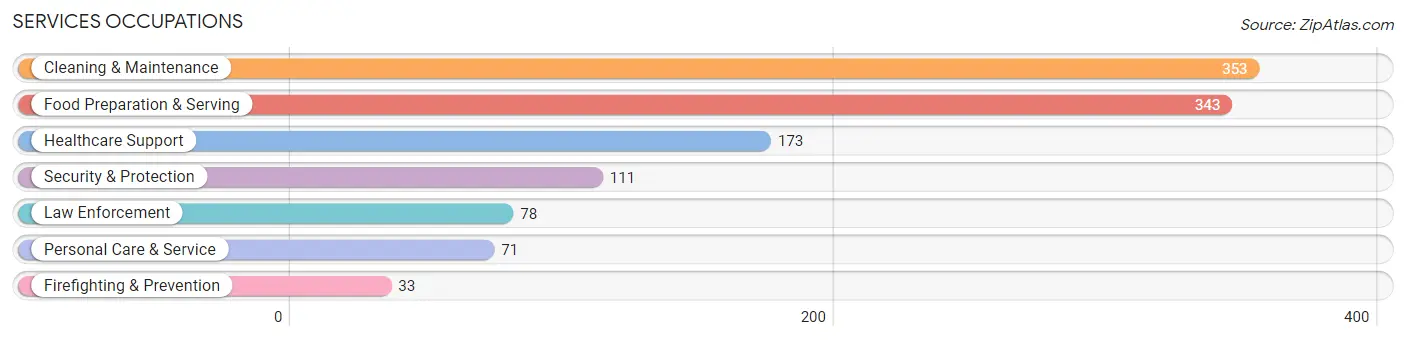
Services Occupations
The most common Services occupations in Berrien County are Cleaning & Maintenance (353 | 4.9%), Food Preparation & Serving (343 | 4.7%), Healthcare Support (173 | 2.4%), Security & Protection (111 | 1.5%), and Law Enforcement (78 | 1.1%).
Services Occupations by Sex
Within the Services occupations in Berrien County, the most male-oriented occupations are Law Enforcement (88.5%), Security & Protection (81.1%), and Firefighting & Prevention (63.6%), while the most female-oriented occupations are Personal Care & Service (100.0%), Healthcare Support (84.4%), and Food Preparation & Serving (55.4%).
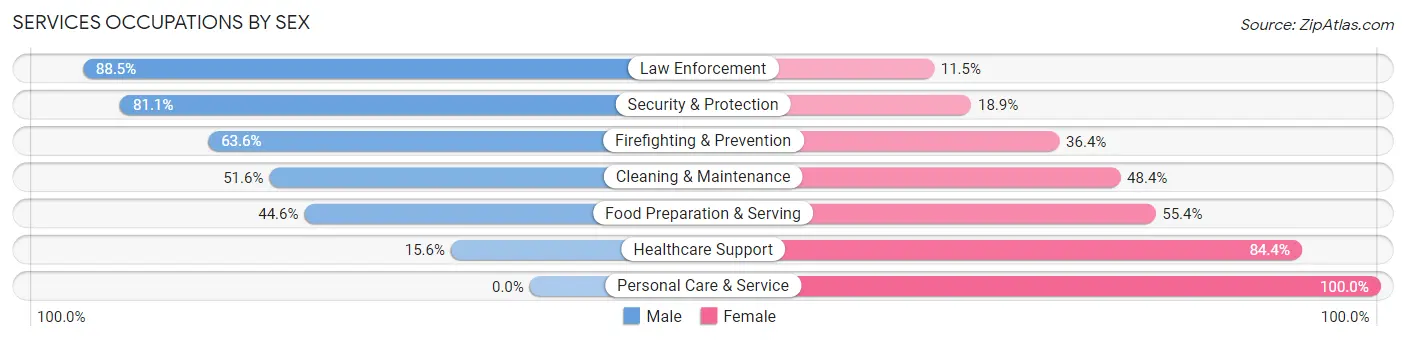
| Occupation | Male | Female |
| Healthcare Support | 27 (15.6%) | 146 (84.4%) |
| Security & Protection | 90 (81.1%) | 21 (18.9%) |
| Firefighting & Prevention | 21 (63.6%) | 12 (36.4%) |
| Law Enforcement | 69 (88.5%) | 9 (11.5%) |
| Food Preparation & Serving | 153 (44.6%) | 190 (55.4%) |
| Cleaning & Maintenance | 182 (51.6%) | 171 (48.4%) |
| Personal Care & Service | 0 (0.0%) | 71 (100.0%) |
| Total (Category) | 452 (43.0%) | 599 (57.0%) |
| Total (Overall) | 4,045 (55.7%) | 3,212 (44.3%) |
Sales and Office Occupations
The most common Sales and Office occupations in Berrien County are Office & Administration (835 | 11.5%), and Sales & Related (453 | 6.2%).

Sales and Office Occupations by Sex
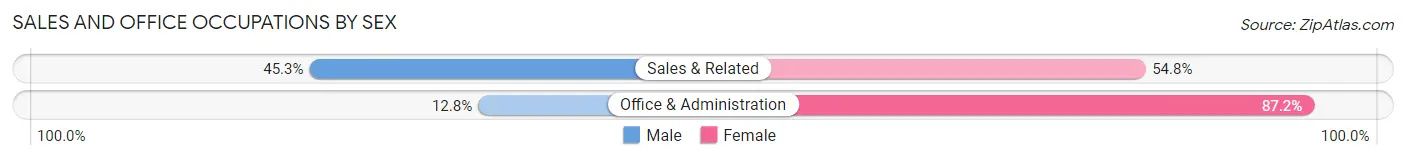
| Occupation | Male | Female |
| Sales & Related | 205 (45.3%) | 248 (54.7%) |
| Office & Administration | 107 (12.8%) | 728 (87.2%) |
| Total (Category) | 312 (24.2%) | 976 (75.8%) |
| Total (Overall) | 4,045 (55.7%) | 3,212 (44.3%) |
Natural Resources, Construction and Maintenance Occupations
The most common Natural Resources, Construction and Maintenance occupations in Berrien County are Construction & Extraction (582 | 8.0%), Installation, Maintenance & Repair (461 | 6.4%), and Farming, Fishing & Forestry (88 | 1.2%).

Natural Resources, Construction and Maintenance Occupations by Sex
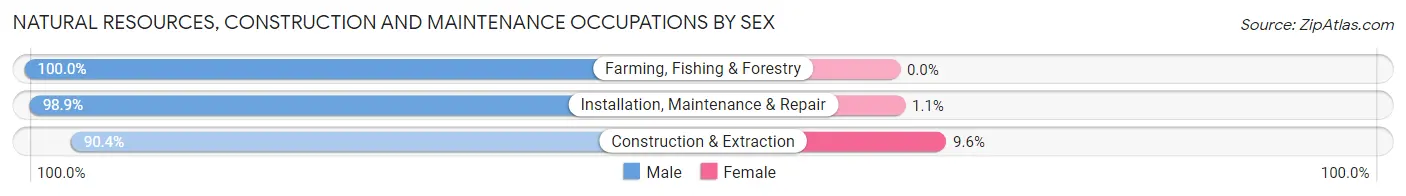
| Occupation | Male | Female |
| Farming, Fishing & Forestry | 88 (100.0%) | 0 (0.0%) |
| Construction & Extraction | 526 (90.4%) | 56 (9.6%) |
| Installation, Maintenance & Repair | 456 (98.9%) | 5 (1.1%) |
| Total (Category) | 1,070 (94.6%) | 61 (5.4%) |
| Total (Overall) | 4,045 (55.7%) | 3,212 (44.3%) |
Production, Transportation and Moving Occupations
The most common Production, Transportation and Moving occupations in Berrien County are Production (880 | 12.1%), Transportation (458 | 6.3%), and Material Moving (225 | 3.1%).
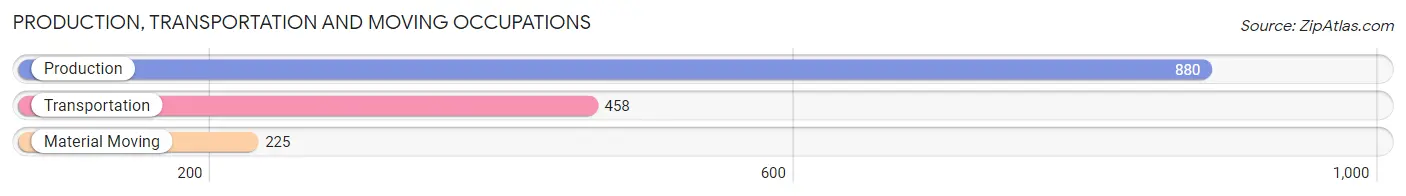
Production, Transportation and Moving Occupations by Sex
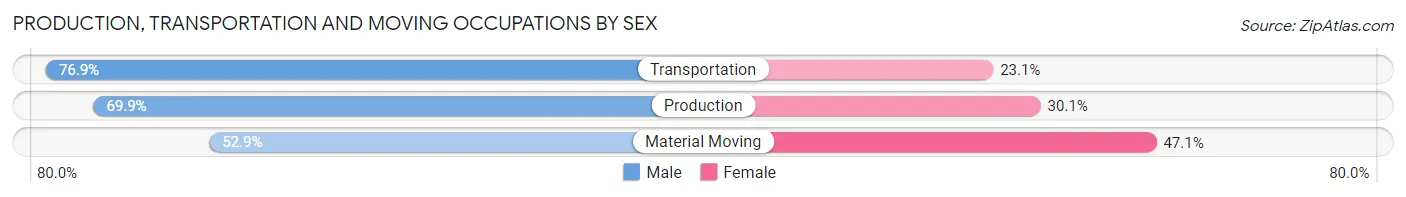
| Occupation | Male | Female |
| Production | 615 (69.9%) | 265 (30.1%) |
| Transportation | 352 (76.9%) | 106 (23.1%) |
| Material Moving | 119 (52.9%) | 106 (47.1%) |
| Total (Category) | 1,086 (69.5%) | 477 (30.5%) |
| Total (Overall) | 4,045 (55.7%) | 3,212 (44.3%) |
Employment Industries by Sex in Berrien County
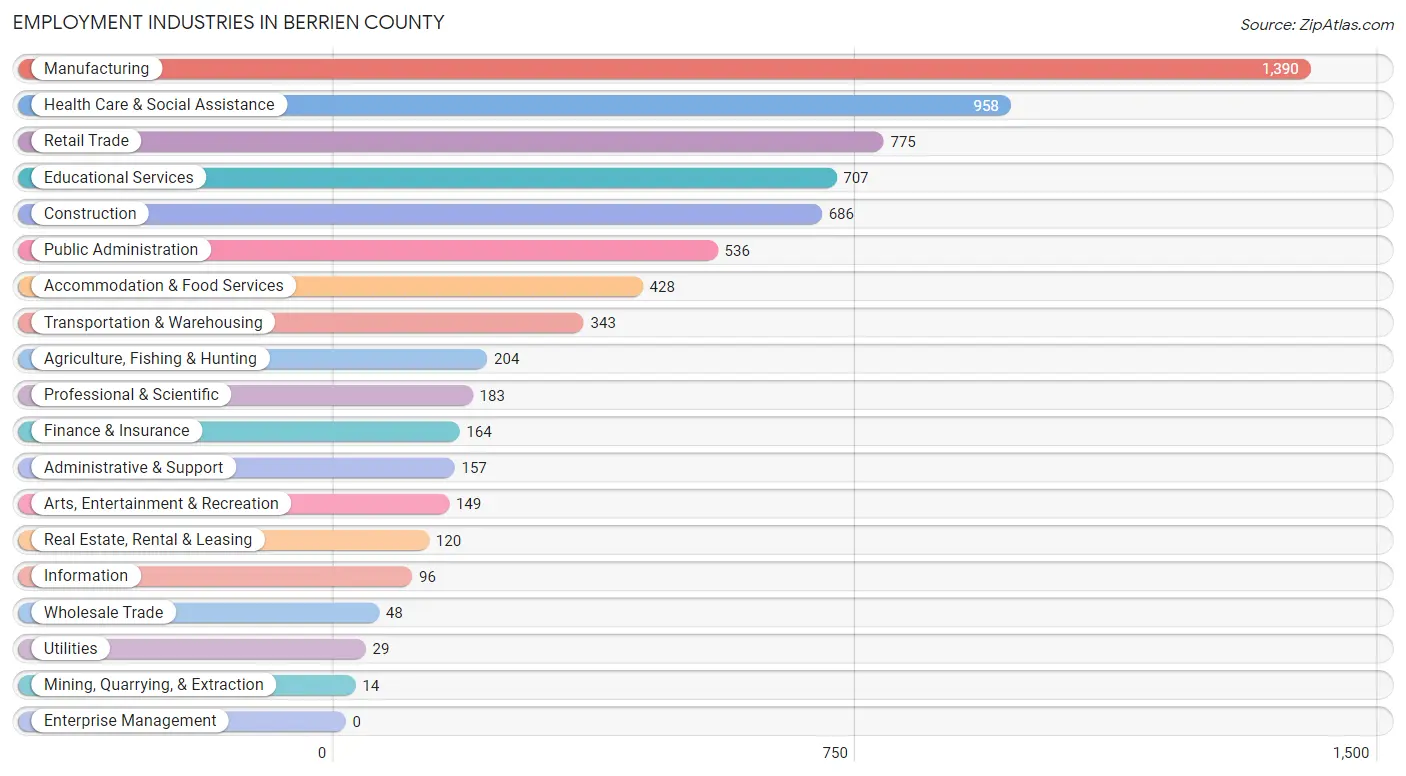
Employment Industries in Berrien County
The major employment industries in Berrien County include Manufacturing (1,390 | 19.2%), Health Care & Social Assistance (958 | 13.2%), Retail Trade (775 | 10.7%), Educational Services (707 | 9.7%), and Construction (686 | 9.5%).
Employment Industries by Sex in Berrien County
The Berrien County industries that see more men than women are Agriculture, Fishing & Hunting (100.0%), Mining, Quarrying, & Extraction (100.0%), and Wholesale Trade (100.0%), whereas the industries that tend to have a higher number of women are Finance & Insurance (83.5%), Real Estate, Rental & Leasing (80.0%), and Health Care & Social Assistance (77.1%).

| Industry | Male | Female |
| Agriculture, Fishing & Hunting | 204 (100.0%) | 0 (0.0%) |
| Mining, Quarrying, & Extraction | 14 (100.0%) | 0 (0.0%) |
| Construction | 618 (90.1%) | 68 (9.9%) |
| Manufacturing | 954 (68.6%) | 436 (31.4%) |
| Wholesale Trade | 48 (100.0%) | 0 (0.0%) |
| Retail Trade | 241 (31.1%) | 534 (68.9%) |
| Transportation & Warehousing | 266 (77.5%) | 77 (22.5%) |
| Utilities | 11 (37.9%) | 18 (62.1%) |
| Information | 90 (93.8%) | 6 (6.2%) |
| Finance & Insurance | 27 (16.5%) | 137 (83.5%) |
| Real Estate, Rental & Leasing | 24 (20.0%) | 96 (80.0%) |
| Professional & Scientific | 127 (69.4%) | 56 (30.6%) |
| Enterprise Management | 0 (0.0%) | 0 (0.0%) |
| Administrative & Support | 116 (73.9%) | 41 (26.1%) |
| Educational Services | 275 (38.9%) | 432 (61.1%) |
| Health Care & Social Assistance | 219 (22.9%) | 739 (77.1%) |
| Arts, Entertainment & Recreation | 140 (94.0%) | 9 (6.0%) |
| Accommodation & Food Services | 191 (44.6%) | 237 (55.4%) |
| Public Administration | 255 (47.6%) | 281 (52.4%) |
| Total | 4,045 (55.7%) | 3,212 (44.3%) |
Education in Berrien County
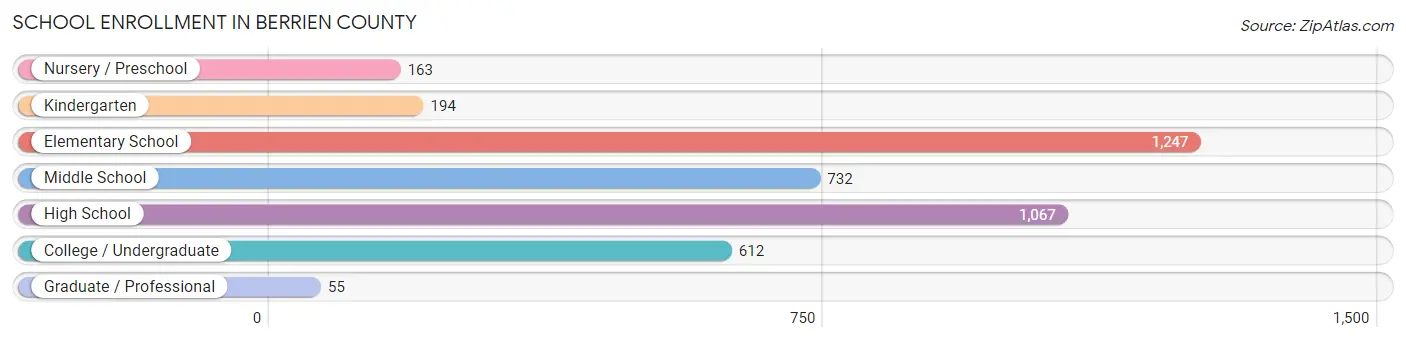
School Enrollment in Berrien County
The most common levels of schooling among the 4,070 students in Berrien County are elementary school (1,247 | 30.6%), high school (1,067 | 26.2%), and middle school (732 | 18.0%).
| School Level | # Students | % Students |
| Nursery / Preschool | 163 | 4.0% |
| Kindergarten | 194 | 4.8% |
| Elementary School | 1,247 | 30.6% |
| Middle School | 732 | 18.0% |
| High School | 1,067 | 26.2% |
| College / Undergraduate | 612 | 15.0% |
| Graduate / Professional | 55 | 1.3% |
| Total | 4,070 | 100.0% |
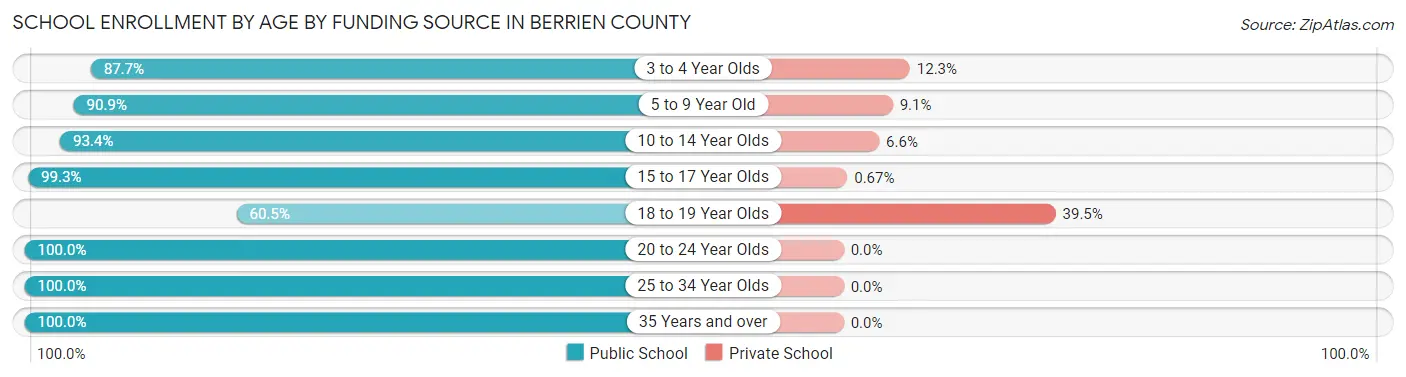
School Enrollment by Age by Funding Source in Berrien County
Out of a total of 4,070 students who are enrolled in schools in Berrien County, 317 (7.8%) attend a private institution, while the remaining 3,753 (92.2%) are enrolled in public schools. The age group of 18 to 19 year olds has the highest likelihood of being enrolled in private schools, with 107 (39.5% in the age bracket) enrolled. Conversely, the age group of 20 to 24 year olds has the lowest likelihood of being enrolled in a private school, with 200 (100.0% in the age bracket) attending a public institution.
| Age Bracket | Public School | Private School |
| 3 to 4 Year Olds | 128 (87.7%) | 18 (12.3%) |
| 5 to 9 Year Old | 1,184 (90.9%) | 119 (9.1%) |
| 10 to 14 Year Olds | 975 (93.4%) | 69 (6.6%) |
| 15 to 17 Year Olds | 742 (99.3%) | 5 (0.7%) |
| 18 to 19 Year Olds | 164 (60.5%) | 107 (39.5%) |
| 20 to 24 Year Olds | 200 (100.0%) | 0 (0.0%) |
| 25 to 34 Year Olds | 192 (100.0%) | 0 (0.0%) |
| 35 Years and over | 167 (100.0%) | 0 (0.0%) |
| Total | 3,753 (92.2%) | 317 (7.8%) |
Educational Attainment by Field of Study in Berrien County
Education (499 | 26.0%), business (413 | 21.5%), science & technology (243 | 12.7%), bio, nature & agricultural (141 | 7.3%), and arts & humanities (110 | 5.7%) are the most common fields of study among 1,921 individuals in Berrien County who have obtained a bachelor's degree or higher.
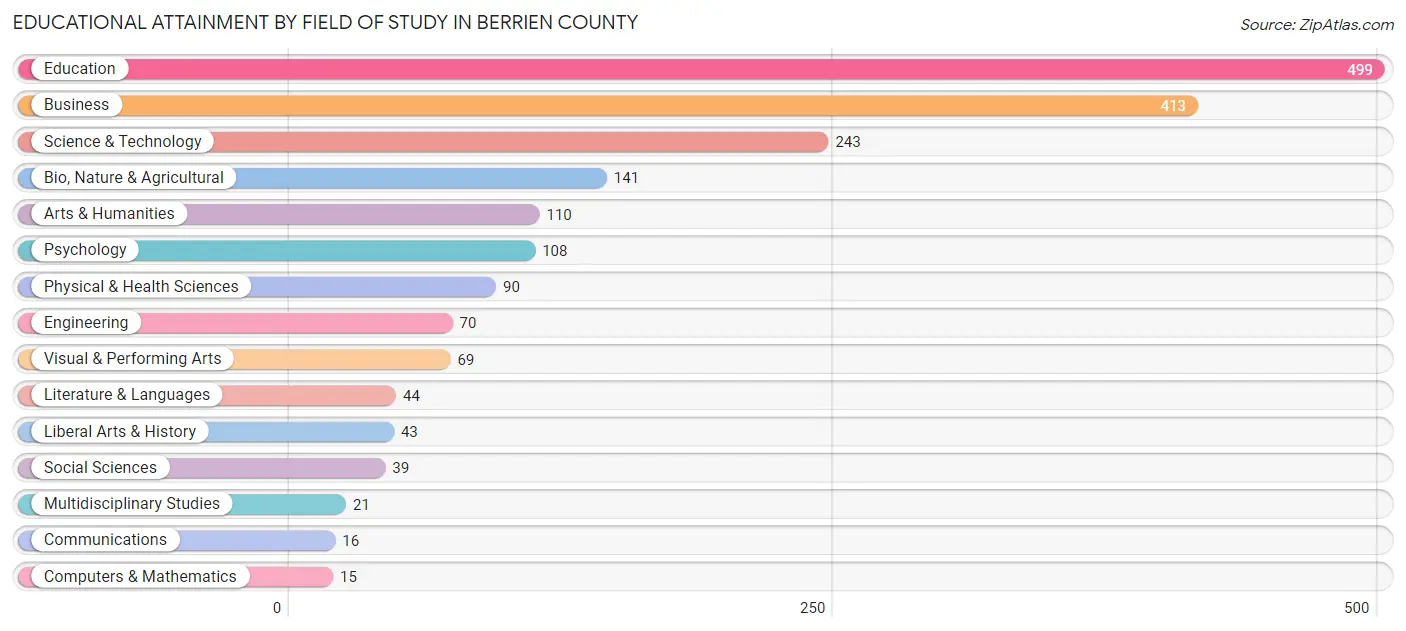
| Field of Study | # Graduates | % Graduates |
| Computers & Mathematics | 15 | 0.8% |
| Bio, Nature & Agricultural | 141 | 7.3% |
| Physical & Health Sciences | 90 | 4.7% |
| Psychology | 108 | 5.6% |
| Social Sciences | 39 | 2.0% |
| Engineering | 70 | 3.6% |
| Multidisciplinary Studies | 21 | 1.1% |
| Science & Technology | 243 | 12.7% |
| Business | 413 | 21.5% |
| Education | 499 | 26.0% |
| Literature & Languages | 44 | 2.3% |
| Liberal Arts & History | 43 | 2.2% |
| Visual & Performing Arts | 69 | 3.6% |
| Communications | 16 | 0.8% |
| Arts & Humanities | 110 | 5.7% |
| Total | 1,921 | 100.0% |
Transportation & Commute in Berrien County
Vehicle Availability by Sex in Berrien County
The most prevalent vehicle ownership categories in Berrien County are males with 2 vehicles (1,830, accounting for 45.1%) and females with 2 vehicles (1,464, making up 58.1%).

| Vehicles Available | Male | Female |
| No Vehicle | 30 (0.7%) | 9 (0.3%) |
| 1 Vehicle | 806 (19.9%) | 742 (23.5%) |
| 2 Vehicles | 1,830 (45.1%) | 1,464 (46.5%) |
| 3 Vehicles | 1,105 (27.3%) | 755 (24.0%) |
| 4 Vehicles | 210 (5.2%) | 95 (3.0%) |
| 5 or more Vehicles | 74 (1.8%) | 86 (2.7%) |
| Total | 4,055 (100.0%) | 3,151 (100.0%) |
Commute Time in Berrien County
The most frequently occuring commute durations in Berrien County are 15 to 19 minutes (1,135 commuters, 16.5%), 20 to 24 minutes (1,100 commuters, 16.0%), and 10 to 14 minutes (869 commuters, 12.6%).

| Commute Time | # Commuters | % Commuters |
| Less than 5 Minutes | 573 | 8.3% |
| 5 to 9 Minutes | 634 | 9.2% |
| 10 to 14 Minutes | 869 | 12.6% |
| 15 to 19 Minutes | 1,135 | 16.5% |
| 20 to 24 Minutes | 1,100 | 16.0% |
| 25 to 29 Minutes | 654 | 9.5% |
| 30 to 34 Minutes | 861 | 12.5% |
| 35 to 39 Minutes | 189 | 2.8% |
| 40 to 44 Minutes | 231 | 3.4% |
| 45 to 59 Minutes | 297 | 4.3% |
| 60 to 89 Minutes | 142 | 2.1% |
| 90 or more Minutes | 189 | 2.8% |
Commute Time by Sex in Berrien County
The most common commute times in Berrien County are 20 to 24 minutes (637 commuters, 16.3%) for males and 15 to 19 minutes (575 commuters, 19.4%) for females.
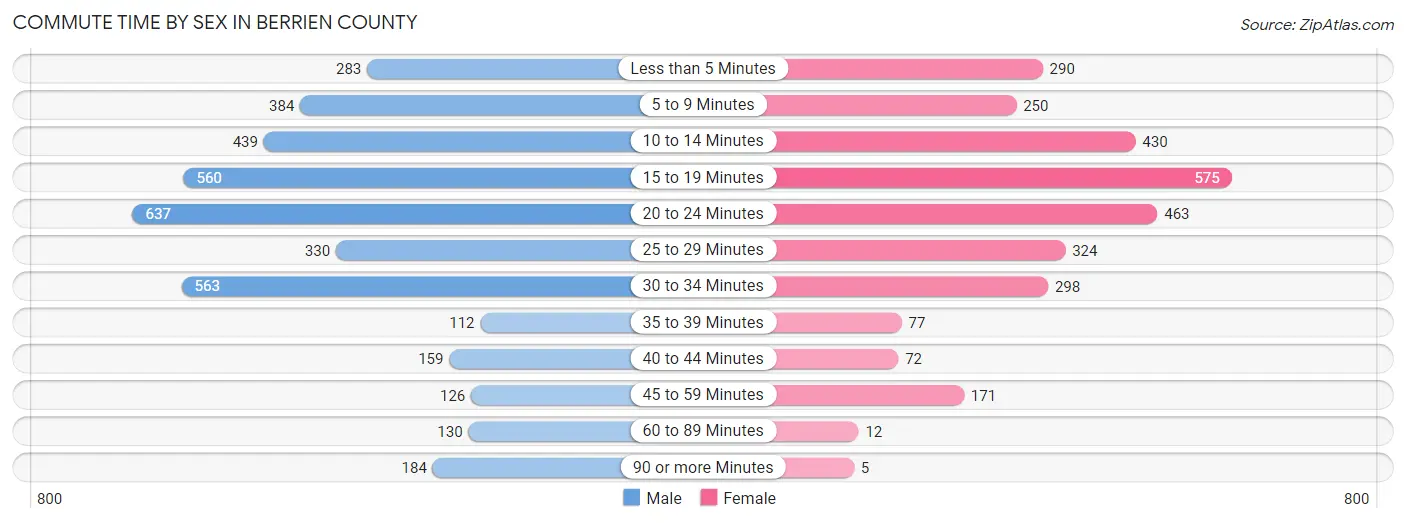
| Commute Time | Male | Female |
| Less than 5 Minutes | 283 (7.2%) | 290 (9.8%) |
| 5 to 9 Minutes | 384 (9.8%) | 250 (8.4%) |
| 10 to 14 Minutes | 439 (11.2%) | 430 (14.5%) |
| 15 to 19 Minutes | 560 (14.3%) | 575 (19.4%) |
| 20 to 24 Minutes | 637 (16.3%) | 463 (15.6%) |
| 25 to 29 Minutes | 330 (8.5%) | 324 (10.9%) |
| 30 to 34 Minutes | 563 (14.4%) | 298 (10.0%) |
| 35 to 39 Minutes | 112 (2.9%) | 77 (2.6%) |
| 40 to 44 Minutes | 159 (4.1%) | 72 (2.4%) |
| 45 to 59 Minutes | 126 (3.2%) | 171 (5.8%) |
| 60 to 89 Minutes | 130 (3.3%) | 12 (0.4%) |
| 90 or more Minutes | 184 (4.7%) | 5 (0.2%) |
Time of Departure to Work by Sex in Berrien County
The most frequent times of departure to work in Berrien County are 7:00 AM to 7:29 AM (993, 25.4%) for males and 7:00 AM to 7:29 AM (572, 19.3%) for females.

| Time of Departure | Male | Female |
| 12:00 AM to 4:59 AM | 207 (5.3%) | 147 (5.0%) |
| 5:00 AM to 5:29 AM | 48 (1.2%) | 87 (2.9%) |
| 5:30 AM to 5:59 AM | 324 (8.3%) | 99 (3.3%) |
| 6:00 AM to 6:29 AM | 587 (15.0%) | 138 (4.6%) |
| 6:30 AM to 6:59 AM | 564 (14.4%) | 335 (11.3%) |
| 7:00 AM to 7:29 AM | 993 (25.4%) | 572 (19.3%) |
| 7:30 AM to 7:59 AM | 530 (13.6%) | 506 (17.1%) |
| 8:00 AM to 8:29 AM | 143 (3.7%) | 300 (10.1%) |
| 8:30 AM to 8:59 AM | 67 (1.7%) | 72 (2.4%) |
| 9:00 AM to 9:59 AM | 162 (4.2%) | 167 (5.6%) |
| 10:00 AM to 10:59 AM | 22 (0.6%) | 6 (0.2%) |
| 11:00 AM to 11:59 AM | 19 (0.5%) | 41 (1.4%) |
| 12:00 PM to 3:59 PM | 104 (2.7%) | 231 (7.8%) |
| 4:00 PM to 11:59 PM | 137 (3.5%) | 266 (9.0%) |
| Total | 3,907 (100.0%) | 2,967 (100.0%) |
Housing Occupancy in Berrien County
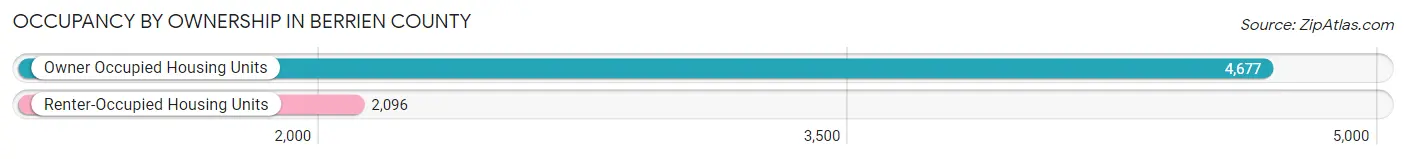
Occupancy by Ownership in Berrien County
Of the total 6,773 dwellings in Berrien County, owner-occupied units account for 4,677 (69.1%), while renter-occupied units make up 2,096 (30.9%).
| Occupancy | # Housing Units | % Housing Units |
| Owner Occupied Housing Units | 4,677 | 69.1% |
| Renter-Occupied Housing Units | 2,096 | 30.9% |
| Total Occupied Housing Units | 6,773 | 100.0% |
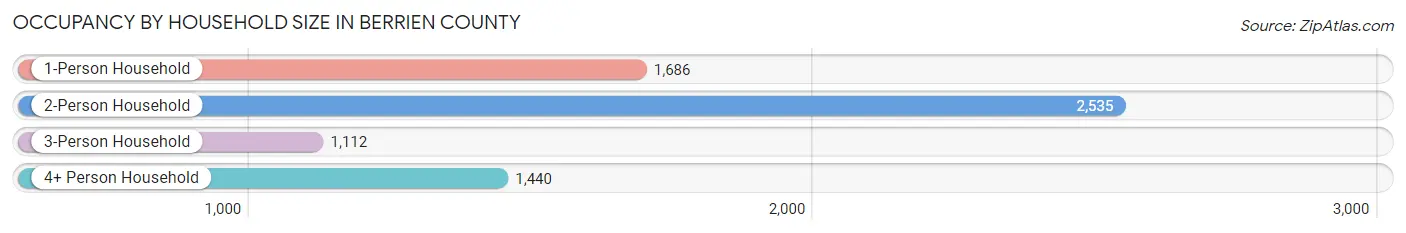
Occupancy by Household Size in Berrien County
| Household Size | # Housing Units | % Housing Units |
| 1-Person Household | 1,686 | 24.9% |
| 2-Person Household | 2,535 | 37.4% |
| 3-Person Household | 1,112 | 16.4% |
| 4+ Person Household | 1,440 | 21.3% |
| Total Housing Units | 6,773 | 100.0% |
Occupancy by Ownership by Household Size in Berrien County
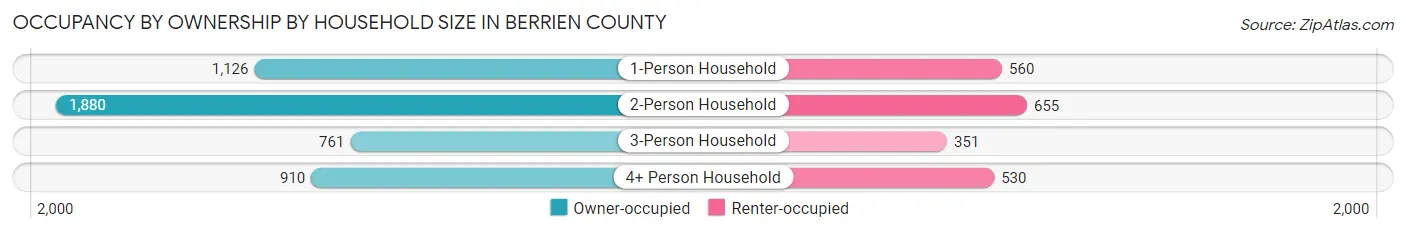
| Household Size | Owner-occupied | Renter-occupied |
| 1-Person Household | 1,126 (66.8%) | 560 (33.2%) |
| 2-Person Household | 1,880 (74.2%) | 655 (25.8%) |
| 3-Person Household | 761 (68.4%) | 351 (31.6%) |
| 4+ Person Household | 910 (63.2%) | 530 (36.8%) |
| Total Housing Units | 4,677 (69.1%) | 2,096 (30.9%) |
Occupancy by Educational Attainment in Berrien County
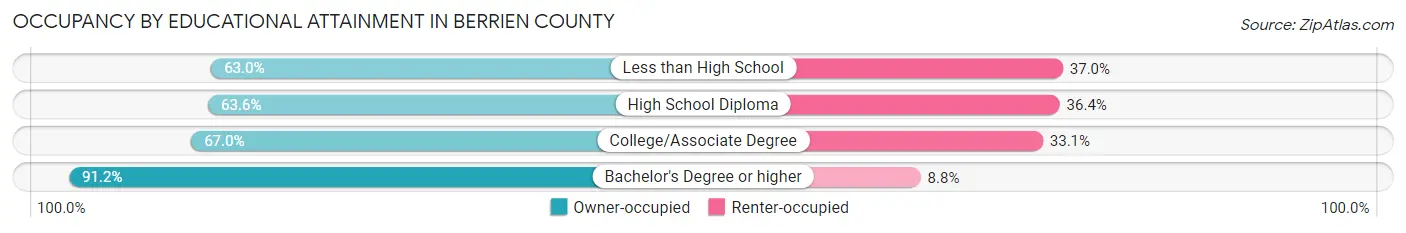
| Household Size | Owner-occupied | Renter-occupied |
| Less than High School | 880 (63.0%) | 517 (37.0%) |
| High School Diploma | 1,317 (63.6%) | 753 (36.4%) |
| College/Associate Degree | 1,477 (66.9%) | 729 (33.1%) |
| Bachelor's Degree or higher | 1,003 (91.2%) | 97 (8.8%) |
Occupancy by Age of Householder in Berrien County
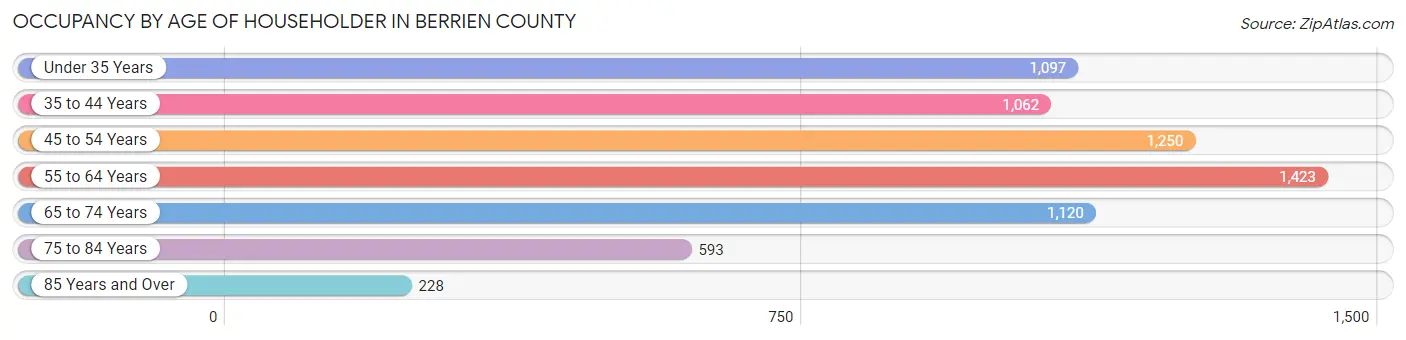
| Age Bracket | # Households | % Households |
| Under 35 Years | 1,097 | 16.2% |
| 35 to 44 Years | 1,062 | 15.7% |
| 45 to 54 Years | 1,250 | 18.5% |
| 55 to 64 Years | 1,423 | 21.0% |
| 65 to 74 Years | 1,120 | 16.5% |
| 75 to 84 Years | 593 | 8.8% |
| 85 Years and Over | 228 | 3.4% |
| Total | 6,773 | 100.0% |
Housing Finances in Berrien County
Median Income by Occupancy in Berrien County
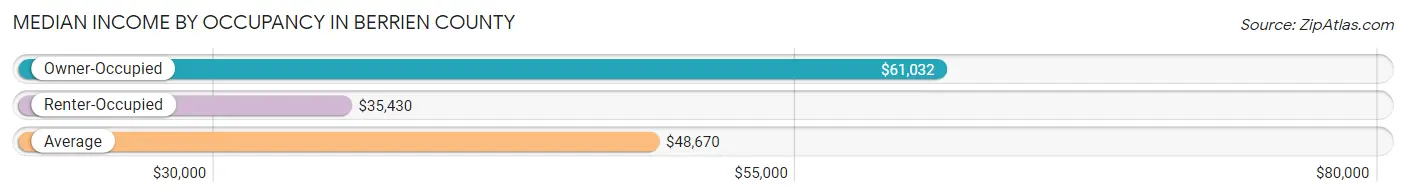
| Occupancy Type | # Households | Median Income |
| Owner-Occupied | 4,677 (69.1%) | $61,032 |
| Renter-Occupied | 2,096 (30.9%) | $35,430 |
| Average | 6,773 (100.0%) | $48,670 |
Occupancy by Householder Income Bracket in Berrien County
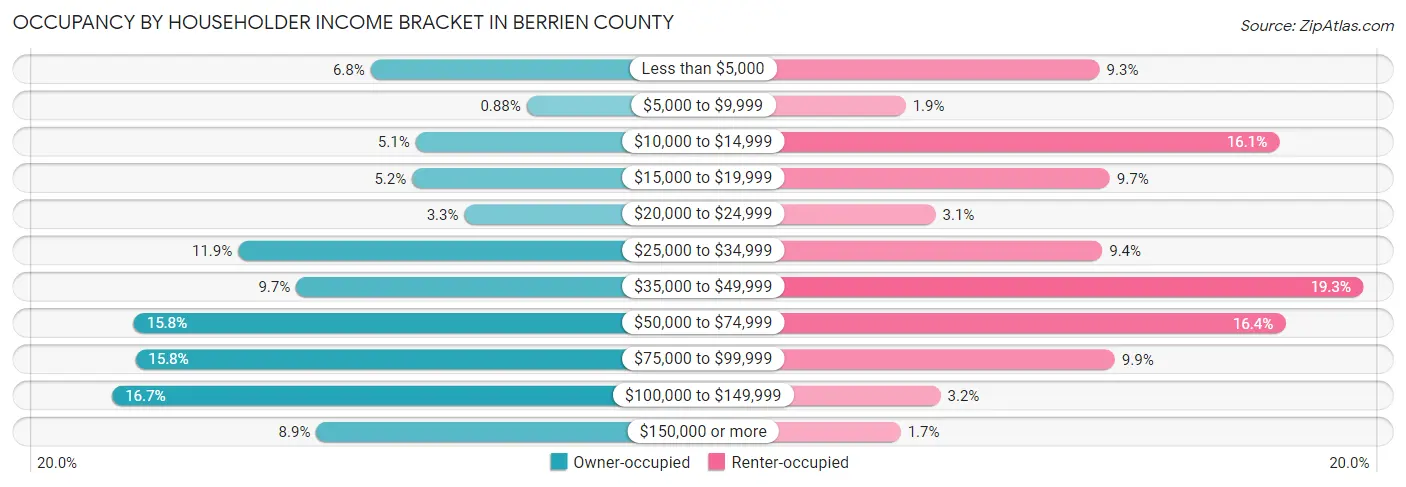
| Income Bracket | Owner-occupied | Renter-occupied |
| Less than $5,000 | 319 (6.8%) | 195 (9.3%) |
| $5,000 to $9,999 | 41 (0.9%) | 40 (1.9%) |
| $10,000 to $14,999 | 239 (5.1%) | 338 (16.1%) |
| $15,000 to $19,999 | 245 (5.2%) | 203 (9.7%) |
| $20,000 to $24,999 | 152 (3.3%) | 64 (3.0%) |
| $25,000 to $34,999 | 555 (11.9%) | 197 (9.4%) |
| $35,000 to $49,999 | 452 (9.7%) | 405 (19.3%) |
| $50,000 to $74,999 | 741 (15.8%) | 343 (16.4%) |
| $75,000 to $99,999 | 738 (15.8%) | 207 (9.9%) |
| $100,000 to $149,999 | 779 (16.7%) | 68 (3.2%) |
| $150,000 or more | 416 (8.9%) | 36 (1.7%) |
| Total | 4,677 (100.0%) | 2,096 (100.0%) |
Monthly Housing Cost Tiers in Berrien County
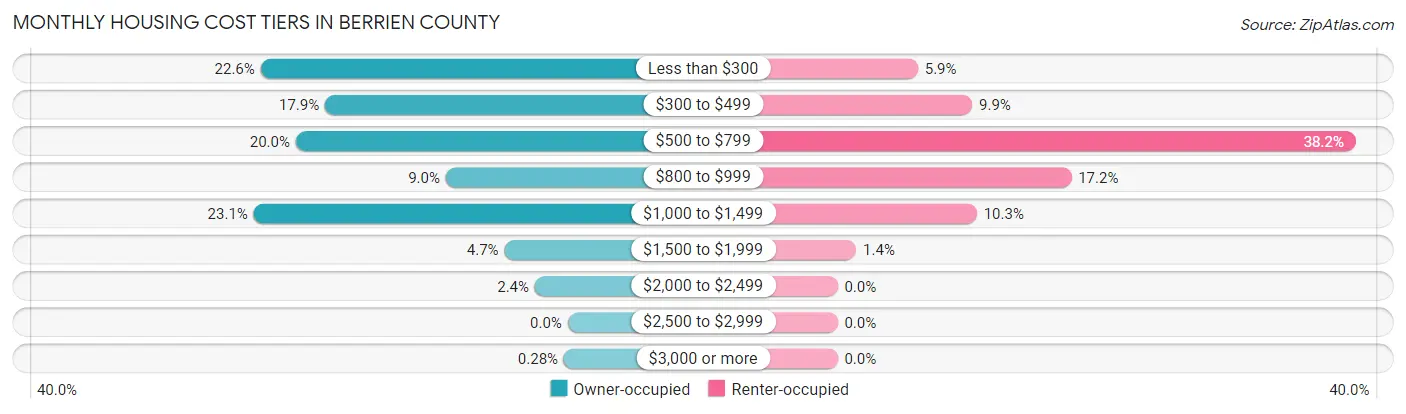
| Monthly Cost | Owner-occupied | Renter-occupied |
| Less than $300 | 1,058 (22.6%) | 124 (5.9%) |
| $300 to $499 | 836 (17.9%) | 208 (9.9%) |
| $500 to $799 | 937 (20.0%) | 800 (38.2%) |
| $800 to $999 | 420 (9.0%) | 361 (17.2%) |
| $1,000 to $1,499 | 1,082 (23.1%) | 215 (10.3%) |
| $1,500 to $1,999 | 218 (4.7%) | 29 (1.4%) |
| $2,000 to $2,499 | 113 (2.4%) | 0 (0.0%) |
| $2,500 to $2,999 | 0 (0.0%) | 0 (0.0%) |
| $3,000 or more | 13 (0.3%) | 0 (0.0%) |
| Total | 4,677 (100.0%) | 2,096 (100.0%) |
Physical Housing Characteristics in Berrien County
Housing Structures in Berrien County
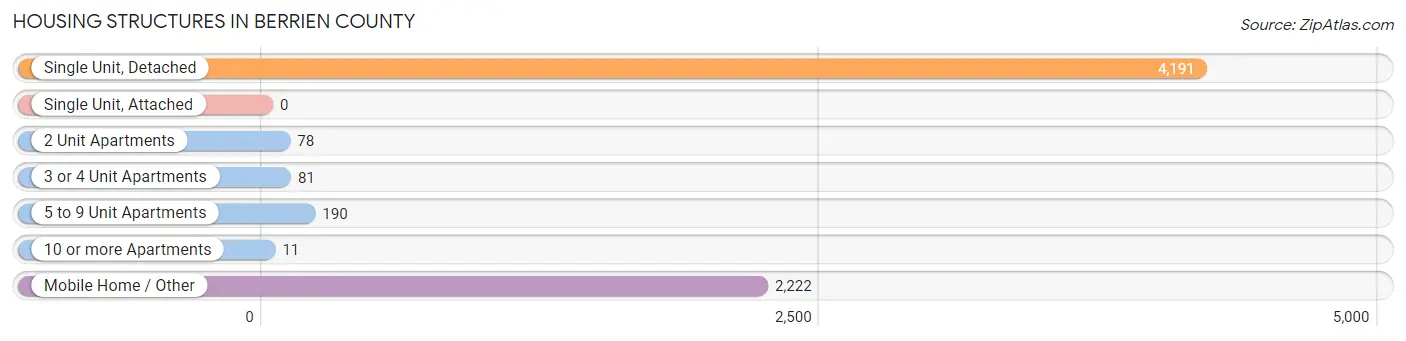
| Structure Type | # Housing Units | % Housing Units |
| Single Unit, Detached | 4,191 | 61.9% |
| Single Unit, Attached | 0 | 0.0% |
| 2 Unit Apartments | 78 | 1.1% |
| 3 or 4 Unit Apartments | 81 | 1.2% |
| 5 to 9 Unit Apartments | 190 | 2.8% |
| 10 or more Apartments | 11 | 0.2% |
| Mobile Home / Other | 2,222 | 32.8% |
| Total | 6,773 | 100.0% |
Housing Structures by Occupancy in Berrien County
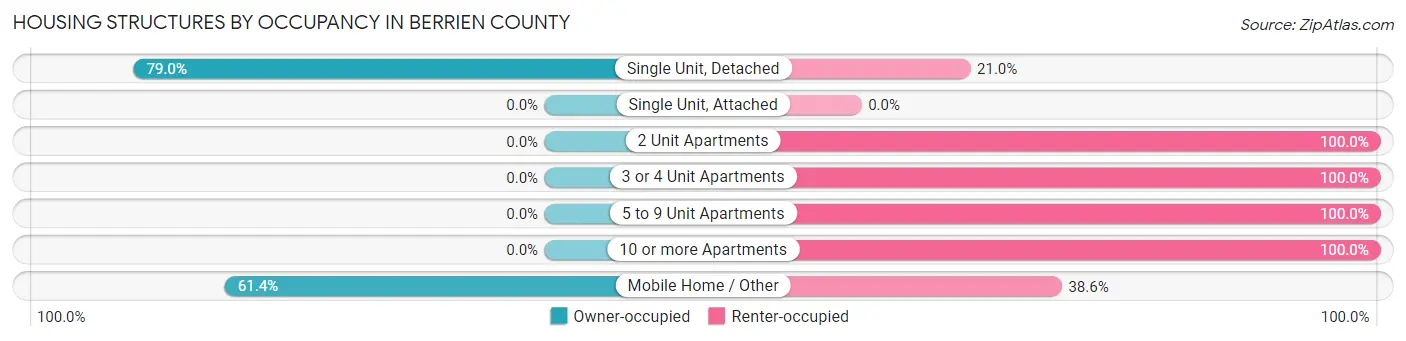
| Structure Type | Owner-occupied | Renter-occupied |
| Single Unit, Detached | 3,312 (79.0%) | 879 (21.0%) |
| Single Unit, Attached | 0 (0.0%) | 0 (0.0%) |
| 2 Unit Apartments | 0 (0.0%) | 78 (100.0%) |
| 3 or 4 Unit Apartments | 0 (0.0%) | 81 (100.0%) |
| 5 to 9 Unit Apartments | 0 (0.0%) | 190 (100.0%) |
| 10 or more Apartments | 0 (0.0%) | 11 (100.0%) |
| Mobile Home / Other | 1,365 (61.4%) | 857 (38.6%) |
| Total | 4,677 (69.1%) | 2,096 (30.9%) |
Housing Structures by Number of Rooms in Berrien County
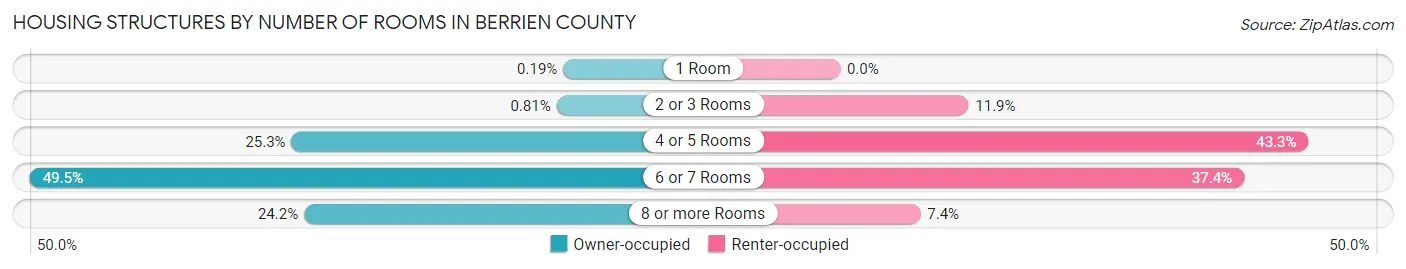
| Number of Rooms | Owner-occupied | Renter-occupied |
| 1 Room | 9 (0.2%) | 0 (0.0%) |
| 2 or 3 Rooms | 38 (0.8%) | 249 (11.9%) |
| 4 or 5 Rooms | 1,184 (25.3%) | 908 (43.3%) |
| 6 or 7 Rooms | 2,316 (49.5%) | 783 (37.4%) |
| 8 or more Rooms | 1,130 (24.2%) | 156 (7.4%) |
| Total | 4,677 (100.0%) | 2,096 (100.0%) |
Housing Structure by Heating Type in Berrien County
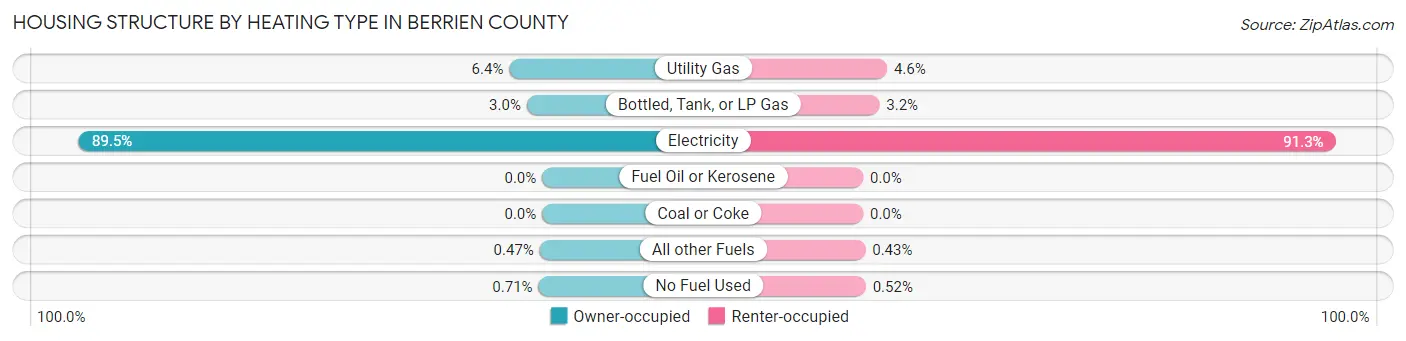
| Heating Type | Owner-occupied | Renter-occupied |
| Utility Gas | 297 (6.4%) | 97 (4.6%) |
| Bottled, Tank, or LP Gas | 139 (3.0%) | 66 (3.2%) |
| Electricity | 4,186 (89.5%) | 1,913 (91.3%) |
| Fuel Oil or Kerosene | 0 (0.0%) | 0 (0.0%) |
| Coal or Coke | 0 (0.0%) | 0 (0.0%) |
| All other Fuels | 22 (0.5%) | 9 (0.4%) |
| No Fuel Used | 33 (0.7%) | 11 (0.5%) |
| Total | 4,677 (100.0%) | 2,096 (100.0%) |
Household Vehicle Usage in Berrien County

| Vehicles per Household | Owner-occupied | Renter-occupied |
| No Vehicle | 74 (1.6%) | 185 (8.8%) |
| 1 Vehicle | 1,372 (29.3%) | 1,034 (49.3%) |
| 2 Vehicles | 1,986 (42.5%) | 657 (31.4%) |
| 3 or more Vehicles | 1,245 (26.6%) | 220 (10.5%) |
| Total | 4,677 (100.0%) | 2,096 (100.0%) |
Real Estate & Mortgages in Berrien County
Real Estate and Mortgage Overview in Berrien County
| Characteristic | Without Mortgage | With Mortgage |
| Housing Units | 2,628 | 2,049 |
| Median Property Value | $87,500 | $150,100 |
| Median Household Income | $52,109 | $227 |
| Monthly Housing Costs | $371 | $10 |
| Real Estate Taxes | $948 | $120 |
Property Value by Mortgage Status in Berrien County
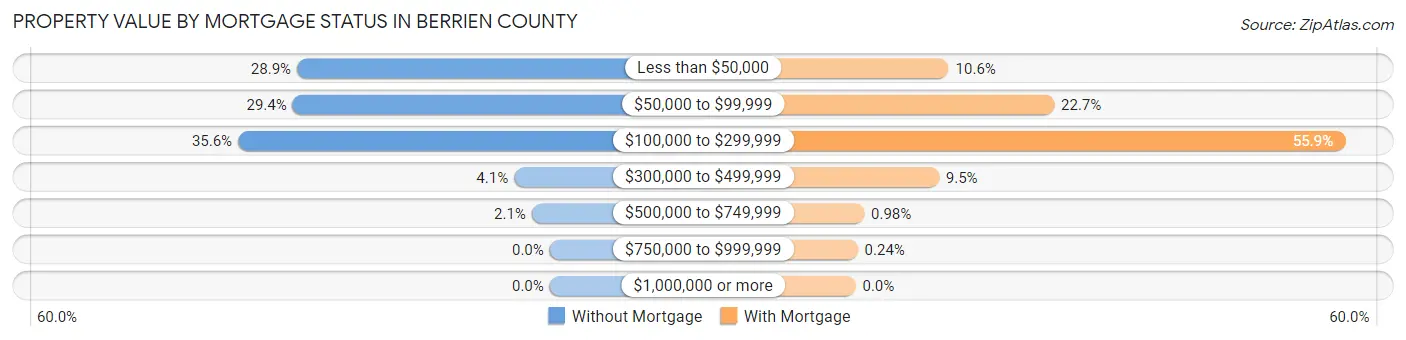
| Property Value | Without Mortgage | With Mortgage |
| Less than $50,000 | 759 (28.9%) | 218 (10.6%) |
| $50,000 to $99,999 | 772 (29.4%) | 465 (22.7%) |
| $100,000 to $299,999 | 936 (35.6%) | 1,146 (55.9%) |
| $300,000 to $499,999 | 107 (4.1%) | 195 (9.5%) |
| $500,000 to $749,999 | 54 (2.1%) | 20 (1.0%) |
| $750,000 to $999,999 | 0 (0.0%) | 5 (0.2%) |
| $1,000,000 or more | 0 (0.0%) | 0 (0.0%) |
| Total | 2,628 (100.0%) | 2,049 (100.0%) |
Household Income by Mortgage Status in Berrien County
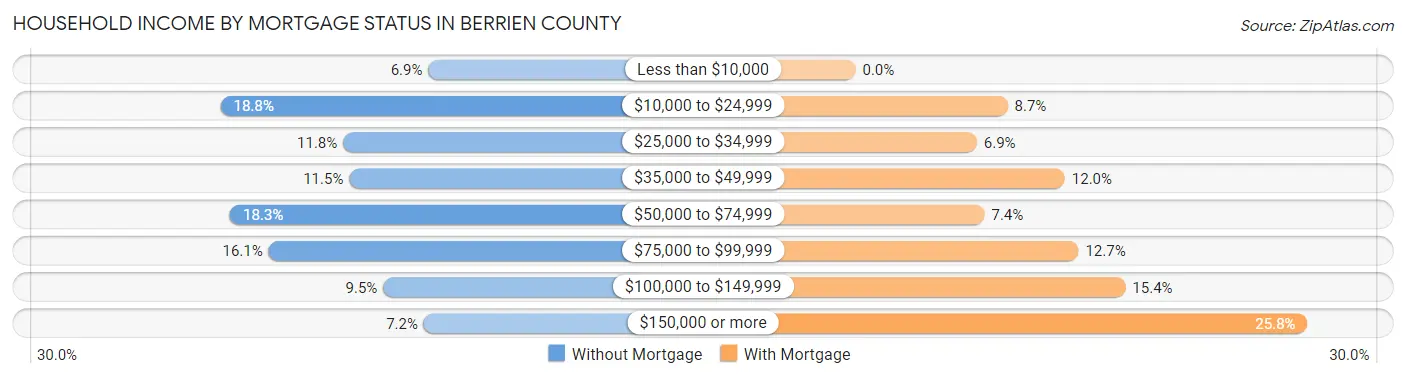
| Household Income | Without Mortgage | With Mortgage |
| Less than $10,000 | 182 (6.9%) | 0 (0.0%) |
| $10,000 to $24,999 | 494 (18.8%) | 178 (8.7%) |
| $25,000 to $34,999 | 310 (11.8%) | 142 (6.9%) |
| $35,000 to $49,999 | 301 (11.5%) | 245 (12.0%) |
| $50,000 to $74,999 | 480 (18.3%) | 151 (7.4%) |
| $75,000 to $99,999 | 422 (16.1%) | 261 (12.7%) |
| $100,000 to $149,999 | 250 (9.5%) | 316 (15.4%) |
| $150,000 or more | 189 (7.2%) | 529 (25.8%) |
| Total | 2,628 (100.0%) | 2,049 (100.0%) |
Property Value to Household Income Ratio in Berrien County
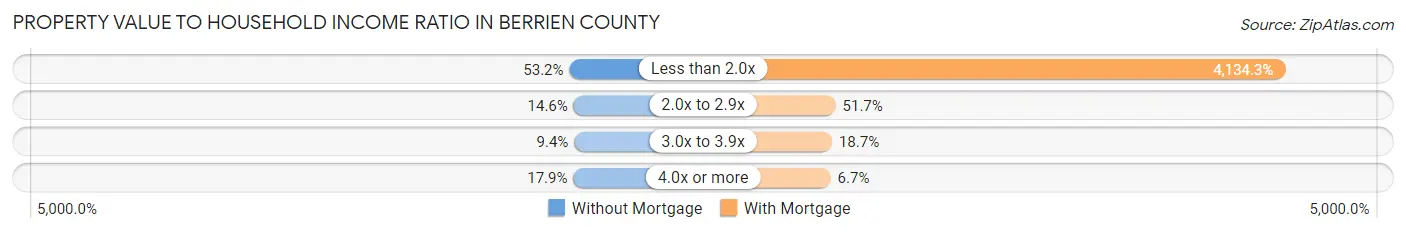
| Value-to-Income Ratio | Without Mortgage | With Mortgage |
| Less than 2.0x | 1,397 (53.2%) | 84,712 (4,134.3%) |
| 2.0x to 2.9x | 383 (14.6%) | 1,060 (51.7%) |
| 3.0x to 3.9x | 246 (9.4%) | 384 (18.7%) |
| 4.0x or more | 469 (17.8%) | 137 (6.7%) |
| Total | 2,628 (100.0%) | 2,049 (100.0%) |
Real Estate Taxes by Mortgage Status in Berrien County
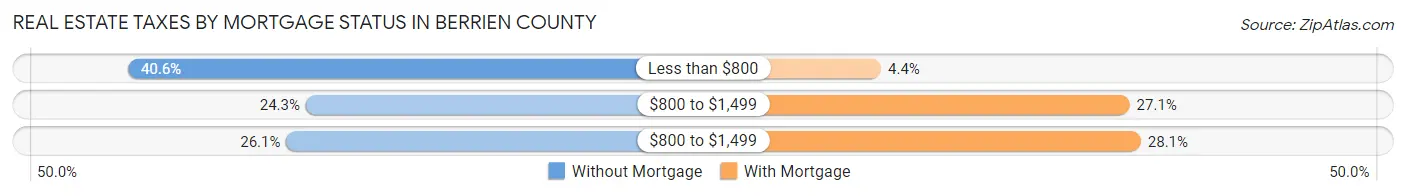
| Property Taxes | Without Mortgage | With Mortgage |
| Less than $800 | 1,066 (40.6%) | 90 (4.4%) |
| $800 to $1,499 | 639 (24.3%) | 555 (27.1%) |
| $800 to $1,499 | 686 (26.1%) | 576 (28.1%) |
| Total | 2,628 (100.0%) | 2,049 (100.0%) |
Health & Disability in Berrien County
Health Insurance Coverage by Age in Berrien County
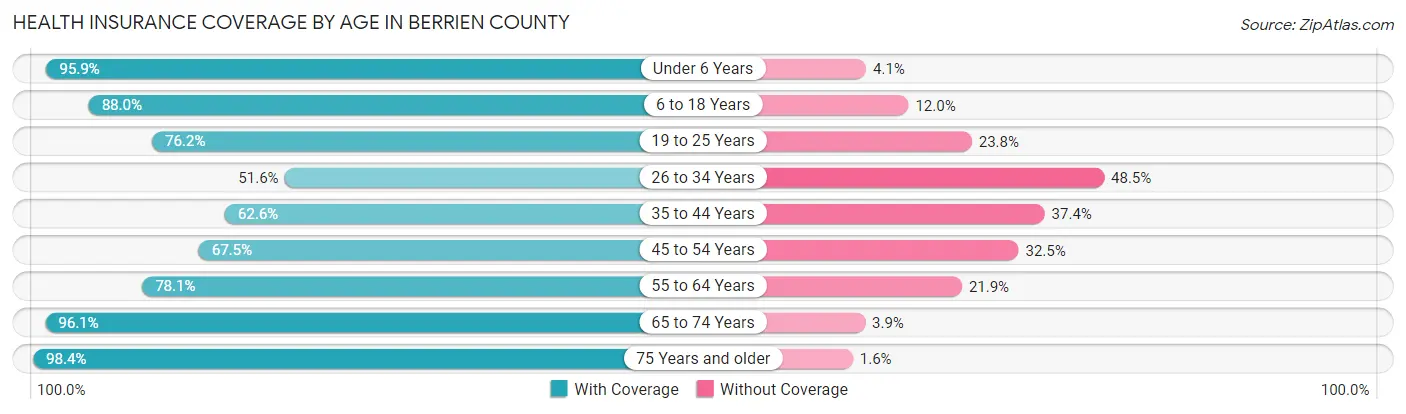
| Age Bracket | With Coverage | Without Coverage |
| Under 6 Years | 1,202 (95.9%) | 51 (4.1%) |
| 6 to 18 Years | 3,031 (88.0%) | 412 (12.0%) |
| 19 to 25 Years | 917 (76.2%) | 286 (23.8%) |
| 26 to 34 Years | 995 (51.5%) | 935 (48.4%) |
| 35 to 44 Years | 1,412 (62.6%) | 842 (37.4%) |
| 45 to 54 Years | 1,594 (67.5%) | 767 (32.5%) |
| 55 to 64 Years | 1,836 (78.1%) | 516 (21.9%) |
| 65 to 74 Years | 1,808 (96.1%) | 73 (3.9%) |
| 75 Years and older | 1,232 (98.4%) | 20 (1.6%) |
| Total | 14,027 (78.2%) | 3,902 (21.8%) |
Health Insurance Coverage by Citizenship Status in Berrien County
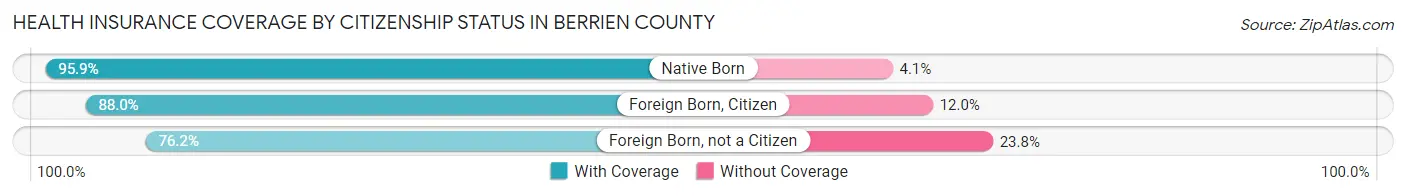
| Citizenship Status | With Coverage | Without Coverage |
| Native Born | 1,202 (95.9%) | 51 (4.1%) |
| Foreign Born, Citizen | 3,031 (88.0%) | 412 (12.0%) |
| Foreign Born, not a Citizen | 917 (76.2%) | 286 (23.8%) |
Health Insurance Coverage by Household Income in Berrien County
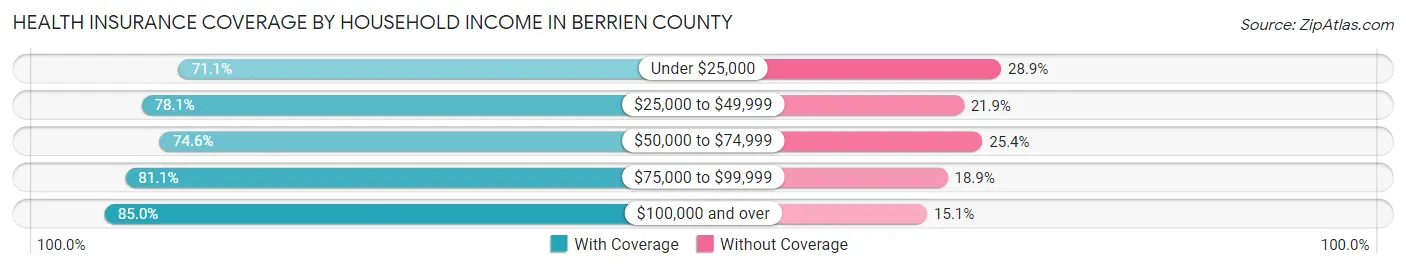
| Household Income | With Coverage | Without Coverage |
| Under $25,000 | 2,471 (71.1%) | 1,005 (28.9%) |
| $25,000 to $49,999 | 3,370 (78.1%) | 945 (21.9%) |
| $50,000 to $74,999 | 2,288 (74.6%) | 779 (25.4%) |
| $75,000 to $99,999 | 2,307 (81.1%) | 537 (18.9%) |
| $100,000 and over | 3,589 (85.0%) | 636 (15.0%) |
Public vs Private Health Insurance Coverage by Age in Berrien County

| Age Bracket | Public Insurance | Private Insurance |
| Under 6 | 799 (63.8%) | 480 (38.3%) |
| 6 to 18 Years | 1,882 (54.7%) | 1,403 (40.7%) |
| 19 to 25 Years | 337 (28.0%) | 601 (50.0%) |
| 25 to 34 Years | 202 (10.5%) | 799 (41.4%) |
| 35 to 44 Years | 381 (16.9%) | 1,141 (50.6%) |
| 45 to 54 Years | 446 (18.9%) | 1,295 (54.8%) |
| 55 to 64 Years | 644 (27.4%) | 1,306 (55.5%) |
| 65 to 74 Years | 1,727 (91.8%) | 809 (43.0%) |
| 75 Years and over | 1,232 (98.4%) | 679 (54.2%) |
| Total | 7,650 (42.7%) | 8,513 (47.5%) |
Disability Status by Sex by Age in Berrien County

| Age Bracket | Male | Female |
| Under 5 Years | 0 (0.0%) | 0 (0.0%) |
| 5 to 17 Years | 220 (13.5%) | 102 (6.4%) |
| 18 to 34 Years | 210 (12.0%) | 140 (8.2%) |
| 35 to 64 Years | 466 (13.6%) | 642 (18.2%) |
| 65 to 74 Years | 335 (36.2%) | 324 (33.9%) |
| 75 Years and over | 309 (56.0%) | 348 (49.7%) |
Disability Class by Sex by Age in Berrien County
Disability Class: Hearing Difficulty

| Age Bracket | Male | Female |
| Under 5 Years | 0 (0.0%) | 0 (0.0%) |
| 5 to 17 Years | 63 (3.9%) | 0 (0.0%) |
| 18 to 34 Years | 0 (0.0%) | 0 (0.0%) |
| 35 to 64 Years | 77 (2.2%) | 78 (2.2%) |
| 65 to 74 Years | 124 (13.4%) | 57 (6.0%) |
| 75 Years and over | 224 (40.6%) | 152 (21.7%) |
Disability Class: Vision Difficulty
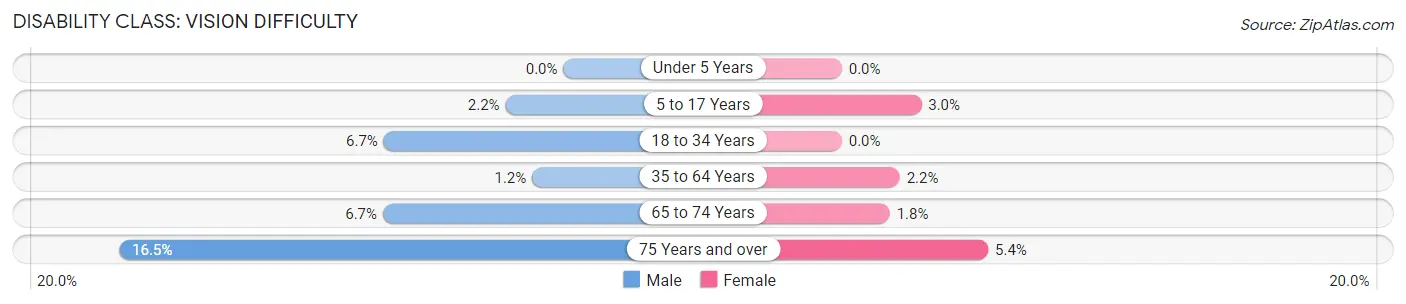
| Age Bracket | Male | Female |
| Under 5 Years | 0 (0.0%) | 0 (0.0%) |
| 5 to 17 Years | 35 (2.1%) | 47 (2.9%) |
| 18 to 34 Years | 117 (6.7%) | 0 (0.0%) |
| 35 to 64 Years | 40 (1.2%) | 76 (2.1%) |
| 65 to 74 Years | 62 (6.7%) | 17 (1.8%) |
| 75 Years and over | 91 (16.5%) | 38 (5.4%) |
Disability Class: Cognitive Difficulty

| Age Bracket | Male | Female |
| 5 to 17 Years | 147 (9.0%) | 48 (3.0%) |
| 18 to 34 Years | 74 (4.2%) | 91 (5.3%) |
| 35 to 64 Years | 215 (6.3%) | 309 (8.7%) |
| 65 to 74 Years | 48 (5.2%) | 51 (5.3%) |
| 75 Years and over | 75 (13.6%) | 57 (8.1%) |
Disability Class: Ambulatory Difficulty
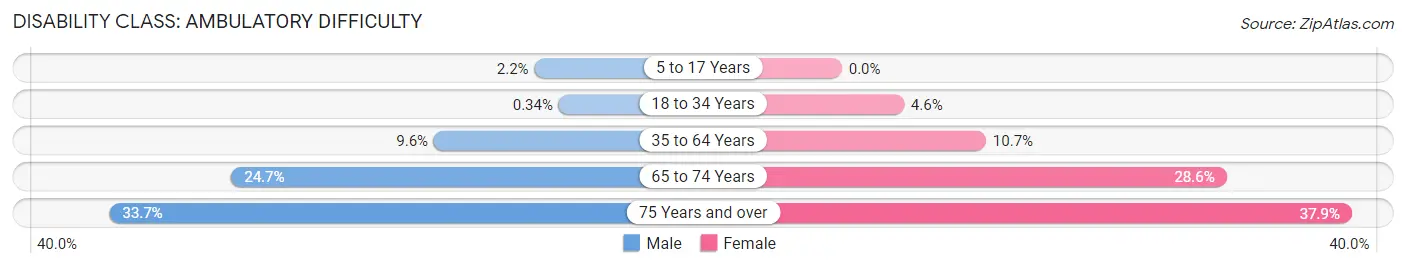
| Age Bracket | Male | Female |
| 5 to 17 Years | 35 (2.1%) | 0 (0.0%) |
| 18 to 34 Years | 6 (0.3%) | 79 (4.6%) |
| 35 to 64 Years | 330 (9.6%) | 378 (10.7%) |
| 65 to 74 Years | 228 (24.6%) | 273 (28.6%) |
| 75 Years and over | 186 (33.7%) | 265 (37.9%) |
Disability Class: Self-Care Difficulty

| Age Bracket | Male | Female |
| 5 to 17 Years | 45 (2.8%) | 0 (0.0%) |
| 18 to 34 Years | 6 (0.3%) | 54 (3.2%) |
| 35 to 64 Years | 162 (4.7%) | 160 (4.5%) |
| 65 to 74 Years | 28 (3.0%) | 106 (11.1%) |
| 75 Years and over | 54 (9.8%) | 118 (16.9%) |
Technology Access in Berrien County
Computing Device Access in Berrien County

| Device Type | # Households | % Households |
| Desktop or Laptop | 4,442 | 65.6% |
| Smartphone | 5,327 | 78.6% |
| Tablet | 2,986 | 44.1% |
| No Computing Device | 975 | 14.4% |
| Total | 6,773 | 100.0% |
Internet Access in Berrien County
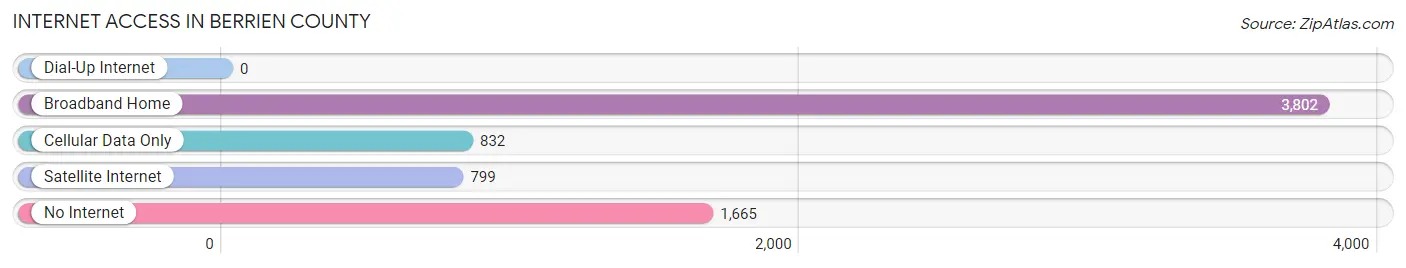
| Internet Type | # Households | % Households |
| Dial-Up Internet | 0 | 0.0% |
| Broadband Home | 3,802 | 56.1% |
| Cellular Data Only | 832 | 12.3% |
| Satellite Internet | 799 | 11.8% |
| No Internet | 1,665 | 24.6% |
| Total | 6,773 | 100.0% |
Berrien County Summary
Berrien County, Georgia is located in the southeastern corner of the state, bordering the states of Florida and Alabama. It is part of the Valdosta Metropolitan Statistical Area and is the largest county in the state by area. The county seat is Nashville, and the largest city is Ray City. The county was created in 1856 from parts of Irwin and Lowndes counties and was named for John Macpherson Berrien, a U.S. Senator from Georgia.
Geography
Berrien County is located in the southeastern corner of Georgia, bordered by the states of Florida and Alabama. It is part of the Valdosta Metropolitan Statistical Area and is the largest county in the state by area. The county has a total area of 1,072 square miles, of which 1,068 square miles is land and 4.2 square miles is water. The county is located in the Coastal Plain region of Georgia and is mostly flat with some rolling hills. The Alapaha River runs through the county, and there are several small lakes and ponds.
Demographics
As of the 2010 census, there were 19,286 people, 7,541 households, and 5,541 families residing in the county. The population density was 18 people per square mile. The racial makeup of the county was 68.3% White, 28.2% African American, 0.4% Native American, 0.3% Asian, 0.1% Pacific Islander, 1.2% from other races, and 1.5% from two or more races. Hispanic or Latino of any race were 3.2% of the population.
The median income for a household in the county was $33,945 and the median income for a family was $41,845. The per capita income for the county was $17,845. About 17.2% of families and 21.2% of the population were below the poverty line, including 28.2% of those under age 18 and 17.2% of those age 65 or over.
Economy
Berrien County’s economy is largely based on agriculture, with the main crops being cotton, peanuts, corn, and soybeans. The county also has a strong timber industry, with pine and hardwood being the main products. Manufacturing is also an important part of the economy, with companies such as Georgia-Pacific and Georgia-Pacific Corrugated producing paper products. The county also has a growing tourism industry, with attractions such as the Alapaha River Wildlife Management Area and the Berrien County Historical Society Museum.
Conclusion
Berrien County, Georgia is a large county located in the southeastern corner of the state. It is part of the Valdosta Metropolitan Statistical Area and is the largest county in the state by area. The county has a diverse economy, with agriculture, timber, and manufacturing being the main industries. The county also has a growing tourism industry, with attractions such as the Alapaha River Wildlife Management Area and the Berrien County Historical Society Museum. The population of the county is diverse, with a mix of races and ethnicities. The median income for a household in the county is $33,945 and the median income for a family is $41,845.
Common Questions
What is the Total Population of Berrien County?
Total Population of Berrien County is 18,187.
What is the Total Male Population of Berrien County?
Total Male Population of Berrien County is 9,046.
What is the Total Female Population of Berrien County?
Total Female Population of Berrien County is 9,141.
What is the Ratio of Males per 100 Females in Berrien County?
There are 98.96 Males per 100 Females in Berrien County.
What is the Ratio of Females per 100 Males in Berrien County?
There are 101.05 Females per 100 Males in Berrien County.
What is the Median Population Age in Berrien County?
Median Population Age in Berrien County is 39.8 Years.
What is the Average Family Size in Berrien County
Average Family Size in Berrien County is 3.2 People.
What is the Average Household Size in Berrien County
Average Household Size in Berrien County is 2.7 People.
What is Per Capita Income in Berrien County?
Per Capita income in Berrien County is $25,100.
What is the Median Family Income in Berrien County?
Median Family Income in Berrien County is $61,384.
What is the Median Household income in Berrien County?
Median Household Income in Berrien County is $48,670.
What is Income or Wage Gap in Berrien County?
Income or Wage Gap in Berrien County is 27.4%.
Women in Berrien County earn 72.6 cents for every dollar earned by a man.
What is Family Income Deficit in Berrien County?
Family Income Deficit in Berrien County is $11,848.
Families that are below poverty line in Berrien County earn $11,848 less on average than the poverty threshold level.
What is Inequality or Gini Index in Berrien County?
Inequality or Gini Index in Berrien County is 0.46.
How Large is the Labor Force in Berrien County?
There are 7,685 People in the Labor Forcein in Berrien County.
What is the Percentage of People in the Labor Force in Berrien County?
53.4% of People are in the Labor Force in Berrien County.
What is the Unemployment Rate in Berrien County?
Unemployment Rate in Berrien County is 4.6%.