Baker County, GA
Baker County Map

Baker County Overview
2,878
TOTAL POPULATION
1,450
MALE POPULATION
1,428
FEMALE POPULATION
101.54
MALES / 100 FEMALES
98.48
FEMALES / 100 MALES
47.0
MEDIAN AGE
3.2
AVG FAMILY SIZE
2.6
AVG HOUSEHOLD SIZE
$23,731
PER CAPITA INCOME
$48,634
AVG FAMILY INCOME
$45,417
AVG HOUSEHOLD INCOME
27.7%
WAGE / INCOME GAP [ % ]
72.3¢/ $1
WAGE / INCOME GAP [ $ ]
0.46
INEQUALITY / GINI INDEX
1,024
LABOR FORCE [ PEOPLE ]
43.1%
PERCENT IN LABOR FORCE
12.2%
UNEMPLOYMENT RATE
Baker County Area Codes
Race in Baker County
The most populous races in Baker County are White / Caucasian (1,505 | 52.3%), Black / African American (981 | 34.1%), and Asian (284 | 9.9%).

| Race | # Population | % Population |
| Asian | 284 | 9.9% |
| Black / African American | 981 | 34.1% |
| Hawaiian / Pacific | 0 | 0.0% |
| Hispanic or Latino | 24 | 0.8% |
| Native / Alaskan | 26 | 0.9% |
| White / Caucasian | 1,505 | 52.3% |
| Two or more Races | 82 | 2.9% |
| Some other Race | 0 | 0.0% |
| Total | 2,878 | 100.0% |
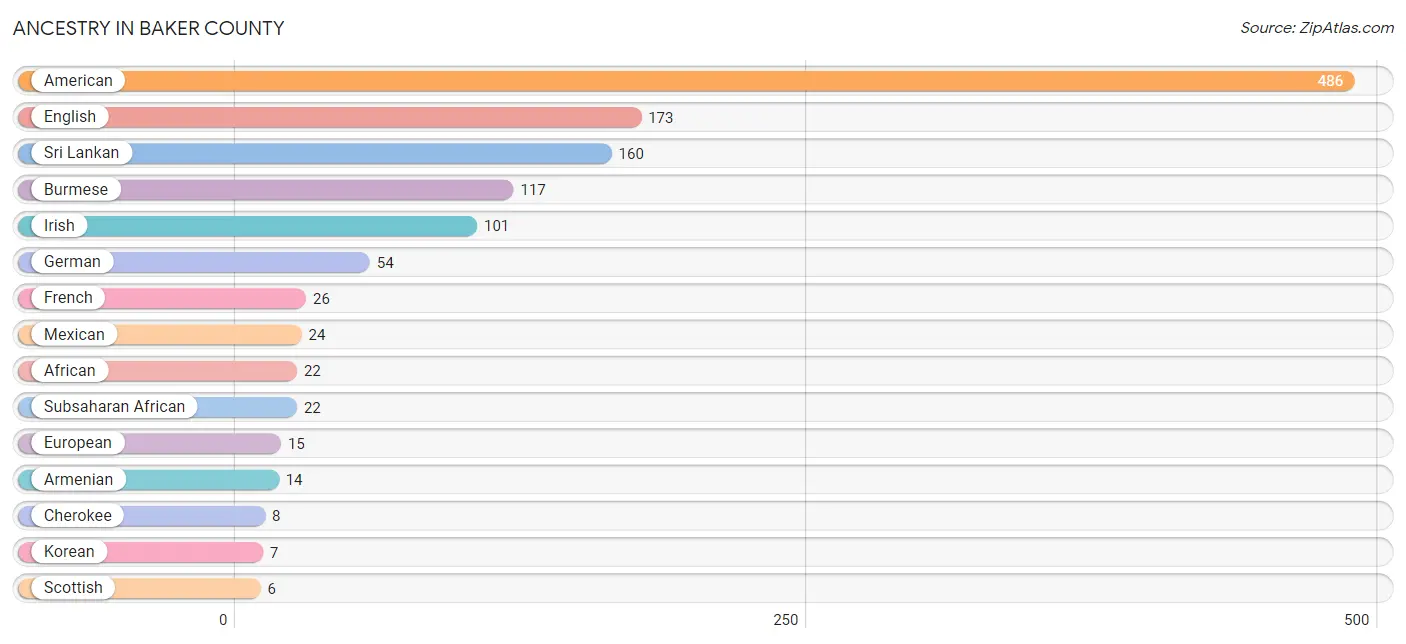
Ancestry in Baker County
The most populous ancestries reported in Baker County are American (486 | 16.9%), English (173 | 6.0%), Sri Lankan (160 | 5.6%), Burmese (117 | 4.1%), and Irish (101 | 3.5%), together accounting for 36.0% of all Baker County residents.
| Ancestry | # Population | % Population |
| African | 22 | 0.8% |
| American | 486 | 16.9% |
| Armenian | 14 | 0.5% |
| Burmese | 117 | 4.1% |
| Cherokee | 8 | 0.3% |
| English | 173 | 6.0% |
| European | 15 | 0.5% |
| French | 26 | 0.9% |
| German | 54 | 1.9% |
| Irish | 101 | 3.5% |
| Korean | 7 | 0.2% |
| Mexican | 24 | 0.8% |
| Scandinavian | 1 | 0.0% |
| Scotch-Irish | 1 | 0.0% |
| Scottish | 6 | 0.2% |
| Sri Lankan | 160 | 5.6% |
| Subsaharan African | 22 | 0.8% |
| Welsh | 3 | 0.1% | View All 18 Rows |
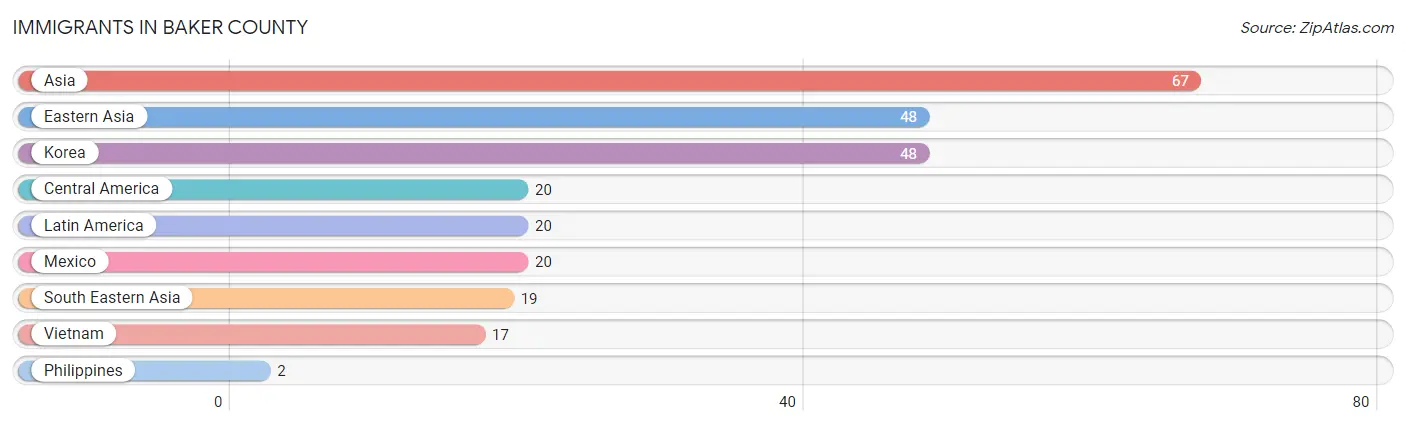
Immigrants in Baker County
The most numerous immigrant groups reported in Baker County came from Asia (67 | 2.3%), Eastern Asia (48 | 1.7%), Korea (48 | 1.7%), Central America (20 | 0.7%), and Latin America (20 | 0.7%), together accounting for 7.1% of all Baker County residents.
| Immigration Origin | # Population | % Population |
| Asia | 67 | 2.3% |
| Central America | 20 | 0.7% |
| Eastern Asia | 48 | 1.7% |
| Korea | 48 | 1.7% |
| Latin America | 20 | 0.7% |
| Mexico | 20 | 0.7% |
| Philippines | 2 | 0.1% |
| South Eastern Asia | 19 | 0.7% |
| Vietnam | 17 | 0.6% | View All 9 Rows |
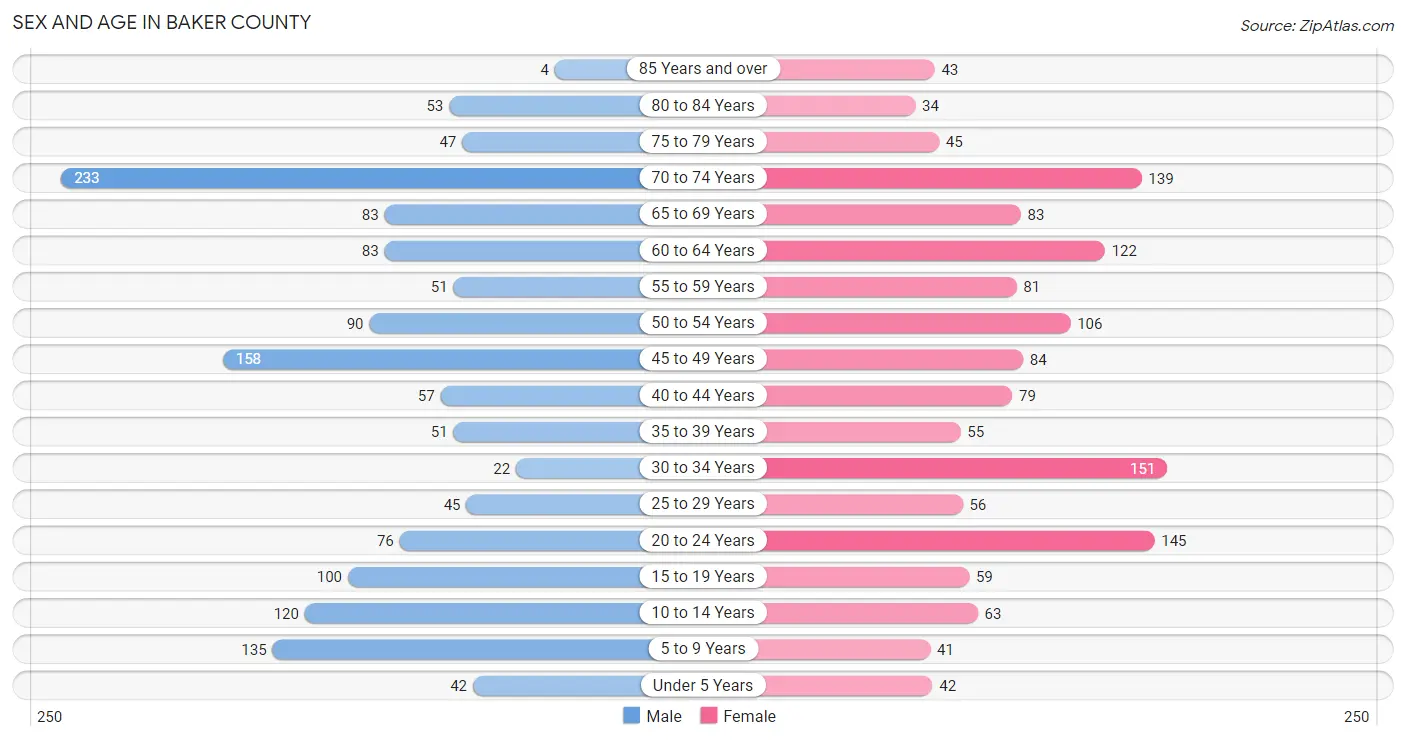
Sex and Age in Baker County
Sex and Age in Baker County
The most populous age groups in Baker County are 70 to 74 Years (233 | 16.1%) for men and 30 to 34 Years (151 | 10.6%) for women.
| Age Bracket | Male | Female |
| Under 5 Years | 42 (2.9%) | 42 (2.9%) |
| 5 to 9 Years | 135 (9.3%) | 41 (2.9%) |
| 10 to 14 Years | 120 (8.3%) | 63 (4.4%) |
| 15 to 19 Years | 100 (6.9%) | 59 (4.1%) |
| 20 to 24 Years | 76 (5.2%) | 145 (10.2%) |
| 25 to 29 Years | 45 (3.1%) | 56 (3.9%) |
| 30 to 34 Years | 22 (1.5%) | 151 (10.6%) |
| 35 to 39 Years | 51 (3.5%) | 55 (3.8%) |
| 40 to 44 Years | 57 (3.9%) | 79 (5.5%) |
| 45 to 49 Years | 158 (10.9%) | 84 (5.9%) |
| 50 to 54 Years | 90 (6.2%) | 106 (7.4%) |
| 55 to 59 Years | 51 (3.5%) | 81 (5.7%) |
| 60 to 64 Years | 83 (5.7%) | 122 (8.5%) |
| 65 to 69 Years | 83 (5.7%) | 83 (5.8%) |
| 70 to 74 Years | 233 (16.1%) | 139 (9.7%) |
| 75 to 79 Years | 47 (3.2%) | 45 (3.2%) |
| 80 to 84 Years | 53 (3.7%) | 34 (2.4%) |
| 85 Years and over | 4 (0.3%) | 43 (3.0%) |
| Total | 1,450 (100.0%) | 1,428 (100.0%) |
Families and Households in Baker County
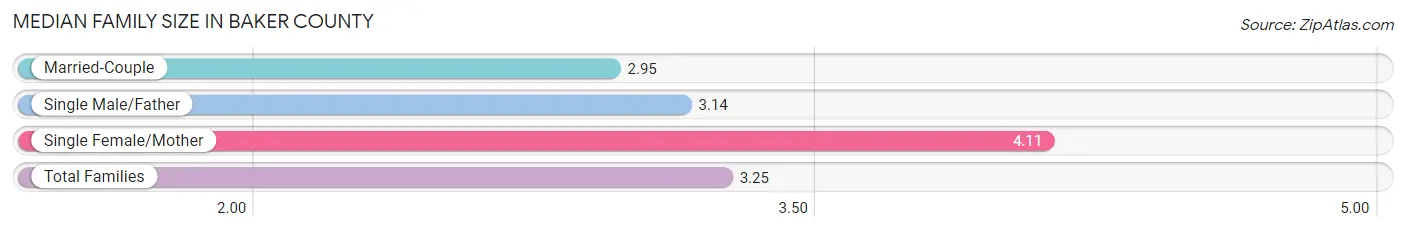
Median Family Size in Baker County
The median family size in Baker County is 3.25 persons per family, with single female/mother families (179 | 24.2%) accounting for the largest median family size of 4.11 persons per family. On the other hand, married-couple families (486 | 65.8%) represent the smallest median family size with 2.95 persons per family.
| Family Type | # Families | Family Size |
| Married-Couple | 486 (65.8%) | 2.95 |
| Single Male/Father | 74 (10.0%) | 3.14 |
| Single Female/Mother | 179 (24.2%) | 4.11 |
| Total Families | 739 (100.0%) | 3.25 |
Median Household Size in Baker County
The median household size in Baker County is 2.60 persons per household, with single female/mother households (179 | 16.3%) accounting for the largest median household size of 4.36 persons per household. non-family households (358 | 32.6%) represent the smallest median household size with 1.09 persons per household.
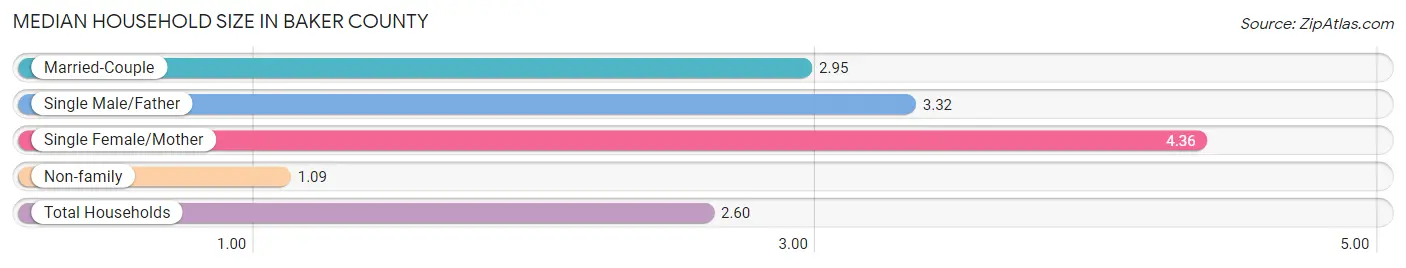
| Household Type | # Households | Household Size |
| Married-Couple | 486 (44.3%) | 2.95 |
| Single Male/Father | 74 (6.8%) | 3.32 |
| Single Female/Mother | 179 (16.3%) | 4.36 |
| Non-family | 358 (32.6%) | 1.09 |
| Total Households | 1,097 (100.0%) | 2.60 |
Household Size by Marriage Status in Baker County
Out of a total of 1,097 households in Baker County, 739 (67.4%) are family households, while 358 (32.6%) are nonfamily households. The most numerous type of family households are 2-person households, comprising 401, and the most common type of nonfamily households are 1-person households, comprising 322.
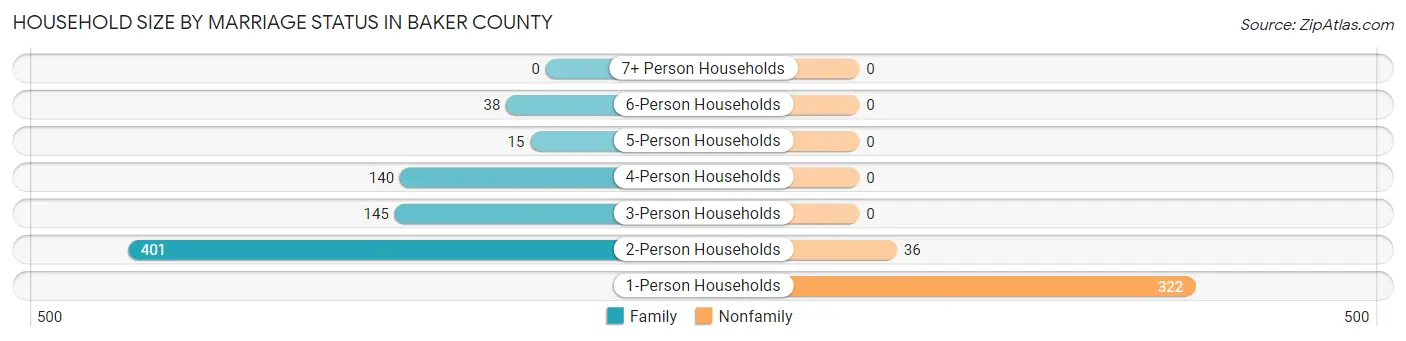
| Household Size | Family Households | Nonfamily Households |
| 1-Person Households | - | 322 (29.3%) |
| 2-Person Households | 401 (36.5%) | 36 (3.3%) |
| 3-Person Households | 145 (13.2%) | 0 (0.0%) |
| 4-Person Households | 140 (12.8%) | 0 (0.0%) |
| 5-Person Households | 15 (1.4%) | 0 (0.0%) |
| 6-Person Households | 38 (3.5%) | 0 (0.0%) |
| 7+ Person Households | 0 (0.0%) | 0 (0.0%) |
| Total | 739 (67.4%) | 358 (32.6%) |
Female Fertility in Baker County
Fertility by Age in Baker County
Average fertility rate in Baker County is 33.0 births per 1,000 women. Women in the age bracket of 20 to 34 years have the highest fertility rate with 48.0 births per 1,000 women. Women in the age bracket of 20 to 34 years acount for 80.9% of all women with births.
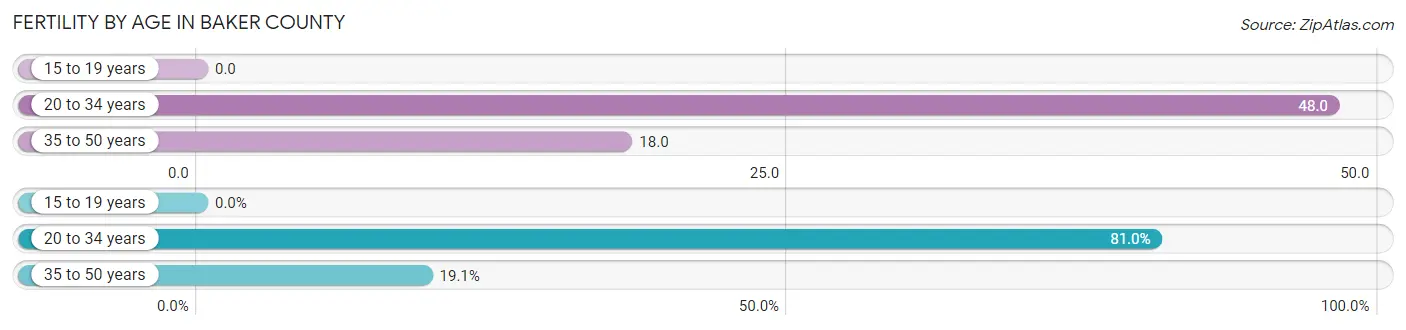
| Age Bracket | Women with Births | Births / 1,000 Women |
| 15 to 19 years | 0 (0.0%) | 0.0 |
| 20 to 34 years | 17 (80.9%) | 48.0 |
| 35 to 50 years | 4 (19.1%) | 18.0 |
| Total | 21 (100.0%) | 33.0 |
Fertility by Age by Marriage Status in Baker County
19.0% of women with births (21) in Baker County are married. The highest percentage of unmarried women with births falls into 20 to 34 years age bracket with 100.0% of them unmarried at the time of birth, while the lowest percentage of unmarried women with births belong to 35 to 50 years age bracket with 0.0% of them unmarried.
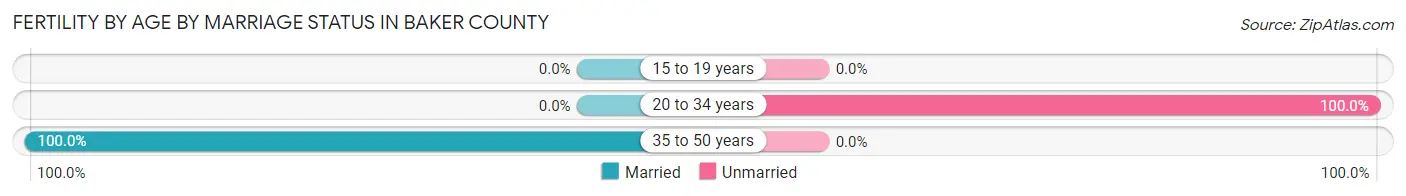
| Age Bracket | Married | Unmarried |
| 15 to 19 years | 0 (0.0%) | 0 (0.0%) |
| 20 to 34 years | 0 (0.0%) | 17 (100.0%) |
| 35 to 50 years | 4 (100.0%) | 0 (0.0%) |
| Total | 4 (19.1%) | 17 (80.9%) |
Fertility by Education in Baker County
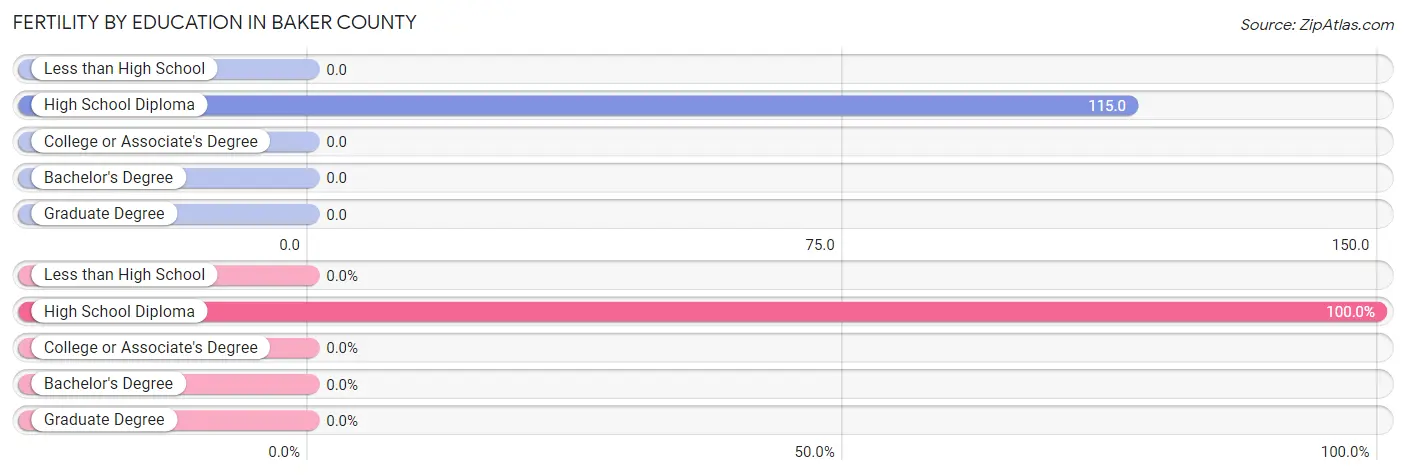
| Educational Attainment | Women with Births | Births / 1,000 Women |
| Less than High School | 0 (0.0%) | 0.0 |
| High School Diploma | 21 (100.0%) | 115.0 |
| College or Associate's Degree | 0 (0.0%) | 0.0 |
| Bachelor's Degree | 0 (0.0%) | 0.0 |
| Graduate Degree | 0 (0.0%) | 0.0 |
| Total | 21 (100.0%) | 33.0 |
Fertility by Education by Marriage Status in Baker County
80.9% of women with births in Baker County are unmarried. Women with the educational attainment of high school diploma are most likely to be married with 19.1% of them married at childbirth, while women with the educational attainment of high school diploma are least likely to be married with 80.9% of them unmarried at childbirth.
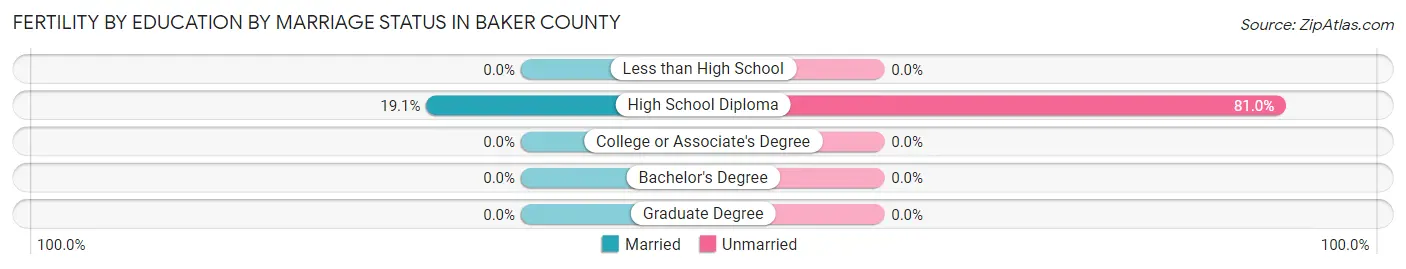
| Educational Attainment | Married | Unmarried |
| Less than High School | 0 (0.0%) | 0 (0.0%) |
| High School Diploma | 4 (19.1%) | 17 (80.9%) |
| College or Associate's Degree | 0 (0.0%) | 0 (0.0%) |
| Bachelor's Degree | 0 (0.0%) | 0 (0.0%) |
| Graduate Degree | 0 (0.0%) | 0 (0.0%) |
| Total | 4 (19.1%) | 17 (80.9%) |
Income in Baker County
Income Overview in Baker County
Per Capita Income in Baker County is $23,731, while median incomes of families and households are $48,634 and $45,417 respectively.
| Characteristic | Number | Measure |
| Per Capita Income | 2,878 | $23,731 |
| Median Family Income | 739 | $48,634 |
| Mean Family Income | 739 | $68,943 |
| Median Household Income | 1,097 | $45,417 |
| Mean Household Income | 1,097 | $59,560 |
| Income Deficit | 739 | $0 |
| Wage / Income Gap (%) | 2,878 | 27.69% |
| Wage / Income Gap ($) | 2,878 | 72.31¢ per $1 |
| Gini / Inequality Index | 2,878 | 0.46 |
Earnings by Sex in Baker County
Average Earnings in Baker County are $33,231, $37,694 for men and $27,256 for women, a difference of 27.7%.
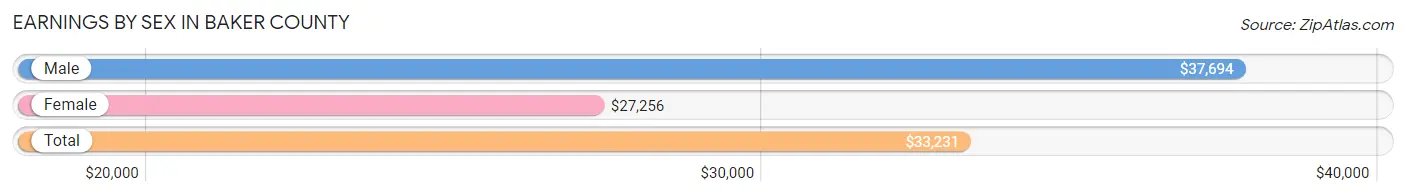
| Sex | Number | Average Earnings |
| Male | 625 (54.9%) | $37,694 |
| Female | 514 (45.1%) | $27,256 |
| Total | 1,139 (100.0%) | $33,231 |
Earnings by Sex by Income Bracket in Baker County
The most common earnings brackets in Baker County are $2,499 or less for men (98 | 15.7%) and $25,000 to $29,999 for women (104 | 20.2%).
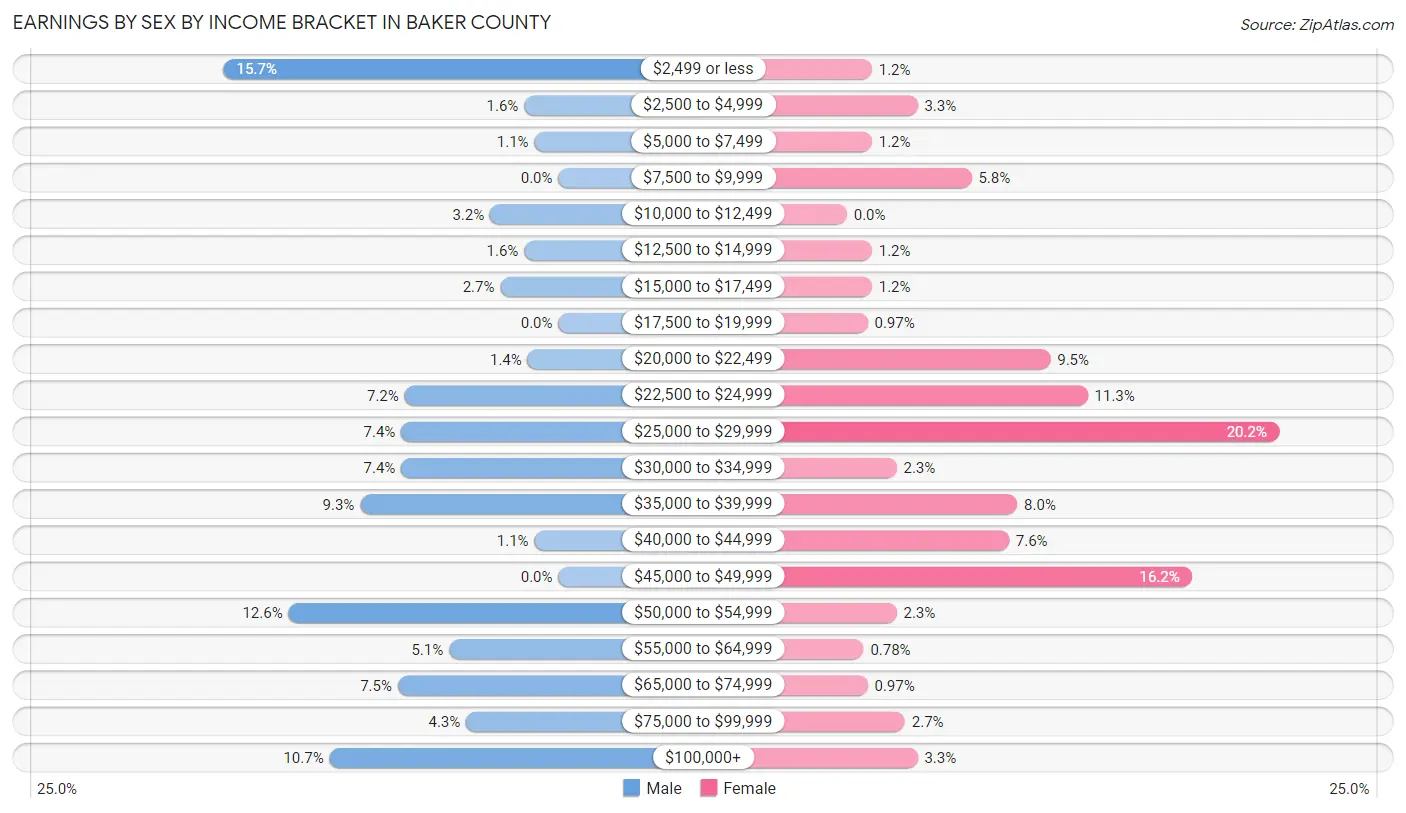
| Income | Male | Female |
| $2,499 or less | 98 (15.7%) | 6 (1.2%) |
| $2,500 to $4,999 | 10 (1.6%) | 17 (3.3%) |
| $5,000 to $7,499 | 7 (1.1%) | 6 (1.2%) |
| $7,500 to $9,999 | 0 (0.0%) | 30 (5.8%) |
| $10,000 to $12,499 | 20 (3.2%) | 0 (0.0%) |
| $12,500 to $14,999 | 10 (1.6%) | 6 (1.2%) |
| $15,000 to $17,499 | 17 (2.7%) | 6 (1.2%) |
| $17,500 to $19,999 | 0 (0.0%) | 5 (1.0%) |
| $20,000 to $22,499 | 9 (1.4%) | 49 (9.5%) |
| $22,500 to $24,999 | 45 (7.2%) | 58 (11.3%) |
| $25,000 to $29,999 | 46 (7.4%) | 104 (20.2%) |
| $30,000 to $34,999 | 46 (7.4%) | 12 (2.3%) |
| $35,000 to $39,999 | 58 (9.3%) | 41 (8.0%) |
| $40,000 to $44,999 | 7 (1.1%) | 39 (7.6%) |
| $45,000 to $49,999 | 0 (0.0%) | 83 (16.2%) |
| $50,000 to $54,999 | 79 (12.6%) | 12 (2.3%) |
| $55,000 to $64,999 | 32 (5.1%) | 4 (0.8%) |
| $65,000 to $74,999 | 47 (7.5%) | 5 (1.0%) |
| $75,000 to $99,999 | 27 (4.3%) | 14 (2.7%) |
| $100,000+ | 67 (10.7%) | 17 (3.3%) |
| Total | 625 (100.0%) | 514 (100.0%) |
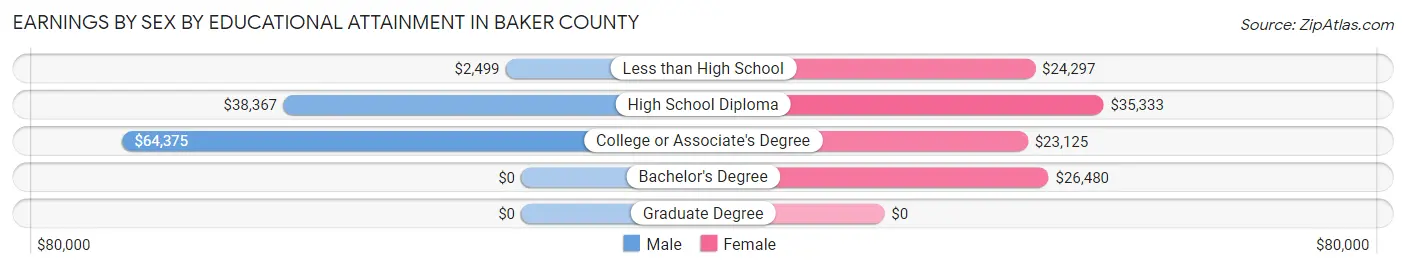
Earnings by Sex by Educational Attainment in Baker County
Average earnings in Baker County are $38,319 for men and $26,753 for women, a difference of 30.2%. Men with an educational attainment of college or associate's degree enjoy the highest average annual earnings of $64,375, while those with less than high school education earn the least with $2,499. Women with an educational attainment of high school diploma earn the most with the average annual earnings of $35,333, while those with college or associate's degree education have the smallest earnings of $23,125.
| Educational Attainment | Male Income | Female Income |
| Less than High School | $2,499 | $24,297 |
| High School Diploma | $38,367 | $35,333 |
| College or Associate's Degree | $64,375 | $23,125 |
| Bachelor's Degree | - | - |
| Graduate Degree | - | - |
| Total | $38,319 | $26,753 |
Family Income in Baker County
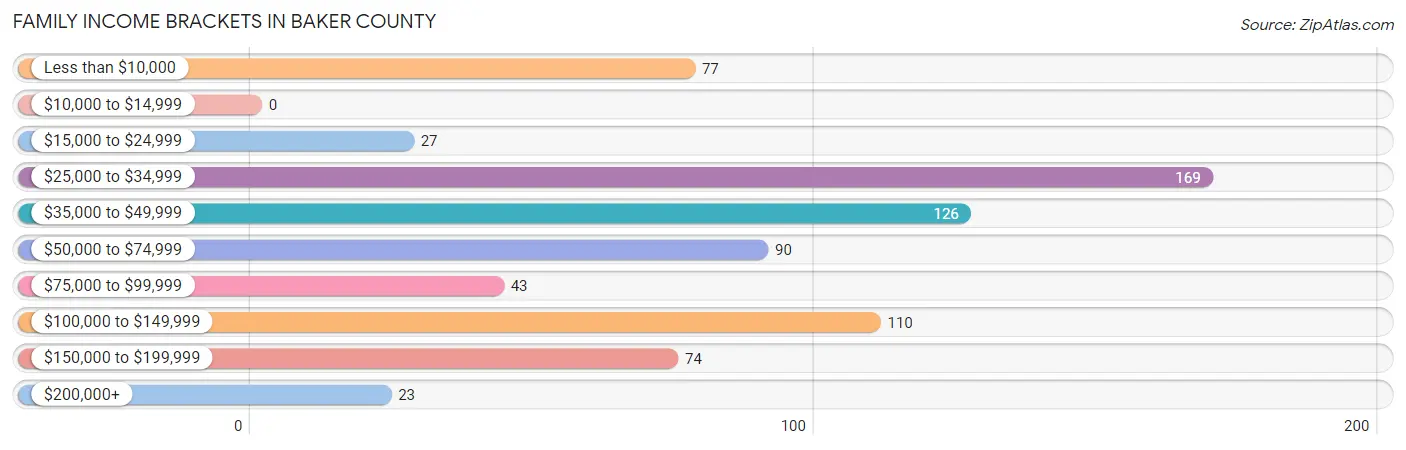
Family Income Brackets in Baker County
According to the Baker County family income data, there are 169 families falling into the $25,000 to $34,999 income range, which is the most common income bracket and makes up 22.9% of all families.
| Income Bracket | # Families | % Families |
| Less than $10,000 | 77 | 10.4% |
| $10,000 to $14,999 | 0 | 0.0% |
| $15,000 to $24,999 | 27 | 3.7% |
| $25,000 to $34,999 | 169 | 22.9% |
| $35,000 to $49,999 | 126 | 17.1% |
| $50,000 to $74,999 | 90 | 12.2% |
| $75,000 to $99,999 | 43 | 5.8% |
| $100,000 to $149,999 | 110 | 14.9% |
| $150,000 to $199,999 | 74 | 10.0% |
| $200,000+ | 23 | 3.1% |
Family Income by Famaliy Size in Baker County
6-person families (32 | 4.3%) account for the highest median family income in Baker County with $60,441 per family, while 2-person families (401 | 54.3%) have the highest median income of $24,442 per family member.

| Income Bracket | # Families | Median Income |
| 2-Person Families | 401 (54.3%) | $48,884 |
| 3-Person Families | 210 (28.4%) | $0 |
| 4-Person Families | 75 (10.2%) | $49,087 |
| 5-Person Families | 21 (2.8%) | $0 |
| 6-Person Families | 32 (4.3%) | $60,441 |
| 7+ Person Families | 0 (0.0%) | $0 |
| Total | 739 (100.0%) | $48,634 |
Family Income by Number of Earners in Baker County

| Number of Earners | # Families | Median Income |
| No Earners | 208 (28.1%) | $26,964 |
| 1 Earner | 290 (39.2%) | $47,000 |
| 2 Earners | 230 (31.1%) | $97,679 |
| 3+ Earners | 11 (1.5%) | $0 |
| Total | 739 (100.0%) | $48,634 |
Household Income in Baker County
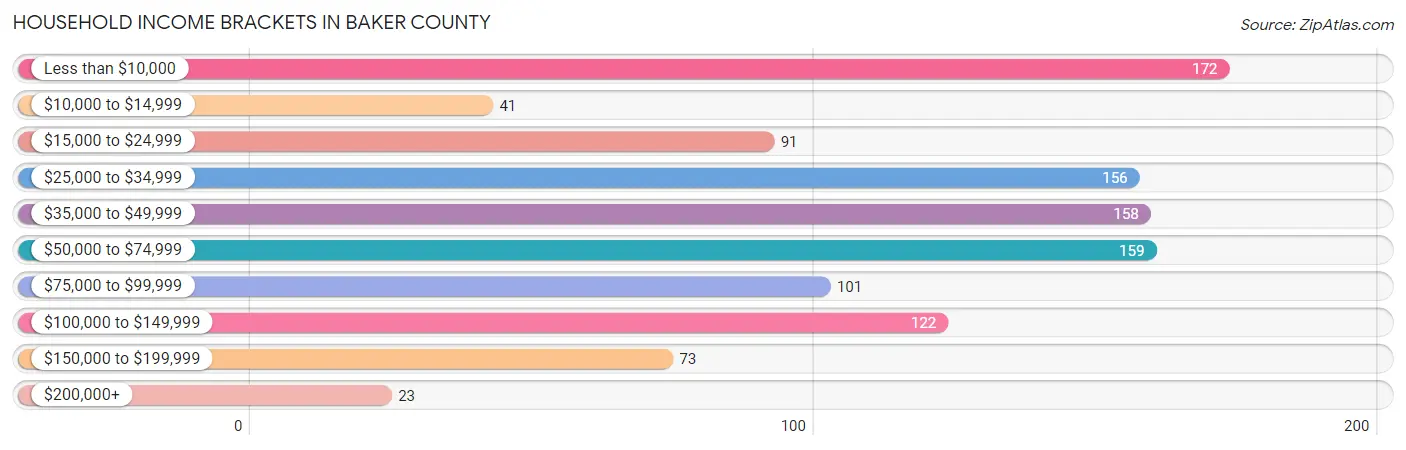
Household Income Brackets in Baker County
With 172 households falling in the category, the less than $10,000 income range is the most frequent in Baker County, accounting for 15.7% of all households. In contrast, only 23 households (2.1%) fall into the $200,000+ income bracket, making it the least populous group.
| Income Bracket | # Households | % Households |
| Less than $10,000 | 172 | 15.7% |
| $10,000 to $14,999 | 41 | 3.7% |
| $15,000 to $24,999 | 91 | 8.3% |
| $25,000 to $34,999 | 156 | 14.2% |
| $35,000 to $49,999 | 158 | 14.4% |
| $50,000 to $74,999 | 159 | 14.5% |
| $75,000 to $99,999 | 101 | 9.2% |
| $100,000 to $149,999 | 122 | 11.1% |
| $150,000 to $199,999 | 73 | 6.7% |
| $200,000+ | 23 | 2.1% |
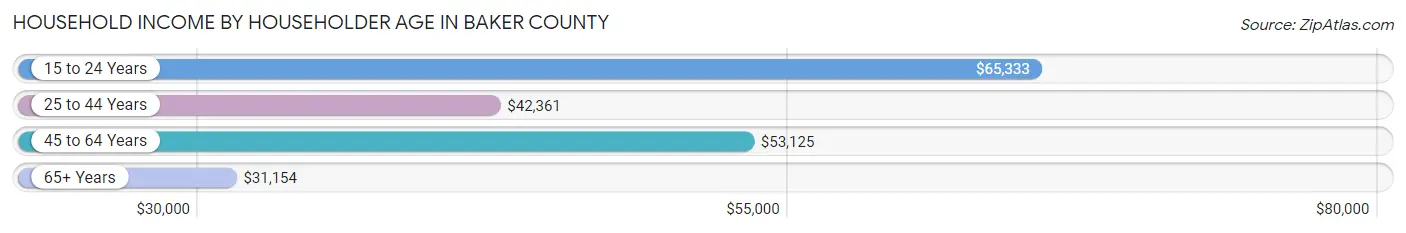
Household Income by Householder Age in Baker County
The median household income in Baker County is $45,417, with the highest median household income of $65,333 found in the 15 to 24 years age bracket for the primary householder. A total of 26 households (2.4%) fall into this category. Meanwhile, the 65+ years age bracket for the primary householder has the lowest median household income of $31,154, with 498 households (45.4%) in this group.
| Income Bracket | # Households | Median Income |
| 15 to 24 Years | 26 (2.4%) | $65,333 |
| 25 to 44 Years | 153 (14.0%) | $42,361 |
| 45 to 64 Years | 420 (38.3%) | $53,125 |
| 65+ Years | 498 (45.4%) | $31,154 |
| Total | 1,097 (100.0%) | $45,417 |
Poverty in Baker County
Income Below Poverty by Sex and Age in Baker County
With 22.1% poverty level for males and 24.2% for females among the residents of Baker County, 16 and 17 year old males and 5 year old females are the most vulnerable to poverty, with 12 males (70.6%) and 7 females (100.0%) in their respective age groups living below the poverty level.
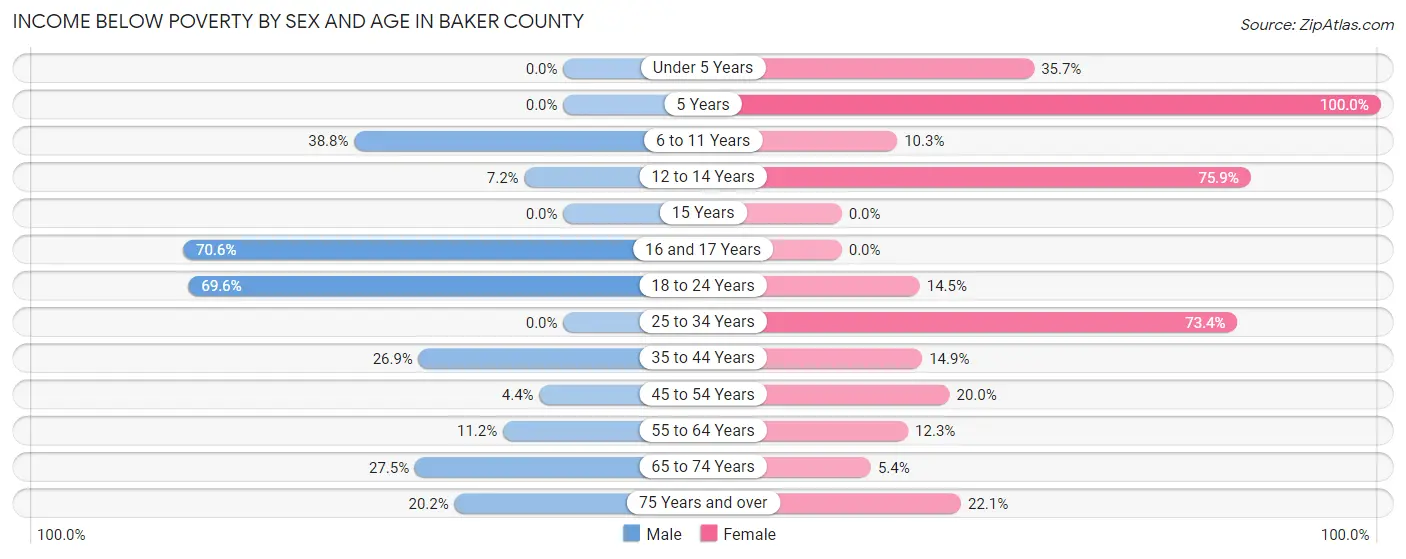
| Age Bracket | Male | Female |
| Under 5 Years | 0 (0.0%) | 15 (35.7%) |
| 5 Years | 0 (0.0%) | 7 (100.0%) |
| 6 to 11 Years | 52 (38.8%) | 7 (10.3%) |
| 12 to 14 Years | 6 (7.2%) | 22 (75.9%) |
| 15 Years | 0 (0.0%) | 0 (0.0%) |
| 16 and 17 Years | 12 (70.6%) | 0 (0.0%) |
| 18 to 24 Years | 87 (69.6%) | 21 (14.5%) |
| 25 to 34 Years | 0 (0.0%) | 152 (73.4%) |
| 35 to 44 Years | 29 (26.9%) | 20 (14.9%) |
| 45 to 54 Years | 11 (4.4%) | 38 (20.0%) |
| 55 to 64 Years | 15 (11.2%) | 25 (12.3%) |
| 65 to 74 Years | 87 (27.5%) | 12 (5.4%) |
| 75 Years and over | 21 (20.2%) | 27 (22.1%) |
| Total | 320 (22.1%) | 346 (24.2%) |
Income Above Poverty by Sex and Age in Baker County
According to the poverty statistics in Baker County, males aged under 5 years and females aged 15 years are the age groups that are most secure financially, with 100.0% of males and 100.0% of females in these age groups living above the poverty line.
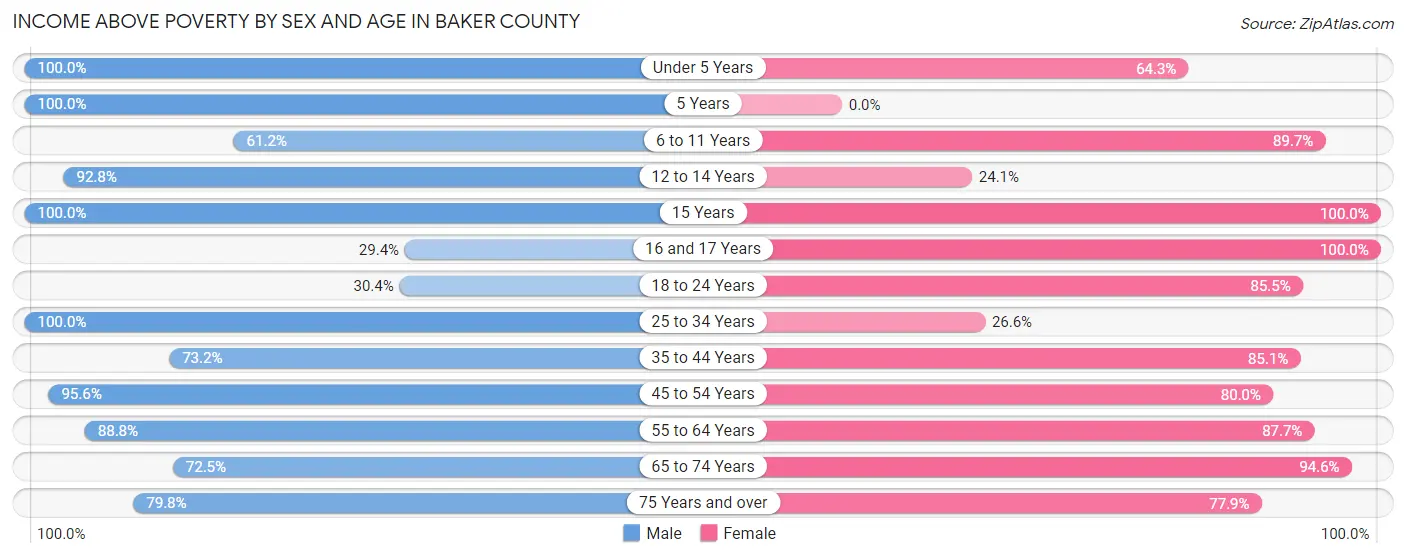
| Age Bracket | Male | Female |
| Under 5 Years | 42 (100.0%) | 27 (64.3%) |
| 5 Years | 38 (100.0%) | 0 (0.0%) |
| 6 to 11 Years | 82 (61.2%) | 61 (89.7%) |
| 12 to 14 Years | 77 (92.8%) | 7 (24.1%) |
| 15 Years | 34 (100.0%) | 24 (100.0%) |
| 16 and 17 Years | 5 (29.4%) | 35 (100.0%) |
| 18 to 24 Years | 38 (30.4%) | 124 (85.5%) |
| 25 to 34 Years | 67 (100.0%) | 55 (26.6%) |
| 35 to 44 Years | 79 (73.2%) | 114 (85.1%) |
| 45 to 54 Years | 237 (95.6%) | 152 (80.0%) |
| 55 to 64 Years | 119 (88.8%) | 178 (87.7%) |
| 65 to 74 Years | 229 (72.5%) | 210 (94.6%) |
| 75 Years and over | 83 (79.8%) | 95 (77.9%) |
| Total | 1,130 (77.9%) | 1,082 (75.8%) |
Income Below Poverty Among Married-Couple Families in Baker County
The poverty statistics for married-couple families in Baker County show that 4.9% or 24 of the total 486 families live below the poverty line. Families with no children have the highest poverty rate of 5.9%, comprising of 22 families. On the other hand, families with 3 or 4 children have the lowest poverty rate of 0.0%, which includes 0 families.

| Children | Above Poverty | Below Poverty |
| No Children | 354 (94.2%) | 22 (5.9%) |
| 1 or 2 Children | 103 (98.1%) | 2 (1.9%) |
| 3 or 4 Children | 5 (100.0%) | 0 (0.0%) |
| 5 or more Children | 0 (0.0%) | 0 (0.0%) |
| Total | 462 (95.1%) | 24 (4.9%) |
Income Below Poverty Among Single-Parent Households in Baker County
According to the poverty data in Baker County, 37.8% or 28 single-father households and 29.0% or 52 single-mother households are living below the poverty line. Among single-father households, those with 1 or 2 children have the highest poverty rate, with 16 households (64.0%) experiencing poverty. Likewise, among single-mother households, those with no children have the highest poverty rate, with 23 households (39.7%) falling below the poverty line.

| Children | Single Father | Single Mother |
| No Children | 12 (25.5%) | 23 (39.7%) |
| 1 or 2 Children | 16 (64.0%) | 12 (16.7%) |
| 3 or 4 Children | 0 (0.0%) | 17 (34.7%) |
| 5 or more Children | 0 (0.0%) | 0 (0.0%) |
| Total | 28 (37.8%) | 52 (29.0%) |
Income Below Poverty Among Married-Couple vs Single-Parent Households in Baker County
The poverty data for Baker County shows that 24 of the married-couple family households (4.9%) and 80 of the single-parent households (31.6%) are living below the poverty level. Within the married-couple family households, those with no children have the highest poverty rate, with 22 households (5.9%) falling below the poverty line. Among the single-parent households, those with no children have the highest poverty rate, with 35 household (33.3%) living below poverty.
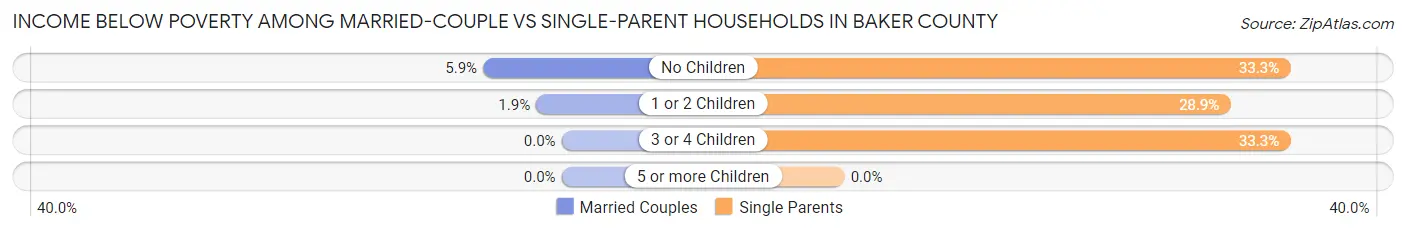
| Children | Married-Couple Families | Single-Parent Households |
| No Children | 22 (5.9%) | 35 (33.3%) |
| 1 or 2 Children | 2 (1.9%) | 28 (28.9%) |
| 3 or 4 Children | 0 (0.0%) | 17 (33.3%) |
| 5 or more Children | 0 (0.0%) | 0 (0.0%) |
| Total | 24 (4.9%) | 80 (31.6%) |
Employment Characteristics in Baker County
Employment by Class of Employer in Baker County
Among the 875 employed individuals in Baker County, private company employees (493 | 56.3%), local government employees (146 | 16.7%), and self-employed (not incorporated) (88 | 10.1%) make up the most common classes of employment.

| Employer Class | # Employees | % Employees |
| Private Company Employees | 493 | 56.3% |
| Self-Employed (Incorporated) | 48 | 5.5% |
| Self-Employed (Not Incorporated) | 88 | 10.1% |
| Not-for-profit Organizations | 62 | 7.1% |
| Local Government Employees | 146 | 16.7% |
| State Government Employees | 38 | 4.3% |
| Federal Government Employees | 0 | 0.0% |
| Unpaid Family Workers | 0 | 0.0% |
| Total | 875 | 100.0% |
Employment Status by Age in Baker County
According to the labor force statistics for Baker County, out of the total population over 16 years of age (2,377), 43.1% or 1,024 individuals are in the labor force, with 12.2% or 125 of them unemployed. The age group with the highest labor force participation rate is 45 to 54 years, with 82.2% or 360 individuals in the labor force. Within the labor force, the 45 to 54 years age range has the highest percentage of unemployed individuals, with 23.6% or 85 of them being unemployed.
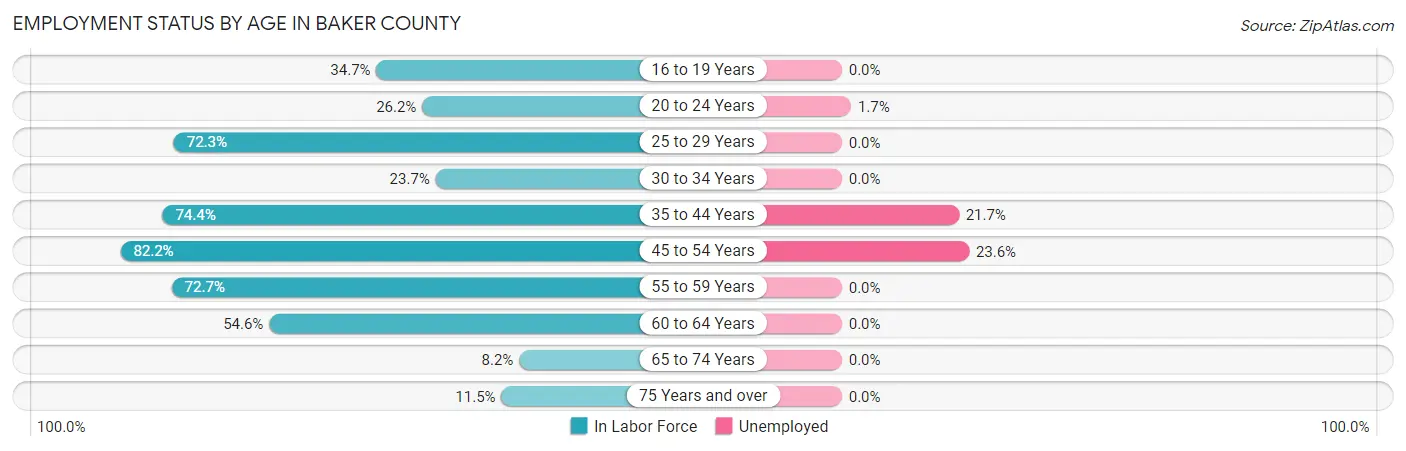
| Age Bracket | In Labor Force | Unemployed |
| 16 to 19 Years | 35 (34.7%) | 0 (0.0%) |
| 20 to 24 Years | 58 (26.2%) | 1 (1.7%) |
| 25 to 29 Years | 73 (72.3%) | 0 (0.0%) |
| 30 to 34 Years | 41 (23.7%) | 0 (0.0%) |
| 35 to 44 Years | 180 (74.4%) | 39 (21.7%) |
| 45 to 54 Years | 360 (82.2%) | 85 (23.6%) |
| 55 to 59 Years | 96 (72.7%) | 0 (0.0%) |
| 60 to 64 Years | 112 (54.6%) | 0 (0.0%) |
| 65 to 74 Years | 44 (8.2%) | 0 (0.0%) |
| 75 Years and over | 26 (11.5%) | 0 (0.0%) |
| Total | 1,024 (43.1%) | 125 (12.2%) |
Employment Status by Educational Attainment in Baker County
According to labor force statistics for Baker County, 66.8% of individuals (862) out of the total population between 25 and 64 years of age (1,291) are in the labor force, with 14.4% or 124 of them being unemployed. The group with the highest labor force participation rate are those with the educational attainment of bachelor's degree or higher, with 85.6% or 178 individuals in the labor force. Within the labor force, individuals with less than high school education have the highest percentage of unemployment, with 42.4% or 53 of them being unemployed.
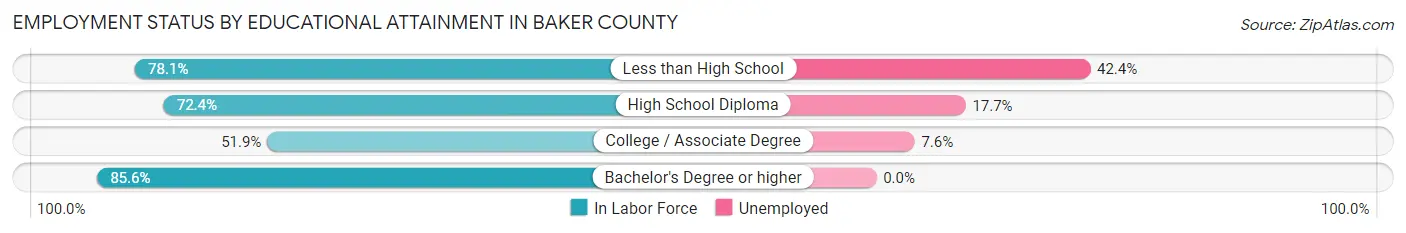
| Educational Attainment | In Labor Force | Unemployed |
| Less than High School | 125 (78.1%) | 68 (42.4%) |
| High School Diploma | 283 (72.4%) | 69 (17.7%) |
| College / Associate Degree | 276 (51.9%) | 40 (7.6%) |
| Bachelor's Degree or higher | 178 (85.6%) | 0 (0.0%) |
| Total | 862 (66.8%) | 186 (14.4%) |
Employment Occupations by Sex in Baker County
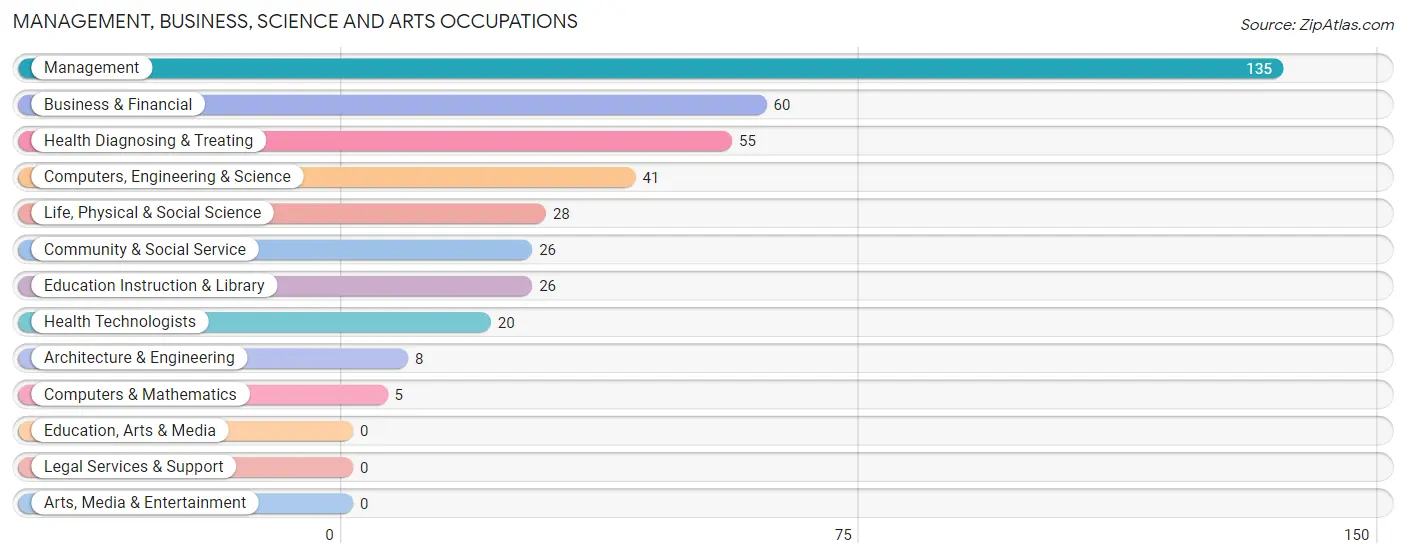
Management, Business, Science and Arts Occupations
The most common Management, Business, Science and Arts occupations in Baker County are Management (135 | 15.0%), Business & Financial (60 | 6.7%), Health Diagnosing & Treating (55 | 6.1%), Computers, Engineering & Science (41 | 4.6%), and Life, Physical & Social Science (28 | 3.1%).
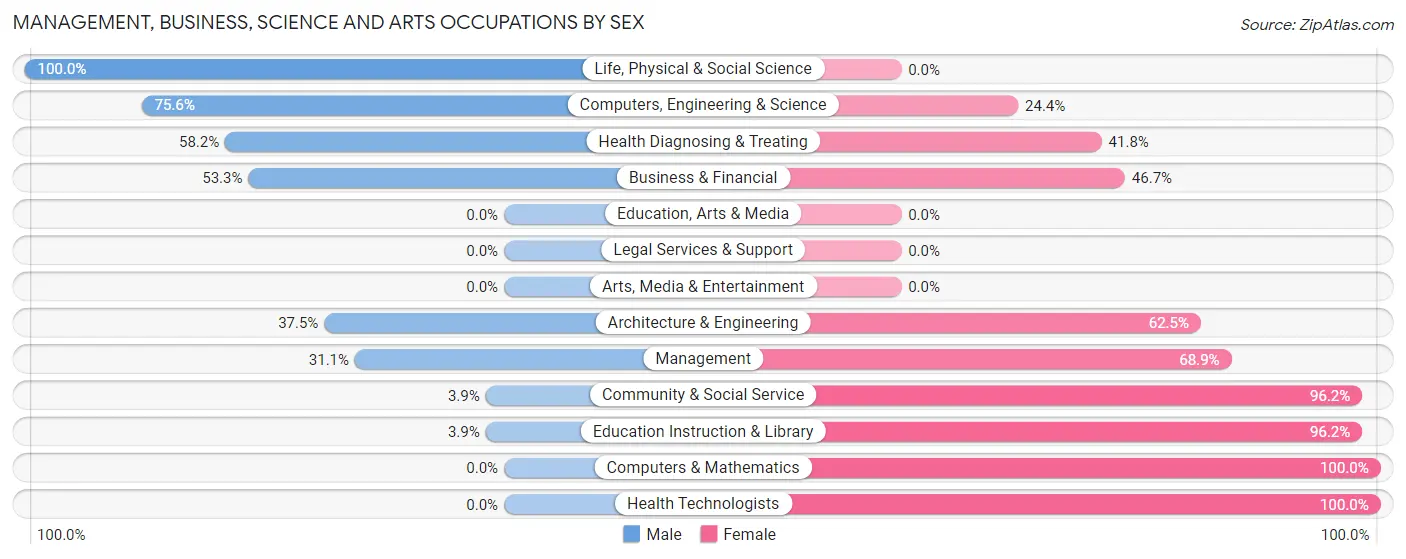
Management, Business, Science and Arts Occupations by Sex
Within the Management, Business, Science and Arts occupations in Baker County, the most male-oriented occupations are Life, Physical & Social Science (100.0%), Computers, Engineering & Science (75.6%), and Health Diagnosing & Treating (58.2%), while the most female-oriented occupations are Computers & Mathematics (100.0%), Health Technologists (100.0%), and Community & Social Service (96.2%).
| Occupation | Male | Female |
| Management | 42 (31.1%) | 93 (68.9%) |
| Business & Financial | 32 (53.3%) | 28 (46.7%) |
| Computers, Engineering & Science | 31 (75.6%) | 10 (24.4%) |
| Computers & Mathematics | 0 (0.0%) | 5 (100.0%) |
| Architecture & Engineering | 3 (37.5%) | 5 (62.5%) |
| Life, Physical & Social Science | 28 (100.0%) | 0 (0.0%) |
| Community & Social Service | 1 (3.8%) | 25 (96.2%) |
| Education, Arts & Media | 0 (0.0%) | 0 (0.0%) |
| Legal Services & Support | 0 (0.0%) | 0 (0.0%) |
| Education Instruction & Library | 1 (3.8%) | 25 (96.2%) |
| Arts, Media & Entertainment | 0 (0.0%) | 0 (0.0%) |
| Health Diagnosing & Treating | 32 (58.2%) | 23 (41.8%) |
| Health Technologists | 0 (0.0%) | 20 (100.0%) |
| Total (Category) | 138 (43.5%) | 179 (56.5%) |
| Total (Overall) | 455 (50.6%) | 445 (49.4%) |
Services Occupations
The most common Services occupations in Baker County are Cleaning & Maintenance (54 | 6.0%), Security & Protection (33 | 3.7%), Law Enforcement (33 | 3.7%), Personal Care & Service (16 | 1.8%), and Healthcare Support (14 | 1.6%).

Services Occupations by Sex
Within the Services occupations in Baker County, the most male-oriented occupations are Cleaning & Maintenance (63.0%), Security & Protection (39.4%), and Law Enforcement (39.4%), while the most female-oriented occupations are Healthcare Support (100.0%), Food Preparation & Serving (100.0%), and Personal Care & Service (100.0%).

| Occupation | Male | Female |
| Healthcare Support | 0 (0.0%) | 14 (100.0%) |
| Security & Protection | 13 (39.4%) | 20 (60.6%) |
| Firefighting & Prevention | 0 (0.0%) | 0 (0.0%) |
| Law Enforcement | 13 (39.4%) | 20 (60.6%) |
| Food Preparation & Serving | 0 (0.0%) | 9 (100.0%) |
| Cleaning & Maintenance | 34 (63.0%) | 20 (37.0%) |
| Personal Care & Service | 0 (0.0%) | 16 (100.0%) |
| Total (Category) | 47 (37.3%) | 79 (62.7%) |
| Total (Overall) | 455 (50.6%) | 445 (49.4%) |
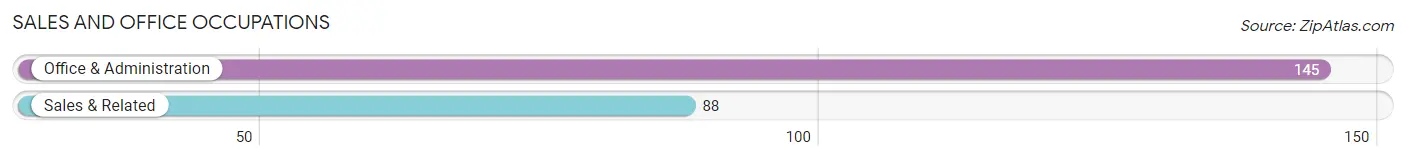
Sales and Office Occupations
The most common Sales and Office occupations in Baker County are Office & Administration (145 | 16.1%), and Sales & Related (88 | 9.8%).
Sales and Office Occupations by Sex

| Occupation | Male | Female |
| Sales & Related | 51 (58.0%) | 37 (42.0%) |
| Office & Administration | 17 (11.7%) | 128 (88.3%) |
| Total (Category) | 68 (29.2%) | 165 (70.8%) |
| Total (Overall) | 455 (50.6%) | 445 (49.4%) |
Natural Resources, Construction and Maintenance Occupations
The most common Natural Resources, Construction and Maintenance occupations in Baker County are Installation, Maintenance & Repair (57 | 6.3%), Construction & Extraction (41 | 4.6%), and Farming, Fishing & Forestry (9 | 1.0%).
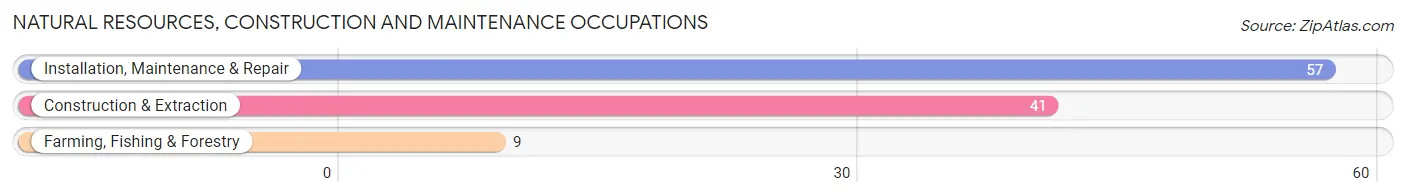
Natural Resources, Construction and Maintenance Occupations by Sex
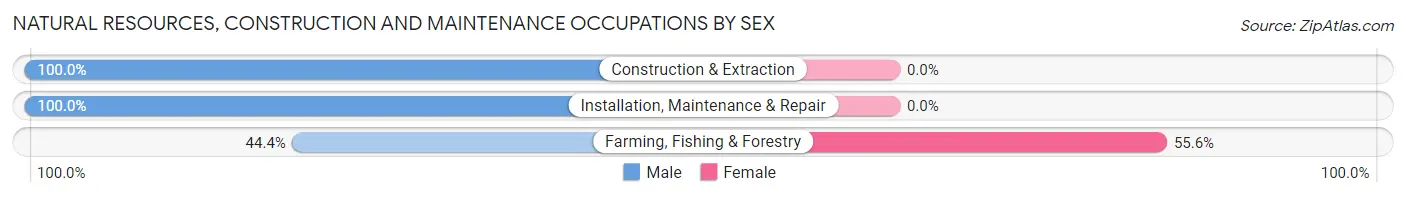
| Occupation | Male | Female |
| Farming, Fishing & Forestry | 4 (44.4%) | 5 (55.6%) |
| Construction & Extraction | 41 (100.0%) | 0 (0.0%) |
| Installation, Maintenance & Repair | 57 (100.0%) | 0 (0.0%) |
| Total (Category) | 102 (95.3%) | 5 (4.7%) |
| Total (Overall) | 455 (50.6%) | 445 (49.4%) |
Production, Transportation and Moving Occupations
The most common Production, Transportation and Moving occupations in Baker County are Transportation (73 | 8.1%), Material Moving (36 | 4.0%), and Production (8 | 0.9%).
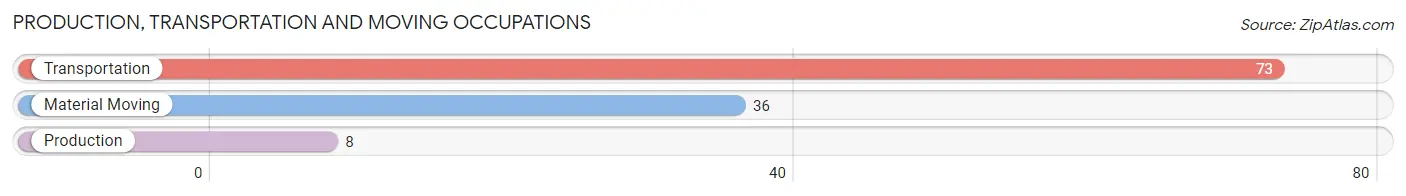
Production, Transportation and Moving Occupations by Sex
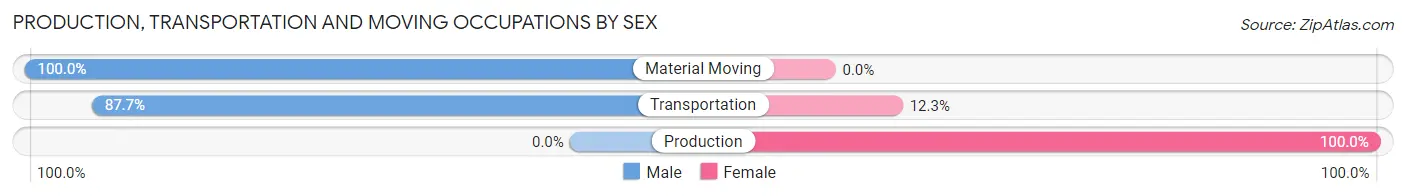
| Occupation | Male | Female |
| Production | 0 (0.0%) | 8 (100.0%) |
| Transportation | 64 (87.7%) | 9 (12.3%) |
| Material Moving | 36 (100.0%) | 0 (0.0%) |
| Total (Category) | 100 (85.5%) | 17 (14.5%) |
| Total (Overall) | 455 (50.6%) | 445 (49.4%) |
Employment Industries by Sex in Baker County
Employment Industries in Baker County
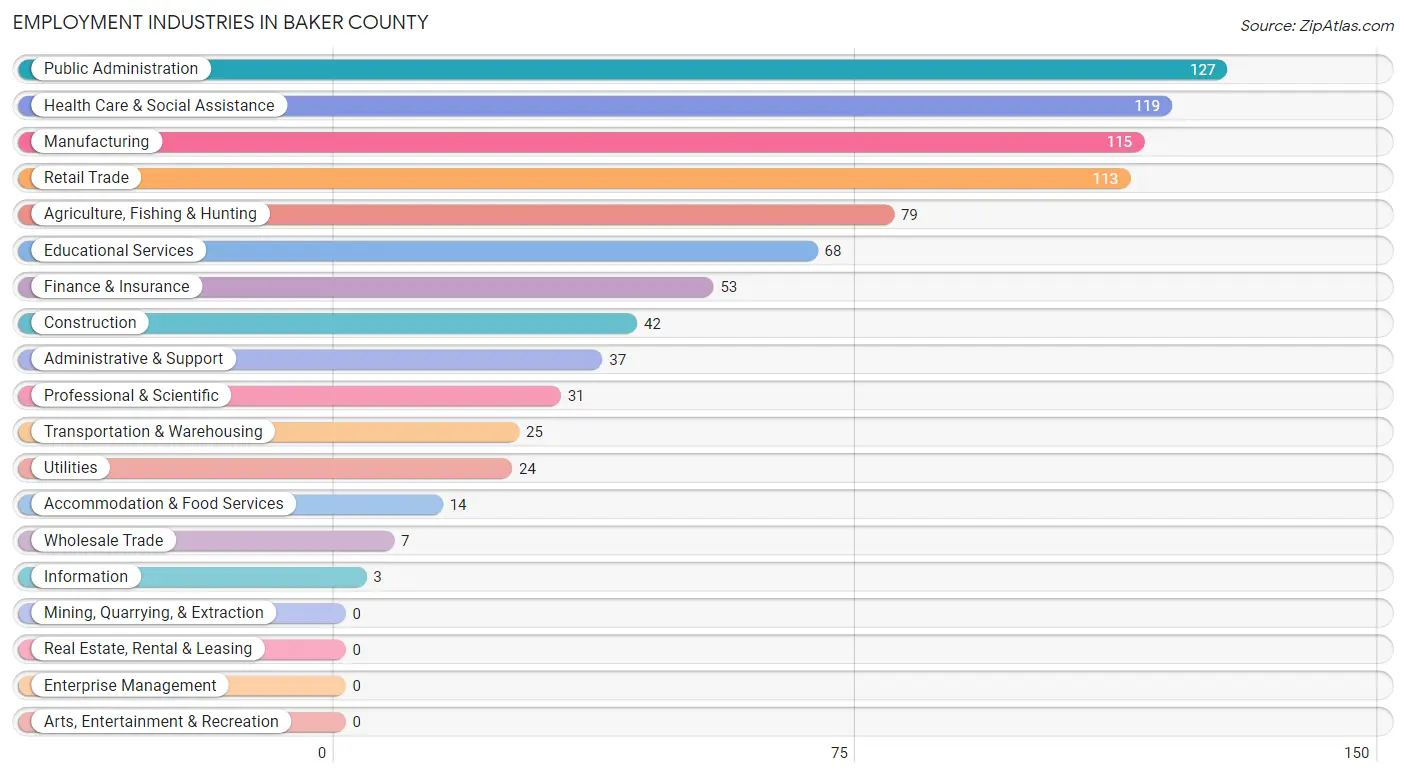
The major employment industries in Baker County include Public Administration (127 | 14.1%), Health Care & Social Assistance (119 | 13.2%), Manufacturing (115 | 12.8%), Retail Trade (113 | 12.6%), and Agriculture, Fishing & Hunting (79 | 8.8%).
Employment Industries by Sex in Baker County
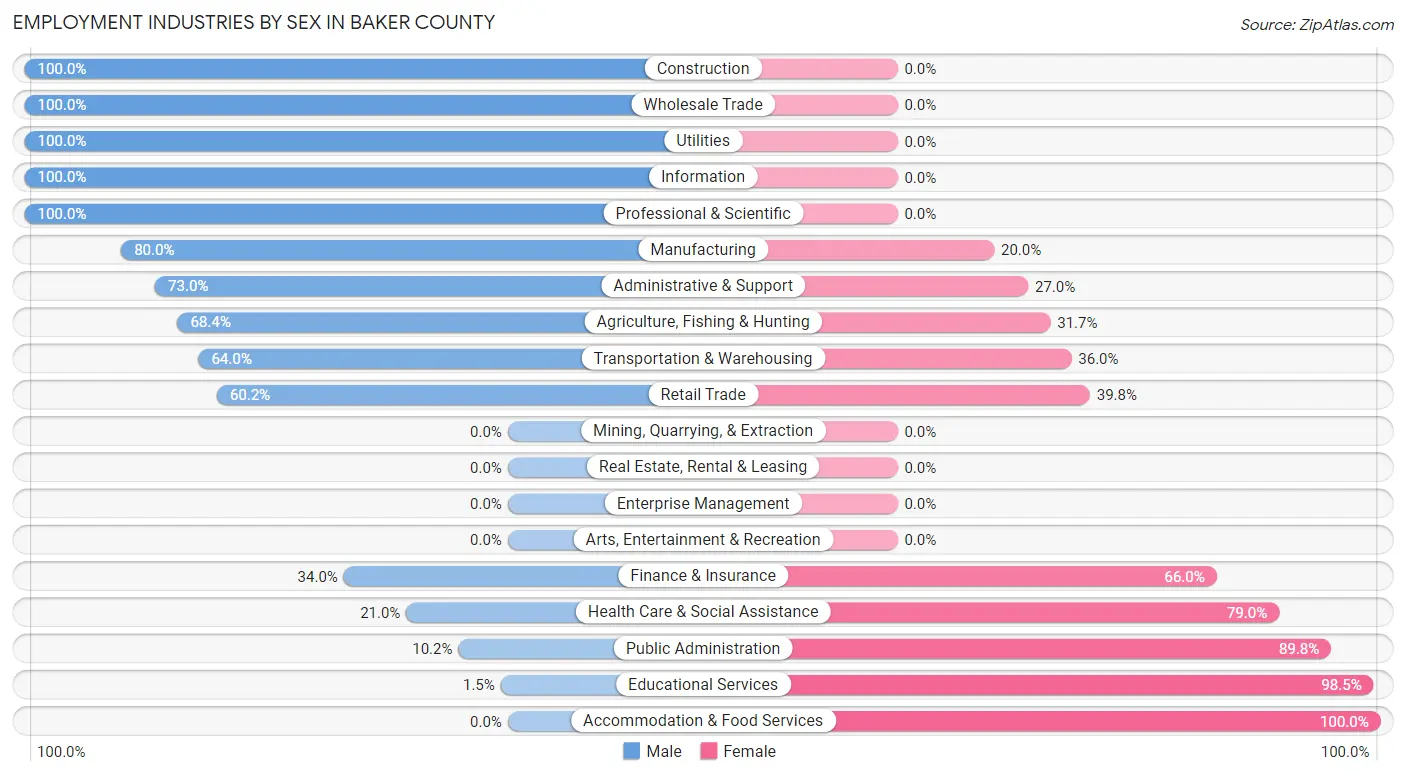
The Baker County industries that see more men than women are Construction (100.0%), Wholesale Trade (100.0%), and Utilities (100.0%), whereas the industries that tend to have a higher number of women are Accommodation & Food Services (100.0%), Educational Services (98.5%), and Public Administration (89.8%).
| Industry | Male | Female |
| Agriculture, Fishing & Hunting | 54 (68.3%) | 25 (31.7%) |
| Mining, Quarrying, & Extraction | 0 (0.0%) | 0 (0.0%) |
| Construction | 42 (100.0%) | 0 (0.0%) |
| Manufacturing | 92 (80.0%) | 23 (20.0%) |
| Wholesale Trade | 7 (100.0%) | 0 (0.0%) |
| Retail Trade | 68 (60.2%) | 45 (39.8%) |
| Transportation & Warehousing | 16 (64.0%) | 9 (36.0%) |
| Utilities | 24 (100.0%) | 0 (0.0%) |
| Information | 3 (100.0%) | 0 (0.0%) |
| Finance & Insurance | 18 (34.0%) | 35 (66.0%) |
| Real Estate, Rental & Leasing | 0 (0.0%) | 0 (0.0%) |
| Professional & Scientific | 31 (100.0%) | 0 (0.0%) |
| Enterprise Management | 0 (0.0%) | 0 (0.0%) |
| Administrative & Support | 27 (73.0%) | 10 (27.0%) |
| Educational Services | 1 (1.5%) | 67 (98.5%) |
| Health Care & Social Assistance | 25 (21.0%) | 94 (79.0%) |
| Arts, Entertainment & Recreation | 0 (0.0%) | 0 (0.0%) |
| Accommodation & Food Services | 0 (0.0%) | 14 (100.0%) |
| Public Administration | 13 (10.2%) | 114 (89.8%) |
| Total | 455 (50.6%) | 445 (49.4%) |
Education in Baker County
School Enrollment in Baker County
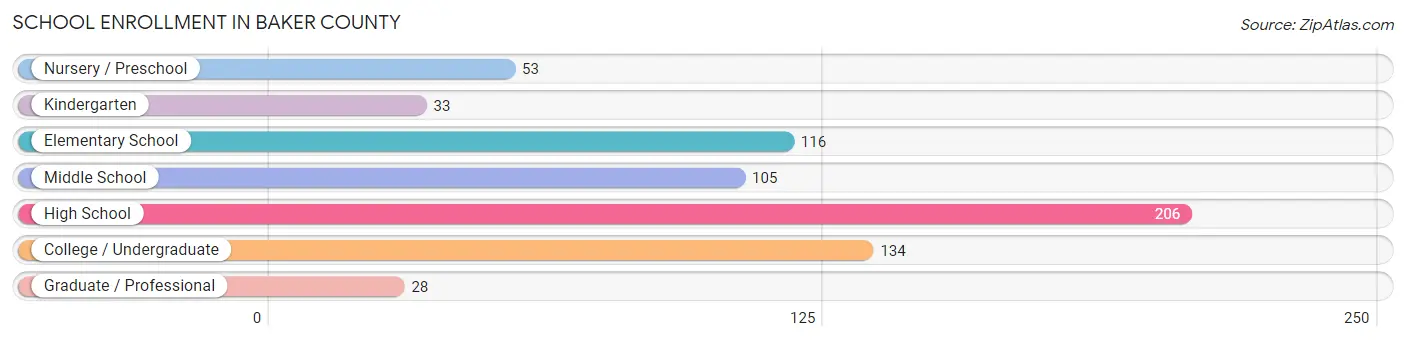
The most common levels of schooling among the 675 students in Baker County are high school (206 | 30.5%), college / undergraduate (134 | 19.9%), and elementary school (116 | 17.2%).
| School Level | # Students | % Students |
| Nursery / Preschool | 53 | 7.9% |
| Kindergarten | 33 | 4.9% |
| Elementary School | 116 | 17.2% |
| Middle School | 105 | 15.6% |
| High School | 206 | 30.5% |
| College / Undergraduate | 134 | 19.9% |
| Graduate / Professional | 28 | 4.2% |
| Total | 675 | 100.0% |
School Enrollment by Age by Funding Source in Baker County
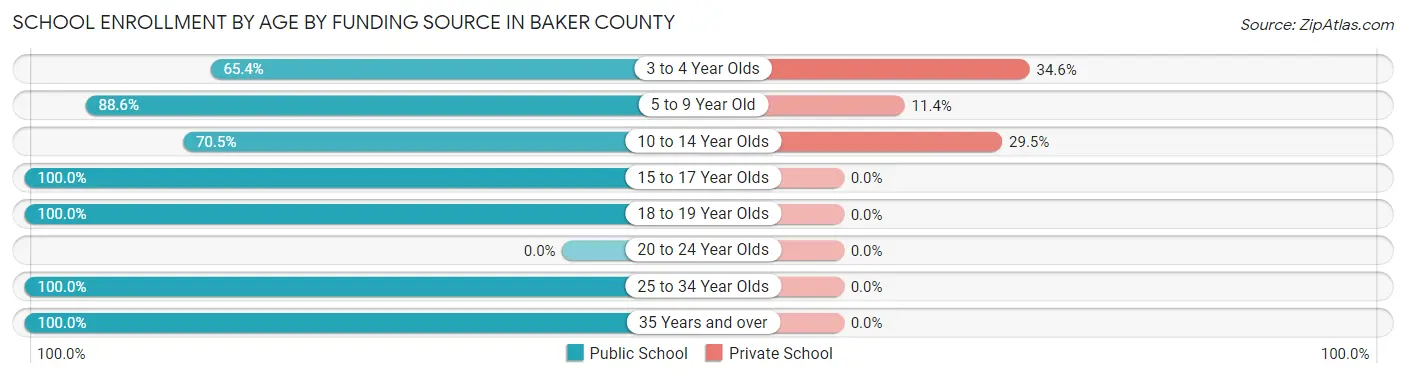
Out of a total of 675 students who are enrolled in schools in Baker County, 83 (12.3%) attend a private institution, while the remaining 592 (87.7%) are enrolled in public schools. The age group of 3 to 4 year olds has the highest likelihood of being enrolled in private schools, with 9 (34.6% in the age bracket) enrolled. Conversely, the age group of 15 to 17 year olds has the lowest likelihood of being enrolled in a private school, with 110 (100.0% in the age bracket) attending a public institution.
| Age Bracket | Public School | Private School |
| 3 to 4 Year Olds | 17 (65.4%) | 9 (34.6%) |
| 5 to 9 Year Old | 156 (88.6%) | 20 (11.4%) |
| 10 to 14 Year Olds | 129 (70.5%) | 54 (29.5%) |
| 15 to 17 Year Olds | 110 (100.0%) | 0 (0.0%) |
| 18 to 19 Year Olds | 29 (100.0%) | 0 (0.0%) |
| 20 to 24 Year Olds | 0 (0.0%) | 0 (0.0%) |
| 25 to 34 Year Olds | 85 (100.0%) | 0 (0.0%) |
| 35 Years and over | 66 (100.0%) | 0 (0.0%) |
| Total | 592 (87.7%) | 83 (12.3%) |
Educational Attainment by Field of Study in Baker County
Education (151 | 38.7%), psychology (56 | 14.4%), business (47 | 12.0%), science & technology (40 | 10.3%), and social sciences (31 | 8.0%) are the most common fields of study among 390 individuals in Baker County who have obtained a bachelor's degree or higher.

| Field of Study | # Graduates | % Graduates |
| Computers & Mathematics | 0 | 0.0% |
| Bio, Nature & Agricultural | 28 | 7.2% |
| Physical & Health Sciences | 0 | 0.0% |
| Psychology | 56 | 14.4% |
| Social Sciences | 31 | 8.0% |
| Engineering | 0 | 0.0% |
| Multidisciplinary Studies | 0 | 0.0% |
| Science & Technology | 40 | 10.3% |
| Business | 47 | 12.0% |
| Education | 151 | 38.7% |
| Literature & Languages | 25 | 6.4% |
| Liberal Arts & History | 8 | 2.1% |
| Visual & Performing Arts | 4 | 1.0% |
| Communications | 0 | 0.0% |
| Arts & Humanities | 0 | 0.0% |
| Total | 390 | 100.0% |
Transportation & Commute in Baker County
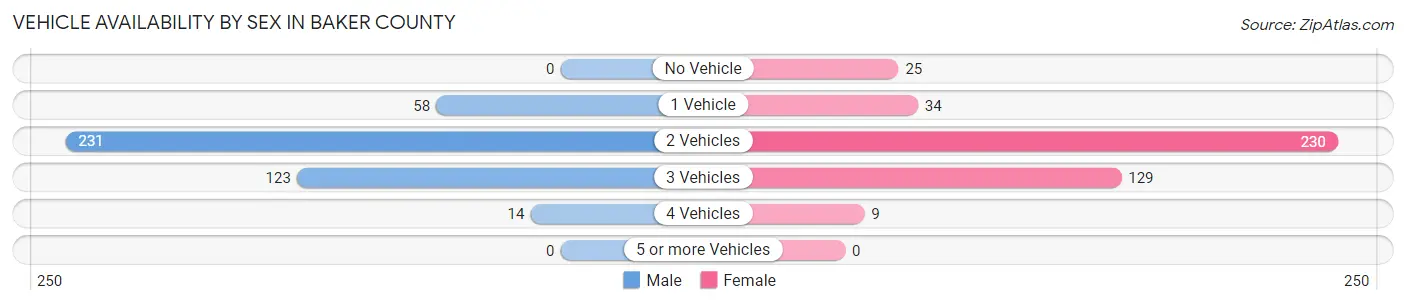
Vehicle Availability by Sex in Baker County
The most prevalent vehicle ownership categories in Baker County are males with 2 vehicles (231, accounting for 54.2%) and females with 2 vehicles (230, making up 54.1%).
| Vehicles Available | Male | Female |
| No Vehicle | 0 (0.0%) | 25 (5.9%) |
| 1 Vehicle | 58 (13.6%) | 34 (8.0%) |
| 2 Vehicles | 231 (54.2%) | 230 (53.9%) |
| 3 Vehicles | 123 (28.9%) | 129 (30.2%) |
| 4 Vehicles | 14 (3.3%) | 9 (2.1%) |
| 5 or more Vehicles | 0 (0.0%) | 0 (0.0%) |
| Total | 426 (100.0%) | 427 (100.0%) |
Commute Time in Baker County
The most frequently occuring commute durations in Baker County are 15 to 19 minutes (214 commuters, 24.8%), 20 to 24 minutes (140 commuters, 16.2%), and less than 5 minutes (104 commuters, 12.1%).

| Commute Time | # Commuters | % Commuters |
| Less than 5 Minutes | 104 | 12.1% |
| 5 to 9 Minutes | 69 | 8.0% |
| 10 to 14 Minutes | 26 | 3.0% |
| 15 to 19 Minutes | 214 | 24.8% |
| 20 to 24 Minutes | 140 | 16.2% |
| 25 to 29 Minutes | 52 | 6.0% |
| 30 to 34 Minutes | 79 | 9.2% |
| 35 to 39 Minutes | 4 | 0.5% |
| 40 to 44 Minutes | 33 | 3.8% |
| 45 to 59 Minutes | 66 | 7.7% |
| 60 to 89 Minutes | 68 | 7.9% |
| 90 or more Minutes | 7 | 0.8% |
Commute Time by Sex in Baker County
The most common commute times in Baker County are 15 to 19 minutes (116 commuters, 26.0%) for males and 15 to 19 minutes (98 commuters, 23.6%) for females.

| Commute Time | Male | Female |
| Less than 5 Minutes | 68 (15.2%) | 36 (8.7%) |
| 5 to 9 Minutes | 54 (12.1%) | 15 (3.6%) |
| 10 to 14 Minutes | 26 (5.8%) | 0 (0.0%) |
| 15 to 19 Minutes | 116 (26.0%) | 98 (23.6%) |
| 20 to 24 Minutes | 65 (14.5%) | 75 (18.1%) |
| 25 to 29 Minutes | 47 (10.5%) | 5 (1.2%) |
| 30 to 34 Minutes | 23 (5.1%) | 56 (13.5%) |
| 35 to 39 Minutes | 0 (0.0%) | 4 (1.0%) |
| 40 to 44 Minutes | 13 (2.9%) | 20 (4.8%) |
| 45 to 59 Minutes | 6 (1.3%) | 60 (14.5%) |
| 60 to 89 Minutes | 22 (4.9%) | 46 (11.1%) |
| 90 or more Minutes | 7 (1.6%) | 0 (0.0%) |
Time of Departure to Work by Sex in Baker County
The most frequent times of departure to work in Baker County are 7:00 AM to 7:29 AM (127, 28.4%) for males and 7:30 AM to 7:59 AM (91, 21.9%) for females.

| Time of Departure | Male | Female |
| 12:00 AM to 4:59 AM | 7 (1.6%) | 8 (1.9%) |
| 5:00 AM to 5:29 AM | 13 (2.9%) | 0 (0.0%) |
| 5:30 AM to 5:59 AM | 9 (2.0%) | 0 (0.0%) |
| 6:00 AM to 6:29 AM | 20 (4.5%) | 19 (4.6%) |
| 6:30 AM to 6:59 AM | 85 (19.0%) | 44 (10.6%) |
| 7:00 AM to 7:29 AM | 127 (28.4%) | 89 (21.4%) |
| 7:30 AM to 7:59 AM | 89 (19.9%) | 91 (21.9%) |
| 8:00 AM to 8:29 AM | 8 (1.8%) | 77 (18.5%) |
| 8:30 AM to 8:59 AM | 7 (1.6%) | 62 (14.9%) |
| 9:00 AM to 9:59 AM | 0 (0.0%) | 12 (2.9%) |
| 10:00 AM to 10:59 AM | 0 (0.0%) | 13 (3.1%) |
| 11:00 AM to 11:59 AM | 0 (0.0%) | 0 (0.0%) |
| 12:00 PM to 3:59 PM | 22 (4.9%) | 0 (0.0%) |
| 4:00 PM to 11:59 PM | 60 (13.4%) | 0 (0.0%) |
| Total | 447 (100.0%) | 415 (100.0%) |
Housing Occupancy in Baker County
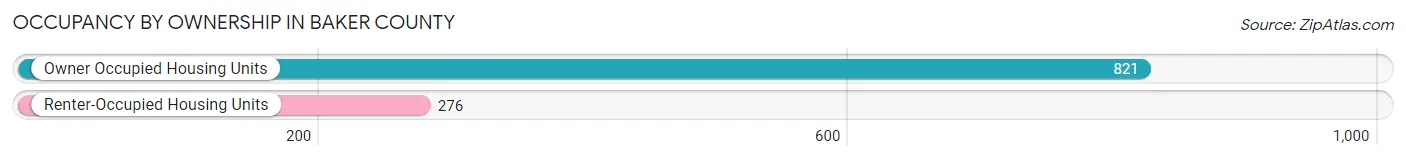
Occupancy by Ownership in Baker County
Of the total 1,097 dwellings in Baker County, owner-occupied units account for 821 (74.8%), while renter-occupied units make up 276 (25.2%).
| Occupancy | # Housing Units | % Housing Units |
| Owner Occupied Housing Units | 821 | 74.8% |
| Renter-Occupied Housing Units | 276 | 25.2% |
| Total Occupied Housing Units | 1,097 | 100.0% |
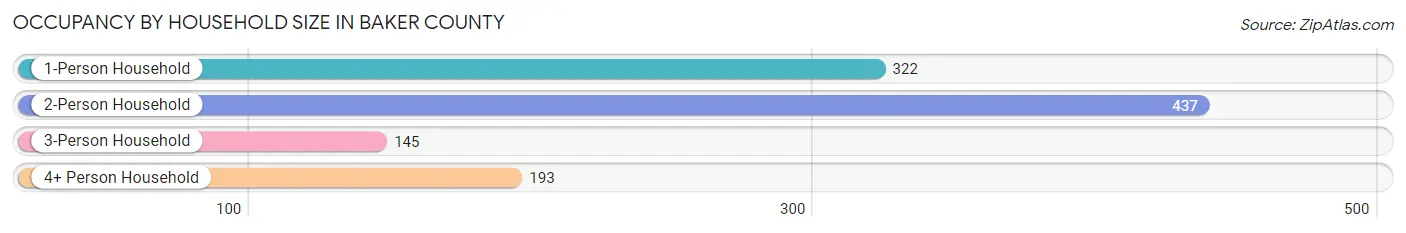
Occupancy by Household Size in Baker County
| Household Size | # Housing Units | % Housing Units |
| 1-Person Household | 322 | 29.3% |
| 2-Person Household | 437 | 39.8% |
| 3-Person Household | 145 | 13.2% |
| 4+ Person Household | 193 | 17.6% |
| Total Housing Units | 1,097 | 100.0% |
Occupancy by Ownership by Household Size in Baker County

| Household Size | Owner-occupied | Renter-occupied |
| 1-Person Household | 160 (49.7%) | 162 (50.3%) |
| 2-Person Household | 392 (89.7%) | 45 (10.3%) |
| 3-Person Household | 113 (77.9%) | 32 (22.1%) |
| 4+ Person Household | 156 (80.8%) | 37 (19.2%) |
| Total Housing Units | 821 (74.8%) | 276 (25.2%) |
Occupancy by Educational Attainment in Baker County

| Household Size | Owner-occupied | Renter-occupied |
| Less than High School | 108 (87.1%) | 16 (12.9%) |
| High School Diploma | 271 (64.2%) | 151 (35.8%) |
| College/Associate Degree | 219 (68.9%) | 99 (31.1%) |
| Bachelor's Degree or higher | 223 (95.7%) | 10 (4.3%) |
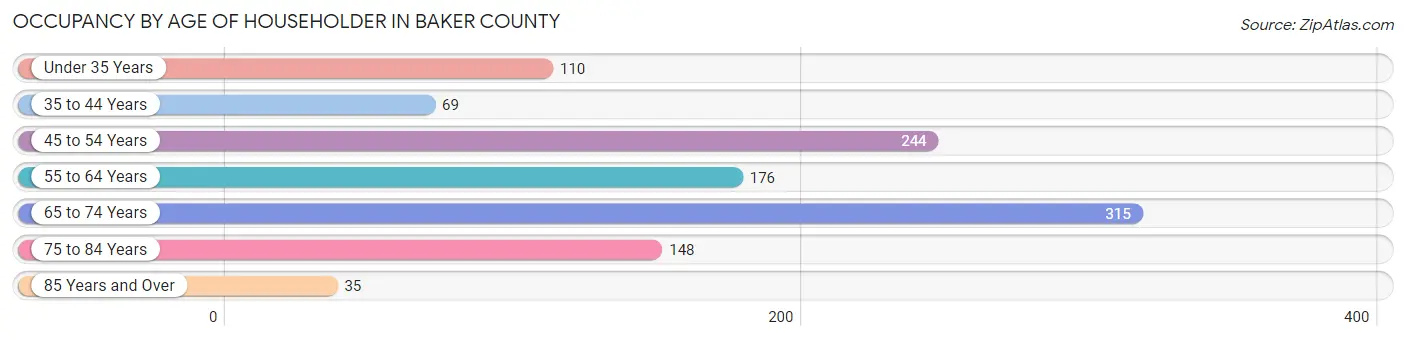
Occupancy by Age of Householder in Baker County
| Age Bracket | # Households | % Households |
| Under 35 Years | 110 | 10.0% |
| 35 to 44 Years | 69 | 6.3% |
| 45 to 54 Years | 244 | 22.2% |
| 55 to 64 Years | 176 | 16.0% |
| 65 to 74 Years | 315 | 28.7% |
| 75 to 84 Years | 148 | 13.5% |
| 85 Years and Over | 35 | 3.2% |
| Total | 1,097 | 100.0% |
Housing Finances in Baker County
Median Income by Occupancy in Baker County
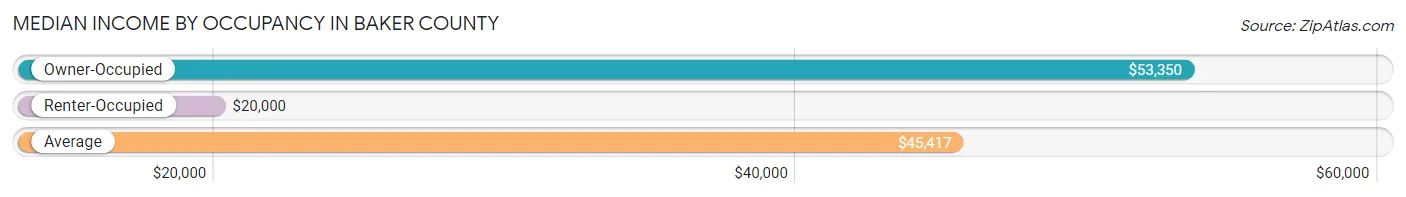
| Occupancy Type | # Households | Median Income |
| Owner-Occupied | 821 (74.8%) | $53,350 |
| Renter-Occupied | 276 (25.2%) | $20,000 |
| Average | 1,097 (100.0%) | $45,417 |
Occupancy by Householder Income Bracket in Baker County
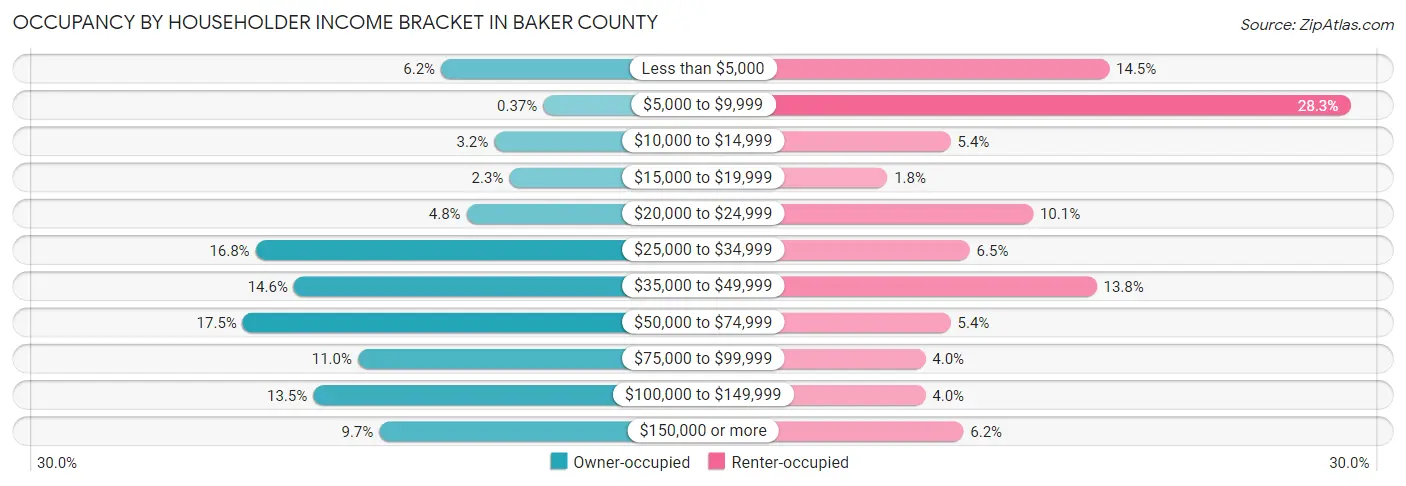
| Income Bracket | Owner-occupied | Renter-occupied |
| Less than $5,000 | 51 (6.2%) | 40 (14.5%) |
| $5,000 to $9,999 | 3 (0.4%) | 78 (28.3%) |
| $10,000 to $14,999 | 26 (3.2%) | 15 (5.4%) |
| $15,000 to $19,999 | 19 (2.3%) | 5 (1.8%) |
| $20,000 to $24,999 | 39 (4.8%) | 28 (10.1%) |
| $25,000 to $34,999 | 138 (16.8%) | 18 (6.5%) |
| $35,000 to $49,999 | 120 (14.6%) | 38 (13.8%) |
| $50,000 to $74,999 | 144 (17.5%) | 15 (5.4%) |
| $75,000 to $99,999 | 90 (11.0%) | 11 (4.0%) |
| $100,000 to $149,999 | 111 (13.5%) | 11 (4.0%) |
| $150,000 or more | 80 (9.7%) | 17 (6.2%) |
| Total | 821 (100.0%) | 276 (100.0%) |
Monthly Housing Cost Tiers in Baker County

| Monthly Cost | Owner-occupied | Renter-occupied |
| Less than $300 | 75 (9.1%) | 19 (6.9%) |
| $300 to $499 | 267 (32.5%) | 40 (14.5%) |
| $500 to $799 | 214 (26.1%) | 80 (29.0%) |
| $800 to $999 | 46 (5.6%) | 5 (1.8%) |
| $1,000 to $1,499 | 140 (17.1%) | 19 (6.9%) |
| $1,500 to $1,999 | 73 (8.9%) | 0 (0.0%) |
| $2,000 to $2,499 | 3 (0.4%) | 0 (0.0%) |
| $2,500 to $2,999 | 0 (0.0%) | 0 (0.0%) |
| $3,000 or more | 3 (0.4%) | 0 (0.0%) |
| Total | 821 (100.0%) | 276 (100.0%) |
Physical Housing Characteristics in Baker County
Housing Structures in Baker County
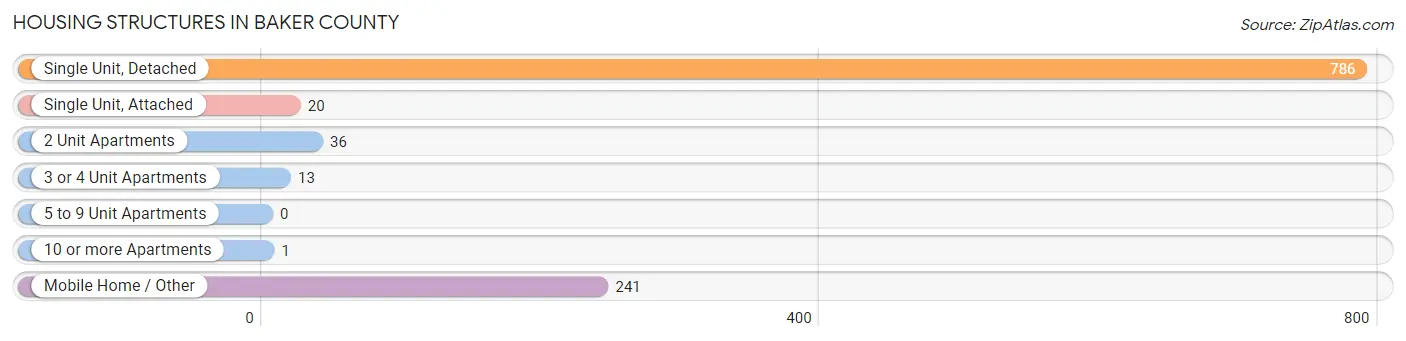
| Structure Type | # Housing Units | % Housing Units |
| Single Unit, Detached | 786 | 71.7% |
| Single Unit, Attached | 20 | 1.8% |
| 2 Unit Apartments | 36 | 3.3% |
| 3 or 4 Unit Apartments | 13 | 1.2% |
| 5 to 9 Unit Apartments | 0 | 0.0% |
| 10 or more Apartments | 1 | 0.1% |
| Mobile Home / Other | 241 | 22.0% |
| Total | 1,097 | 100.0% |
Housing Structures by Occupancy in Baker County
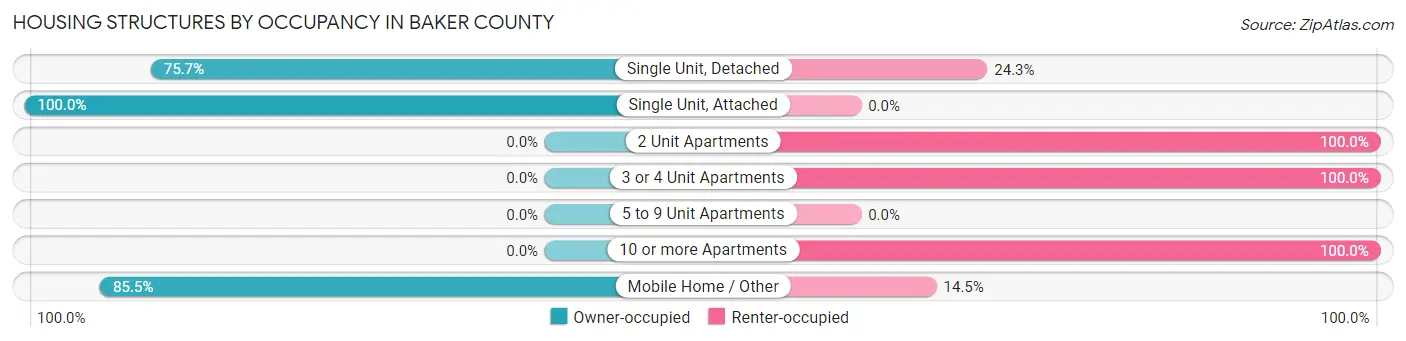
| Structure Type | Owner-occupied | Renter-occupied |
| Single Unit, Detached | 595 (75.7%) | 191 (24.3%) |
| Single Unit, Attached | 20 (100.0%) | 0 (0.0%) |
| 2 Unit Apartments | 0 (0.0%) | 36 (100.0%) |
| 3 or 4 Unit Apartments | 0 (0.0%) | 13 (100.0%) |
| 5 to 9 Unit Apartments | 0 (0.0%) | 0 (0.0%) |
| 10 or more Apartments | 0 (0.0%) | 1 (100.0%) |
| Mobile Home / Other | 206 (85.5%) | 35 (14.5%) |
| Total | 821 (74.8%) | 276 (25.2%) |
Housing Structures by Number of Rooms in Baker County

| Number of Rooms | Owner-occupied | Renter-occupied |
| 1 Room | 0 (0.0%) | 13 (4.7%) |
| 2 or 3 Rooms | 22 (2.7%) | 23 (8.3%) |
| 4 or 5 Rooms | 259 (31.6%) | 196 (71.0%) |
| 6 or 7 Rooms | 320 (39.0%) | 41 (14.9%) |
| 8 or more Rooms | 220 (26.8%) | 3 (1.1%) |
| Total | 821 (100.0%) | 276 (100.0%) |
Housing Structure by Heating Type in Baker County

| Heating Type | Owner-occupied | Renter-occupied |
| Utility Gas | 96 (11.7%) | 13 (4.7%) |
| Bottled, Tank, or LP Gas | 46 (5.6%) | 94 (34.1%) |
| Electricity | 666 (81.1%) | 169 (61.2%) |
| Fuel Oil or Kerosene | 0 (0.0%) | 0 (0.0%) |
| Coal or Coke | 0 (0.0%) | 0 (0.0%) |
| All other Fuels | 0 (0.0%) | 0 (0.0%) |
| No Fuel Used | 13 (1.6%) | 0 (0.0%) |
| Total | 821 (100.0%) | 276 (100.0%) |
Household Vehicle Usage in Baker County
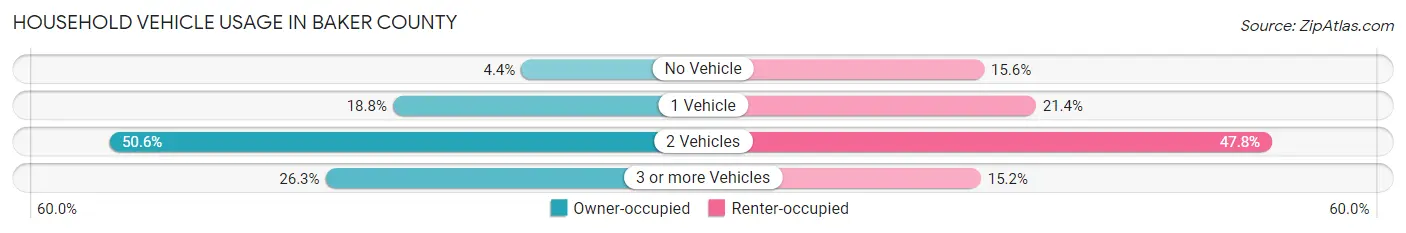
| Vehicles per Household | Owner-occupied | Renter-occupied |
| No Vehicle | 36 (4.4%) | 43 (15.6%) |
| 1 Vehicle | 154 (18.8%) | 59 (21.4%) |
| 2 Vehicles | 415 (50.5%) | 132 (47.8%) |
| 3 or more Vehicles | 216 (26.3%) | 42 (15.2%) |
| Total | 821 (100.0%) | 276 (100.0%) |
Real Estate & Mortgages in Baker County
Real Estate and Mortgage Overview in Baker County
| Characteristic | Without Mortgage | With Mortgage |
| Housing Units | 523 | 298 |
| Median Property Value | $129,900 | $95,000 |
| Median Household Income | $49,395 | $25 |
| Monthly Housing Costs | $422 | $3 |
| Real Estate Taxes | $973 | $0 |
Property Value by Mortgage Status in Baker County
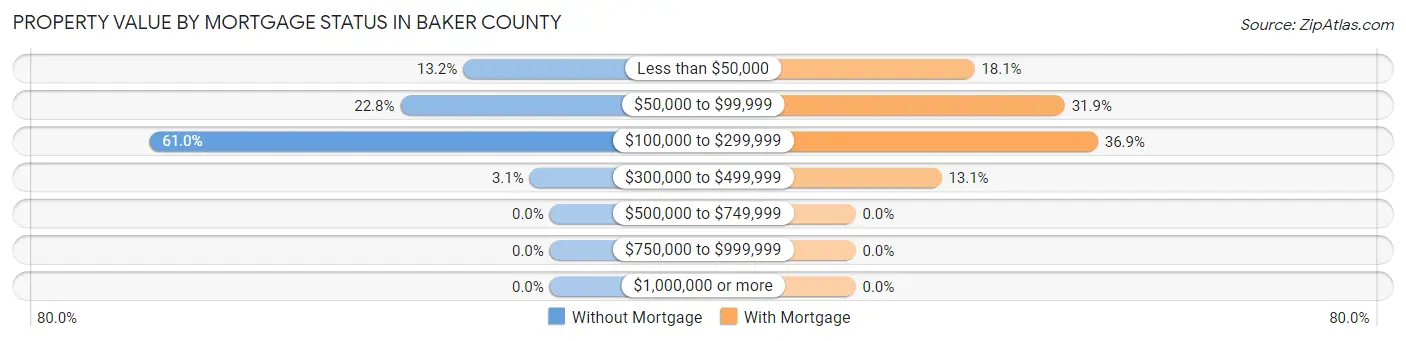
| Property Value | Without Mortgage | With Mortgage |
| Less than $50,000 | 69 (13.2%) | 54 (18.1%) |
| $50,000 to $99,999 | 119 (22.8%) | 95 (31.9%) |
| $100,000 to $299,999 | 319 (61.0%) | 110 (36.9%) |
| $300,000 to $499,999 | 16 (3.1%) | 39 (13.1%) |
| $500,000 to $749,999 | 0 (0.0%) | 0 (0.0%) |
| $750,000 to $999,999 | 0 (0.0%) | 0 (0.0%) |
| $1,000,000 or more | 0 (0.0%) | 0 (0.0%) |
| Total | 523 (100.0%) | 298 (100.0%) |
Household Income by Mortgage Status in Baker County
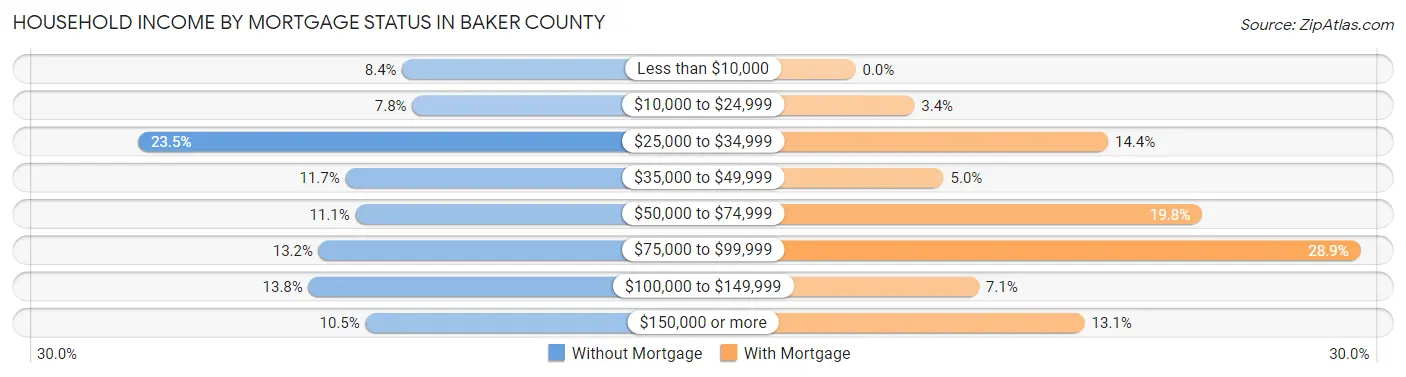
| Household Income | Without Mortgage | With Mortgage |
| Less than $10,000 | 44 (8.4%) | 0 (0.0%) |
| $10,000 to $24,999 | 41 (7.8%) | 10 (3.4%) |
| $25,000 to $34,999 | 123 (23.5%) | 43 (14.4%) |
| $35,000 to $49,999 | 61 (11.7%) | 15 (5.0%) |
| $50,000 to $74,999 | 58 (11.1%) | 59 (19.8%) |
| $75,000 to $99,999 | 69 (13.2%) | 86 (28.9%) |
| $100,000 to $149,999 | 72 (13.8%) | 21 (7.0%) |
| $150,000 or more | 55 (10.5%) | 39 (13.1%) |
| Total | 523 (100.0%) | 298 (100.0%) |
Property Value to Household Income Ratio in Baker County
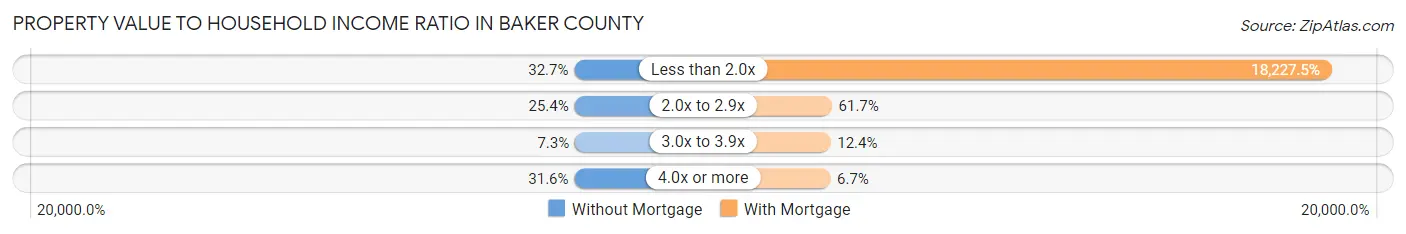
| Value-to-Income Ratio | Without Mortgage | With Mortgage |
| Less than 2.0x | 171 (32.7%) | 54,318 (18,227.5%) |
| 2.0x to 2.9x | 133 (25.4%) | 184 (61.7%) |
| 3.0x to 3.9x | 38 (7.3%) | 37 (12.4%) |
| 4.0x or more | 165 (31.6%) | 20 (6.7%) |
| Total | 523 (100.0%) | 298 (100.0%) |
Real Estate Taxes by Mortgage Status in Baker County

| Property Taxes | Without Mortgage | With Mortgage |
| Less than $800 | 184 (35.2%) | 2 (0.7%) |
| $800 to $1,499 | 194 (37.1%) | 154 (51.7%) |
| $800 to $1,499 | 120 (22.9%) | 83 (27.9%) |
| Total | 523 (100.0%) | 298 (100.0%) |
Health & Disability in Baker County
Health Insurance Coverage by Age in Baker County
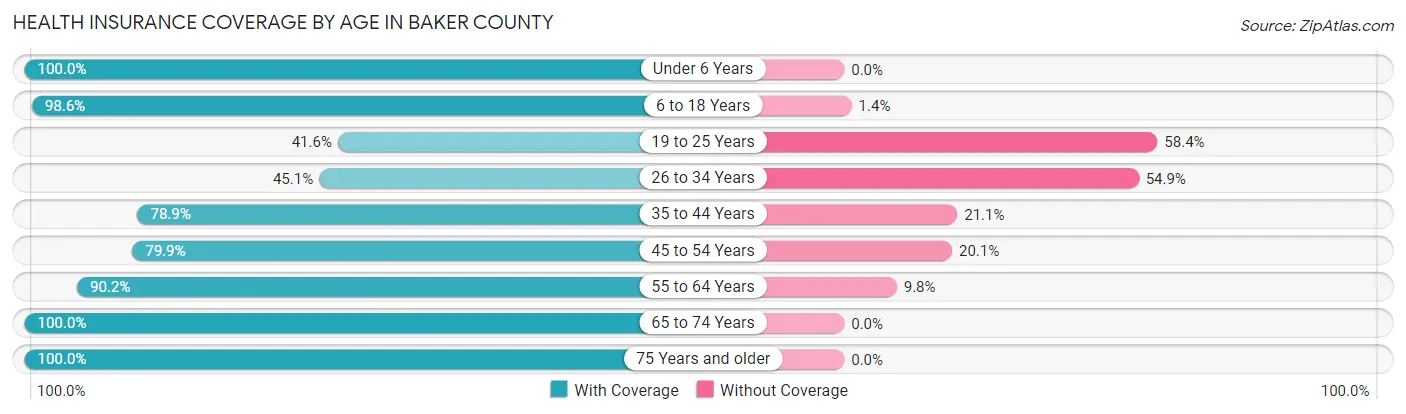
| Age Bracket | With Coverage | Without Coverage |
| Under 6 Years | 129 (100.0%) | 0 (0.0%) |
| 6 to 18 Years | 433 (98.6%) | 6 (1.4%) |
| 19 to 25 Years | 114 (41.6%) | 160 (58.4%) |
| 26 to 34 Years | 115 (45.1%) | 140 (54.9%) |
| 35 to 44 Years | 191 (78.9%) | 51 (21.1%) |
| 45 to 54 Years | 350 (79.9%) | 88 (20.1%) |
| 55 to 64 Years | 304 (90.2%) | 33 (9.8%) |
| 65 to 74 Years | 538 (100.0%) | 0 (0.0%) |
| 75 Years and older | 226 (100.0%) | 0 (0.0%) |
| Total | 2,400 (83.4%) | 478 (16.6%) |
Health Insurance Coverage by Citizenship Status in Baker County
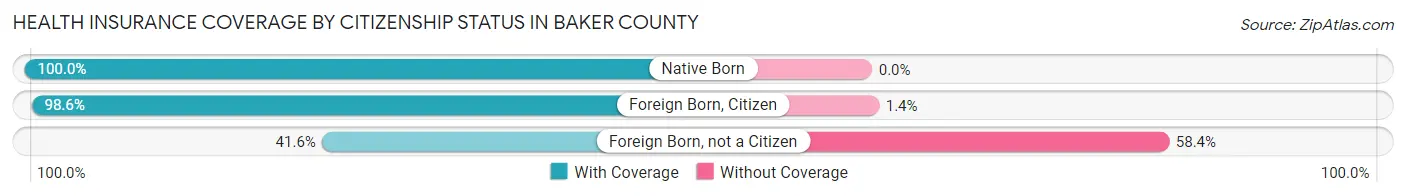
| Citizenship Status | With Coverage | Without Coverage |
| Native Born | 129 (100.0%) | 0 (0.0%) |
| Foreign Born, Citizen | 433 (98.6%) | 6 (1.4%) |
| Foreign Born, not a Citizen | 114 (41.6%) | 160 (58.4%) |
Health Insurance Coverage by Household Income in Baker County
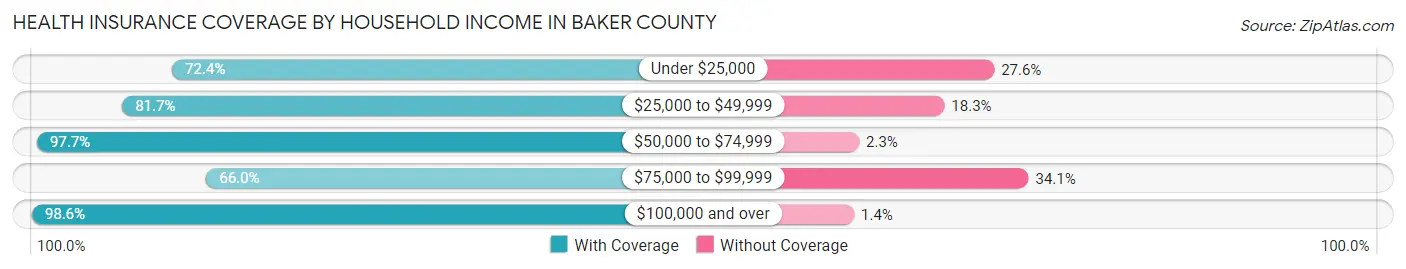
| Household Income | With Coverage | Without Coverage |
| Under $25,000 | 359 (72.4%) | 137 (27.6%) |
| $25,000 to $49,999 | 773 (81.7%) | 173 (18.3%) |
| $50,000 to $74,999 | 466 (97.7%) | 11 (2.3%) |
| $75,000 to $99,999 | 277 (65.9%) | 143 (34.1%) |
| $100,000 and over | 503 (98.6%) | 7 (1.4%) |
Public vs Private Health Insurance Coverage by Age in Baker County

| Age Bracket | Public Insurance | Private Insurance |
| Under 6 | 88 (68.2%) | 50 (38.8%) |
| 6 to 18 Years | 301 (68.6%) | 140 (31.9%) |
| 19 to 25 Years | 25 (9.1%) | 106 (38.7%) |
| 25 to 34 Years | 28 (11.0%) | 92 (36.1%) |
| 35 to 44 Years | 26 (10.7%) | 165 (68.2%) |
| 45 to 54 Years | 69 (15.8%) | 290 (66.2%) |
| 55 to 64 Years | 106 (31.5%) | 210 (62.3%) |
| 65 to 74 Years | 526 (97.8%) | 148 (27.5%) |
| 75 Years and over | 226 (100.0%) | 66 (29.2%) |
| Total | 1,395 (48.5%) | 1,267 (44.0%) |
Disability Status by Sex by Age in Baker County
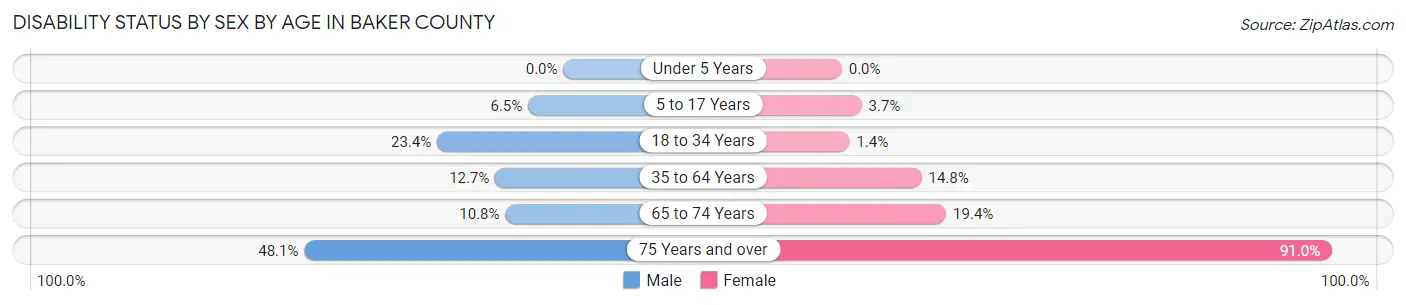
| Age Bracket | Male | Female |
| Under 5 Years | 0 (0.0%) | 0 (0.0%) |
| 5 to 17 Years | 20 (6.5%) | 6 (3.7%) |
| 18 to 34 Years | 45 (23.4%) | 5 (1.4%) |
| 35 to 64 Years | 62 (12.7%) | 78 (14.8%) |
| 65 to 74 Years | 34 (10.8%) | 43 (19.4%) |
| 75 Years and over | 50 (48.1%) | 111 (91.0%) |
Disability Class by Sex by Age in Baker County
Disability Class: Hearing Difficulty
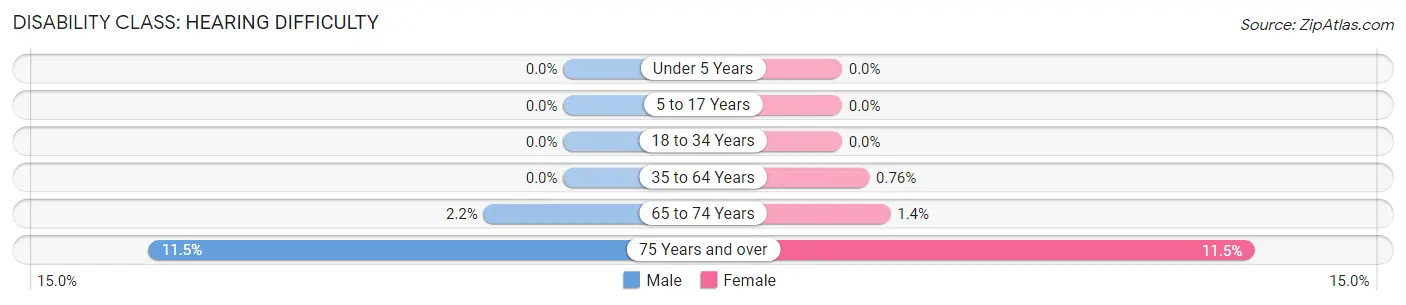
| Age Bracket | Male | Female |
| Under 5 Years | 0 (0.0%) | 0 (0.0%) |
| 5 to 17 Years | 0 (0.0%) | 0 (0.0%) |
| 18 to 34 Years | 0 (0.0%) | 0 (0.0%) |
| 35 to 64 Years | 0 (0.0%) | 4 (0.8%) |
| 65 to 74 Years | 7 (2.2%) | 3 (1.3%) |
| 75 Years and over | 12 (11.5%) | 14 (11.5%) |
Disability Class: Vision Difficulty
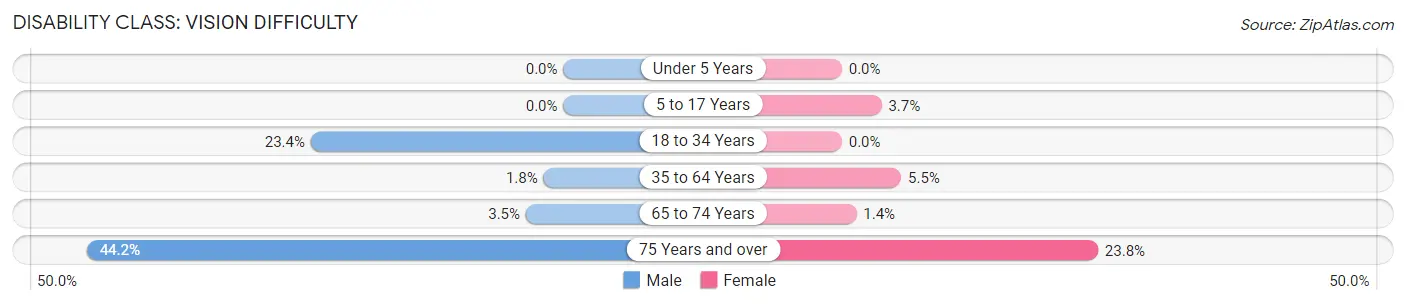
| Age Bracket | Male | Female |
| Under 5 Years | 0 (0.0%) | 0 (0.0%) |
| 5 to 17 Years | 0 (0.0%) | 6 (3.7%) |
| 18 to 34 Years | 45 (23.4%) | 0 (0.0%) |
| 35 to 64 Years | 9 (1.8%) | 29 (5.5%) |
| 65 to 74 Years | 11 (3.5%) | 3 (1.3%) |
| 75 Years and over | 46 (44.2%) | 29 (23.8%) |
Disability Class: Cognitive Difficulty
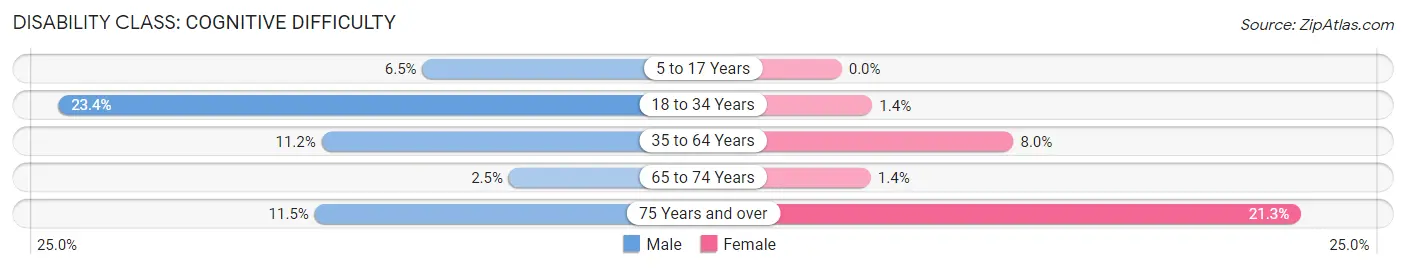
| Age Bracket | Male | Female |
| 5 to 17 Years | 20 (6.5%) | 0 (0.0%) |
| 18 to 34 Years | 45 (23.4%) | 5 (1.4%) |
| 35 to 64 Years | 55 (11.2%) | 42 (8.0%) |
| 65 to 74 Years | 8 (2.5%) | 3 (1.3%) |
| 75 Years and over | 12 (11.5%) | 26 (21.3%) |
Disability Class: Ambulatory Difficulty
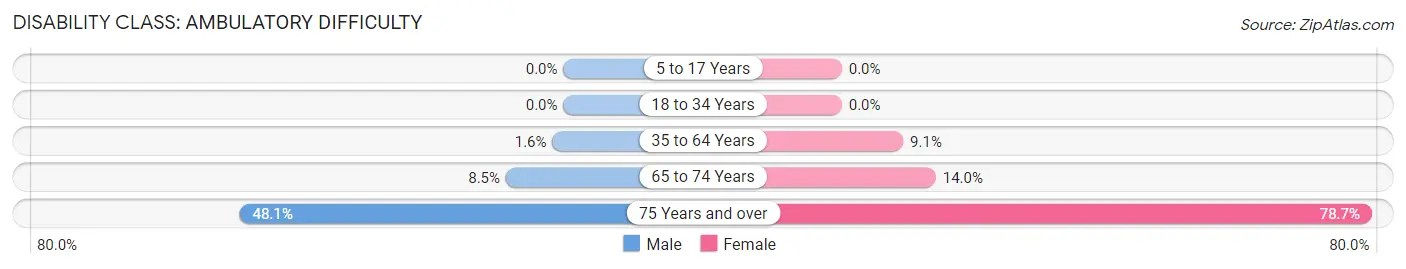
| Age Bracket | Male | Female |
| 5 to 17 Years | 0 (0.0%) | 0 (0.0%) |
| 18 to 34 Years | 0 (0.0%) | 0 (0.0%) |
| 35 to 64 Years | 8 (1.6%) | 48 (9.1%) |
| 65 to 74 Years | 27 (8.5%) | 31 (14.0%) |
| 75 Years and over | 50 (48.1%) | 96 (78.7%) |
Disability Class: Self-Care Difficulty
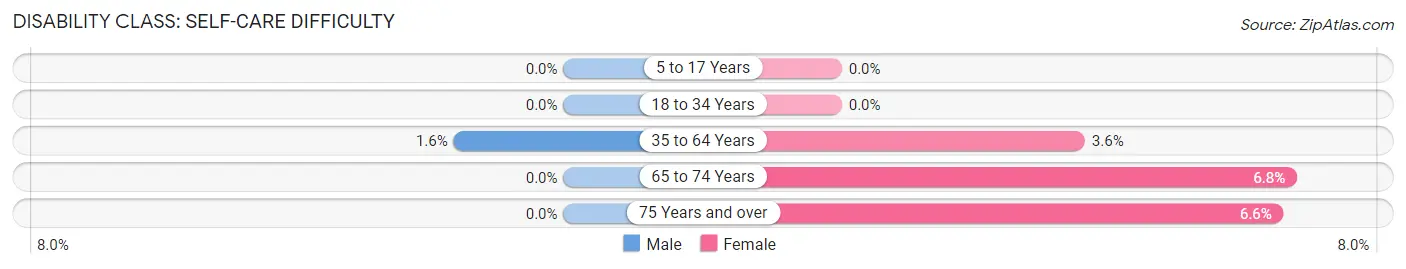
| Age Bracket | Male | Female |
| 5 to 17 Years | 0 (0.0%) | 0 (0.0%) |
| 18 to 34 Years | 0 (0.0%) | 0 (0.0%) |
| 35 to 64 Years | 8 (1.6%) | 19 (3.6%) |
| 65 to 74 Years | 0 (0.0%) | 15 (6.8%) |
| 75 Years and over | 0 (0.0%) | 8 (6.6%) |
Technology Access in Baker County
Computing Device Access in Baker County
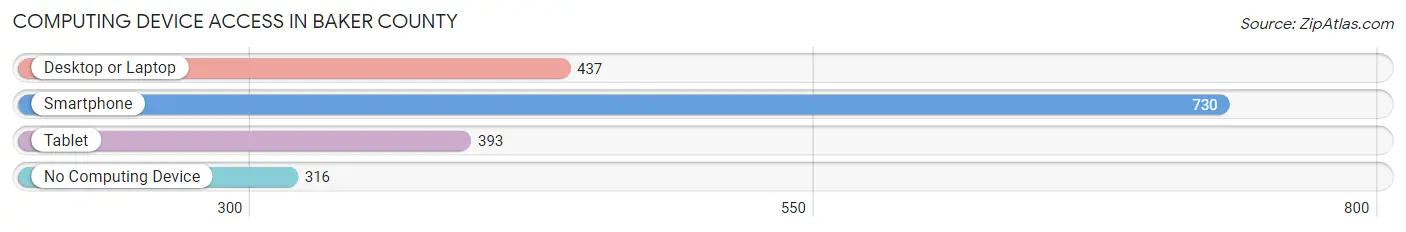
| Device Type | # Households | % Households |
| Desktop or Laptop | 437 | 39.8% |
| Smartphone | 730 | 66.5% |
| Tablet | 393 | 35.8% |
| No Computing Device | 316 | 28.8% |
| Total | 1,097 | 100.0% |
Internet Access in Baker County
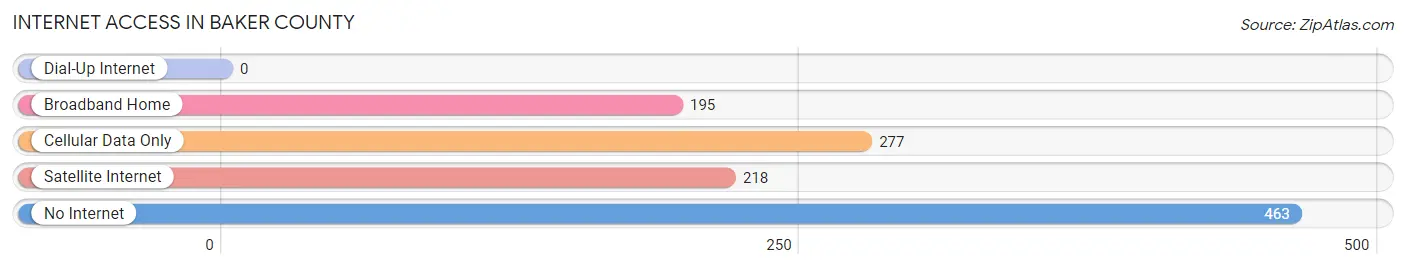
| Internet Type | # Households | % Households |
| Dial-Up Internet | 0 | 0.0% |
| Broadband Home | 195 | 17.8% |
| Cellular Data Only | 277 | 25.3% |
| Satellite Internet | 218 | 19.9% |
| No Internet | 463 | 42.2% |
| Total | 1,097 | 100.0% |
Baker County Summary
Baker County is located in the south-central part of the state of Georgia, in the United States. It is bordered by Mitchell County to the north, Decatur County to the east, Miller County to the south, and Early County to the west. The county seat is Newton, and the largest city is Albany. As of the 2010 census, the population was 13,451.
History
Baker County was created in 1825 from parts of Early and Decatur counties. It was named for Colonel John Baker, a Revolutionary War hero who fought in the Battle of Kettle Creek. The county was originally part of the Creek Nation, and the area was home to many Native American tribes.
In the early 19th century, the area was settled by European-American settlers, mostly from the Carolinas and Georgia. The county was developed for cotton plantations, and the economy was based on slave labor. After the Civil War, the economy shifted to small-scale farming.
Geography
Baker County covers an area of 441 square miles, of which 439 square miles is land and 2 square miles is water. The county is located in the Flint River basin, and is mostly flat with some rolling hills. The highest point in the county is located at an elevation of 545 feet.
The county is home to several rivers and streams, including the Flint River, the Ocmulgee River, and the Kinchafoonee Creek. The county is also home to several lakes, including Lake Blackshear, Lake Chehaw, and Lake Worth.
Economy
The economy of Baker County is largely based on agriculture. The county is home to several large farms, and the main crops grown are cotton, corn, peanuts, and soybeans. The county is also home to several timber companies, and the timber industry is an important part of the local economy.
The county is home to several manufacturing companies, including a paper mill, a furniture factory, and a plastics plant. The county is also home to several retail stores, restaurants, and other businesses.
Demographics
As of the 2010 census, there were 13,451 people, 4,945 households, and 3,541 families living in the county. The population density was 30.5 people per square mile. The racial makeup of the county was 63.3% White, 32.2% African American, 0.4% Native American, 0.3% Asian, 0.1% Pacific Islander, 2.2% from other races, and 1.5% from two or more races. Hispanic or Latino of any race were 4.2% of the population.
The median income for a household in the county was $30,945, and the median income for a family was $37,945. The per capita income for the county was $15,945. About 19.3% of the population was below the poverty line.
Conclusion
Baker County is located in the south-central part of the state of Georgia. It was created in 1825 and named for a Revolutionary War hero. The county is mostly flat with some rolling hills, and is home to several rivers and streams. The economy is largely based on agriculture, and the county is also home to several manufacturing companies. As of the 2010 census, the population was 13,451, with a median income of $30,945.
Common Questions
What is the Total Population of Baker County?
Total Population of Baker County is 2,878.
What is the Total Male Population of Baker County?
Total Male Population of Baker County is 1,450.
What is the Total Female Population of Baker County?
Total Female Population of Baker County is 1,428.
What is the Ratio of Males per 100 Females in Baker County?
There are 101.54 Males per 100 Females in Baker County.
What is the Ratio of Females per 100 Males in Baker County?
There are 98.48 Females per 100 Males in Baker County.
What is the Median Population Age in Baker County?
Median Population Age in Baker County is 47.0 Years.
What is the Average Family Size in Baker County
Average Family Size in Baker County is 3.2 People.
What is the Average Household Size in Baker County
Average Household Size in Baker County is 2.6 People.
What is Per Capita Income in Baker County?
Per Capita income in Baker County is $23,731.
What is the Median Family Income in Baker County?
Median Family Income in Baker County is $48,634.
What is the Median Household income in Baker County?
Median Household Income in Baker County is $45,417.
What is Income or Wage Gap in Baker County?
Income or Wage Gap in Baker County is 27.7%.
Women in Baker County earn 72.3 cents for every dollar earned by a man.
What is Inequality or Gini Index in Baker County?
Inequality or Gini Index in Baker County is 0.46.
How Large is the Labor Force in Baker County?
There are 1,024 People in the Labor Forcein in Baker County.
What is the Percentage of People in the Labor Force in Baker County?
43.1% of People are in the Labor Force in Baker County.
What is the Unemployment Rate in Baker County?
Unemployment Rate in Baker County is 12.2%.