Byron, GA
Byron Map
Byron Overview
5,687
TOTAL POPULATION
2,781
MALE POPULATION
2,906
FEMALE POPULATION
95.70
MALES / 100 FEMALES
104.49
FEMALES / 100 MALES
36.0
MEDIAN AGE
3.2
AVG FAMILY SIZE
2.8
AVG HOUSEHOLD SIZE
$33,398
PER CAPITA INCOME
$97,640
AVG FAMILY INCOME
$83,996
AVG HOUSEHOLD INCOME
0.41
INEQUALITY / GINI INDEX
2,920
LABOR FORCE [ PEOPLE ]
66.4%
PERCENT IN LABOR FORCE
3.4%
UNEMPLOYMENT RATE
Byron Zip Codes
Byron Area Codes
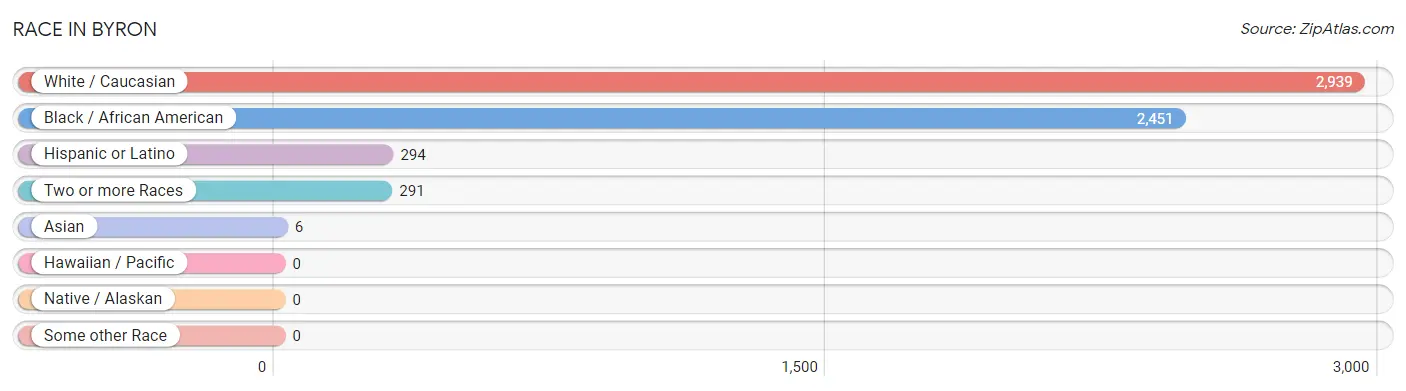
Race in Byron
The most populous races in Byron are White / Caucasian (2,939 | 51.7%), Black / African American (2,451 | 43.1%), and Hispanic or Latino (294 | 5.2%).
| Race | # Population | % Population |
| Asian | 6 | 0.1% |
| Black / African American | 2,451 | 43.1% |
| Hawaiian / Pacific | 0 | 0.0% |
| Hispanic or Latino | 294 | 5.2% |
| Native / Alaskan | 0 | 0.0% |
| White / Caucasian | 2,939 | 51.7% |
| Two or more Races | 291 | 5.1% |
| Some other Race | 0 | 0.0% |
| Total | 5,687 | 100.0% |
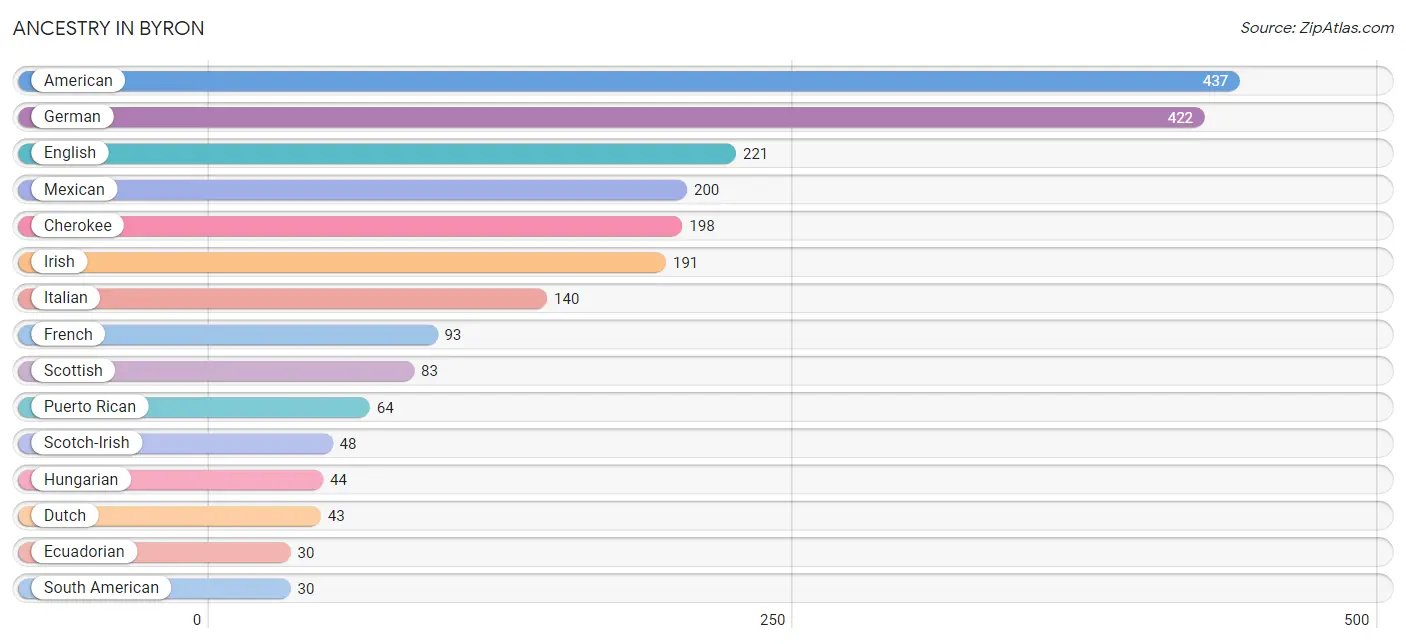
Ancestry in Byron
The most populous ancestries reported in Byron are American (437 | 7.7%), German (422 | 7.4%), English (221 | 3.9%), Mexican (200 | 3.5%), and Cherokee (198 | 3.5%), together accounting for 26.0% of all Byron residents.
| Ancestry | # Population | % Population |
| American | 437 | 7.7% |
| Arab | 6 | 0.1% |
| Burmese | 6 | 0.1% |
| Cherokee | 198 | 3.5% |
| Comanche | 29 | 0.5% |
| Dutch | 43 | 0.8% |
| Ecuadorian | 30 | 0.5% |
| English | 221 | 3.9% |
| French | 93 | 1.6% |
| German | 422 | 7.4% |
| Hungarian | 44 | 0.8% |
| Irish | 191 | 3.4% |
| Italian | 140 | 2.5% |
| Mexican | 200 | 3.5% |
| Puerto Rican | 64 | 1.1% |
| Scotch-Irish | 48 | 0.8% |
| Scottish | 83 | 1.5% |
| South American | 30 | 0.5% |
| Syrian | 6 | 0.1% | View All 19 Rows |
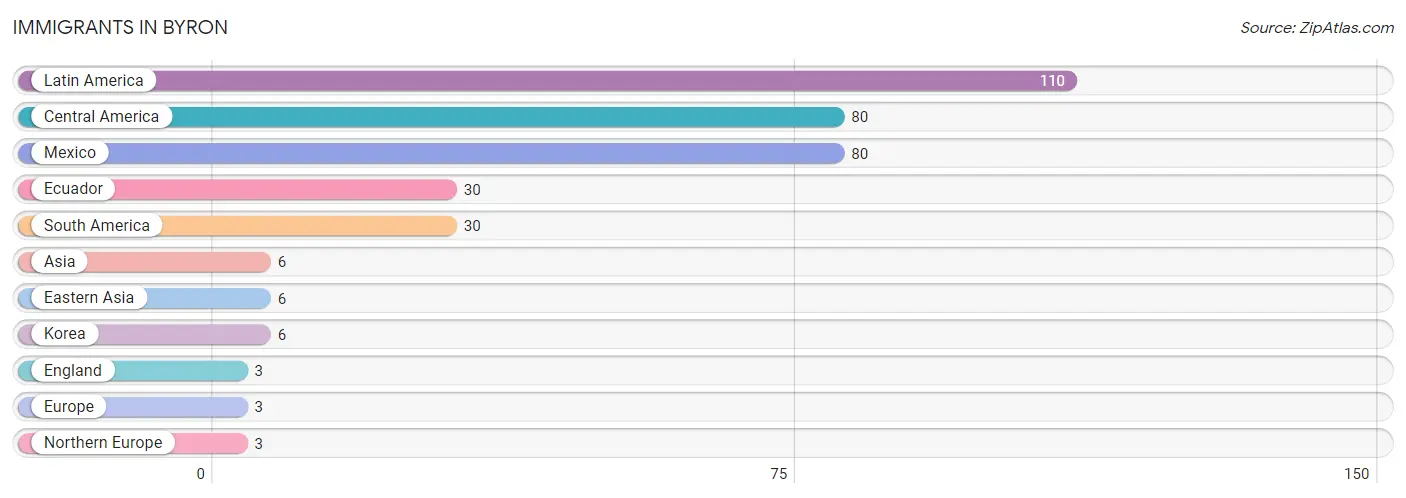
Immigrants in Byron
The most numerous immigrant groups reported in Byron came from Latin America (110 | 1.9%), Central America (80 | 1.4%), Mexico (80 | 1.4%), Ecuador (30 | 0.5%), and South America (30 | 0.5%), together accounting for 5.8% of all Byron residents.
| Immigration Origin | # Population | % Population |
| Asia | 6 | 0.1% |
| Central America | 80 | 1.4% |
| Eastern Asia | 6 | 0.1% |
| Ecuador | 30 | 0.5% |
| England | 3 | 0.1% |
| Europe | 3 | 0.1% |
| Korea | 6 | 0.1% |
| Latin America | 110 | 1.9% |
| Mexico | 80 | 1.4% |
| Northern Europe | 3 | 0.1% |
| South America | 30 | 0.5% | View All 11 Rows |
Sex and Age in Byron
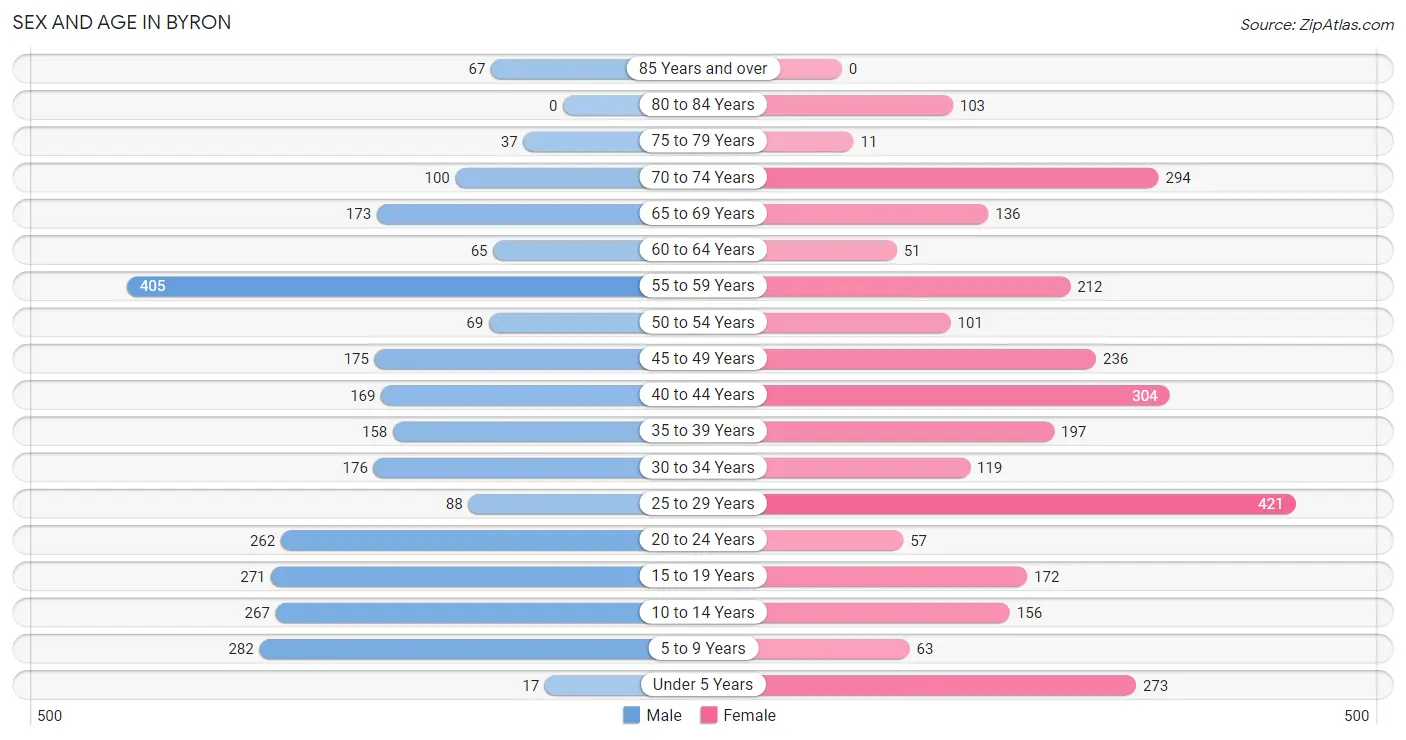
Sex and Age in Byron
The most populous age groups in Byron are 55 to 59 Years (405 | 14.6%) for men and 25 to 29 Years (421 | 14.5%) for women.
| Age Bracket | Male | Female |
| Under 5 Years | 17 (0.6%) | 273 (9.4%) |
| 5 to 9 Years | 282 (10.1%) | 63 (2.2%) |
| 10 to 14 Years | 267 (9.6%) | 156 (5.4%) |
| 15 to 19 Years | 271 (9.7%) | 172 (5.9%) |
| 20 to 24 Years | 262 (9.4%) | 57 (2.0%) |
| 25 to 29 Years | 88 (3.2%) | 421 (14.5%) |
| 30 to 34 Years | 176 (6.3%) | 119 (4.1%) |
| 35 to 39 Years | 158 (5.7%) | 197 (6.8%) |
| 40 to 44 Years | 169 (6.1%) | 304 (10.5%) |
| 45 to 49 Years | 175 (6.3%) | 236 (8.1%) |
| 50 to 54 Years | 69 (2.5%) | 101 (3.5%) |
| 55 to 59 Years | 405 (14.6%) | 212 (7.3%) |
| 60 to 64 Years | 65 (2.3%) | 51 (1.8%) |
| 65 to 69 Years | 173 (6.2%) | 136 (4.7%) |
| 70 to 74 Years | 100 (3.6%) | 294 (10.1%) |
| 75 to 79 Years | 37 (1.3%) | 11 (0.4%) |
| 80 to 84 Years | 0 (0.0%) | 103 (3.5%) |
| 85 Years and over | 67 (2.4%) | 0 (0.0%) |
| Total | 2,781 (100.0%) | 2,906 (100.0%) |
Families and Households in Byron
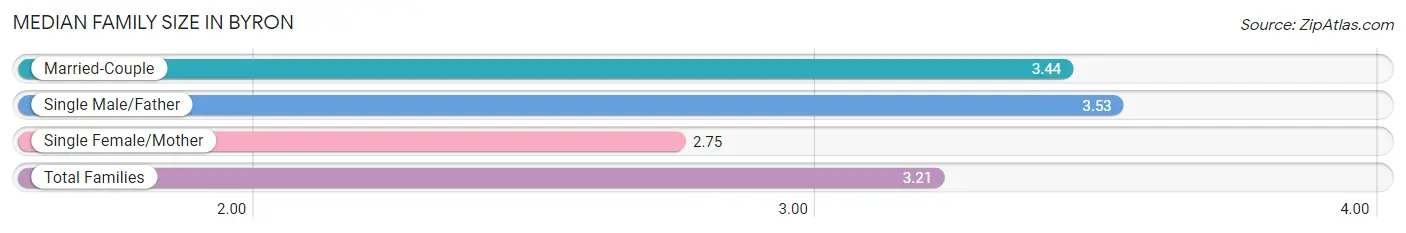
Median Family Size in Byron
The median family size in Byron is 3.21 persons per family, with single male/father families (77 | 4.8%) accounting for the largest median family size of 3.53 persons per family. On the other hand, single female/mother families (548 | 33.9%) represent the smallest median family size with 2.75 persons per family.
| Family Type | # Families | Family Size |
| Married-Couple | 993 (61.4%) | 3.44 |
| Single Male/Father | 77 (4.8%) | 3.53 |
| Single Female/Mother | 548 (33.9%) | 2.75 |
| Total Families | 1,618 (100.0%) | 3.21 |
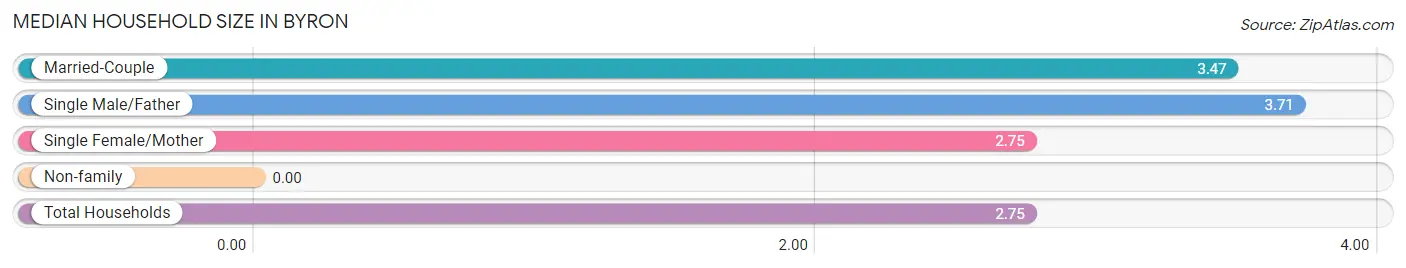
Median Household Size in Byron
| Household Type | # Households | Household Size |
| Married-Couple | 993 (48.1%) | 3.47 |
| Single Male/Father | 77 (3.7%) | 3.71 |
| Single Female/Mother | 548 (26.5%) | 2.75 |
| Non-family | 447 (21.6%) | - |
| Total Households | 2,065 (100.0%) | 2.75 |
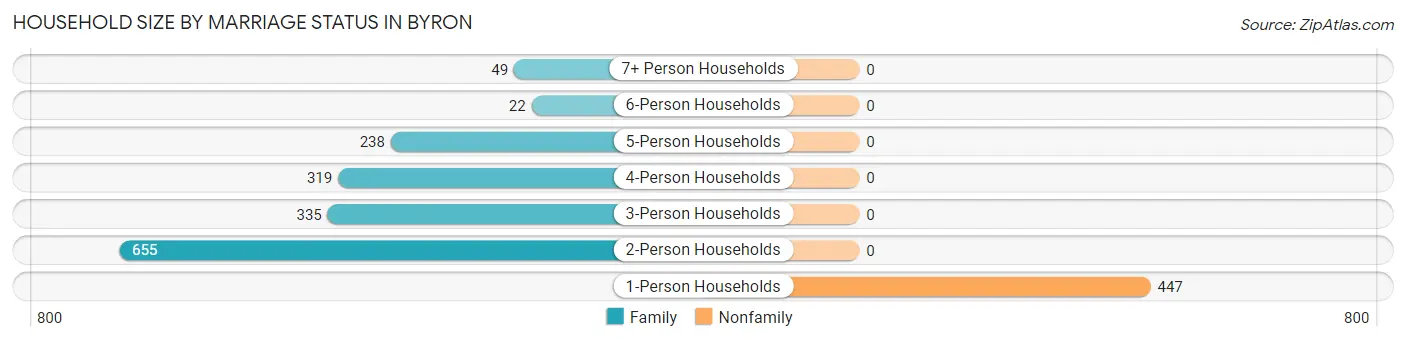
Household Size by Marriage Status in Byron
Out of a total of 2,065 households in Byron, 1,618 (78.3%) are family households, while 447 (21.6%) are nonfamily households. The most numerous type of family households are 2-person households, comprising 655, and the most common type of nonfamily households are 1-person households, comprising 447.
| Household Size | Family Households | Nonfamily Households |
| 1-Person Households | - | 447 (21.6%) |
| 2-Person Households | 655 (31.7%) | 0 (0.0%) |
| 3-Person Households | 335 (16.2%) | 0 (0.0%) |
| 4-Person Households | 319 (15.4%) | 0 (0.0%) |
| 5-Person Households | 238 (11.5%) | 0 (0.0%) |
| 6-Person Households | 22 (1.1%) | 0 (0.0%) |
| 7+ Person Households | 49 (2.4%) | 0 (0.0%) |
| Total | 1,618 (78.3%) | 447 (21.6%) |
Female Fertility in Byron
Fertility by Age in Byron
Average fertility rate in Byron is 89.0 births per 1,000 women. Women in the age bracket of 20 to 34 years have the highest fertility rate with 229.0 births per 1,000 women. Women in the age bracket of 20 to 34 years acount for 100.0% of all women with births.
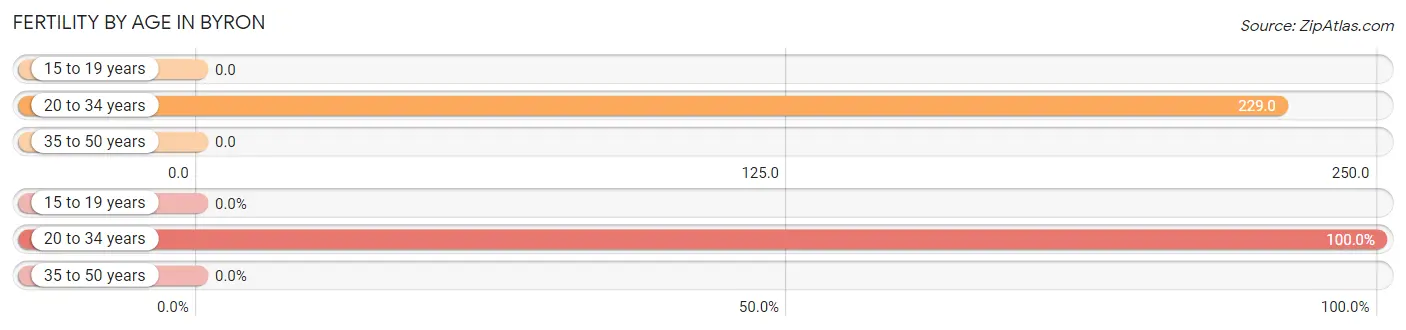
| Age Bracket | Women with Births | Births / 1,000 Women |
| 15 to 19 years | 0 (0.0%) | 0.0 |
| 20 to 34 years | 137 (100.0%) | 229.0 |
| 35 to 50 years | 0 (0.0%) | 0.0 |
| Total | 137 (100.0%) | 89.0 |
Fertility by Age by Marriage Status in Byron
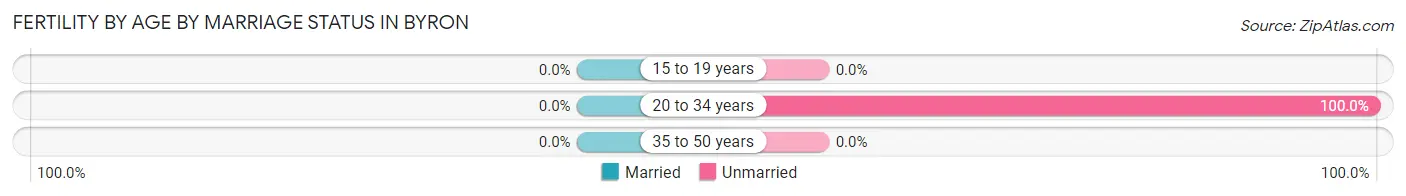
| Age Bracket | Married | Unmarried |
| 15 to 19 years | 0 (0.0%) | 0 (0.0%) |
| 20 to 34 years | 0 (0.0%) | 137 (100.0%) |
| 35 to 50 years | 0 (0.0%) | 0 (0.0%) |
| Total | 0 (0.0%) | 137 (100.0%) |
Fertility by Education in Byron
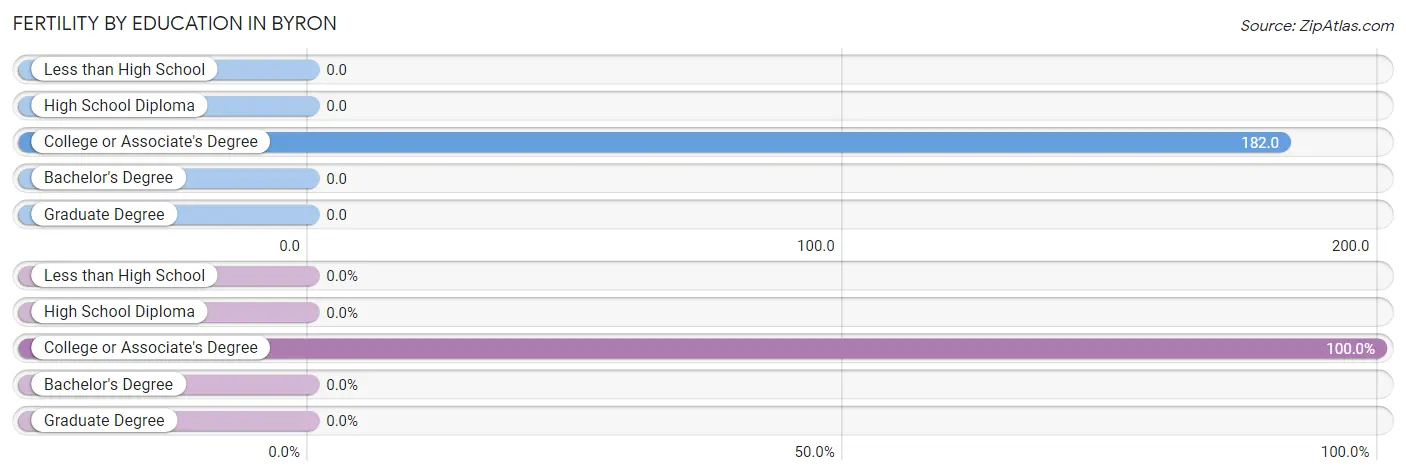
| Educational Attainment | Women with Births | Births / 1,000 Women |
| Less than High School | 0 (0.0%) | 0.0 |
| High School Diploma | 0 (0.0%) | 0.0 |
| College or Associate's Degree | 137 (100.0%) | 182.0 |
| Bachelor's Degree | 0 (0.0%) | 0.0 |
| Graduate Degree | 0 (0.0%) | 0.0 |
| Total | 137 (100.0%) | 89.0 |
Fertility by Education by Marriage Status in Byron
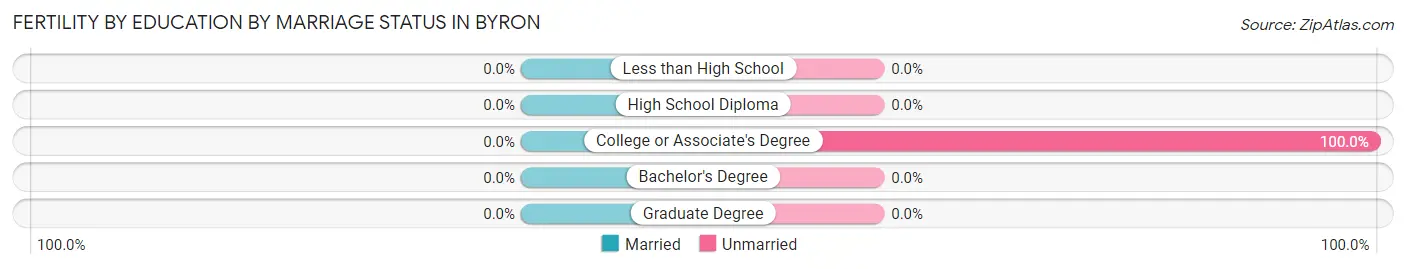
| Educational Attainment | Married | Unmarried |
| Less than High School | 0 (0.0%) | 0 (0.0%) |
| High School Diploma | 0 (0.0%) | 0 (0.0%) |
| College or Associate's Degree | 0 (0.0%) | 137 (100.0%) |
| Bachelor's Degree | 0 (0.0%) | 0 (0.0%) |
| Graduate Degree | 0 (0.0%) | 0 (0.0%) |
| Total | 0 (0.0%) | 137 (100.0%) |
Income in Byron
Income Overview in Byron
Per Capita Income in Byron is $33,398, while median incomes of families and households are $97,640 and $83,996 respectively.
| Characteristic | Number | Measure |
| Per Capita Income | 5,687 | $33,398 |
| Median Family Income | 1,618 | $97,640 |
| Mean Family Income | 1,618 | $97,779 |
| Median Household Income | 2,065 | $83,996 |
| Mean Household Income | 2,065 | $87,297 |
| Income Deficit | 1,618 | $0 |
| Wage / Income Gap (%) | 5,687 | 0.00% |
| Wage / Income Gap ($) | 5,687 | 100.00¢ per $1 |
| Gini / Inequality Index | 5,687 | 0.41 |
Earnings by Sex in Byron
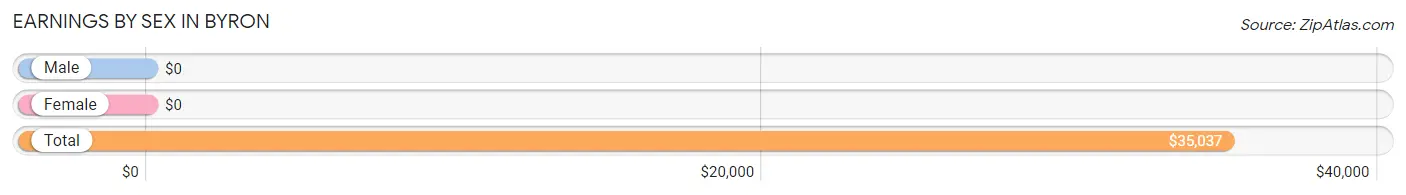
| Sex | Number | Average Earnings |
| Male | 1,713 (56.6%) | $0 |
| Female | 1,312 (43.4%) | $0 |
| Total | 3,025 (100.0%) | $35,037 |
Earnings by Sex by Income Bracket in Byron
The most common earnings brackets in Byron are $75,000 to $99,999 for men (512 | 29.9%) and $15,000 to $17,499 for women (335 | 25.5%).
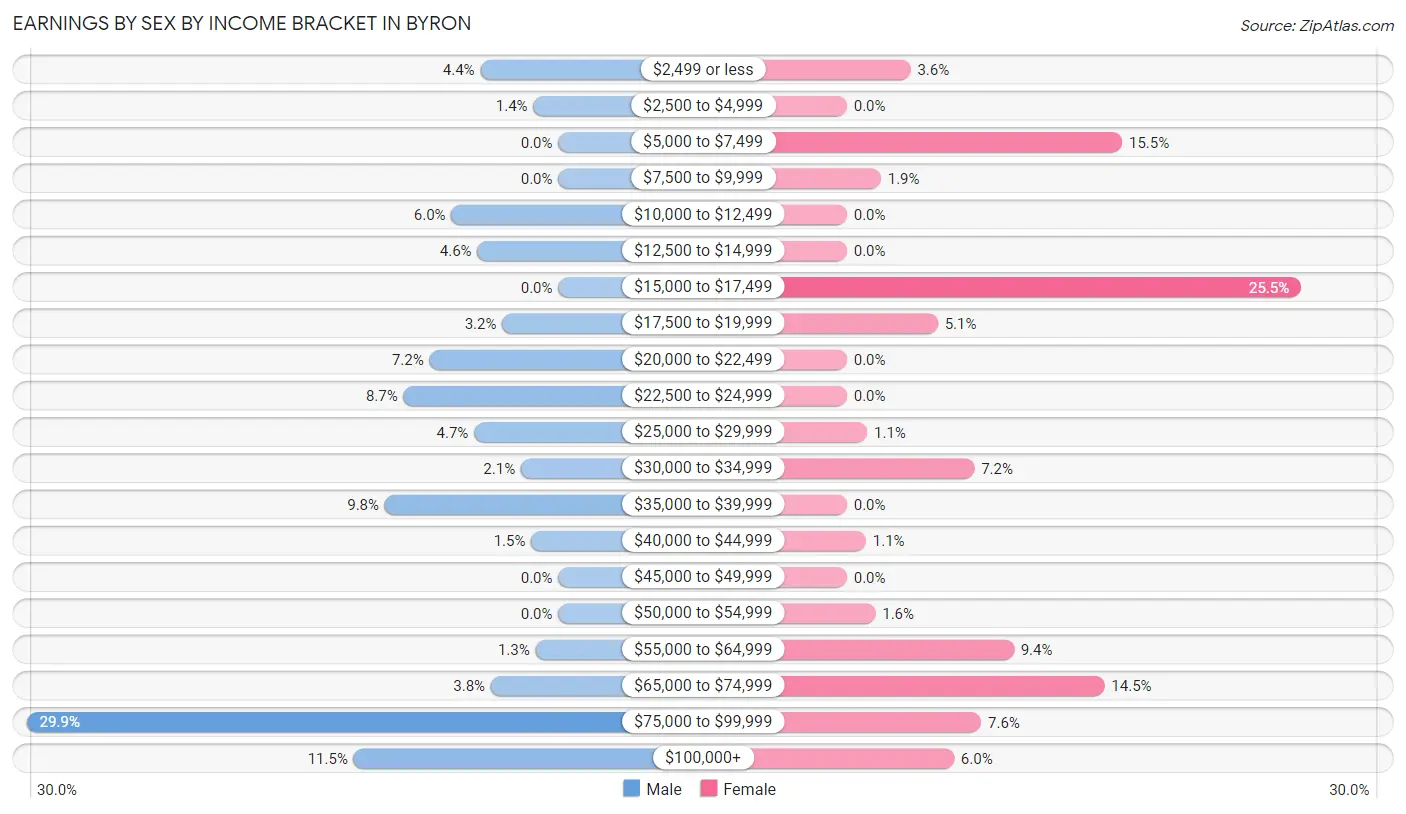
| Income | Male | Female |
| $2,499 or less | 75 (4.4%) | 47 (3.6%) |
| $2,500 to $4,999 | 24 (1.4%) | 0 (0.0%) |
| $5,000 to $7,499 | 0 (0.0%) | 203 (15.5%) |
| $7,500 to $9,999 | 0 (0.0%) | 25 (1.9%) |
| $10,000 to $12,499 | 103 (6.0%) | 0 (0.0%) |
| $12,500 to $14,999 | 78 (4.5%) | 0 (0.0%) |
| $15,000 to $17,499 | 0 (0.0%) | 335 (25.5%) |
| $17,500 to $19,999 | 54 (3.2%) | 67 (5.1%) |
| $20,000 to $22,499 | 124 (7.2%) | 0 (0.0%) |
| $22,500 to $24,999 | 149 (8.7%) | 0 (0.0%) |
| $25,000 to $29,999 | 81 (4.7%) | 15 (1.1%) |
| $30,000 to $34,999 | 36 (2.1%) | 94 (7.2%) |
| $35,000 to $39,999 | 167 (9.8%) | 0 (0.0%) |
| $40,000 to $44,999 | 26 (1.5%) | 14 (1.1%) |
| $45,000 to $49,999 | 0 (0.0%) | 0 (0.0%) |
| $50,000 to $54,999 | 0 (0.0%) | 21 (1.6%) |
| $55,000 to $64,999 | 22 (1.3%) | 123 (9.4%) |
| $65,000 to $74,999 | 65 (3.8%) | 190 (14.5%) |
| $75,000 to $99,999 | 512 (29.9%) | 99 (7.5%) |
| $100,000+ | 197 (11.5%) | 79 (6.0%) |
| Total | 1,713 (100.0%) | 1,312 (100.0%) |
Earnings by Sex by Educational Attainment in Byron
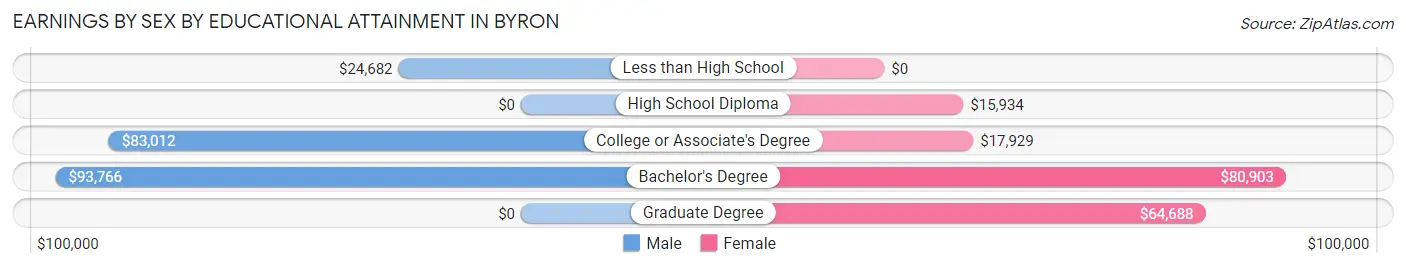
| Educational Attainment | Male Income | Female Income |
| Less than High School | $24,682 | $0 |
| High School Diploma | - | - |
| College or Associate's Degree | $83,012 | $17,929 |
| Bachelor's Degree | $93,766 | $80,903 |
| Graduate Degree | - | - |
| Total | $80,826 | $0 |
Family Income in Byron
Family Income Brackets in Byron
According to the Byron family income data, there are 414 families falling into the $100,000 to $149,999 income range, which is the most common income bracket and makes up 25.6% of all families. Conversely, the $10,000 to $14,999 income bracket is the least frequent group with only 26 families (1.6%) belonging to this category.
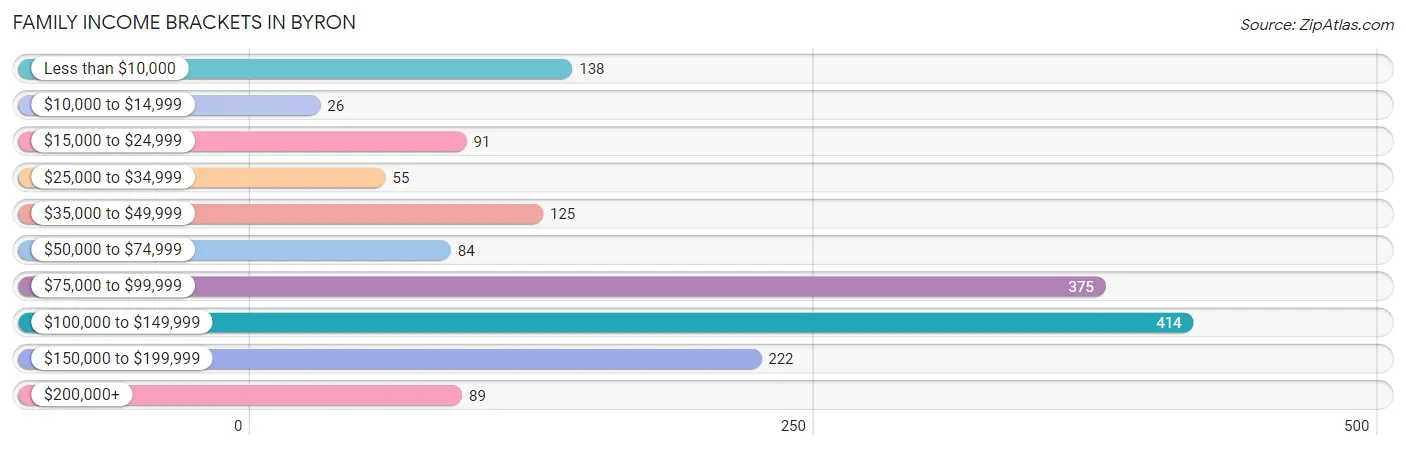
| Income Bracket | # Families | % Families |
| Less than $10,000 | 138 | 8.5% |
| $10,000 to $14,999 | 26 | 1.6% |
| $15,000 to $24,999 | 91 | 5.6% |
| $25,000 to $34,999 | 55 | 3.4% |
| $35,000 to $49,999 | 125 | 7.7% |
| $50,000 to $74,999 | 84 | 5.2% |
| $75,000 to $99,999 | 375 | 23.2% |
| $100,000 to $149,999 | 414 | 25.6% |
| $150,000 to $199,999 | 222 | 13.7% |
| $200,000+ | 89 | 5.5% |
Family Income by Famaliy Size in Byron
5-person families (238 | 14.7%) account for the highest median family income in Byron with $168,105 per family, while 2-person families (680 | 42.0%) have the highest median income of $49,345 per family member.
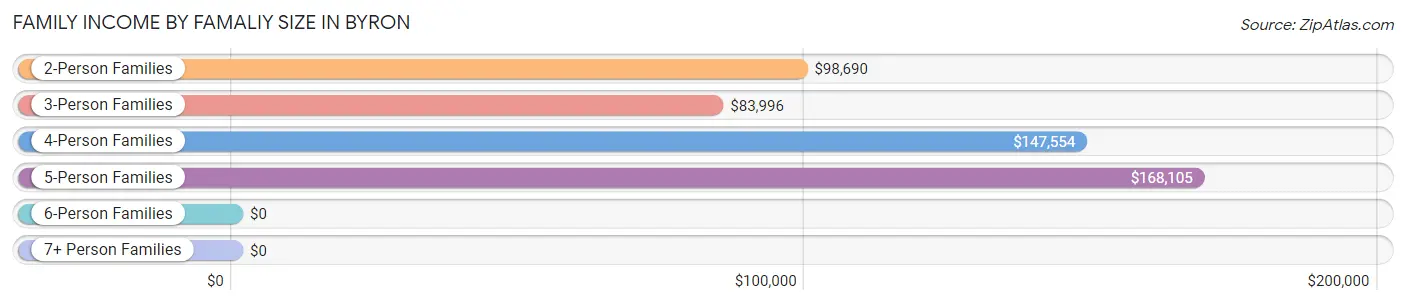
| Income Bracket | # Families | Median Income |
| 2-Person Families | 680 (42.0%) | $98,690 |
| 3-Person Families | 333 (20.6%) | $83,996 |
| 4-Person Families | 296 (18.3%) | $147,554 |
| 5-Person Families | 238 (14.7%) | $168,105 |
| 6-Person Families | 22 (1.4%) | $0 |
| 7+ Person Families | 49 (3.0%) | $0 |
| Total | 1,618 (100.0%) | $97,640 |
Family Income by Number of Earners in Byron
The median family income in Byron is $97,640, with families comprising 3+ earners (174) having the highest median family income of $149,402, while families with 1 earner (676) have the lowest median family income of $80,171, accounting for 10.7% and 41.8% of families, respectively.
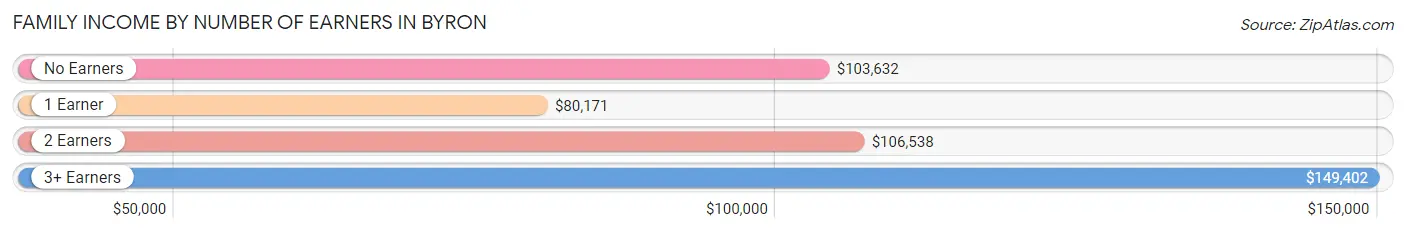
| Number of Earners | # Families | Median Income |
| No Earners | 102 (6.3%) | $103,632 |
| 1 Earner | 676 (41.8%) | $80,171 |
| 2 Earners | 666 (41.2%) | $106,538 |
| 3+ Earners | 174 (10.7%) | $149,402 |
| Total | 1,618 (100.0%) | $97,640 |
Household Income in Byron
Household Income Brackets in Byron
With 456 households falling in the category, the $100,000 to $149,999 income range is the most frequent in Byron, accounting for 22.1% of all households. In contrast, only 27 households (1.3%) fall into the $10,000 to $14,999 income bracket, making it the least populous group.
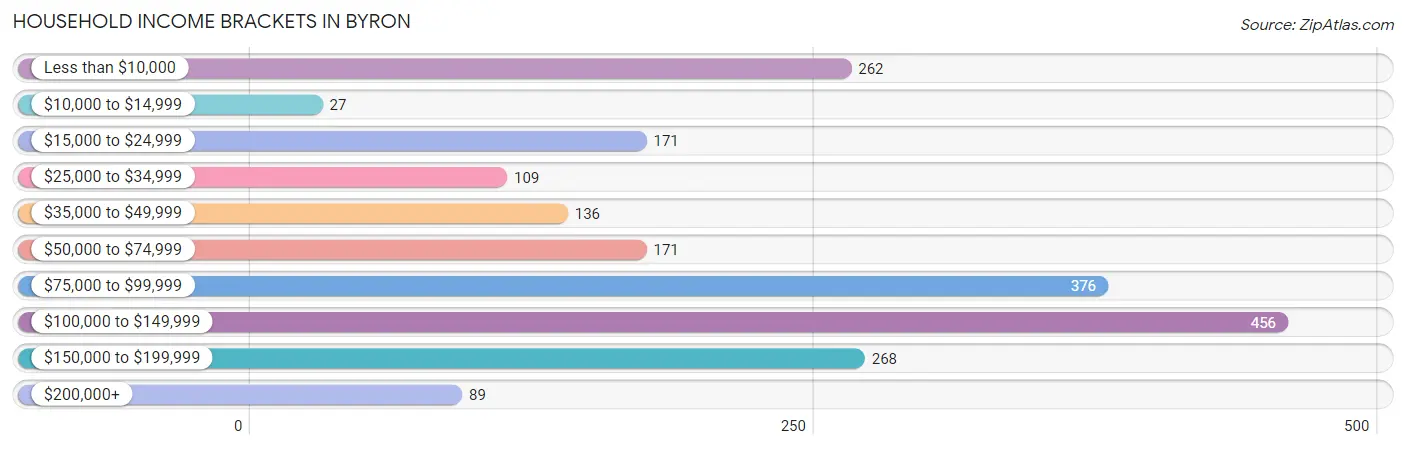
| Income Bracket | # Households | % Households |
| Less than $10,000 | 262 | 12.7% |
| $10,000 to $14,999 | 27 | 1.3% |
| $15,000 to $24,999 | 171 | 8.3% |
| $25,000 to $34,999 | 109 | 5.3% |
| $35,000 to $49,999 | 136 | 6.6% |
| $50,000 to $74,999 | 171 | 8.3% |
| $75,000 to $99,999 | 376 | 18.2% |
| $100,000 to $149,999 | 456 | 22.1% |
| $150,000 to $199,999 | 268 | 13.0% |
| $200,000+ | 89 | 4.3% |
Household Income by Householder Age in Byron
The median household income in Byron is $83,996, with the highest median household income of $100,828 found in the 45 to 64 years age bracket for the primary householder. A total of 755 households (36.6%) fall into this category.
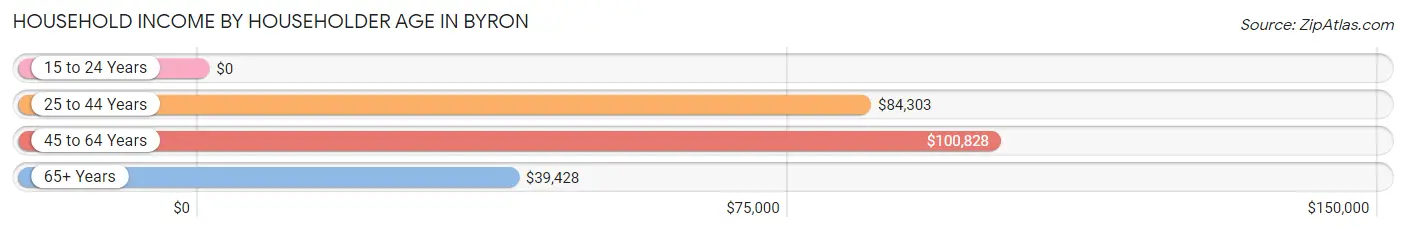
| Income Bracket | # Households | Median Income |
| 15 to 24 Years | 0 (0.0%) | $0 |
| 25 to 44 Years | 724 (35.1%) | $84,303 |
| 45 to 64 Years | 755 (36.6%) | $100,828 |
| 65+ Years | 586 (28.4%) | $39,428 |
| Total | 2,065 (100.0%) | $83,996 |
Poverty in Byron
Income Below Poverty by Sex and Age in Byron
With 11.0% poverty level for males and 19.8% for females among the residents of Byron, 75 year old and over males and 16 and 17 year old females are the most vulnerable to poverty, with 37 males (35.6%) and 41 females (100.0%) in their respective age groups living below the poverty level.
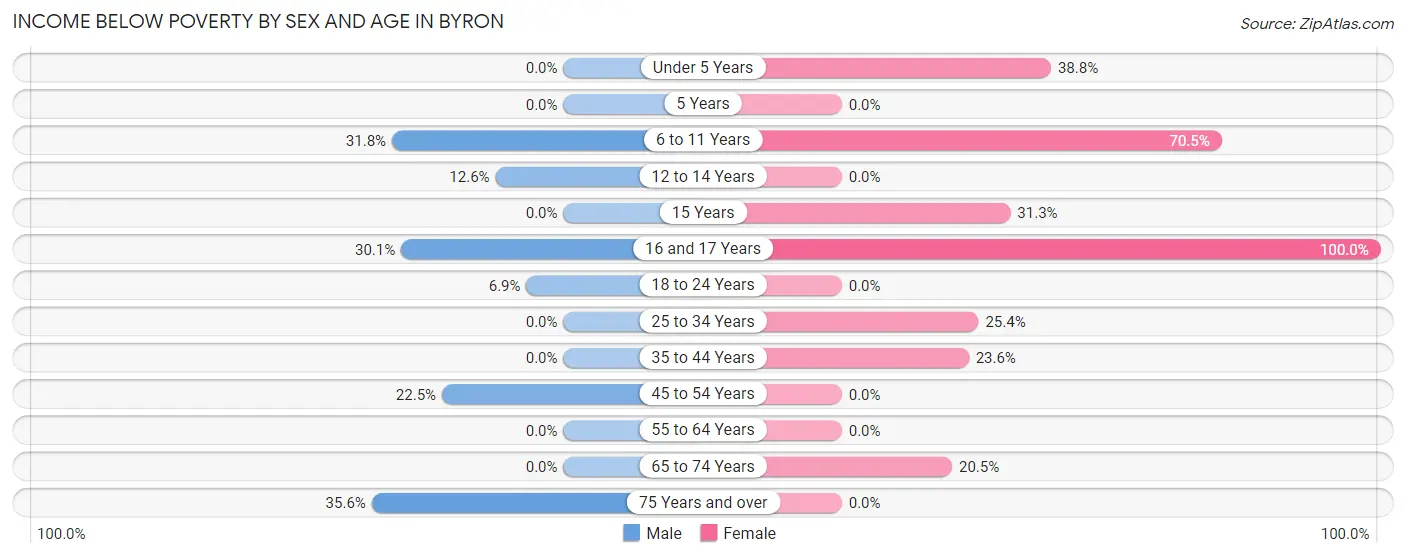
| Age Bracket | Male | Female |
| Under 5 Years | 0 (0.0%) | 106 (38.8%) |
| 5 Years | 0 (0.0%) | 0 (0.0%) |
| 6 to 11 Years | 133 (31.8%) | 43 (70.5%) |
| 12 to 14 Years | 15 (12.6%) | 0 (0.0%) |
| 15 Years | 0 (0.0%) | 41 (31.3%) |
| 16 and 17 Years | 47 (30.1%) | 41 (100.0%) |
| 18 to 24 Years | 19 (6.9%) | 0 (0.0%) |
| 25 to 34 Years | 0 (0.0%) | 137 (25.4%) |
| 35 to 44 Years | 0 (0.0%) | 118 (23.5%) |
| 45 to 54 Years | 55 (22.5%) | 0 (0.0%) |
| 55 to 64 Years | 0 (0.0%) | 0 (0.0%) |
| 65 to 74 Years | 0 (0.0%) | 88 (20.5%) |
| 75 Years and over | 37 (35.6%) | 0 (0.0%) |
| Total | 306 (11.0%) | 574 (19.8%) |
Income Above Poverty by Sex and Age in Byron
According to the poverty statistics in Byron, males aged under 5 years and females aged 5 years are the age groups that are most secure financially, with 100.0% of males and 100.0% of females in these age groups living above the poverty line.
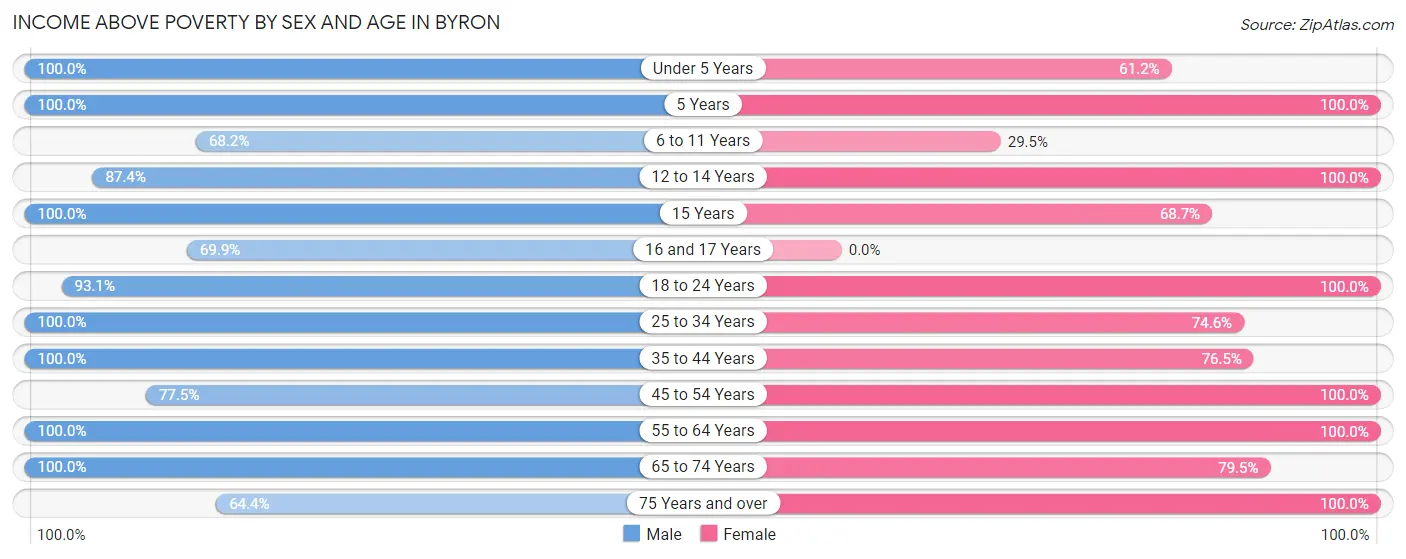
| Age Bracket | Male | Female |
| Under 5 Years | 17 (100.0%) | 167 (61.2%) |
| 5 Years | 12 (100.0%) | 63 (100.0%) |
| 6 to 11 Years | 285 (68.2%) | 18 (29.5%) |
| 12 to 14 Years | 104 (87.4%) | 95 (100.0%) |
| 15 Years | 100 (100.0%) | 90 (68.7%) |
| 16 and 17 Years | 109 (69.9%) | 0 (0.0%) |
| 18 to 24 Years | 258 (93.1%) | 57 (100.0%) |
| 25 to 34 Years | 264 (100.0%) | 403 (74.6%) |
| 35 to 44 Years | 327 (100.0%) | 383 (76.4%) |
| 45 to 54 Years | 189 (77.5%) | 337 (100.0%) |
| 55 to 64 Years | 470 (100.0%) | 263 (100.0%) |
| 65 to 74 Years | 273 (100.0%) | 342 (79.5%) |
| 75 Years and over | 67 (64.4%) | 114 (100.0%) |
| Total | 2,475 (89.0%) | 2,332 (80.2%) |
Income Below Poverty Among Married-Couple Families in Byron
The poverty statistics for married-couple families in Byron show that 5.5% or 55 of the total 993 families live below the poverty line. Families with 3 or 4 children have the highest poverty rate of 19.4%, comprising of 55 families. On the other hand, families with no children have the lowest poverty rate of 0.0%, which includes 0 families.
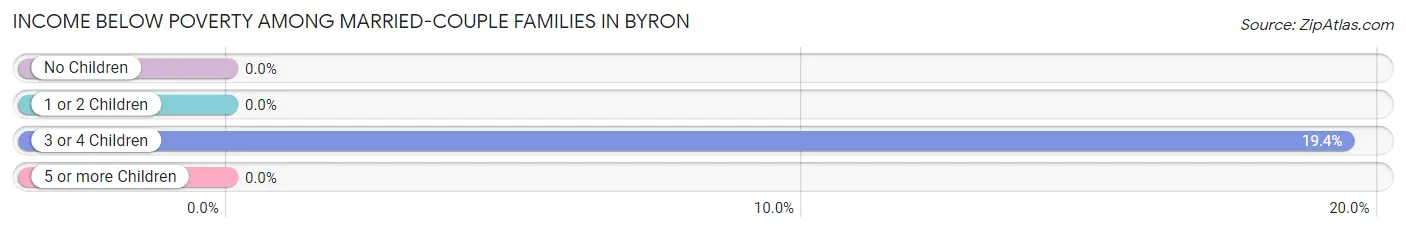
| Children | Above Poverty | Below Poverty |
| No Children | 468 (100.0%) | 0 (0.0%) |
| 1 or 2 Children | 242 (100.0%) | 0 (0.0%) |
| 3 or 4 Children | 228 (80.6%) | 55 (19.4%) |
| 5 or more Children | 0 (0.0%) | 0 (0.0%) |
| Total | 938 (94.5%) | 55 (5.5%) |
Income Below Poverty Among Single-Parent Households in Byron
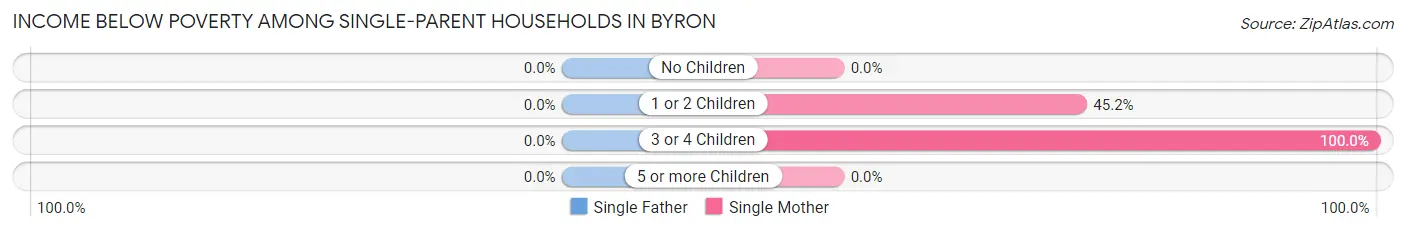
| Children | Single Father | Single Mother |
| No Children | 0 (0.0%) | 0 (0.0%) |
| 1 or 2 Children | 0 (0.0%) | 137 (45.2%) |
| 3 or 4 Children | 0 (0.0%) | 93 (100.0%) |
| 5 or more Children | 0 (0.0%) | 0 (0.0%) |
| Total | 0 (0.0%) | 230 (42.0%) |
Income Below Poverty Among Married-Couple vs Single-Parent Households in Byron
The poverty data for Byron shows that 55 of the married-couple family households (5.5%) and 230 of the single-parent households (36.8%) are living below the poverty level. Within the married-couple family households, those with 3 or 4 children have the highest poverty rate, with 55 households (19.4%) falling below the poverty line. Among the single-parent households, those with 3 or 4 children have the highest poverty rate, with 93 household (100.0%) living below poverty.
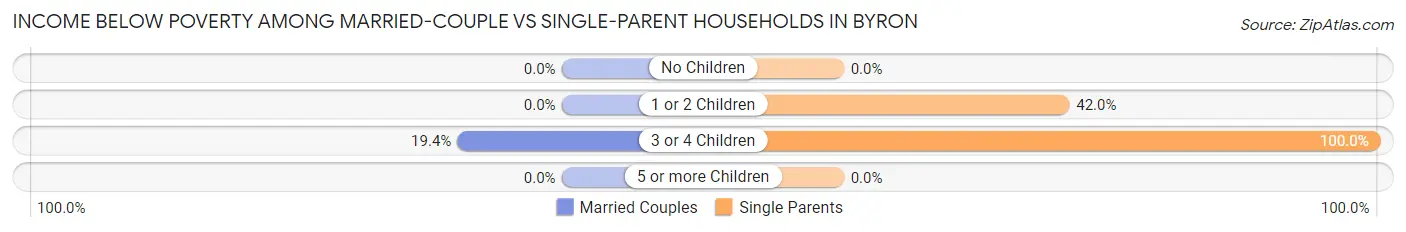
| Children | Married-Couple Families | Single-Parent Households |
| No Children | 0 (0.0%) | 0 (0.0%) |
| 1 or 2 Children | 0 (0.0%) | 137 (42.0%) |
| 3 or 4 Children | 55 (19.4%) | 93 (100.0%) |
| 5 or more Children | 0 (0.0%) | 0 (0.0%) |
| Total | 55 (5.5%) | 230 (36.8%) |
Employment Characteristics in Byron
Employment by Class of Employer in Byron
Among the 2,649 employed individuals in Byron, private company employees (1,649 | 62.3%), not-for-profit organizations (273 | 10.3%), and self-employed (not incorporated) (183 | 6.9%) make up the most common classes of employment.
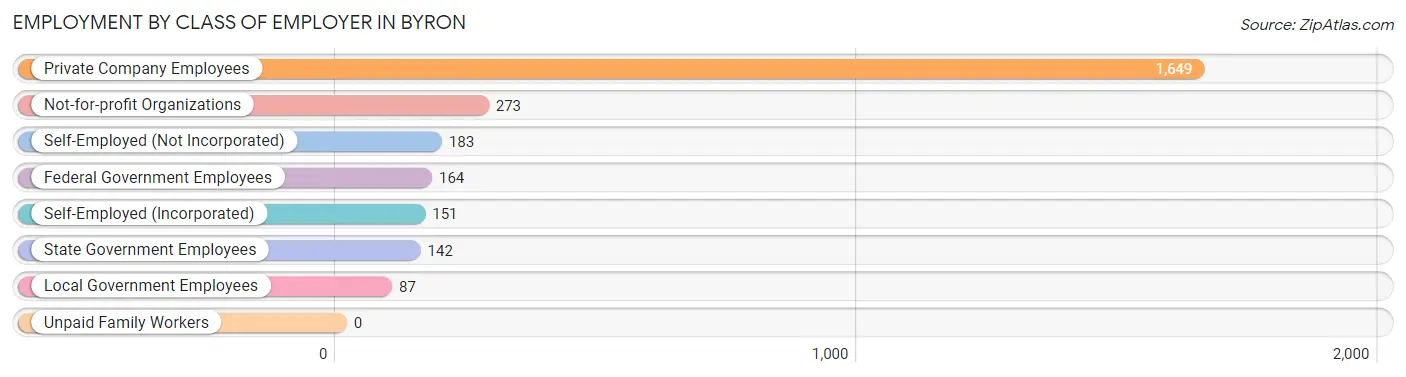
| Employer Class | # Employees | % Employees |
| Private Company Employees | 1,649 | 62.3% |
| Self-Employed (Incorporated) | 151 | 5.7% |
| Self-Employed (Not Incorporated) | 183 | 6.9% |
| Not-for-profit Organizations | 273 | 10.3% |
| Local Government Employees | 87 | 3.3% |
| State Government Employees | 142 | 5.4% |
| Federal Government Employees | 164 | 6.2% |
| Unpaid Family Workers | 0 | 0.0% |
| Total | 2,649 | 100.0% |
Employment Status by Age in Byron
According to the labor force statistics for Byron, out of the total population over 16 years of age (4,398), 66.4% or 2,920 individuals are in the labor force, with 3.4% or 99 of them unemployed. The age group with the highest labor force participation rate is 25 to 29 years, with 98.4% or 501 individuals in the labor force. Within the labor force, the 16 to 19 years age range has the highest percentage of unemployed individuals, with 17.6% or 15 of them being unemployed.
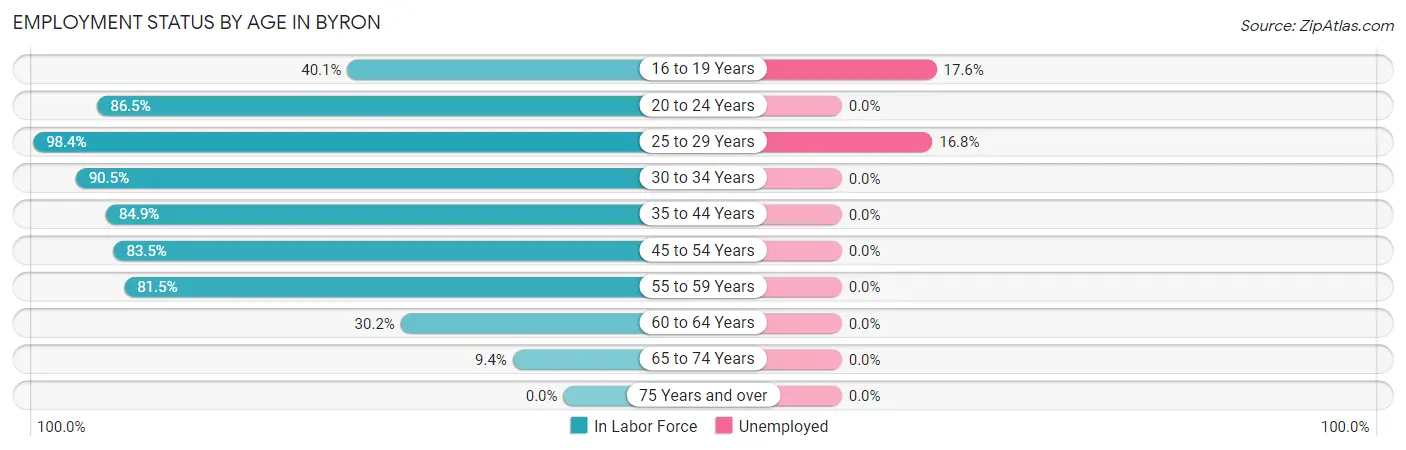
| Age Bracket | In Labor Force | Unemployed |
| 16 to 19 Years | 85 (40.1%) | 15 (17.6%) |
| 20 to 24 Years | 276 (86.5%) | 0 (0.0%) |
| 25 to 29 Years | 501 (98.4%) | 84 (16.8%) |
| 30 to 34 Years | 267 (90.5%) | 0 (0.0%) |
| 35 to 44 Years | 703 (84.9%) | 0 (0.0%) |
| 45 to 54 Years | 485 (83.5%) | 0 (0.0%) |
| 55 to 59 Years | 503 (81.5%) | 0 (0.0%) |
| 60 to 64 Years | 35 (30.2%) | 0 (0.0%) |
| 65 to 74 Years | 66 (9.4%) | 0 (0.0%) |
| 75 Years and over | 0 (0.0%) | 0 (0.0%) |
| Total | 2,920 (66.4%) | 99 (3.4%) |
Employment Status by Educational Attainment in Byron
According to labor force statistics for Byron, 84.7% of individuals (2,495) out of the total population between 25 and 64 years of age (2,946) are in the labor force, with 3.4% or 85 of them being unemployed. The group with the highest labor force participation rate are those with the educational attainment of bachelor's degree or higher, with 92.8% or 801 individuals in the labor force. Within the labor force, individuals with bachelor's degree or higher education have the highest percentage of unemployment, with 10.5% or 84 of them being unemployed.
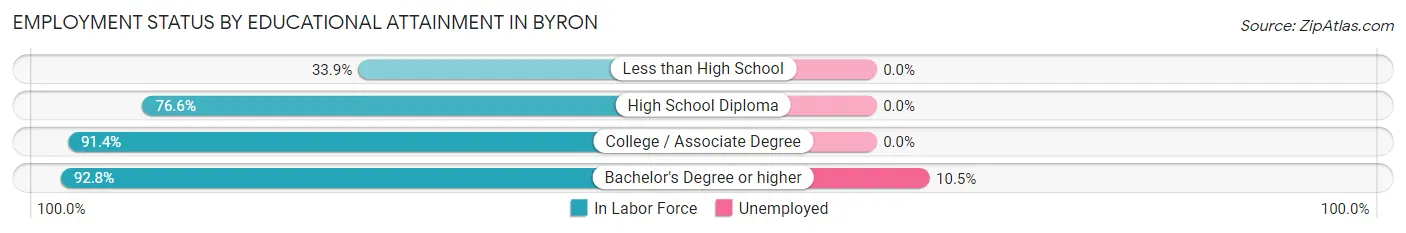
| Educational Attainment | In Labor Force | Unemployed |
| Less than High School | 62 (33.9%) | 0 (0.0%) |
| High School Diploma | 542 (76.6%) | 0 (0.0%) |
| College / Associate Degree | 1,089 (91.4%) | 0 (0.0%) |
| Bachelor's Degree or higher | 801 (92.8%) | 91 (10.5%) |
| Total | 2,495 (84.7%) | 100 (3.4%) |
Employment Occupations by Sex in Byron
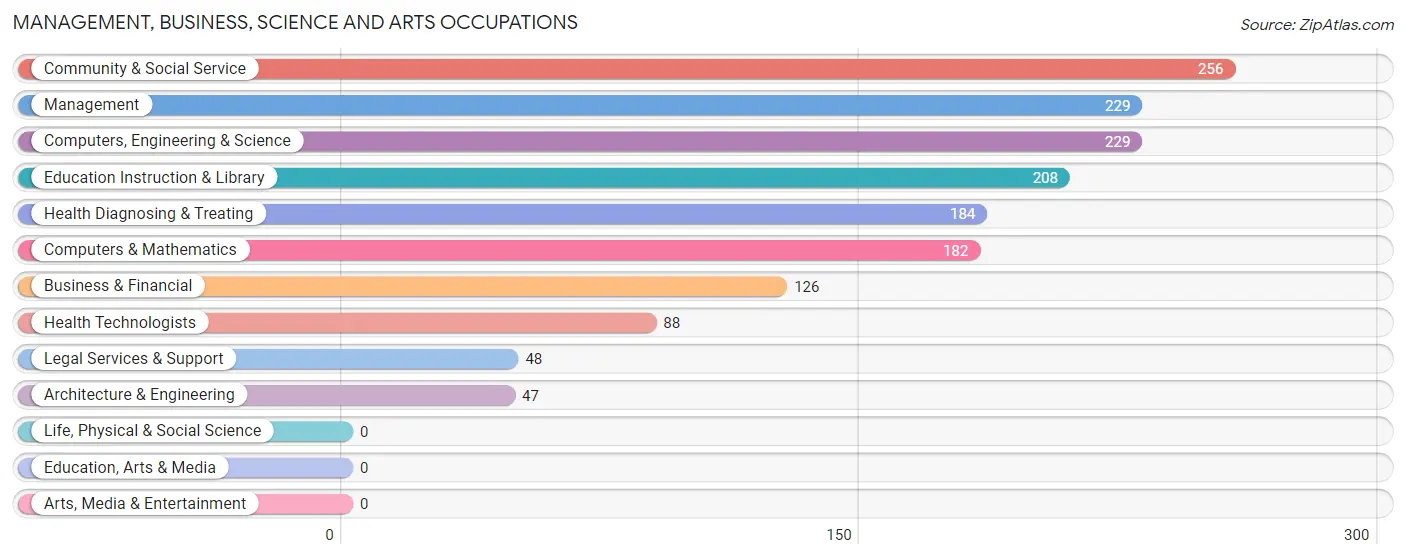
Management, Business, Science and Arts Occupations
The most common Management, Business, Science and Arts occupations in Byron are Community & Social Service (256 | 9.1%), Management (229 | 8.1%), Computers, Engineering & Science (229 | 8.1%), Education Instruction & Library (208 | 7.4%), and Health Diagnosing & Treating (184 | 6.5%).
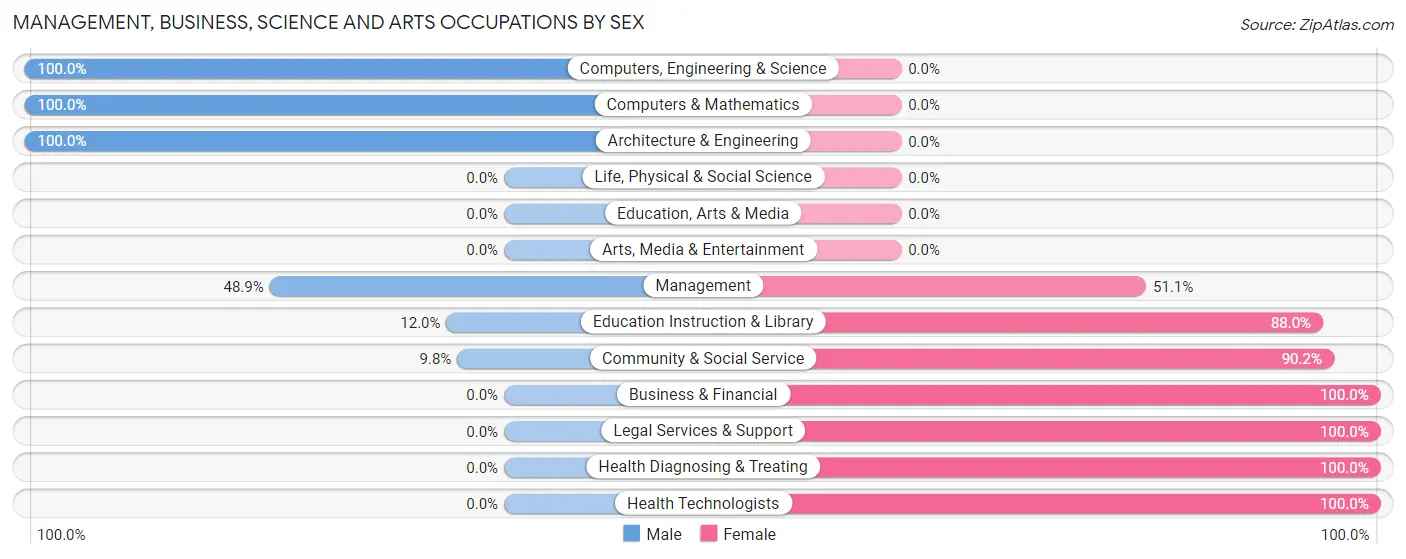
Management, Business, Science and Arts Occupations by Sex
Within the Management, Business, Science and Arts occupations in Byron, the most male-oriented occupations are Computers, Engineering & Science (100.0%), Computers & Mathematics (100.0%), and Architecture & Engineering (100.0%), while the most female-oriented occupations are Business & Financial (100.0%), Legal Services & Support (100.0%), and Health Diagnosing & Treating (100.0%).
| Occupation | Male | Female |
| Management | 112 (48.9%) | 117 (51.1%) |
| Business & Financial | 0 (0.0%) | 126 (100.0%) |
| Computers, Engineering & Science | 229 (100.0%) | 0 (0.0%) |
| Computers & Mathematics | 182 (100.0%) | 0 (0.0%) |
| Architecture & Engineering | 47 (100.0%) | 0 (0.0%) |
| Life, Physical & Social Science | 0 (0.0%) | 0 (0.0%) |
| Community & Social Service | 25 (9.8%) | 231 (90.2%) |
| Education, Arts & Media | 0 (0.0%) | 0 (0.0%) |
| Legal Services & Support | 0 (0.0%) | 48 (100.0%) |
| Education Instruction & Library | 25 (12.0%) | 183 (88.0%) |
| Arts, Media & Entertainment | 0 (0.0%) | 0 (0.0%) |
| Health Diagnosing & Treating | 0 (0.0%) | 184 (100.0%) |
| Health Technologists | 0 (0.0%) | 88 (100.0%) |
| Total (Category) | 366 (35.7%) | 658 (64.3%) |
| Total (Overall) | 1,556 (55.1%) | 1,266 (44.9%) |
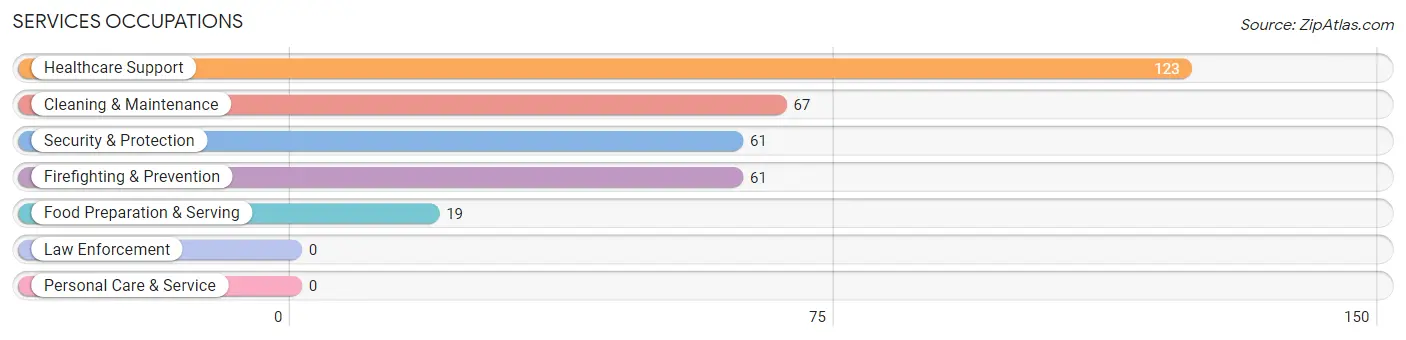
Services Occupations
The most common Services occupations in Byron are Healthcare Support (123 | 4.4%), Cleaning & Maintenance (67 | 2.4%), Security & Protection (61 | 2.2%), Firefighting & Prevention (61 | 2.2%), and Food Preparation & Serving (19 | 0.7%).
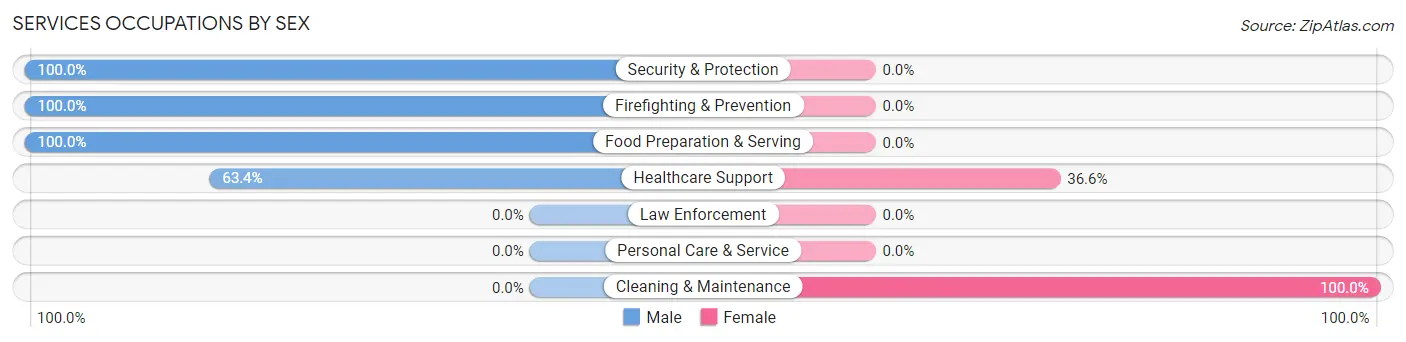
Services Occupations by Sex
Within the Services occupations in Byron, the most male-oriented occupations are Security & Protection (100.0%), Firefighting & Prevention (100.0%), and Food Preparation & Serving (100.0%), while the most female-oriented occupations are Cleaning & Maintenance (100.0%), and Healthcare Support (36.6%).
| Occupation | Male | Female |
| Healthcare Support | 78 (63.4%) | 45 (36.6%) |
| Security & Protection | 61 (100.0%) | 0 (0.0%) |
| Firefighting & Prevention | 61 (100.0%) | 0 (0.0%) |
| Law Enforcement | 0 (0.0%) | 0 (0.0%) |
| Food Preparation & Serving | 19 (100.0%) | 0 (0.0%) |
| Cleaning & Maintenance | 0 (0.0%) | 67 (100.0%) |
| Personal Care & Service | 0 (0.0%) | 0 (0.0%) |
| Total (Category) | 158 (58.5%) | 112 (41.5%) |
| Total (Overall) | 1,556 (55.1%) | 1,266 (44.9%) |
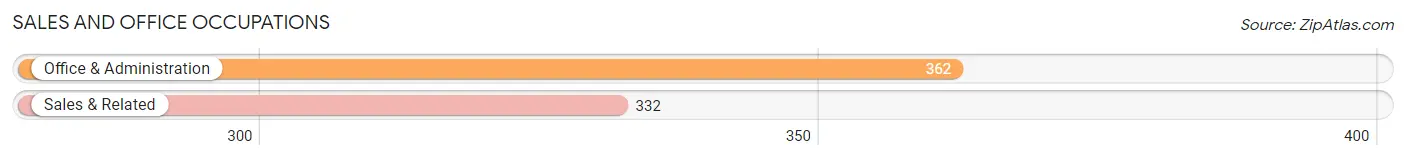
Sales and Office Occupations
The most common Sales and Office occupations in Byron are Office & Administration (362 | 12.8%), and Sales & Related (332 | 11.8%).
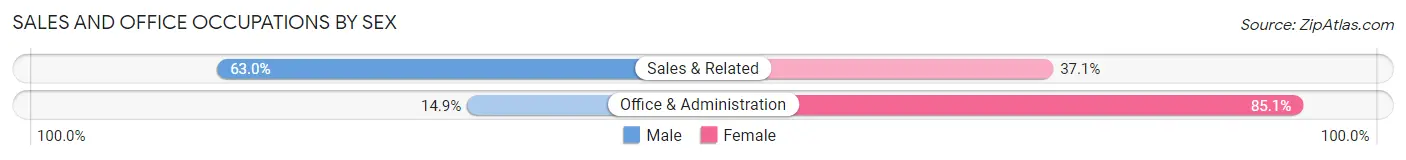
Sales and Office Occupations by Sex
| Occupation | Male | Female |
| Sales & Related | 209 (62.9%) | 123 (37.0%) |
| Office & Administration | 54 (14.9%) | 308 (85.1%) |
| Total (Category) | 263 (37.9%) | 431 (62.1%) |
| Total (Overall) | 1,556 (55.1%) | 1,266 (44.9%) |
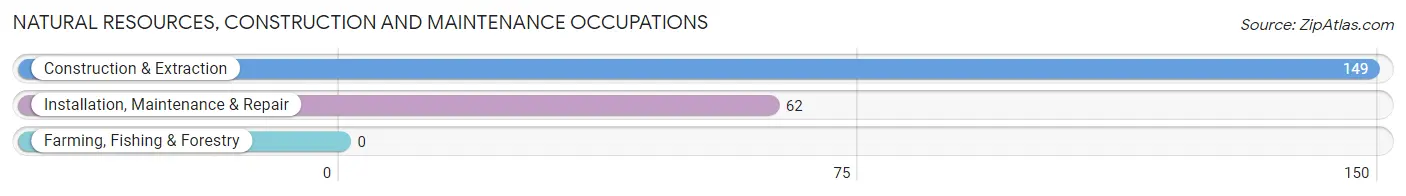
Natural Resources, Construction and Maintenance Occupations
The most common Natural Resources, Construction and Maintenance occupations in Byron are Construction & Extraction (149 | 5.3%), and Installation, Maintenance & Repair (62 | 2.2%).
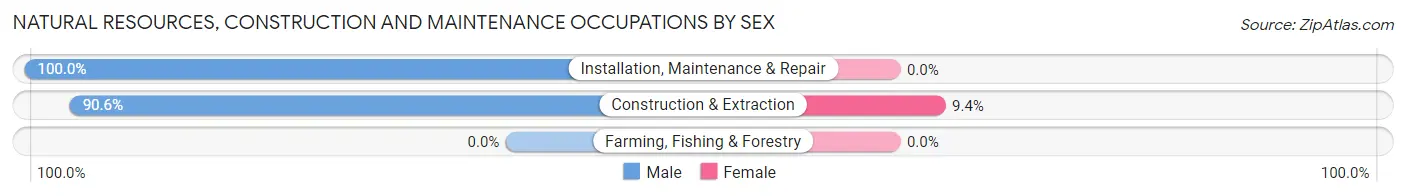
Natural Resources, Construction and Maintenance Occupations by Sex
| Occupation | Male | Female |
| Farming, Fishing & Forestry | 0 (0.0%) | 0 (0.0%) |
| Construction & Extraction | 135 (90.6%) | 14 (9.4%) |
| Installation, Maintenance & Repair | 62 (100.0%) | 0 (0.0%) |
| Total (Category) | 197 (93.4%) | 14 (6.6%) |
| Total (Overall) | 1,556 (55.1%) | 1,266 (44.9%) |
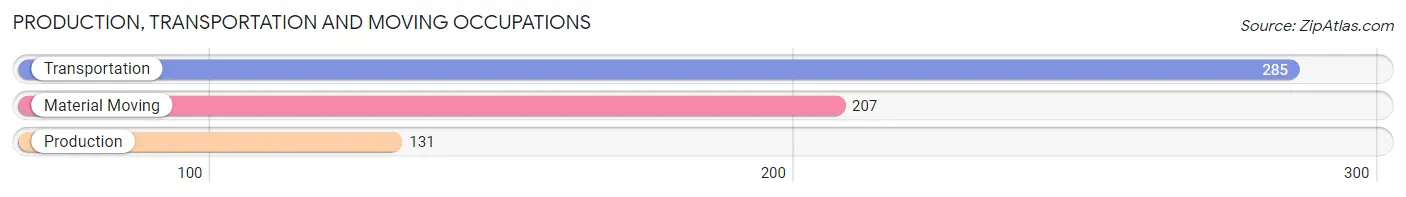
Production, Transportation and Moving Occupations
The most common Production, Transportation and Moving occupations in Byron are Transportation (285 | 10.1%), Material Moving (207 | 7.3%), and Production (131 | 4.6%).
Production, Transportation and Moving Occupations by Sex
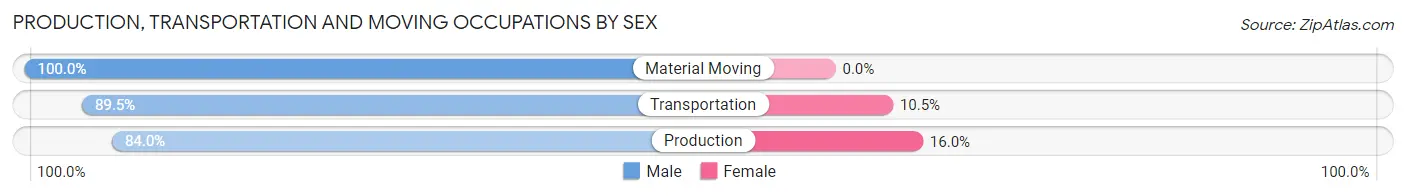
| Occupation | Male | Female |
| Production | 110 (84.0%) | 21 (16.0%) |
| Transportation | 255 (89.5%) | 30 (10.5%) |
| Material Moving | 207 (100.0%) | 0 (0.0%) |
| Total (Category) | 572 (91.8%) | 51 (8.2%) |
| Total (Overall) | 1,556 (55.1%) | 1,266 (44.9%) |
Employment Industries by Sex in Byron
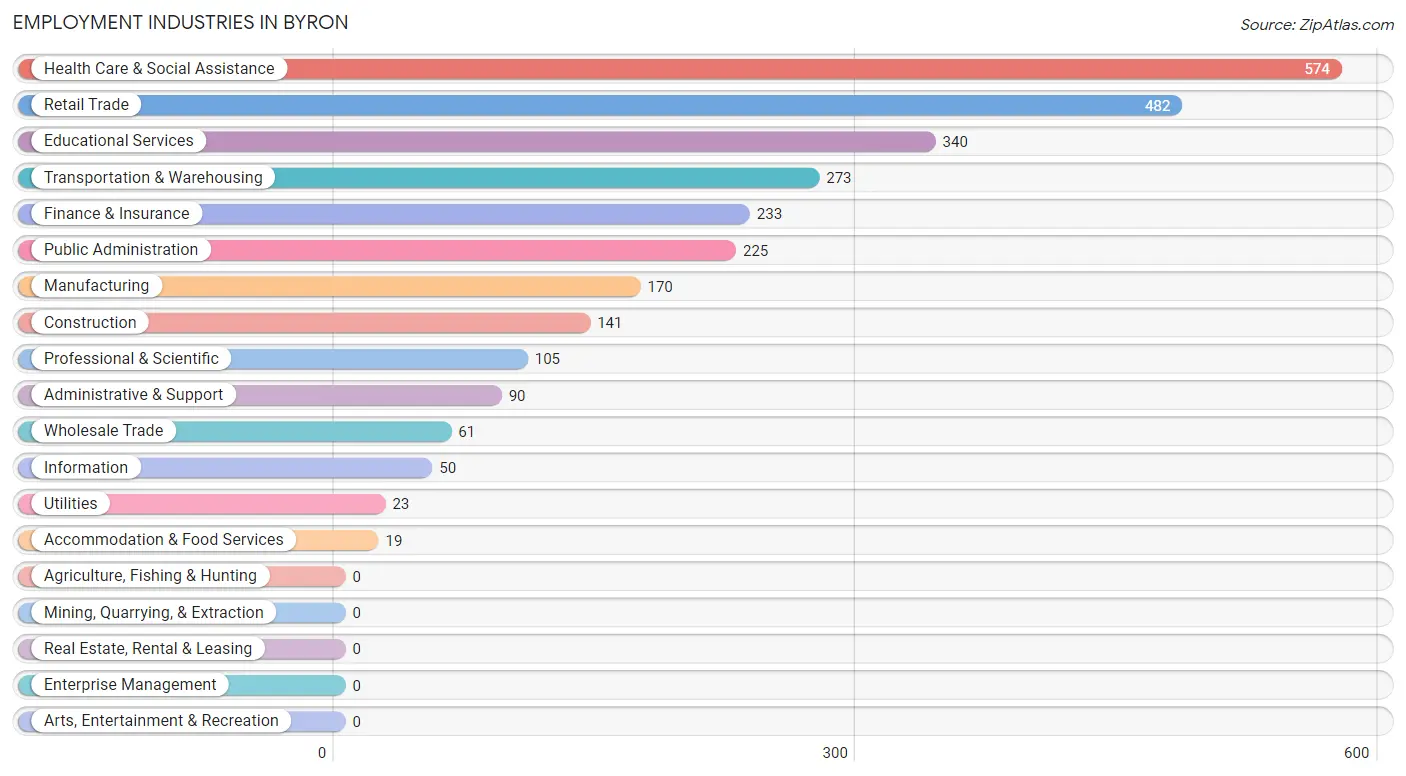
Employment Industries in Byron
The major employment industries in Byron include Health Care & Social Assistance (574 | 20.3%), Retail Trade (482 | 17.1%), Educational Services (340 | 12.0%), Transportation & Warehousing (273 | 9.7%), and Finance & Insurance (233 | 8.3%).
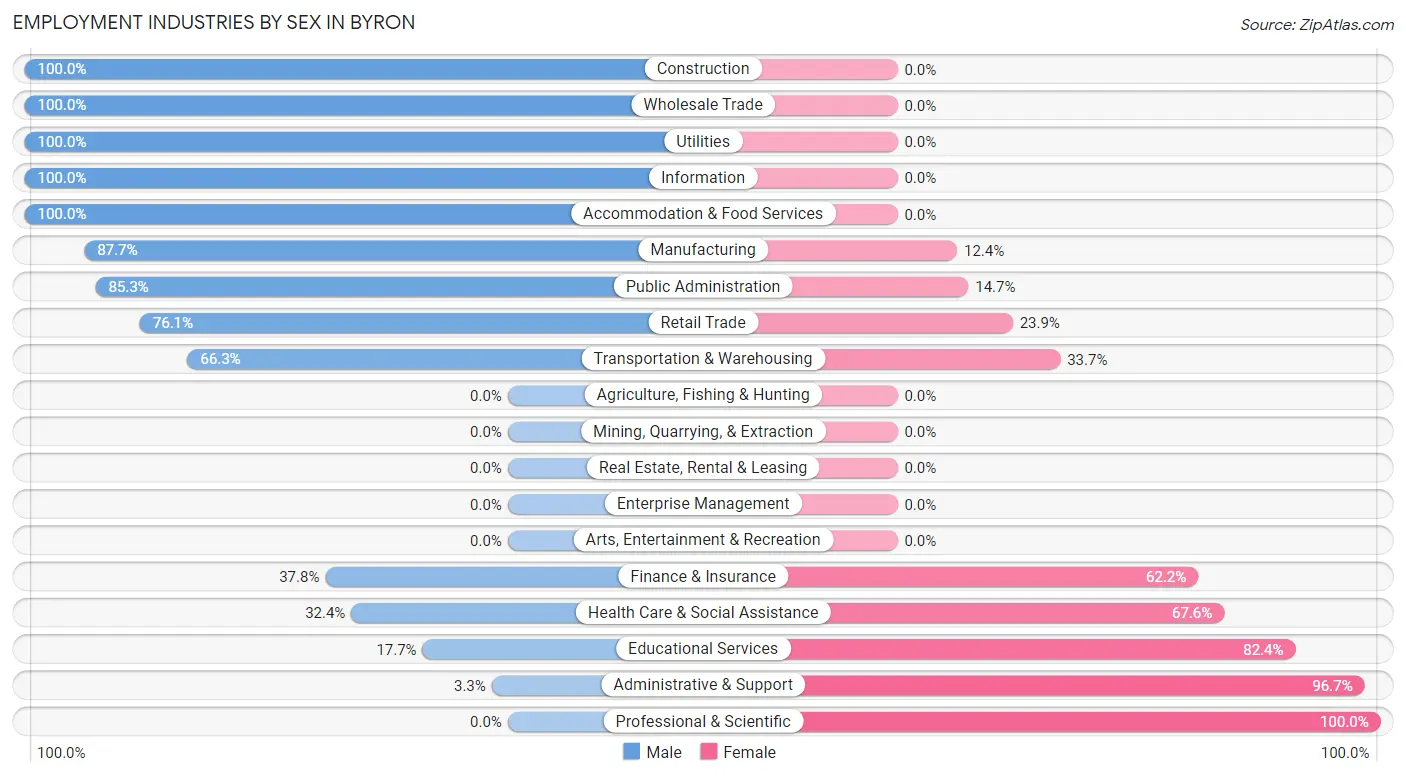
Employment Industries by Sex in Byron
The Byron industries that see more men than women are Construction (100.0%), Wholesale Trade (100.0%), and Utilities (100.0%), whereas the industries that tend to have a higher number of women are Professional & Scientific (100.0%), Administrative & Support (96.7%), and Educational Services (82.4%).
| Industry | Male | Female |
| Agriculture, Fishing & Hunting | 0 (0.0%) | 0 (0.0%) |
| Mining, Quarrying, & Extraction | 0 (0.0%) | 0 (0.0%) |
| Construction | 141 (100.0%) | 0 (0.0%) |
| Manufacturing | 149 (87.6%) | 21 (12.3%) |
| Wholesale Trade | 61 (100.0%) | 0 (0.0%) |
| Retail Trade | 367 (76.1%) | 115 (23.9%) |
| Transportation & Warehousing | 181 (66.3%) | 92 (33.7%) |
| Utilities | 23 (100.0%) | 0 (0.0%) |
| Information | 50 (100.0%) | 0 (0.0%) |
| Finance & Insurance | 88 (37.8%) | 145 (62.2%) |
| Real Estate, Rental & Leasing | 0 (0.0%) | 0 (0.0%) |
| Professional & Scientific | 0 (0.0%) | 105 (100.0%) |
| Enterprise Management | 0 (0.0%) | 0 (0.0%) |
| Administrative & Support | 3 (3.3%) | 87 (96.7%) |
| Educational Services | 60 (17.6%) | 280 (82.4%) |
| Health Care & Social Assistance | 186 (32.4%) | 388 (67.6%) |
| Arts, Entertainment & Recreation | 0 (0.0%) | 0 (0.0%) |
| Accommodation & Food Services | 19 (100.0%) | 0 (0.0%) |
| Public Administration | 192 (85.3%) | 33 (14.7%) |
| Total | 1,556 (55.1%) | 1,266 (44.9%) |
Education in Byron
School Enrollment in Byron
The most common levels of schooling among the 1,847 students in Byron are high school (428 | 23.2%), college / undergraduate (425 | 23.0%), and middle school (423 | 22.9%).
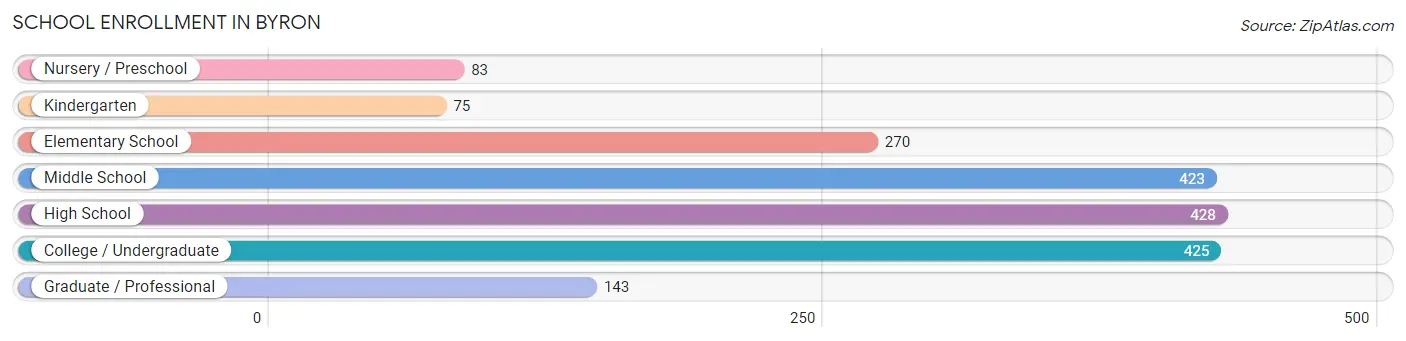
| School Level | # Students | % Students |
| Nursery / Preschool | 83 | 4.5% |
| Kindergarten | 75 | 4.1% |
| Elementary School | 270 | 14.6% |
| Middle School | 423 | 22.9% |
| High School | 428 | 23.2% |
| College / Undergraduate | 425 | 23.0% |
| Graduate / Professional | 143 | 7.7% |
| Total | 1,847 | 100.0% |
School Enrollment by Age by Funding Source in Byron
Out of a total of 1,847 students who are enrolled in schools in Byron, 170 (9.2%) attend a private institution, while the remaining 1,677 (90.8%) are enrolled in public schools. The age group of 3 to 4 year olds has the highest likelihood of being enrolled in private schools, with 83 (100.0% in the age bracket) enrolled. Conversely, the age group of 5 to 9 year old has the lowest likelihood of being enrolled in a private school, with 345 (100.0% in the age bracket) attending a public institution.
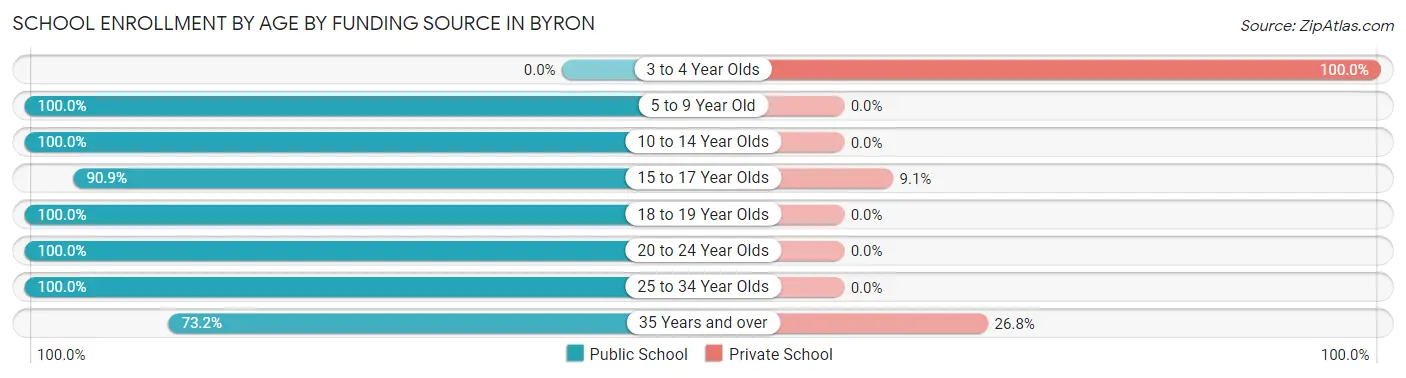
| Age Bracket | Public School | Private School |
| 3 to 4 Year Olds | 0 (0.0%) | 83 (100.0%) |
| 5 to 9 Year Old | 345 (100.0%) | 0 (0.0%) |
| 10 to 14 Year Olds | 423 (100.0%) | 0 (0.0%) |
| 15 to 17 Year Olds | 389 (90.9%) | 39 (9.1%) |
| 18 to 19 Year Olds | 15 (100.0%) | 0 (0.0%) |
| 20 to 24 Year Olds | 240 (100.0%) | 0 (0.0%) |
| 25 to 34 Year Olds | 134 (100.0%) | 0 (0.0%) |
| 35 Years and over | 131 (73.2%) | 48 (26.8%) |
| Total | 1,677 (90.8%) | 170 (9.2%) |
Educational Attainment by Field of Study in Byron
Business (328 | 28.9%), education (239 | 21.1%), visual & performing arts (124 | 10.9%), science & technology (85 | 7.5%), and engineering (76 | 6.7%) are the most common fields of study among 1,134 individuals in Byron who have obtained a bachelor's degree or higher.
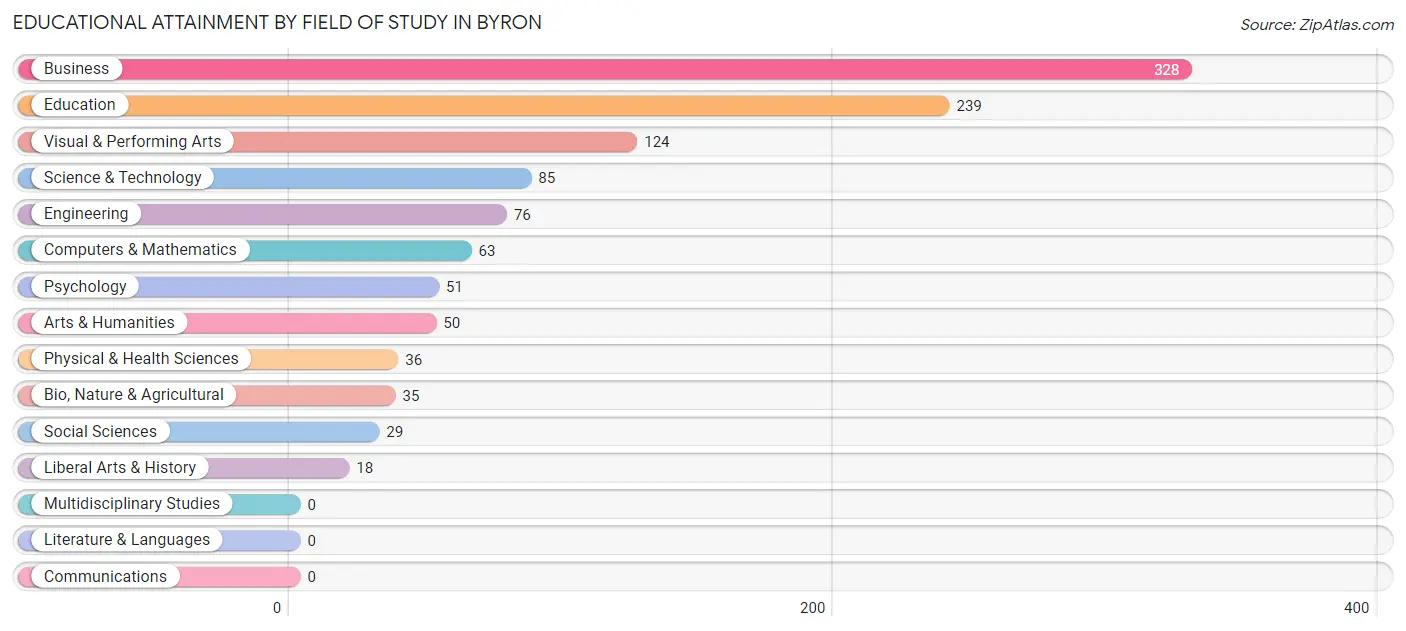
| Field of Study | # Graduates | % Graduates |
| Computers & Mathematics | 63 | 5.6% |
| Bio, Nature & Agricultural | 35 | 3.1% |
| Physical & Health Sciences | 36 | 3.2% |
| Psychology | 51 | 4.5% |
| Social Sciences | 29 | 2.6% |
| Engineering | 76 | 6.7% |
| Multidisciplinary Studies | 0 | 0.0% |
| Science & Technology | 85 | 7.5% |
| Business | 328 | 28.9% |
| Education | 239 | 21.1% |
| Literature & Languages | 0 | 0.0% |
| Liberal Arts & History | 18 | 1.6% |
| Visual & Performing Arts | 124 | 10.9% |
| Communications | 0 | 0.0% |
| Arts & Humanities | 50 | 4.4% |
| Total | 1,134 | 100.0% |
Transportation & Commute in Byron
Vehicle Availability by Sex in Byron
The most prevalent vehicle ownership categories in Byron are males with 3 vehicles (600, accounting for 38.6%) and females with 3 vehicles (319, making up 54.9%).
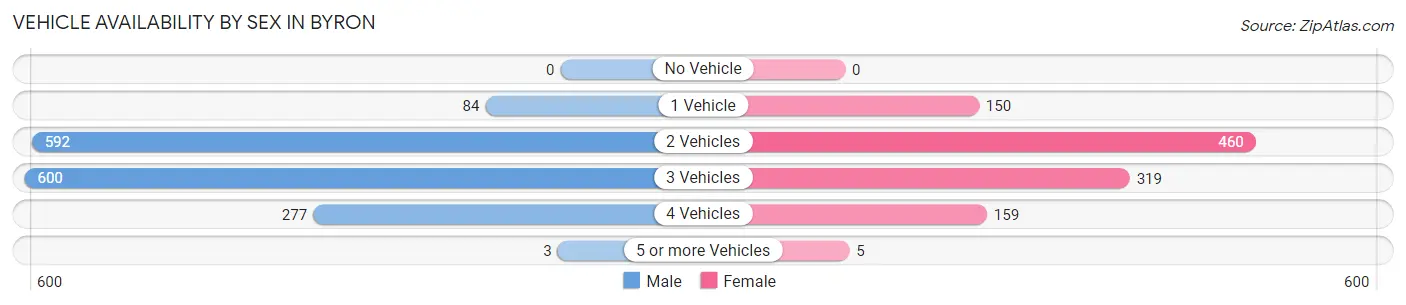
| Vehicles Available | Male | Female |
| No Vehicle | 0 (0.0%) | 0 (0.0%) |
| 1 Vehicle | 84 (5.4%) | 150 (13.7%) |
| 2 Vehicles | 592 (38.1%) | 460 (42.1%) |
| 3 Vehicles | 600 (38.6%) | 319 (29.2%) |
| 4 Vehicles | 277 (17.8%) | 159 (14.5%) |
| 5 or more Vehicles | 3 (0.2%) | 5 (0.5%) |
| Total | 1,556 (100.0%) | 1,093 (100.0%) |
Commute Time in Byron
The most frequently occuring commute durations in Byron are 20 to 24 minutes (516 commuters, 24.6%), 10 to 14 minutes (350 commuters, 16.7%), and 15 to 19 minutes (259 commuters, 12.3%).
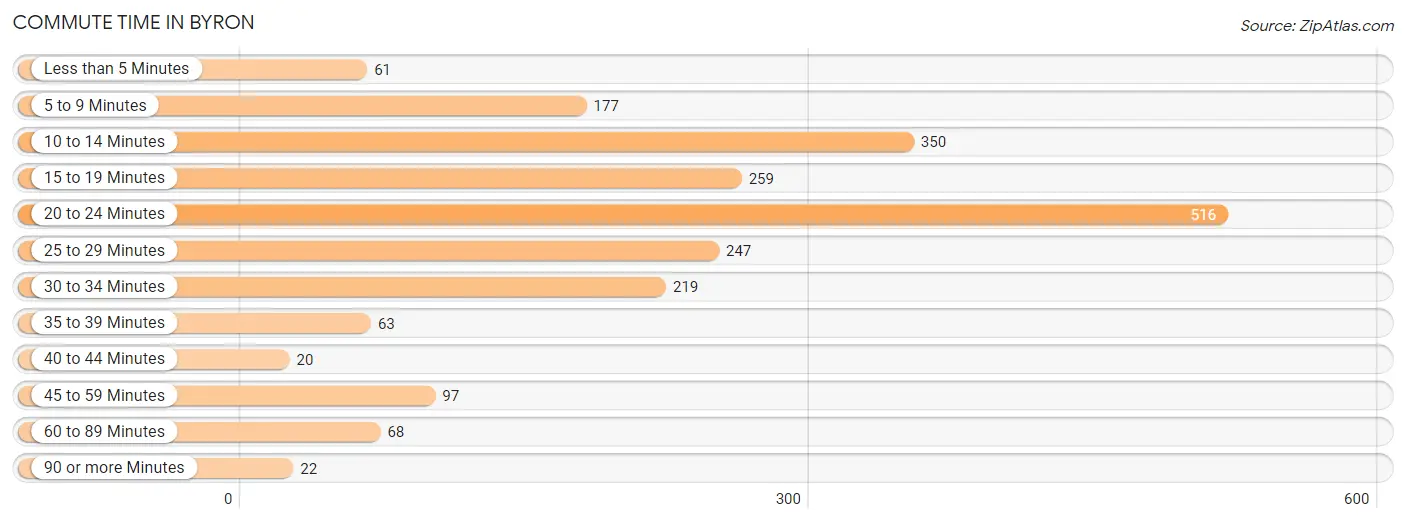
| Commute Time | # Commuters | % Commuters |
| Less than 5 Minutes | 61 | 2.9% |
| 5 to 9 Minutes | 177 | 8.4% |
| 10 to 14 Minutes | 350 | 16.7% |
| 15 to 19 Minutes | 259 | 12.3% |
| 20 to 24 Minutes | 516 | 24.6% |
| 25 to 29 Minutes | 247 | 11.8% |
| 30 to 34 Minutes | 219 | 10.4% |
| 35 to 39 Minutes | 63 | 3.0% |
| 40 to 44 Minutes | 20 | 0.9% |
| 45 to 59 Minutes | 97 | 4.6% |
| 60 to 89 Minutes | 68 | 3.2% |
| 90 or more Minutes | 22 | 1.1% |
Commute Time by Sex in Byron
The most common commute times in Byron are 15 to 19 minutes (259 commuters, 22.5%) for males and 20 to 24 minutes (298 commuters, 31.4%) for females.
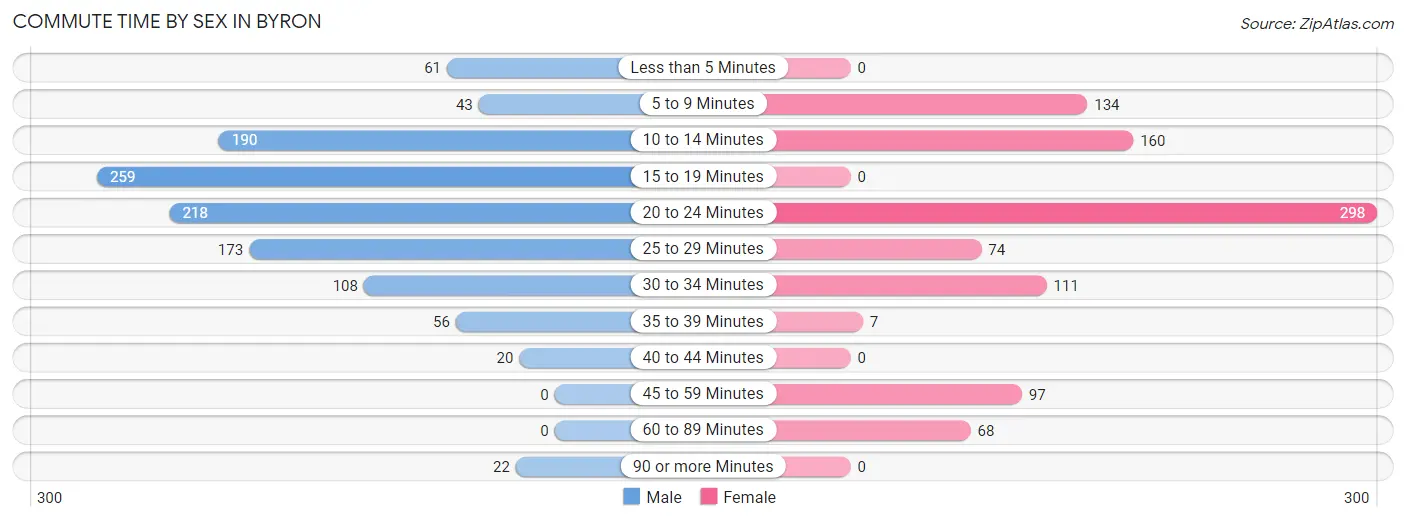
| Commute Time | Male | Female |
| Less than 5 Minutes | 61 (5.3%) | 0 (0.0%) |
| 5 to 9 Minutes | 43 (3.7%) | 134 (14.1%) |
| 10 to 14 Minutes | 190 (16.5%) | 160 (16.9%) |
| 15 to 19 Minutes | 259 (22.5%) | 0 (0.0%) |
| 20 to 24 Minutes | 218 (19.0%) | 298 (31.4%) |
| 25 to 29 Minutes | 173 (15.0%) | 74 (7.8%) |
| 30 to 34 Minutes | 108 (9.4%) | 111 (11.7%) |
| 35 to 39 Minutes | 56 (4.9%) | 7 (0.7%) |
| 40 to 44 Minutes | 20 (1.7%) | 0 (0.0%) |
| 45 to 59 Minutes | 0 (0.0%) | 97 (10.2%) |
| 60 to 89 Minutes | 0 (0.0%) | 68 (7.2%) |
| 90 or more Minutes | 22 (1.9%) | 0 (0.0%) |
Time of Departure to Work by Sex in Byron
The most frequent times of departure to work in Byron are 7:30 AM to 7:59 AM (301, 26.2%) for males and 7:00 AM to 7:29 AM (223, 23.5%) for females.
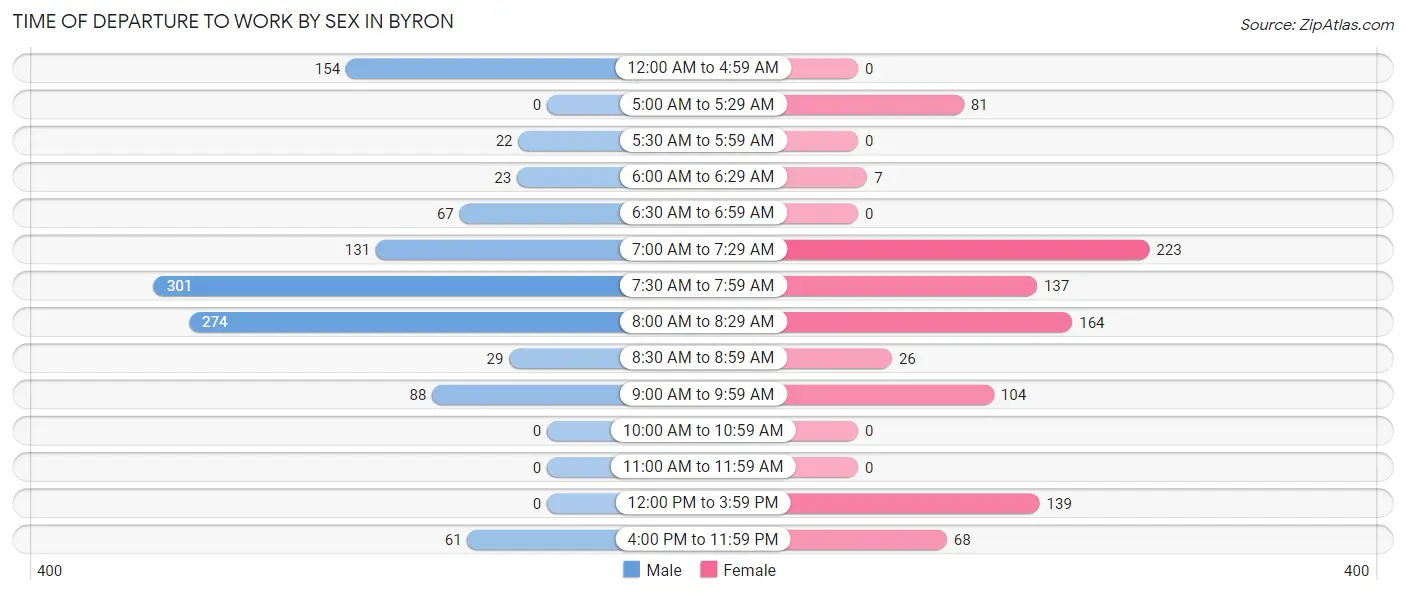
| Time of Departure | Male | Female |
| 12:00 AM to 4:59 AM | 154 (13.4%) | 0 (0.0%) |
| 5:00 AM to 5:29 AM | 0 (0.0%) | 81 (8.5%) |
| 5:30 AM to 5:59 AM | 22 (1.9%) | 0 (0.0%) |
| 6:00 AM to 6:29 AM | 23 (2.0%) | 7 (0.7%) |
| 6:30 AM to 6:59 AM | 67 (5.8%) | 0 (0.0%) |
| 7:00 AM to 7:29 AM | 131 (11.4%) | 223 (23.5%) |
| 7:30 AM to 7:59 AM | 301 (26.2%) | 137 (14.4%) |
| 8:00 AM to 8:29 AM | 274 (23.8%) | 164 (17.3%) |
| 8:30 AM to 8:59 AM | 29 (2.5%) | 26 (2.7%) |
| 9:00 AM to 9:59 AM | 88 (7.6%) | 104 (11.0%) |
| 10:00 AM to 10:59 AM | 0 (0.0%) | 0 (0.0%) |
| 11:00 AM to 11:59 AM | 0 (0.0%) | 0 (0.0%) |
| 12:00 PM to 3:59 PM | 0 (0.0%) | 139 (14.6%) |
| 4:00 PM to 11:59 PM | 61 (5.3%) | 68 (7.2%) |
| Total | 1,150 (100.0%) | 949 (100.0%) |
Housing Occupancy in Byron
Occupancy by Ownership in Byron
Of the total 2,065 dwellings in Byron, owner-occupied units account for 1,747 (84.6%), while renter-occupied units make up 318 (15.4%).
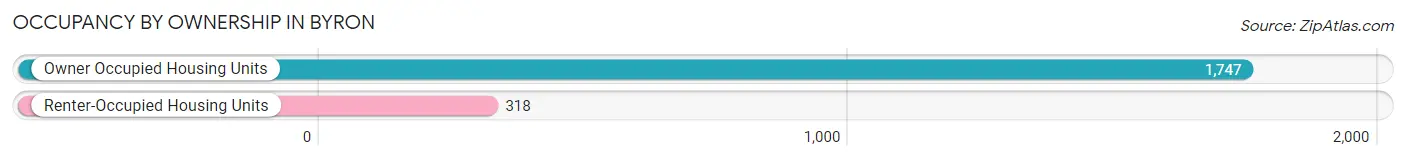
| Occupancy | # Housing Units | % Housing Units |
| Owner Occupied Housing Units | 1,747 | 84.6% |
| Renter-Occupied Housing Units | 318 | 15.4% |
| Total Occupied Housing Units | 2,065 | 100.0% |
Occupancy by Household Size in Byron
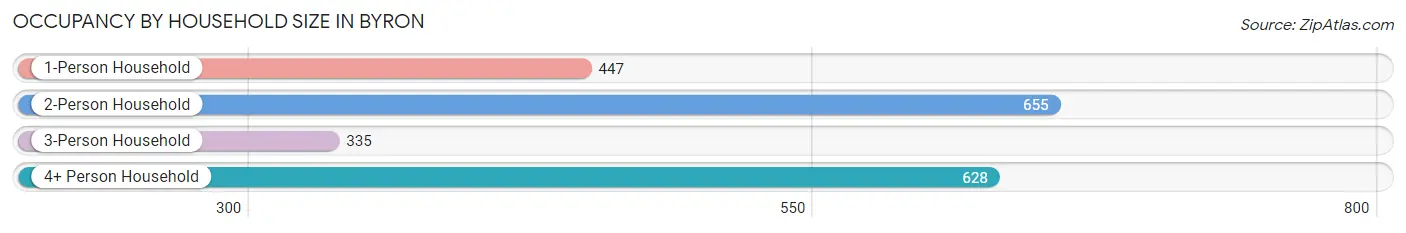
| Household Size | # Housing Units | % Housing Units |
| 1-Person Household | 447 | 21.6% |
| 2-Person Household | 655 | 31.7% |
| 3-Person Household | 335 | 16.2% |
| 4+ Person Household | 628 | 30.4% |
| Total Housing Units | 2,065 | 100.0% |
Occupancy by Ownership by Household Size in Byron
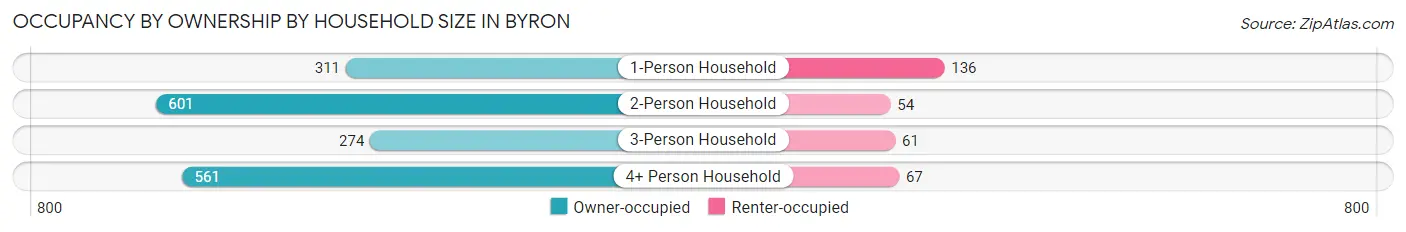
| Household Size | Owner-occupied | Renter-occupied |
| 1-Person Household | 311 (69.6%) | 136 (30.4%) |
| 2-Person Household | 601 (91.8%) | 54 (8.2%) |
| 3-Person Household | 274 (81.8%) | 61 (18.2%) |
| 4+ Person Household | 561 (89.3%) | 67 (10.7%) |
| Total Housing Units | 1,747 (84.6%) | 318 (15.4%) |
Occupancy by Educational Attainment in Byron
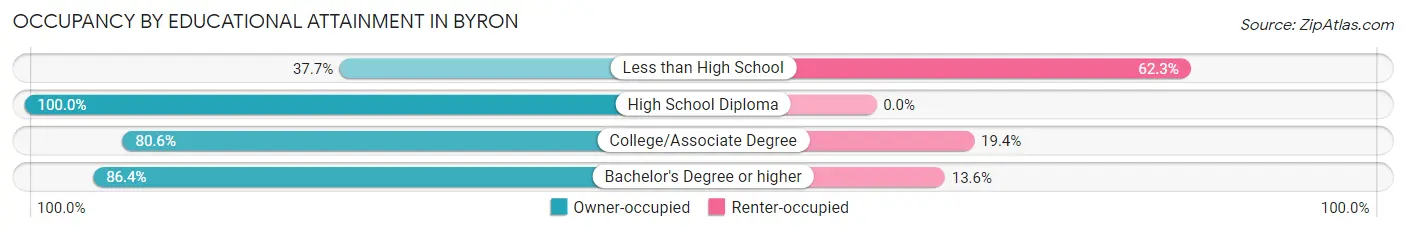
| Household Size | Owner-occupied | Renter-occupied |
| Less than High School | 55 (37.7%) | 91 (62.3%) |
| High School Diploma | 574 (100.0%) | 0 (0.0%) |
| College/Associate Degree | 610 (80.6%) | 147 (19.4%) |
| Bachelor's Degree or higher | 508 (86.4%) | 80 (13.6%) |
Occupancy by Age of Householder in Byron
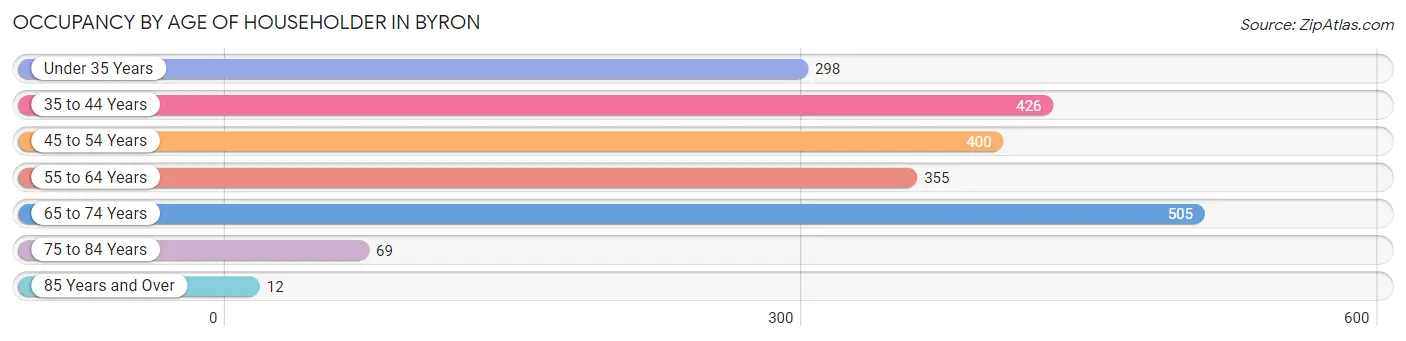
| Age Bracket | # Households | % Households |
| Under 35 Years | 298 | 14.4% |
| 35 to 44 Years | 426 | 20.6% |
| 45 to 54 Years | 400 | 19.4% |
| 55 to 64 Years | 355 | 17.2% |
| 65 to 74 Years | 505 | 24.5% |
| 75 to 84 Years | 69 | 3.3% |
| 85 Years and Over | 12 | 0.6% |
| Total | 2,065 | 100.0% |
Housing Finances in Byron
Median Income by Occupancy in Byron
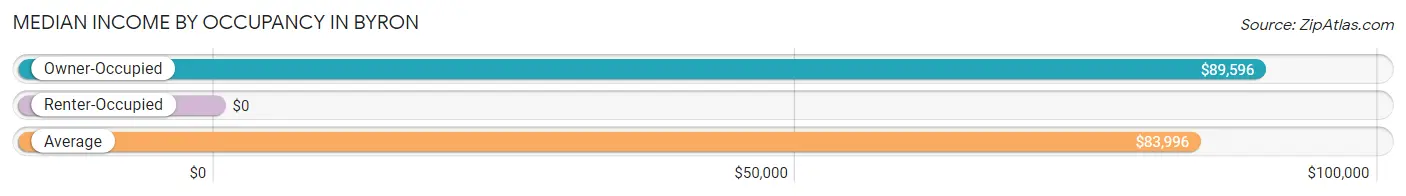
| Occupancy Type | # Households | Median Income |
| Owner-Occupied | 1,747 (84.6%) | $89,596 |
| Renter-Occupied | 318 (15.4%) | $0 |
| Average | 2,065 (100.0%) | $83,996 |
Occupancy by Householder Income Bracket in Byron
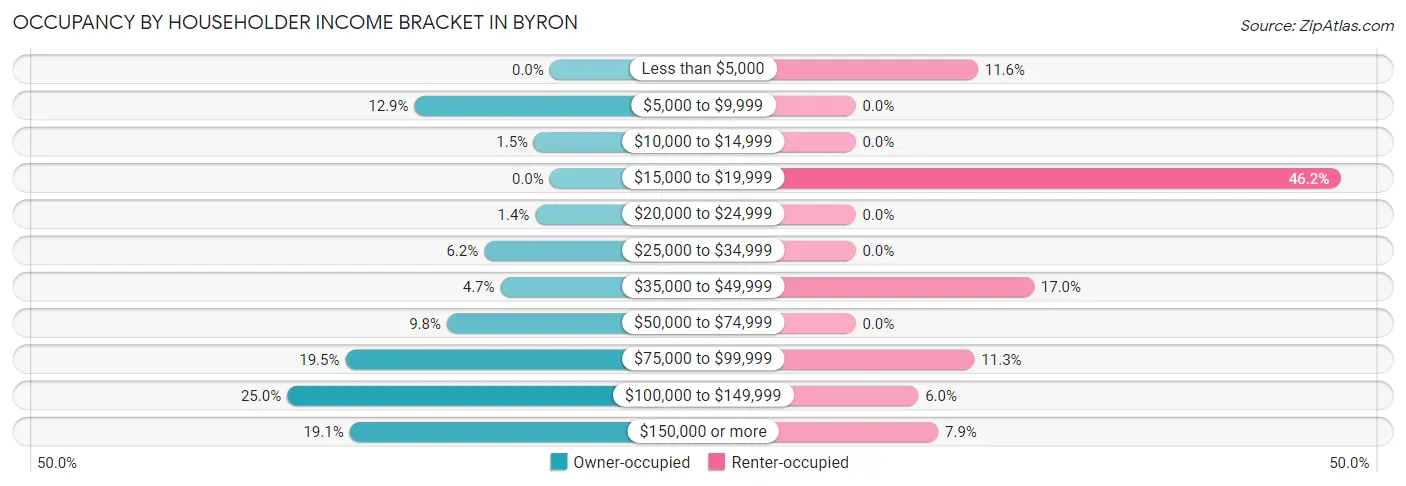
| Income Bracket | Owner-occupied | Renter-occupied |
| Less than $5,000 | 0 (0.0%) | 37 (11.6%) |
| $5,000 to $9,999 | 225 (12.9%) | 0 (0.0%) |
| $10,000 to $14,999 | 26 (1.5%) | 0 (0.0%) |
| $15,000 to $19,999 | 0 (0.0%) | 147 (46.2%) |
| $20,000 to $24,999 | 24 (1.4%) | 0 (0.0%) |
| $25,000 to $34,999 | 109 (6.2%) | 0 (0.0%) |
| $35,000 to $49,999 | 82 (4.7%) | 54 (17.0%) |
| $50,000 to $74,999 | 171 (9.8%) | 0 (0.0%) |
| $75,000 to $99,999 | 340 (19.5%) | 36 (11.3%) |
| $100,000 to $149,999 | 437 (25.0%) | 19 (6.0%) |
| $150,000 or more | 333 (19.1%) | 25 (7.9%) |
| Total | 1,747 (100.0%) | 318 (100.0%) |
Monthly Housing Cost Tiers in Byron
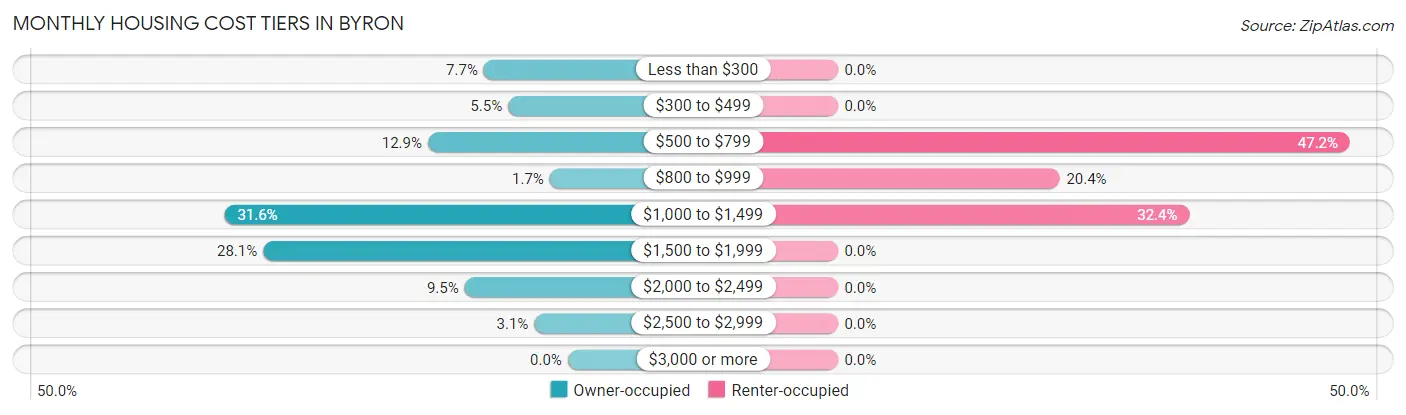
| Monthly Cost | Owner-occupied | Renter-occupied |
| Less than $300 | 135 (7.7%) | 0 (0.0%) |
| $300 to $499 | 96 (5.5%) | 0 (0.0%) |
| $500 to $799 | 225 (12.9%) | 150 (47.2%) |
| $800 to $999 | 29 (1.7%) | 65 (20.4%) |
| $1,000 to $1,499 | 552 (31.6%) | 103 (32.4%) |
| $1,500 to $1,999 | 490 (28.1%) | 0 (0.0%) |
| $2,000 to $2,499 | 166 (9.5%) | 0 (0.0%) |
| $2,500 to $2,999 | 54 (3.1%) | 0 (0.0%) |
| $3,000 or more | 0 (0.0%) | 0 (0.0%) |
| Total | 1,747 (100.0%) | 318 (100.0%) |
Physical Housing Characteristics in Byron
Housing Structures in Byron
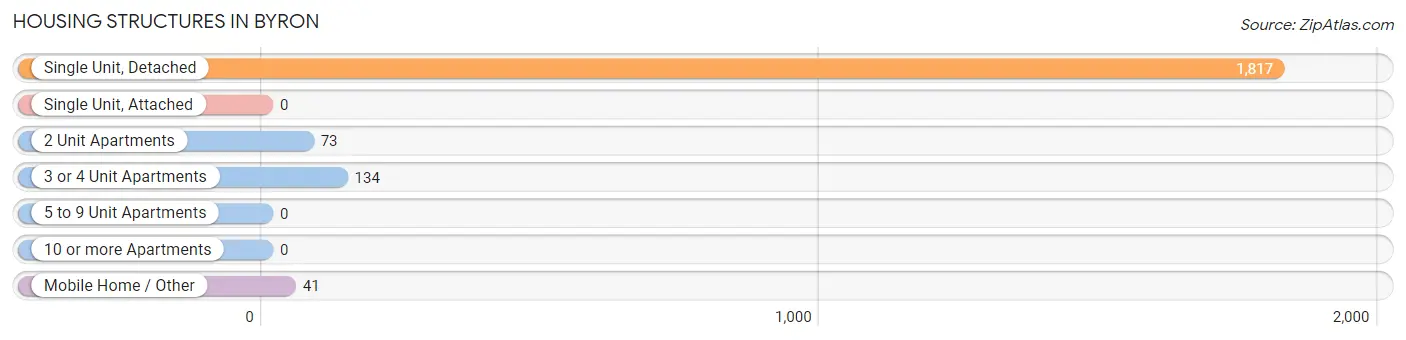
| Structure Type | # Housing Units | % Housing Units |
| Single Unit, Detached | 1,817 | 88.0% |
| Single Unit, Attached | 0 | 0.0% |
| 2 Unit Apartments | 73 | 3.5% |
| 3 or 4 Unit Apartments | 134 | 6.5% |
| 5 to 9 Unit Apartments | 0 | 0.0% |
| 10 or more Apartments | 0 | 0.0% |
| Mobile Home / Other | 41 | 2.0% |
| Total | 2,065 | 100.0% |
Housing Structures by Occupancy in Byron
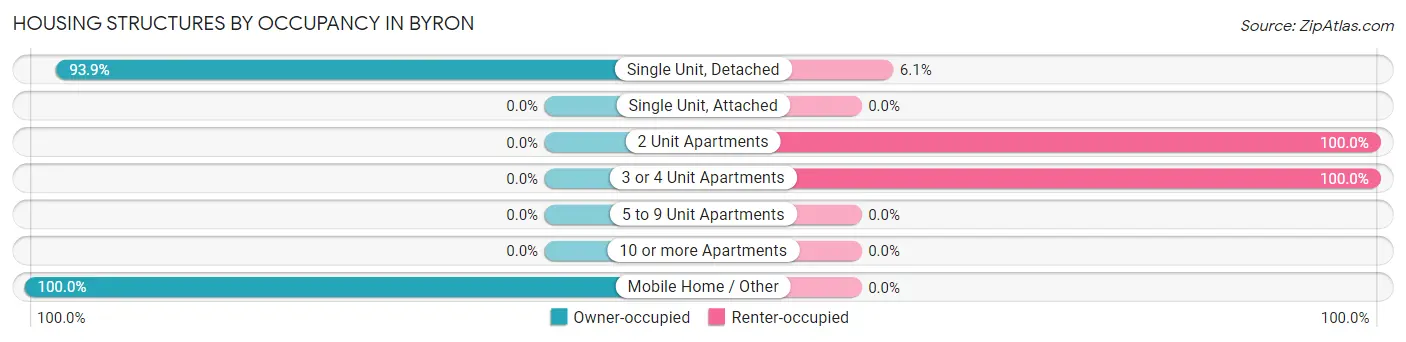
| Structure Type | Owner-occupied | Renter-occupied |
| Single Unit, Detached | 1,706 (93.9%) | 111 (6.1%) |
| Single Unit, Attached | 0 (0.0%) | 0 (0.0%) |
| 2 Unit Apartments | 0 (0.0%) | 73 (100.0%) |
| 3 or 4 Unit Apartments | 0 (0.0%) | 134 (100.0%) |
| 5 to 9 Unit Apartments | 0 (0.0%) | 0 (0.0%) |
| 10 or more Apartments | 0 (0.0%) | 0 (0.0%) |
| Mobile Home / Other | 41 (100.0%) | 0 (0.0%) |
| Total | 1,747 (84.6%) | 318 (15.4%) |
Housing Structures by Number of Rooms in Byron
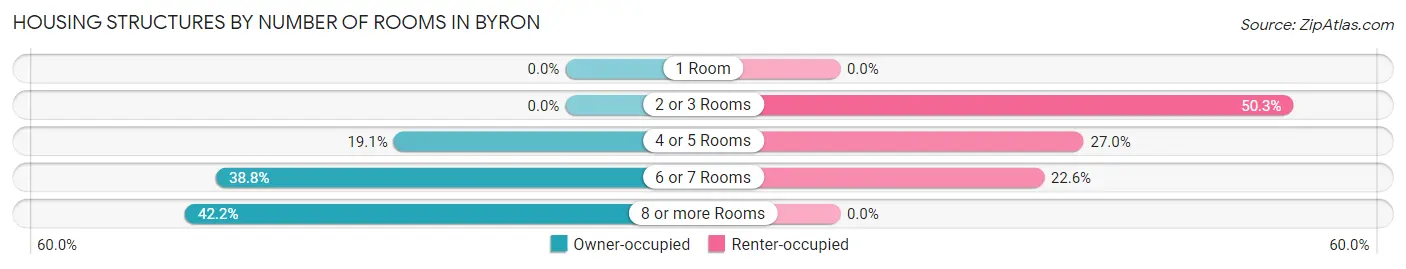
| Number of Rooms | Owner-occupied | Renter-occupied |
| 1 Room | 0 (0.0%) | 0 (0.0%) |
| 2 or 3 Rooms | 0 (0.0%) | 160 (50.3%) |
| 4 or 5 Rooms | 333 (19.1%) | 86 (27.0%) |
| 6 or 7 Rooms | 677 (38.8%) | 72 (22.6%) |
| 8 or more Rooms | 737 (42.2%) | 0 (0.0%) |
| Total | 1,747 (100.0%) | 318 (100.0%) |
Housing Structure by Heating Type in Byron
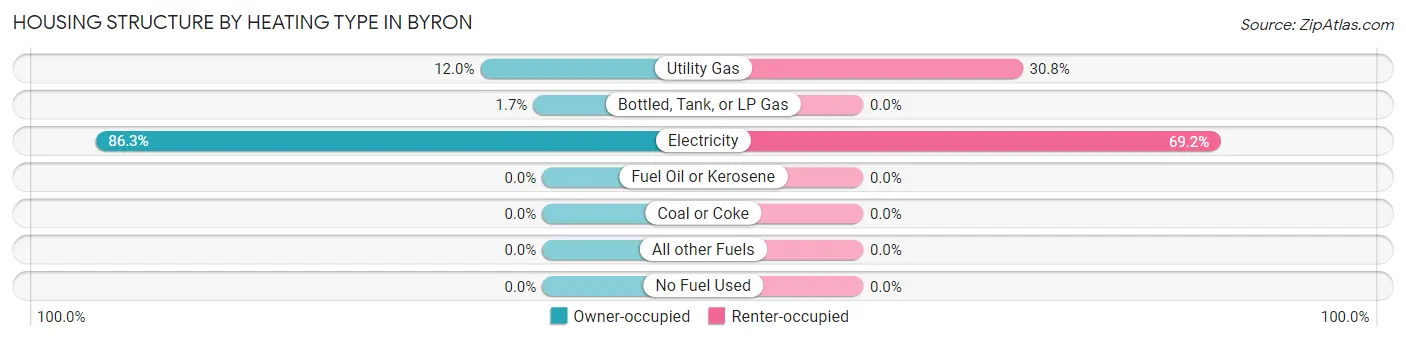
| Heating Type | Owner-occupied | Renter-occupied |
| Utility Gas | 209 (12.0%) | 98 (30.8%) |
| Bottled, Tank, or LP Gas | 30 (1.7%) | 0 (0.0%) |
| Electricity | 1,508 (86.3%) | 220 (69.2%) |
| Fuel Oil or Kerosene | 0 (0.0%) | 0 (0.0%) |
| Coal or Coke | 0 (0.0%) | 0 (0.0%) |
| All other Fuels | 0 (0.0%) | 0 (0.0%) |
| No Fuel Used | 0 (0.0%) | 0 (0.0%) |
| Total | 1,747 (100.0%) | 318 (100.0%) |
Household Vehicle Usage in Byron
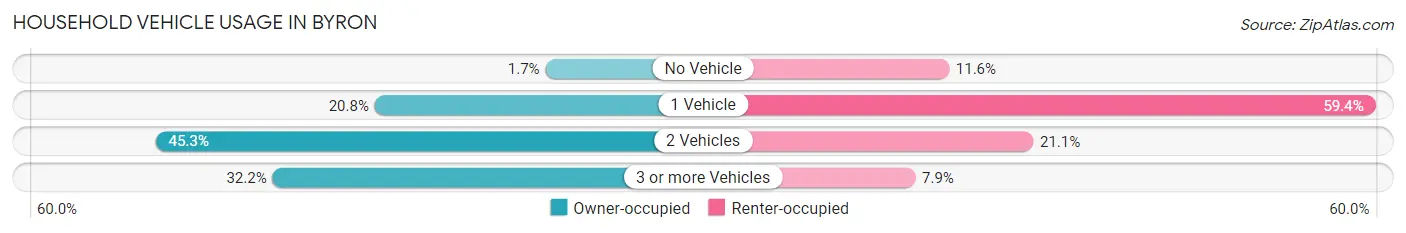
| Vehicles per Household | Owner-occupied | Renter-occupied |
| No Vehicle | 29 (1.7%) | 37 (11.6%) |
| 1 Vehicle | 363 (20.8%) | 189 (59.4%) |
| 2 Vehicles | 792 (45.3%) | 67 (21.1%) |
| 3 or more Vehicles | 563 (32.2%) | 25 (7.9%) |
| Total | 1,747 (100.0%) | 318 (100.0%) |
Real Estate & Mortgages in Byron
Real Estate and Mortgage Overview in Byron
| Characteristic | Without Mortgage | With Mortgage |
| Housing Units | 372 | 1,375 |
| Median Property Value | $142,800 | $213,800 |
| Median Household Income | $125,114 | $183 |
| Monthly Housing Costs | $439 | $0 |
| Real Estate Taxes | $2,506 | $107 |
Property Value by Mortgage Status in Byron
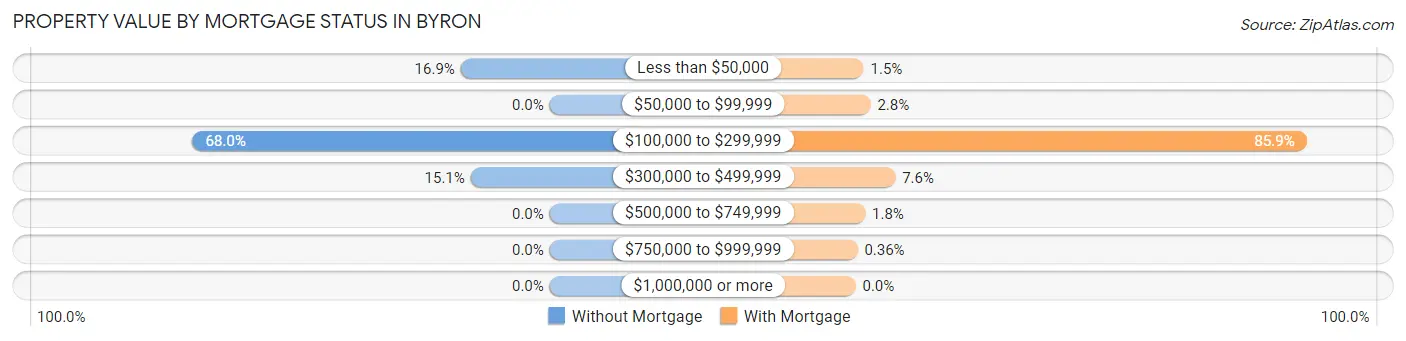
| Property Value | Without Mortgage | With Mortgage |
| Less than $50,000 | 63 (16.9%) | 21 (1.5%) |
| $50,000 to $99,999 | 0 (0.0%) | 39 (2.8%) |
| $100,000 to $299,999 | 253 (68.0%) | 1,181 (85.9%) |
| $300,000 to $499,999 | 56 (15.0%) | 104 (7.6%) |
| $500,000 to $749,999 | 0 (0.0%) | 25 (1.8%) |
| $750,000 to $999,999 | 0 (0.0%) | 5 (0.4%) |
| $1,000,000 or more | 0 (0.0%) | 0 (0.0%) |
| Total | 372 (100.0%) | 1,375 (100.0%) |
Household Income by Mortgage Status in Byron
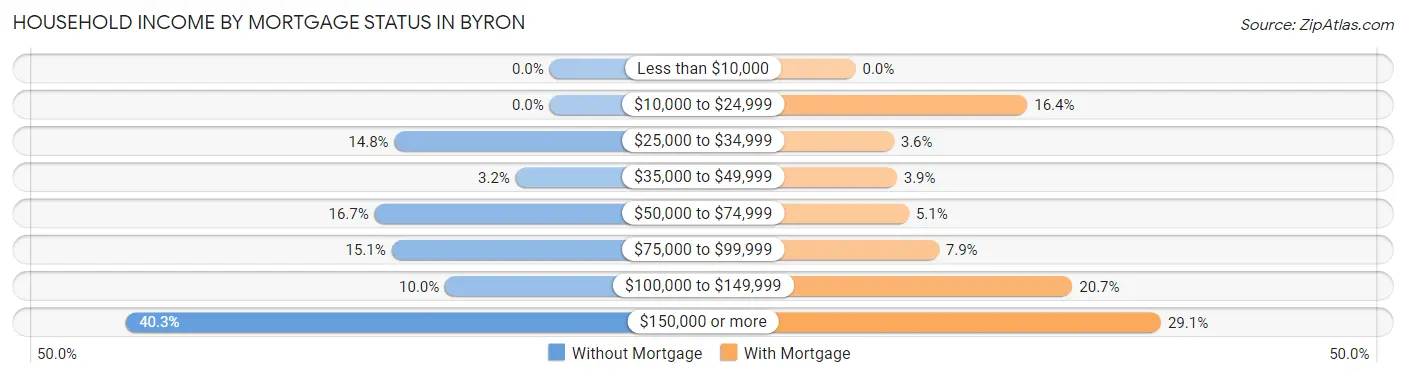
| Household Income | Without Mortgage | With Mortgage |
| Less than $10,000 | 0 (0.0%) | 0 (0.0%) |
| $10,000 to $24,999 | 0 (0.0%) | 225 (16.4%) |
| $25,000 to $34,999 | 55 (14.8%) | 50 (3.6%) |
| $35,000 to $49,999 | 12 (3.2%) | 54 (3.9%) |
| $50,000 to $74,999 | 62 (16.7%) | 70 (5.1%) |
| $75,000 to $99,999 | 56 (15.0%) | 109 (7.9%) |
| $100,000 to $149,999 | 37 (10.0%) | 284 (20.6%) |
| $150,000 or more | 150 (40.3%) | 400 (29.1%) |
| Total | 372 (100.0%) | 1,375 (100.0%) |
Property Value to Household Income Ratio in Byron
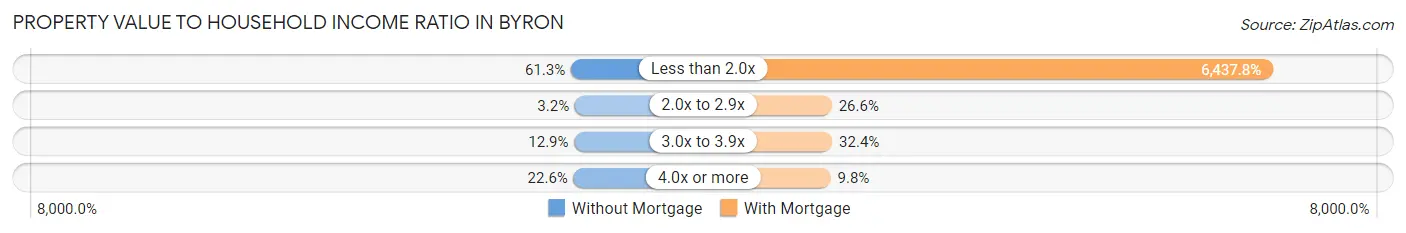
| Value-to-Income Ratio | Without Mortgage | With Mortgage |
| Less than 2.0x | 228 (61.3%) | 88,519 (6,437.7%) |
| 2.0x to 2.9x | 12 (3.2%) | 366 (26.6%) |
| 3.0x to 3.9x | 48 (12.9%) | 446 (32.4%) |
| 4.0x or more | 84 (22.6%) | 134 (9.8%) |
| Total | 372 (100.0%) | 1,375 (100.0%) |
Real Estate Taxes by Mortgage Status in Byron
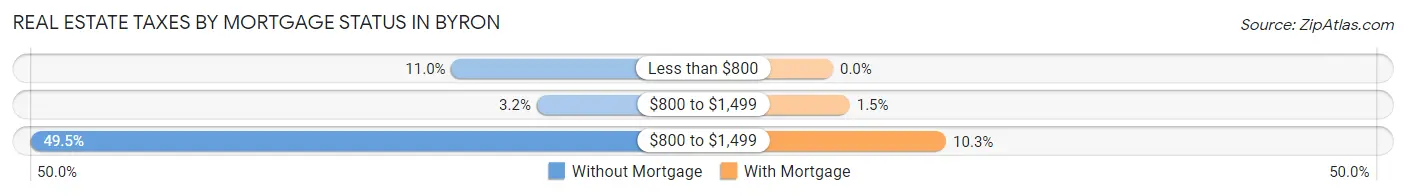
| Property Taxes | Without Mortgage | With Mortgage |
| Less than $800 | 41 (11.0%) | 0 (0.0%) |
| $800 to $1,499 | 12 (3.2%) | 21 (1.5%) |
| $800 to $1,499 | 184 (49.5%) | 142 (10.3%) |
| Total | 372 (100.0%) | 1,375 (100.0%) |
Health & Disability in Byron
Health Insurance Coverage by Age in Byron
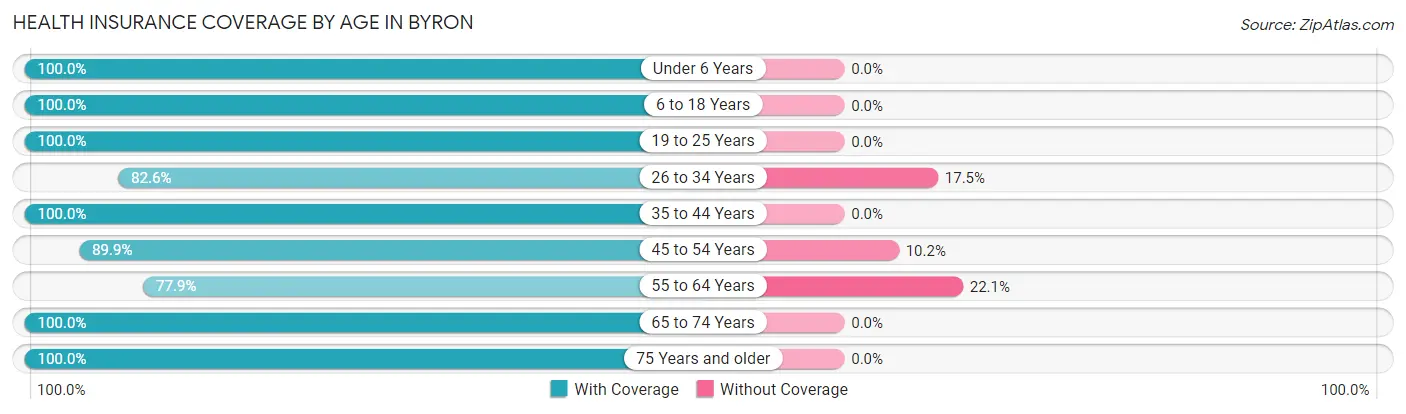
| Age Bracket | With Coverage | Without Coverage |
| Under 6 Years | 365 (100.0%) | 0 (0.0%) |
| 6 to 18 Years | 1,136 (100.0%) | 0 (0.0%) |
| 19 to 25 Years | 395 (100.0%) | 0 (0.0%) |
| 26 to 34 Years | 601 (82.6%) | 127 (17.4%) |
| 35 to 44 Years | 828 (100.0%) | 0 (0.0%) |
| 45 to 54 Years | 522 (89.8%) | 59 (10.2%) |
| 55 to 64 Years | 571 (77.9%) | 162 (22.1%) |
| 65 to 74 Years | 703 (100.0%) | 0 (0.0%) |
| 75 Years and older | 218 (100.0%) | 0 (0.0%) |
| Total | 5,339 (93.9%) | 348 (6.1%) |
Health Insurance Coverage by Citizenship Status in Byron
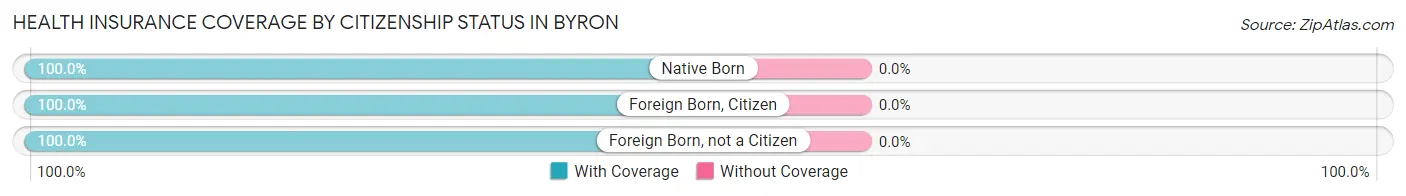
| Citizenship Status | With Coverage | Without Coverage |
| Native Born | 365 (100.0%) | 0 (0.0%) |
| Foreign Born, Citizen | 1,136 (100.0%) | 0 (0.0%) |
| Foreign Born, not a Citizen | 395 (100.0%) | 0 (0.0%) |
Health Insurance Coverage by Household Income in Byron
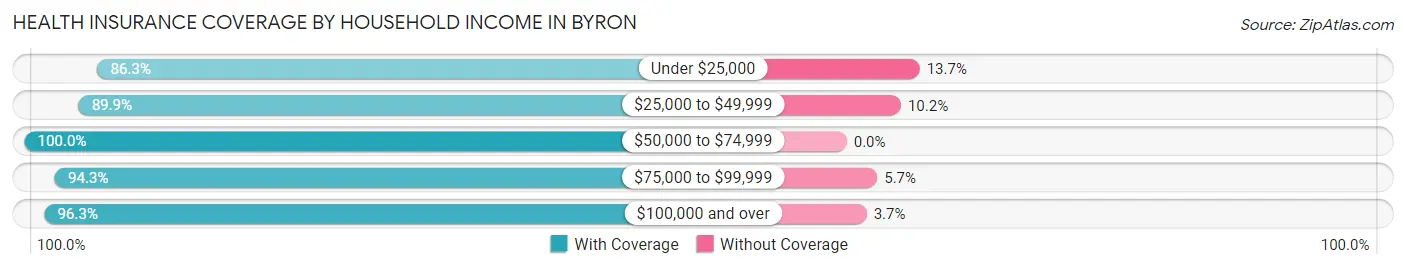
| Household Income | With Coverage | Without Coverage |
| Under $25,000 | 784 (86.3%) | 124 (13.7%) |
| $25,000 to $49,999 | 522 (89.8%) | 59 (10.2%) |
| $50,000 to $74,999 | 443 (100.0%) | 0 (0.0%) |
| $75,000 to $99,999 | 1,190 (94.3%) | 72 (5.7%) |
| $100,000 and over | 2,400 (96.3%) | 93 (3.7%) |
Public vs Private Health Insurance Coverage by Age in Byron
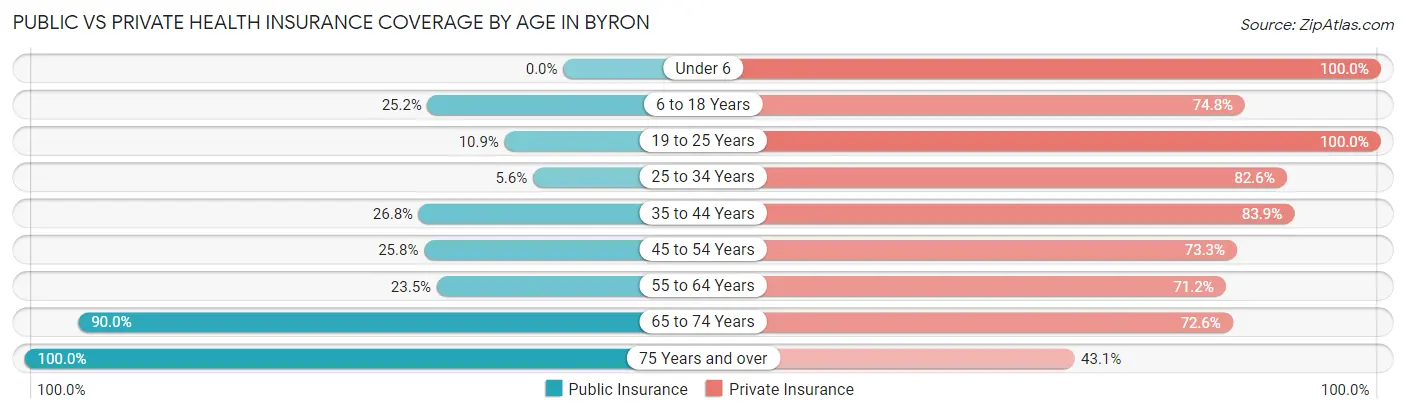
| Age Bracket | Public Insurance | Private Insurance |
| Under 6 | 0 (0.0%) | 365 (100.0%) |
| 6 to 18 Years | 286 (25.2%) | 850 (74.8%) |
| 19 to 25 Years | 43 (10.9%) | 395 (100.0%) |
| 25 to 34 Years | 41 (5.6%) | 601 (82.6%) |
| 35 to 44 Years | 222 (26.8%) | 695 (83.9%) |
| 45 to 54 Years | 150 (25.8%) | 426 (73.3%) |
| 55 to 64 Years | 172 (23.5%) | 522 (71.2%) |
| 65 to 74 Years | 633 (90.0%) | 510 (72.6%) |
| 75 Years and over | 218 (100.0%) | 94 (43.1%) |
| Total | 1,765 (31.0%) | 4,458 (78.4%) |
Disability Status by Sex by Age in Byron
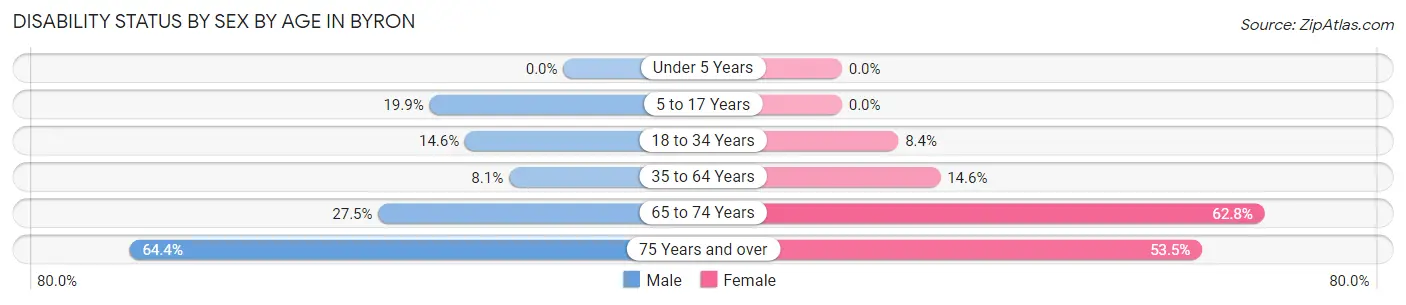
| Age Bracket | Male | Female |
| Under 5 Years | 0 (0.0%) | 0 (0.0%) |
| 5 to 17 Years | 160 (19.9%) | 0 (0.0%) |
| 18 to 34 Years | 79 (14.6%) | 50 (8.4%) |
| 35 to 64 Years | 84 (8.1%) | 161 (14.6%) |
| 65 to 74 Years | 75 (27.5%) | 270 (62.8%) |
| 75 Years and over | 67 (64.4%) | 61 (53.5%) |
Disability Class by Sex by Age in Byron
Disability Class: Hearing Difficulty
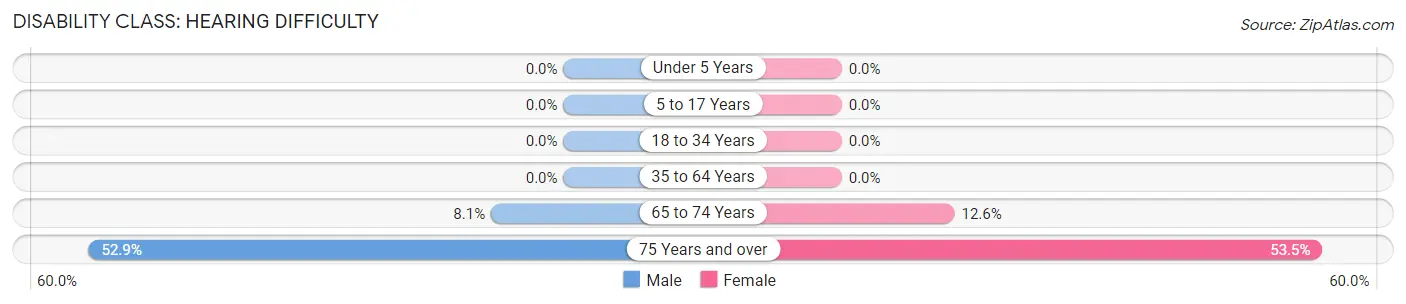
| Age Bracket | Male | Female |
| Under 5 Years | 0 (0.0%) | 0 (0.0%) |
| 5 to 17 Years | 0 (0.0%) | 0 (0.0%) |
| 18 to 34 Years | 0 (0.0%) | 0 (0.0%) |
| 35 to 64 Years | 0 (0.0%) | 0 (0.0%) |
| 65 to 74 Years | 22 (8.1%) | 54 (12.6%) |
| 75 Years and over | 55 (52.9%) | 61 (53.5%) |
Disability Class: Vision Difficulty
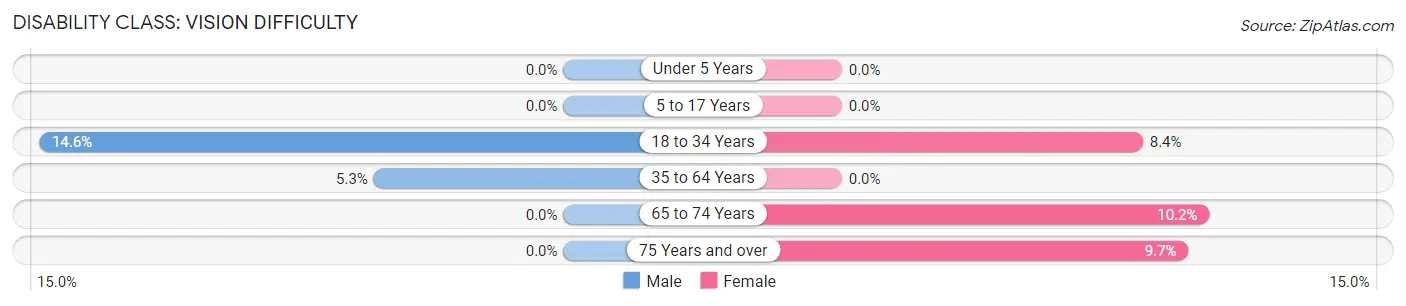
| Age Bracket | Male | Female |
| Under 5 Years | 0 (0.0%) | 0 (0.0%) |
| 5 to 17 Years | 0 (0.0%) | 0 (0.0%) |
| 18 to 34 Years | 79 (14.6%) | 50 (8.4%) |
| 35 to 64 Years | 55 (5.3%) | 0 (0.0%) |
| 65 to 74 Years | 0 (0.0%) | 44 (10.2%) |
| 75 Years and over | 0 (0.0%) | 11 (9.7%) |
Disability Class: Cognitive Difficulty
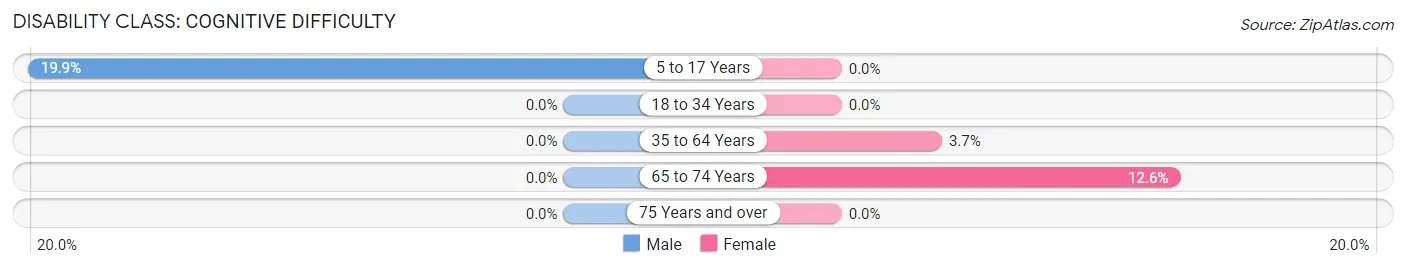
| Age Bracket | Male | Female |
| 5 to 17 Years | 160 (19.9%) | 0 (0.0%) |
| 18 to 34 Years | 0 (0.0%) | 0 (0.0%) |
| 35 to 64 Years | 0 (0.0%) | 41 (3.7%) |
| 65 to 74 Years | 0 (0.0%) | 54 (12.6%) |
| 75 Years and over | 0 (0.0%) | 0 (0.0%) |
Disability Class: Ambulatory Difficulty
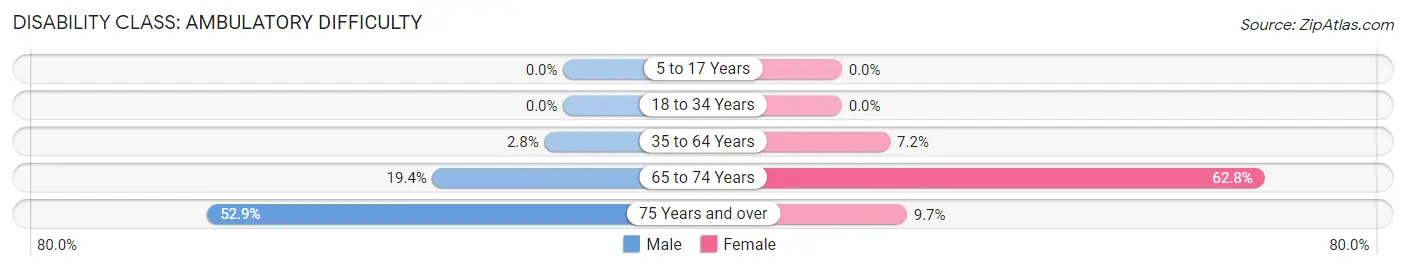
| Age Bracket | Male | Female |
| 5 to 17 Years | 0 (0.0%) | 0 (0.0%) |
| 18 to 34 Years | 0 (0.0%) | 0 (0.0%) |
| 35 to 64 Years | 29 (2.8%) | 79 (7.2%) |
| 65 to 74 Years | 53 (19.4%) | 270 (62.8%) |
| 75 Years and over | 55 (52.9%) | 11 (9.7%) |
Disability Class: Self-Care Difficulty
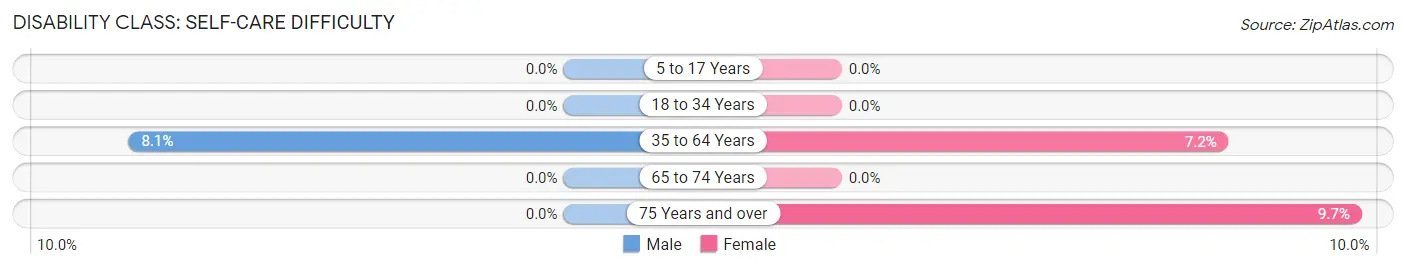
| Age Bracket | Male | Female |
| 5 to 17 Years | 0 (0.0%) | 0 (0.0%) |
| 18 to 34 Years | 0 (0.0%) | 0 (0.0%) |
| 35 to 64 Years | 84 (8.1%) | 79 (7.2%) |
| 65 to 74 Years | 0 (0.0%) | 0 (0.0%) |
| 75 Years and over | 0 (0.0%) | 11 (9.7%) |
Technology Access in Byron
Computing Device Access in Byron
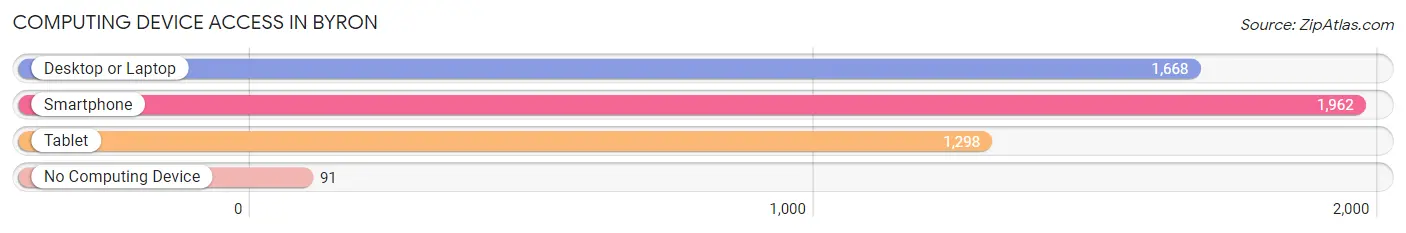
| Device Type | # Households | % Households |
| Desktop or Laptop | 1,668 | 80.8% |
| Smartphone | 1,962 | 95.0% |
| Tablet | 1,298 | 62.9% |
| No Computing Device | 91 | 4.4% |
| Total | 2,065 | 100.0% |
Internet Access in Byron
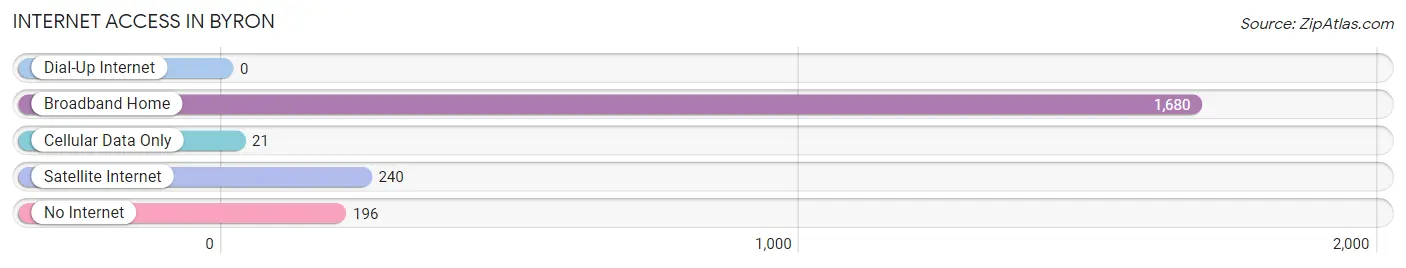
| Internet Type | # Households | % Households |
| Dial-Up Internet | 0 | 0.0% |
| Broadband Home | 1,680 | 81.4% |
| Cellular Data Only | 21 | 1.0% |
| Satellite Internet | 240 | 11.6% |
| No Internet | 196 | 9.5% |
| Total | 2,065 | 100.0% |
Byron Summary
Byron, Georgia is a small city located in Peach County, Georgia, United States. It is part of the Macon metropolitan area and is located approximately 20 miles south of Macon. The city has a population of about 4,000 people and is known for its small-town charm and friendly atmosphere.
Geography
Byron is located in Peach County, Georgia, in the central part of the state. It is situated along the Flint River, which runs through the city. The city is located about 20 miles south of Macon and is part of the Macon metropolitan area. The city is located in a rural area and is surrounded by farmland and wooded areas.
The climate in Byron is humid subtropical, with hot, humid summers and mild winters. The average annual temperature is around 70 degrees Fahrenheit, with an average high of around 90 degrees in the summer and an average low of around 50 degrees in the winter. The average annual precipitation is around 50 inches.
Economy
Byron’s economy is largely based on agriculture and manufacturing. The city is home to several large agricultural operations, including poultry farms, dairy farms, and vegetable farms. The city is also home to several manufacturing companies, including a paper mill, a furniture factory, and a plastics factory.
The city is also home to several retail stores, restaurants, and other businesses. The city is home to a large outlet mall, which attracts shoppers from all over the region.
Demographics
As of the 2010 census, the population of Byron was 4,051. The racial makeup of the city was 79.3% White, 16.2% African American, 0.3% Native American, 0.7% Asian, 0.1% Pacific Islander, 1.7% from other races, and 1.9% from two or more races. Hispanic or Latino of any race were 3.3% of the population.
The median income for a household in the city was $37,917, and the median income for a family was $45,938. The per capita income for the city was $18,945. About 15.2% of families and 18.2% of the population were below the poverty line, including 25.2% of those under age 18 and 11.2% of those age 65 or over.
Conclusion
Byron, Georgia is a small city located in Peach County, Georgia, United States. It is part of the Macon metropolitan area and is known for its small-town charm and friendly atmosphere. The city has a population of about 4,000 people and is largely based on agriculture and manufacturing. The city is home to several large agricultural operations, manufacturing companies, and retail stores. The racial makeup of the city is 79.3% White, 16.2% African American, 0.3% Native American, 0.7% Asian, 0.1% Pacific Islander, 1.7% from other races, and 1.9% from two or more races. The median income for a household in the city was $37,917, and the median income for a family was $45,938. Byron is a great place to live and work, and its friendly atmosphere and small-town charm make it a great place to visit.
Common Questions
What is the Total Population of Byron?
Total Population of Byron is 5,687.
What is the Total Male Population of Byron?
Total Male Population of Byron is 2,781.
What is the Total Female Population of Byron?
Total Female Population of Byron is 2,906.
What is the Ratio of Males per 100 Females in Byron?
There are 95.70 Males per 100 Females in Byron.
What is the Ratio of Females per 100 Males in Byron?
There are 104.49 Females per 100 Males in Byron.
What is the Median Population Age in Byron?
Median Population Age in Byron is 36.0 Years.
What is the Average Family Size in Byron
Average Family Size in Byron is 3.2 People.
What is the Average Household Size in Byron
Average Household Size in Byron is 2.8 People.
What is Per Capita Income in Byron?
Per Capita income in Byron is $33,398.
What is the Median Family Income in Byron?
Median Family Income in Byron is $97,640.
What is the Median Household income in Byron?
Median Household Income in Byron is $83,996.
What is Inequality or Gini Index in Byron?
Inequality or Gini Index in Byron is 0.41.
How Large is the Labor Force in Byron?
There are 2,920 People in the Labor Forcein in Byron.
What is the Percentage of People in the Labor Force in Byron?
66.4% of People are in the Labor Force in Byron.
What is the Unemployment Rate in Byron?
Unemployment Rate in Byron is 3.4%.