Bluffton, GA
Bluffton Map
Bluffton Overview
295
TOTAL POPULATION
140
MALE POPULATION
155
FEMALE POPULATION
90.32
MALES / 100 FEMALES
110.71
FEMALES / 100 MALES
17.8
MEDIAN AGE
7.1
AVG FAMILY SIZE
5.7
AVG HOUSEHOLD SIZE
$15,517
PER CAPITA INCOME
$78,594
AVG FAMILY INCOME
4.3%
WAGE / INCOME GAP [ % ]
95.7¢/ $1
WAGE / INCOME GAP [ $ ]
0.43
INEQUALITY / GINI INDEX
111
LABOR FORCE [ PEOPLE ]
48.1%
PERCENT IN LABOR FORCE
Bluffton Zip Codes
Bluffton Area Codes
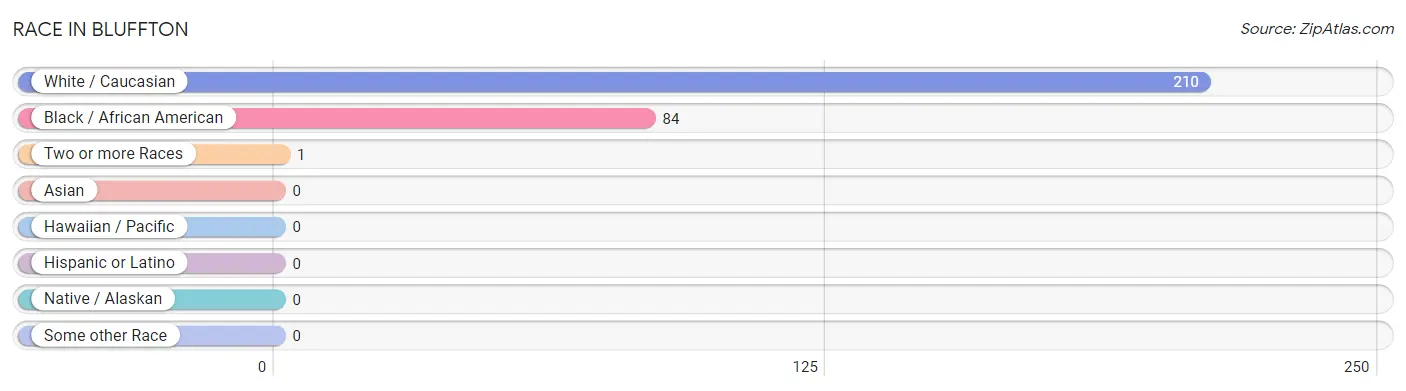
Race in Bluffton
The most populous races in Bluffton are White / Caucasian (210 | 71.2%), Black / African American (84 | 28.5%), and Two or more Races (1 | 0.3%).
| Race | # Population | % Population |
| Asian | 0 | 0.0% |
| Black / African American | 84 | 28.5% |
| Hawaiian / Pacific | 0 | 0.0% |
| Hispanic or Latino | 0 | 0.0% |
| Native / Alaskan | 0 | 0.0% |
| White / Caucasian | 210 | 71.2% |
| Two or more Races | 1 | 0.3% |
| Some other Race | 0 | 0.0% |
| Total | 295 | 100.0% |
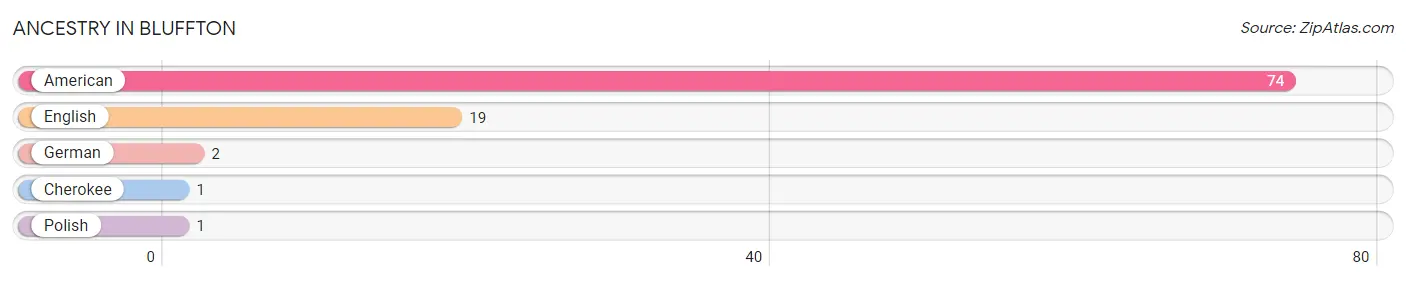
Ancestry in Bluffton
The most populous ancestries reported in Bluffton are American (74 | 25.1%), English (19 | 6.4%), German (2 | 0.7%), Cherokee (1 | 0.3%), and Polish (1 | 0.3%), together accounting for 32.9% of all Bluffton residents.
| Ancestry | # Population | % Population |
| American | 74 | 25.1% |
| Cherokee | 1 | 0.3% |
| English | 19 | 6.4% |
| German | 2 | 0.7% |
| Polish | 1 | 0.3% | View All 5 Rows |
Immigrants in Bluffton

| Immigration Origin | # Population | % Population | View All 0 Rows |
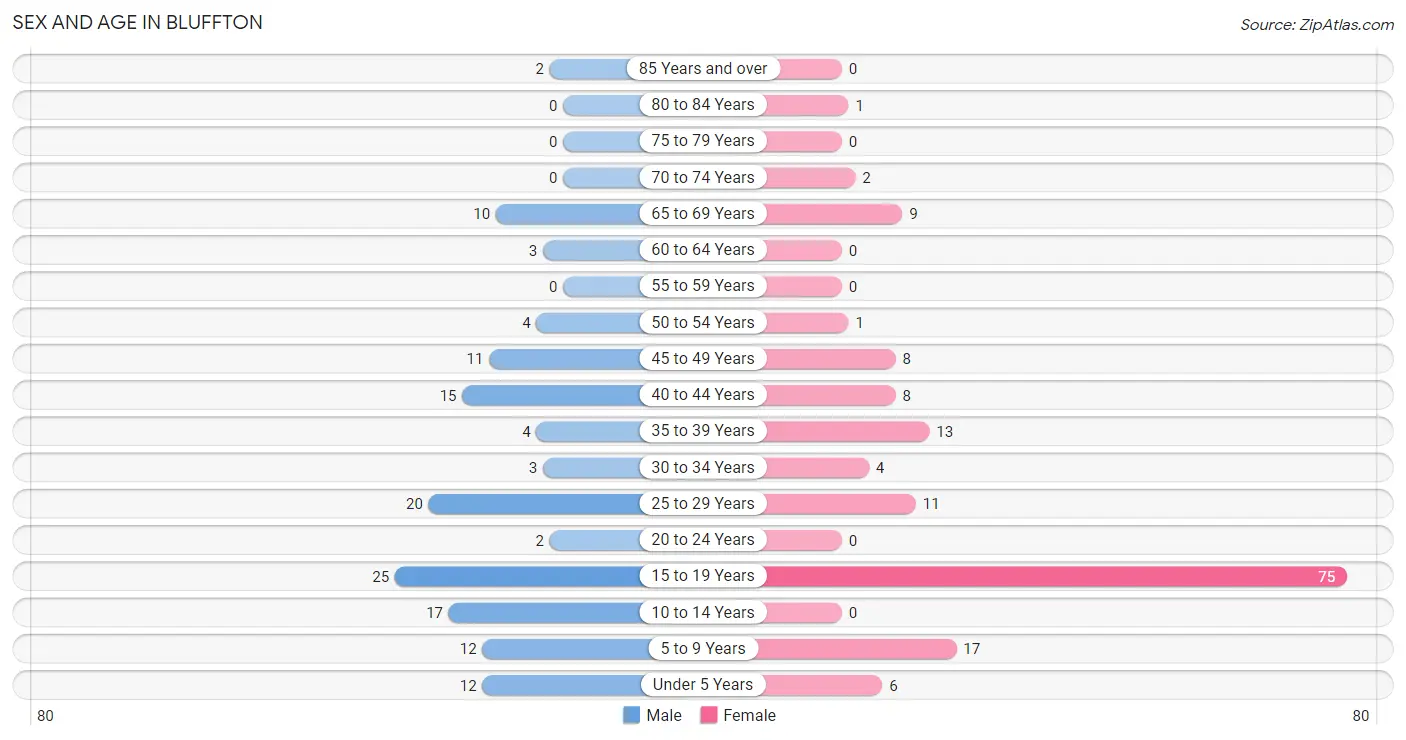
Sex and Age in Bluffton
Sex and Age in Bluffton
The most populous age groups in Bluffton are 15 to 19 Years (25 | 17.9%) for men and 15 to 19 Years (75 | 48.4%) for women.
| Age Bracket | Male | Female |
| Under 5 Years | 12 (8.6%) | 6 (3.9%) |
| 5 to 9 Years | 12 (8.6%) | 17 (11.0%) |
| 10 to 14 Years | 17 (12.1%) | 0 (0.0%) |
| 15 to 19 Years | 25 (17.9%) | 75 (48.4%) |
| 20 to 24 Years | 2 (1.4%) | 0 (0.0%) |
| 25 to 29 Years | 20 (14.3%) | 11 (7.1%) |
| 30 to 34 Years | 3 (2.1%) | 4 (2.6%) |
| 35 to 39 Years | 4 (2.9%) | 13 (8.4%) |
| 40 to 44 Years | 15 (10.7%) | 8 (5.2%) |
| 45 to 49 Years | 11 (7.9%) | 8 (5.2%) |
| 50 to 54 Years | 4 (2.9%) | 1 (0.6%) |
| 55 to 59 Years | 0 (0.0%) | 0 (0.0%) |
| 60 to 64 Years | 3 (2.1%) | 0 (0.0%) |
| 65 to 69 Years | 10 (7.1%) | 9 (5.8%) |
| 70 to 74 Years | 0 (0.0%) | 2 (1.3%) |
| 75 to 79 Years | 0 (0.0%) | 0 (0.0%) |
| 80 to 84 Years | 0 (0.0%) | 1 (0.6%) |
| 85 Years and over | 2 (1.4%) | 0 (0.0%) |
| Total | 140 (100.0%) | 155 (100.0%) |
Families and Households in Bluffton
Median Family Size in Bluffton
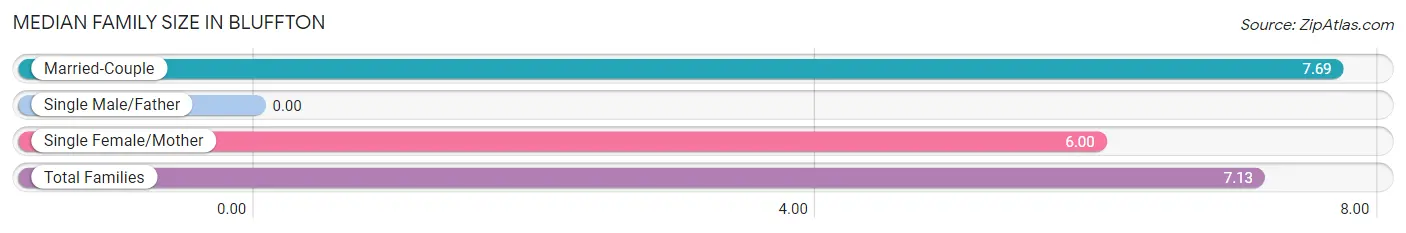
| Family Type | # Families | Family Size |
| Married-Couple | 26 (66.7%) | 7.69 |
| Single Male/Father | 0 (0.0%) | - |
| Single Female/Mother | 13 (33.3%) | 6.00 |
| Total Families | 39 (100.0%) | 7.13 |
Median Household Size in Bluffton
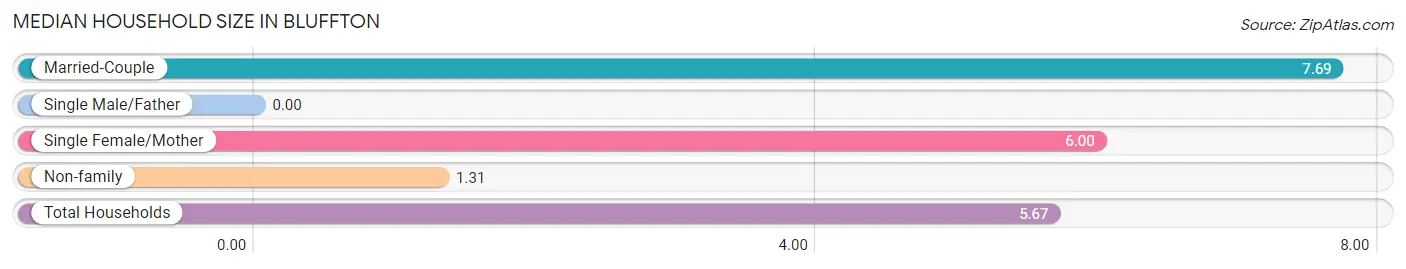
| Household Type | # Households | Household Size |
| Married-Couple | 26 (50.0%) | 7.69 |
| Single Male/Father | 0 (0.0%) | - |
| Single Female/Mother | 13 (25.0%) | 6.00 |
| Non-family | 13 (25.0%) | 1.31 |
| Total Households | 52 (100.0%) | 5.67 |
Household Size by Marriage Status in Bluffton
Out of a total of 52 households in Bluffton, 39 (75.0%) are family households, while 13 (25.0%) are nonfamily households. The most numerous type of family households are 2-person households, comprising 13, and the most common type of nonfamily households are 1-person households, comprising 10.
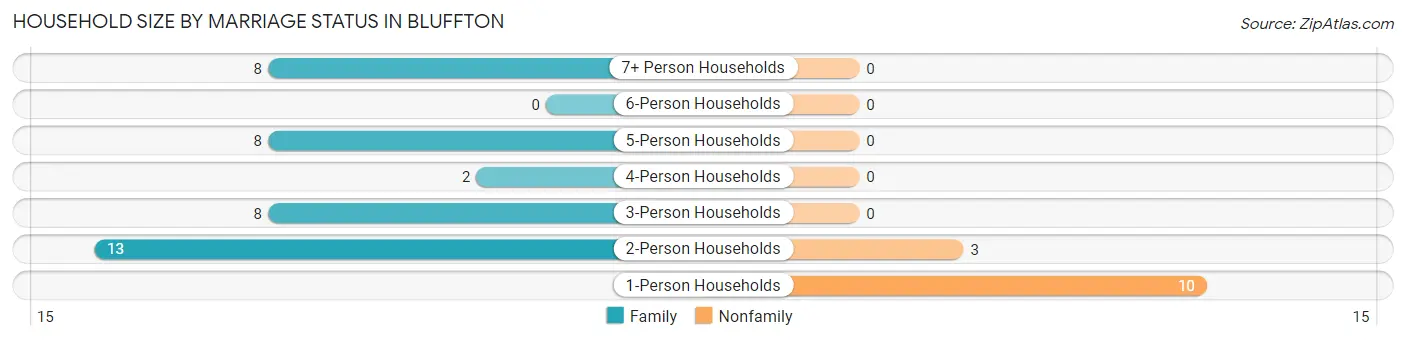
| Household Size | Family Households | Nonfamily Households |
| 1-Person Households | - | 10 (19.2%) |
| 2-Person Households | 13 (25.0%) | 3 (5.8%) |
| 3-Person Households | 8 (15.4%) | 0 (0.0%) |
| 4-Person Households | 2 (3.8%) | 0 (0.0%) |
| 5-Person Households | 8 (15.4%) | 0 (0.0%) |
| 6-Person Households | 0 (0.0%) | 0 (0.0%) |
| 7+ Person Households | 8 (15.4%) | 0 (0.0%) |
| Total | 39 (75.0%) | 13 (25.0%) |
Female Fertility in Bluffton
Fertility by Age in Bluffton
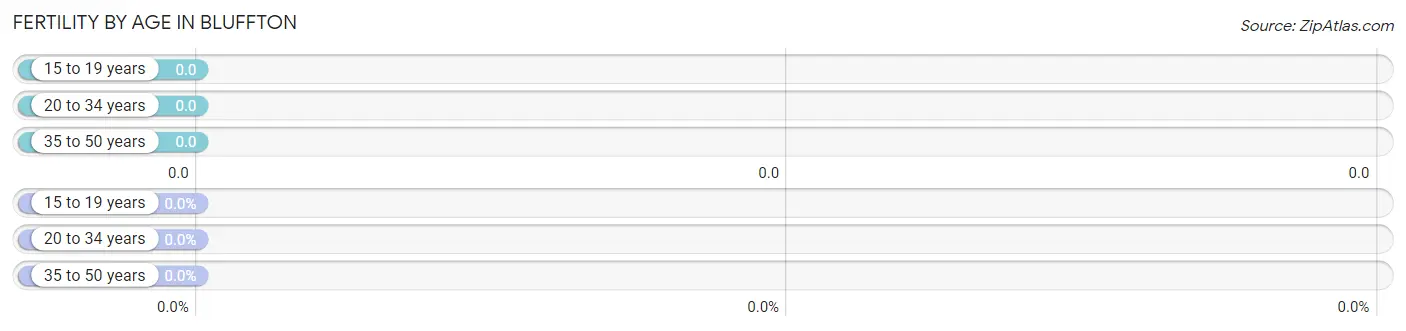
| Age Bracket | Women with Births | Births / 1,000 Women |
| 15 to 19 years | 0 (0.0%) | 0.0 |
| 20 to 34 years | 0 (0.0%) | 0.0 |
| 35 to 50 years | 0 (0.0%) | 0.0 |
| Total | 0 (0.0%) | 0.0 |
Fertility by Age by Marriage Status in Bluffton
| Age Bracket | Married | Unmarried |
| 15 to 19 years | 0 (0.0%) | 0 (0.0%) |
| 20 to 34 years | 0 (0.0%) | 0 (0.0%) |
| 35 to 50 years | 0 (0.0%) | 0 (0.0%) |
| Total | 0 (0.0%) | 0 (0.0%) |
Fertility by Education in Bluffton
| Educational Attainment | Women with Births | Births / 1,000 Women |
| Less than High School | 0 (0.0%) | 0.0 |
| High School Diploma | 0 (0.0%) | 0.0 |
| College or Associate's Degree | 0 (0.0%) | 0.0 |
| Bachelor's Degree | 0 (0.0%) | 0.0 |
| Graduate Degree | 0 (0.0%) | 0.0 |
| Total | 0 (0.0%) | 0.0 |
Fertility by Education by Marriage Status in Bluffton
| Educational Attainment | Married | Unmarried |
| Less than High School | 0 (0.0%) | 0 (0.0%) |
| High School Diploma | 0 (0.0%) | 0 (0.0%) |
| College or Associate's Degree | 0 (0.0%) | 0 (0.0%) |
| Bachelor's Degree | 0 (0.0%) | 0 (0.0%) |
| Graduate Degree | 0 (0.0%) | 0 (0.0%) |
| Total | 0 (0.0%) | 0 (0.0%) |
Income in Bluffton
Income Overview in Bluffton
| Characteristic | Number | Measure |
| Per Capita Income | 295 | $15,517 |
| Median Family Income | 39 | $78,594 |
| Mean Family Income | 39 | $79,885 |
| Median Household Income | 52 | $0 |
| Mean Household Income | 52 | $64,015 |
| Income Deficit | 39 | $0 |
| Wage / Income Gap (%) | 295 | 4.28% |
| Wage / Income Gap ($) | 295 | 95.72¢ per $1 |
| Gini / Inequality Index | 295 | 0.43 |
Earnings by Sex in Bluffton
Average Earnings in Bluffton are $31,125, $31,667 for men and $30,313 for women, a difference of 4.3%.
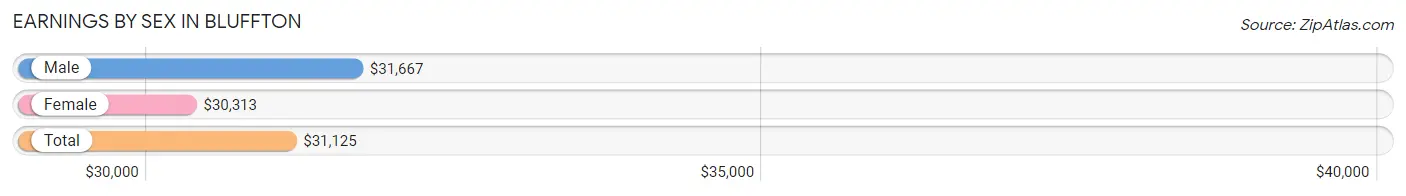
| Sex | Number | Average Earnings |
| Male | 62 (55.9%) | $31,667 |
| Female | 49 (44.1%) | $30,313 |
| Total | 111 (100.0%) | $31,125 |
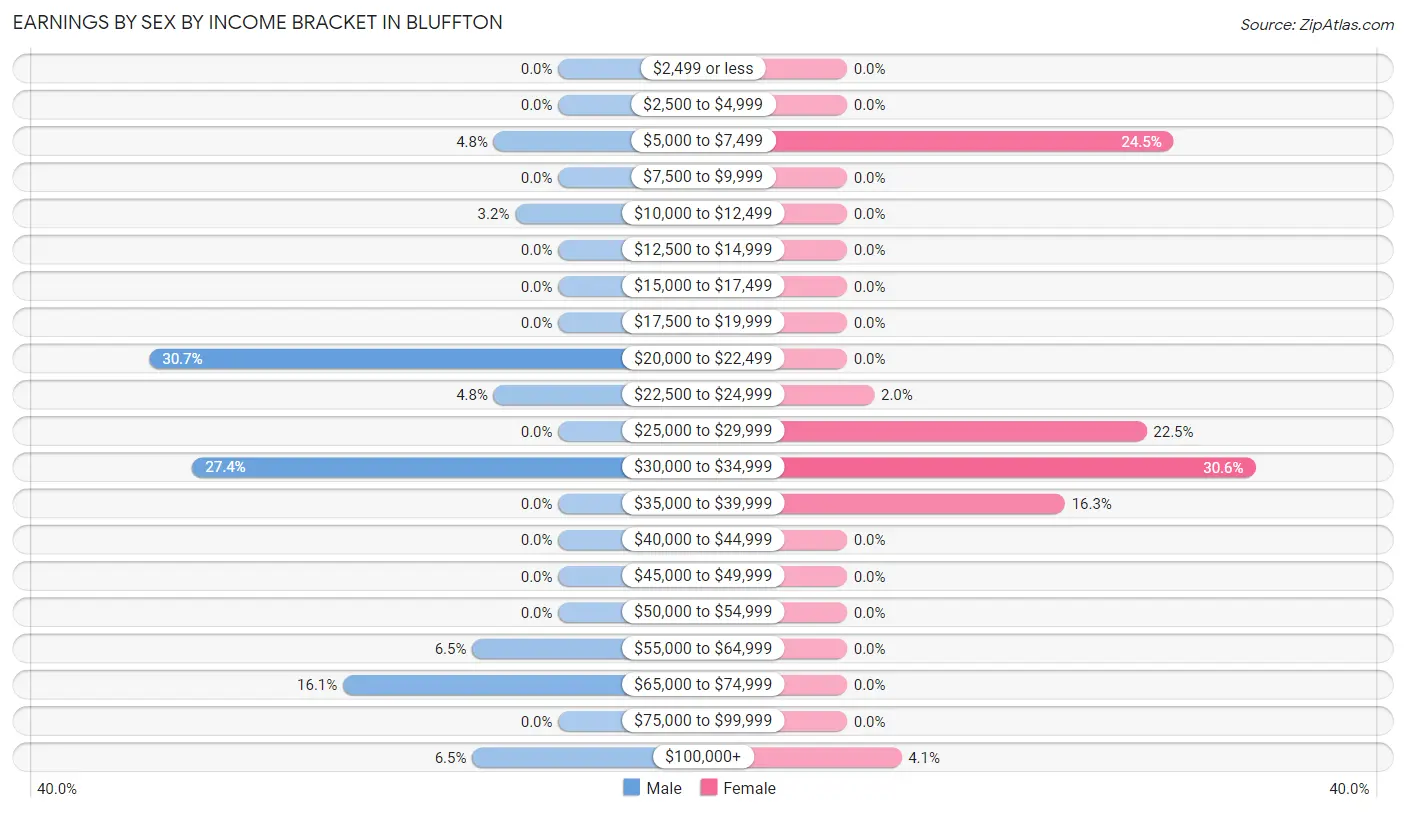
Earnings by Sex by Income Bracket in Bluffton
The most common earnings brackets in Bluffton are $20,000 to $22,499 for men (19 | 30.6%) and $30,000 to $34,999 for women (15 | 30.6%).
| Income | Male | Female |
| $2,499 or less | 0 (0.0%) | 0 (0.0%) |
| $2,500 to $4,999 | 0 (0.0%) | 0 (0.0%) |
| $5,000 to $7,499 | 3 (4.8%) | 12 (24.5%) |
| $7,500 to $9,999 | 0 (0.0%) | 0 (0.0%) |
| $10,000 to $12,499 | 2 (3.2%) | 0 (0.0%) |
| $12,500 to $14,999 | 0 (0.0%) | 0 (0.0%) |
| $15,000 to $17,499 | 0 (0.0%) | 0 (0.0%) |
| $17,500 to $19,999 | 0 (0.0%) | 0 (0.0%) |
| $20,000 to $22,499 | 19 (30.6%) | 0 (0.0%) |
| $22,500 to $24,999 | 3 (4.8%) | 1 (2.0%) |
| $25,000 to $29,999 | 0 (0.0%) | 11 (22.5%) |
| $30,000 to $34,999 | 17 (27.4%) | 15 (30.6%) |
| $35,000 to $39,999 | 0 (0.0%) | 8 (16.3%) |
| $40,000 to $44,999 | 0 (0.0%) | 0 (0.0%) |
| $45,000 to $49,999 | 0 (0.0%) | 0 (0.0%) |
| $50,000 to $54,999 | 0 (0.0%) | 0 (0.0%) |
| $55,000 to $64,999 | 4 (6.5%) | 0 (0.0%) |
| $65,000 to $74,999 | 10 (16.1%) | 0 (0.0%) |
| $75,000 to $99,999 | 0 (0.0%) | 0 (0.0%) |
| $100,000+ | 4 (6.5%) | 2 (4.1%) |
| Total | 62 (100.0%) | 49 (100.0%) |
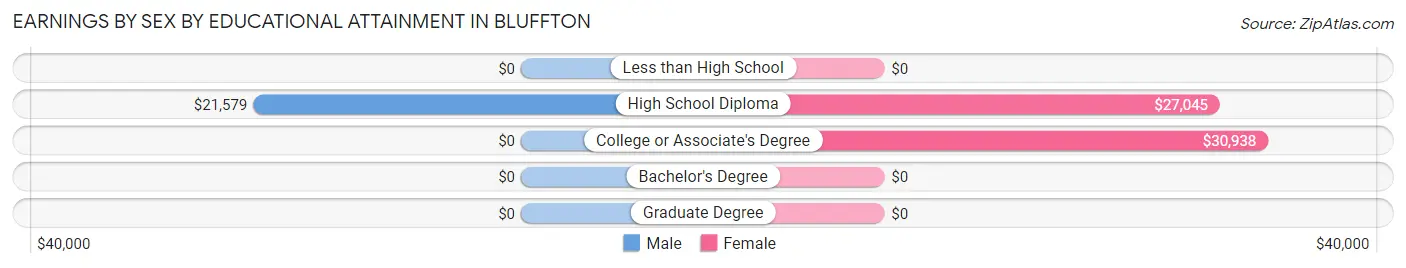
Earnings by Sex by Educational Attainment in Bluffton
Average earnings in Bluffton are $32,083 for men and $30,313 for women, a difference of 5.5%. Men with an educational attainment of high school diploma enjoy the highest average annual earnings of $21,579, while those with high school diploma education earn the least with $21,579. Women with an educational attainment of college or associate's degree earn the most with the average annual earnings of $30,938, while those with high school diploma education have the smallest earnings of $27,045.
| Educational Attainment | Male Income | Female Income |
| Less than High School | - | - |
| High School Diploma | $21,579 | $27,045 |
| College or Associate's Degree | - | - |
| Bachelor's Degree | - | - |
| Graduate Degree | - | - |
| Total | $32,083 | $30,313 |
Family Income in Bluffton
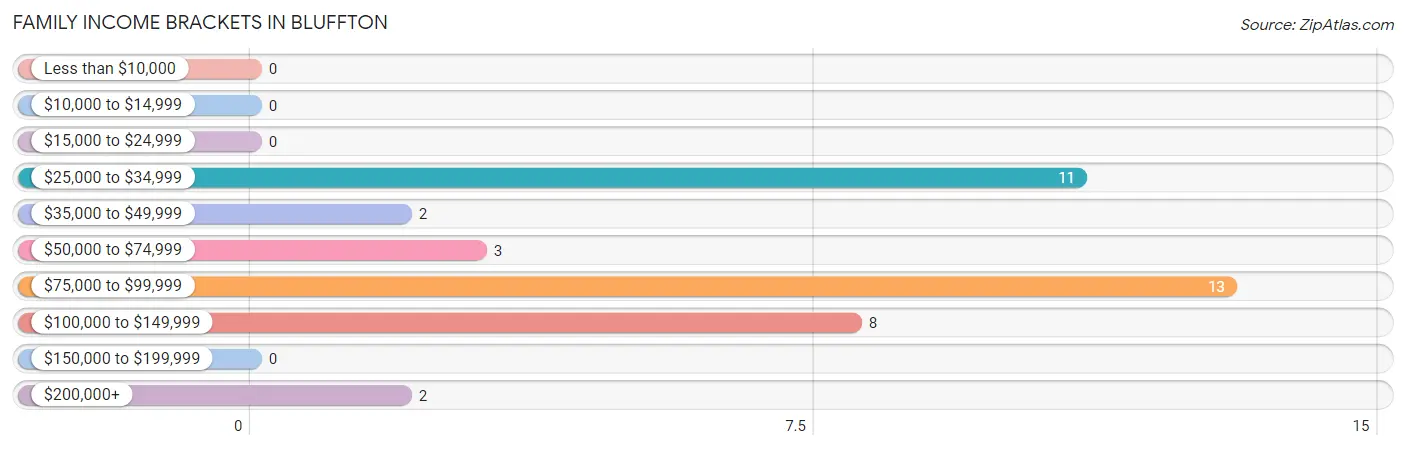
Family Income Brackets in Bluffton
According to the Bluffton family income data, there are 13 families falling into the $75,000 to $99,999 income range, which is the most common income bracket and makes up 33.3% of all families.
| Income Bracket | # Families | % Families |
| Less than $10,000 | 0 | 0.0% |
| $10,000 to $14,999 | 0 | 0.0% |
| $15,000 to $24,999 | 0 | 0.0% |
| $25,000 to $34,999 | 11 | 28.2% |
| $35,000 to $49,999 | 2 | 5.1% |
| $50,000 to $74,999 | 3 | 7.7% |
| $75,000 to $99,999 | 13 | 33.3% |
| $100,000 to $149,999 | 8 | 20.5% |
| $150,000 to $199,999 | 0 | 0.0% |
| $200,000+ | 2 | 5.1% |
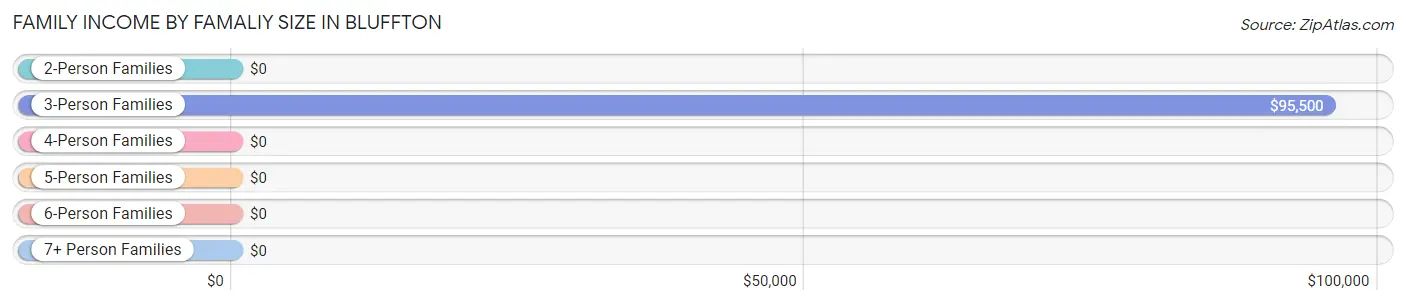
Family Income by Famaliy Size in Bluffton
3-person families (8 | 20.5%) account for the highest median family income in Bluffton with $95,500 per family, while 3-person families (8 | 20.5%) have the highest median income of $31,833 per family member.
| Income Bracket | # Families | Median Income |
| 2-Person Families | 13 (33.3%) | $0 |
| 3-Person Families | 8 (20.5%) | $95,500 |
| 4-Person Families | 2 (5.1%) | $0 |
| 5-Person Families | 8 (20.5%) | $0 |
| 6-Person Families | 0 (0.0%) | $0 |
| 7+ Person Families | 8 (20.5%) | $0 |
| Total | 39 (100.0%) | $78,594 |
Family Income by Number of Earners in Bluffton
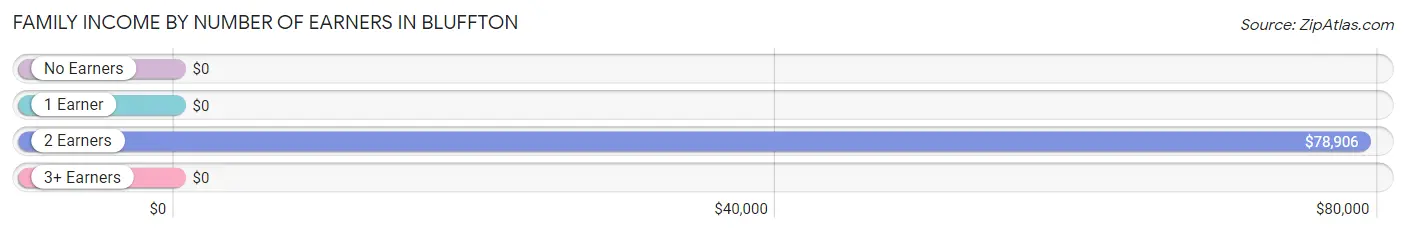
| Number of Earners | # Families | Median Income |
| No Earners | 2 (5.1%) | $0 |
| 1 Earner | 18 (46.2%) | $0 |
| 2 Earners | 11 (28.2%) | $78,906 |
| 3+ Earners | 8 (20.5%) | $0 |
| Total | 39 (100.0%) | $78,594 |
Household Income in Bluffton
Household Income Brackets in Bluffton
With 13 households falling in the category, the $75,000 to $99,999 income range is the most frequent in Bluffton, accounting for 25.0% of all households.
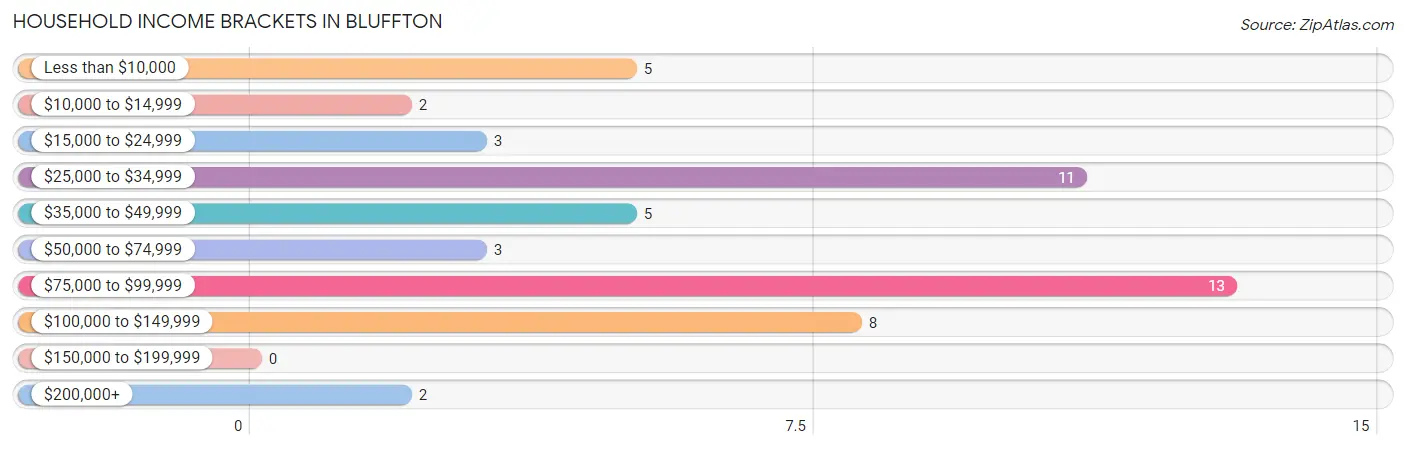
| Income Bracket | # Households | % Households |
| Less than $10,000 | 5 | 9.6% |
| $10,000 to $14,999 | 2 | 3.8% |
| $15,000 to $24,999 | 3 | 5.8% |
| $25,000 to $34,999 | 11 | 21.2% |
| $35,000 to $49,999 | 5 | 9.6% |
| $50,000 to $74,999 | 3 | 5.8% |
| $75,000 to $99,999 | 13 | 25.0% |
| $100,000 to $149,999 | 8 | 15.4% |
| $150,000 to $199,999 | 0 | 0.0% |
| $200,000+ | 2 | 3.8% |
Household Income by Householder Age in Bluffton
The median household income in Bluffton is $0, with the highest median household income of $123,438 found in the 45 to 64 years age bracket for the primary householder. A total of 12 households (23.1%) fall into this category. Meanwhile, the 15 to 24 years age bracket for the primary householder has the lowest median household income of $0, with 2 households (3.8%) in this group.
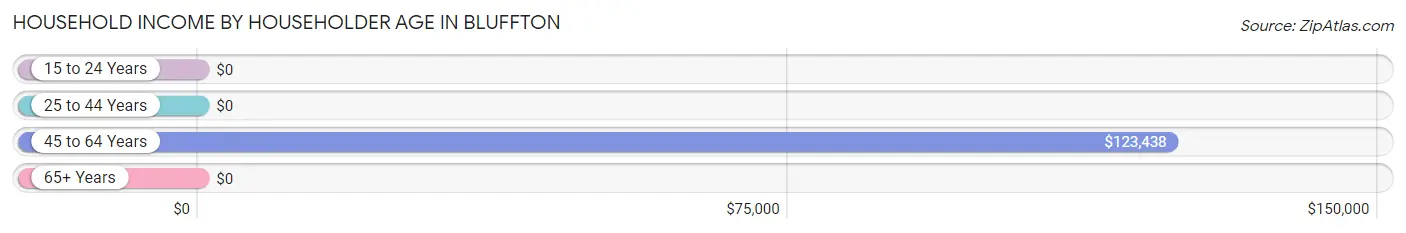
| Income Bracket | # Households | Median Income |
| 15 to 24 Years | 2 (3.8%) | $0 |
| 25 to 44 Years | 24 (46.2%) | $0 |
| 45 to 64 Years | 12 (23.1%) | $123,438 |
| 65+ Years | 14 (26.9%) | $0 |
| Total | 52 (100.0%) | $0 |
Poverty in Bluffton
Income Below Poverty by Sex and Age in Bluffton
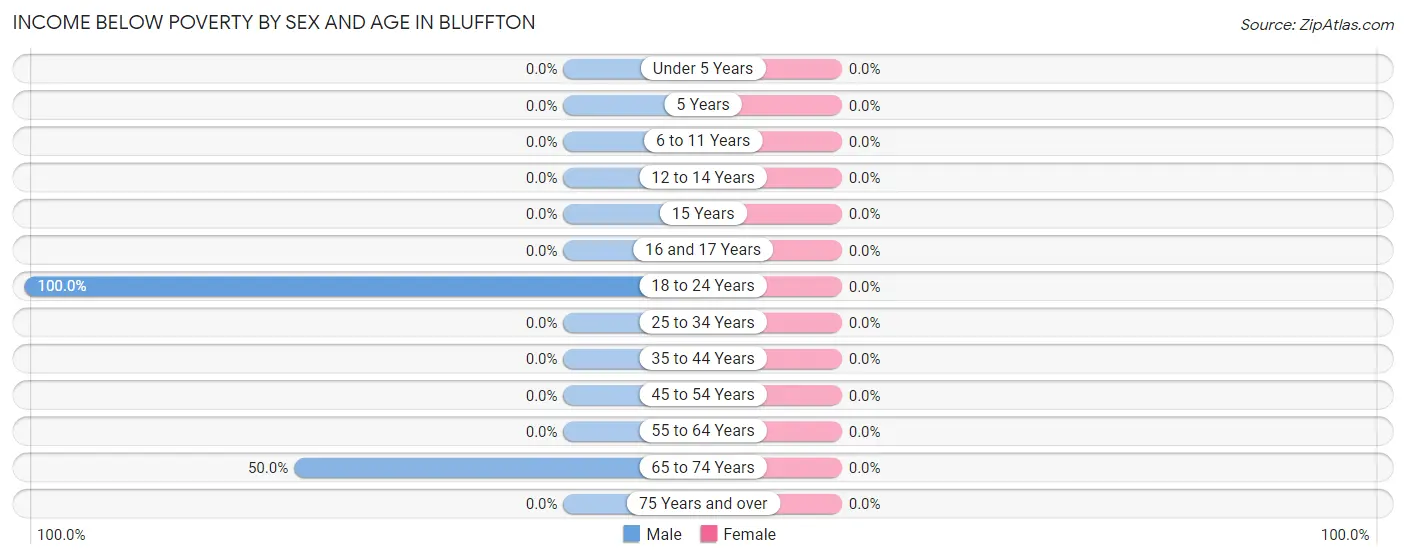
| Age Bracket | Male | Female |
| Under 5 Years | 0 (0.0%) | 0 (0.0%) |
| 5 Years | 0 (0.0%) | 0 (0.0%) |
| 6 to 11 Years | 0 (0.0%) | 0 (0.0%) |
| 12 to 14 Years | 0 (0.0%) | 0 (0.0%) |
| 15 Years | 0 (0.0%) | 0 (0.0%) |
| 16 and 17 Years | 0 (0.0%) | 0 (0.0%) |
| 18 to 24 Years | 2 (100.0%) | 0 (0.0%) |
| 25 to 34 Years | 0 (0.0%) | 0 (0.0%) |
| 35 to 44 Years | 0 (0.0%) | 0 (0.0%) |
| 45 to 54 Years | 0 (0.0%) | 0 (0.0%) |
| 55 to 64 Years | 0 (0.0%) | 0 (0.0%) |
| 65 to 74 Years | 5 (50.0%) | 0 (0.0%) |
| 75 Years and over | 0 (0.0%) | 0 (0.0%) |
| Total | 7 (5.0%) | 0 (0.0%) |
Income Above Poverty by Sex and Age in Bluffton
According to the poverty statistics in Bluffton, males aged under 5 years and females aged under 5 years are the age groups that are most secure financially, with 100.0% of males and 100.0% of females in these age groups living above the poverty line.
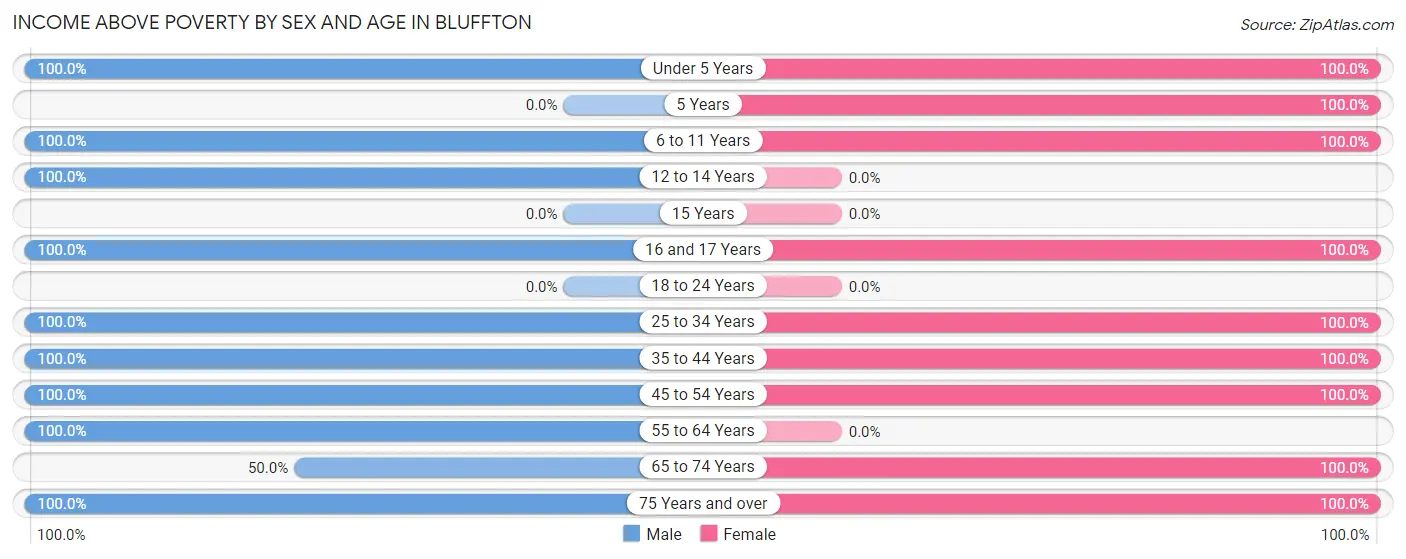
| Age Bracket | Male | Female |
| Under 5 Years | 12 (100.0%) | 6 (100.0%) |
| 5 Years | 0 (0.0%) | 8 (100.0%) |
| 6 to 11 Years | 23 (100.0%) | 9 (100.0%) |
| 12 to 14 Years | 6 (100.0%) | 0 (0.0%) |
| 15 Years | 0 (0.0%) | 0 (0.0%) |
| 16 and 17 Years | 25 (100.0%) | 75 (100.0%) |
| 18 to 24 Years | 0 (0.0%) | 0 (0.0%) |
| 25 to 34 Years | 23 (100.0%) | 15 (100.0%) |
| 35 to 44 Years | 19 (100.0%) | 21 (100.0%) |
| 45 to 54 Years | 15 (100.0%) | 9 (100.0%) |
| 55 to 64 Years | 3 (100.0%) | 0 (0.0%) |
| 65 to 74 Years | 5 (50.0%) | 11 (100.0%) |
| 75 Years and over | 2 (100.0%) | 1 (100.0%) |
| Total | 133 (95.0%) | 155 (100.0%) |
Income Below Poverty Among Married-Couple Families in Bluffton
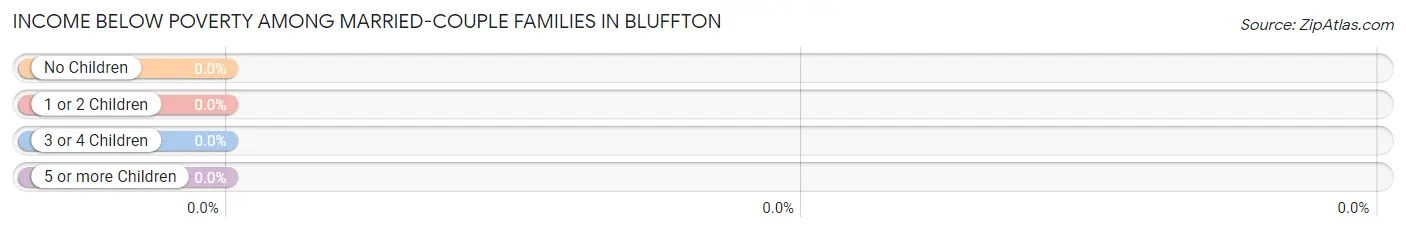
| Children | Above Poverty | Below Poverty |
| No Children | 7 (100.0%) | 0 (0.0%) |
| 1 or 2 Children | 3 (100.0%) | 0 (0.0%) |
| 3 or 4 Children | 16 (100.0%) | 0 (0.0%) |
| 5 or more Children | 0 (0.0%) | 0 (0.0%) |
| Total | 26 (100.0%) | 0 (0.0%) |
Income Below Poverty Among Single-Parent Households in Bluffton
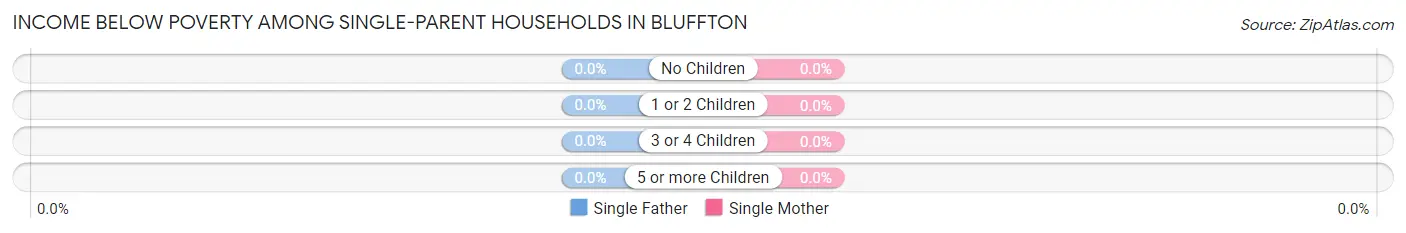
| Children | Single Father | Single Mother |
| No Children | 0 (0.0%) | 0 (0.0%) |
| 1 or 2 Children | 0 (0.0%) | 0 (0.0%) |
| 3 or 4 Children | 0 (0.0%) | 0 (0.0%) |
| 5 or more Children | 0 (0.0%) | 0 (0.0%) |
| Total | 0 (0.0%) | 0 (0.0%) |
Income Below Poverty Among Married-Couple vs Single-Parent Households in Bluffton
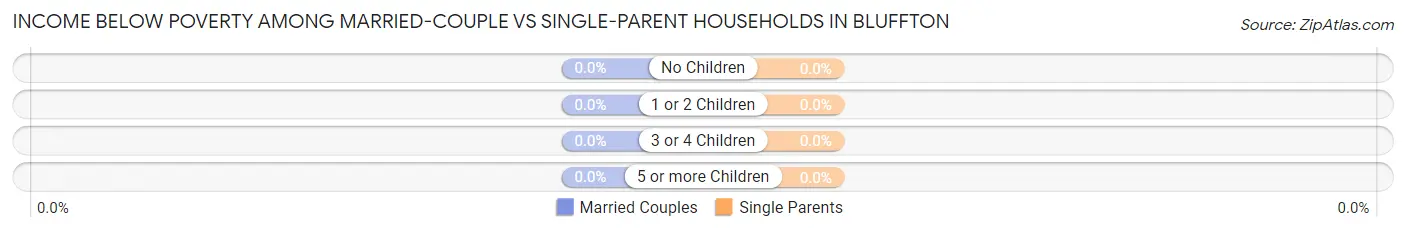
| Children | Married-Couple Families | Single-Parent Households |
| No Children | 0 (0.0%) | 0 (0.0%) |
| 1 or 2 Children | 0 (0.0%) | 0 (0.0%) |
| 3 or 4 Children | 0 (0.0%) | 0 (0.0%) |
| 5 or more Children | 0 (0.0%) | 0 (0.0%) |
| Total | 0 (0.0%) | 0 (0.0%) |
Employment Characteristics in Bluffton
Employment by Class of Employer in Bluffton
Among the 106 employed individuals in Bluffton, private company employees (90 | 84.9%), local government employees (9 | 8.5%), and federal government employees (4 | 3.8%) make up the most common classes of employment.
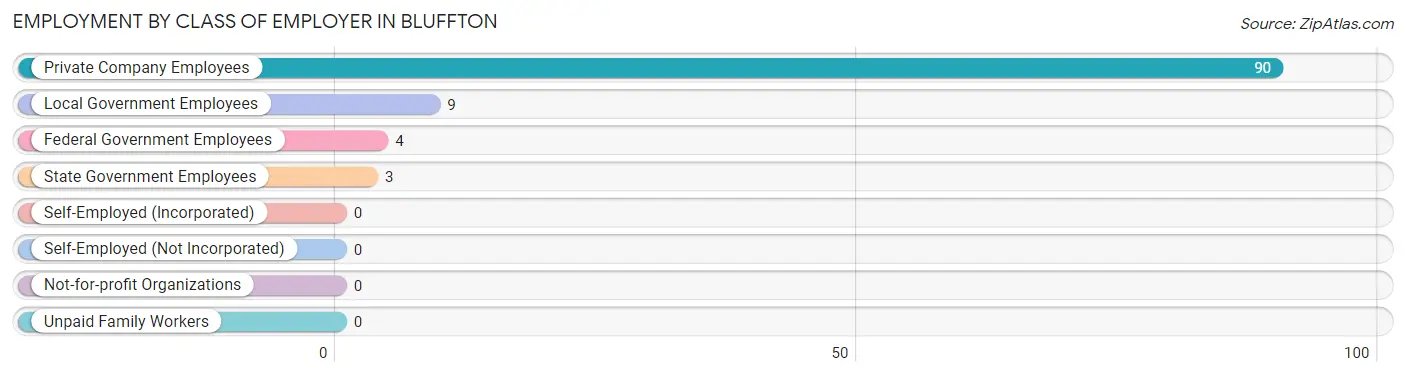
| Employer Class | # Employees | % Employees |
| Private Company Employees | 90 | 84.9% |
| Self-Employed (Incorporated) | 0 | 0.0% |
| Self-Employed (Not Incorporated) | 0 | 0.0% |
| Not-for-profit Organizations | 0 | 0.0% |
| Local Government Employees | 9 | 8.5% |
| State Government Employees | 3 | 2.8% |
| Federal Government Employees | 4 | 3.8% |
| Unpaid Family Workers | 0 | 0.0% |
| Total | 106 | 100.0% |
Employment Status by Age in Bluffton
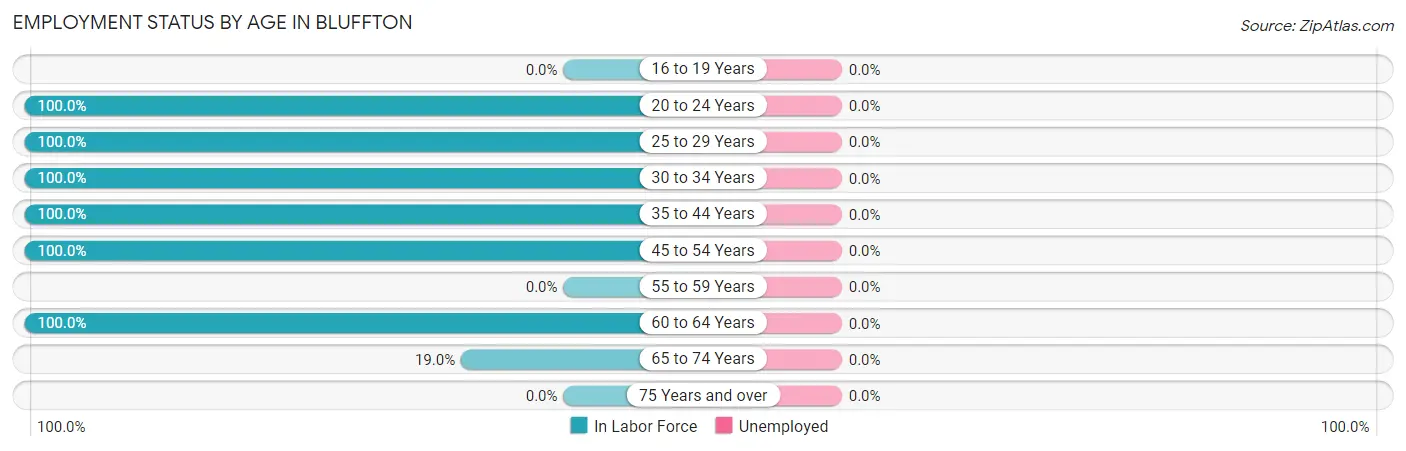
| Age Bracket | In Labor Force | Unemployed |
| 16 to 19 Years | 0 (0.0%) | 0 (0.0%) |
| 20 to 24 Years | 2 (100.0%) | 0 (0.0%) |
| 25 to 29 Years | 31 (100.0%) | 0 (0.0%) |
| 30 to 34 Years | 7 (100.0%) | 0 (0.0%) |
| 35 to 44 Years | 40 (100.0%) | 0 (0.0%) |
| 45 to 54 Years | 24 (100.0%) | 0 (0.0%) |
| 55 to 59 Years | 0 (0.0%) | 0 (0.0%) |
| 60 to 64 Years | 3 (100.0%) | 0 (0.0%) |
| 65 to 74 Years | 4 (19.0%) | 0 (0.0%) |
| 75 Years and over | 0 (0.0%) | 0 (0.0%) |
| Total | 111 (48.1%) | 0 (0.0%) |
Employment Status by Educational Attainment in Bluffton
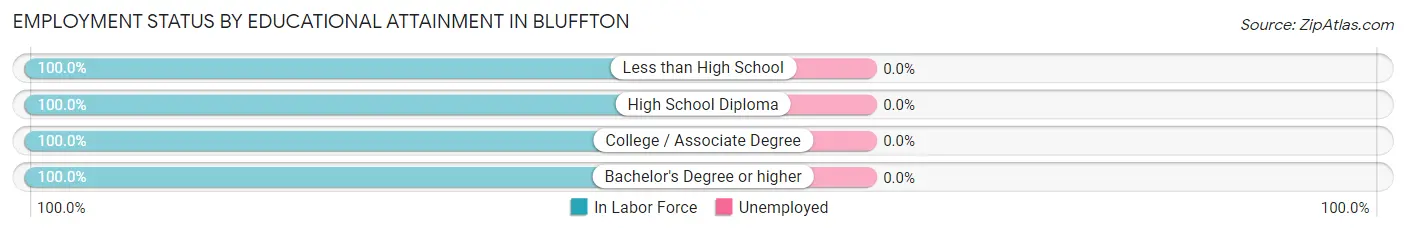
| Educational Attainment | In Labor Force | Unemployed |
| Less than High School | 16 (100.0%) | 0 (0.0%) |
| High School Diploma | 52 (100.0%) | 0 (0.0%) |
| College / Associate Degree | 21 (100.0%) | 0 (0.0%) |
| Bachelor's Degree or higher | 16 (100.0%) | 0 (0.0%) |
| Total | 105 (100.0%) | 0 (0.0%) |
Employment Occupations by Sex in Bluffton
Management, Business, Science and Arts Occupations
The most common Management, Business, Science and Arts occupations in Bluffton are Management (15 | 13.5%), Community & Social Service (1 | 0.9%), and Education Instruction & Library (1 | 0.9%).
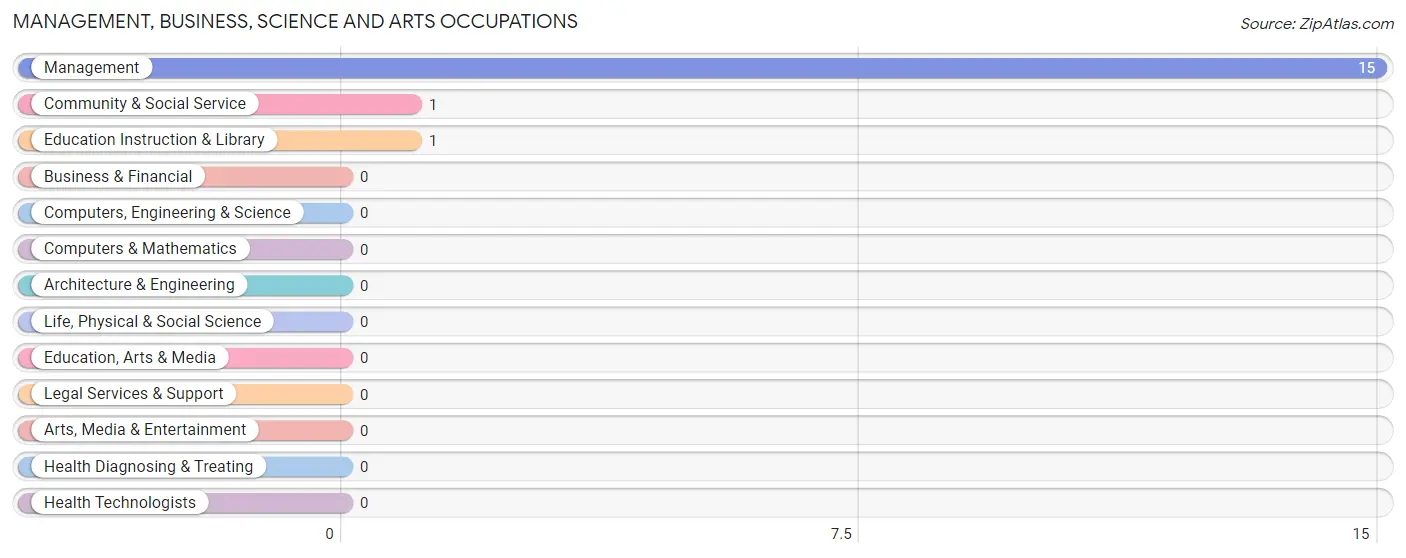
Management, Business, Science and Arts Occupations by Sex
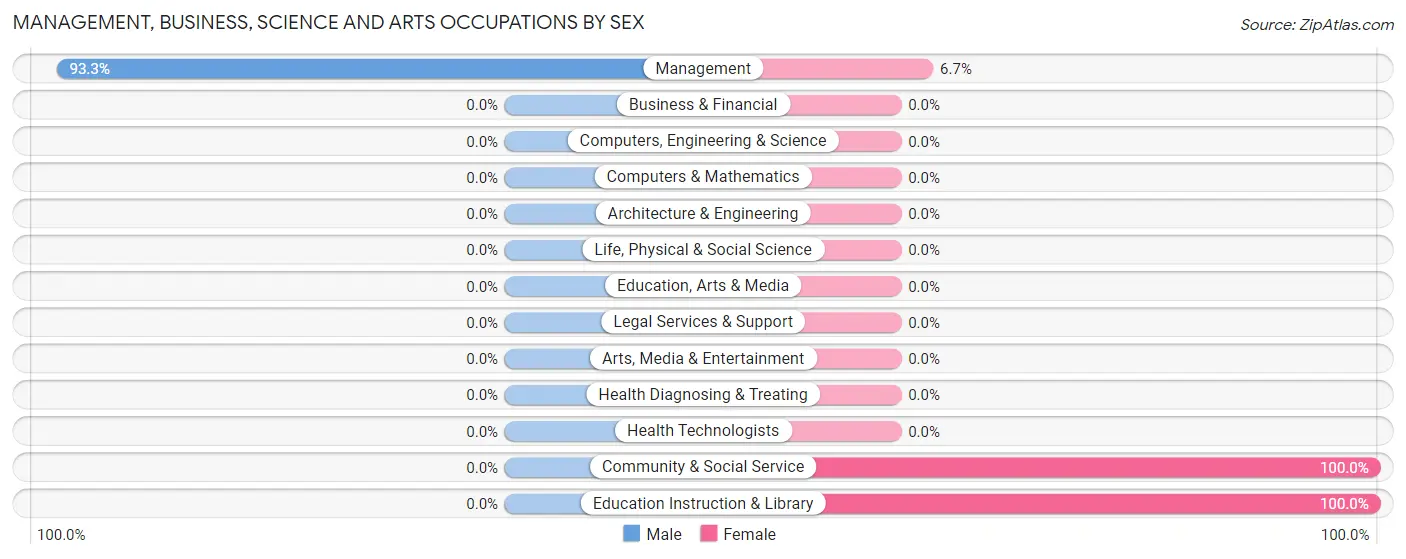
| Occupation | Male | Female |
| Management | 14 (93.3%) | 1 (6.7%) |
| Business & Financial | 0 (0.0%) | 0 (0.0%) |
| Computers, Engineering & Science | 0 (0.0%) | 0 (0.0%) |
| Computers & Mathematics | 0 (0.0%) | 0 (0.0%) |
| Architecture & Engineering | 0 (0.0%) | 0 (0.0%) |
| Life, Physical & Social Science | 0 (0.0%) | 0 (0.0%) |
| Community & Social Service | 0 (0.0%) | 1 (100.0%) |
| Education, Arts & Media | 0 (0.0%) | 0 (0.0%) |
| Legal Services & Support | 0 (0.0%) | 0 (0.0%) |
| Education Instruction & Library | 0 (0.0%) | 1 (100.0%) |
| Arts, Media & Entertainment | 0 (0.0%) | 0 (0.0%) |
| Health Diagnosing & Treating | 0 (0.0%) | 0 (0.0%) |
| Health Technologists | 0 (0.0%) | 0 (0.0%) |
| Total (Category) | 14 (87.5%) | 2 (12.5%) |
| Total (Overall) | 62 (55.9%) | 49 (44.1%) |
Services Occupations
The most common Services occupations in Bluffton are , and Healthcare Support (15 | 13.5%).
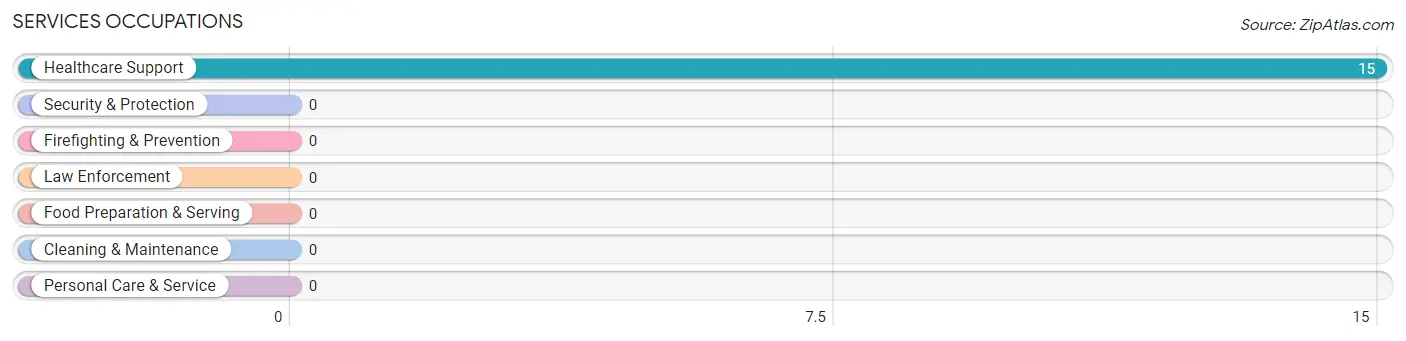
Services Occupations by Sex
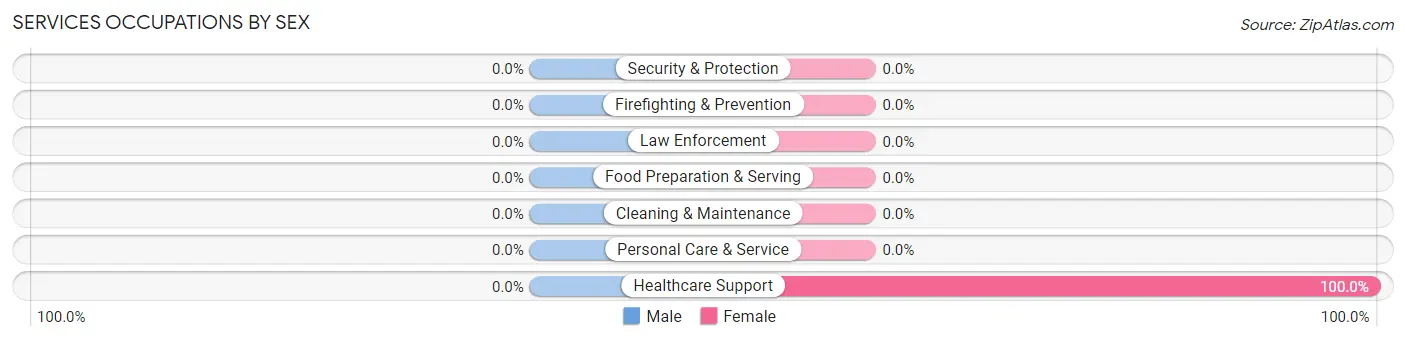
| Occupation | Male | Female |
| Healthcare Support | 0 (0.0%) | 15 (100.0%) |
| Security & Protection | 0 (0.0%) | 0 (0.0%) |
| Firefighting & Prevention | 0 (0.0%) | 0 (0.0%) |
| Law Enforcement | 0 (0.0%) | 0 (0.0%) |
| Food Preparation & Serving | 0 (0.0%) | 0 (0.0%) |
| Cleaning & Maintenance | 0 (0.0%) | 0 (0.0%) |
| Personal Care & Service | 0 (0.0%) | 0 (0.0%) |
| Total (Category) | 0 (0.0%) | 15 (100.0%) |
| Total (Overall) | 62 (55.9%) | 49 (44.1%) |
Sales and Office Occupations
The most common Sales and Office occupations in Bluffton are Office & Administration (21 | 18.9%), and Sales & Related (11 | 9.9%).
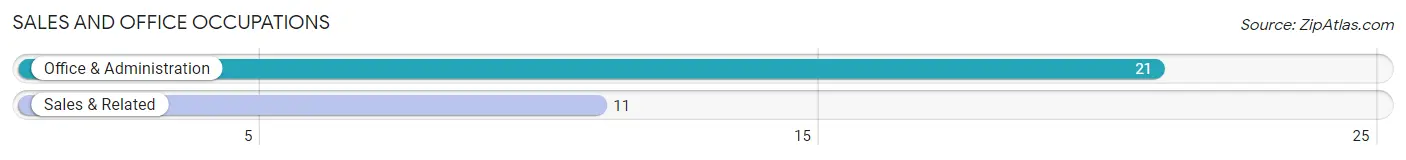
Sales and Office Occupations by Sex
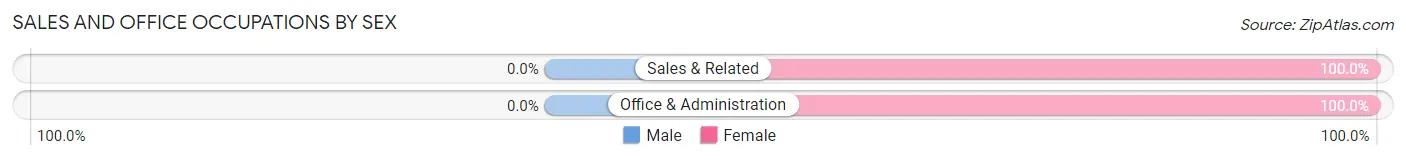
| Occupation | Male | Female |
| Sales & Related | 0 (0.0%) | 11 (100.0%) |
| Office & Administration | 0 (0.0%) | 21 (100.0%) |
| Total (Category) | 0 (0.0%) | 32 (100.0%) |
| Total (Overall) | 62 (55.9%) | 49 (44.1%) |
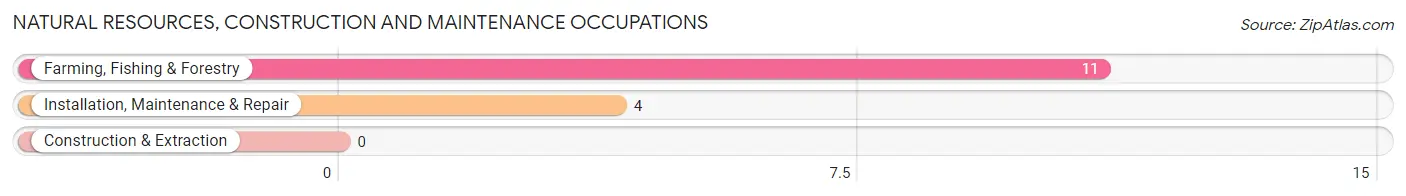
Natural Resources, Construction and Maintenance Occupations
The most common Natural Resources, Construction and Maintenance occupations in Bluffton are Farming, Fishing & Forestry (11 | 9.9%), and Installation, Maintenance & Repair (4 | 3.6%).
Natural Resources, Construction and Maintenance Occupations by Sex
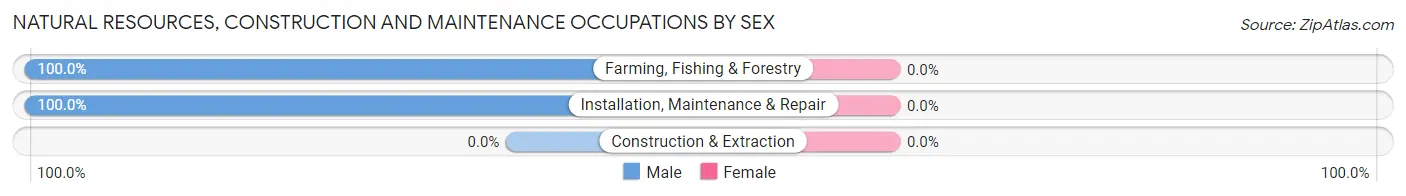
| Occupation | Male | Female |
| Farming, Fishing & Forestry | 11 (100.0%) | 0 (0.0%) |
| Construction & Extraction | 0 (0.0%) | 0 (0.0%) |
| Installation, Maintenance & Repair | 4 (100.0%) | 0 (0.0%) |
| Total (Category) | 15 (100.0%) | 0 (0.0%) |
| Total (Overall) | 62 (55.9%) | 49 (44.1%) |
Production, Transportation and Moving Occupations
The most common Production, Transportation and Moving occupations in Bluffton are , and Production (33 | 29.7%).
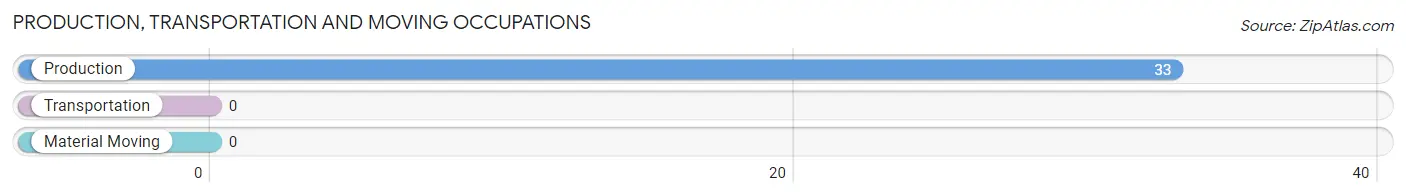
Production, Transportation and Moving Occupations by Sex
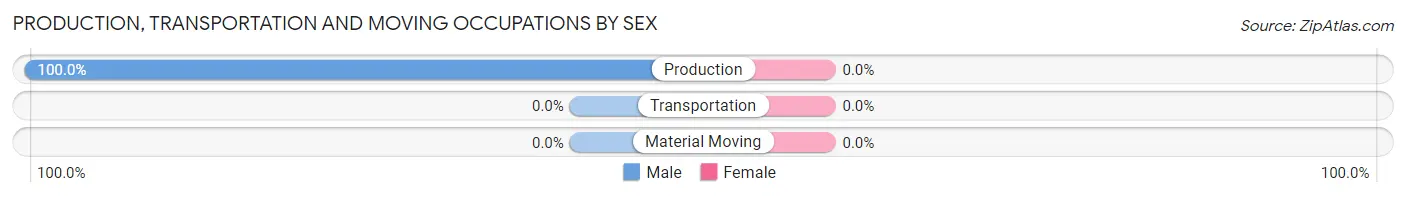
| Occupation | Male | Female |
| Production | 33 (100.0%) | 0 (0.0%) |
| Transportation | 0 (0.0%) | 0 (0.0%) |
| Material Moving | 0 (0.0%) | 0 (0.0%) |
| Total (Category) | 33 (100.0%) | 0 (0.0%) |
| Total (Overall) | 62 (55.9%) | 49 (44.1%) |
Employment Industries by Sex in Bluffton
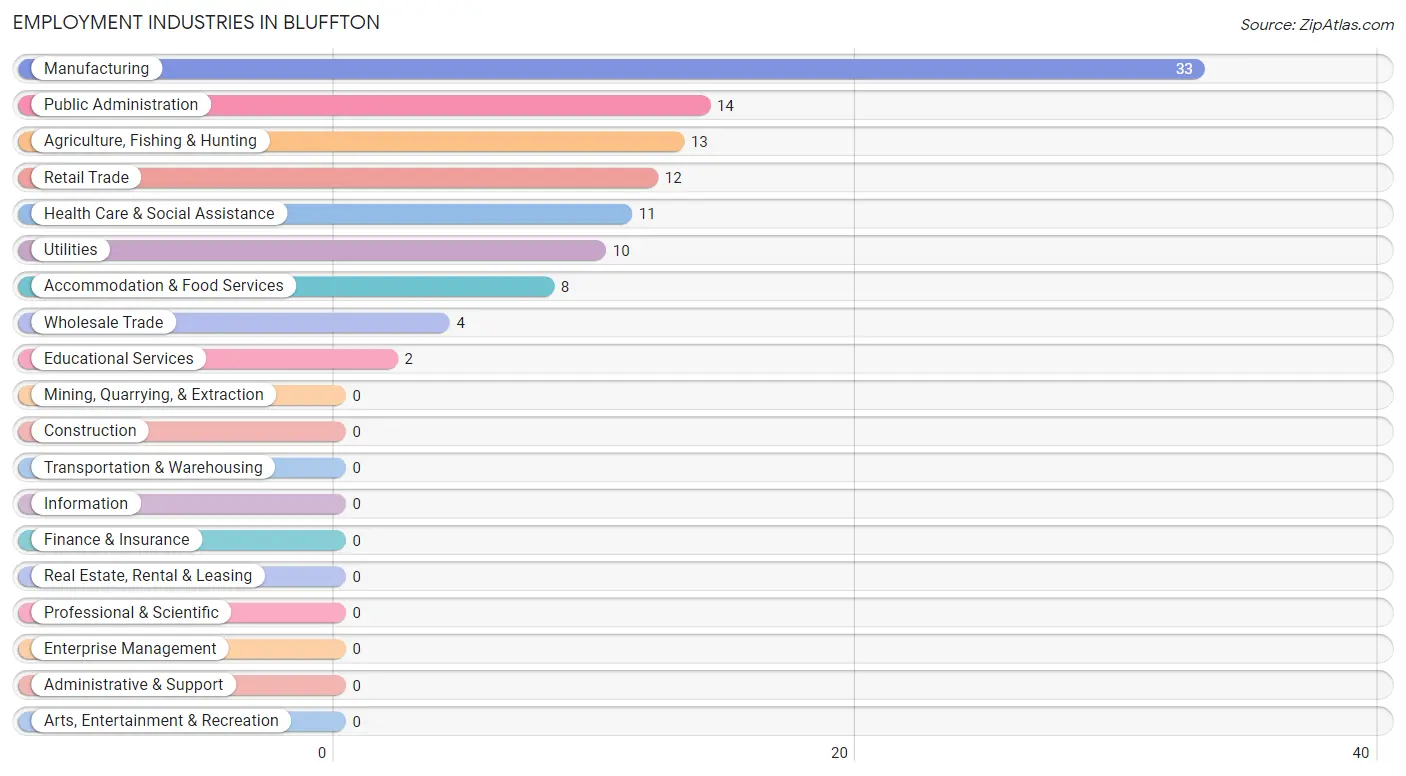
Employment Industries in Bluffton
The major employment industries in Bluffton include Manufacturing (33 | 29.7%), Public Administration (14 | 12.6%), Agriculture, Fishing & Hunting (13 | 11.7%), Retail Trade (12 | 10.8%), and Health Care & Social Assistance (11 | 9.9%).
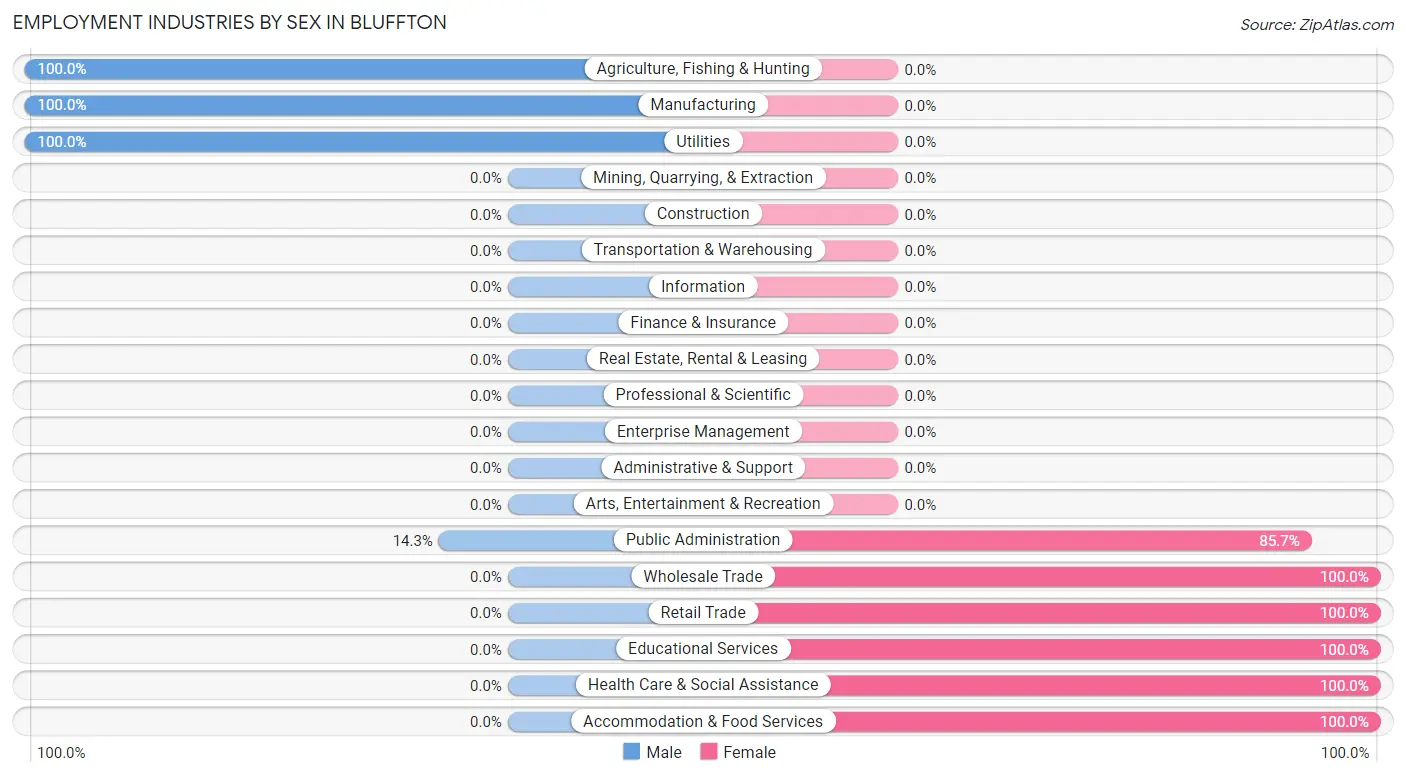
Employment Industries by Sex in Bluffton
The Bluffton industries that see more men than women are Agriculture, Fishing & Hunting (100.0%), Manufacturing (100.0%), and Utilities (100.0%), whereas the industries that tend to have a higher number of women are Wholesale Trade (100.0%), Retail Trade (100.0%), and Educational Services (100.0%).
| Industry | Male | Female |
| Agriculture, Fishing & Hunting | 13 (100.0%) | 0 (0.0%) |
| Mining, Quarrying, & Extraction | 0 (0.0%) | 0 (0.0%) |
| Construction | 0 (0.0%) | 0 (0.0%) |
| Manufacturing | 33 (100.0%) | 0 (0.0%) |
| Wholesale Trade | 0 (0.0%) | 4 (100.0%) |
| Retail Trade | 0 (0.0%) | 12 (100.0%) |
| Transportation & Warehousing | 0 (0.0%) | 0 (0.0%) |
| Utilities | 10 (100.0%) | 0 (0.0%) |
| Information | 0 (0.0%) | 0 (0.0%) |
| Finance & Insurance | 0 (0.0%) | 0 (0.0%) |
| Real Estate, Rental & Leasing | 0 (0.0%) | 0 (0.0%) |
| Professional & Scientific | 0 (0.0%) | 0 (0.0%) |
| Enterprise Management | 0 (0.0%) | 0 (0.0%) |
| Administrative & Support | 0 (0.0%) | 0 (0.0%) |
| Educational Services | 0 (0.0%) | 2 (100.0%) |
| Health Care & Social Assistance | 0 (0.0%) | 11 (100.0%) |
| Arts, Entertainment & Recreation | 0 (0.0%) | 0 (0.0%) |
| Accommodation & Food Services | 0 (0.0%) | 8 (100.0%) |
| Public Administration | 2 (14.3%) | 12 (85.7%) |
| Total | 62 (55.9%) | 49 (44.1%) |
Education in Bluffton
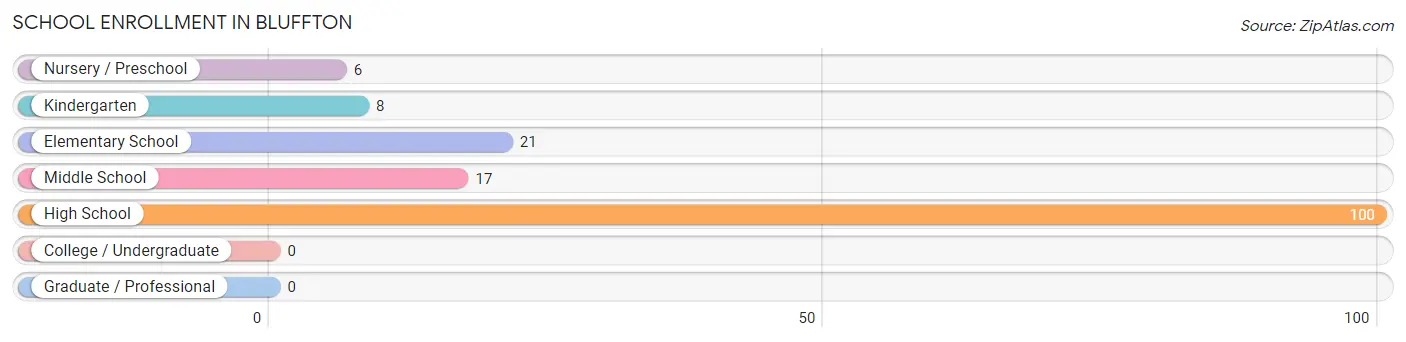
School Enrollment in Bluffton
The most common levels of schooling among the 152 students in Bluffton are high school (100 | 65.8%), elementary school (21 | 13.8%), and middle school (17 | 11.2%).
| School Level | # Students | % Students |
| Nursery / Preschool | 6 | 4.0% |
| Kindergarten | 8 | 5.3% |
| Elementary School | 21 | 13.8% |
| Middle School | 17 | 11.2% |
| High School | 100 | 65.8% |
| College / Undergraduate | 0 | 0.0% |
| Graduate / Professional | 0 | 0.0% |
| Total | 152 | 100.0% |
School Enrollment by Age by Funding Source in Bluffton
Out of a total of 152 students who are enrolled in schools in Bluffton, 1 (0.7%) attend a private institution, while the remaining 151 (99.3%) are enrolled in public schools. The age group of 5 to 9 year old has the highest likelihood of being enrolled in private schools, with 1 (3.5% in the age bracket) enrolled. Conversely, the age group of 3 to 4 year olds has the lowest likelihood of being enrolled in a private school, with 6 (100.0% in the age bracket) attending a public institution.
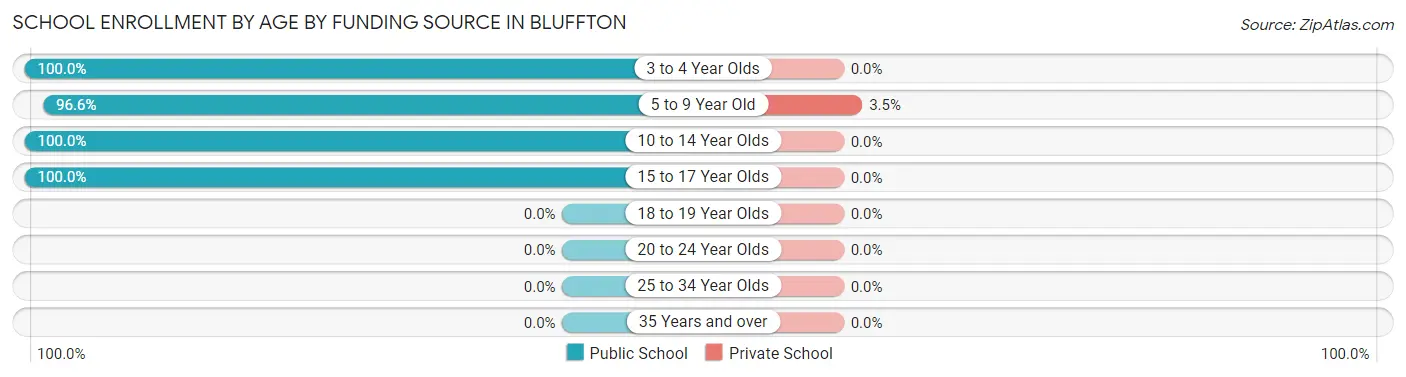
| Age Bracket | Public School | Private School |
| 3 to 4 Year Olds | 6 (100.0%) | 0 (0.0%) |
| 5 to 9 Year Old | 28 (96.6%) | 1 (3.5%) |
| 10 to 14 Year Olds | 17 (100.0%) | 0 (0.0%) |
| 15 to 17 Year Olds | 100 (100.0%) | 0 (0.0%) |
| 18 to 19 Year Olds | 0 (0.0%) | 0 (0.0%) |
| 20 to 24 Year Olds | 0 (0.0%) | 0 (0.0%) |
| 25 to 34 Year Olds | 0 (0.0%) | 0 (0.0%) |
| 35 Years and over | 0 (0.0%) | 0 (0.0%) |
| Total | 151 (99.3%) | 1 (0.7%) |
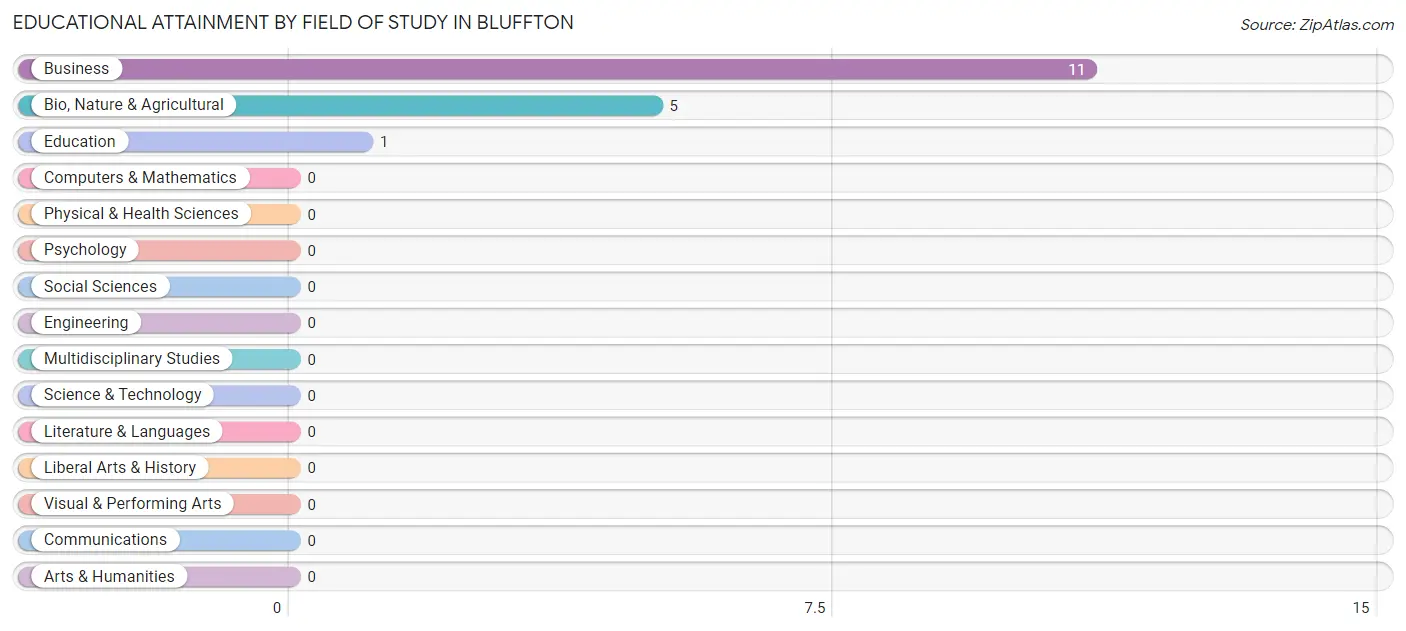
Educational Attainment by Field of Study in Bluffton
Business (11 | 64.7%), bio, nature & agricultural (5 | 29.4%), and education (1 | 5.9%) are the most common fields of study among 17 individuals in Bluffton who have obtained a bachelor's degree or higher.
| Field of Study | # Graduates | % Graduates |
| Computers & Mathematics | 0 | 0.0% |
| Bio, Nature & Agricultural | 5 | 29.4% |
| Physical & Health Sciences | 0 | 0.0% |
| Psychology | 0 | 0.0% |
| Social Sciences | 0 | 0.0% |
| Engineering | 0 | 0.0% |
| Multidisciplinary Studies | 0 | 0.0% |
| Science & Technology | 0 | 0.0% |
| Business | 11 | 64.7% |
| Education | 1 | 5.9% |
| Literature & Languages | 0 | 0.0% |
| Liberal Arts & History | 0 | 0.0% |
| Visual & Performing Arts | 0 | 0.0% |
| Communications | 0 | 0.0% |
| Arts & Humanities | 0 | 0.0% |
| Total | 17 | 100.0% |
Transportation & Commute in Bluffton
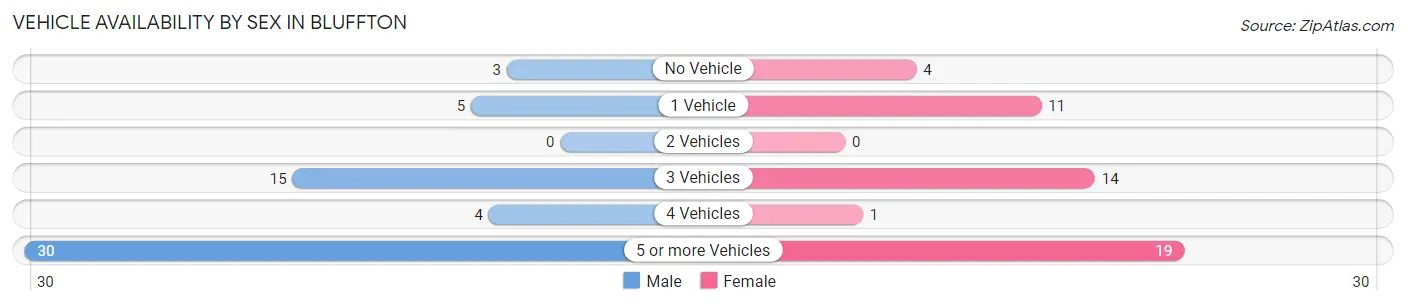
Vehicle Availability by Sex in Bluffton
The most prevalent vehicle ownership categories in Bluffton are males with 5 or more vehicles (30, accounting for 52.6%) and females with 5 or more vehicles (19, making up 61.2%).
| Vehicles Available | Male | Female |
| No Vehicle | 3 (5.3%) | 4 (8.2%) |
| 1 Vehicle | 5 (8.8%) | 11 (22.5%) |
| 2 Vehicles | 0 (0.0%) | 0 (0.0%) |
| 3 Vehicles | 15 (26.3%) | 14 (28.6%) |
| 4 Vehicles | 4 (7.0%) | 1 (2.0%) |
| 5 or more Vehicles | 30 (52.6%) | 19 (38.8%) |
| Total | 57 (100.0%) | 49 (100.0%) |
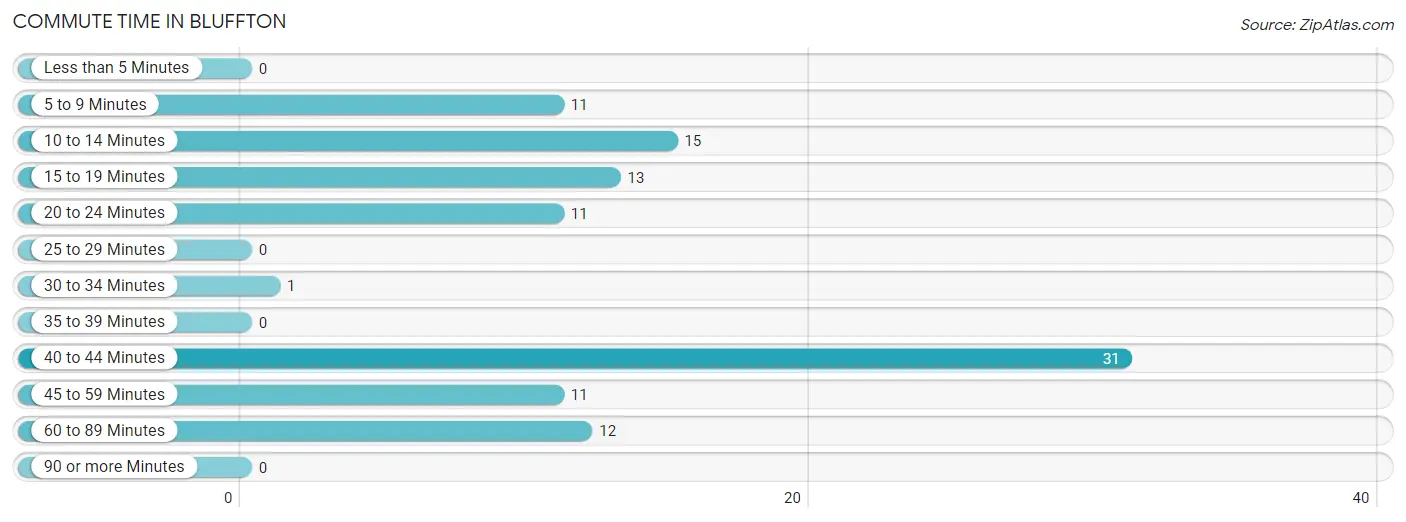
Commute Time in Bluffton
The most frequently occuring commute durations in Bluffton are 40 to 44 minutes (31 commuters, 29.5%), 10 to 14 minutes (15 commuters, 14.3%), and 15 to 19 minutes (13 commuters, 12.4%).
| Commute Time | # Commuters | % Commuters |
| Less than 5 Minutes | 0 | 0.0% |
| 5 to 9 Minutes | 11 | 10.5% |
| 10 to 14 Minutes | 15 | 14.3% |
| 15 to 19 Minutes | 13 | 12.4% |
| 20 to 24 Minutes | 11 | 10.5% |
| 25 to 29 Minutes | 0 | 0.0% |
| 30 to 34 Minutes | 1 | 0.9% |
| 35 to 39 Minutes | 0 | 0.0% |
| 40 to 44 Minutes | 31 | 29.5% |
| 45 to 59 Minutes | 11 | 10.5% |
| 60 to 89 Minutes | 12 | 11.4% |
| 90 or more Minutes | 0 | 0.0% |
Commute Time by Sex in Bluffton
The most common commute times in Bluffton are 40 to 44 minutes (31 commuters, 54.4%) for males and 15 to 19 minutes (13 commuters, 27.1%) for females.
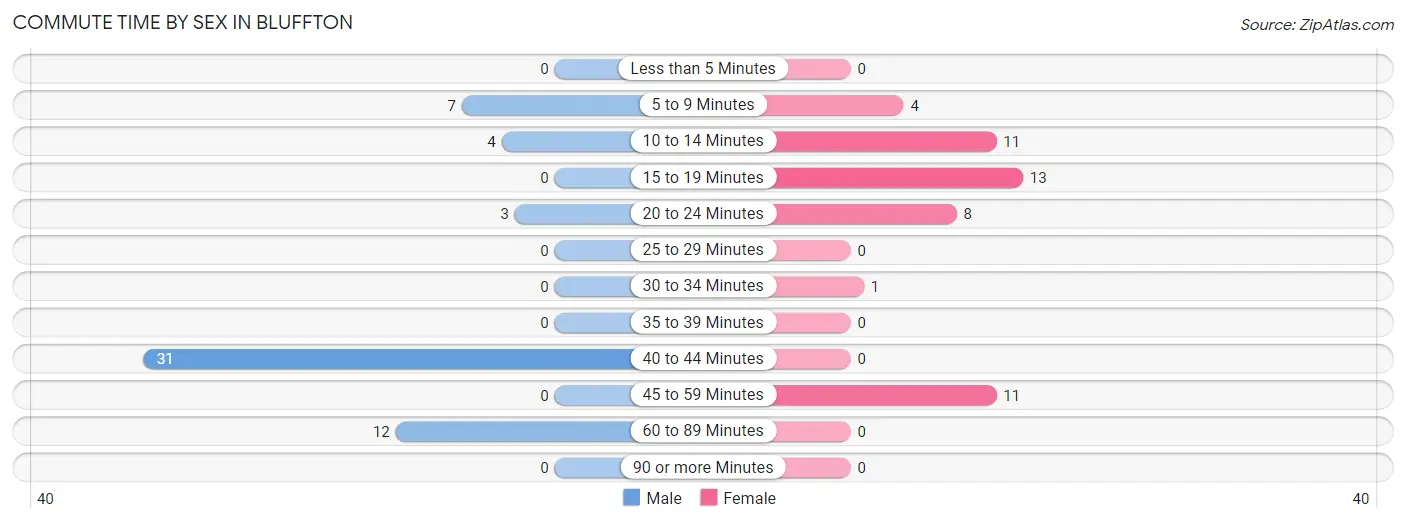
| Commute Time | Male | Female |
| Less than 5 Minutes | 0 (0.0%) | 0 (0.0%) |
| 5 to 9 Minutes | 7 (12.3%) | 4 (8.3%) |
| 10 to 14 Minutes | 4 (7.0%) | 11 (22.9%) |
| 15 to 19 Minutes | 0 (0.0%) | 13 (27.1%) |
| 20 to 24 Minutes | 3 (5.3%) | 8 (16.7%) |
| 25 to 29 Minutes | 0 (0.0%) | 0 (0.0%) |
| 30 to 34 Minutes | 0 (0.0%) | 1 (2.1%) |
| 35 to 39 Minutes | 0 (0.0%) | 0 (0.0%) |
| 40 to 44 Minutes | 31 (54.4%) | 0 (0.0%) |
| 45 to 59 Minutes | 0 (0.0%) | 11 (22.9%) |
| 60 to 89 Minutes | 12 (21.0%) | 0 (0.0%) |
| 90 or more Minutes | 0 (0.0%) | 0 (0.0%) |
Time of Departure to Work by Sex in Bluffton
The most frequent times of departure to work in Bluffton are 6:00 AM to 6:29 AM (40, 70.2%) for males and 8:00 AM to 8:29 AM (23, 47.9%) for females.
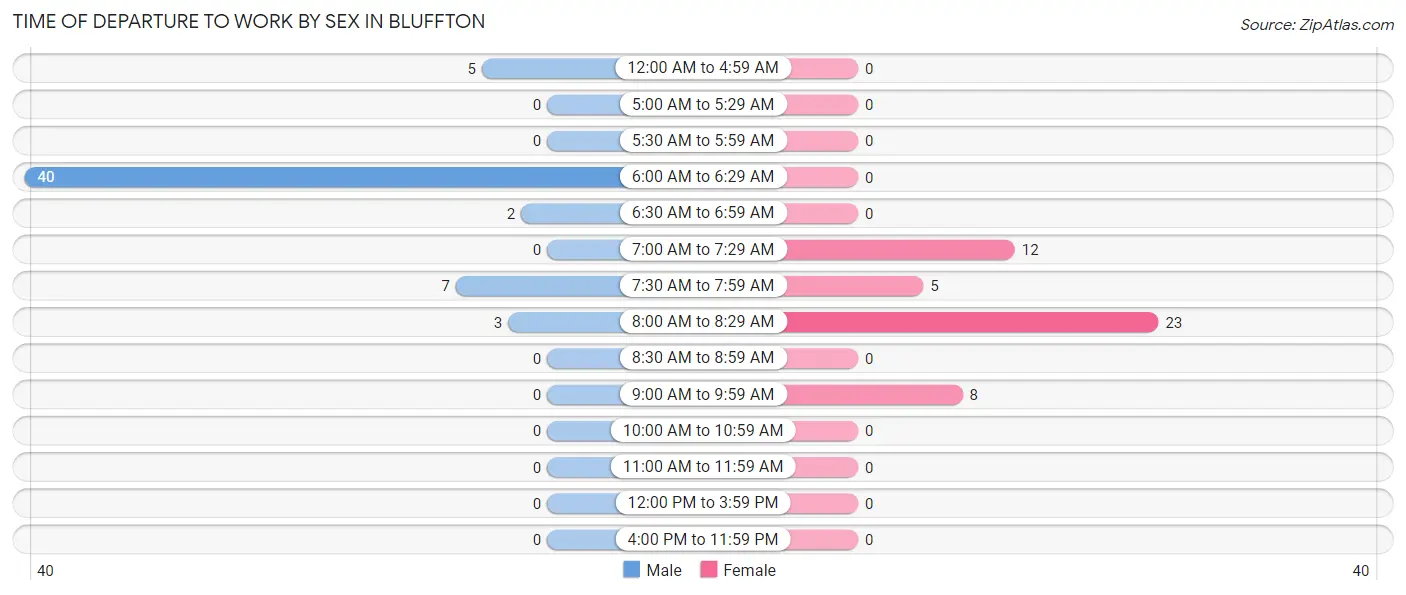
| Time of Departure | Male | Female |
| 12:00 AM to 4:59 AM | 5 (8.8%) | 0 (0.0%) |
| 5:00 AM to 5:29 AM | 0 (0.0%) | 0 (0.0%) |
| 5:30 AM to 5:59 AM | 0 (0.0%) | 0 (0.0%) |
| 6:00 AM to 6:29 AM | 40 (70.2%) | 0 (0.0%) |
| 6:30 AM to 6:59 AM | 2 (3.5%) | 0 (0.0%) |
| 7:00 AM to 7:29 AM | 0 (0.0%) | 12 (25.0%) |
| 7:30 AM to 7:59 AM | 7 (12.3%) | 5 (10.4%) |
| 8:00 AM to 8:29 AM | 3 (5.3%) | 23 (47.9%) |
| 8:30 AM to 8:59 AM | 0 (0.0%) | 0 (0.0%) |
| 9:00 AM to 9:59 AM | 0 (0.0%) | 8 (16.7%) |
| 10:00 AM to 10:59 AM | 0 (0.0%) | 0 (0.0%) |
| 11:00 AM to 11:59 AM | 0 (0.0%) | 0 (0.0%) |
| 12:00 PM to 3:59 PM | 0 (0.0%) | 0 (0.0%) |
| 4:00 PM to 11:59 PM | 0 (0.0%) | 0 (0.0%) |
| Total | 57 (100.0%) | 48 (100.0%) |
Housing Occupancy in Bluffton
Occupancy by Ownership in Bluffton
Of the total 52 dwellings in Bluffton, owner-occupied units account for 32 (61.5%), while renter-occupied units make up 20 (38.5%).
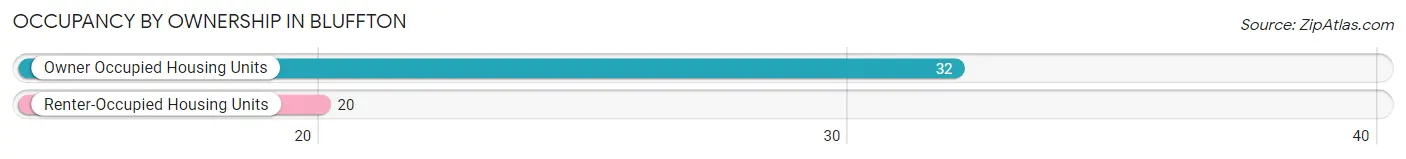
| Occupancy | # Housing Units | % Housing Units |
| Owner Occupied Housing Units | 32 | 61.5% |
| Renter-Occupied Housing Units | 20 | 38.5% |
| Total Occupied Housing Units | 52 | 100.0% |
Occupancy by Household Size in Bluffton
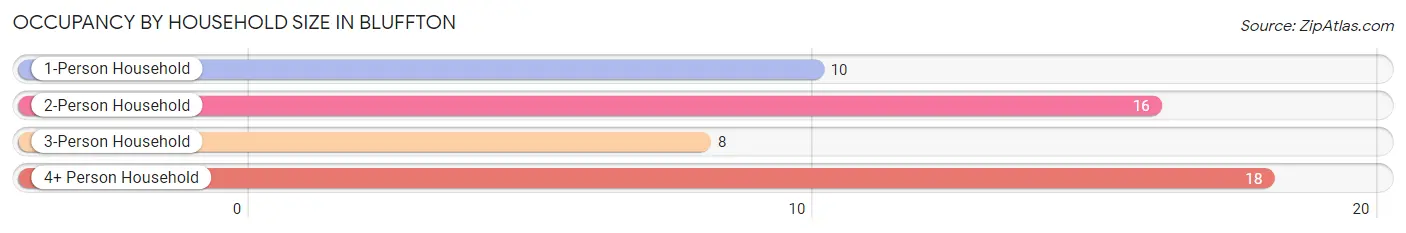
| Household Size | # Housing Units | % Housing Units |
| 1-Person Household | 10 | 19.2% |
| 2-Person Household | 16 | 30.8% |
| 3-Person Household | 8 | 15.4% |
| 4+ Person Household | 18 | 34.6% |
| Total Housing Units | 52 | 100.0% |
Occupancy by Ownership by Household Size in Bluffton
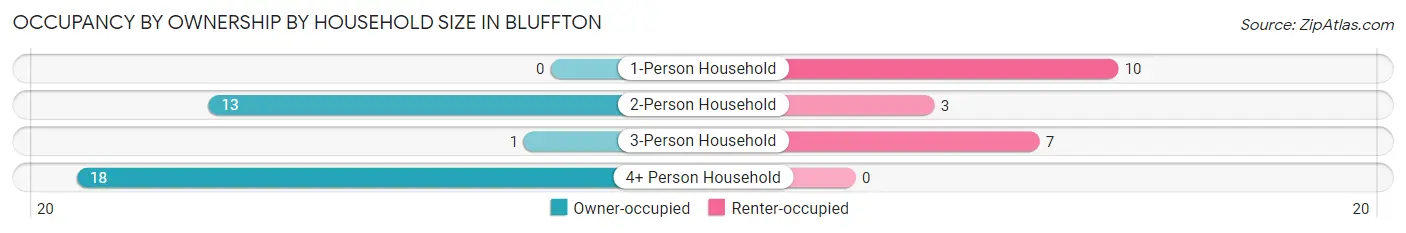
| Household Size | Owner-occupied | Renter-occupied |
| 1-Person Household | 0 (0.0%) | 10 (100.0%) |
| 2-Person Household | 13 (81.2%) | 3 (18.8%) |
| 3-Person Household | 1 (12.5%) | 7 (87.5%) |
| 4+ Person Household | 18 (100.0%) | 0 (0.0%) |
| Total Housing Units | 32 (61.5%) | 20 (38.5%) |
Occupancy by Educational Attainment in Bluffton
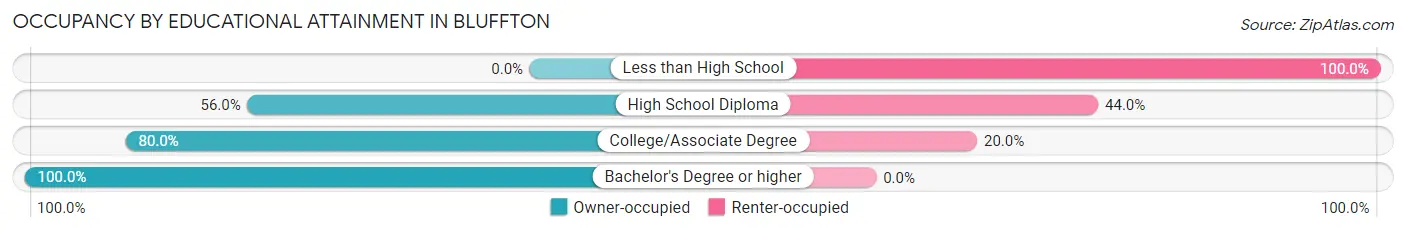
| Household Size | Owner-occupied | Renter-occupied |
| Less than High School | 0 (0.0%) | 5 (100.0%) |
| High School Diploma | 14 (56.0%) | 11 (44.0%) |
| College/Associate Degree | 16 (80.0%) | 4 (20.0%) |
| Bachelor's Degree or higher | 2 (100.0%) | 0 (0.0%) |
Occupancy by Age of Householder in Bluffton
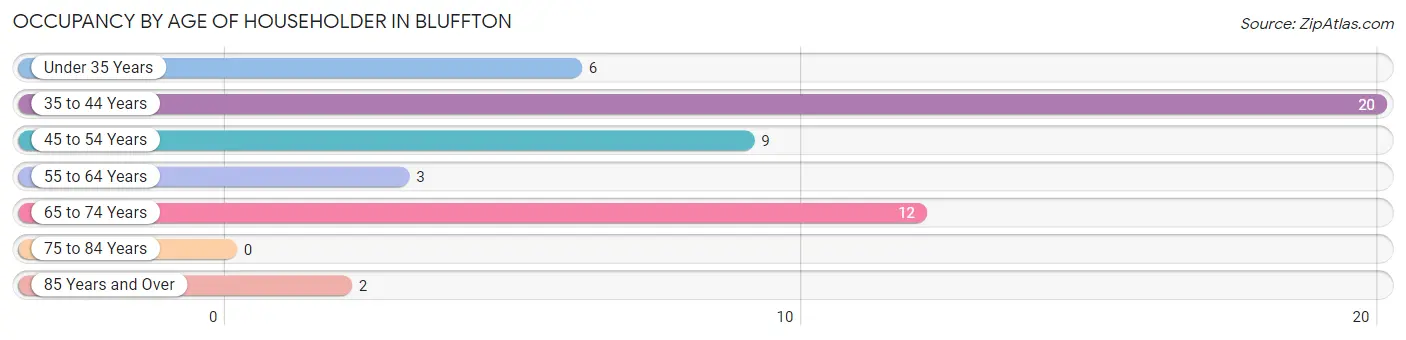
| Age Bracket | # Households | % Households |
| Under 35 Years | 6 | 11.5% |
| 35 to 44 Years | 20 | 38.5% |
| 45 to 54 Years | 9 | 17.3% |
| 55 to 64 Years | 3 | 5.8% |
| 65 to 74 Years | 12 | 23.1% |
| 75 to 84 Years | 0 | 0.0% |
| 85 Years and Over | 2 | 3.8% |
| Total | 52 | 100.0% |
Housing Finances in Bluffton
Median Income by Occupancy in Bluffton
| Occupancy Type | # Households | Median Income |
| Owner-Occupied | 32 (61.5%) | $0 |
| Renter-Occupied | 20 (38.5%) | $0 |
| Average | 52 (100.0%) | $0 |
Occupancy by Householder Income Bracket in Bluffton
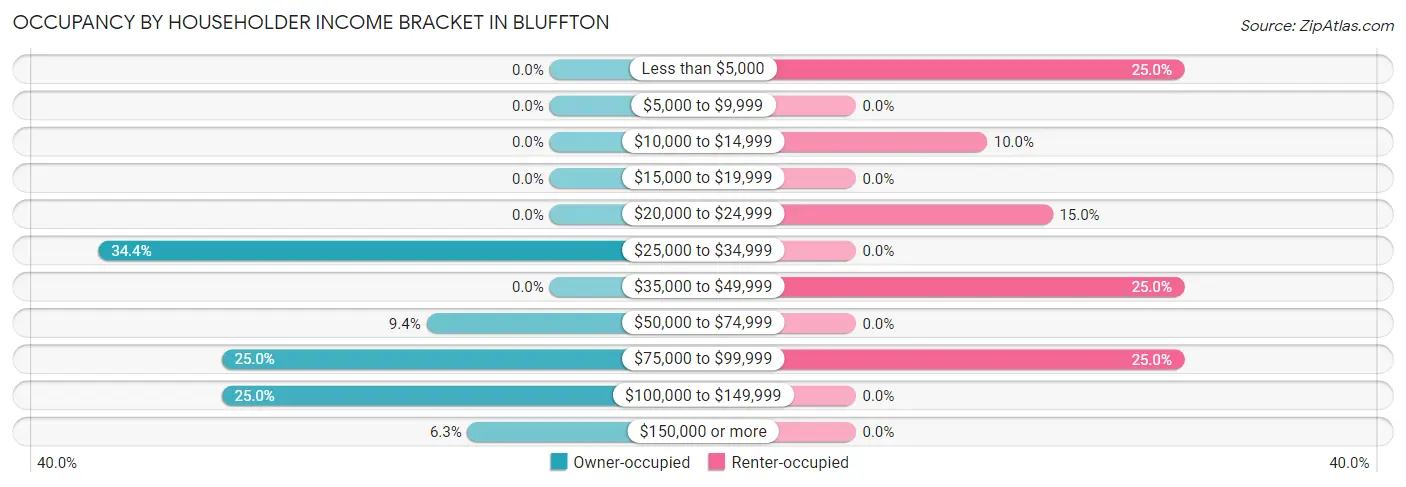
| Income Bracket | Owner-occupied | Renter-occupied |
| Less than $5,000 | 0 (0.0%) | 5 (25.0%) |
| $5,000 to $9,999 | 0 (0.0%) | 0 (0.0%) |
| $10,000 to $14,999 | 0 (0.0%) | 2 (10.0%) |
| $15,000 to $19,999 | 0 (0.0%) | 0 (0.0%) |
| $20,000 to $24,999 | 0 (0.0%) | 3 (15.0%) |
| $25,000 to $34,999 | 11 (34.4%) | 0 (0.0%) |
| $35,000 to $49,999 | 0 (0.0%) | 5 (25.0%) |
| $50,000 to $74,999 | 3 (9.4%) | 0 (0.0%) |
| $75,000 to $99,999 | 8 (25.0%) | 5 (25.0%) |
| $100,000 to $149,999 | 8 (25.0%) | 0 (0.0%) |
| $150,000 or more | 2 (6.2%) | 0 (0.0%) |
| Total | 32 (100.0%) | 20 (100.0%) |
Monthly Housing Cost Tiers in Bluffton
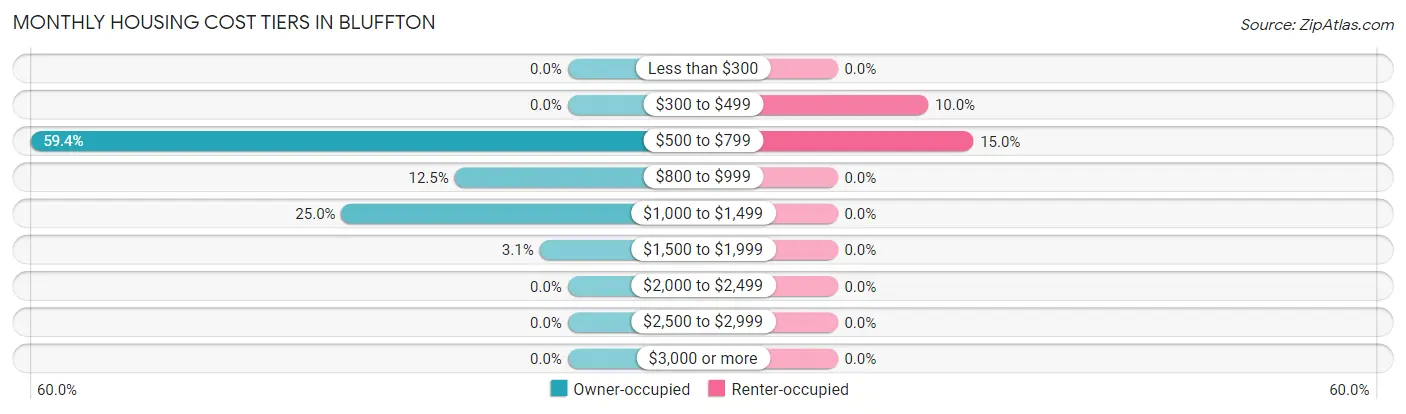
| Monthly Cost | Owner-occupied | Renter-occupied |
| Less than $300 | 0 (0.0%) | 0 (0.0%) |
| $300 to $499 | 0 (0.0%) | 2 (10.0%) |
| $500 to $799 | 19 (59.4%) | 3 (15.0%) |
| $800 to $999 | 4 (12.5%) | 0 (0.0%) |
| $1,000 to $1,499 | 8 (25.0%) | 0 (0.0%) |
| $1,500 to $1,999 | 1 (3.1%) | 0 (0.0%) |
| $2,000 to $2,499 | 0 (0.0%) | 0 (0.0%) |
| $2,500 to $2,999 | 0 (0.0%) | 0 (0.0%) |
| $3,000 or more | 0 (0.0%) | 0 (0.0%) |
| Total | 32 (100.0%) | 20 (100.0%) |
Physical Housing Characteristics in Bluffton
Housing Structures in Bluffton
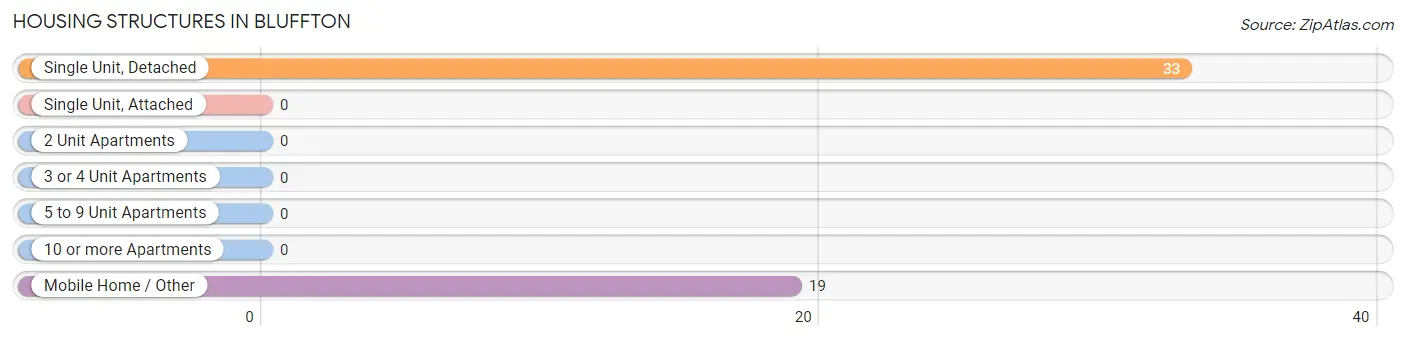
| Structure Type | # Housing Units | % Housing Units |
| Single Unit, Detached | 33 | 63.5% |
| Single Unit, Attached | 0 | 0.0% |
| 2 Unit Apartments | 0 | 0.0% |
| 3 or 4 Unit Apartments | 0 | 0.0% |
| 5 to 9 Unit Apartments | 0 | 0.0% |
| 10 or more Apartments | 0 | 0.0% |
| Mobile Home / Other | 19 | 36.5% |
| Total | 52 | 100.0% |
Housing Structures by Occupancy in Bluffton
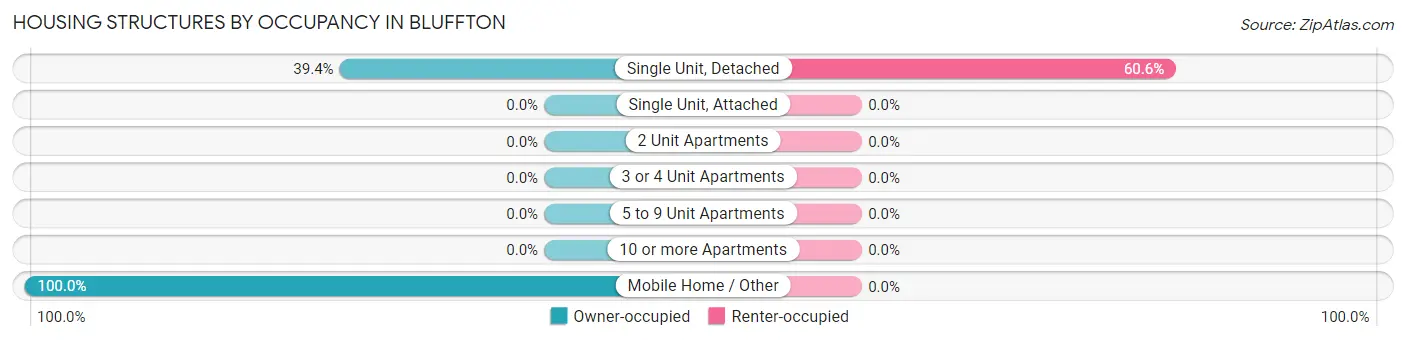
| Structure Type | Owner-occupied | Renter-occupied |
| Single Unit, Detached | 13 (39.4%) | 20 (60.6%) |
| Single Unit, Attached | 0 (0.0%) | 0 (0.0%) |
| 2 Unit Apartments | 0 (0.0%) | 0 (0.0%) |
| 3 or 4 Unit Apartments | 0 (0.0%) | 0 (0.0%) |
| 5 to 9 Unit Apartments | 0 (0.0%) | 0 (0.0%) |
| 10 or more Apartments | 0 (0.0%) | 0 (0.0%) |
| Mobile Home / Other | 19 (100.0%) | 0 (0.0%) |
| Total | 32 (61.5%) | 20 (38.5%) |
Housing Structures by Number of Rooms in Bluffton
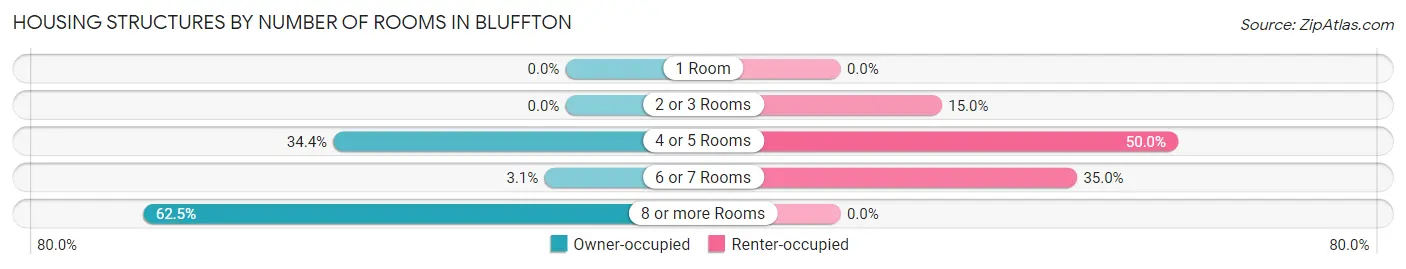
| Number of Rooms | Owner-occupied | Renter-occupied |
| 1 Room | 0 (0.0%) | 0 (0.0%) |
| 2 or 3 Rooms | 0 (0.0%) | 3 (15.0%) |
| 4 or 5 Rooms | 11 (34.4%) | 10 (50.0%) |
| 6 or 7 Rooms | 1 (3.1%) | 7 (35.0%) |
| 8 or more Rooms | 20 (62.5%) | 0 (0.0%) |
| Total | 32 (100.0%) | 20 (100.0%) |
Housing Structure by Heating Type in Bluffton
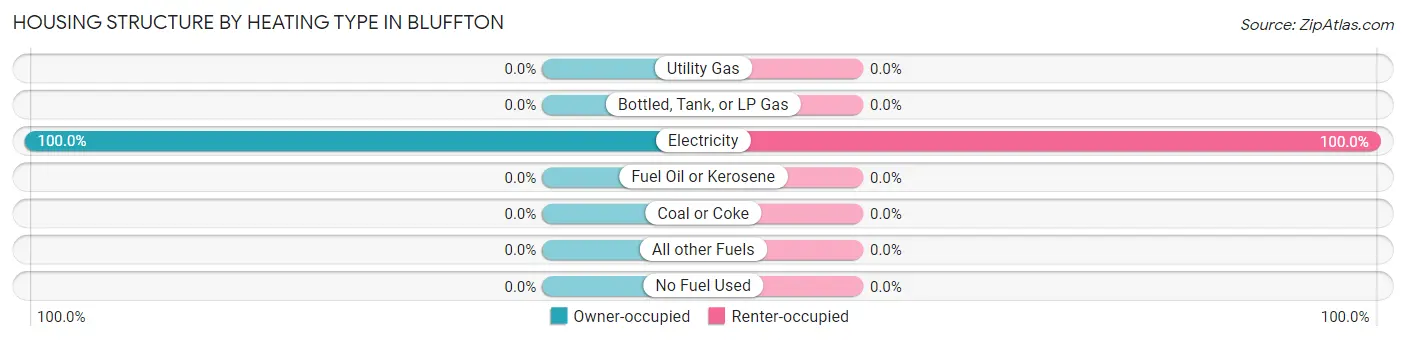
| Heating Type | Owner-occupied | Renter-occupied |
| Utility Gas | 0 (0.0%) | 0 (0.0%) |
| Bottled, Tank, or LP Gas | 0 (0.0%) | 0 (0.0%) |
| Electricity | 32 (100.0%) | 20 (100.0%) |
| Fuel Oil or Kerosene | 0 (0.0%) | 0 (0.0%) |
| Coal or Coke | 0 (0.0%) | 0 (0.0%) |
| All other Fuels | 0 (0.0%) | 0 (0.0%) |
| No Fuel Used | 0 (0.0%) | 0 (0.0%) |
| Total | 32 (100.0%) | 20 (100.0%) |
Household Vehicle Usage in Bluffton
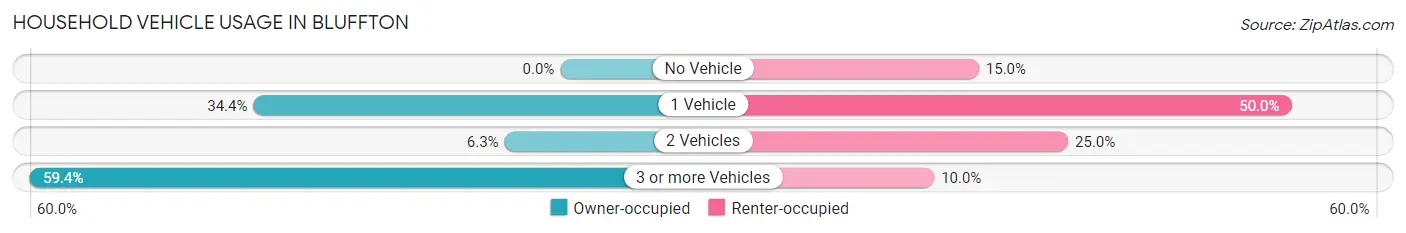
| Vehicles per Household | Owner-occupied | Renter-occupied |
| No Vehicle | 0 (0.0%) | 3 (15.0%) |
| 1 Vehicle | 11 (34.4%) | 10 (50.0%) |
| 2 Vehicles | 2 (6.2%) | 5 (25.0%) |
| 3 or more Vehicles | 19 (59.4%) | 2 (10.0%) |
| Total | 32 (100.0%) | 20 (100.0%) |
Real Estate & Mortgages in Bluffton
Real Estate and Mortgage Overview in Bluffton
| Characteristic | Without Mortgage | With Mortgage |
| Housing Units | 13 | 19 |
| Median Property Value | - | - |
| Median Household Income | - | - |
| Monthly Housing Costs | $659 | $0 |
| Real Estate Taxes | $199 | $0 |
Property Value by Mortgage Status in Bluffton
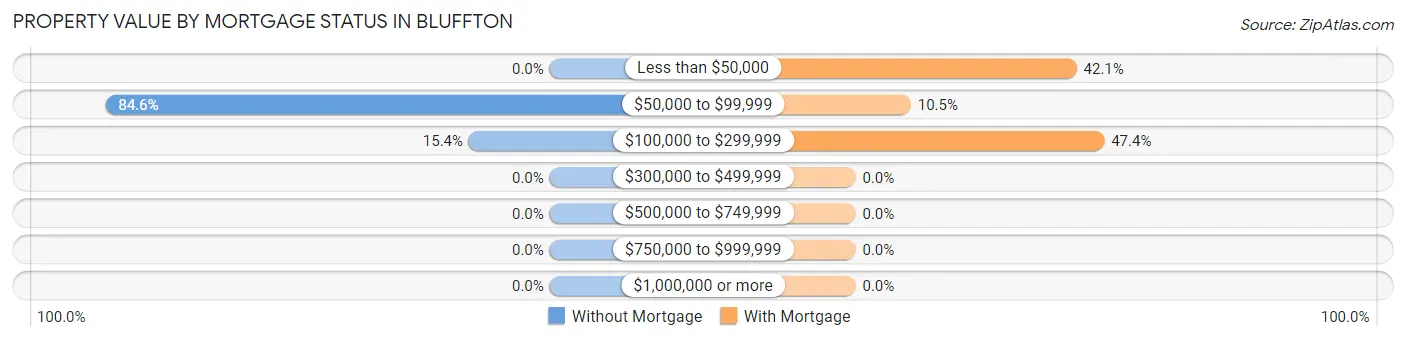
| Property Value | Without Mortgage | With Mortgage |
| Less than $50,000 | 0 (0.0%) | 8 (42.1%) |
| $50,000 to $99,999 | 11 (84.6%) | 2 (10.5%) |
| $100,000 to $299,999 | 2 (15.4%) | 9 (47.4%) |
| $300,000 to $499,999 | 0 (0.0%) | 0 (0.0%) |
| $500,000 to $749,999 | 0 (0.0%) | 0 (0.0%) |
| $750,000 to $999,999 | 0 (0.0%) | 0 (0.0%) |
| $1,000,000 or more | 0 (0.0%) | 0 (0.0%) |
| Total | 13 (100.0%) | 19 (100.0%) |
Household Income by Mortgage Status in Bluffton
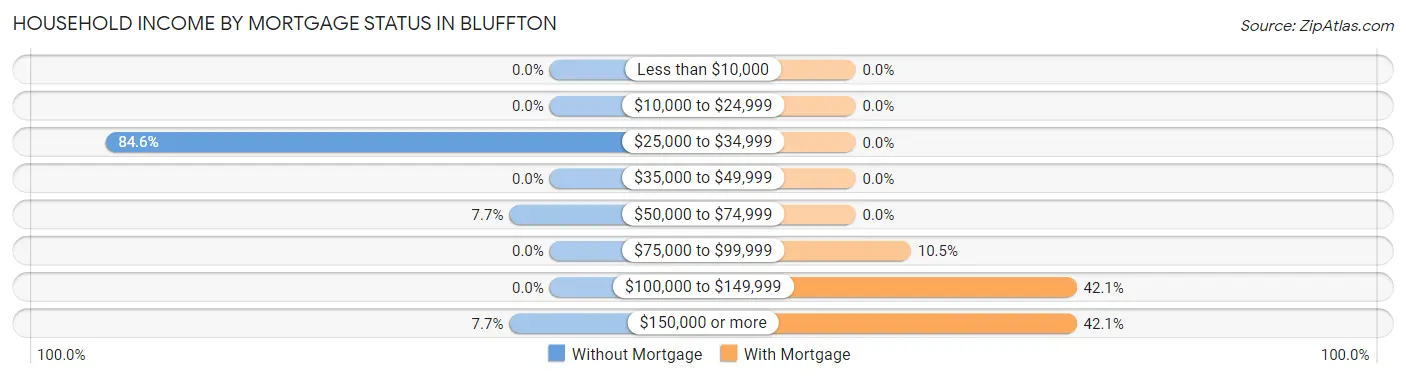
| Household Income | Without Mortgage | With Mortgage |
| Less than $10,000 | 0 (0.0%) | 0 (0.0%) |
| $10,000 to $24,999 | 0 (0.0%) | 0 (0.0%) |
| $25,000 to $34,999 | 11 (84.6%) | 0 (0.0%) |
| $35,000 to $49,999 | 0 (0.0%) | 0 (0.0%) |
| $50,000 to $74,999 | 1 (7.7%) | 0 (0.0%) |
| $75,000 to $99,999 | 0 (0.0%) | 2 (10.5%) |
| $100,000 to $149,999 | 0 (0.0%) | 8 (42.1%) |
| $150,000 or more | 1 (7.7%) | 8 (42.1%) |
| Total | 13 (100.0%) | 19 (100.0%) |
Property Value to Household Income Ratio in Bluffton
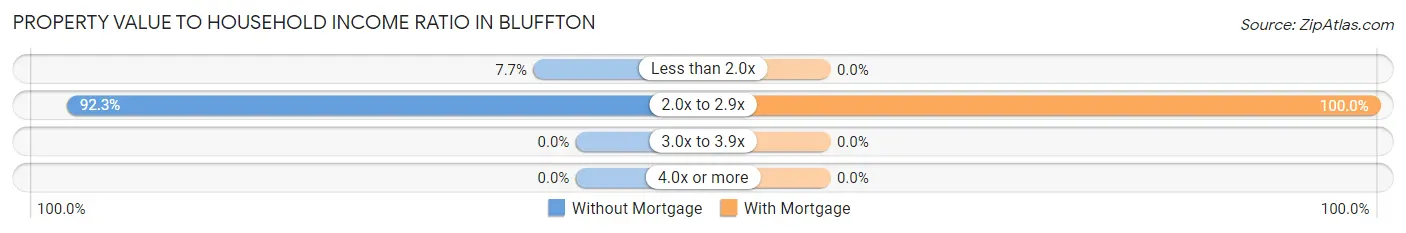
| Value-to-Income Ratio | Without Mortgage | With Mortgage |
| Less than 2.0x | 1 (7.7%) | 0 (0.0%) |
| 2.0x to 2.9x | 12 (92.3%) | 19 (100.0%) |
| 3.0x to 3.9x | 0 (0.0%) | 0 (0.0%) |
| 4.0x or more | 0 (0.0%) | 0 (0.0%) |
| Total | 13 (100.0%) | 19 (100.0%) |
Real Estate Taxes by Mortgage Status in Bluffton
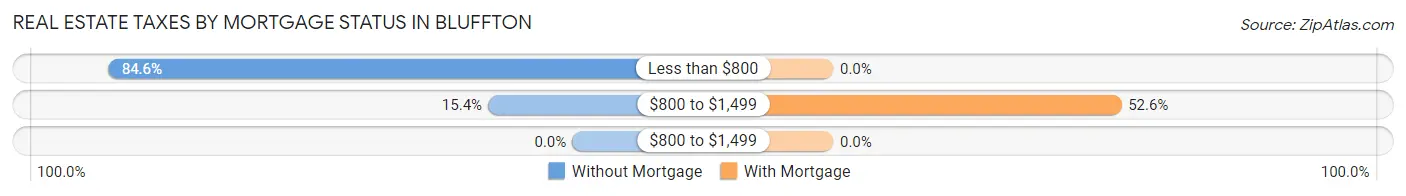
| Property Taxes | Without Mortgage | With Mortgage |
| Less than $800 | 11 (84.6%) | 0 (0.0%) |
| $800 to $1,499 | 2 (15.4%) | 10 (52.6%) |
| $800 to $1,499 | 0 (0.0%) | 0 (0.0%) |
| Total | 13 (100.0%) | 19 (100.0%) |
Health & Disability in Bluffton
Health Insurance Coverage by Age in Bluffton
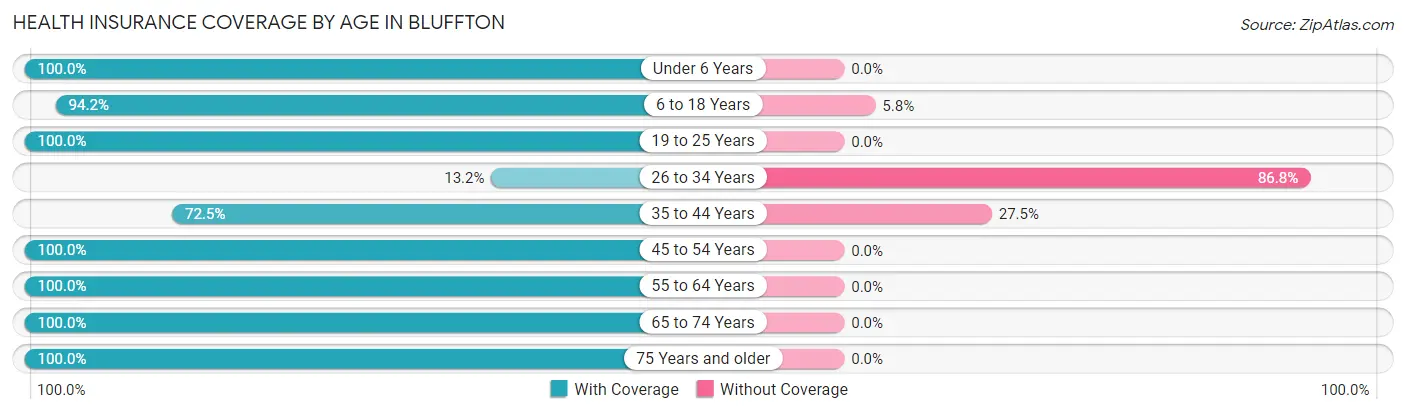
| Age Bracket | With Coverage | Without Coverage |
| Under 6 Years | 26 (100.0%) | 0 (0.0%) |
| 6 to 18 Years | 130 (94.2%) | 8 (5.8%) |
| 19 to 25 Years | 2 (100.0%) | 0 (0.0%) |
| 26 to 34 Years | 5 (13.2%) | 33 (86.8%) |
| 35 to 44 Years | 29 (72.5%) | 11 (27.5%) |
| 45 to 54 Years | 24 (100.0%) | 0 (0.0%) |
| 55 to 64 Years | 3 (100.0%) | 0 (0.0%) |
| 65 to 74 Years | 21 (100.0%) | 0 (0.0%) |
| 75 Years and older | 3 (100.0%) | 0 (0.0%) |
| Total | 243 (82.4%) | 52 (17.6%) |
Health Insurance Coverage by Citizenship Status in Bluffton
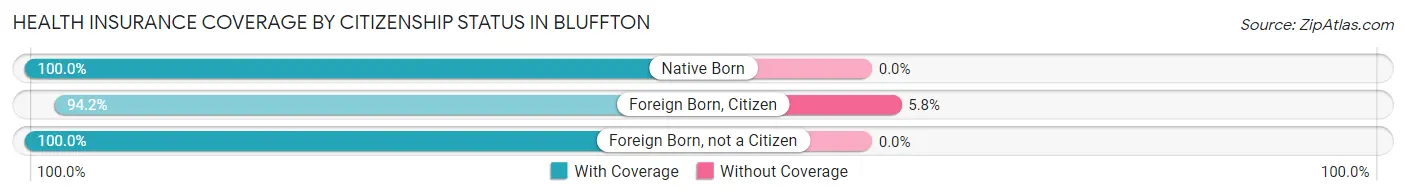
| Citizenship Status | With Coverage | Without Coverage |
| Native Born | 26 (100.0%) | 0 (0.0%) |
| Foreign Born, Citizen | 130 (94.2%) | 8 (5.8%) |
| Foreign Born, not a Citizen | 2 (100.0%) | 0 (0.0%) |
Health Insurance Coverage by Household Income in Bluffton
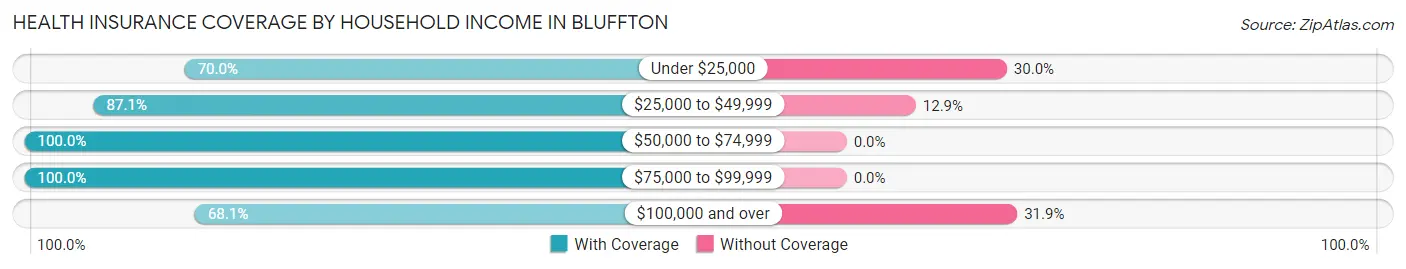
| Household Income | With Coverage | Without Coverage |
| Under $25,000 | 7 (70.0%) | 3 (30.0%) |
| $25,000 to $49,999 | 74 (87.1%) | 11 (12.9%) |
| $50,000 to $74,999 | 15 (100.0%) | 0 (0.0%) |
| $75,000 to $99,999 | 66 (100.0%) | 0 (0.0%) |
| $100,000 and over | 81 (68.1%) | 38 (31.9%) |
Public vs Private Health Insurance Coverage by Age in Bluffton
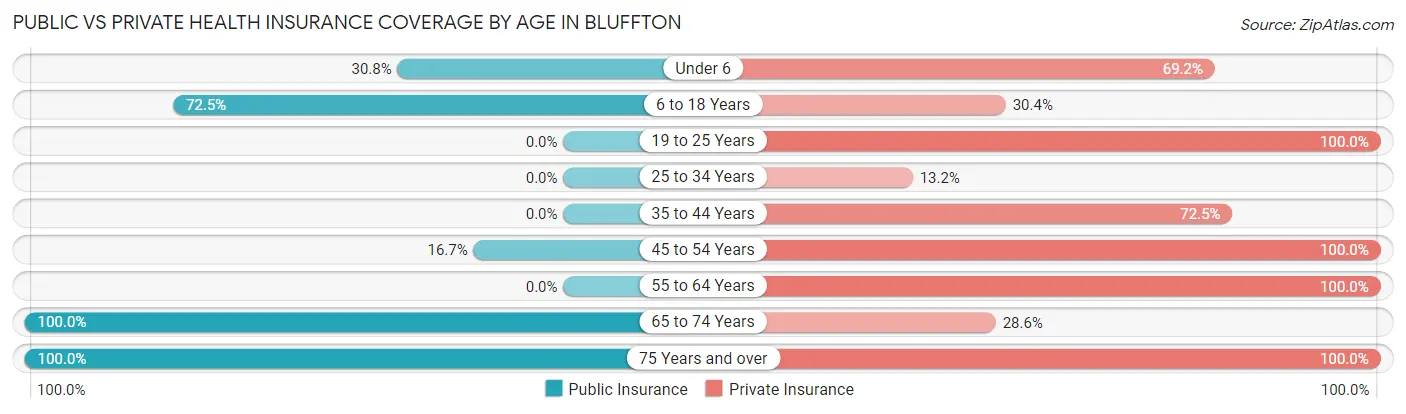
| Age Bracket | Public Insurance | Private Insurance |
| Under 6 | 8 (30.8%) | 18 (69.2%) |
| 6 to 18 Years | 100 (72.5%) | 42 (30.4%) |
| 19 to 25 Years | 0 (0.0%) | 2 (100.0%) |
| 25 to 34 Years | 0 (0.0%) | 5 (13.2%) |
| 35 to 44 Years | 0 (0.0%) | 29 (72.5%) |
| 45 to 54 Years | 4 (16.7%) | 24 (100.0%) |
| 55 to 64 Years | 0 (0.0%) | 3 (100.0%) |
| 65 to 74 Years | 21 (100.0%) | 6 (28.6%) |
| 75 Years and over | 3 (100.0%) | 3 (100.0%) |
| Total | 136 (46.1%) | 132 (44.8%) |
Disability Status by Sex by Age in Bluffton
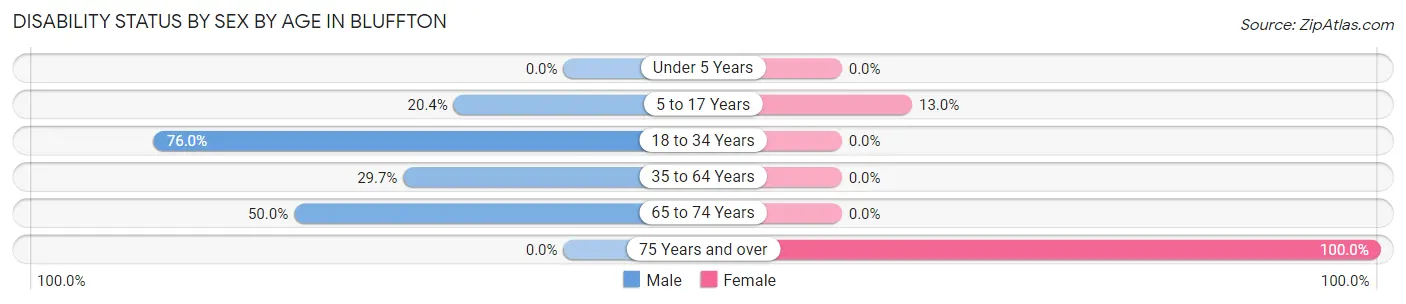
| Age Bracket | Male | Female |
| Under 5 Years | 0 (0.0%) | 0 (0.0%) |
| 5 to 17 Years | 11 (20.4%) | 12 (13.0%) |
| 18 to 34 Years | 19 (76.0%) | 0 (0.0%) |
| 35 to 64 Years | 11 (29.7%) | 0 (0.0%) |
| 65 to 74 Years | 5 (50.0%) | 0 (0.0%) |
| 75 Years and over | 0 (0.0%) | 1 (100.0%) |
Disability Class by Sex by Age in Bluffton
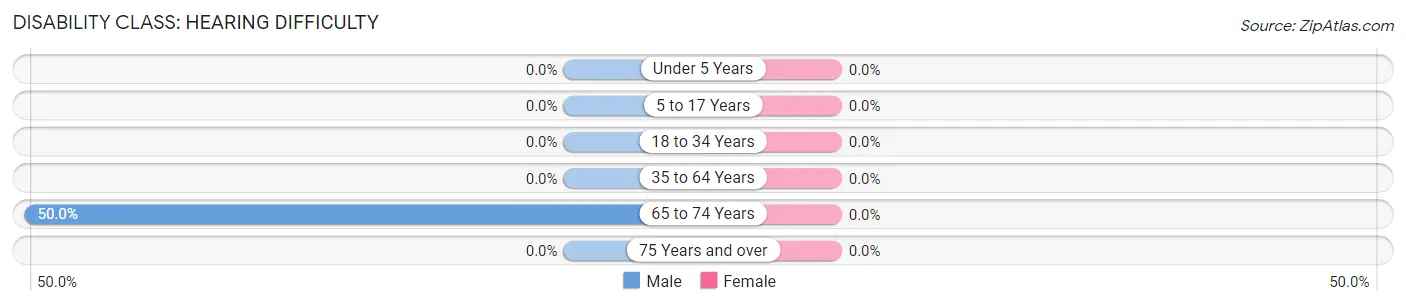
Disability Class: Hearing Difficulty
| Age Bracket | Male | Female |
| Under 5 Years | 0 (0.0%) | 0 (0.0%) |
| 5 to 17 Years | 0 (0.0%) | 0 (0.0%) |
| 18 to 34 Years | 0 (0.0%) | 0 (0.0%) |
| 35 to 64 Years | 0 (0.0%) | 0 (0.0%) |
| 65 to 74 Years | 5 (50.0%) | 0 (0.0%) |
| 75 Years and over | 0 (0.0%) | 0 (0.0%) |
Disability Class: Vision Difficulty
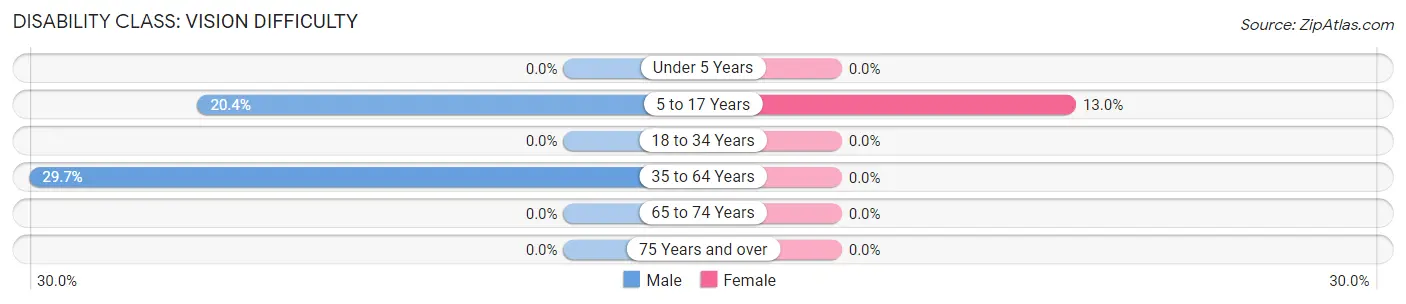
| Age Bracket | Male | Female |
| Under 5 Years | 0 (0.0%) | 0 (0.0%) |
| 5 to 17 Years | 11 (20.4%) | 12 (13.0%) |
| 18 to 34 Years | 0 (0.0%) | 0 (0.0%) |
| 35 to 64 Years | 11 (29.7%) | 0 (0.0%) |
| 65 to 74 Years | 0 (0.0%) | 0 (0.0%) |
| 75 Years and over | 0 (0.0%) | 0 (0.0%) |
Disability Class: Cognitive Difficulty
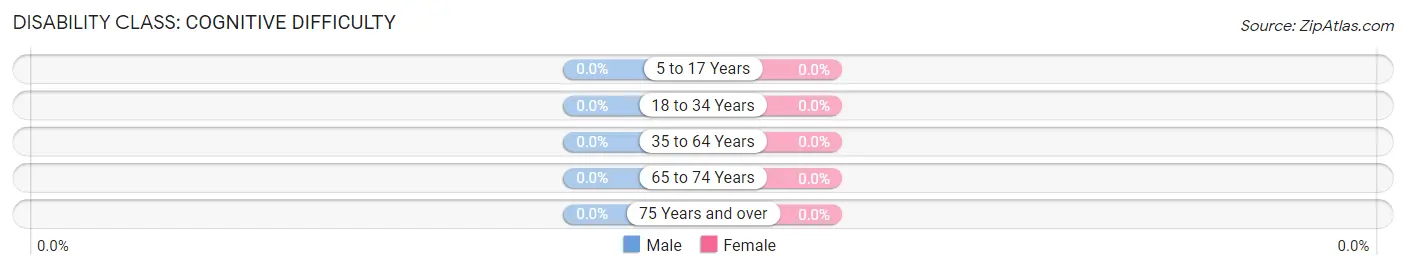
| Age Bracket | Male | Female |
| 5 to 17 Years | 0 (0.0%) | 0 (0.0%) |
| 18 to 34 Years | 0 (0.0%) | 0 (0.0%) |
| 35 to 64 Years | 0 (0.0%) | 0 (0.0%) |
| 65 to 74 Years | 0 (0.0%) | 0 (0.0%) |
| 75 Years and over | 0 (0.0%) | 0 (0.0%) |
Disability Class: Ambulatory Difficulty
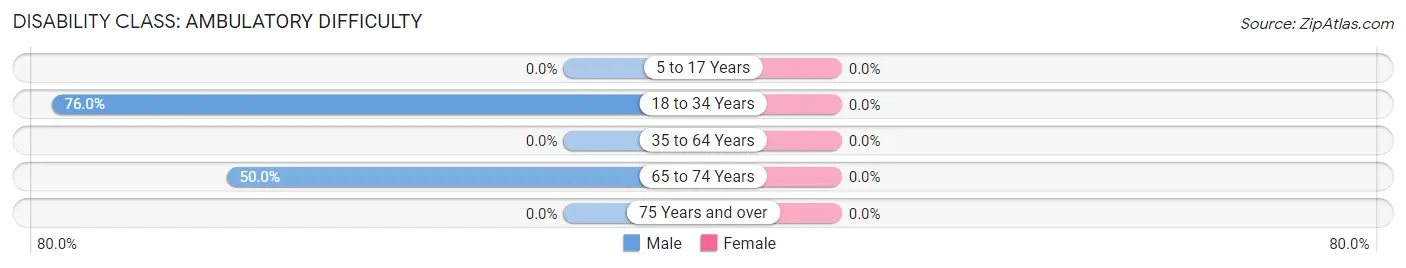
| Age Bracket | Male | Female |
| 5 to 17 Years | 0 (0.0%) | 0 (0.0%) |
| 18 to 34 Years | 19 (76.0%) | 0 (0.0%) |
| 35 to 64 Years | 0 (0.0%) | 0 (0.0%) |
| 65 to 74 Years | 5 (50.0%) | 0 (0.0%) |
| 75 Years and over | 0 (0.0%) | 0 (0.0%) |
Disability Class: Self-Care Difficulty
| Age Bracket | Male | Female |
| 5 to 17 Years | 0 (0.0%) | 0 (0.0%) |
| 18 to 34 Years | 0 (0.0%) | 0 (0.0%) |
| 35 to 64 Years | 0 (0.0%) | 0 (0.0%) |
| 65 to 74 Years | 0 (0.0%) | 0 (0.0%) |
| 75 Years and over | 0 (0.0%) | 0 (0.0%) |
Technology Access in Bluffton
Computing Device Access in Bluffton
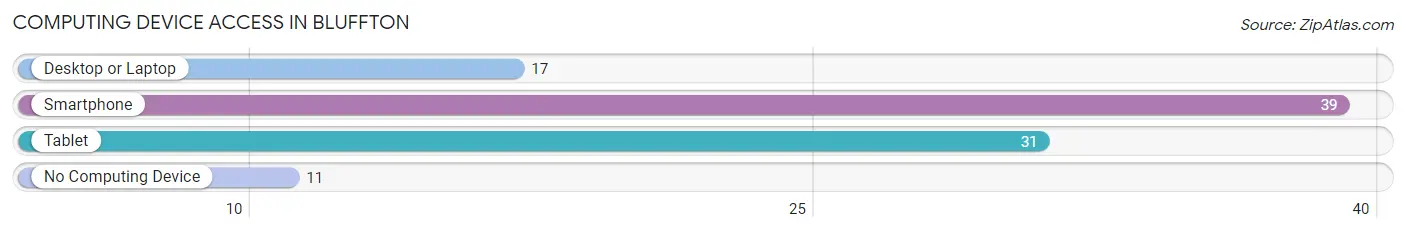
| Device Type | # Households | % Households |
| Desktop or Laptop | 17 | 32.7% |
| Smartphone | 39 | 75.0% |
| Tablet | 31 | 59.6% |
| No Computing Device | 11 | 21.1% |
| Total | 52 | 100.0% |
Internet Access in Bluffton
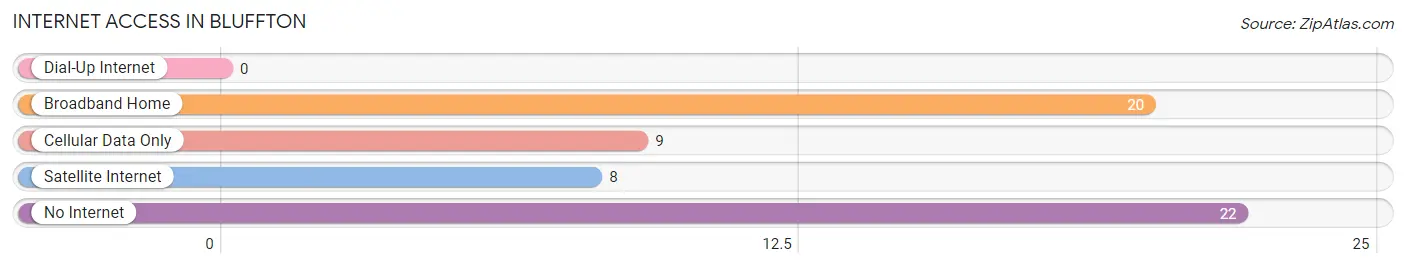
| Internet Type | # Households | % Households |
| Dial-Up Internet | 0 | 0.0% |
| Broadband Home | 20 | 38.5% |
| Cellular Data Only | 9 | 17.3% |
| Satellite Internet | 8 | 15.4% |
| No Internet | 22 | 42.3% |
| Total | 52 | 100.0% |
Bluffton Summary
Bluffton, Georgia is a small town located in the southeastern corner of the state, just north of the Georgia-Florida border. It is part of the Savannah metropolitan area and is situated on the banks of the May River. The town has a population of just over 1,000 people and is known for its historic downtown area, which is listed on the National Register of Historic Places.
Geography
Bluffton is located in the southeastern corner of Georgia, just north of the Georgia-Florida border. It is part of the Savannah metropolitan area and is situated on the banks of the May River. The town is located in the Lowcountry region of the state, which is characterized by its flat terrain and coastal marshes. The town is bordered by the May River to the east, the Savannah River to the south, and the Atlantic Ocean to the east.
The town is located in the humid subtropical climate zone, which is characterized by hot, humid summers and mild winters. The average annual temperature is around 70 degrees Fahrenheit, with the average high in the summer months reaching the mid-90s and the average low in the winter months reaching the mid-30s. The town receives an average of 50 inches of precipitation per year, with most of it falling in the summer months.
Economy
The economy of Bluffton is largely based on tourism and agriculture. The town is home to several historic sites, including the Bluffton Historic District, which is listed on the National Register of Historic Places. The town also has several wineries and vineyards, as well as a number of restaurants and shops.
Agriculture is also an important part of the local economy. The town is home to several farms, which produce a variety of crops, including corn, soybeans, cotton, and peanuts. The town also has a number of nurseries and greenhouses, which produce flowers and other plants for sale.
Demographics
As of the 2010 census, the population of Bluffton was 1,068. The racial makeup of the town was 79.2% White, 15.3% African American, 0.3% Native American, 0.7% Asian, 0.1% Pacific Islander, and 4.4% from other races. The median household income was $41,250, and the median family income was $50,000.
The town is home to a number of churches, including the Bluffton United Methodist Church, the Bluffton Presbyterian Church, and the Bluffton Baptist Church. The town also has a number of schools, including the Bluffton Elementary School, the Bluffton Middle School, and the Bluffton High School.
Conclusion
Bluffton, Georgia is a small town located in the southeastern corner of the state, just north of the Georgia-Florida border. It is part of the Savannah metropolitan area and is situated on the banks of the May River. The town has a population of just over 1,000 people and is known for its historic downtown area, which is listed on the National Register of Historic Places. The economy of Bluffton is largely based on tourism and agriculture, and the town is home to a number of churches, schools, and other amenities. The racial makeup of the town is 79.2% White, 15.3% African American, 0.3% Native American, 0.7% Asian, 0.1% Pacific Islander, and 4.4% from other races. The median household income was $41,250, and the median family income was $50,000.
Common Questions
What is the Total Population of Bluffton?
Total Population of Bluffton is 295.
What is the Total Male Population of Bluffton?
Total Male Population of Bluffton is 140.
What is the Total Female Population of Bluffton?
Total Female Population of Bluffton is 155.
What is the Ratio of Males per 100 Females in Bluffton?
There are 90.32 Males per 100 Females in Bluffton.
What is the Ratio of Females per 100 Males in Bluffton?
There are 110.71 Females per 100 Males in Bluffton.
What is the Median Population Age in Bluffton?
Median Population Age in Bluffton is 17.8 Years.
What is the Average Family Size in Bluffton
Average Family Size in Bluffton is 7.1 People.
What is the Average Household Size in Bluffton
Average Household Size in Bluffton is 5.7 People.
What is Per Capita Income in Bluffton?
Per Capita income in Bluffton is $15,517.
What is the Median Family Income in Bluffton?
Median Family Income in Bluffton is $78,594.
What is Income or Wage Gap in Bluffton?
Income or Wage Gap in Bluffton is 4.3%.
Women in Bluffton earn 95.7 cents for every dollar earned by a man.
What is Inequality or Gini Index in Bluffton?
Inequality or Gini Index in Bluffton is 0.43.
How Large is the Labor Force in Bluffton?
There are 111 People in the Labor Forcein in Bluffton.
What is the Percentage of People in the Labor Force in Bluffton?
48.1% of People are in the Labor Force in Bluffton.