Attapulgus, GA
Attapulgus Map
Attapulgus Overview
715
TOTAL POPULATION
429
MALE POPULATION
286
FEMALE POPULATION
150.00
MALES / 100 FEMALES
66.67
FEMALES / 100 MALES
35.3
MEDIAN AGE
5.0
AVG FAMILY SIZE
3.8
AVG HOUSEHOLD SIZE
$17,573
PER CAPITA INCOME
$34,286
AVG FAMILY INCOME
$34,028
AVG HOUSEHOLD INCOME
$11,606
FAMILY INCOME DEFICIT
0.45
INEQUALITY / GINI INDEX
362
LABOR FORCE [ PEOPLE ]
59.2%
PERCENT IN LABOR FORCE
1.7%
UNEMPLOYMENT RATE
Attapulgus Zip Codes
Attapulgus Area Codes
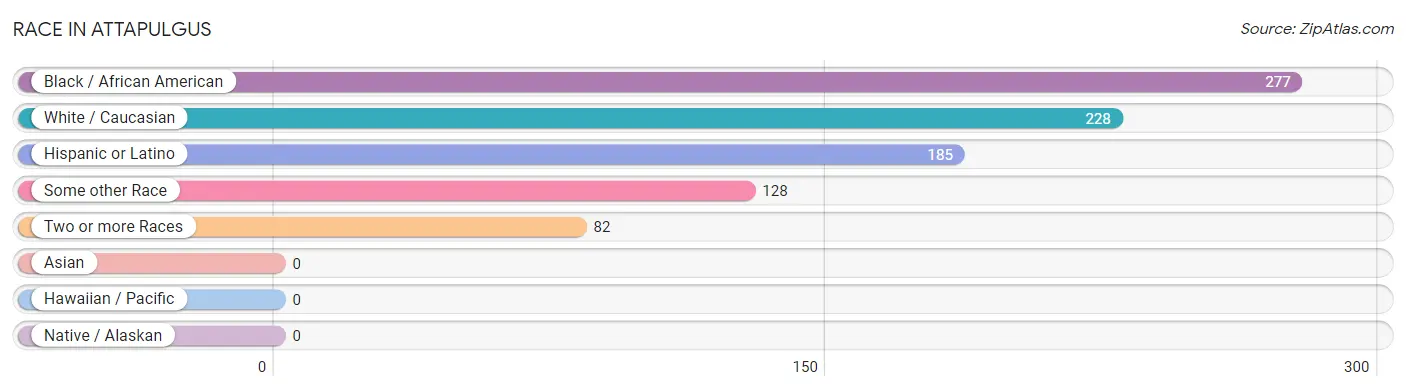
Race in Attapulgus
The most populous races in Attapulgus are Black / African American (277 | 38.7%), White / Caucasian (228 | 31.9%), and Hispanic or Latino (185 | 25.9%).
| Race | # Population | % Population |
| Asian | 0 | 0.0% |
| Black / African American | 277 | 38.7% |
| Hawaiian / Pacific | 0 | 0.0% |
| Hispanic or Latino | 185 | 25.9% |
| Native / Alaskan | 0 | 0.0% |
| White / Caucasian | 228 | 31.9% |
| Two or more Races | 82 | 11.5% |
| Some other Race | 128 | 17.9% |
| Total | 715 | 100.0% |
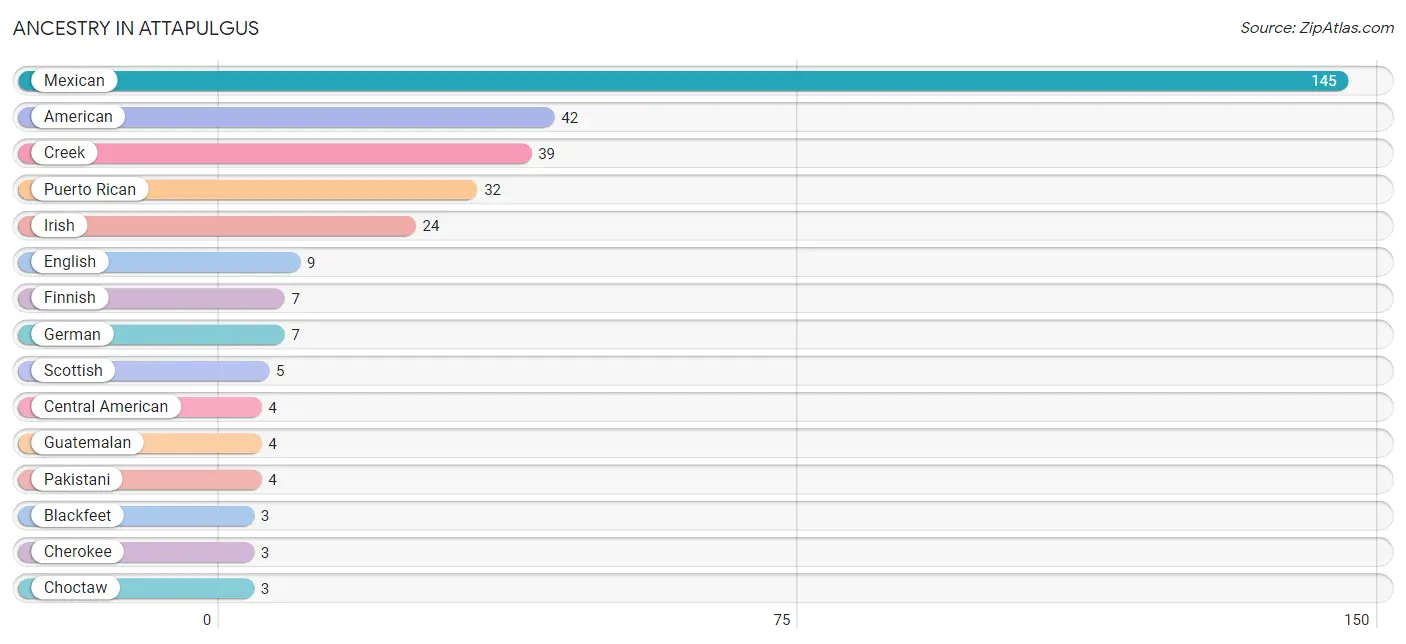
Ancestry in Attapulgus
The most populous ancestries reported in Attapulgus are Mexican (145 | 20.3%), American (42 | 5.9%), Creek (39 | 5.4%), Puerto Rican (32 | 4.5%), and Irish (24 | 3.4%), together accounting for 39.4% of all Attapulgus residents.
| Ancestry | # Population | % Population |
| American | 42 | 5.9% |
| Blackfeet | 3 | 0.4% |
| British | 1 | 0.1% |
| Central American | 4 | 0.6% |
| Cherokee | 3 | 0.4% |
| Choctaw | 3 | 0.4% |
| Creek | 39 | 5.4% |
| English | 9 | 1.3% |
| Finnish | 7 | 1.0% |
| French Canadian | 1 | 0.1% |
| German | 7 | 1.0% |
| Guatemalan | 4 | 0.6% |
| Irish | 24 | 3.4% |
| Mexican | 145 | 20.3% |
| Pakistani | 4 | 0.6% |
| Puerto Rican | 32 | 4.5% |
| Scandinavian | 3 | 0.4% |
| Scottish | 5 | 0.7% | View All 18 Rows |
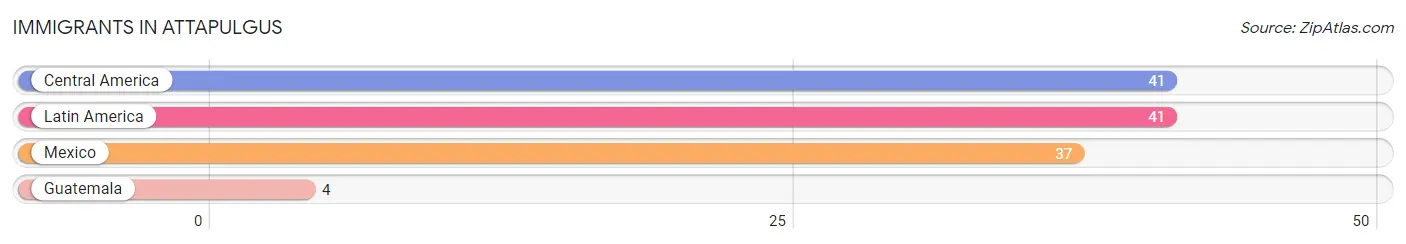
Immigrants in Attapulgus
The most numerous immigrant groups reported in Attapulgus came from Central America (41 | 5.7%), Latin America (41 | 5.7%), Mexico (37 | 5.2%), and Guatemala (4 | 0.6%), together accounting for 17.2% of all Attapulgus residents.
| Immigration Origin | # Population | % Population |
| Central America | 41 | 5.7% |
| Guatemala | 4 | 0.6% |
| Latin America | 41 | 5.7% |
| Mexico | 37 | 5.2% | View All 4 Rows |
Sex and Age in Attapulgus
Sex and Age in Attapulgus
The most populous age groups in Attapulgus are 15 to 19 Years (105 | 24.5%) for men and 35 to 39 Years (49 | 17.1%) for women.
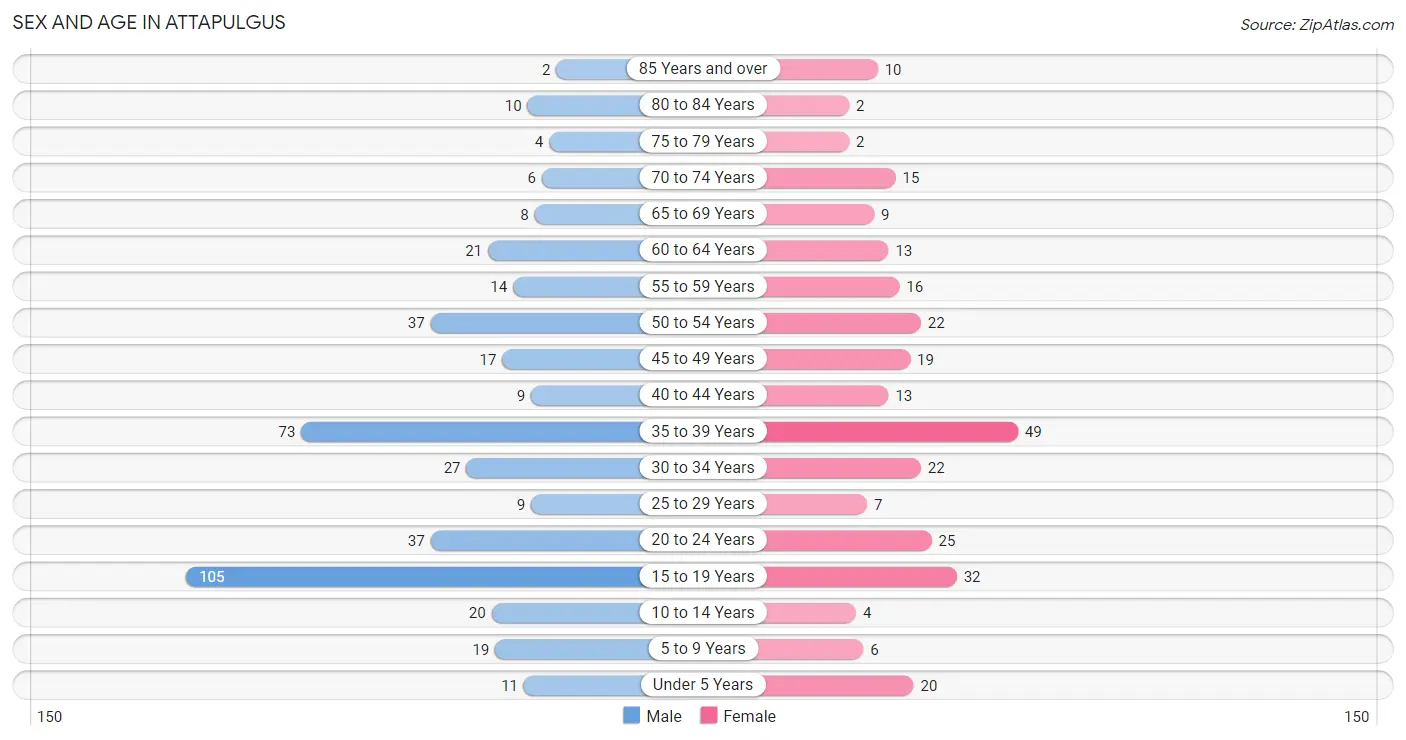
| Age Bracket | Male | Female |
| Under 5 Years | 11 (2.6%) | 20 (7.0%) |
| 5 to 9 Years | 19 (4.4%) | 6 (2.1%) |
| 10 to 14 Years | 20 (4.7%) | 4 (1.4%) |
| 15 to 19 Years | 105 (24.5%) | 32 (11.2%) |
| 20 to 24 Years | 37 (8.6%) | 25 (8.7%) |
| 25 to 29 Years | 9 (2.1%) | 7 (2.5%) |
| 30 to 34 Years | 27 (6.3%) | 22 (7.7%) |
| 35 to 39 Years | 73 (17.0%) | 49 (17.1%) |
| 40 to 44 Years | 9 (2.1%) | 13 (4.5%) |
| 45 to 49 Years | 17 (4.0%) | 19 (6.6%) |
| 50 to 54 Years | 37 (8.6%) | 22 (7.7%) |
| 55 to 59 Years | 14 (3.3%) | 16 (5.6%) |
| 60 to 64 Years | 21 (4.9%) | 13 (4.5%) |
| 65 to 69 Years | 8 (1.9%) | 9 (3.2%) |
| 70 to 74 Years | 6 (1.4%) | 15 (5.2%) |
| 75 to 79 Years | 4 (0.9%) | 2 (0.7%) |
| 80 to 84 Years | 10 (2.3%) | 2 (0.7%) |
| 85 Years and over | 2 (0.5%) | 10 (3.5%) |
| Total | 429 (100.0%) | 286 (100.0%) |
Families and Households in Attapulgus
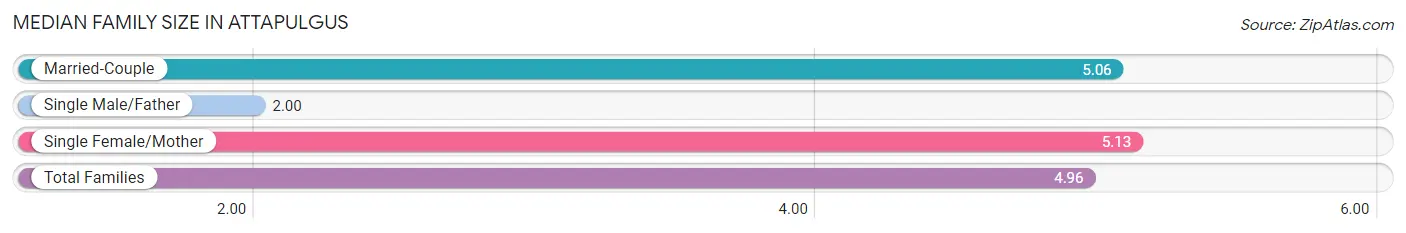
Median Family Size in Attapulgus
The median family size in Attapulgus is 4.96 persons per family, with single female/mother families (45 | 39.5%) accounting for the largest median family size of 5.13 persons per family. On the other hand, single male/father families (5 | 4.4%) represent the smallest median family size with 2.00 persons per family.
| Family Type | # Families | Family Size |
| Married-Couple | 64 (56.1%) | 5.06 |
| Single Male/Father | 5 (4.4%) | 2.00 |
| Single Female/Mother | 45 (39.5%) | 5.13 |
| Total Families | 114 (100.0%) | 4.96 |
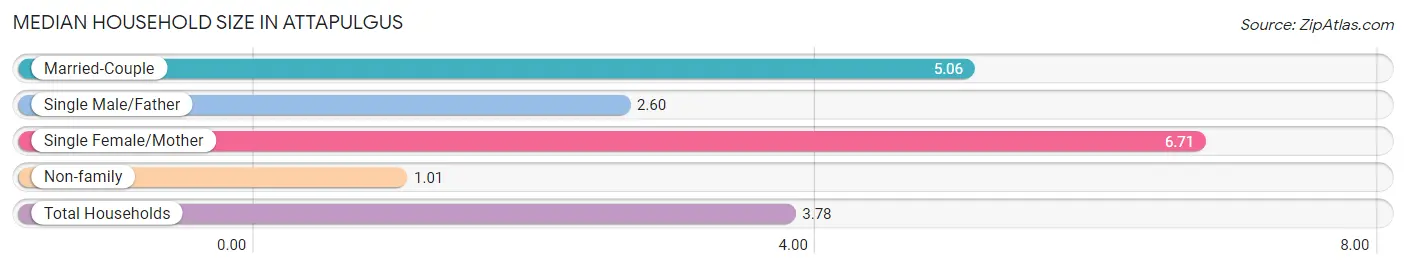
Median Household Size in Attapulgus
The median household size in Attapulgus is 3.78 persons per household, with single female/mother households (45 | 23.8%) accounting for the largest median household size of 6.71 persons per household. non-family households (75 | 39.7%) represent the smallest median household size with 1.01 persons per household.
| Household Type | # Households | Household Size |
| Married-Couple | 64 (33.9%) | 5.06 |
| Single Male/Father | 5 (2.6%) | 2.60 |
| Single Female/Mother | 45 (23.8%) | 6.71 |
| Non-family | 75 (39.7%) | 1.01 |
| Total Households | 189 (100.0%) | 3.78 |
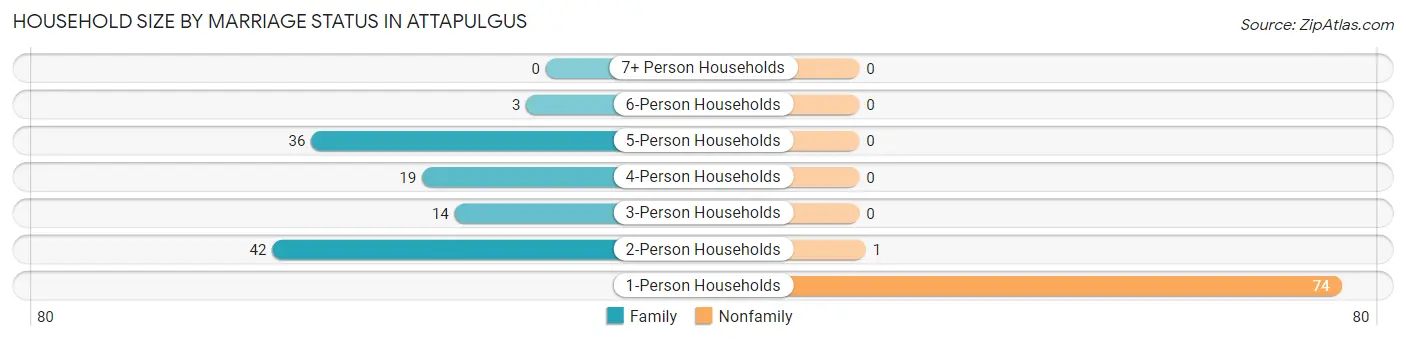
Household Size by Marriage Status in Attapulgus
Out of a total of 189 households in Attapulgus, 114 (60.3%) are family households, while 75 (39.7%) are nonfamily households. The most numerous type of family households are 2-person households, comprising 42, and the most common type of nonfamily households are 1-person households, comprising 74.
| Household Size | Family Households | Nonfamily Households |
| 1-Person Households | - | 74 (39.2%) |
| 2-Person Households | 42 (22.2%) | 1 (0.5%) |
| 3-Person Households | 14 (7.4%) | 0 (0.0%) |
| 4-Person Households | 19 (10.1%) | 0 (0.0%) |
| 5-Person Households | 36 (19.1%) | 0 (0.0%) |
| 6-Person Households | 3 (1.6%) | 0 (0.0%) |
| 7+ Person Households | 0 (0.0%) | 0 (0.0%) |
| Total | 114 (60.3%) | 75 (39.7%) |
Female Fertility in Attapulgus
Fertility by Age in Attapulgus
Average fertility rate in Attapulgus is 6.0 births per 1,000 women. Women in the age bracket of 20 to 34 years have the highest fertility rate with 19.0 births per 1,000 women. Women in the age bracket of 20 to 34 years acount for 100.0% of all women with births.
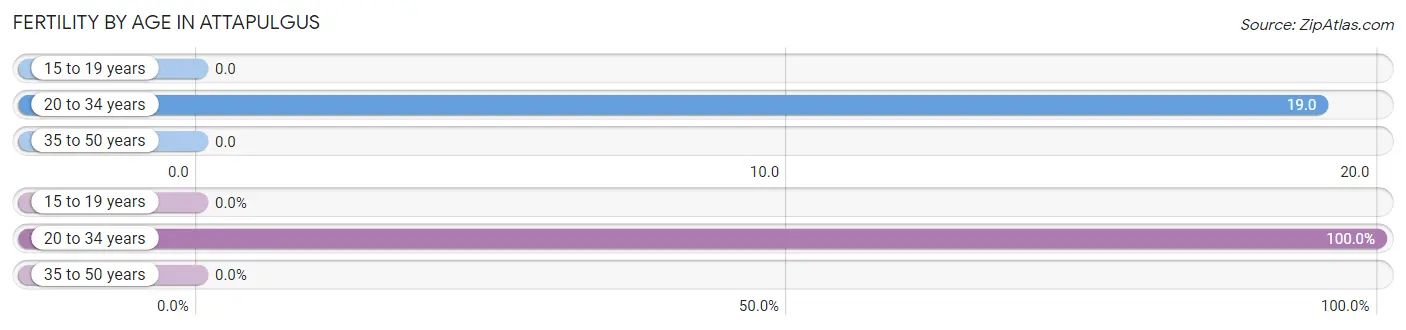
| Age Bracket | Women with Births | Births / 1,000 Women |
| 15 to 19 years | 0 (0.0%) | 0.0 |
| 20 to 34 years | 1 (100.0%) | 19.0 |
| 35 to 50 years | 0 (0.0%) | 0.0 |
| Total | 1 (100.0%) | 6.0 |
Fertility by Age by Marriage Status in Attapulgus
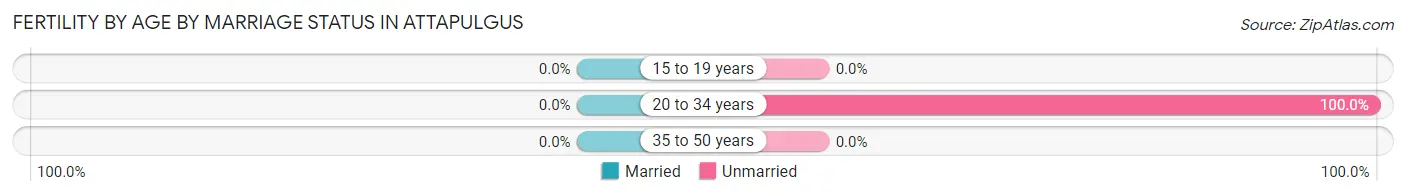
| Age Bracket | Married | Unmarried |
| 15 to 19 years | 0 (0.0%) | 0 (0.0%) |
| 20 to 34 years | 0 (0.0%) | 1 (100.0%) |
| 35 to 50 years | 0 (0.0%) | 0 (0.0%) |
| Total | 0 (0.0%) | 1 (100.0%) |
Fertility by Education in Attapulgus
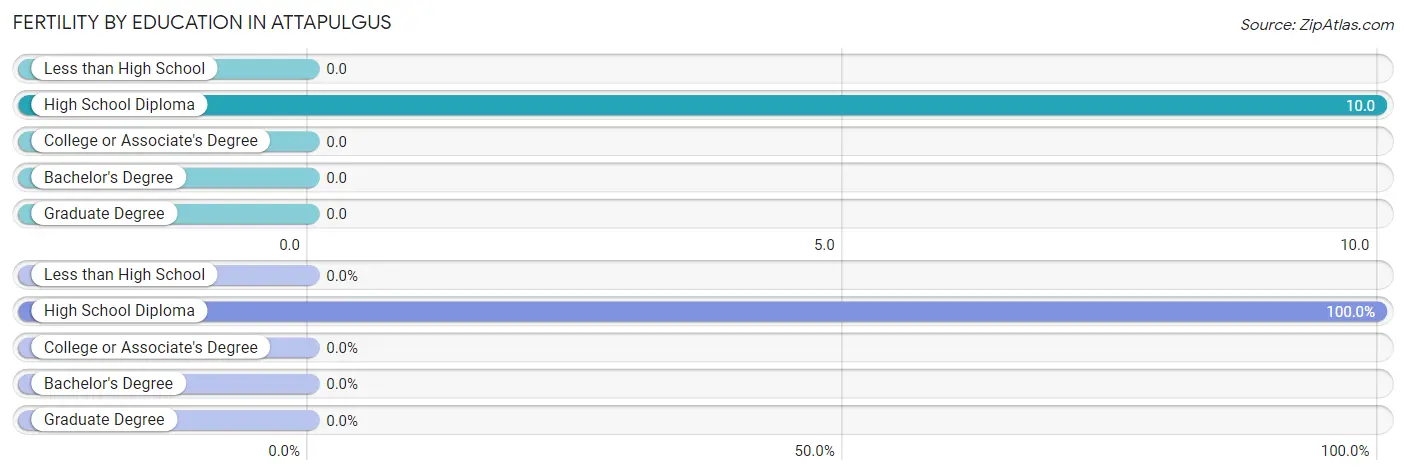
| Educational Attainment | Women with Births | Births / 1,000 Women |
| Less than High School | 0 (0.0%) | 0.0 |
| High School Diploma | 1 (100.0%) | 10.0 |
| College or Associate's Degree | 0 (0.0%) | 0.0 |
| Bachelor's Degree | 0 (0.0%) | 0.0 |
| Graduate Degree | 0 (0.0%) | 0.0 |
| Total | 1 (100.0%) | 6.0 |
Fertility by Education by Marriage Status in Attapulgus
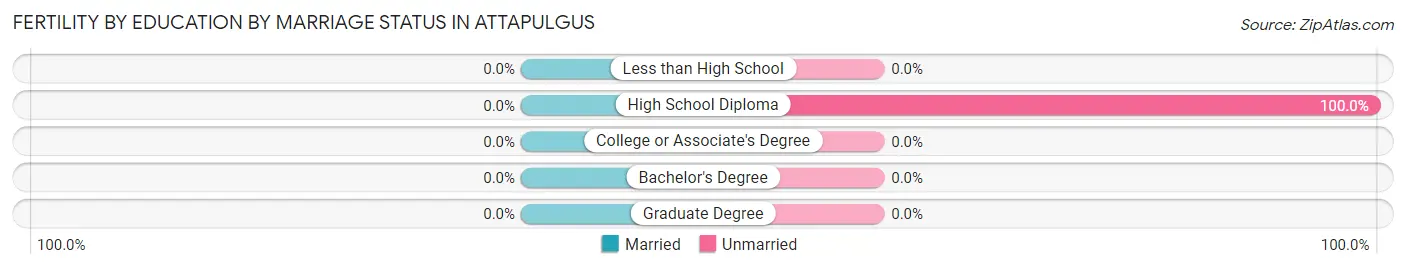
| Educational Attainment | Married | Unmarried |
| Less than High School | 0 (0.0%) | 0 (0.0%) |
| High School Diploma | 0 (0.0%) | 1 (100.0%) |
| College or Associate's Degree | 0 (0.0%) | 0 (0.0%) |
| Bachelor's Degree | 0 (0.0%) | 0 (0.0%) |
| Graduate Degree | 0 (0.0%) | 0 (0.0%) |
| Total | 0 (0.0%) | 1 (100.0%) |
Income in Attapulgus
Income Overview in Attapulgus
Per Capita Income in Attapulgus is $17,573, while median incomes of families and households are $34,286 and $34,028 respectively.
| Characteristic | Number | Measure |
| Per Capita Income | 715 | $17,573 |
| Median Family Income | 114 | $34,286 |
| Mean Family Income | 114 | $54,574 |
| Median Household Income | 189 | $34,028 |
| Mean Household Income | 189 | $47,957 |
| Income Deficit | 114 | $11,606 |
| Wage / Income Gap (%) | 715 | 0.00% |
| Wage / Income Gap ($) | 715 | 100.00¢ per $1 |
| Gini / Inequality Index | 715 | 0.45 |
Earnings by Sex in Attapulgus
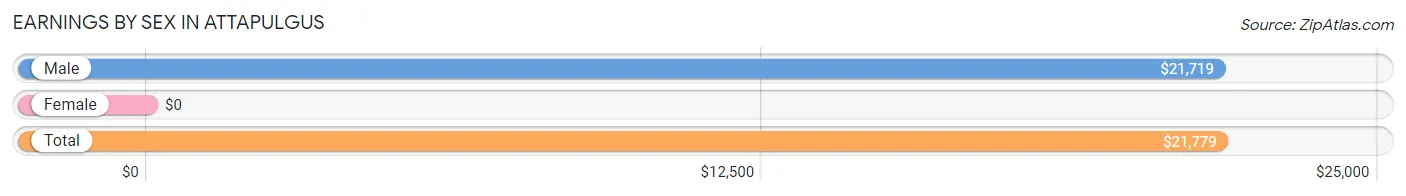
| Sex | Number | Average Earnings |
| Male | 217 (60.8%) | $21,719 |
| Female | 140 (39.2%) | $0 |
| Total | 357 (100.0%) | $21,779 |
Earnings by Sex by Income Bracket in Attapulgus
The most common earnings brackets in Attapulgus are $7,500 to $9,999 for men (64 | 29.5%) and $35,000 to $39,999 for women (43 | 30.7%).
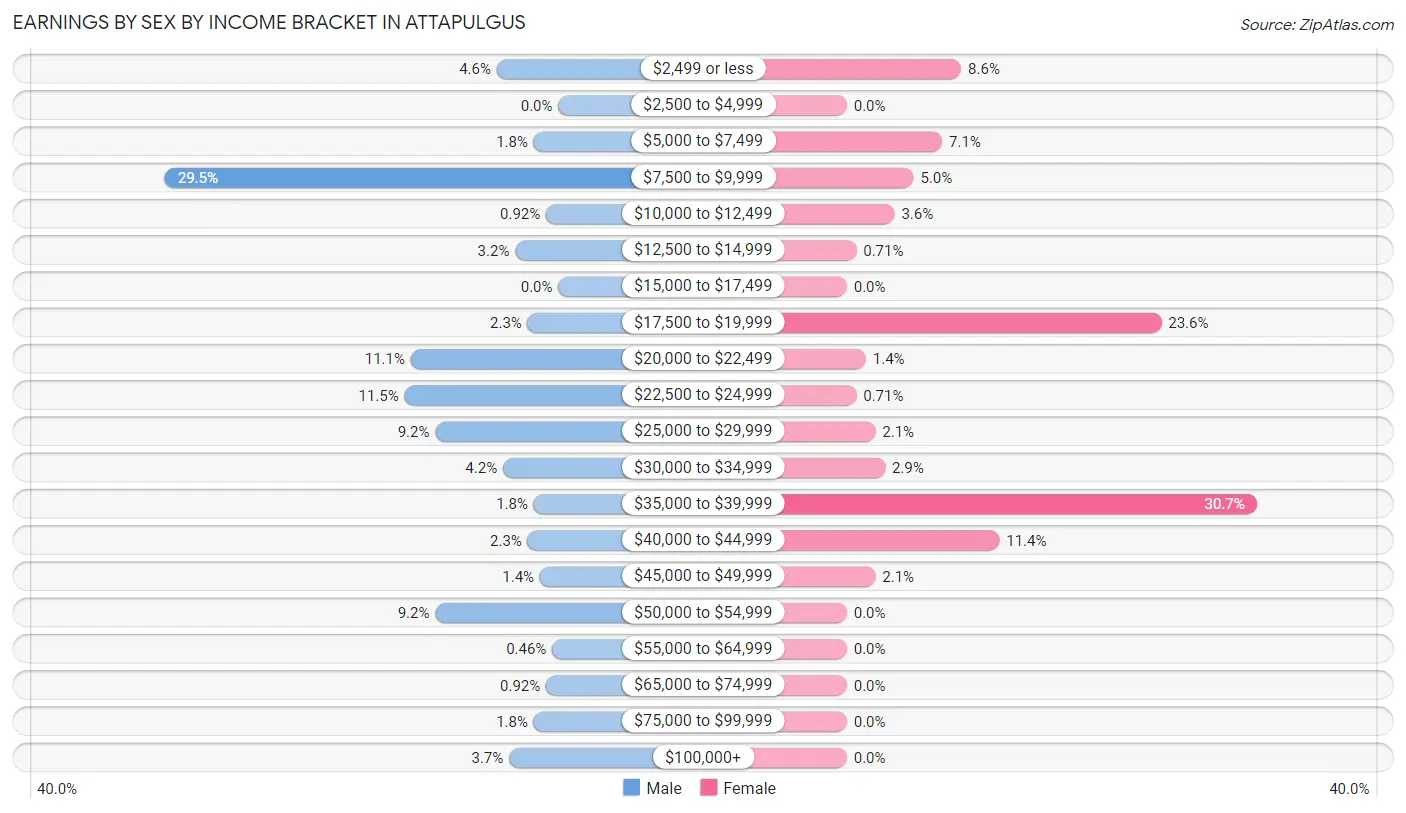
| Income | Male | Female |
| $2,499 or less | 10 (4.6%) | 12 (8.6%) |
| $2,500 to $4,999 | 0 (0.0%) | 0 (0.0%) |
| $5,000 to $7,499 | 4 (1.8%) | 10 (7.1%) |
| $7,500 to $9,999 | 64 (29.5%) | 7 (5.0%) |
| $10,000 to $12,499 | 2 (0.9%) | 5 (3.6%) |
| $12,500 to $14,999 | 7 (3.2%) | 1 (0.7%) |
| $15,000 to $17,499 | 0 (0.0%) | 0 (0.0%) |
| $17,500 to $19,999 | 5 (2.3%) | 33 (23.6%) |
| $20,000 to $22,499 | 24 (11.1%) | 2 (1.4%) |
| $22,500 to $24,999 | 25 (11.5%) | 1 (0.7%) |
| $25,000 to $29,999 | 20 (9.2%) | 3 (2.1%) |
| $30,000 to $34,999 | 9 (4.2%) | 4 (2.9%) |
| $35,000 to $39,999 | 4 (1.8%) | 43 (30.7%) |
| $40,000 to $44,999 | 5 (2.3%) | 16 (11.4%) |
| $45,000 to $49,999 | 3 (1.4%) | 3 (2.1%) |
| $50,000 to $54,999 | 20 (9.2%) | 0 (0.0%) |
| $55,000 to $64,999 | 1 (0.5%) | 0 (0.0%) |
| $65,000 to $74,999 | 2 (0.9%) | 0 (0.0%) |
| $75,000 to $99,999 | 4 (1.8%) | 0 (0.0%) |
| $100,000+ | 8 (3.7%) | 0 (0.0%) |
| Total | 217 (100.0%) | 140 (100.0%) |
Earnings by Sex by Educational Attainment in Attapulgus
Average earnings in Attapulgus are $20,781 for men and $35,579 for women, a difference of 41.6%. Men with an educational attainment of less than high school enjoy the highest average annual earnings of $32,500, while those with college or associate's degree education earn the least with $9,180. Women with an educational attainment of high school diploma earn the most with the average annual earnings of $36,098, while those with high school diploma education have the smallest earnings of $36,098.
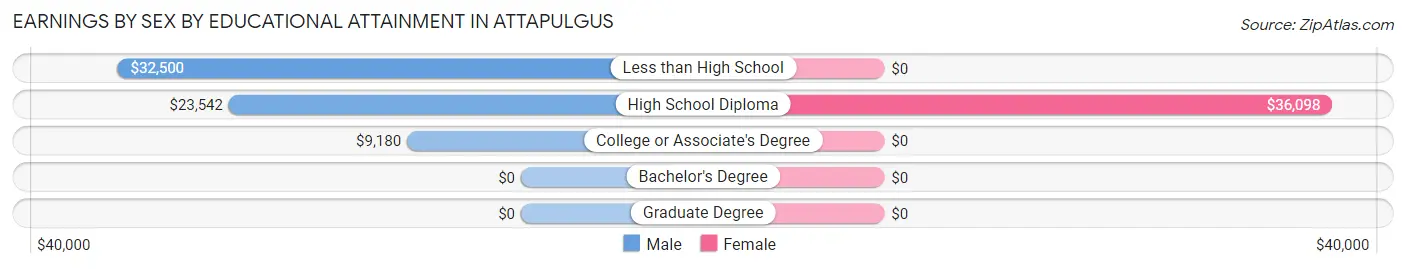
| Educational Attainment | Male Income | Female Income |
| Less than High School | $32,500 | $0 |
| High School Diploma | $23,542 | $36,098 |
| College or Associate's Degree | $9,180 | $0 |
| Bachelor's Degree | - | - |
| Graduate Degree | - | - |
| Total | $20,781 | $35,579 |
Family Income in Attapulgus
Family Income Brackets in Attapulgus
According to the Attapulgus family income data, there are 22 families falling into the $100,000 to $149,999 income range, which is the most common income bracket and makes up 19.3% of all families.
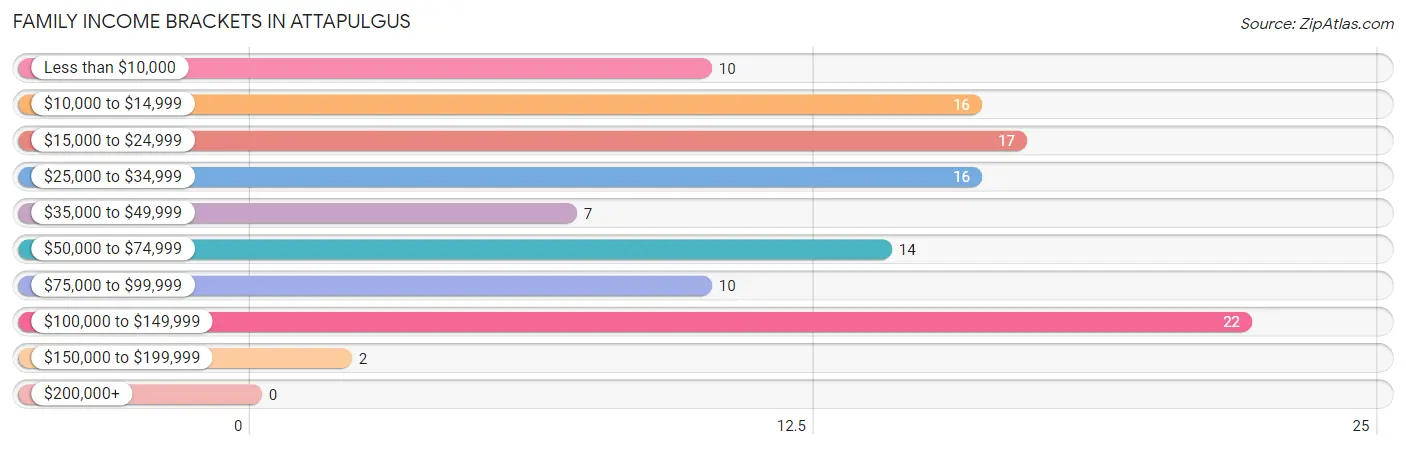
| Income Bracket | # Families | % Families |
| Less than $10,000 | 10 | 8.8% |
| $10,000 to $14,999 | 16 | 14.0% |
| $15,000 to $24,999 | 17 | 14.9% |
| $25,000 to $34,999 | 16 | 14.0% |
| $35,000 to $49,999 | 7 | 6.1% |
| $50,000 to $74,999 | 14 | 12.3% |
| $75,000 to $99,999 | 10 | 8.8% |
| $100,000 to $149,999 | 22 | 19.3% |
| $150,000 to $199,999 | 2 | 1.8% |
| $200,000+ | 0 | 0.0% |
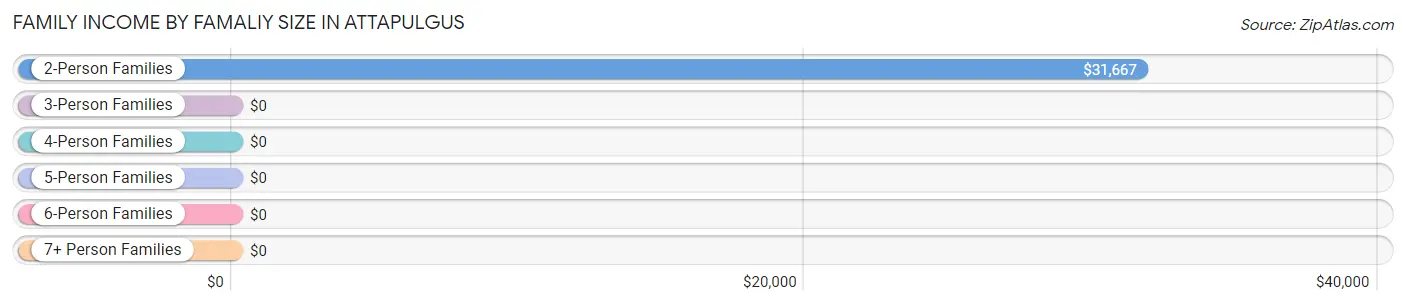
Family Income by Famaliy Size in Attapulgus
2-person families (44 | 38.6%) account for the highest median family income in Attapulgus with $31,667 per family, while 2-person families (44 | 38.6%) have the highest median income of $15,834 per family member.
| Income Bracket | # Families | Median Income |
| 2-Person Families | 44 (38.6%) | $31,667 |
| 3-Person Families | 14 (12.3%) | $0 |
| 4-Person Families | 24 (21.0%) | $0 |
| 5-Person Families | 29 (25.4%) | $0 |
| 6-Person Families | 3 (2.6%) | $0 |
| 7+ Person Families | 0 (0.0%) | $0 |
| Total | 114 (100.0%) | $34,286 |
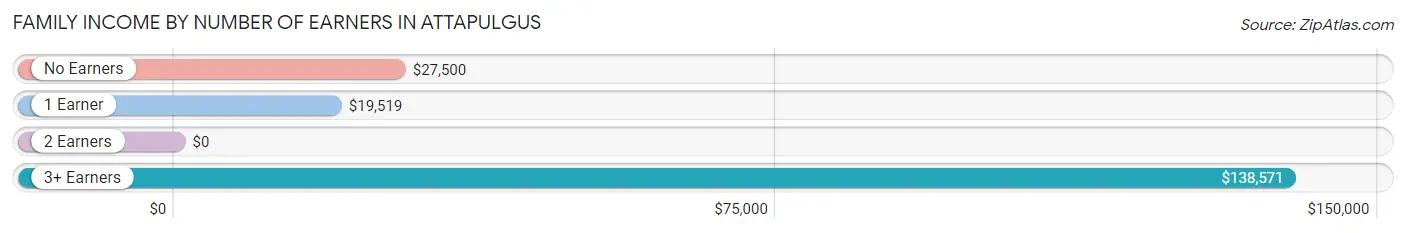
Family Income by Number of Earners in Attapulgus
| Number of Earners | # Families | Median Income |
| No Earners | 26 (22.8%) | $27,500 |
| 1 Earner | 43 (37.7%) | $19,519 |
| 2 Earners | 29 (25.4%) | $0 |
| 3+ Earners | 16 (14.0%) | $138,571 |
| Total | 114 (100.0%) | $34,286 |
Household Income in Attapulgus
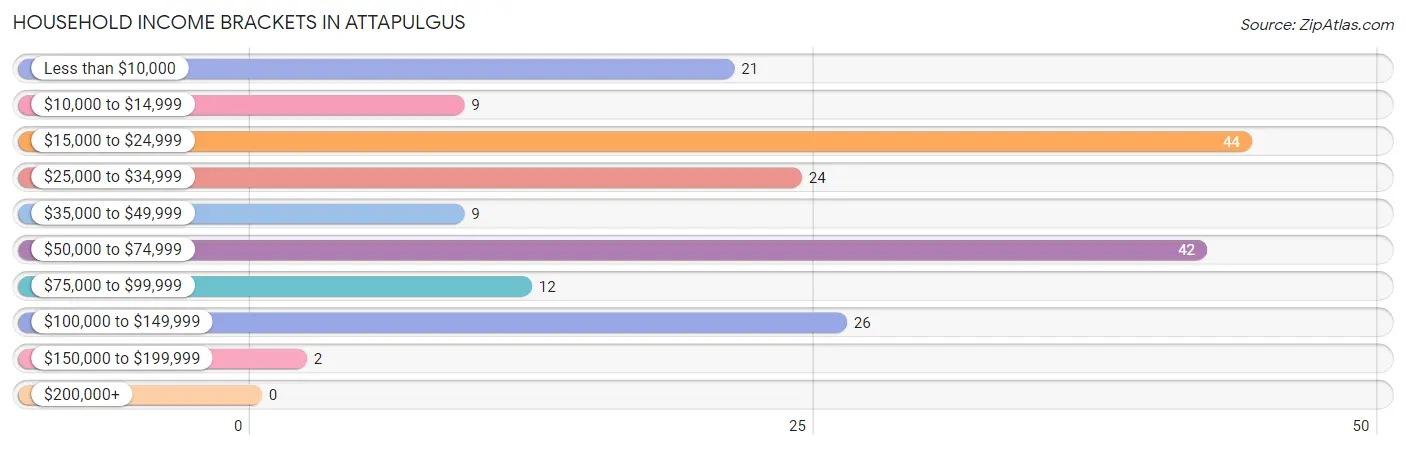
Household Income Brackets in Attapulgus
With 44 households falling in the category, the $15,000 to $24,999 income range is the most frequent in Attapulgus, accounting for 23.3% of all households.
| Income Bracket | # Households | % Households |
| Less than $10,000 | 21 | 11.1% |
| $10,000 to $14,999 | 9 | 4.8% |
| $15,000 to $24,999 | 44 | 23.3% |
| $25,000 to $34,999 | 24 | 12.7% |
| $35,000 to $49,999 | 9 | 4.8% |
| $50,000 to $74,999 | 42 | 22.2% |
| $75,000 to $99,999 | 12 | 6.3% |
| $100,000 to $149,999 | 26 | 13.8% |
| $150,000 to $199,999 | 2 | 1.1% |
| $200,000+ | 0 | 0.0% |
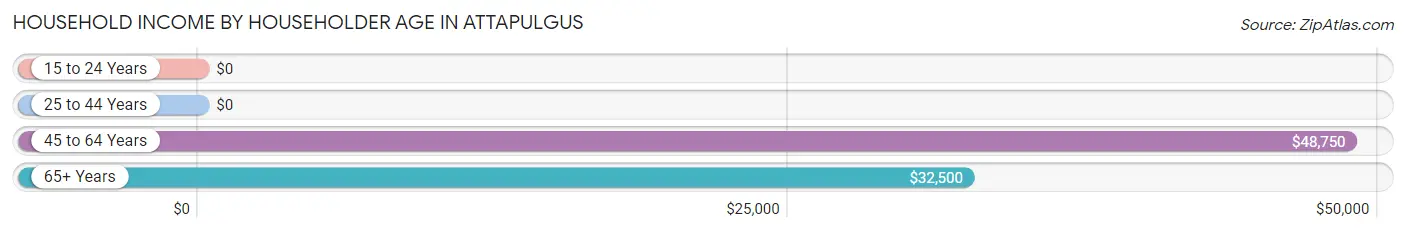
Household Income by Householder Age in Attapulgus
The median household income in Attapulgus is $34,028, with the highest median household income of $48,750 found in the 45 to 64 years age bracket for the primary householder. A total of 95 households (50.3%) fall into this category. Meanwhile, the 15 to 24 years age bracket for the primary householder has the lowest median household income of $0, with 4 households (2.1%) in this group.
| Income Bracket | # Households | Median Income |
| 15 to 24 Years | 4 (2.1%) | $0 |
| 25 to 44 Years | 50 (26.5%) | $0 |
| 45 to 64 Years | 95 (50.3%) | $48,750 |
| 65+ Years | 40 (21.2%) | $32,500 |
| Total | 189 (100.0%) | $34,028 |
Poverty in Attapulgus
Income Below Poverty by Sex and Age in Attapulgus
With 45.9% poverty level for males and 43.7% for females among the residents of Attapulgus, 35 to 44 year old males and 12 to 14 year old females are the most vulnerable to poverty, with 67 males (81.7%) and 3 females (100.0%) in their respective age groups living below the poverty level.
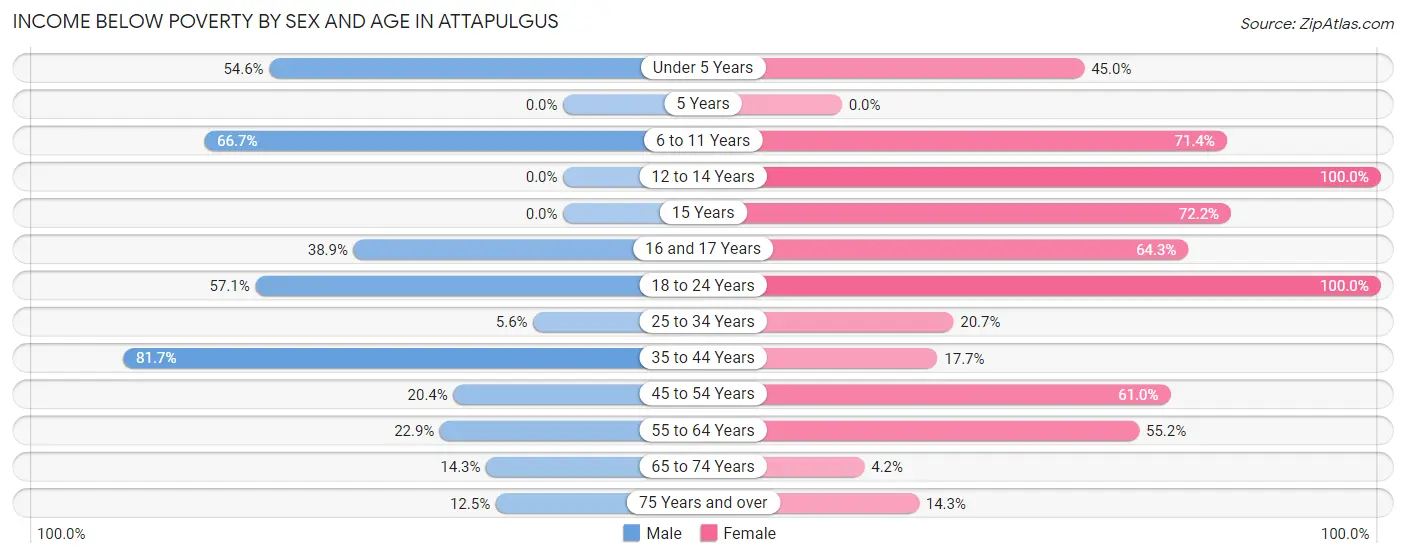
| Age Bracket | Male | Female |
| Under 5 Years | 6 (54.5%) | 9 (45.0%) |
| 5 Years | 0 (0.0%) | 0 (0.0%) |
| 6 to 11 Years | 24 (66.7%) | 5 (71.4%) |
| 12 to 14 Years | 0 (0.0%) | 3 (100.0%) |
| 15 Years | 0 (0.0%) | 13 (72.2%) |
| 16 and 17 Years | 7 (38.9%) | 9 (64.3%) |
| 18 to 24 Years | 68 (57.1%) | 25 (100.0%) |
| 25 to 34 Years | 2 (5.6%) | 6 (20.7%) |
| 35 to 44 Years | 67 (81.7%) | 11 (17.7%) |
| 45 to 54 Years | 11 (20.4%) | 25 (61.0%) |
| 55 to 64 Years | 8 (22.9%) | 16 (55.2%) |
| 65 to 74 Years | 2 (14.3%) | 1 (4.2%) |
| 75 Years and over | 2 (12.5%) | 2 (14.3%) |
| Total | 197 (45.9%) | 125 (43.7%) |
Income Above Poverty by Sex and Age in Attapulgus
According to the poverty statistics in Attapulgus, males aged 12 to 14 years and females aged 65 to 74 years are the age groups that are most secure financially, with 100.0% of males and 95.8% of females in these age groups living above the poverty line.
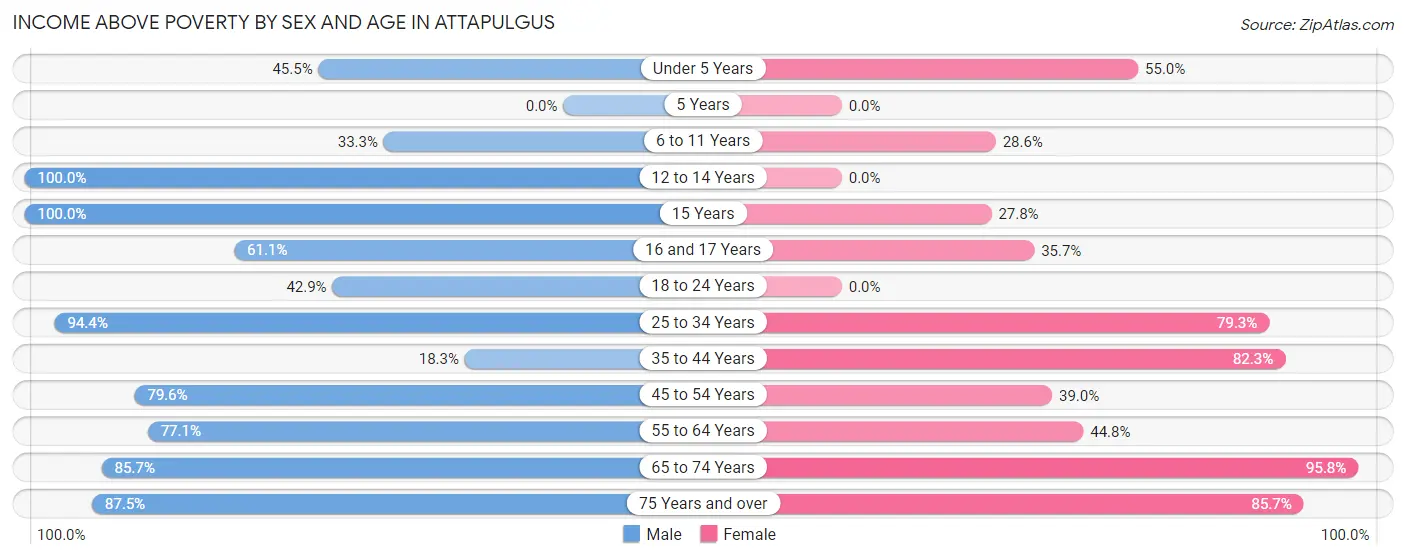
| Age Bracket | Male | Female |
| Under 5 Years | 5 (45.5%) | 11 (55.0%) |
| 5 Years | 0 (0.0%) | 0 (0.0%) |
| 6 to 11 Years | 12 (33.3%) | 2 (28.6%) |
| 12 to 14 Years | 3 (100.0%) | 0 (0.0%) |
| 15 Years | 5 (100.0%) | 5 (27.8%) |
| 16 and 17 Years | 11 (61.1%) | 5 (35.7%) |
| 18 to 24 Years | 51 (42.9%) | 0 (0.0%) |
| 25 to 34 Years | 34 (94.4%) | 23 (79.3%) |
| 35 to 44 Years | 15 (18.3%) | 51 (82.3%) |
| 45 to 54 Years | 43 (79.6%) | 16 (39.0%) |
| 55 to 64 Years | 27 (77.1%) | 13 (44.8%) |
| 65 to 74 Years | 12 (85.7%) | 23 (95.8%) |
| 75 Years and over | 14 (87.5%) | 12 (85.7%) |
| Total | 232 (54.1%) | 161 (56.3%) |
Income Below Poverty Among Married-Couple Families in Attapulgus
The poverty statistics for married-couple families in Attapulgus show that 10.9% or 7 of the total 64 families live below the poverty line. Families with 3 or 4 children have the highest poverty rate of 35.7%, comprising of 5 families. On the other hand, families with no children have the lowest poverty rate of 2.7%, which includes 1 families.
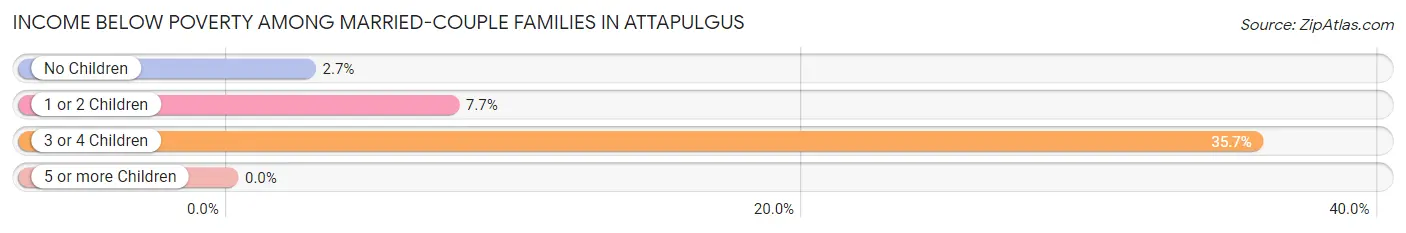
| Children | Above Poverty | Below Poverty |
| No Children | 36 (97.3%) | 1 (2.7%) |
| 1 or 2 Children | 12 (92.3%) | 1 (7.7%) |
| 3 or 4 Children | 9 (64.3%) | 5 (35.7%) |
| 5 or more Children | 0 (0.0%) | 0 (0.0%) |
| Total | 57 (89.1%) | 7 (10.9%) |
Income Below Poverty Among Single-Parent Households in Attapulgus
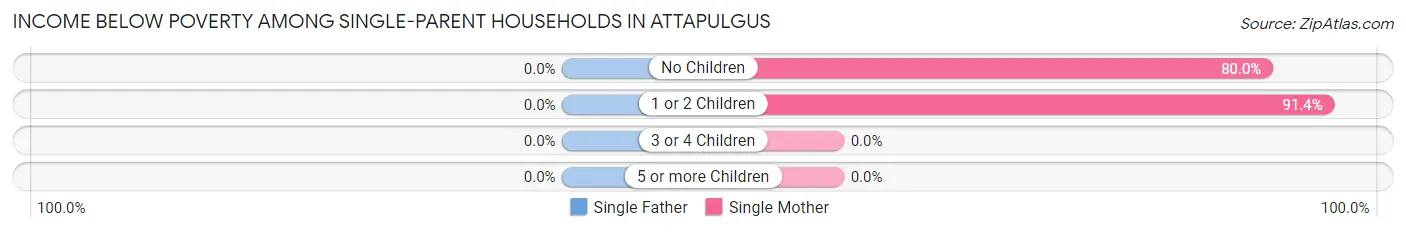
| Children | Single Father | Single Mother |
| No Children | 0 (0.0%) | 8 (80.0%) |
| 1 or 2 Children | 0 (0.0%) | 32 (91.4%) |
| 3 or 4 Children | 0 (0.0%) | 0 (0.0%) |
| 5 or more Children | 0 (0.0%) | 0 (0.0%) |
| Total | 0 (0.0%) | 40 (88.9%) |
Income Below Poverty Among Married-Couple vs Single-Parent Households in Attapulgus
The poverty data for Attapulgus shows that 7 of the married-couple family households (10.9%) and 40 of the single-parent households (80.0%) are living below the poverty level. Within the married-couple family households, those with 3 or 4 children have the highest poverty rate, with 5 households (35.7%) falling below the poverty line. Among the single-parent households, those with 1 or 2 children have the highest poverty rate, with 32 household (91.4%) living below poverty.
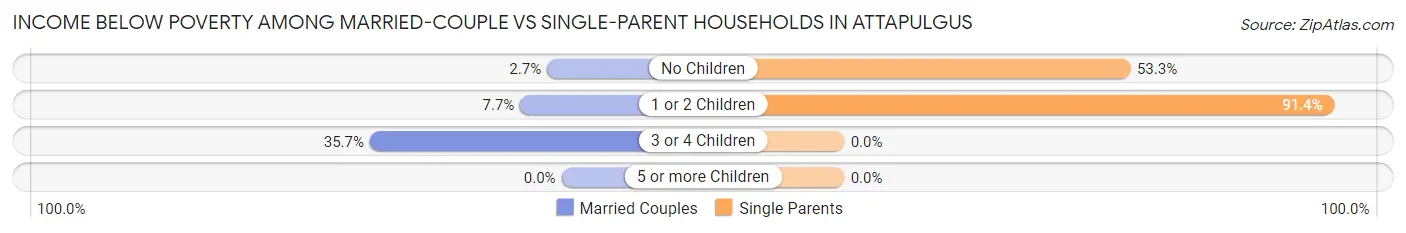
| Children | Married-Couple Families | Single-Parent Households |
| No Children | 1 (2.7%) | 8 (53.3%) |
| 1 or 2 Children | 1 (7.7%) | 32 (91.4%) |
| 3 or 4 Children | 5 (35.7%) | 0 (0.0%) |
| 5 or more Children | 0 (0.0%) | 0 (0.0%) |
| Total | 7 (10.9%) | 40 (80.0%) |
Employment Characteristics in Attapulgus
Employment by Class of Employer in Attapulgus
Among the 356 employed individuals in Attapulgus, private company employees (263 | 73.9%), state government employees (37 | 10.4%), and local government employees (32 | 9.0%) make up the most common classes of employment.
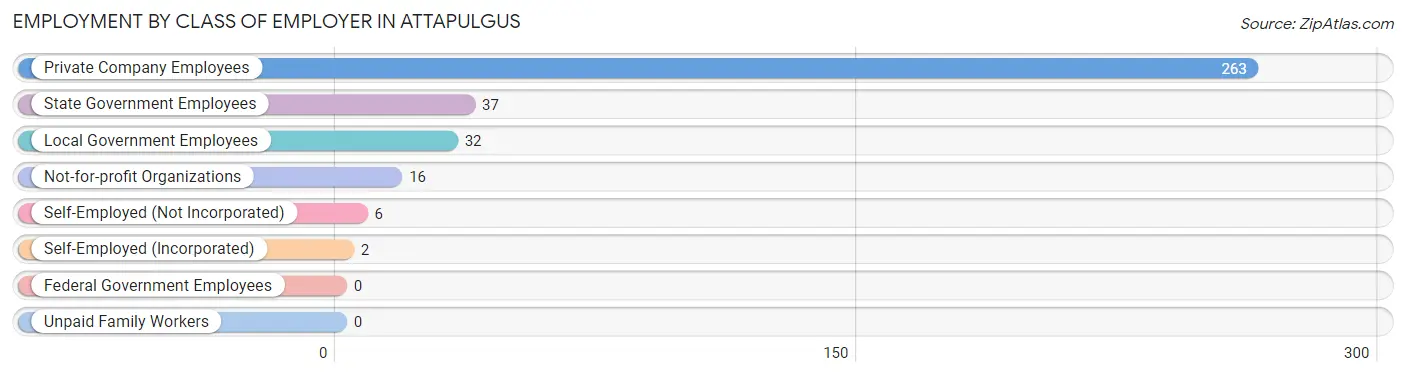
| Employer Class | # Employees | % Employees |
| Private Company Employees | 263 | 73.9% |
| Self-Employed (Incorporated) | 2 | 0.6% |
| Self-Employed (Not Incorporated) | 6 | 1.7% |
| Not-for-profit Organizations | 16 | 4.5% |
| Local Government Employees | 32 | 9.0% |
| State Government Employees | 37 | 10.4% |
| Federal Government Employees | 0 | 0.0% |
| Unpaid Family Workers | 0 | 0.0% |
| Total | 356 | 100.0% |
Employment Status by Age in Attapulgus
According to the labor force statistics for Attapulgus, out of the total population over 16 years of age (612), 59.2% or 362 individuals are in the labor force, with 1.7% or 6 of them unemployed. The age group with the highest labor force participation rate is 35 to 44 years, with 97.2% or 140 individuals in the labor force. Within the labor force, the 35 to 44 years age range has the highest percentage of unemployed individuals, with 4.3% or 6 of them being unemployed.
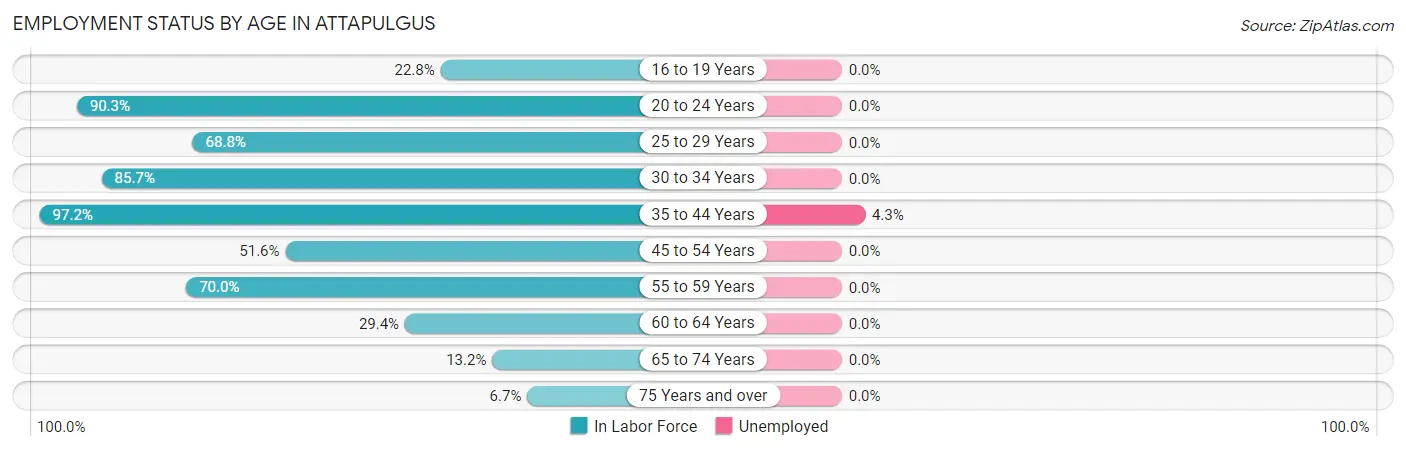
| Age Bracket | In Labor Force | Unemployed |
| 16 to 19 Years | 26 (22.8%) | 0 (0.0%) |
| 20 to 24 Years | 56 (90.3%) | 0 (0.0%) |
| 25 to 29 Years | 11 (68.8%) | 0 (0.0%) |
| 30 to 34 Years | 42 (85.7%) | 0 (0.0%) |
| 35 to 44 Years | 140 (97.2%) | 6 (4.3%) |
| 45 to 54 Years | 49 (51.6%) | 0 (0.0%) |
| 55 to 59 Years | 21 (70.0%) | 0 (0.0%) |
| 60 to 64 Years | 10 (29.4%) | 0 (0.0%) |
| 65 to 74 Years | 5 (13.2%) | 0 (0.0%) |
| 75 Years and over | 2 (6.7%) | 0 (0.0%) |
| Total | 362 (59.2%) | 6 (1.7%) |
Employment Status by Educational Attainment in Attapulgus
According to labor force statistics for Attapulgus, 74.2% of individuals (273) out of the total population between 25 and 64 years of age (368) are in the labor force, with 2.2% or 6 of them being unemployed. The group with the highest labor force participation rate are those with the educational attainment of college / associate degree, with 85.8% or 109 individuals in the labor force. Within the labor force, individuals with college / associate degree education have the highest percentage of unemployment, with 5.5% or 6 of them being unemployed.
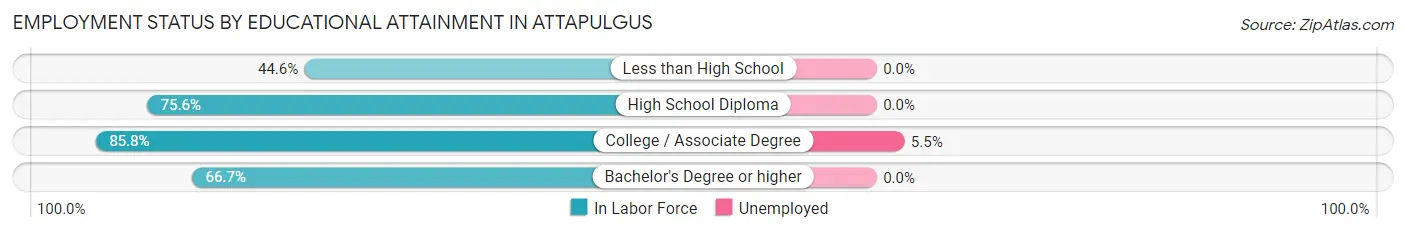
| Educational Attainment | In Labor Force | Unemployed |
| Less than High School | 25 (44.6%) | 0 (0.0%) |
| High School Diploma | 133 (75.6%) | 0 (0.0%) |
| College / Associate Degree | 109 (85.8%) | 7 (5.5%) |
| Bachelor's Degree or higher | 6 (66.7%) | 0 (0.0%) |
| Total | 273 (74.2%) | 8 (2.2%) |
Employment Occupations by Sex in Attapulgus
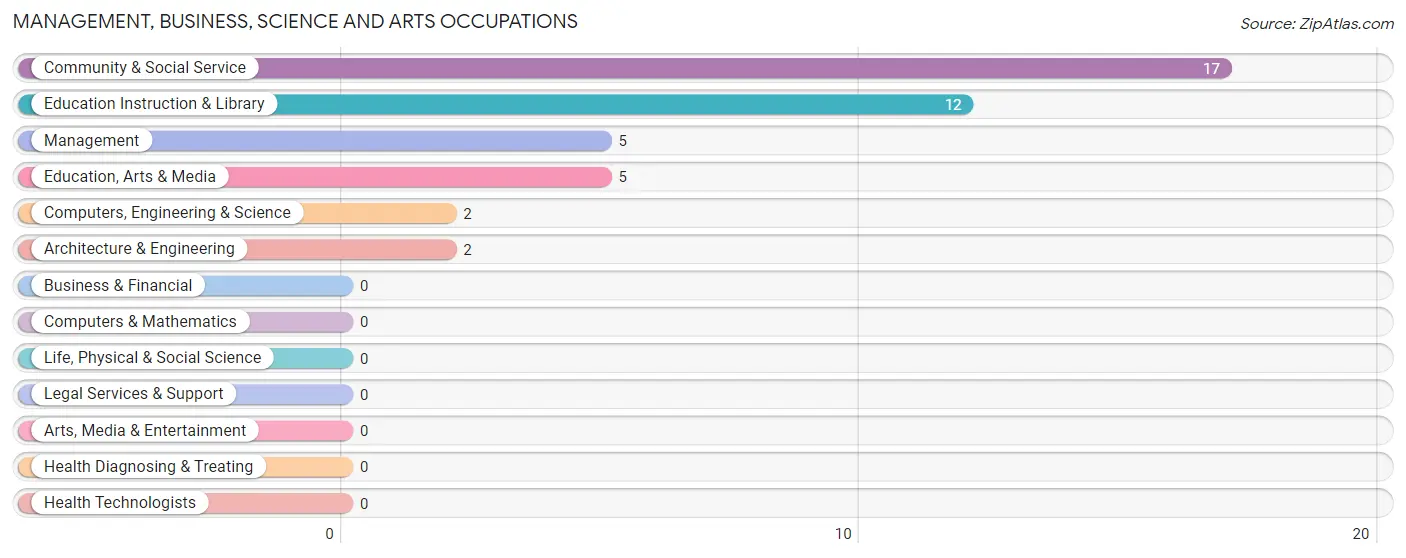
Management, Business, Science and Arts Occupations
The most common Management, Business, Science and Arts occupations in Attapulgus are Community & Social Service (17 | 4.8%), Education Instruction & Library (12 | 3.4%), Management (5 | 1.4%), Education, Arts & Media (5 | 1.4%), and Computers, Engineering & Science (2 | 0.6%).
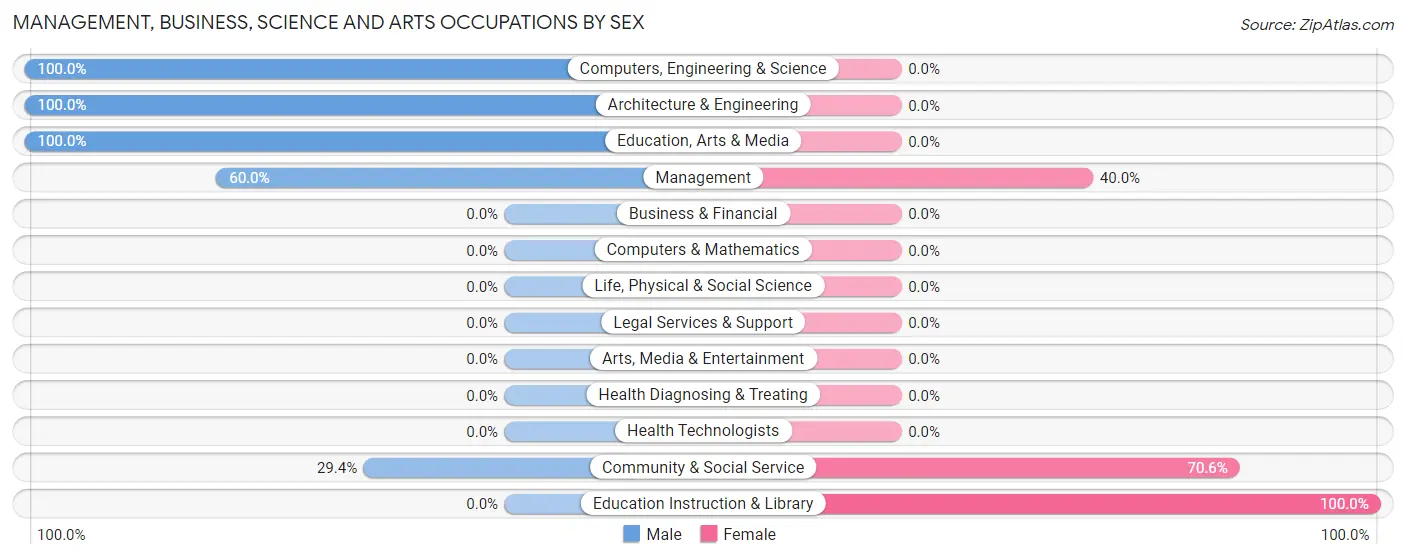
Management, Business, Science and Arts Occupations by Sex
Within the Management, Business, Science and Arts occupations in Attapulgus, the most male-oriented occupations are Computers, Engineering & Science (100.0%), Architecture & Engineering (100.0%), and Education, Arts & Media (100.0%), while the most female-oriented occupations are Education Instruction & Library (100.0%), Community & Social Service (70.6%), and Management (40.0%).
| Occupation | Male | Female |
| Management | 3 (60.0%) | 2 (40.0%) |
| Business & Financial | 0 (0.0%) | 0 (0.0%) |
| Computers, Engineering & Science | 2 (100.0%) | 0 (0.0%) |
| Computers & Mathematics | 0 (0.0%) | 0 (0.0%) |
| Architecture & Engineering | 2 (100.0%) | 0 (0.0%) |
| Life, Physical & Social Science | 0 (0.0%) | 0 (0.0%) |
| Community & Social Service | 5 (29.4%) | 12 (70.6%) |
| Education, Arts & Media | 5 (100.0%) | 0 (0.0%) |
| Legal Services & Support | 0 (0.0%) | 0 (0.0%) |
| Education Instruction & Library | 0 (0.0%) | 12 (100.0%) |
| Arts, Media & Entertainment | 0 (0.0%) | 0 (0.0%) |
| Health Diagnosing & Treating | 0 (0.0%) | 0 (0.0%) |
| Health Technologists | 0 (0.0%) | 0 (0.0%) |
| Total (Category) | 10 (41.7%) | 14 (58.3%) |
| Total (Overall) | 216 (60.7%) | 140 (39.3%) |
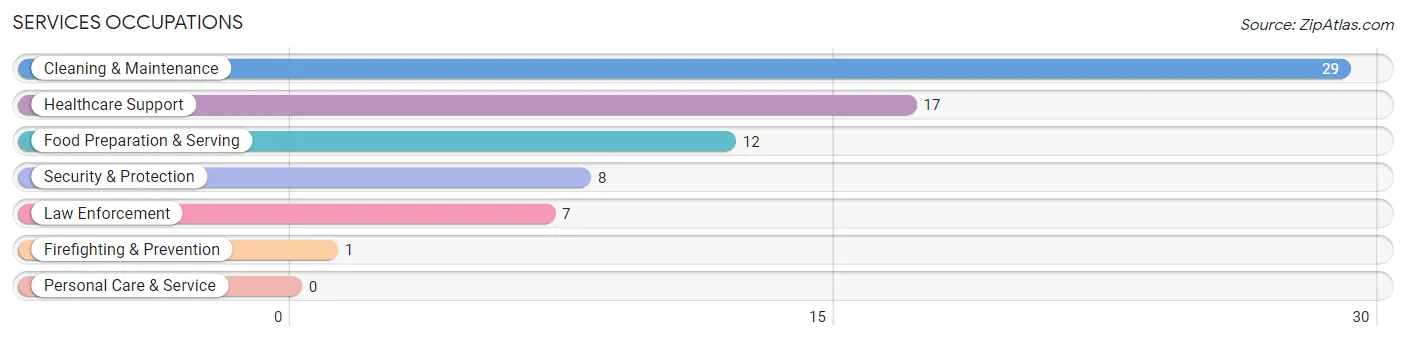
Services Occupations
The most common Services occupations in Attapulgus are Cleaning & Maintenance (29 | 8.2%), Healthcare Support (17 | 4.8%), Food Preparation & Serving (12 | 3.4%), Security & Protection (8 | 2.2%), and Law Enforcement (7 | 2.0%).
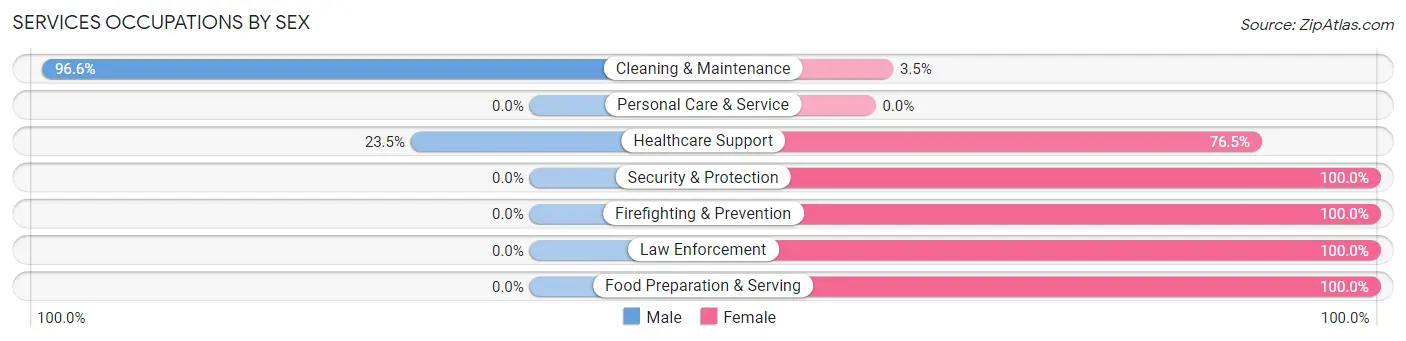
Services Occupations by Sex
Within the Services occupations in Attapulgus, the most male-oriented occupations are Cleaning & Maintenance (96.6%), and Healthcare Support (23.5%), while the most female-oriented occupations are Security & Protection (100.0%), Firefighting & Prevention (100.0%), and Law Enforcement (100.0%).
| Occupation | Male | Female |
| Healthcare Support | 4 (23.5%) | 13 (76.5%) |
| Security & Protection | 0 (0.0%) | 8 (100.0%) |
| Firefighting & Prevention | 0 (0.0%) | 1 (100.0%) |
| Law Enforcement | 0 (0.0%) | 7 (100.0%) |
| Food Preparation & Serving | 0 (0.0%) | 12 (100.0%) |
| Cleaning & Maintenance | 28 (96.6%) | 1 (3.5%) |
| Personal Care & Service | 0 (0.0%) | 0 (0.0%) |
| Total (Category) | 32 (48.5%) | 34 (51.5%) |
| Total (Overall) | 216 (60.7%) | 140 (39.3%) |
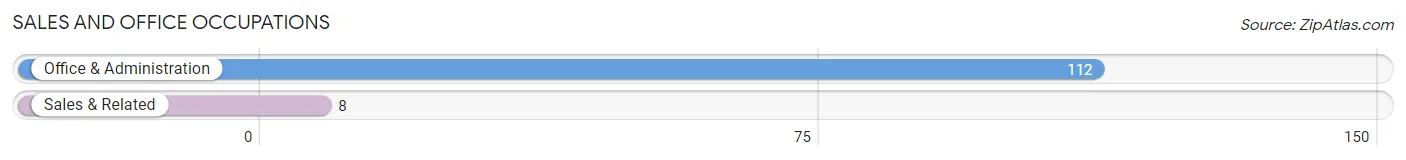
Sales and Office Occupations
The most common Sales and Office occupations in Attapulgus are Office & Administration (112 | 31.5%), and Sales & Related (8 | 2.2%).
Sales and Office Occupations by Sex
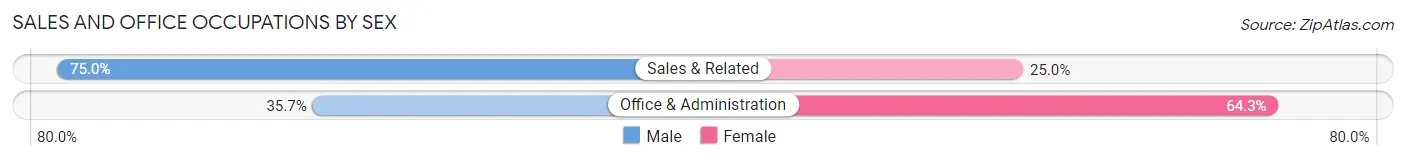
| Occupation | Male | Female |
| Sales & Related | 6 (75.0%) | 2 (25.0%) |
| Office & Administration | 40 (35.7%) | 72 (64.3%) |
| Total (Category) | 46 (38.3%) | 74 (61.7%) |
| Total (Overall) | 216 (60.7%) | 140 (39.3%) |
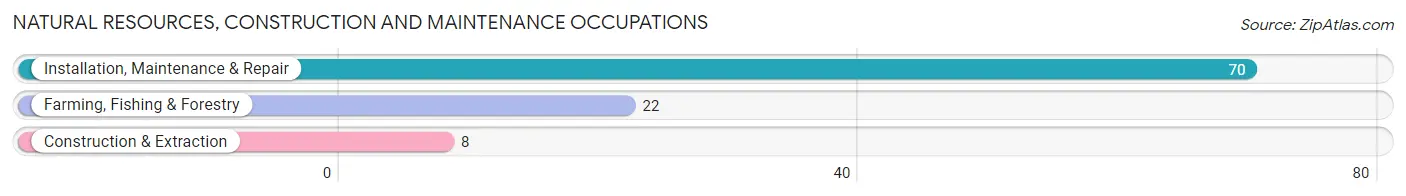
Natural Resources, Construction and Maintenance Occupations
The most common Natural Resources, Construction and Maintenance occupations in Attapulgus are Installation, Maintenance & Repair (70 | 19.7%), Farming, Fishing & Forestry (22 | 6.2%), and Construction & Extraction (8 | 2.2%).
Natural Resources, Construction and Maintenance Occupations by Sex
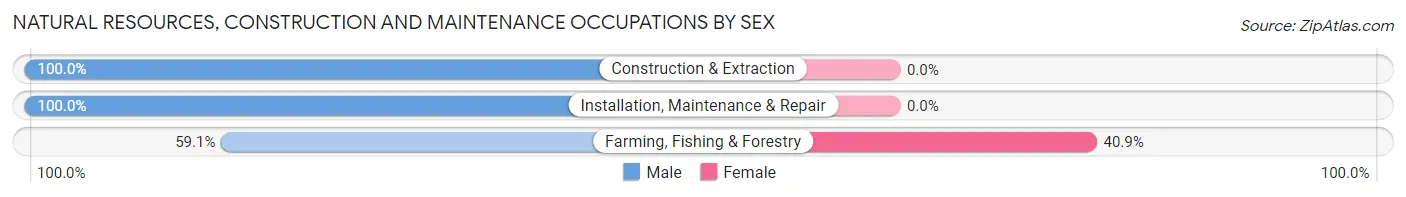
| Occupation | Male | Female |
| Farming, Fishing & Forestry | 13 (59.1%) | 9 (40.9%) |
| Construction & Extraction | 8 (100.0%) | 0 (0.0%) |
| Installation, Maintenance & Repair | 70 (100.0%) | 0 (0.0%) |
| Total (Category) | 91 (91.0%) | 9 (9.0%) |
| Total (Overall) | 216 (60.7%) | 140 (39.3%) |
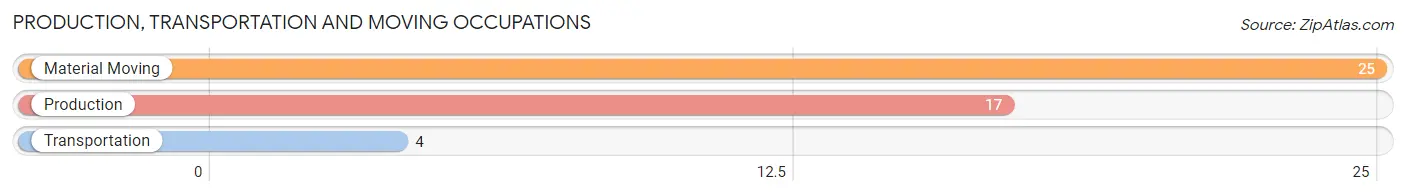
Production, Transportation and Moving Occupations
The most common Production, Transportation and Moving occupations in Attapulgus are Material Moving (25 | 7.0%), Production (17 | 4.8%), and Transportation (4 | 1.1%).
Production, Transportation and Moving Occupations by Sex
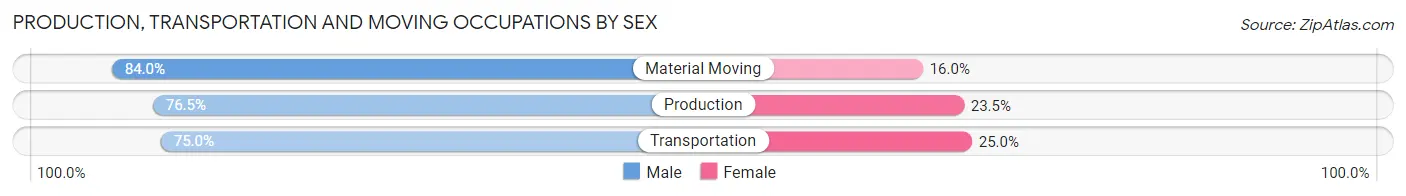
| Occupation | Male | Female |
| Production | 13 (76.5%) | 4 (23.5%) |
| Transportation | 3 (75.0%) | 1 (25.0%) |
| Material Moving | 21 (84.0%) | 4 (16.0%) |
| Total (Category) | 37 (80.4%) | 9 (19.6%) |
| Total (Overall) | 216 (60.7%) | 140 (39.3%) |
Employment Industries by Sex in Attapulgus
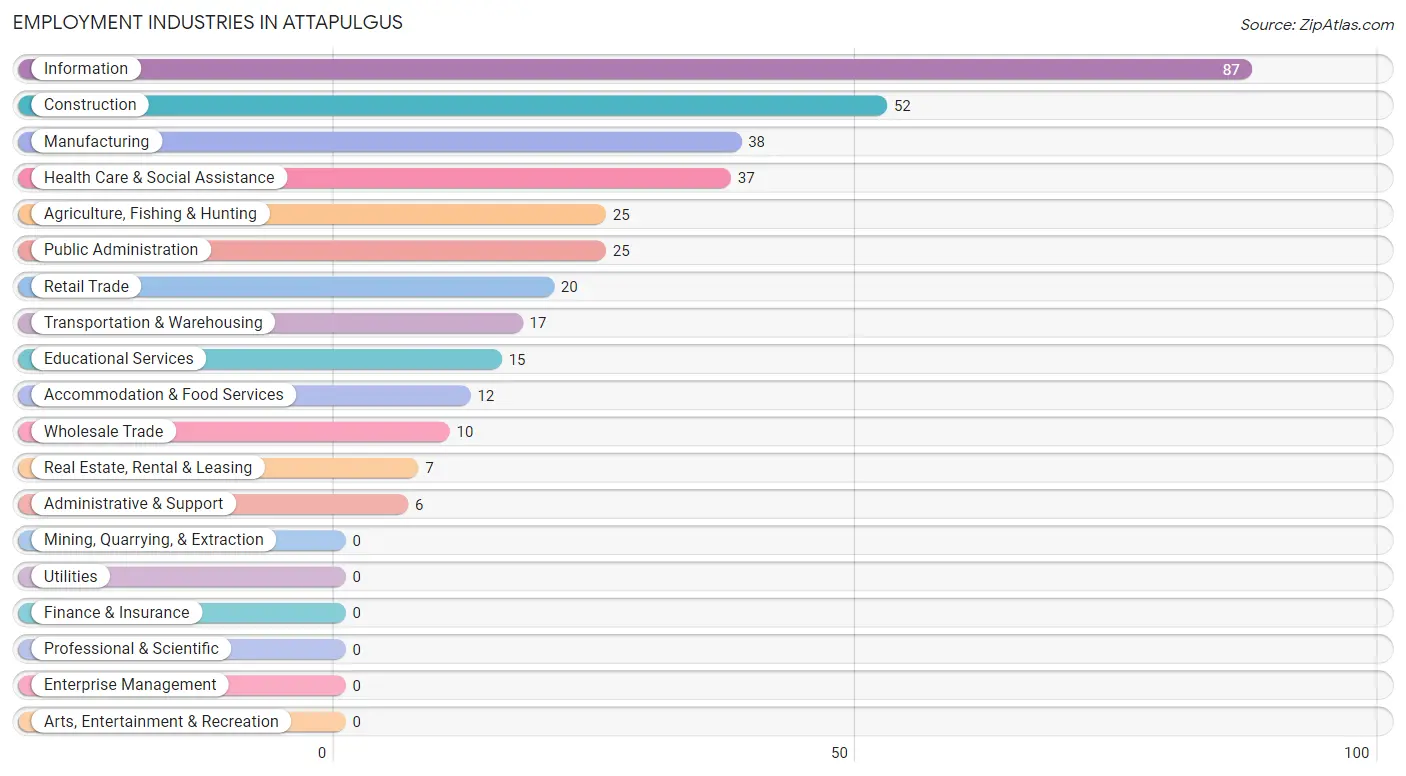
Employment Industries in Attapulgus
The major employment industries in Attapulgus include Information (87 | 24.4%), Construction (52 | 14.6%), Manufacturing (38 | 10.7%), Health Care & Social Assistance (37 | 10.4%), and Agriculture, Fishing & Hunting (25 | 7.0%).
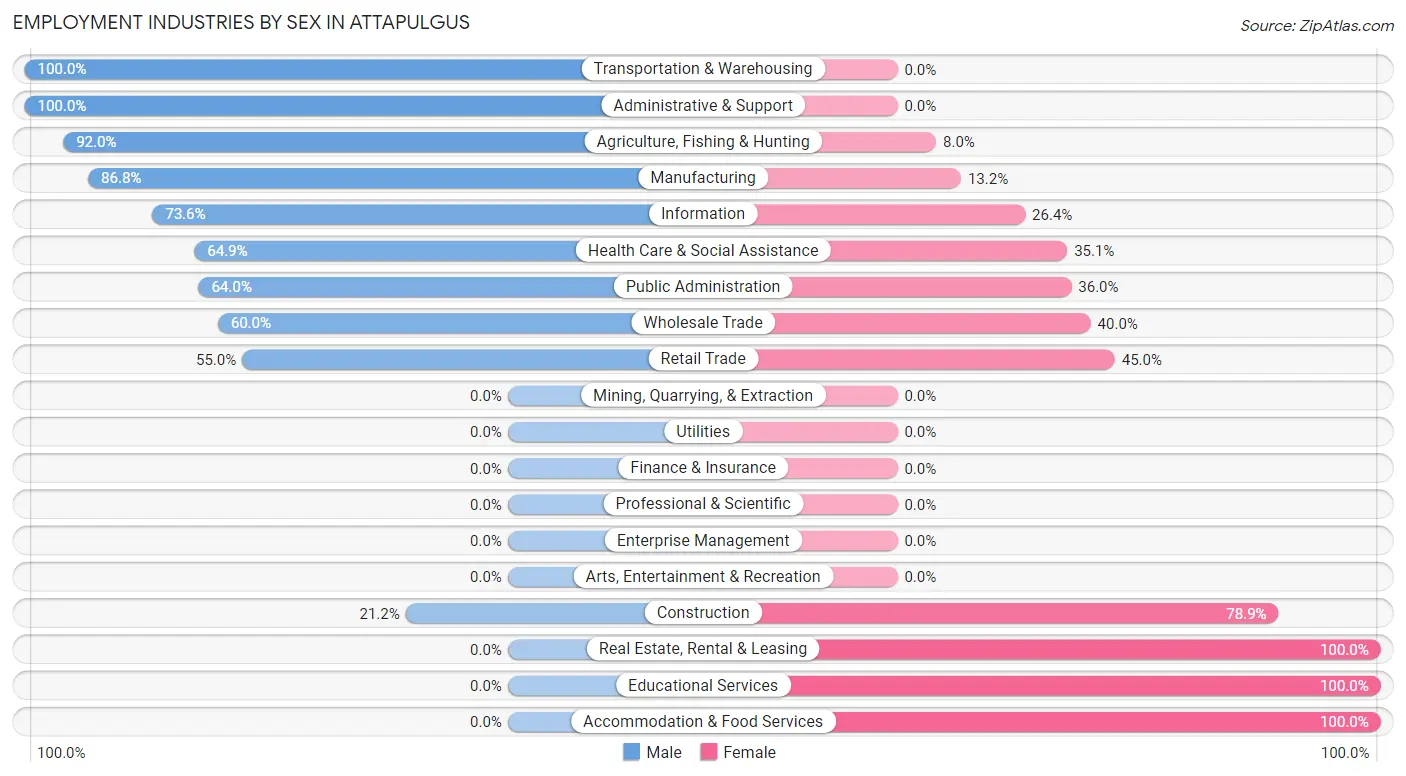
Employment Industries by Sex in Attapulgus
The Attapulgus industries that see more men than women are Transportation & Warehousing (100.0%), Administrative & Support (100.0%), and Agriculture, Fishing & Hunting (92.0%), whereas the industries that tend to have a higher number of women are Real Estate, Rental & Leasing (100.0%), Educational Services (100.0%), and Accommodation & Food Services (100.0%).
| Industry | Male | Female |
| Agriculture, Fishing & Hunting | 23 (92.0%) | 2 (8.0%) |
| Mining, Quarrying, & Extraction | 0 (0.0%) | 0 (0.0%) |
| Construction | 11 (21.1%) | 41 (78.8%) |
| Manufacturing | 33 (86.8%) | 5 (13.2%) |
| Wholesale Trade | 6 (60.0%) | 4 (40.0%) |
| Retail Trade | 11 (55.0%) | 9 (45.0%) |
| Transportation & Warehousing | 17 (100.0%) | 0 (0.0%) |
| Utilities | 0 (0.0%) | 0 (0.0%) |
| Information | 64 (73.6%) | 23 (26.4%) |
| Finance & Insurance | 0 (0.0%) | 0 (0.0%) |
| Real Estate, Rental & Leasing | 0 (0.0%) | 7 (100.0%) |
| Professional & Scientific | 0 (0.0%) | 0 (0.0%) |
| Enterprise Management | 0 (0.0%) | 0 (0.0%) |
| Administrative & Support | 6 (100.0%) | 0 (0.0%) |
| Educational Services | 0 (0.0%) | 15 (100.0%) |
| Health Care & Social Assistance | 24 (64.9%) | 13 (35.1%) |
| Arts, Entertainment & Recreation | 0 (0.0%) | 0 (0.0%) |
| Accommodation & Food Services | 0 (0.0%) | 12 (100.0%) |
| Public Administration | 16 (64.0%) | 9 (36.0%) |
| Total | 216 (60.7%) | 140 (39.3%) |
Education in Attapulgus
School Enrollment in Attapulgus
The most common levels of schooling among the 127 students in Attapulgus are high school (70 | 55.1%), elementary school (31 | 24.4%), and middle school (13 | 10.2%).
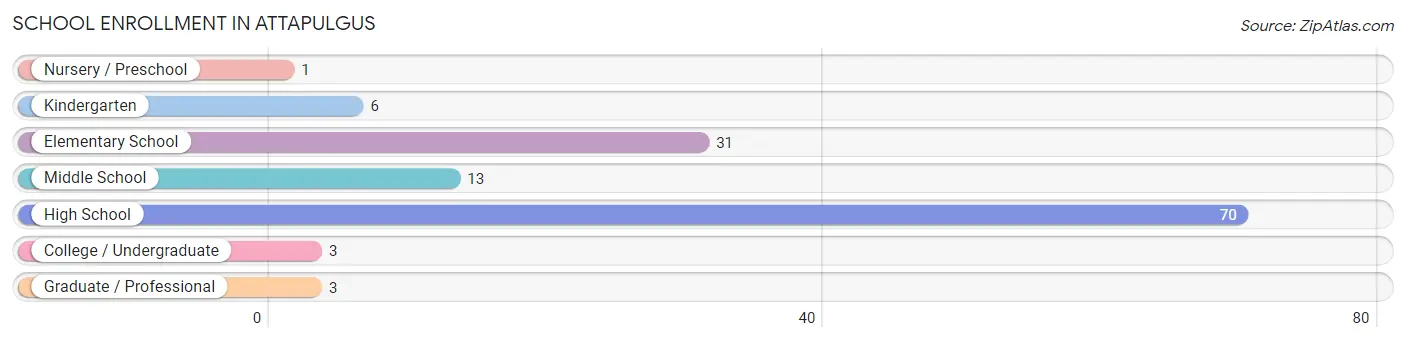
| School Level | # Students | % Students |
| Nursery / Preschool | 1 | 0.8% |
| Kindergarten | 6 | 4.7% |
| Elementary School | 31 | 24.4% |
| Middle School | 13 | 10.2% |
| High School | 70 | 55.1% |
| College / Undergraduate | 3 | 2.4% |
| Graduate / Professional | 3 | 2.4% |
| Total | 127 | 100.0% |
School Enrollment by Age by Funding Source in Attapulgus
Out of a total of 127 students who are enrolled in schools in Attapulgus, 10 (7.9%) attend a private institution, while the remaining 117 (92.1%) are enrolled in public schools. The age group of 15 to 17 year olds has the highest likelihood of being enrolled in private schools, with 10 (18.2% in the age bracket) enrolled. Conversely, the age group of 3 to 4 year olds has the lowest likelihood of being enrolled in a private school, with 1 (100.0% in the age bracket) attending a public institution.
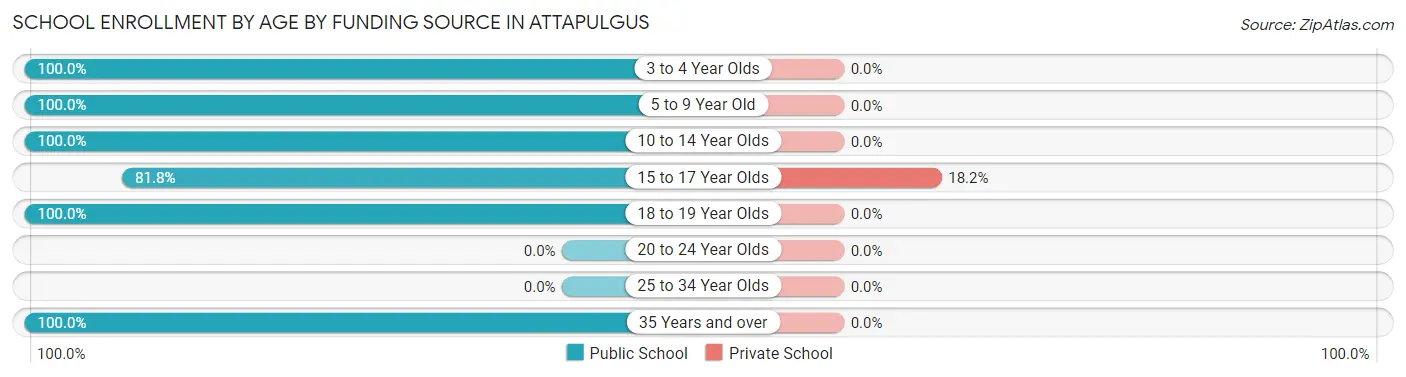
| Age Bracket | Public School | Private School |
| 3 to 4 Year Olds | 1 (100.0%) | 0 (0.0%) |
| 5 to 9 Year Old | 22 (100.0%) | 0 (0.0%) |
| 10 to 14 Year Olds | 24 (100.0%) | 0 (0.0%) |
| 15 to 17 Year Olds | 45 (81.8%) | 10 (18.2%) |
| 18 to 19 Year Olds | 19 (100.0%) | 0 (0.0%) |
| 20 to 24 Year Olds | 0 (0.0%) | 0 (0.0%) |
| 25 to 34 Year Olds | 0 (0.0%) | 0 (0.0%) |
| 35 Years and over | 6 (100.0%) | 0 (0.0%) |
| Total | 117 (92.1%) | 10 (7.9%) |
Educational Attainment by Field of Study in Attapulgus
Education (8 | 50.0%), business (6 | 37.5%), and engineering (2 | 12.5%) are the most common fields of study among 16 individuals in Attapulgus who have obtained a bachelor's degree or higher.
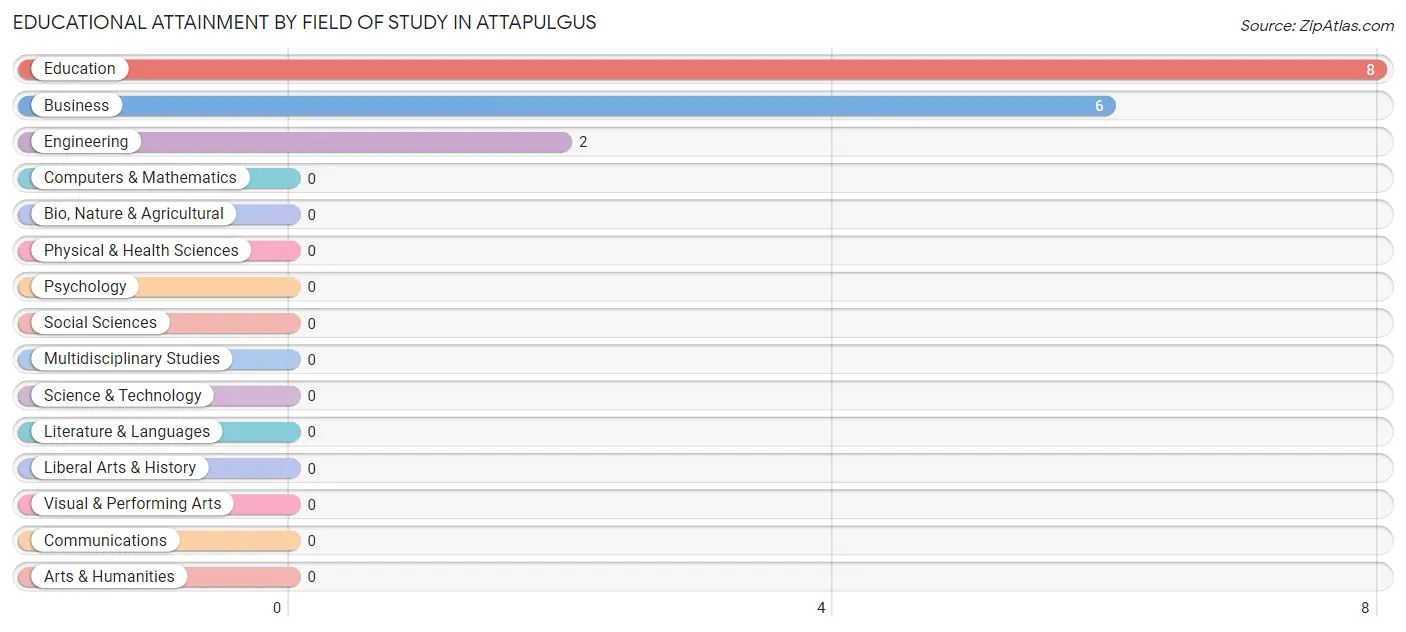
| Field of Study | # Graduates | % Graduates |
| Computers & Mathematics | 0 | 0.0% |
| Bio, Nature & Agricultural | 0 | 0.0% |
| Physical & Health Sciences | 0 | 0.0% |
| Psychology | 0 | 0.0% |
| Social Sciences | 0 | 0.0% |
| Engineering | 2 | 12.5% |
| Multidisciplinary Studies | 0 | 0.0% |
| Science & Technology | 0 | 0.0% |
| Business | 6 | 37.5% |
| Education | 8 | 50.0% |
| Literature & Languages | 0 | 0.0% |
| Liberal Arts & History | 0 | 0.0% |
| Visual & Performing Arts | 0 | 0.0% |
| Communications | 0 | 0.0% |
| Arts & Humanities | 0 | 0.0% |
| Total | 16 | 100.0% |
Transportation & Commute in Attapulgus
Vehicle Availability by Sex in Attapulgus
The most prevalent vehicle ownership categories in Attapulgus are males with 4 vehicles (82, accounting for 38.0%) and females with 4 vehicles (53, making up 58.6%).
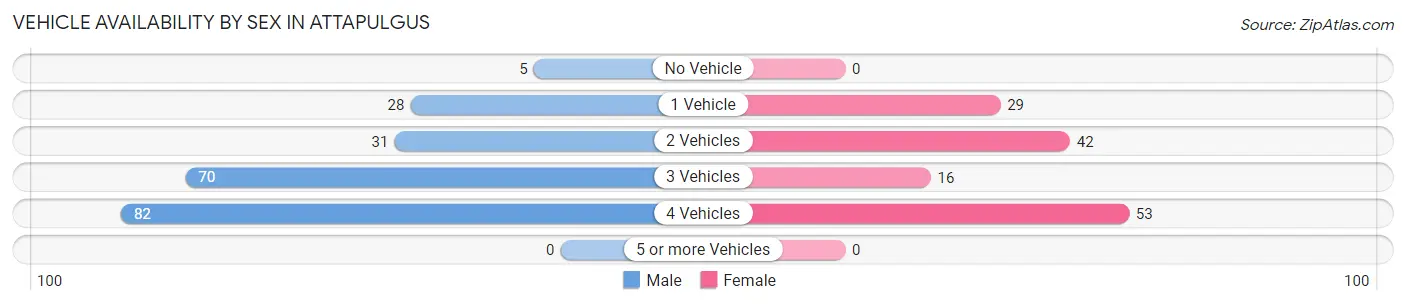
| Vehicles Available | Male | Female |
| No Vehicle | 5 (2.3%) | 0 (0.0%) |
| 1 Vehicle | 28 (13.0%) | 29 (20.7%) |
| 2 Vehicles | 31 (14.3%) | 42 (30.0%) |
| 3 Vehicles | 70 (32.4%) | 16 (11.4%) |
| 4 Vehicles | 82 (38.0%) | 53 (37.9%) |
| 5 or more Vehicles | 0 (0.0%) | 0 (0.0%) |
| Total | 216 (100.0%) | 140 (100.0%) |
Commute Time in Attapulgus
The most frequently occuring commute durations in Attapulgus are 30 to 34 minutes (68 commuters, 19.1%), 90 or more minutes (66 commuters, 18.5%), and 20 to 24 minutes (56 commuters, 15.7%).
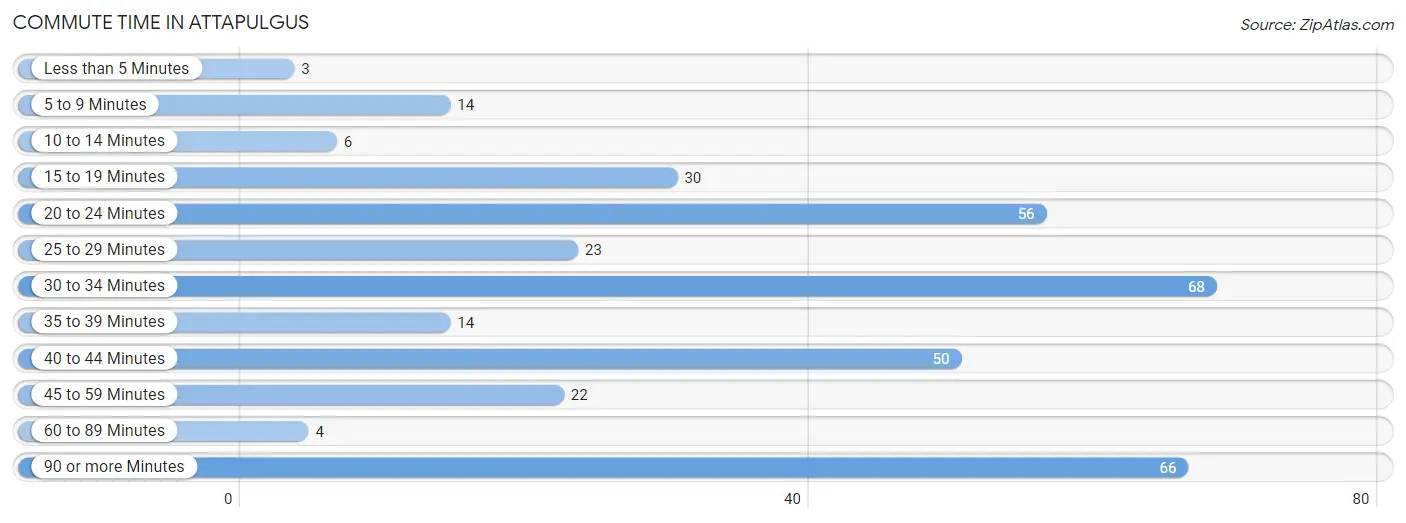
| Commute Time | # Commuters | % Commuters |
| Less than 5 Minutes | 3 | 0.8% |
| 5 to 9 Minutes | 14 | 3.9% |
| 10 to 14 Minutes | 6 | 1.7% |
| 15 to 19 Minutes | 30 | 8.4% |
| 20 to 24 Minutes | 56 | 15.7% |
| 25 to 29 Minutes | 23 | 6.5% |
| 30 to 34 Minutes | 68 | 19.1% |
| 35 to 39 Minutes | 14 | 3.9% |
| 40 to 44 Minutes | 50 | 14.0% |
| 45 to 59 Minutes | 22 | 6.2% |
| 60 to 89 Minutes | 4 | 1.1% |
| 90 or more Minutes | 66 | 18.5% |
Commute Time by Sex in Attapulgus
The most common commute times in Attapulgus are 90 or more minutes (64 commuters, 29.6%) for males and 40 to 44 minutes (48 commuters, 34.3%) for females.
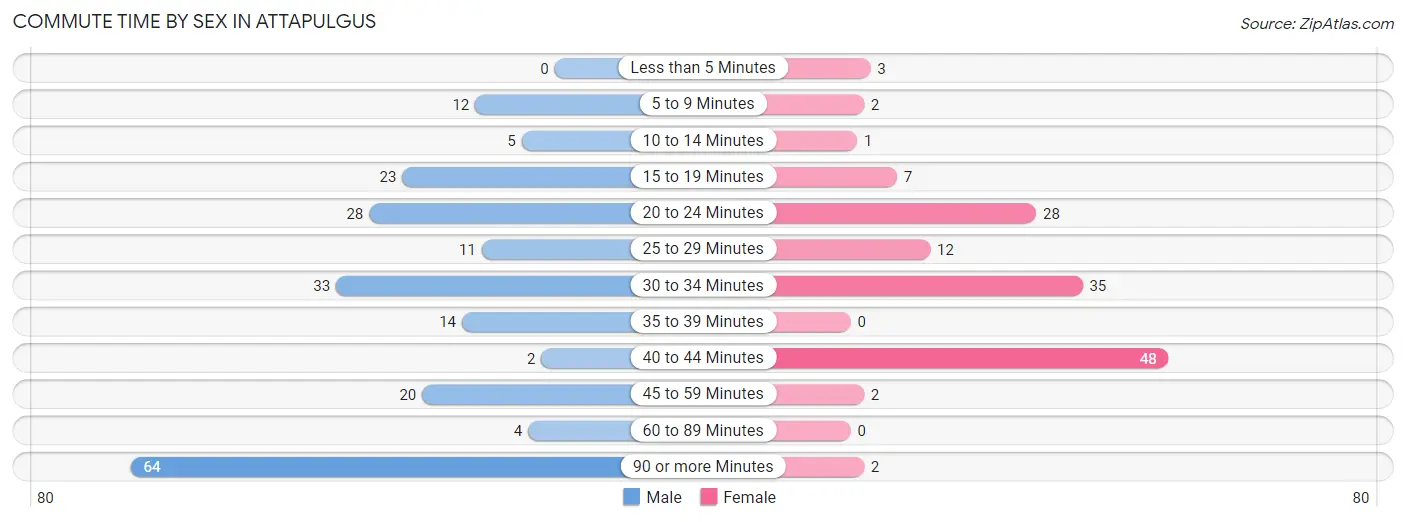
| Commute Time | Male | Female |
| Less than 5 Minutes | 0 (0.0%) | 3 (2.1%) |
| 5 to 9 Minutes | 12 (5.6%) | 2 (1.4%) |
| 10 to 14 Minutes | 5 (2.3%) | 1 (0.7%) |
| 15 to 19 Minutes | 23 (10.6%) | 7 (5.0%) |
| 20 to 24 Minutes | 28 (13.0%) | 28 (20.0%) |
| 25 to 29 Minutes | 11 (5.1%) | 12 (8.6%) |
| 30 to 34 Minutes | 33 (15.3%) | 35 (25.0%) |
| 35 to 39 Minutes | 14 (6.5%) | 0 (0.0%) |
| 40 to 44 Minutes | 2 (0.9%) | 48 (34.3%) |
| 45 to 59 Minutes | 20 (9.3%) | 2 (1.4%) |
| 60 to 89 Minutes | 4 (1.8%) | 0 (0.0%) |
| 90 or more Minutes | 64 (29.6%) | 2 (1.4%) |
Time of Departure to Work by Sex in Attapulgus
The most frequent times of departure to work in Attapulgus are 5:00 AM to 5:29 AM (64, 29.6%) for males and 4:00 PM to 11:59 PM (41, 29.3%) for females.
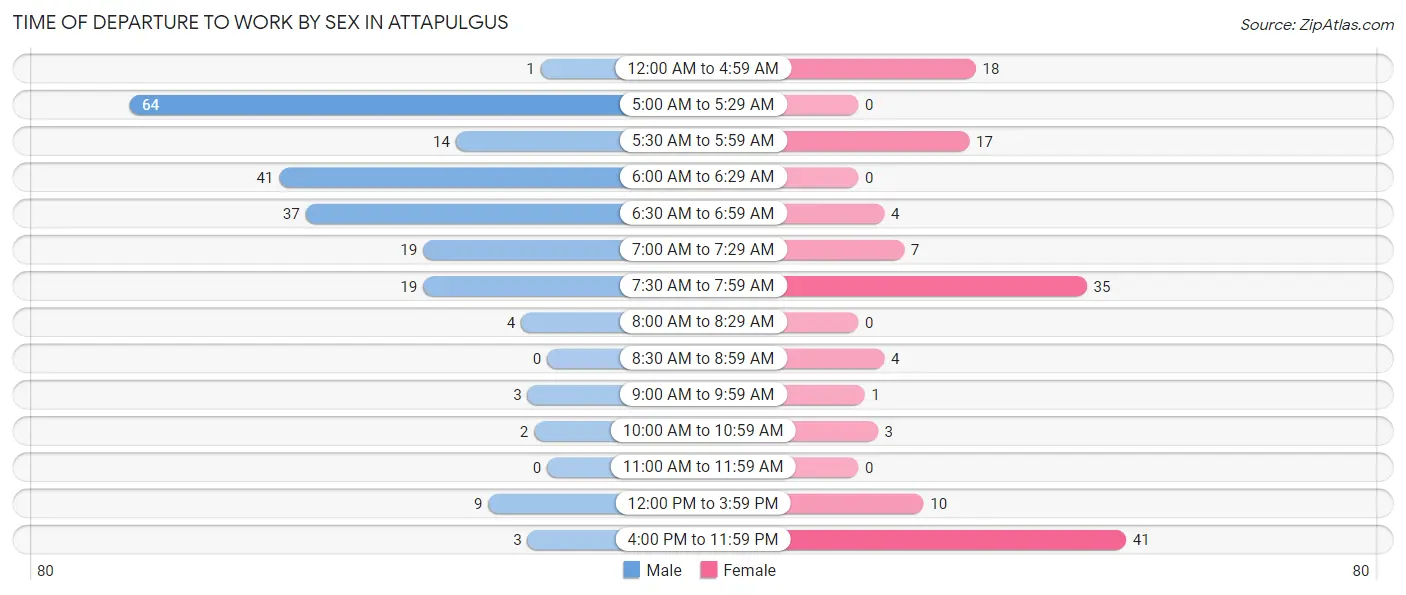
| Time of Departure | Male | Female |
| 12:00 AM to 4:59 AM | 1 (0.5%) | 18 (12.9%) |
| 5:00 AM to 5:29 AM | 64 (29.6%) | 0 (0.0%) |
| 5:30 AM to 5:59 AM | 14 (6.5%) | 17 (12.1%) |
| 6:00 AM to 6:29 AM | 41 (19.0%) | 0 (0.0%) |
| 6:30 AM to 6:59 AM | 37 (17.1%) | 4 (2.9%) |
| 7:00 AM to 7:29 AM | 19 (8.8%) | 7 (5.0%) |
| 7:30 AM to 7:59 AM | 19 (8.8%) | 35 (25.0%) |
| 8:00 AM to 8:29 AM | 4 (1.8%) | 0 (0.0%) |
| 8:30 AM to 8:59 AM | 0 (0.0%) | 4 (2.9%) |
| 9:00 AM to 9:59 AM | 3 (1.4%) | 1 (0.7%) |
| 10:00 AM to 10:59 AM | 2 (0.9%) | 3 (2.1%) |
| 11:00 AM to 11:59 AM | 0 (0.0%) | 0 (0.0%) |
| 12:00 PM to 3:59 PM | 9 (4.2%) | 10 (7.1%) |
| 4:00 PM to 11:59 PM | 3 (1.4%) | 41 (29.3%) |
| Total | 216 (100.0%) | 140 (100.0%) |
Housing Occupancy in Attapulgus
Occupancy by Ownership in Attapulgus
Of the total 189 dwellings in Attapulgus, owner-occupied units account for 131 (69.3%), while renter-occupied units make up 58 (30.7%).
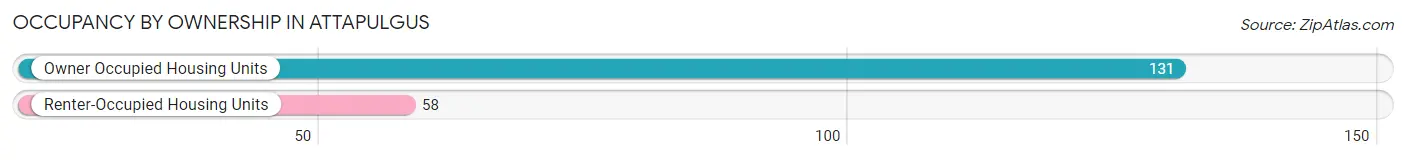
| Occupancy | # Housing Units | % Housing Units |
| Owner Occupied Housing Units | 131 | 69.3% |
| Renter-Occupied Housing Units | 58 | 30.7% |
| Total Occupied Housing Units | 189 | 100.0% |
Occupancy by Household Size in Attapulgus
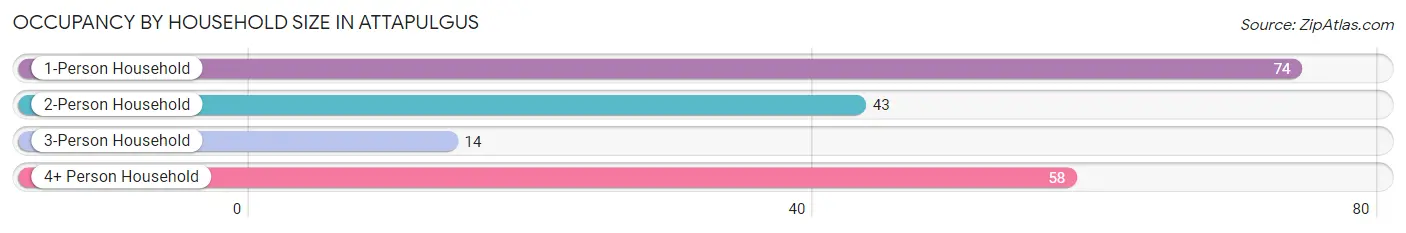
| Household Size | # Housing Units | % Housing Units |
| 1-Person Household | 74 | 39.2% |
| 2-Person Household | 43 | 22.8% |
| 3-Person Household | 14 | 7.4% |
| 4+ Person Household | 58 | 30.7% |
| Total Housing Units | 189 | 100.0% |
Occupancy by Ownership by Household Size in Attapulgus
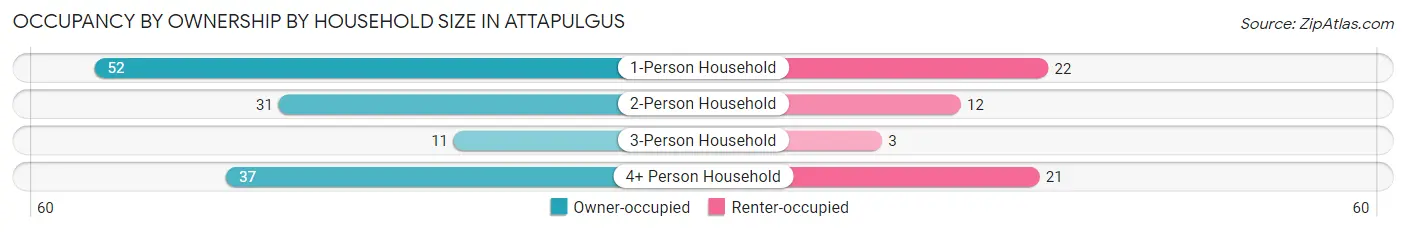
| Household Size | Owner-occupied | Renter-occupied |
| 1-Person Household | 52 (70.3%) | 22 (29.7%) |
| 2-Person Household | 31 (72.1%) | 12 (27.9%) |
| 3-Person Household | 11 (78.6%) | 3 (21.4%) |
| 4+ Person Household | 37 (63.8%) | 21 (36.2%) |
| Total Housing Units | 131 (69.3%) | 58 (30.7%) |
Occupancy by Educational Attainment in Attapulgus
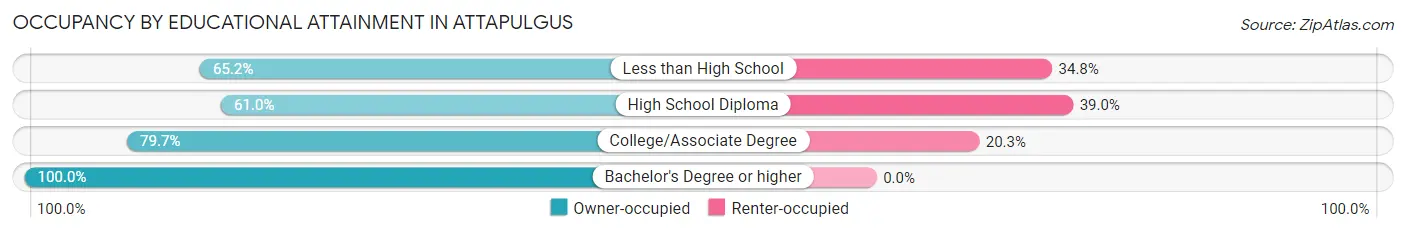
| Household Size | Owner-occupied | Renter-occupied |
| Less than High School | 30 (65.2%) | 16 (34.8%) |
| High School Diploma | 47 (61.0%) | 30 (39.0%) |
| College/Associate Degree | 47 (79.7%) | 12 (20.3%) |
| Bachelor's Degree or higher | 7 (100.0%) | 0 (0.0%) |
Occupancy by Age of Householder in Attapulgus
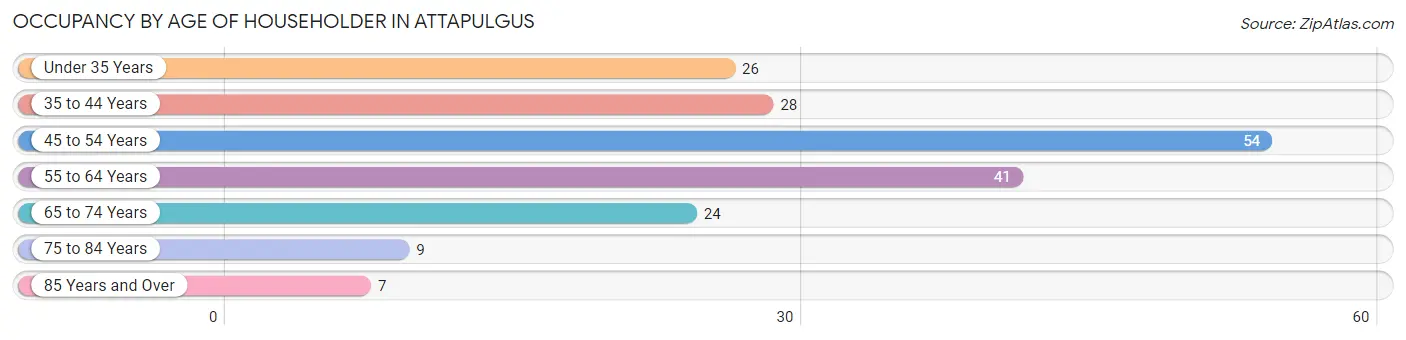
| Age Bracket | # Households | % Households |
| Under 35 Years | 26 | 13.8% |
| 35 to 44 Years | 28 | 14.8% |
| 45 to 54 Years | 54 | 28.6% |
| 55 to 64 Years | 41 | 21.7% |
| 65 to 74 Years | 24 | 12.7% |
| 75 to 84 Years | 9 | 4.8% |
| 85 Years and Over | 7 | 3.7% |
| Total | 189 | 100.0% |
Housing Finances in Attapulgus
Median Income by Occupancy in Attapulgus
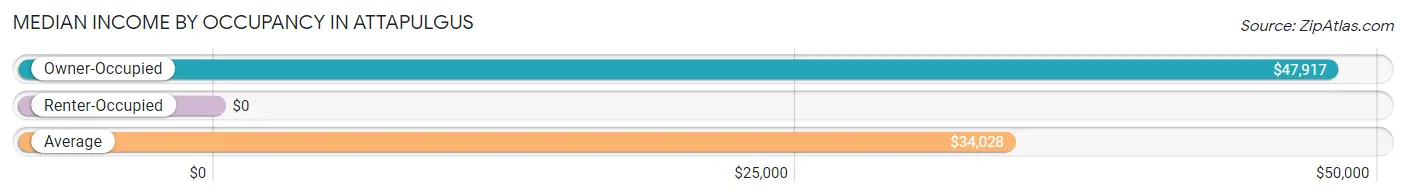
| Occupancy Type | # Households | Median Income |
| Owner-Occupied | 131 (69.3%) | $47,917 |
| Renter-Occupied | 58 (30.7%) | $0 |
| Average | 189 (100.0%) | $34,028 |
Occupancy by Householder Income Bracket in Attapulgus
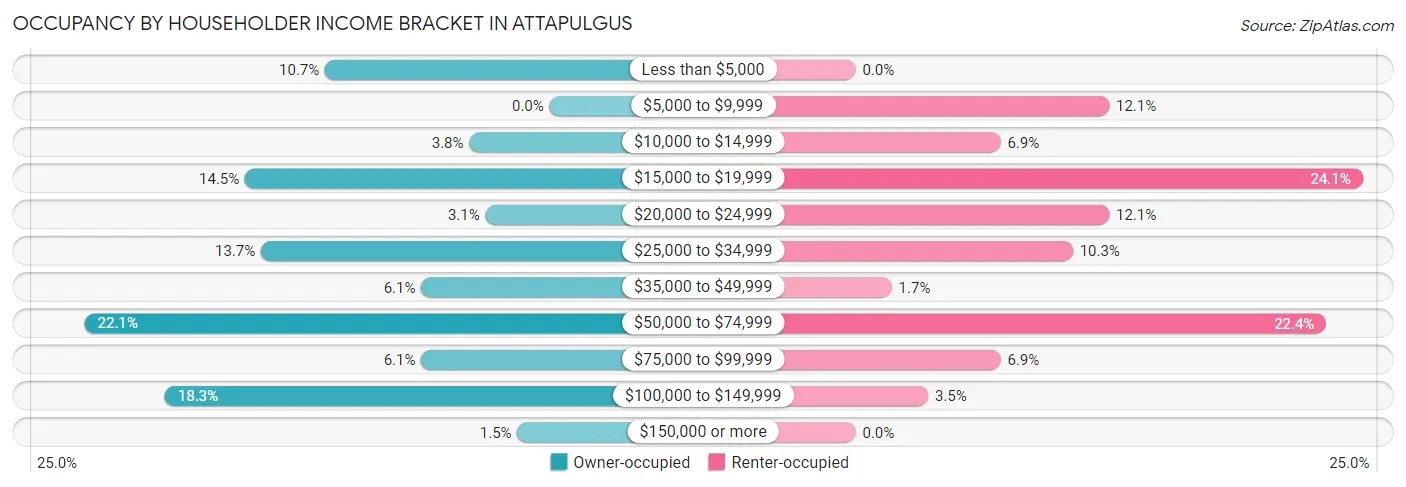
| Income Bracket | Owner-occupied | Renter-occupied |
| Less than $5,000 | 14 (10.7%) | 0 (0.0%) |
| $5,000 to $9,999 | 0 (0.0%) | 7 (12.1%) |
| $10,000 to $14,999 | 5 (3.8%) | 4 (6.9%) |
| $15,000 to $19,999 | 19 (14.5%) | 14 (24.1%) |
| $20,000 to $24,999 | 4 (3.0%) | 7 (12.1%) |
| $25,000 to $34,999 | 18 (13.7%) | 6 (10.3%) |
| $35,000 to $49,999 | 8 (6.1%) | 1 (1.7%) |
| $50,000 to $74,999 | 29 (22.1%) | 13 (22.4%) |
| $75,000 to $99,999 | 8 (6.1%) | 4 (6.9%) |
| $100,000 to $149,999 | 24 (18.3%) | 2 (3.5%) |
| $150,000 or more | 2 (1.5%) | 0 (0.0%) |
| Total | 131 (100.0%) | 58 (100.0%) |
Monthly Housing Cost Tiers in Attapulgus
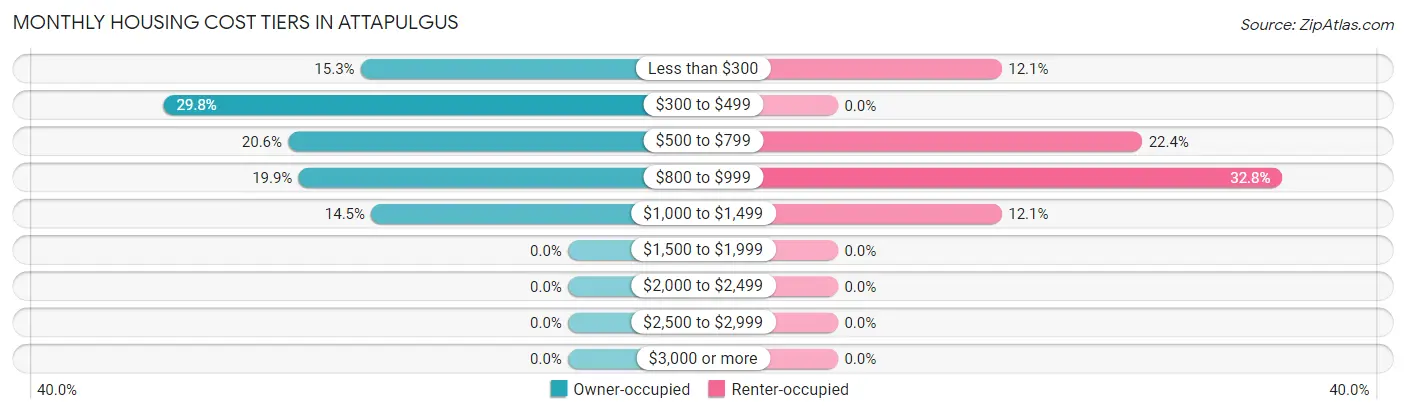
| Monthly Cost | Owner-occupied | Renter-occupied |
| Less than $300 | 20 (15.3%) | 7 (12.1%) |
| $300 to $499 | 39 (29.8%) | 0 (0.0%) |
| $500 to $799 | 27 (20.6%) | 13 (22.4%) |
| $800 to $999 | 26 (19.9%) | 19 (32.8%) |
| $1,000 to $1,499 | 19 (14.5%) | 7 (12.1%) |
| $1,500 to $1,999 | 0 (0.0%) | 0 (0.0%) |
| $2,000 to $2,499 | 0 (0.0%) | 0 (0.0%) |
| $2,500 to $2,999 | 0 (0.0%) | 0 (0.0%) |
| $3,000 or more | 0 (0.0%) | 0 (0.0%) |
| Total | 131 (100.0%) | 58 (100.0%) |
Physical Housing Characteristics in Attapulgus
Housing Structures in Attapulgus
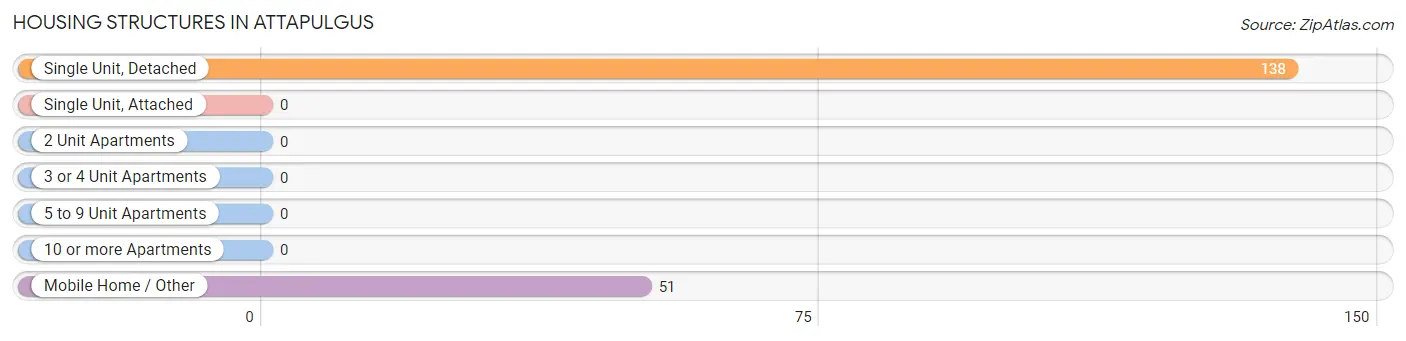
| Structure Type | # Housing Units | % Housing Units |
| Single Unit, Detached | 138 | 73.0% |
| Single Unit, Attached | 0 | 0.0% |
| 2 Unit Apartments | 0 | 0.0% |
| 3 or 4 Unit Apartments | 0 | 0.0% |
| 5 to 9 Unit Apartments | 0 | 0.0% |
| 10 or more Apartments | 0 | 0.0% |
| Mobile Home / Other | 51 | 27.0% |
| Total | 189 | 100.0% |
Housing Structures by Occupancy in Attapulgus
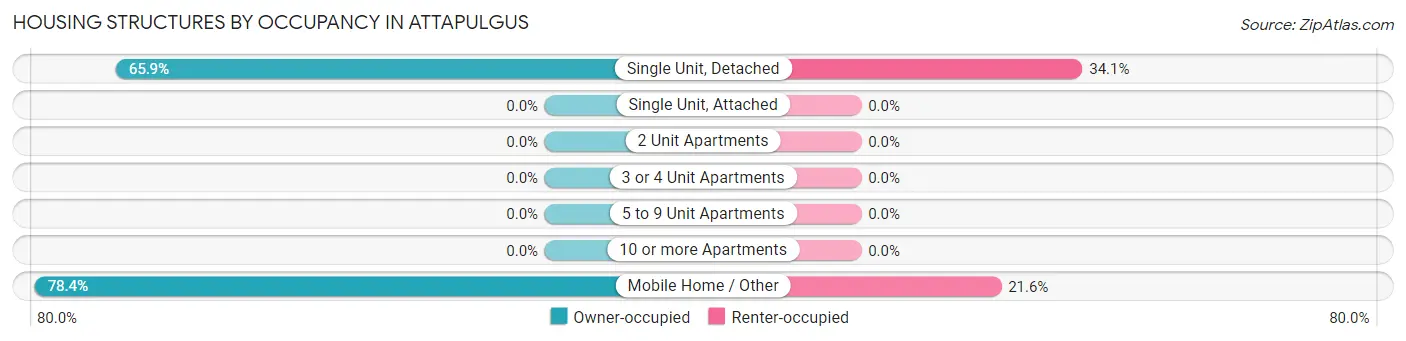
| Structure Type | Owner-occupied | Renter-occupied |
| Single Unit, Detached | 91 (65.9%) | 47 (34.1%) |
| Single Unit, Attached | 0 (0.0%) | 0 (0.0%) |
| 2 Unit Apartments | 0 (0.0%) | 0 (0.0%) |
| 3 or 4 Unit Apartments | 0 (0.0%) | 0 (0.0%) |
| 5 to 9 Unit Apartments | 0 (0.0%) | 0 (0.0%) |
| 10 or more Apartments | 0 (0.0%) | 0 (0.0%) |
| Mobile Home / Other | 40 (78.4%) | 11 (21.6%) |
| Total | 131 (69.3%) | 58 (30.7%) |
Housing Structures by Number of Rooms in Attapulgus
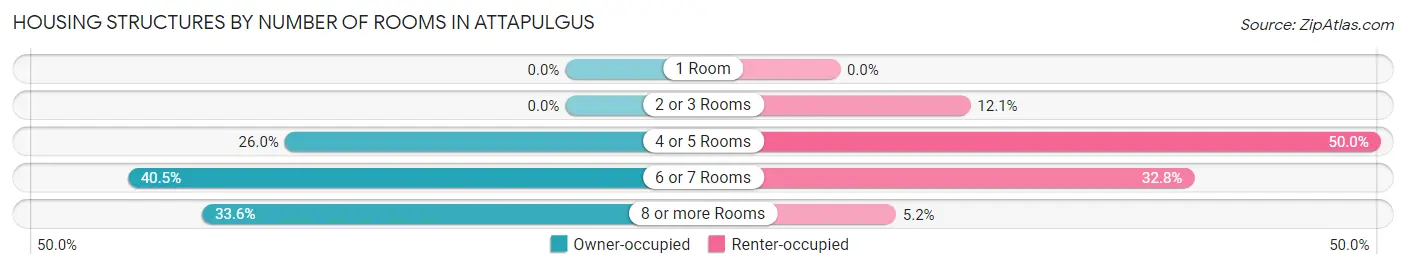
| Number of Rooms | Owner-occupied | Renter-occupied |
| 1 Room | 0 (0.0%) | 0 (0.0%) |
| 2 or 3 Rooms | 0 (0.0%) | 7 (12.1%) |
| 4 or 5 Rooms | 34 (26.0%) | 29 (50.0%) |
| 6 or 7 Rooms | 53 (40.5%) | 19 (32.8%) |
| 8 or more Rooms | 44 (33.6%) | 3 (5.2%) |
| Total | 131 (100.0%) | 58 (100.0%) |
Housing Structure by Heating Type in Attapulgus
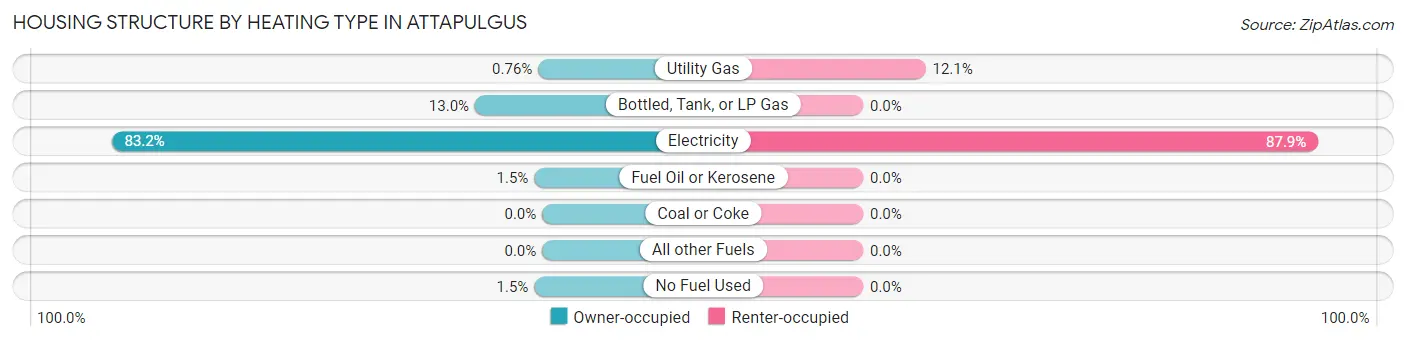
| Heating Type | Owner-occupied | Renter-occupied |
| Utility Gas | 1 (0.8%) | 7 (12.1%) |
| Bottled, Tank, or LP Gas | 17 (13.0%) | 0 (0.0%) |
| Electricity | 109 (83.2%) | 51 (87.9%) |
| Fuel Oil or Kerosene | 2 (1.5%) | 0 (0.0%) |
| Coal or Coke | 0 (0.0%) | 0 (0.0%) |
| All other Fuels | 0 (0.0%) | 0 (0.0%) |
| No Fuel Used | 2 (1.5%) | 0 (0.0%) |
| Total | 131 (100.0%) | 58 (100.0%) |
Household Vehicle Usage in Attapulgus
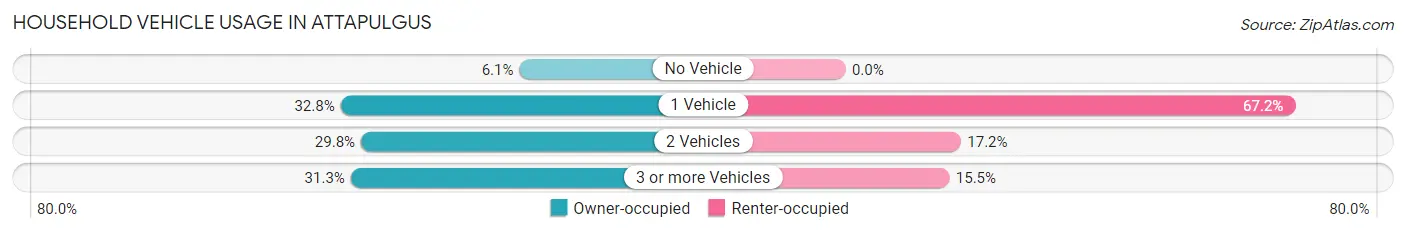
| Vehicles per Household | Owner-occupied | Renter-occupied |
| No Vehicle | 8 (6.1%) | 0 (0.0%) |
| 1 Vehicle | 43 (32.8%) | 39 (67.2%) |
| 2 Vehicles | 39 (29.8%) | 10 (17.2%) |
| 3 or more Vehicles | 41 (31.3%) | 9 (15.5%) |
| Total | 131 (100.0%) | 58 (100.0%) |
Real Estate & Mortgages in Attapulgus
Real Estate and Mortgage Overview in Attapulgus
| Characteristic | Without Mortgage | With Mortgage |
| Housing Units | 73 | 58 |
| Median Property Value | $59,300 | $75,700 |
| Median Household Income | $30,417 | $0 |
| Monthly Housing Costs | $408 | $0 |
| Real Estate Taxes | $377 | $0 |
Property Value by Mortgage Status in Attapulgus
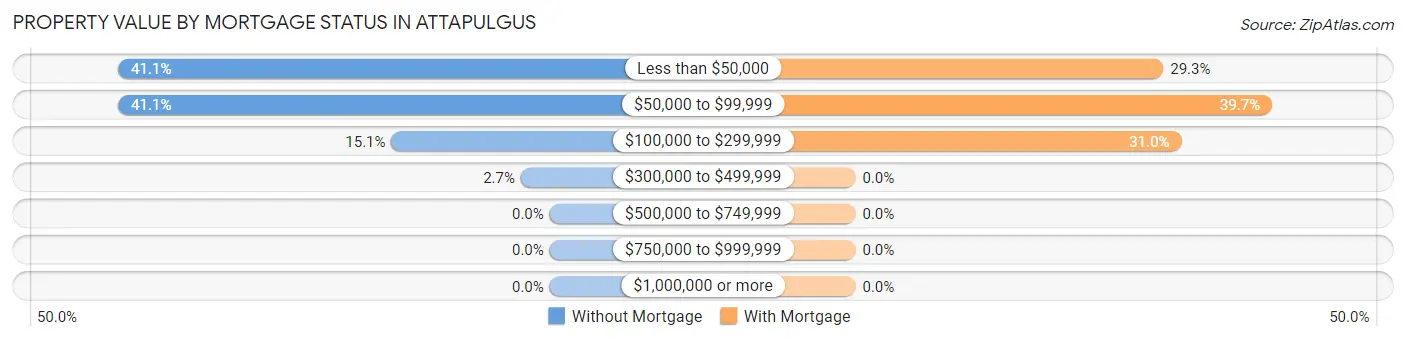
| Property Value | Without Mortgage | With Mortgage |
| Less than $50,000 | 30 (41.1%) | 17 (29.3%) |
| $50,000 to $99,999 | 30 (41.1%) | 23 (39.7%) |
| $100,000 to $299,999 | 11 (15.1%) | 18 (31.0%) |
| $300,000 to $499,999 | 2 (2.7%) | 0 (0.0%) |
| $500,000 to $749,999 | 0 (0.0%) | 0 (0.0%) |
| $750,000 to $999,999 | 0 (0.0%) | 0 (0.0%) |
| $1,000,000 or more | 0 (0.0%) | 0 (0.0%) |
| Total | 73 (100.0%) | 58 (100.0%) |
Household Income by Mortgage Status in Attapulgus
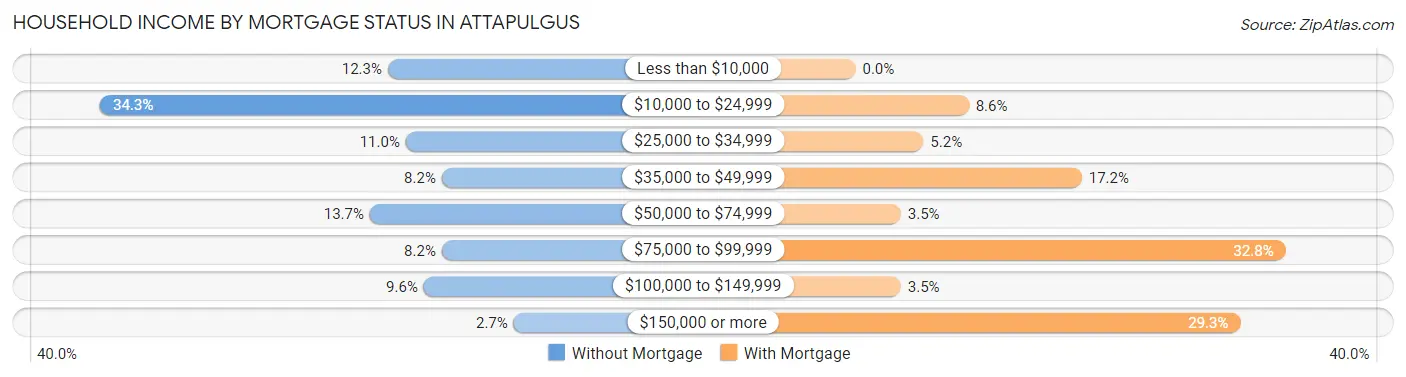
| Household Income | Without Mortgage | With Mortgage |
| Less than $10,000 | 9 (12.3%) | 0 (0.0%) |
| $10,000 to $24,999 | 25 (34.3%) | 5 (8.6%) |
| $25,000 to $34,999 | 8 (11.0%) | 3 (5.2%) |
| $35,000 to $49,999 | 6 (8.2%) | 10 (17.2%) |
| $50,000 to $74,999 | 10 (13.7%) | 2 (3.5%) |
| $75,000 to $99,999 | 6 (8.2%) | 19 (32.8%) |
| $100,000 to $149,999 | 7 (9.6%) | 2 (3.5%) |
| $150,000 or more | 2 (2.7%) | 17 (29.3%) |
| Total | 73 (100.0%) | 58 (100.0%) |
Property Value to Household Income Ratio in Attapulgus
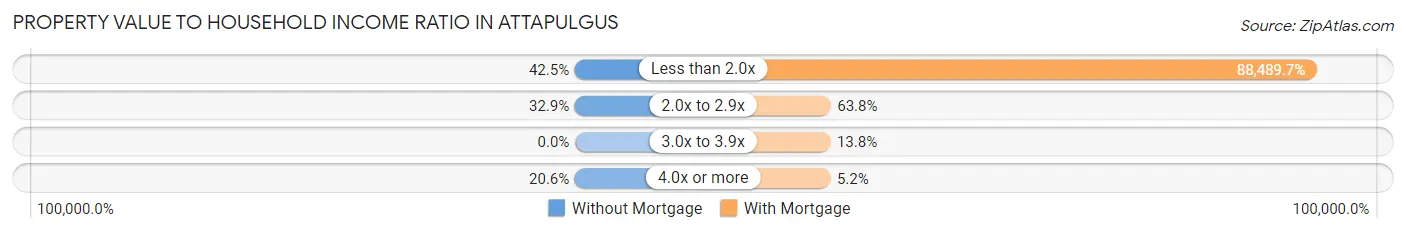
| Value-to-Income Ratio | Without Mortgage | With Mortgage |
| Less than 2.0x | 31 (42.5%) | 51,324 (88,489.7%) |
| 2.0x to 2.9x | 24 (32.9%) | 37 (63.8%) |
| 3.0x to 3.9x | 0 (0.0%) | 8 (13.8%) |
| 4.0x or more | 15 (20.5%) | 3 (5.2%) |
| Total | 73 (100.0%) | 58 (100.0%) |
Real Estate Taxes by Mortgage Status in Attapulgus
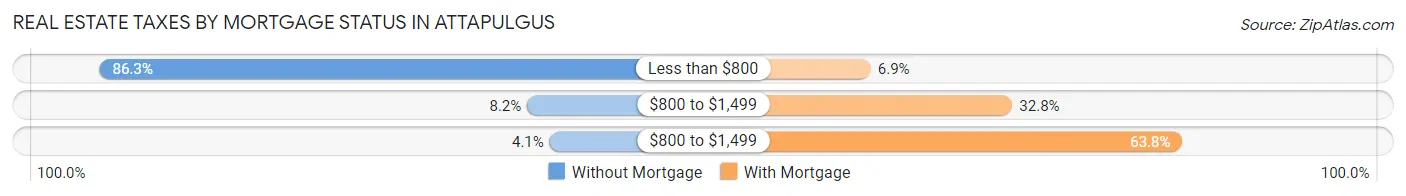
| Property Taxes | Without Mortgage | With Mortgage |
| Less than $800 | 63 (86.3%) | 4 (6.9%) |
| $800 to $1,499 | 6 (8.2%) | 19 (32.8%) |
| $800 to $1,499 | 3 (4.1%) | 37 (63.8%) |
| Total | 73 (100.0%) | 58 (100.0%) |
Health & Disability in Attapulgus
Health Insurance Coverage by Age in Attapulgus
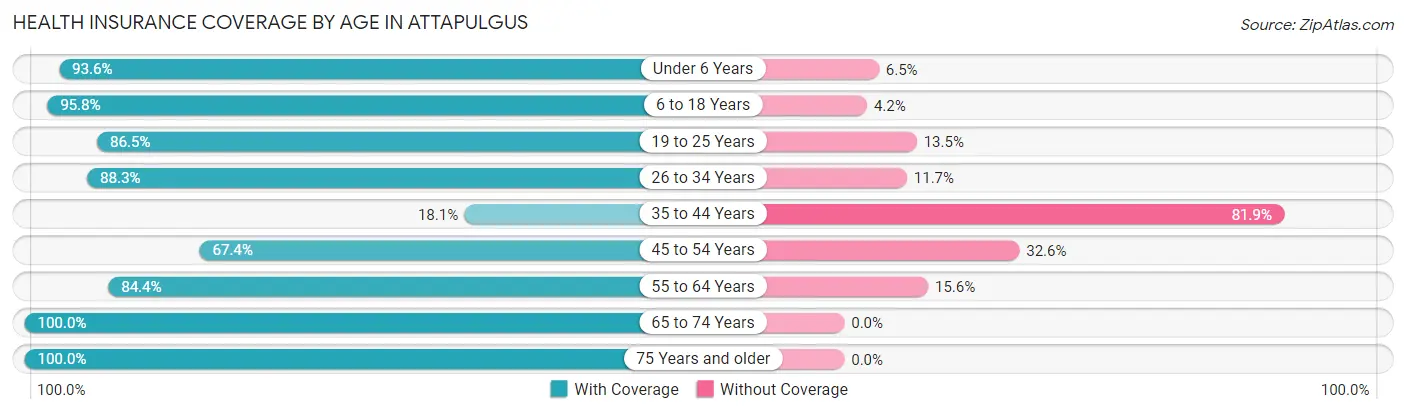
| Age Bracket | With Coverage | Without Coverage |
| Under 6 Years | 29 (93.5%) | 2 (6.5%) |
| 6 to 18 Years | 136 (95.8%) | 6 (4.2%) |
| 19 to 25 Years | 96 (86.5%) | 15 (13.5%) |
| 26 to 34 Years | 53 (88.3%) | 7 (11.7%) |
| 35 to 44 Years | 26 (18.1%) | 118 (81.9%) |
| 45 to 54 Years | 64 (67.4%) | 31 (32.6%) |
| 55 to 64 Years | 54 (84.4%) | 10 (15.6%) |
| 65 to 74 Years | 38 (100.0%) | 0 (0.0%) |
| 75 Years and older | 30 (100.0%) | 0 (0.0%) |
| Total | 526 (73.6%) | 189 (26.4%) |
Health Insurance Coverage by Citizenship Status in Attapulgus
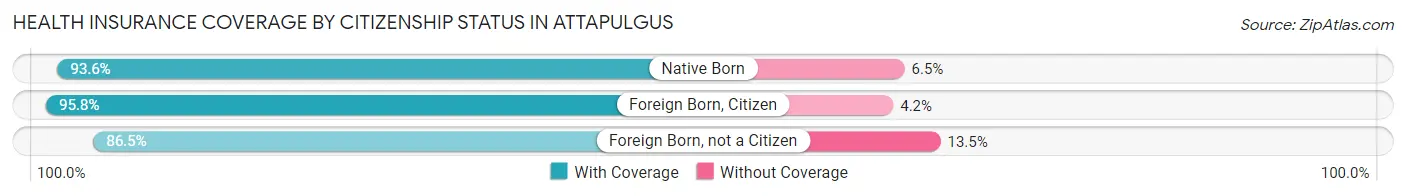
| Citizenship Status | With Coverage | Without Coverage |
| Native Born | 29 (93.5%) | 2 (6.5%) |
| Foreign Born, Citizen | 136 (95.8%) | 6 (4.2%) |
| Foreign Born, not a Citizen | 96 (86.5%) | 15 (13.5%) |
Health Insurance Coverage by Household Income in Attapulgus
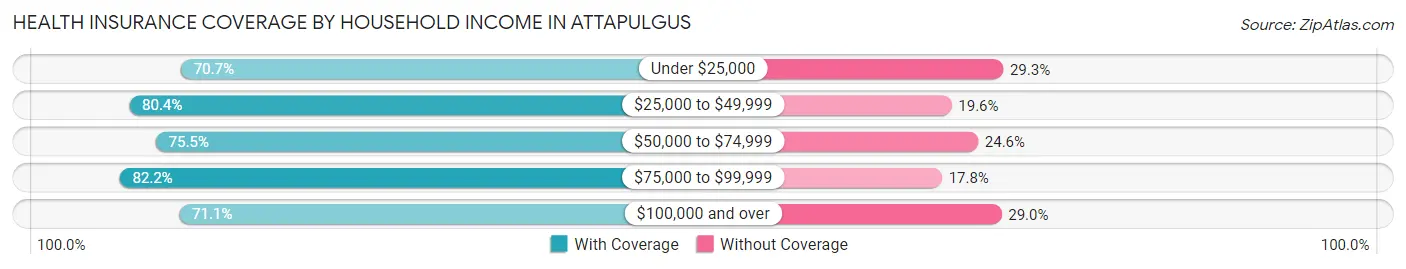
| Household Income | With Coverage | Without Coverage |
| Under $25,000 | 220 (70.7%) | 91 (29.3%) |
| $25,000 to $49,999 | 78 (80.4%) | 19 (19.6%) |
| $50,000 to $74,999 | 83 (75.4%) | 27 (24.5%) |
| $75,000 to $99,999 | 37 (82.2%) | 8 (17.8%) |
| $100,000 and over | 108 (71.1%) | 44 (28.9%) |
Public vs Private Health Insurance Coverage by Age in Attapulgus
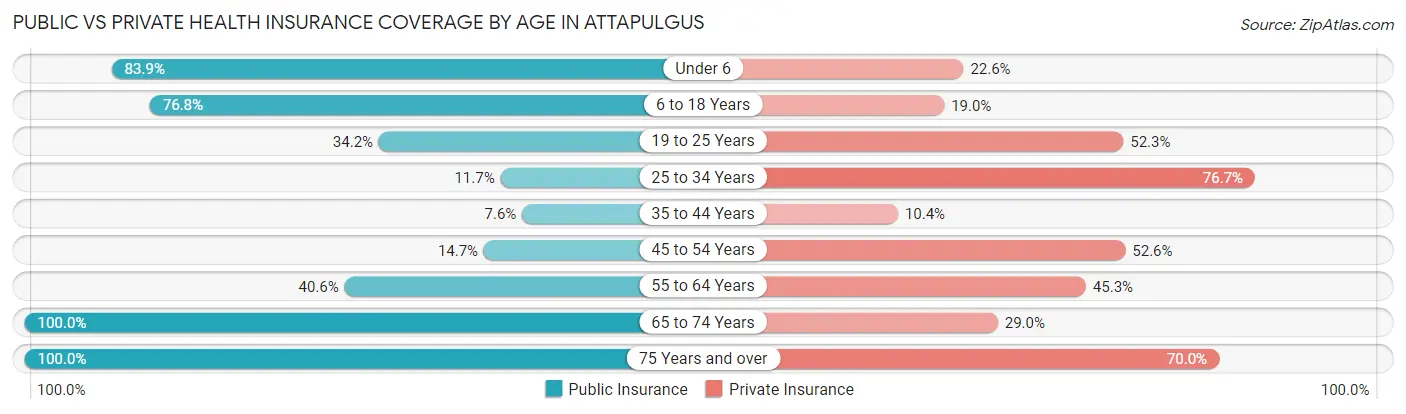
| Age Bracket | Public Insurance | Private Insurance |
| Under 6 | 26 (83.9%) | 7 (22.6%) |
| 6 to 18 Years | 109 (76.8%) | 27 (19.0%) |
| 19 to 25 Years | 38 (34.2%) | 58 (52.2%) |
| 25 to 34 Years | 7 (11.7%) | 46 (76.7%) |
| 35 to 44 Years | 11 (7.6%) | 15 (10.4%) |
| 45 to 54 Years | 14 (14.7%) | 50 (52.6%) |
| 55 to 64 Years | 26 (40.6%) | 29 (45.3%) |
| 65 to 74 Years | 38 (100.0%) | 11 (28.9%) |
| 75 Years and over | 30 (100.0%) | 21 (70.0%) |
| Total | 299 (41.8%) | 264 (36.9%) |
Disability Status by Sex by Age in Attapulgus
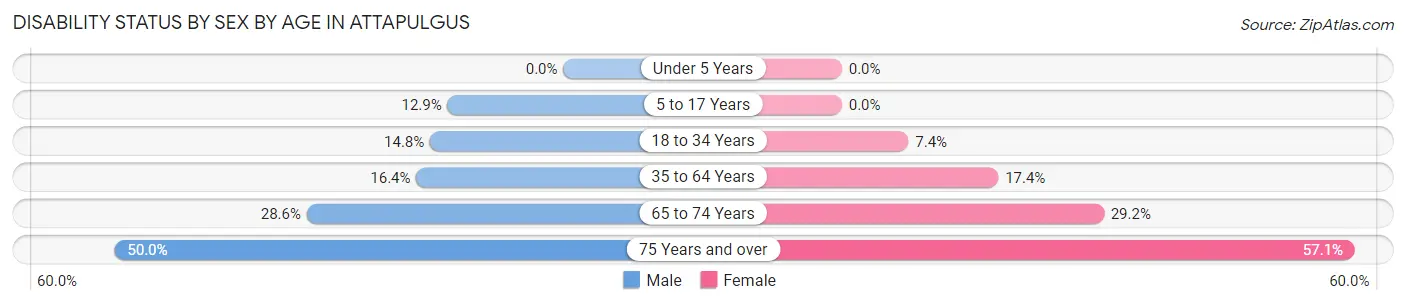
| Age Bracket | Male | Female |
| Under 5 Years | 0 (0.0%) | 0 (0.0%) |
| 5 to 17 Years | 8 (12.9%) | 0 (0.0%) |
| 18 to 34 Years | 23 (14.8%) | 4 (7.4%) |
| 35 to 64 Years | 28 (16.4%) | 23 (17.4%) |
| 65 to 74 Years | 4 (28.6%) | 7 (29.2%) |
| 75 Years and over | 8 (50.0%) | 8 (57.1%) |
Disability Class by Sex by Age in Attapulgus
Disability Class: Hearing Difficulty
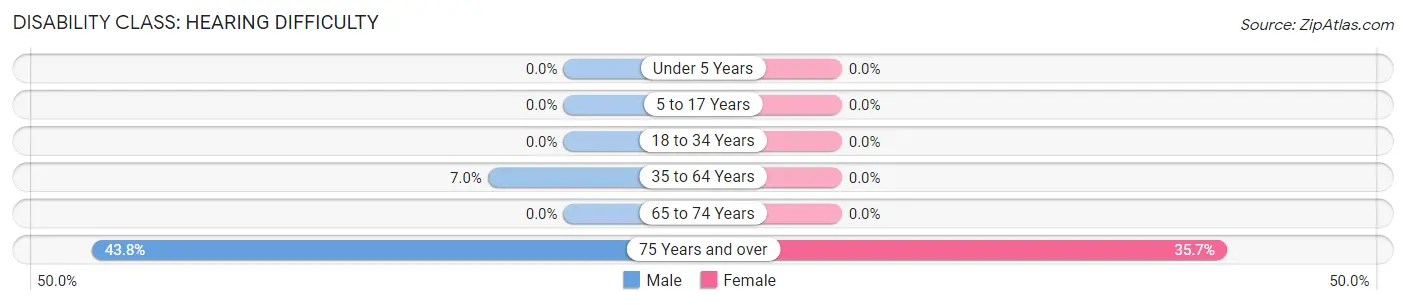
| Age Bracket | Male | Female |
| Under 5 Years | 0 (0.0%) | 0 (0.0%) |
| 5 to 17 Years | 0 (0.0%) | 0 (0.0%) |
| 18 to 34 Years | 0 (0.0%) | 0 (0.0%) |
| 35 to 64 Years | 12 (7.0%) | 0 (0.0%) |
| 65 to 74 Years | 0 (0.0%) | 0 (0.0%) |
| 75 Years and over | 7 (43.8%) | 5 (35.7%) |
Disability Class: Vision Difficulty
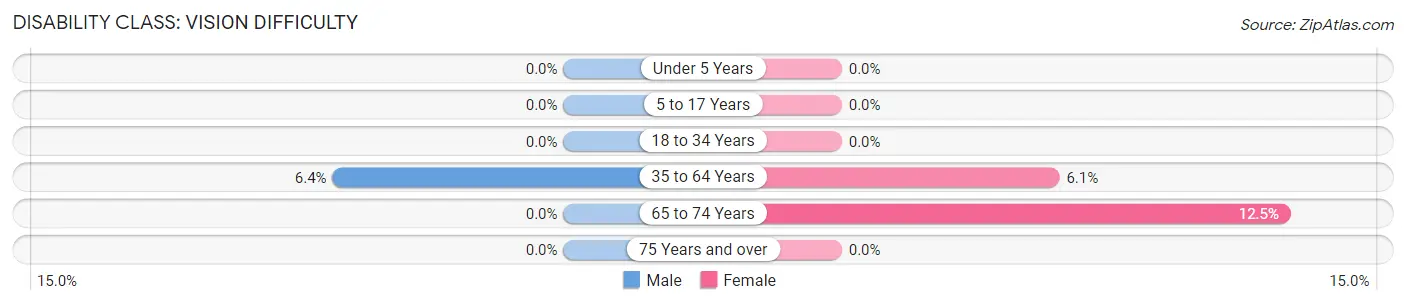
| Age Bracket | Male | Female |
| Under 5 Years | 0 (0.0%) | 0 (0.0%) |
| 5 to 17 Years | 0 (0.0%) | 0 (0.0%) |
| 18 to 34 Years | 0 (0.0%) | 0 (0.0%) |
| 35 to 64 Years | 11 (6.4%) | 8 (6.1%) |
| 65 to 74 Years | 0 (0.0%) | 3 (12.5%) |
| 75 Years and over | 0 (0.0%) | 0 (0.0%) |
Disability Class: Cognitive Difficulty
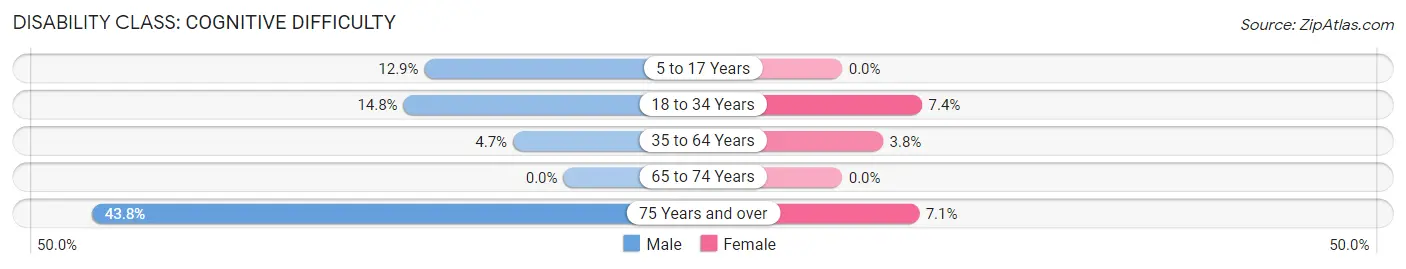
| Age Bracket | Male | Female |
| 5 to 17 Years | 8 (12.9%) | 0 (0.0%) |
| 18 to 34 Years | 23 (14.8%) | 4 (7.4%) |
| 35 to 64 Years | 8 (4.7%) | 5 (3.8%) |
| 65 to 74 Years | 0 (0.0%) | 0 (0.0%) |
| 75 Years and over | 7 (43.8%) | 1 (7.1%) |
Disability Class: Ambulatory Difficulty
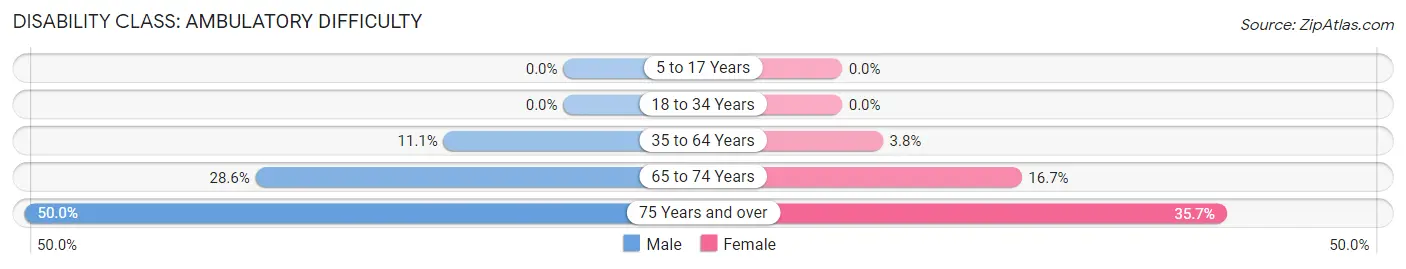
| Age Bracket | Male | Female |
| 5 to 17 Years | 0 (0.0%) | 0 (0.0%) |
| 18 to 34 Years | 0 (0.0%) | 0 (0.0%) |
| 35 to 64 Years | 19 (11.1%) | 5 (3.8%) |
| 65 to 74 Years | 4 (28.6%) | 4 (16.7%) |
| 75 Years and over | 8 (50.0%) | 5 (35.7%) |
Disability Class: Self-Care Difficulty
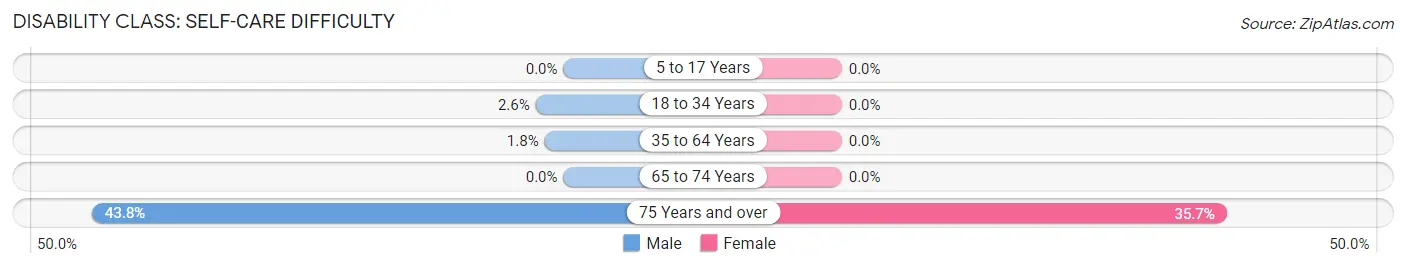
| Age Bracket | Male | Female |
| 5 to 17 Years | 0 (0.0%) | 0 (0.0%) |
| 18 to 34 Years | 4 (2.6%) | 0 (0.0%) |
| 35 to 64 Years | 3 (1.8%) | 0 (0.0%) |
| 65 to 74 Years | 0 (0.0%) | 0 (0.0%) |
| 75 Years and over | 7 (43.8%) | 5 (35.7%) |
Technology Access in Attapulgus
Computing Device Access in Attapulgus
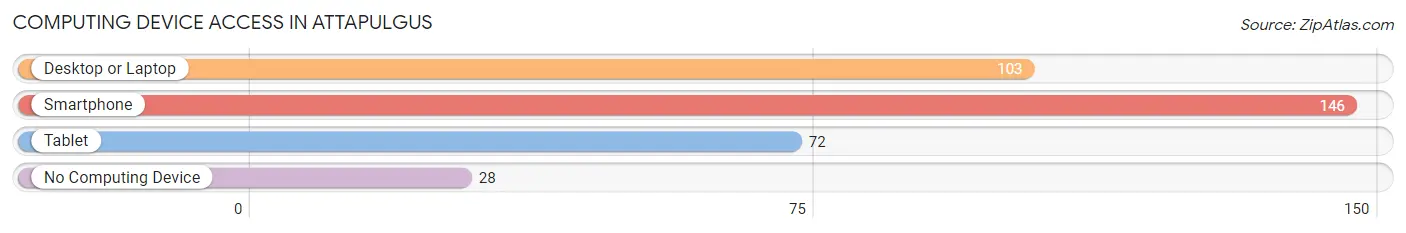
| Device Type | # Households | % Households |
| Desktop or Laptop | 103 | 54.5% |
| Smartphone | 146 | 77.2% |
| Tablet | 72 | 38.1% |
| No Computing Device | 28 | 14.8% |
| Total | 189 | 100.0% |
Internet Access in Attapulgus
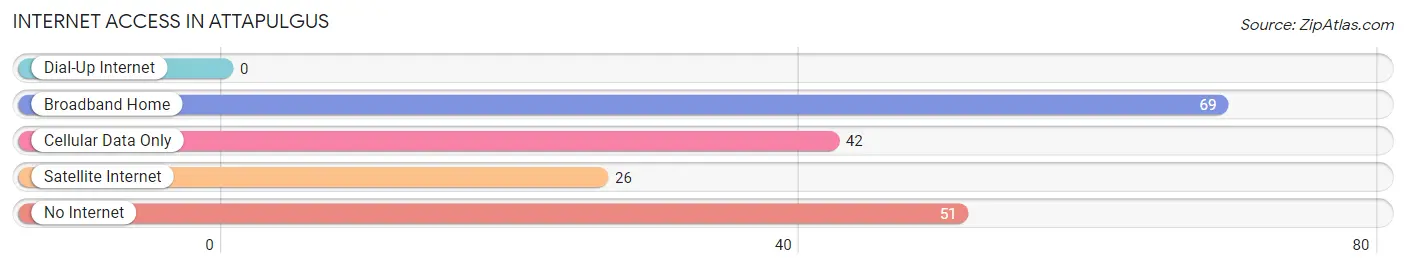
| Internet Type | # Households | % Households |
| Dial-Up Internet | 0 | 0.0% |
| Broadband Home | 69 | 36.5% |
| Cellular Data Only | 42 | 22.2% |
| Satellite Internet | 26 | 13.8% |
| No Internet | 51 | 27.0% |
| Total | 189 | 100.0% |
Attapulgus Summary
Attapulgus is a small town located in Decatur County, Georgia, United States. It is situated on the banks of the Flint River, about 20 miles north of the state capital, Atlanta. The town was founded in 1820 and was named after the Attapulgus Creek, which flows through the area. As of the 2010 census, the population of Attapulgus was 545.
History
Attapulgus was founded in 1820 by settlers from North Carolina. The town was named after the Attapulgus Creek, which flows through the area. The creek was named after the Attapulgus Indians, who were a Native American tribe that lived in the area. The town was originally a farming community, but it soon became a center for the production of turpentine and naval stores. The town was also home to a number of sawmills and gristmills.
In the late 19th century, Attapulgus was a thriving community with a population of over 1,000. The town had several stores, a hotel, a bank, a post office, and a number of churches. The town also had a railroad station, which connected it to the rest of the state.
In the early 20th century, the turpentine and naval stores industry began to decline, and the population of Attapulgus began to decline as well. By the 1950s, the population had dropped to just over 500. The town has remained relatively unchanged since then, and the population has remained steady at around 500.
Geography
Attapulgus is located in Decatur County, Georgia, at the intersection of US Highway 84 and Georgia State Route 37. The town is situated on the banks of the Flint River, about 20 miles north of the state capital, Atlanta. The town has a total area of 1.2 square miles, all of which is land.
Economy
The economy of Attapulgus is largely based on agriculture. The town is home to several farms, which produce a variety of crops, including cotton, corn, soybeans, and peanuts. The town also has a number of small businesses, including a grocery store, a hardware store, and a few restaurants.
Demographics
As of the 2010 census, there were 545 people living in Attapulgus. The racial makeup of the town was 79.3% White, 17.3% African American, 0.2% Native American, 0.2% Asian, and 3.0% from other races. The median household income was $30,000, and the median family income was $35,000. The per capita income was $14,000. About 18.2% of the population was below the poverty line.
Common Questions
What is the Total Population of Attapulgus?
Total Population of Attapulgus is 715.
What is the Total Male Population of Attapulgus?
Total Male Population of Attapulgus is 429.
What is the Total Female Population of Attapulgus?
Total Female Population of Attapulgus is 286.
What is the Ratio of Males per 100 Females in Attapulgus?
There are 150.00 Males per 100 Females in Attapulgus.
What is the Ratio of Females per 100 Males in Attapulgus?
There are 66.67 Females per 100 Males in Attapulgus.
What is the Median Population Age in Attapulgus?
Median Population Age in Attapulgus is 35.3 Years.
What is the Average Family Size in Attapulgus
Average Family Size in Attapulgus is 5.0 People.
What is the Average Household Size in Attapulgus
Average Household Size in Attapulgus is 3.8 People.
What is Per Capita Income in Attapulgus?
Per Capita income in Attapulgus is $17,573.
What is the Median Family Income in Attapulgus?
Median Family Income in Attapulgus is $34,286.
What is the Median Household income in Attapulgus?
Median Household Income in Attapulgus is $34,028.
What is Family Income Deficit in Attapulgus?
Family Income Deficit in Attapulgus is $11,606.
Families that are below poverty line in Attapulgus earn $11,606 less on average than the poverty threshold level.
What is Inequality or Gini Index in Attapulgus?
Inequality or Gini Index in Attapulgus is 0.45.
How Large is the Labor Force in Attapulgus?
There are 362 People in the Labor Forcein in Attapulgus.
What is the Percentage of People in the Labor Force in Attapulgus?
59.2% of People are in the Labor Force in Attapulgus.
What is the Unemployment Rate in Attapulgus?
Unemployment Rate in Attapulgus is 1.7%.