Cities with the Highest Poverty Level Among Families in Delaware
RELATED REPORTS & OPTIONS
Highest Family Poverty
Delaware
Compare Cities
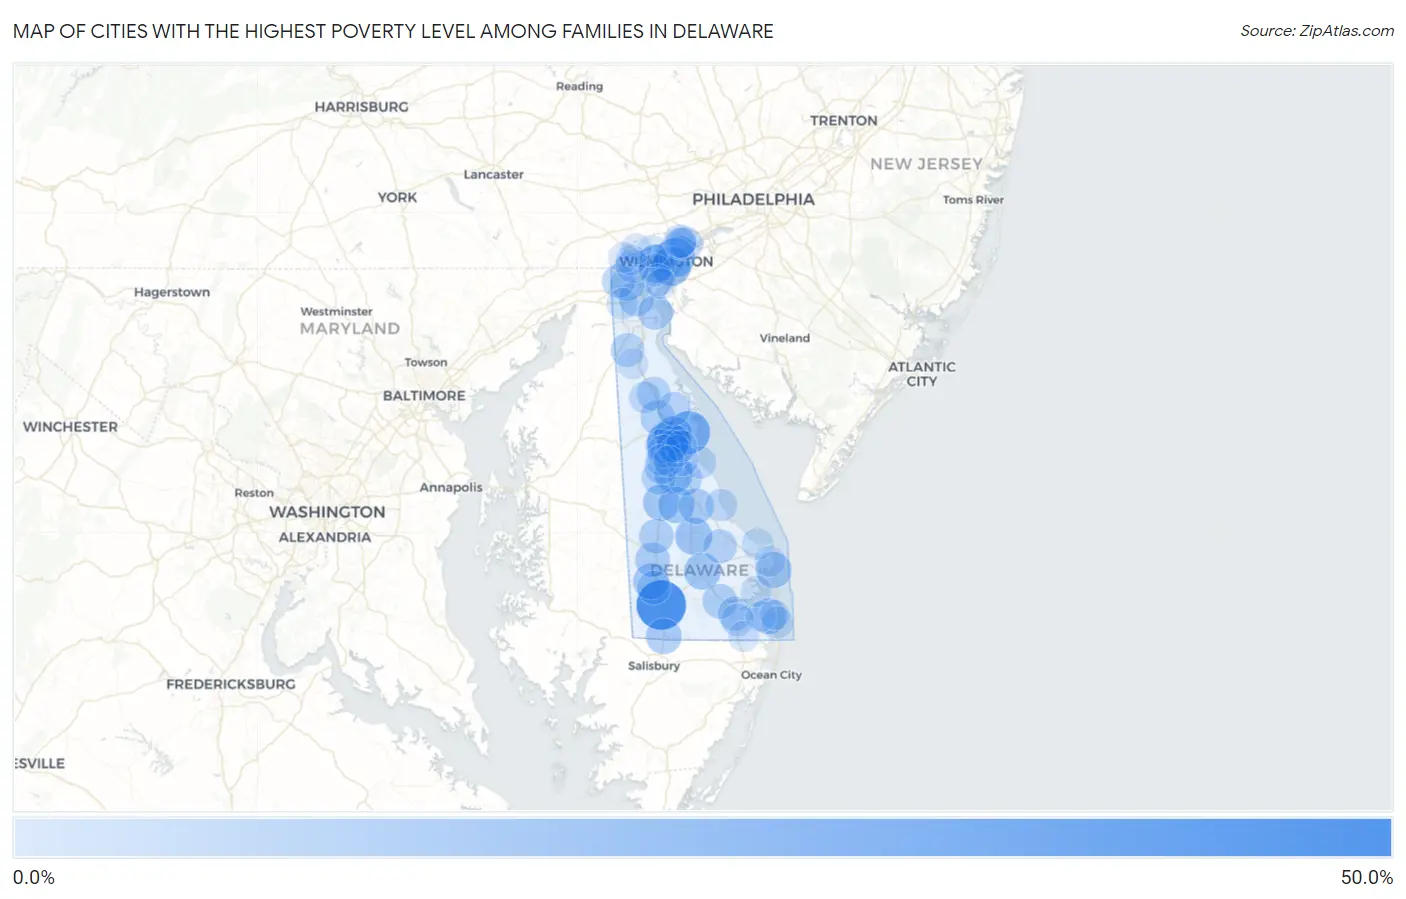
Map of Cities with the Highest Poverty Level Among Families in Delaware
0.0%
50.0%
Cities with the Highest Poverty Level Among Families in Delaware
| City | Family Poverty | vs State | vs National | |
| 1. | Laurel | 42.9% | 7.5%(+35.4)#1 | 8.8%(+34.1)#997 |
| 2. | Little Creek | 27.7% | 7.5%(+20.2)#2 | 8.8%(+18.9)#2,633 |
| 3. | Rodney Village | 24.1% | 7.5%(+16.6)#3 | 8.8%(+15.3)#3,480 |
| 4. | Edgemoor | 20.2% | 7.5%(+12.6)#4 | 8.8%(+11.4)#4,771 |
| 5. | Wilmington | 19.7% | 7.5%(+12.2)#5 | 8.8%(+10.9)#4,997 |
| 6. | Elsmere | 18.1% | 7.5%(+10.6)#6 | 8.8%(+9.33)#5,715 |
| 7. | Riverview | 17.1% | 7.5%(+9.63)#7 | 8.8%(+8.35)#6,204 |
| 8. | Dover | 16.3% | 7.5%(+8.77)#8 | 8.8%(+7.50)#6,682 |
| 9. | Ellendale | 15.1% | 7.5%(+7.60)#9 | 8.8%(+6.33)#7,381 |
| 10. | Georgetown | 14.3% | 7.5%(+6.83)#10 | 8.8%(+5.56)#7,903 |
| 11. | Harrington | 13.7% | 7.5%(+6.15)#11 | 8.8%(+4.88)#8,448 |
| 12. | Houston | 13.5% | 7.5%(+5.96)#12 | 8.8%(+4.68)#8,588 |
| 13. | Seaford | 12.9% | 7.5%(+5.41)#13 | 8.8%(+4.13)#9,039 |
| 14. | Ocean View | 12.9% | 7.5%(+5.38)#14 | 8.8%(+4.10)#9,067 |
| 15. | Dewey Beach | 12.4% | 7.5%(+4.89)#15 | 8.8%(+3.62)#9,453 |
| 16. | Delmar | 12.0% | 7.5%(+4.50)#16 | 8.8%(+3.22)#9,785 |
| 17. | Kent Acres | 11.8% | 7.5%(+4.27)#17 | 8.8%(+3.00)#9,989 |
| 18. | Milford | 11.4% | 7.5%(+3.86)#18 | 8.8%(+2.58)#10,395 |
| 19. | Bridgeville | 10.5% | 7.5%(+2.95)#19 | 8.8%(+1.67)#11,297 |
| 20. | Greenwood | 9.9% | 7.5%(+2.43)#20 | 8.8%(+1.15)#11,850 |
| 21. | Millsboro | 9.9% | 7.5%(+2.40)#21 | 8.8%(+1.13)#11,875 |
| 22. | Bear | 9.8% | 7.5%(+2.33)#22 | 8.8%(+1.05)#11,963 |
| 23. | Cheswold | 9.7% | 7.5%(+2.15)#23 | 8.8%(+0.872)#12,195 |
| 24. | Delaware City | 9.1% | 7.5%(+1.59)#24 | 8.8%(+0.309)#12,778 |
| 25. | Dagsboro | 8.9% | 7.5%(+1.44)#25 | 8.8%(+0.164)#12,975 |
| 26. | Brookside | 8.9% | 7.5%(+1.43)#26 | 8.8%(+0.151)#12,990 |
| 27. | Felton | 8.6% | 7.5%(+1.14)#27 | 8.8%(-0.140)#13,320 |
| 28. | Smyrna | 8.2% | 7.5%(+0.707)#28 | 8.8%(-0.570)#13,888 |
| 29. | Frederica | 8.2% | 7.5%(+0.650)#29 | 8.8%(-0.627)#13,975 |
| 30. | Wyoming | 8.1% | 7.5%(+0.637)#30 | 8.8%(-0.640)#13,982 |
| 31. | Blades | 7.9% | 7.5%(+0.437)#31 | 8.8%(-0.839)#14,230 |
| 32. | Milton | 7.9% | 7.5%(+0.410)#32 | 8.8%(-0.867)#14,269 |
| 33. | Leipsic | 7.9% | 7.5%(+0.390)#33 | 8.8%(-0.887)#14,297 |
| 34. | Middletown | 7.6% | 7.5%(+0.095)#34 | 8.8%(-1.18)#14,693 |
| 35. | Viola | 7.4% | 7.5%(-0.097)#35 | 8.8%(-1.37)#14,945 |
| 36. | Newark | 7.4% | 7.5%(-0.133)#36 | 8.8%(-1.41)#14,984 |
| 37. | Pike Creek Valley | 7.2% | 7.5%(-0.321)#37 | 8.8%(-1.60)#15,251 |
| 38. | Claymont | 7.2% | 7.5%(-0.341)#38 | 8.8%(-1.62)#15,265 |
| 39. | Arden | 6.1% | 7.5%(-1.36)#39 | 8.8%(-2.64)#16,719 |
| 40. | Camden | 5.9% | 7.5%(-1.58)#40 | 8.8%(-2.86)#17,032 |
| 41. | Frankford | 5.7% | 7.5%(-1.81)#41 | 8.8%(-3.08)#17,382 |
| 42. | Bowers | 4.9% | 7.5%(-2.60)#42 | 8.8%(-3.88)#18,634 |
| 43. | Newport | 4.7% | 7.5%(-2.80)#43 | 8.8%(-4.08)#18,910 |
| 44. | Slaughter Beach | 4.5% | 7.5%(-3.03)#44 | 8.8%(-4.30)#19,288 |
| 45. | Wilmington Manor | 4.4% | 7.5%(-3.09)#45 | 8.8%(-4.36)#19,373 |
| 46. | Magnolia | 4.3% | 7.5%(-3.16)#46 | 8.8%(-4.43)#19,473 |
| 47. | Rising Sun Lebanon | 4.3% | 7.5%(-3.23)#47 | 8.8%(-4.51)#19,604 |
| 48. | South Bethany | 4.1% | 7.5%(-3.41)#48 | 8.8%(-4.69)#19,891 |
| 49. | Clayton | 4.0% | 7.5%(-3.50)#49 | 8.8%(-4.77)#20,021 |
| 50. | Lincoln | 3.9% | 7.5%(-3.58)#50 | 8.8%(-4.85)#20,153 |
| 51. | Highland Acres | 3.8% | 7.5%(-3.71)#51 | 8.8%(-4.98)#20,345 |
| 52. | Glasgow | 3.3% | 7.5%(-4.17)#52 | 8.8%(-5.45)#21,095 |
| 53. | Dover Base Housing | 3.3% | 7.5%(-4.25)#53 | 8.8%(-5.53)#21,263 |
| 54. | Lewes | 3.2% | 7.5%(-4.34)#54 | 8.8%(-5.62)#21,393 |
| 55. | Greenville | 3.0% | 7.5%(-4.52)#55 | 8.8%(-5.80)#21,702 |
| 56. | Ardencroft | 2.7% | 7.5%(-4.77)#56 | 8.8%(-6.04)#22,135 |
| 57. | Woodside | 2.6% | 7.5%(-4.87)#57 | 8.8%(-6.15)#22,322 |
| 58. | Long Neck | 2.3% | 7.5%(-5.23)#58 | 8.8%(-6.50)#22,901 |
| 59. | Rehoboth Beach | 2.0% | 7.5%(-5.47)#59 | 8.8%(-6.75)#23,284 |
| 60. | Selbyville | 2.0% | 7.5%(-5.47)#60 | 8.8%(-6.75)#23,290 |
| 61. | Millville | 2.0% | 7.5%(-5.54)#61 | 8.8%(-6.82)#23,382 |
| 62. | Townsend | 1.9% | 7.5%(-5.61)#62 | 8.8%(-6.88)#23,486 |
| 63. | Hockessin | 1.8% | 7.5%(-5.71)#63 | 8.8%(-6.99)#23,643 |
| 64. | Woodside East | 1.7% | 7.5%(-5.76)#64 | 8.8%(-7.03)#23,717 |
| 65. | Pike Creek | 1.5% | 7.5%(-5.96)#65 | 8.8%(-7.23)#24,004 |
| 66. | Ardentown | 1.5% | 7.5%(-6.03)#66 | 8.8%(-7.31)#24,125 |
| 67. | North Star | 1.4% | 7.5%(-6.10)#67 | 8.8%(-7.38)#24,214 |
| 68. | New Castle | 1.3% | 7.5%(-6.22)#68 | 8.8%(-7.50)#24,357 |
| 69. | Bethany Beach | 0.60% | 7.5%(-6.91)#69 | 8.8%(-8.18)#25,069 |
1
Common Questions
What are the Top 10 Cities with the Highest Poverty Level Among Families in Delaware?
Top 10 Cities with the Highest Poverty Level Among Families in Delaware are:
#1
42.9%
#2
27.7%
#3
24.1%
#4
20.2%
#5
19.7%
#6
18.1%
#7
17.1%
#8
16.3%
#9
15.1%
#10
14.3%
What city has the Highest Poverty Level Among Families in Delaware?
Laurel has the Highest Poverty Level Among Families in Delaware with 42.9%.
What is the Poverty Level Among Families in the State of Delaware?
Poverty Level Among Families in Delaware is 7.5%.
What is the Poverty Level Among Families in the United States?
Poverty Level Among Families in the United States is 8.8%.