Brookside, DE
Brookside Map
Brookside Overview
14,331
TOTAL POPULATION
6,656
MALE POPULATION
7,675
FEMALE POPULATION
86.72
MALES / 100 FEMALES
115.31
FEMALES / 100 MALES
34.5
MEDIAN AGE
3.4
AVG FAMILY SIZE
2.6
AVG HOUSEHOLD SIZE
$34,827
PER CAPITA INCOME
$67,958
AVG FAMILY INCOME
$66,485
AVG HOUSEHOLD INCOME
21.6%
WAGE / INCOME GAP [ % ]
78.4¢/ $1
WAGE / INCOME GAP [ $ ]
$10,597
FAMILY INCOME DEFICIT
0.41
INEQUALITY / GINI INDEX
7,818
LABOR FORCE [ PEOPLE ]
68.6%
PERCENT IN LABOR FORCE
4.5%
UNEMPLOYMENT RATE
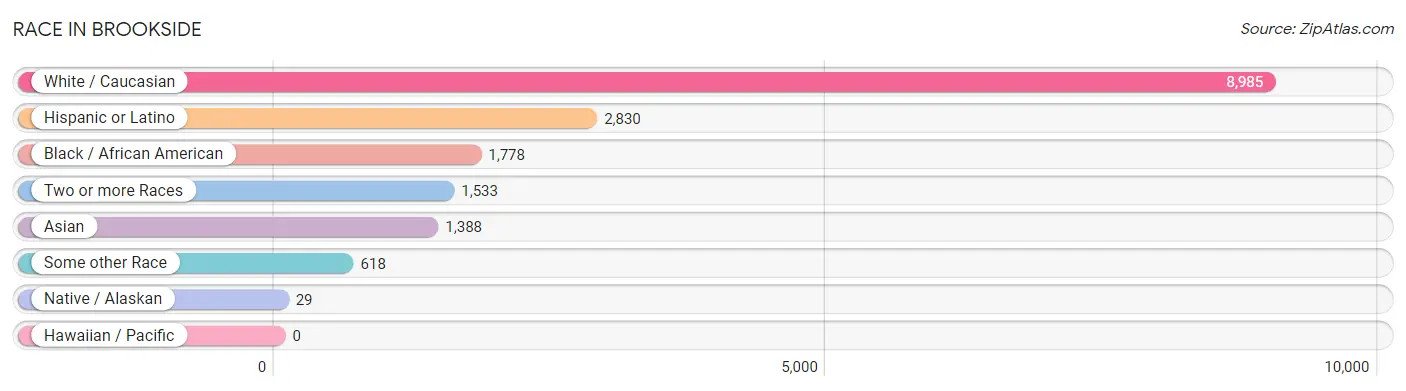
Race in Brookside
The most populous races in Brookside are White / Caucasian (8,985 | 62.7%), Hispanic or Latino (2,830 | 19.8%), and Black / African American (1,778 | 12.4%).
| Race | # Population | % Population |
| Asian | 1,388 | 9.7% |
| Black / African American | 1,778 | 12.4% |
| Hawaiian / Pacific | 0 | 0.0% |
| Hispanic or Latino | 2,830 | 19.8% |
| Native / Alaskan | 29 | 0.2% |
| White / Caucasian | 8,985 | 62.7% |
| Two or more Races | 1,533 | 10.7% |
| Some other Race | 618 | 4.3% |
| Total | 14,331 | 100.0% |
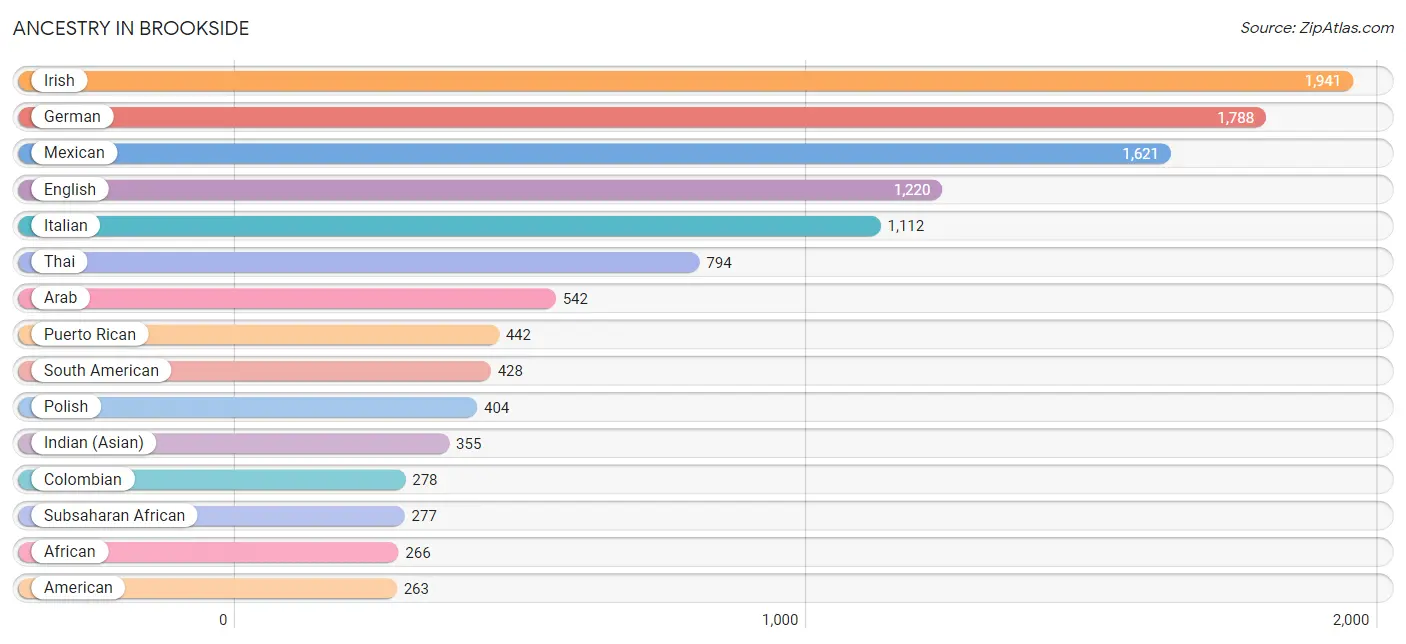
Ancestry in Brookside
The most populous ancestries reported in Brookside are Irish (1,941 | 13.5%), German (1,788 | 12.5%), Mexican (1,621 | 11.3%), English (1,220 | 8.5%), and Italian (1,112 | 7.8%), together accounting for 53.6% of all Brookside residents.
| Ancestry | # Population | % Population |
| Afghan | 5 | 0.0% |
| African | 266 | 1.9% |
| American | 263 | 1.8% |
| Arab | 542 | 3.8% |
| Argentinean | 120 | 0.8% |
| Austrian | 22 | 0.2% |
| Belgian | 18 | 0.1% |
| Blackfeet | 23 | 0.2% |
| British | 71 | 0.5% |
| British West Indian | 38 | 0.3% |
| Bulgarian | 19 | 0.1% |
| Burmese | 95 | 0.7% |
| Celtic | 8 | 0.1% |
| Central American | 101 | 0.7% |
| Central American Indian | 14 | 0.1% |
| Cherokee | 17 | 0.1% |
| Choctaw | 15 | 0.1% |
| Colombian | 278 | 1.9% |
| Costa Rican | 13 | 0.1% |
| Croatian | 54 | 0.4% |
| Danish | 11 | 0.1% |
| Delaware | 7 | 0.1% |
| Dominican | 151 | 1.1% |
| Dutch | 25 | 0.2% |
| Dutch West Indian | 6 | 0.0% |
| Eastern European | 25 | 0.2% |
| Egyptian | 124 | 0.9% |
| English | 1,220 | 8.5% |
| European | 43 | 0.3% |
| French | 170 | 1.2% |
| French Canadian | 51 | 0.4% |
| German | 1,788 | 12.5% |
| Greek | 78 | 0.5% |
| Honduran | 55 | 0.4% |
| Hungarian | 67 | 0.5% |
| Indian (Asian) | 355 | 2.5% |
| Irish | 1,941 | 13.5% |
| Italian | 1,112 | 7.8% |
| Jamaican | 119 | 0.8% |
| Korean | 99 | 0.7% |
| Latvian | 14 | 0.1% |
| Lebanese | 228 | 1.6% |
| Lithuanian | 54 | 0.4% |
| Mexican | 1,621 | 11.3% |
| Moroccan | 22 | 0.2% |
| Navajo | 70 | 0.5% |
| Nigerian | 11 | 0.1% |
| Norwegian | 8 | 0.1% |
| Panamanian | 13 | 0.1% |
| Pennsylvania German | 9 | 0.1% |
| Peruvian | 30 | 0.2% |
| Polish | 404 | 2.8% |
| Puerto Rican | 442 | 3.1% |
| Russian | 12 | 0.1% |
| Salvadoran | 20 | 0.1% |
| Scandinavian | 21 | 0.2% |
| Scotch-Irish | 115 | 0.8% |
| Scottish | 123 | 0.9% |
| Slavic | 6 | 0.0% |
| South American | 428 | 3.0% |
| Spaniard | 8 | 0.1% |
| Spanish | 18 | 0.1% |
| Spanish American | 22 | 0.2% |
| Sri Lankan | 70 | 0.5% |
| Subsaharan African | 277 | 1.9% |
| Swedish | 60 | 0.4% |
| Swiss | 20 | 0.1% |
| Thai | 794 | 5.5% |
| Ukrainian | 29 | 0.2% |
| Welsh | 115 | 0.8% |
| Yugoslavian | 14 | 0.1% | View All 71 Rows |
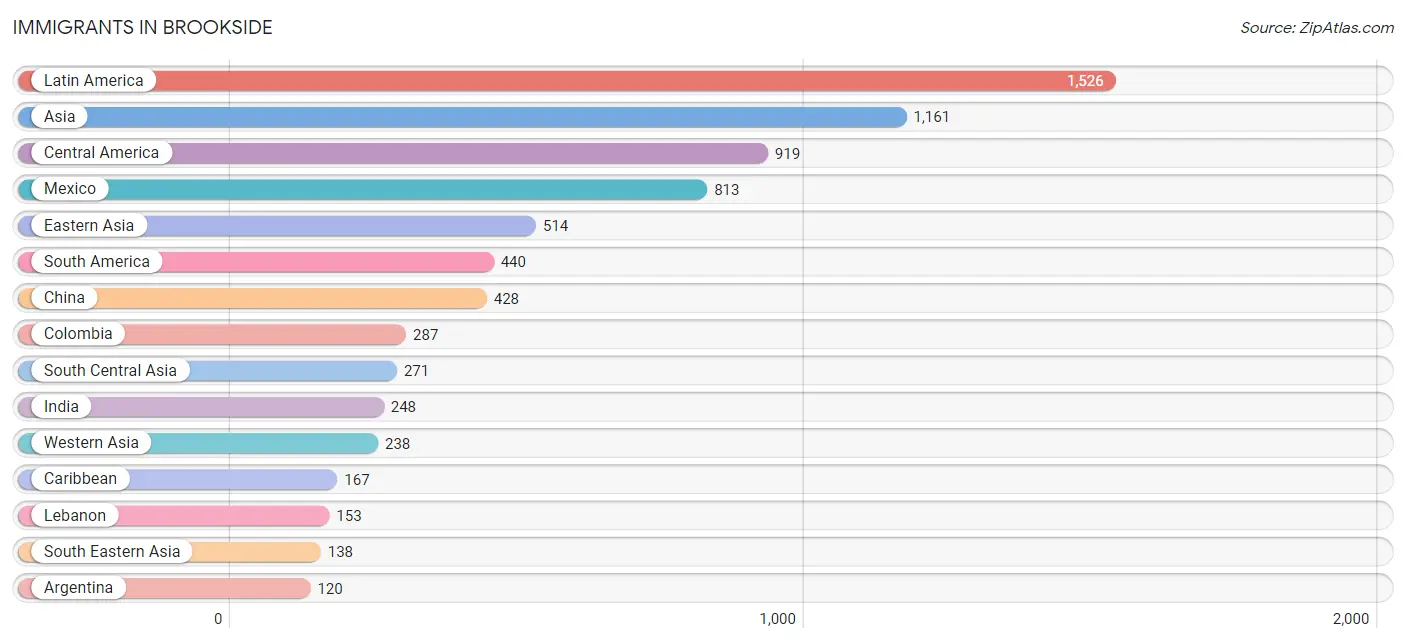
Immigrants in Brookside
The most numerous immigrant groups reported in Brookside came from Latin America (1,526 | 10.6%), Asia (1,161 | 8.1%), Central America (919 | 6.4%), Mexico (813 | 5.7%), and Eastern Asia (514 | 3.6%), together accounting for 34.4% of all Brookside residents.
| Immigration Origin | # Population | % Population |
| Africa | 85 | 0.6% |
| Argentina | 120 | 0.8% |
| Asia | 1,161 | 8.1% |
| Brazil | 2 | 0.0% |
| Bulgaria | 19 | 0.1% |
| Canada | 41 | 0.3% |
| Caribbean | 167 | 1.2% |
| Central America | 919 | 6.4% |
| China | 428 | 3.0% |
| Colombia | 287 | 2.0% |
| Costa Rica | 13 | 0.1% |
| Dominican Republic | 58 | 0.4% |
| Eastern Africa | 24 | 0.2% |
| Eastern Asia | 514 | 3.6% |
| Eastern Europe | 33 | 0.2% |
| Egypt | 47 | 0.3% |
| El Salvador | 20 | 0.1% |
| Europe | 67 | 0.5% |
| Germany | 33 | 0.2% |
| Grenada | 38 | 0.3% |
| Guyana | 8 | 0.1% |
| Honduras | 55 | 0.4% |
| India | 248 | 1.7% |
| Italy | 1 | 0.0% |
| Jamaica | 71 | 0.5% |
| Kenya | 24 | 0.2% |
| Korea | 86 | 0.6% |
| Latin America | 1,526 | 10.6% |
| Lebanon | 153 | 1.1% |
| Mexico | 813 | 5.7% |
| Morocco | 14 | 0.1% |
| Nepal | 23 | 0.2% |
| Northern Africa | 61 | 0.4% |
| Panama | 18 | 0.1% |
| Philippines | 99 | 0.7% |
| Poland | 14 | 0.1% |
| South America | 440 | 3.1% |
| South Central Asia | 271 | 1.9% |
| South Eastern Asia | 138 | 1.0% |
| Southern Europe | 1 | 0.0% |
| Taiwan | 4 | 0.0% |
| Thailand | 26 | 0.2% |
| Vietnam | 13 | 0.1% |
| Western Asia | 238 | 1.7% |
| Western Europe | 33 | 0.2% |
| Yemen | 85 | 0.6% | View All 46 Rows |
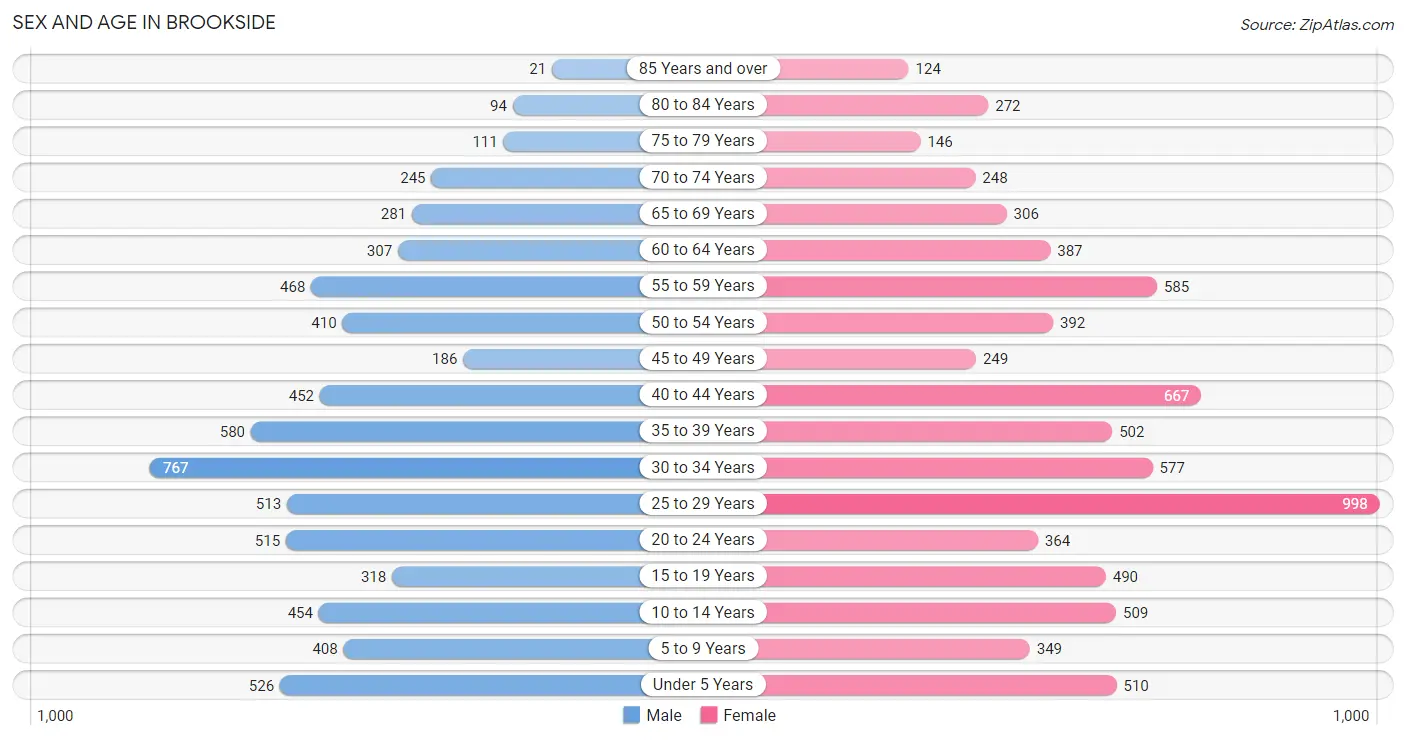
Sex and Age in Brookside
Sex and Age in Brookside
The most populous age groups in Brookside are 30 to 34 Years (767 | 11.5%) for men and 25 to 29 Years (998 | 13.0%) for women.
| Age Bracket | Male | Female |
| Under 5 Years | 526 (7.9%) | 510 (6.6%) |
| 5 to 9 Years | 408 (6.1%) | 349 (4.5%) |
| 10 to 14 Years | 454 (6.8%) | 509 (6.6%) |
| 15 to 19 Years | 318 (4.8%) | 490 (6.4%) |
| 20 to 24 Years | 515 (7.7%) | 364 (4.7%) |
| 25 to 29 Years | 513 (7.7%) | 998 (13.0%) |
| 30 to 34 Years | 767 (11.5%) | 577 (7.5%) |
| 35 to 39 Years | 580 (8.7%) | 502 (6.5%) |
| 40 to 44 Years | 452 (6.8%) | 667 (8.7%) |
| 45 to 49 Years | 186 (2.8%) | 249 (3.2%) |
| 50 to 54 Years | 410 (6.2%) | 392 (5.1%) |
| 55 to 59 Years | 468 (7.0%) | 585 (7.6%) |
| 60 to 64 Years | 307 (4.6%) | 387 (5.0%) |
| 65 to 69 Years | 281 (4.2%) | 306 (4.0%) |
| 70 to 74 Years | 245 (3.7%) | 248 (3.2%) |
| 75 to 79 Years | 111 (1.7%) | 146 (1.9%) |
| 80 to 84 Years | 94 (1.4%) | 272 (3.5%) |
| 85 Years and over | 21 (0.3%) | 124 (1.6%) |
| Total | 6,656 (100.0%) | 7,675 (100.0%) |
Families and Households in Brookside
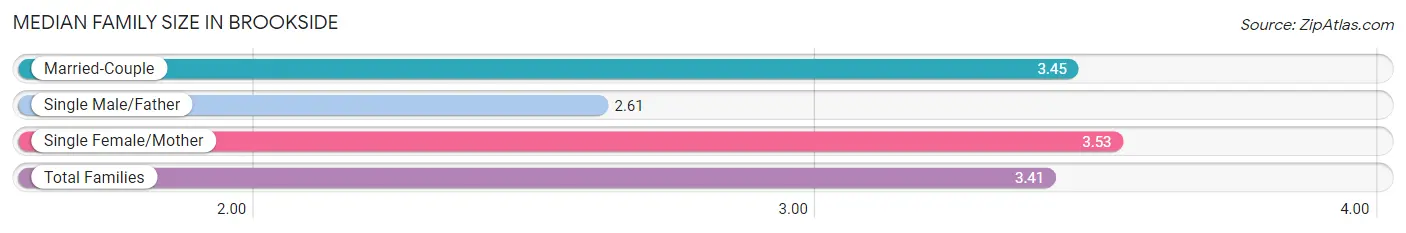
Median Family Size in Brookside
The median family size in Brookside is 3.41 persons per family, with single female/mother families (772 | 24.4%) accounting for the largest median family size of 3.53 persons per family. On the other hand, single male/father families (213 | 6.7%) represent the smallest median family size with 2.61 persons per family.
| Family Type | # Families | Family Size |
| Married-Couple | 2,183 (68.9%) | 3.45 |
| Single Male/Father | 213 (6.7%) | 2.61 |
| Single Female/Mother | 772 (24.4%) | 3.53 |
| Total Families | 3,168 (100.0%) | 3.41 |
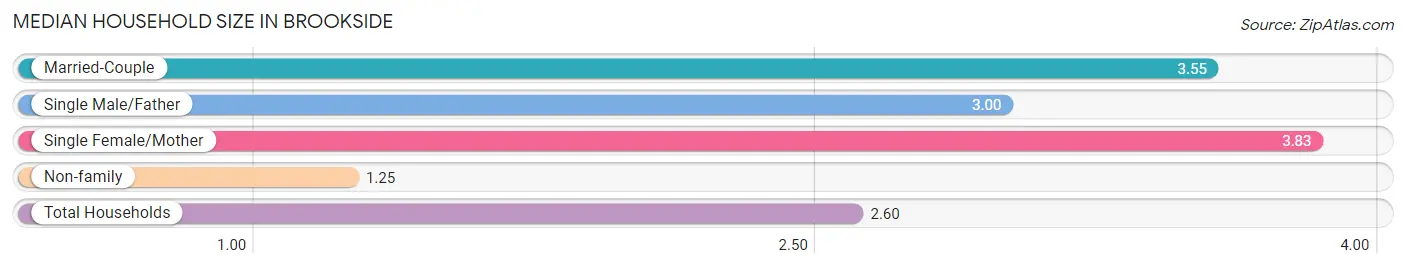
Median Household Size in Brookside
The median household size in Brookside is 2.60 persons per household, with single female/mother households (772 | 14.1%) accounting for the largest median household size of 3.83 persons per household. non-family households (2,310 | 42.2%) represent the smallest median household size with 1.25 persons per household.
| Household Type | # Households | Household Size |
| Married-Couple | 2,183 (39.9%) | 3.55 |
| Single Male/Father | 213 (3.9%) | 3.00 |
| Single Female/Mother | 772 (14.1%) | 3.83 |
| Non-family | 2,310 (42.2%) | 1.25 |
| Total Households | 5,478 (100.0%) | 2.60 |
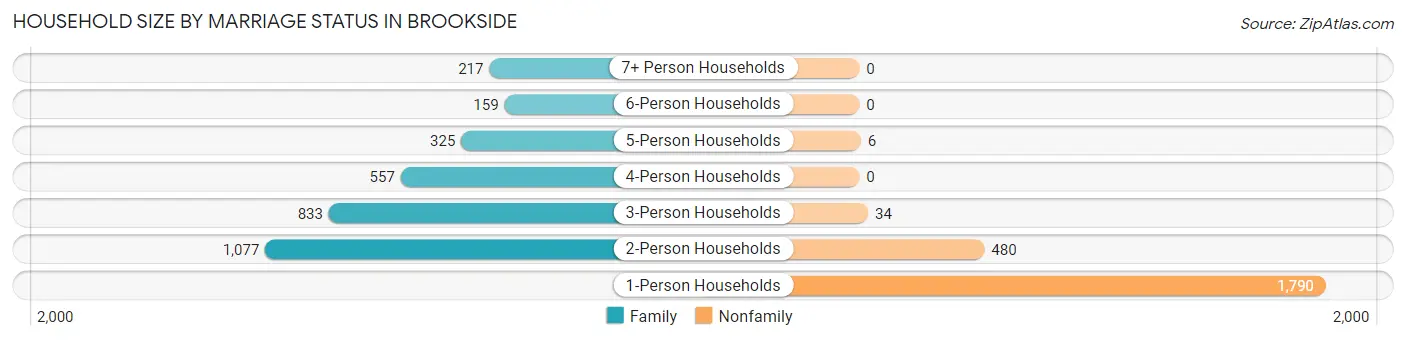
Household Size by Marriage Status in Brookside
Out of a total of 5,478 households in Brookside, 3,168 (57.8%) are family households, while 2,310 (42.2%) are nonfamily households. The most numerous type of family households are 2-person households, comprising 1,077, and the most common type of nonfamily households are 1-person households, comprising 1,790.
| Household Size | Family Households | Nonfamily Households |
| 1-Person Households | - | 1,790 (32.7%) |
| 2-Person Households | 1,077 (19.7%) | 480 (8.8%) |
| 3-Person Households | 833 (15.2%) | 34 (0.6%) |
| 4-Person Households | 557 (10.2%) | 0 (0.0%) |
| 5-Person Households | 325 (5.9%) | 6 (0.1%) |
| 6-Person Households | 159 (2.9%) | 0 (0.0%) |
| 7+ Person Households | 217 (4.0%) | 0 (0.0%) |
| Total | 3,168 (57.8%) | 2,310 (42.2%) |
Female Fertility in Brookside
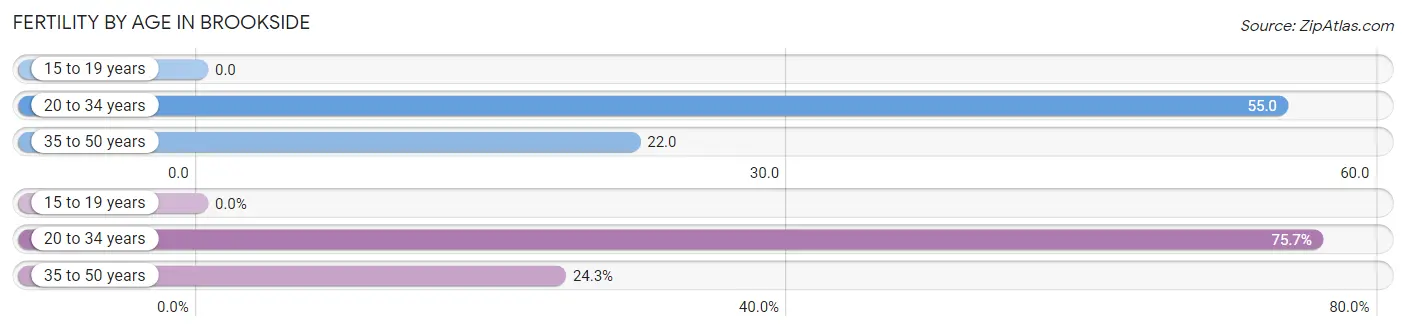
Fertility by Age in Brookside
Average fertility rate in Brookside is 35.0 births per 1,000 women. Women in the age bracket of 20 to 34 years have the highest fertility rate with 55.0 births per 1,000 women. Women in the age bracket of 20 to 34 years acount for 75.7% of all women with births.
| Age Bracket | Women with Births | Births / 1,000 Women |
| 15 to 19 years | 0 (0.0%) | 0.0 |
| 20 to 34 years | 106 (75.7%) | 55.0 |
| 35 to 50 years | 34 (24.3%) | 22.0 |
| Total | 140 (100.0%) | 35.0 |
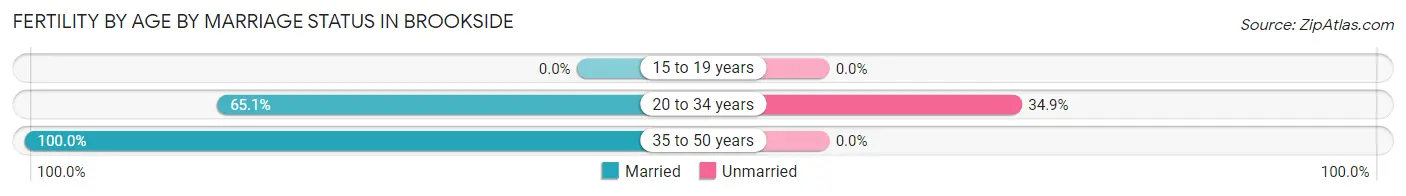
Fertility by Age by Marriage Status in Brookside
73.6% of women with births (140) in Brookside are married. The highest percentage of unmarried women with births falls into 20 to 34 years age bracket with 34.9% of them unmarried at the time of birth, while the lowest percentage of unmarried women with births belong to 35 to 50 years age bracket with 0.0% of them unmarried.
| Age Bracket | Married | Unmarried |
| 15 to 19 years | 0 (0.0%) | 0 (0.0%) |
| 20 to 34 years | 69 (65.1%) | 37 (34.9%) |
| 35 to 50 years | 34 (100.0%) | 0 (0.0%) |
| Total | 103 (73.6%) | 37 (26.4%) |
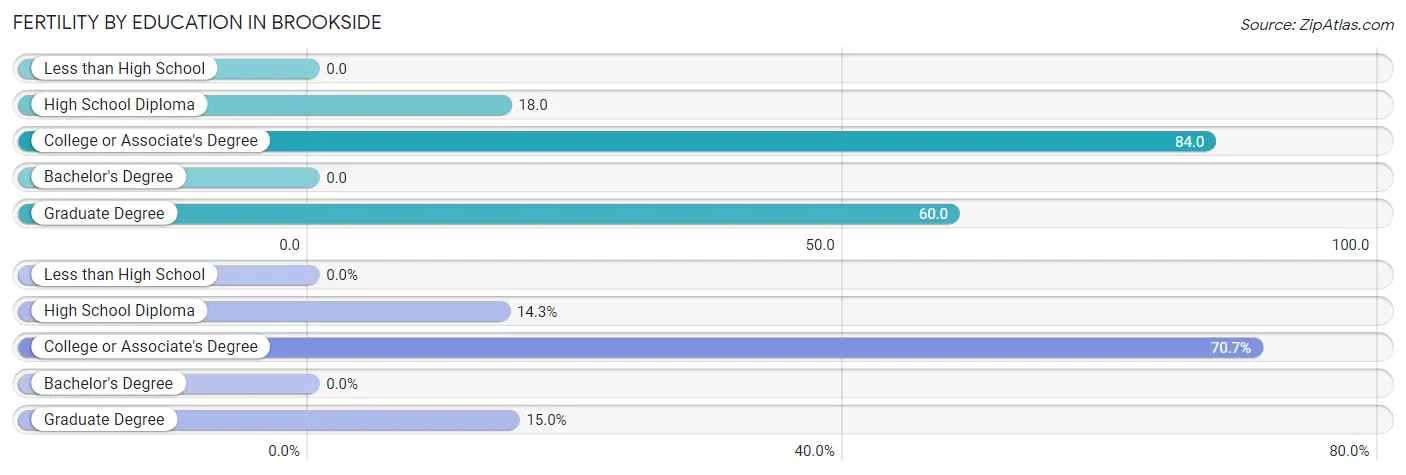
Fertility by Education in Brookside
| Educational Attainment | Women with Births | Births / 1,000 Women |
| Less than High School | 0 (0.0%) | 0.0 |
| High School Diploma | 20 (14.3%) | 18.0 |
| College or Associate's Degree | 99 (70.7%) | 84.0 |
| Bachelor's Degree | 0 (0.0%) | 0.0 |
| Graduate Degree | 21 (15.0%) | 60.0 |
| Total | 140 (100.0%) | 35.0 |
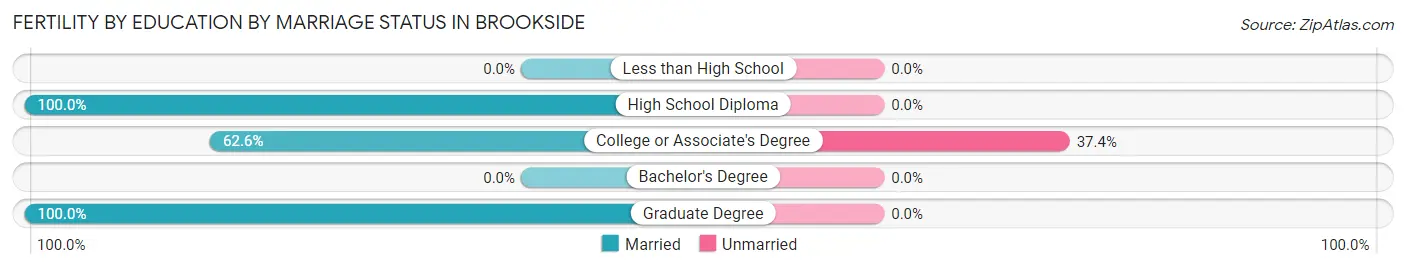
Fertility by Education by Marriage Status in Brookside
26.4% of women with births in Brookside are unmarried. Women with the educational attainment of high school diploma are most likely to be married with 100.0% of them married at childbirth, while women with the educational attainment of college or associate's degree are least likely to be married with 37.4% of them unmarried at childbirth.
| Educational Attainment | Married | Unmarried |
| Less than High School | 0 (0.0%) | 0 (0.0%) |
| High School Diploma | 20 (100.0%) | 0 (0.0%) |
| College or Associate's Degree | 62 (62.6%) | 37 (37.4%) |
| Bachelor's Degree | 0 (0.0%) | 0 (0.0%) |
| Graduate Degree | 21 (100.0%) | 0 (0.0%) |
| Total | 103 (73.6%) | 37 (26.4%) |
Income in Brookside
Income Overview in Brookside
Per Capita Income in Brookside is $34,827, while median incomes of families and households are $67,958 and $66,485 respectively.
| Characteristic | Number | Measure |
| Per Capita Income | 14,331 | $34,827 |
| Median Family Income | 3,168 | $67,958 |
| Mean Family Income | 3,168 | $91,462 |
| Median Household Income | 5,478 | $66,485 |
| Mean Household Income | 5,478 | $89,003 |
| Income Deficit | 3,168 | $10,597 |
| Wage / Income Gap (%) | 14,331 | 21.64% |
| Wage / Income Gap ($) | 14,331 | 78.36¢ per $1 |
| Gini / Inequality Index | 14,331 | 0.41 |
Earnings by Sex in Brookside
Average Earnings in Brookside are $36,882, $41,801 for men and $32,755 for women, a difference of 21.6%.
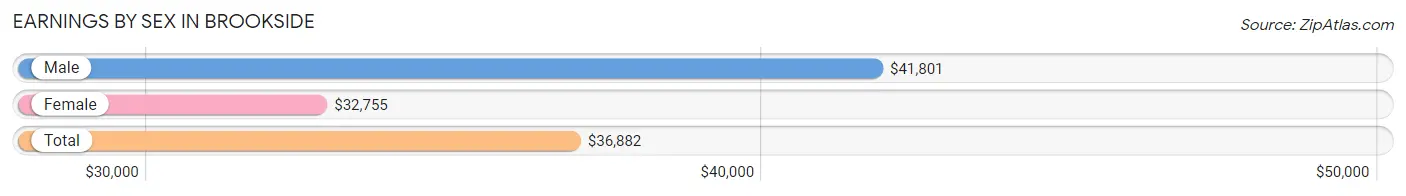
| Sex | Number | Average Earnings |
| Male | 4,010 (49.0%) | $41,801 |
| Female | 4,174 (51.0%) | $32,755 |
| Total | 8,184 (100.0%) | $36,882 |
Earnings by Sex by Income Bracket in Brookside
The most common earnings brackets in Brookside are $100,000+ for men (636 | 15.9%) and $25,000 to $29,999 for women (456 | 10.9%).
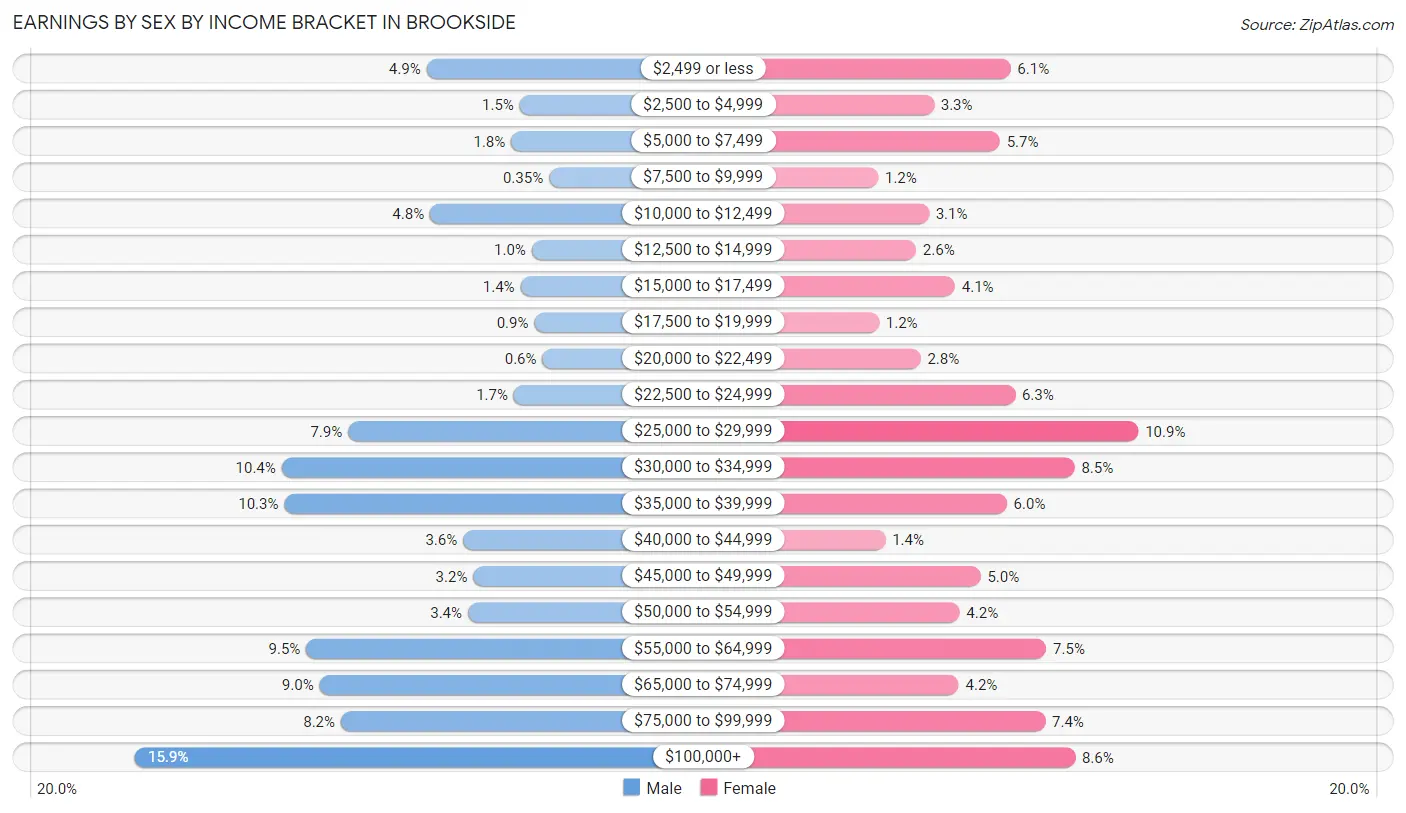
| Income | Male | Female |
| $2,499 or less | 198 (4.9%) | 256 (6.1%) |
| $2,500 to $4,999 | 58 (1.5%) | 136 (3.3%) |
| $5,000 to $7,499 | 71 (1.8%) | 239 (5.7%) |
| $7,500 to $9,999 | 14 (0.4%) | 49 (1.2%) |
| $10,000 to $12,499 | 193 (4.8%) | 128 (3.1%) |
| $12,500 to $14,999 | 40 (1.0%) | 108 (2.6%) |
| $15,000 to $17,499 | 57 (1.4%) | 169 (4.1%) |
| $17,500 to $19,999 | 36 (0.9%) | 50 (1.2%) |
| $20,000 to $22,499 | 24 (0.6%) | 115 (2.8%) |
| $22,500 to $24,999 | 67 (1.7%) | 263 (6.3%) |
| $25,000 to $29,999 | 316 (7.9%) | 456 (10.9%) |
| $30,000 to $34,999 | 416 (10.4%) | 356 (8.5%) |
| $35,000 to $39,999 | 412 (10.3%) | 250 (6.0%) |
| $40,000 to $44,999 | 143 (3.6%) | 60 (1.4%) |
| $45,000 to $49,999 | 128 (3.2%) | 209 (5.0%) |
| $50,000 to $54,999 | 136 (3.4%) | 176 (4.2%) |
| $55,000 to $64,999 | 379 (9.5%) | 312 (7.5%) |
| $65,000 to $74,999 | 359 (8.9%) | 175 (4.2%) |
| $75,000 to $99,999 | 327 (8.2%) | 310 (7.4%) |
| $100,000+ | 636 (15.9%) | 357 (8.6%) |
| Total | 4,010 (100.0%) | 4,174 (100.0%) |
Earnings by Sex by Educational Attainment in Brookside
Average earnings in Brookside are $50,974 for men and $34,943 for women, a difference of 31.5%. Men with an educational attainment of graduate degree enjoy the highest average annual earnings of $126,719, while those with less than high school education earn the least with $36,574. Women with an educational attainment of bachelor's degree earn the most with the average annual earnings of $68,850, while those with college or associate's degree education have the smallest earnings of $28,716.
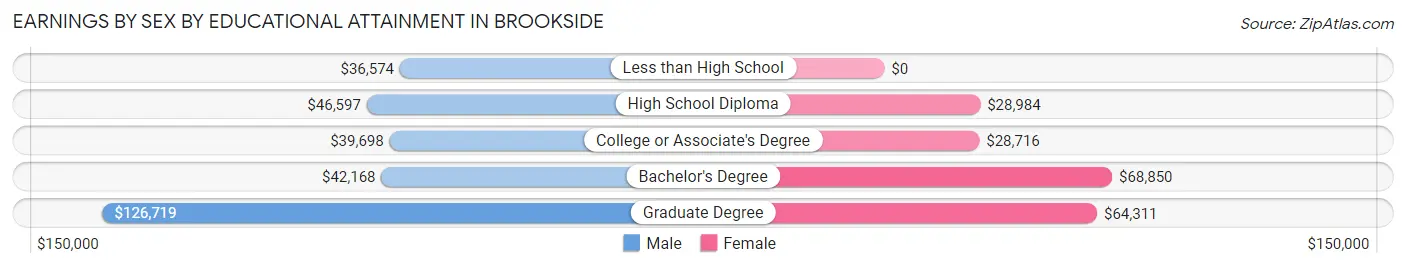
| Educational Attainment | Male Income | Female Income |
| Less than High School | $36,574 | $0 |
| High School Diploma | $46,597 | $28,984 |
| College or Associate's Degree | $39,698 | $28,716 |
| Bachelor's Degree | $42,168 | $68,850 |
| Graduate Degree | $126,719 | $64,311 |
| Total | $50,974 | $34,943 |
Family Income in Brookside
Family Income Brackets in Brookside
According to the Brookside family income data, there are 738 families falling into the $50,000 to $74,999 income range, which is the most common income bracket and makes up 23.3% of all families.
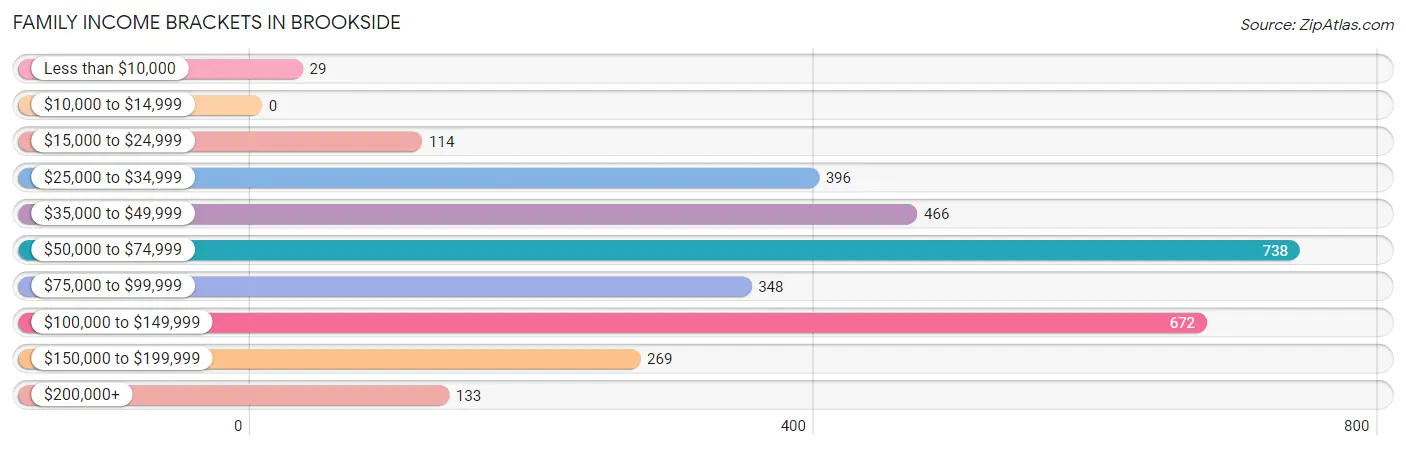
| Income Bracket | # Families | % Families |
| Less than $10,000 | 29 | 0.9% |
| $10,000 to $14,999 | 0 | 0.0% |
| $15,000 to $24,999 | 114 | 3.6% |
| $25,000 to $34,999 | 396 | 12.5% |
| $35,000 to $49,999 | 466 | 14.7% |
| $50,000 to $74,999 | 738 | 23.3% |
| $75,000 to $99,999 | 348 | 11.0% |
| $100,000 to $149,999 | 672 | 21.2% |
| $150,000 to $199,999 | 269 | 8.5% |
| $200,000+ | 133 | 4.2% |
Family Income by Famaliy Size in Brookside
4-person families (521 | 16.5%) account for the highest median family income in Brookside with $103,685 per family, while 2-person families (1,273 | 40.2%) have the highest median income of $34,453 per family member.
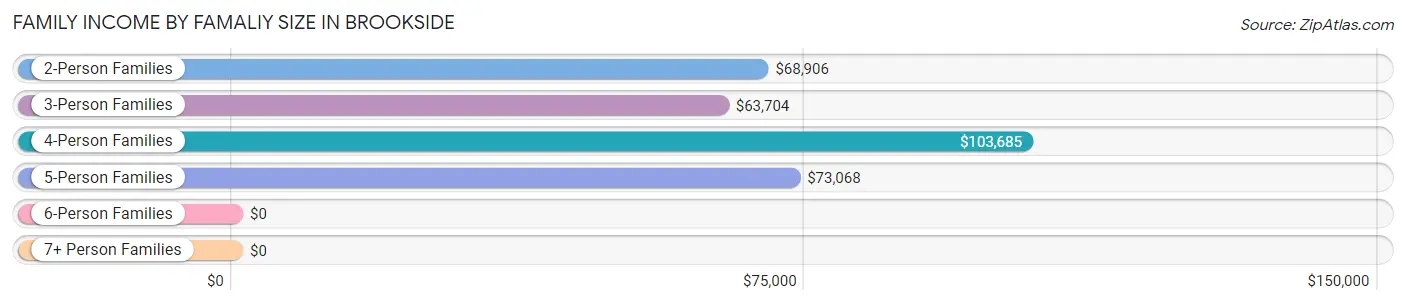
| Income Bracket | # Families | Median Income |
| 2-Person Families | 1,273 (40.2%) | $68,906 |
| 3-Person Families | 732 (23.1%) | $63,704 |
| 4-Person Families | 521 (16.5%) | $103,685 |
| 5-Person Families | 321 (10.1%) | $73,068 |
| 6-Person Families | 137 (4.3%) | $0 |
| 7+ Person Families | 184 (5.8%) | $0 |
| Total | 3,168 (100.0%) | $67,958 |
Family Income by Number of Earners in Brookside
The median family income in Brookside is $67,958, with families comprising 3+ earners (422) having the highest median family income of $127,143, while families with 1 earner (1,085) have the lowest median family income of $46,574, accounting for 13.3% and 34.3% of families, respectively.
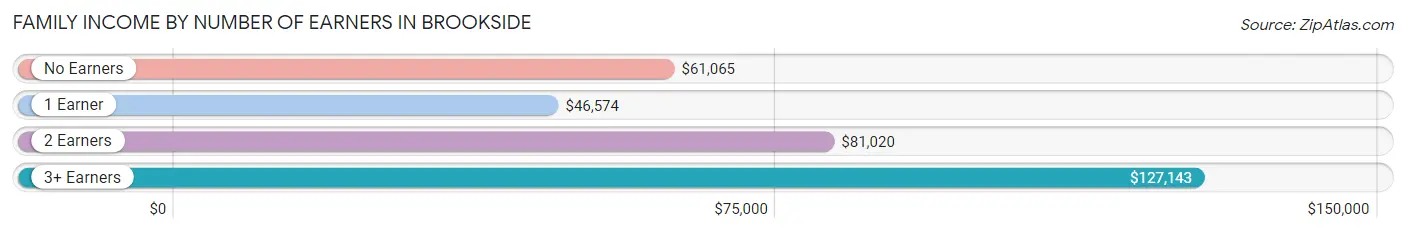
| Number of Earners | # Families | Median Income |
| No Earners | 341 (10.8%) | $61,065 |
| 1 Earner | 1,085 (34.3%) | $46,574 |
| 2 Earners | 1,320 (41.7%) | $81,020 |
| 3+ Earners | 422 (13.3%) | $127,143 |
| Total | 3,168 (100.0%) | $67,958 |
Household Income in Brookside
Household Income Brackets in Brookside
With 1,134 households falling in the category, the $50,000 to $74,999 income range is the most frequent in Brookside, accounting for 20.7% of all households. In contrast, only 55 households (1.0%) fall into the $10,000 to $14,999 income bracket, making it the least populous group.
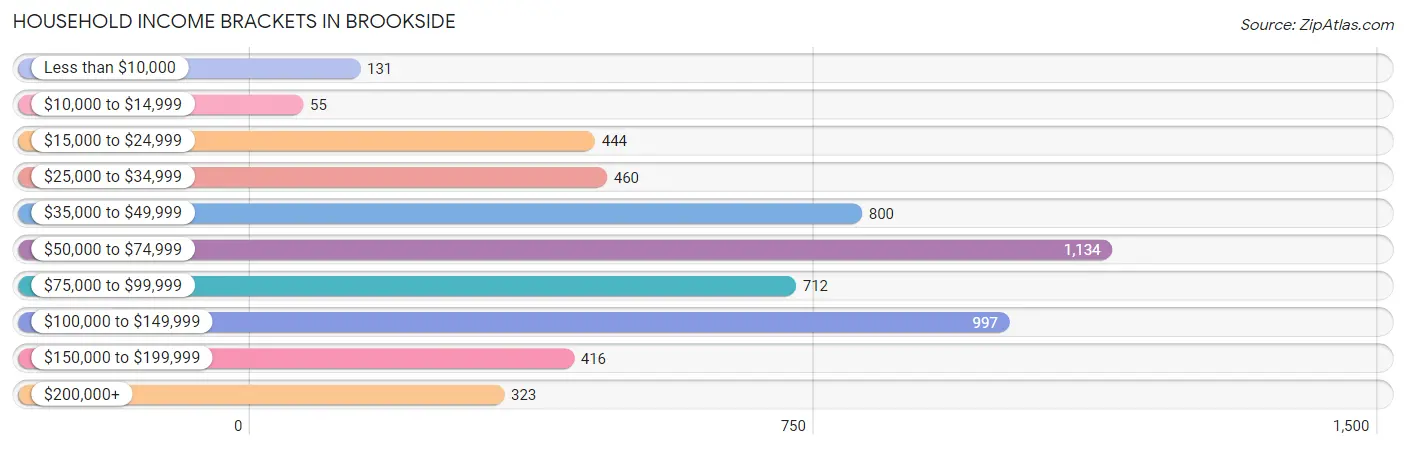
| Income Bracket | # Households | % Households |
| Less than $10,000 | 131 | 2.4% |
| $10,000 to $14,999 | 55 | 1.0% |
| $15,000 to $24,999 | 444 | 8.1% |
| $25,000 to $34,999 | 460 | 8.4% |
| $35,000 to $49,999 | 800 | 14.6% |
| $50,000 to $74,999 | 1,134 | 20.7% |
| $75,000 to $99,999 | 712 | 13.0% |
| $100,000 to $149,999 | 997 | 18.2% |
| $150,000 to $199,999 | 416 | 7.6% |
| $200,000+ | 323 | 5.9% |
Household Income by Householder Age in Brookside
The median household income in Brookside is $66,485, with the highest median household income of $77,139 found in the 45 to 64 years age bracket for the primary householder. A total of 1,757 households (32.1%) fall into this category. Meanwhile, the 65+ years age bracket for the primary householder has the lowest median household income of $46,799, with 1,195 households (21.8%) in this group.
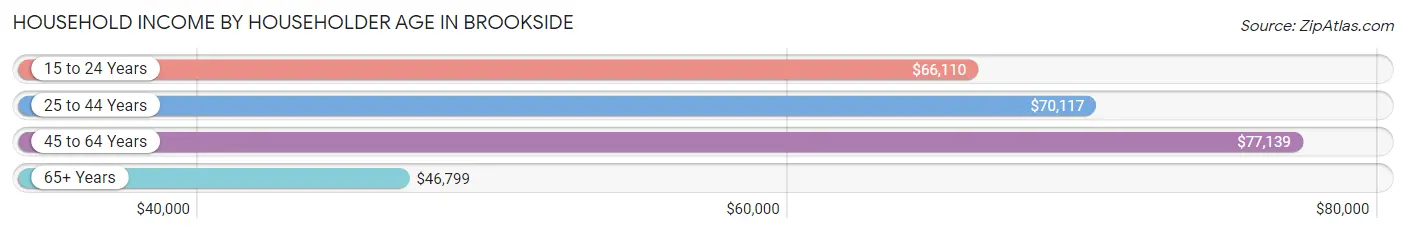
| Income Bracket | # Households | Median Income |
| 15 to 24 Years | 197 (3.6%) | $66,110 |
| 25 to 44 Years | 2,329 (42.5%) | $70,117 |
| 45 to 64 Years | 1,757 (32.1%) | $77,139 |
| 65+ Years | 1,195 (21.8%) | $46,799 |
| Total | 5,478 (100.0%) | $66,485 |
Poverty in Brookside
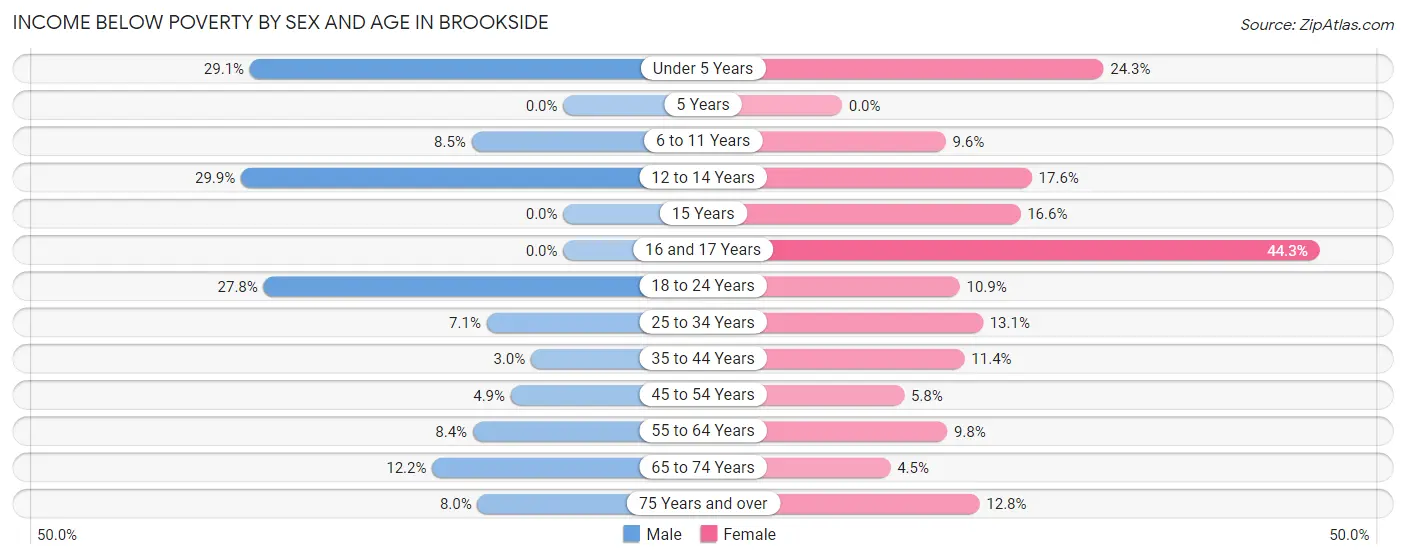
Income Below Poverty by Sex and Age in Brookside
With 12.0% poverty level for males and 12.4% for females among the residents of Brookside, 12 to 14 year old males and 16 and 17 year old females are the most vulnerable to poverty, with 105 males (29.9%) and 86 females (44.3%) in their respective age groups living below the poverty level.
| Age Bracket | Male | Female |
| Under 5 Years | 153 (29.1%) | 116 (24.3%) |
| 5 Years | 0 (0.0%) | 0 (0.0%) |
| 6 to 11 Years | 43 (8.5%) | 54 (9.6%) |
| 12 to 14 Years | 105 (29.9%) | 46 (17.6%) |
| 15 Years | 0 (0.0%) | 26 (16.6%) |
| 16 and 17 Years | 0 (0.0%) | 86 (44.3%) |
| 18 to 24 Years | 200 (27.8%) | 55 (10.9%) |
| 25 to 34 Years | 91 (7.1%) | 206 (13.1%) |
| 35 to 44 Years | 31 (3.0%) | 133 (11.4%) |
| 45 to 54 Years | 29 (4.9%) | 37 (5.8%) |
| 55 to 64 Years | 65 (8.4%) | 94 (9.8%) |
| 65 to 74 Years | 63 (12.2%) | 24 (4.5%) |
| 75 Years and over | 18 (8.0%) | 66 (12.8%) |
| Total | 798 (12.0%) | 943 (12.4%) |
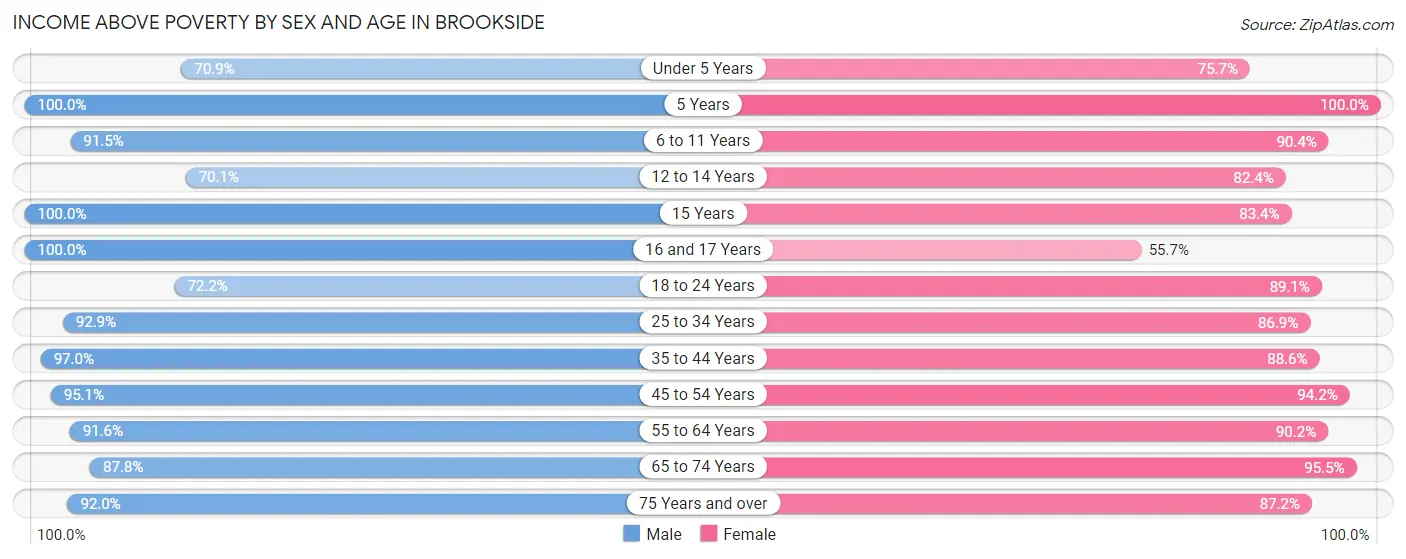
Income Above Poverty by Sex and Age in Brookside
According to the poverty statistics in Brookside, males aged 5 years and females aged 5 years are the age groups that are most secure financially, with 100.0% of males and 100.0% of females in these age groups living above the poverty line.
| Age Bracket | Male | Female |
| Under 5 Years | 373 (70.9%) | 362 (75.7%) |
| 5 Years | 6 (100.0%) | 36 (100.0%) |
| 6 to 11 Years | 462 (91.5%) | 507 (90.4%) |
| 12 to 14 Years | 246 (70.1%) | 215 (82.4%) |
| 15 Years | 22 (100.0%) | 131 (83.4%) |
| 16 and 17 Years | 92 (100.0%) | 108 (55.7%) |
| 18 to 24 Years | 519 (72.2%) | 448 (89.1%) |
| 25 to 34 Years | 1,189 (92.9%) | 1,369 (86.9%) |
| 35 to 44 Years | 1,001 (97.0%) | 1,036 (88.6%) |
| 45 to 54 Years | 567 (95.1%) | 604 (94.2%) |
| 55 to 64 Years | 710 (91.6%) | 869 (90.2%) |
| 65 to 74 Years | 455 (87.8%) | 511 (95.5%) |
| 75 Years and over | 208 (92.0%) | 451 (87.2%) |
| Total | 5,850 (88.0%) | 6,647 (87.6%) |
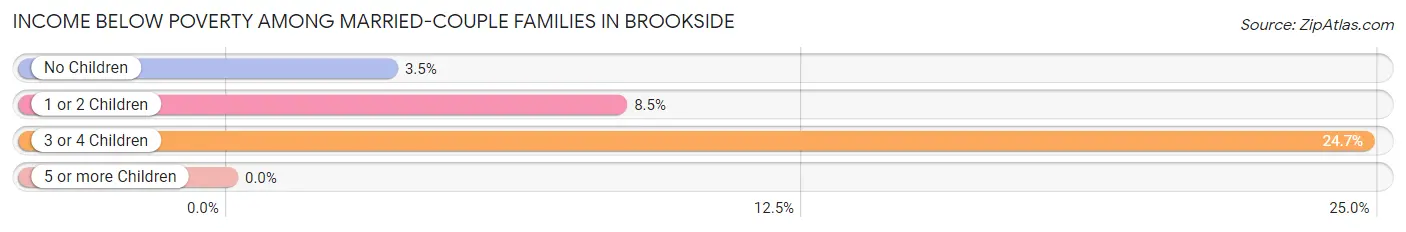
Income Below Poverty Among Married-Couple Families in Brookside
The poverty statistics for married-couple families in Brookside show that 7.3% or 159 of the total 2,183 families live below the poverty line. Families with 3 or 4 children have the highest poverty rate of 24.7%, comprising of 47 families. On the other hand, families with 5 or more children have the lowest poverty rate of 0.0%, which includes 0 families.
| Children | Above Poverty | Below Poverty |
| No Children | 1,081 (96.5%) | 39 (3.5%) |
| 1 or 2 Children | 789 (91.5%) | 73 (8.5%) |
| 3 or 4 Children | 143 (75.3%) | 47 (24.7%) |
| 5 or more Children | 11 (100.0%) | 0 (0.0%) |
| Total | 2,024 (92.7%) | 159 (7.3%) |
Income Below Poverty Among Single-Parent Households in Brookside
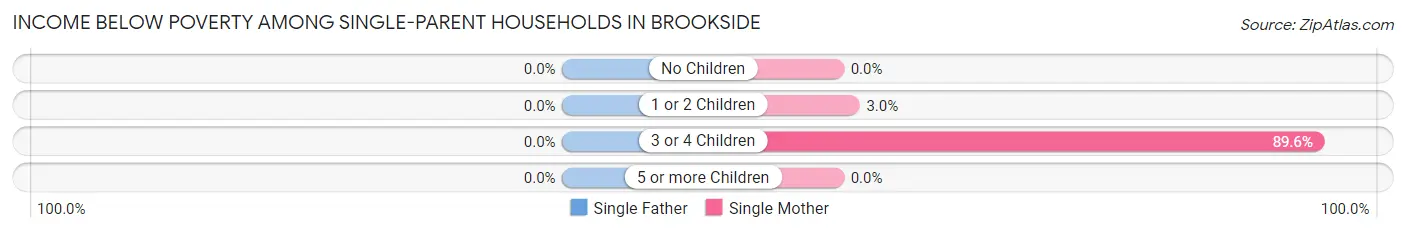
| Children | Single Father | Single Mother |
| No Children | 0 (0.0%) | 0 (0.0%) |
| 1 or 2 Children | 0 (0.0%) | 12 (2.9%) |
| 3 or 4 Children | 0 (0.0%) | 112 (89.6%) |
| 5 or more Children | 0 (0.0%) | 0 (0.0%) |
| Total | 0 (0.0%) | 124 (16.1%) |
Income Below Poverty Among Married-Couple vs Single-Parent Households in Brookside
The poverty data for Brookside shows that 159 of the married-couple family households (7.3%) and 124 of the single-parent households (12.6%) are living below the poverty level. Within the married-couple family households, those with 3 or 4 children have the highest poverty rate, with 47 households (24.7%) falling below the poverty line. Among the single-parent households, those with 3 or 4 children have the highest poverty rate, with 112 household (89.6%) living below poverty.
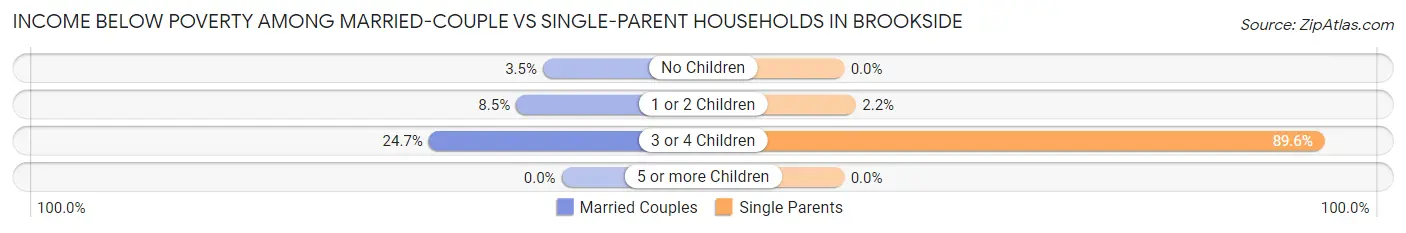
| Children | Married-Couple Families | Single-Parent Households |
| No Children | 39 (3.5%) | 0 (0.0%) |
| 1 or 2 Children | 73 (8.5%) | 12 (2.2%) |
| 3 or 4 Children | 47 (24.7%) | 112 (89.6%) |
| 5 or more Children | 0 (0.0%) | 0 (0.0%) |
| Total | 159 (7.3%) | 124 (12.6%) |
Employment Characteristics in Brookside
Employment by Class of Employer in Brookside
Among the 7,373 employed individuals in Brookside, private company employees (5,556 | 75.4%), local government employees (517 | 7.0%), and state government employees (357 | 4.8%) make up the most common classes of employment.
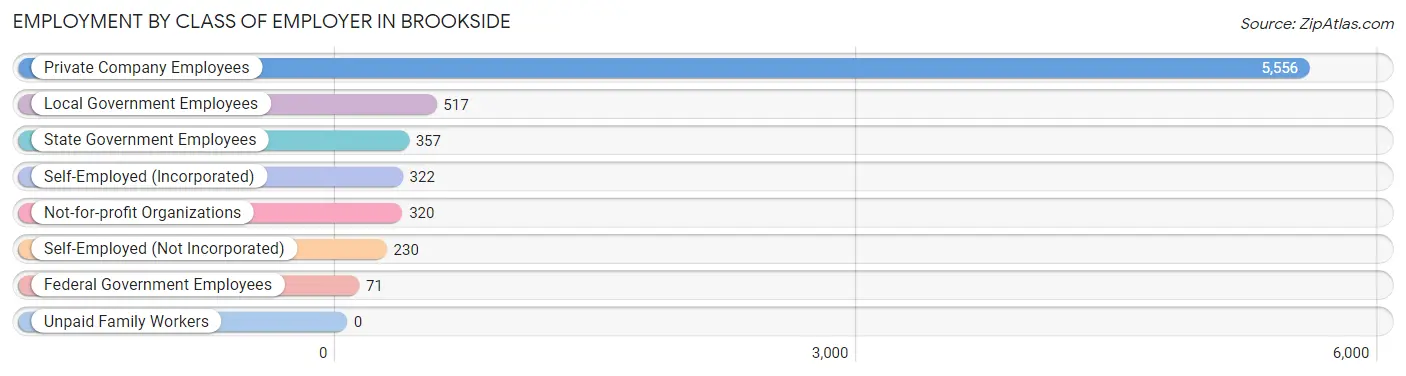
| Employer Class | # Employees | % Employees |
| Private Company Employees | 5,556 | 75.4% |
| Self-Employed (Incorporated) | 322 | 4.4% |
| Self-Employed (Not Incorporated) | 230 | 3.1% |
| Not-for-profit Organizations | 320 | 4.3% |
| Local Government Employees | 517 | 7.0% |
| State Government Employees | 357 | 4.8% |
| Federal Government Employees | 71 | 1.0% |
| Unpaid Family Workers | 0 | 0.0% |
| Total | 7,373 | 100.0% |
Employment Status by Age in Brookside
According to the labor force statistics for Brookside, out of the total population over 16 years of age (11,396), 68.6% or 7,818 individuals are in the labor force, with 4.5% or 352 of them unemployed. The age group with the highest labor force participation rate is 25 to 29 years, with 88.9% or 1,343 individuals in the labor force. Within the labor force, the 16 to 19 years age range has the highest percentage of unemployed individuals, with 15.3% or 46 of them being unemployed.
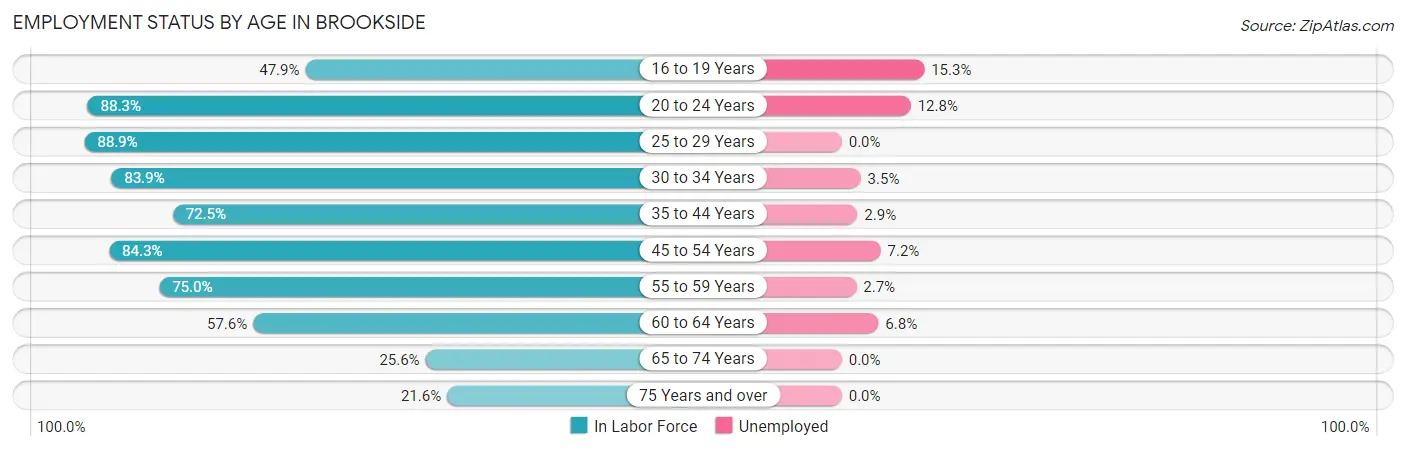
| Age Bracket | In Labor Force | Unemployed |
| 16 to 19 Years | 301 (47.9%) | 46 (15.3%) |
| 20 to 24 Years | 776 (88.3%) | 99 (12.8%) |
| 25 to 29 Years | 1,343 (88.9%) | 0 (0.0%) |
| 30 to 34 Years | 1,128 (83.9%) | 39 (3.5%) |
| 35 to 44 Years | 1,596 (72.5%) | 46 (2.9%) |
| 45 to 54 Years | 1,043 (84.3%) | 75 (7.2%) |
| 55 to 59 Years | 790 (75.0%) | 21 (2.7%) |
| 60 to 64 Years | 400 (57.6%) | 27 (6.8%) |
| 65 to 74 Years | 276 (25.6%) | 0 (0.0%) |
| 75 Years and over | 166 (21.6%) | 0 (0.0%) |
| Total | 7,818 (68.6%) | 352 (4.5%) |
Employment Status by Educational Attainment in Brookside
According to labor force statistics for Brookside, 78.4% of individuals (6,303) out of the total population between 25 and 64 years of age (8,040) are in the labor force, with 3.3% or 208 of them being unemployed. The group with the highest labor force participation rate are those with the educational attainment of bachelor's degree or higher, with 89.9% or 2,107 individuals in the labor force. Within the labor force, individuals with high school diploma education have the highest percentage of unemployment, with 6.0% or 121 of them being unemployed.
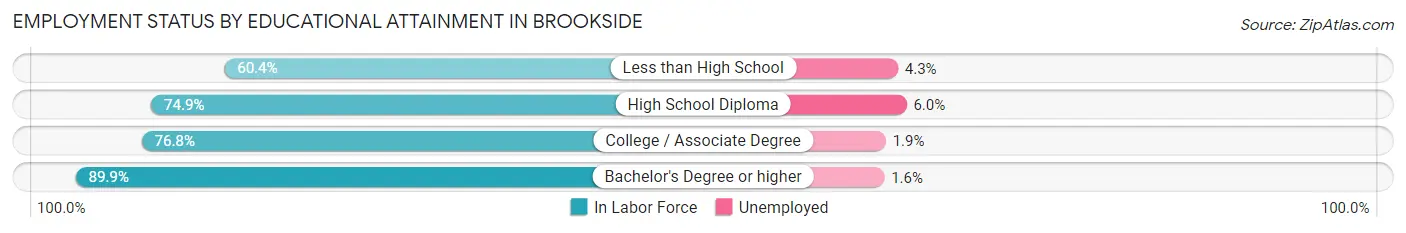
| Educational Attainment | In Labor Force | Unemployed |
| Less than High School | 489 (60.4%) | 35 (4.3%) |
| High School Diploma | 2,022 (74.9%) | 162 (6.0%) |
| College / Associate Degree | 1,680 (76.8%) | 42 (1.9%) |
| Bachelor's Degree or higher | 2,107 (89.9%) | 38 (1.6%) |
| Total | 6,303 (78.4%) | 265 (3.3%) |
Employment Occupations by Sex in Brookside
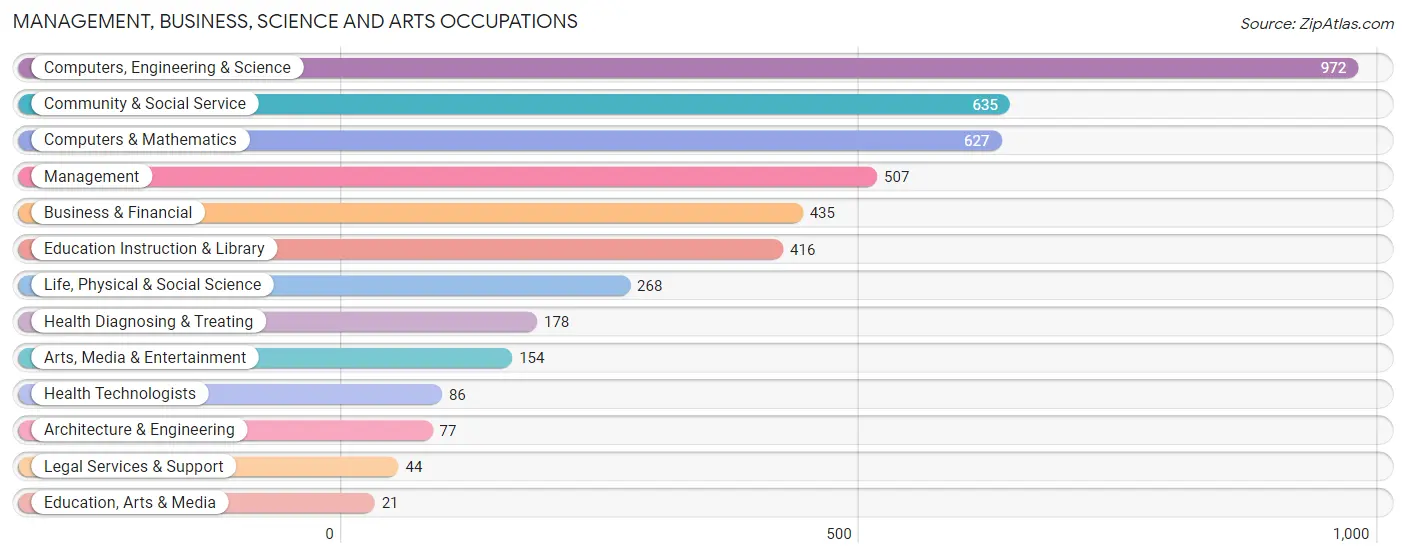
Management, Business, Science and Arts Occupations
The most common Management, Business, Science and Arts occupations in Brookside are Computers, Engineering & Science (972 | 13.0%), Community & Social Service (635 | 8.5%), Computers & Mathematics (627 | 8.4%), Management (507 | 6.8%), and Business & Financial (435 | 5.8%).
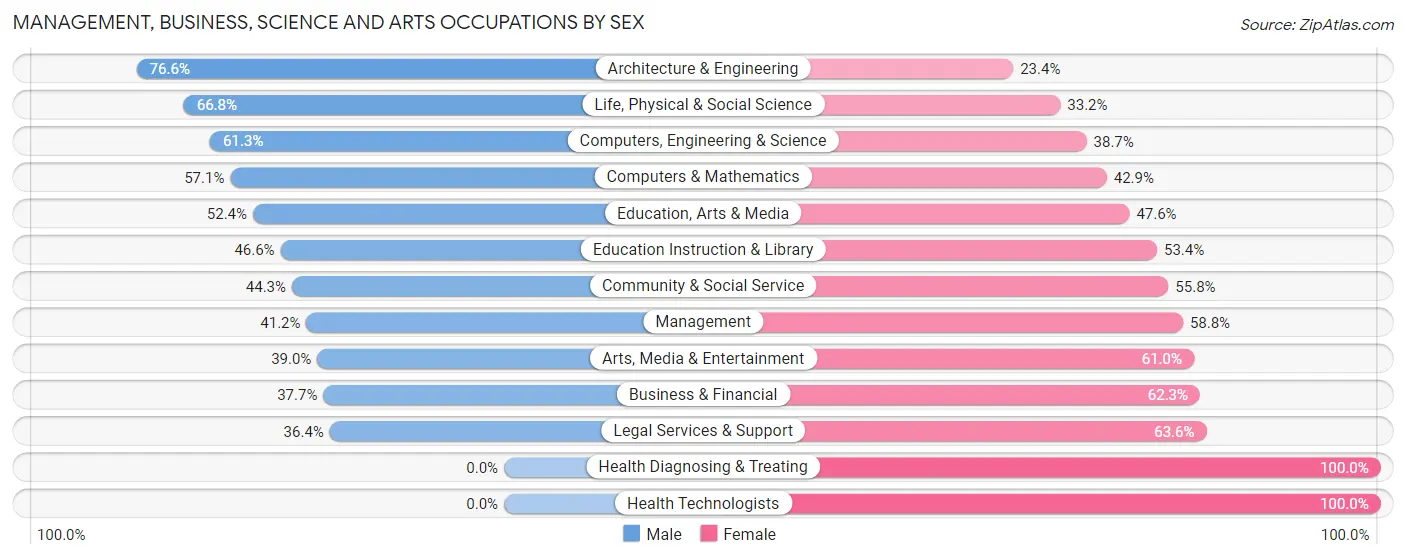
Management, Business, Science and Arts Occupations by Sex
Within the Management, Business, Science and Arts occupations in Brookside, the most male-oriented occupations are Architecture & Engineering (76.6%), Life, Physical & Social Science (66.8%), and Computers, Engineering & Science (61.3%), while the most female-oriented occupations are Health Diagnosing & Treating (100.0%), Health Technologists (100.0%), and Legal Services & Support (63.6%).
| Occupation | Male | Female |
| Management | 209 (41.2%) | 298 (58.8%) |
| Business & Financial | 164 (37.7%) | 271 (62.3%) |
| Computers, Engineering & Science | 596 (61.3%) | 376 (38.7%) |
| Computers & Mathematics | 358 (57.1%) | 269 (42.9%) |
| Architecture & Engineering | 59 (76.6%) | 18 (23.4%) |
| Life, Physical & Social Science | 179 (66.8%) | 89 (33.2%) |
| Community & Social Service | 281 (44.3%) | 354 (55.7%) |
| Education, Arts & Media | 11 (52.4%) | 10 (47.6%) |
| Legal Services & Support | 16 (36.4%) | 28 (63.6%) |
| Education Instruction & Library | 194 (46.6%) | 222 (53.4%) |
| Arts, Media & Entertainment | 60 (39.0%) | 94 (61.0%) |
| Health Diagnosing & Treating | 0 (0.0%) | 178 (100.0%) |
| Health Technologists | 0 (0.0%) | 86 (100.0%) |
| Total (Category) | 1,250 (45.8%) | 1,477 (54.2%) |
| Total (Overall) | 3,818 (51.1%) | 3,649 (48.9%) |
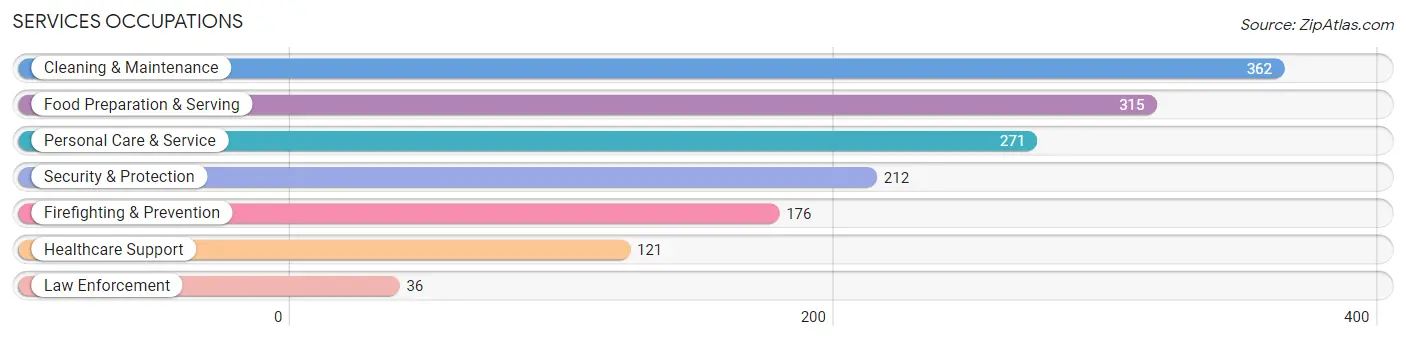
Services Occupations
The most common Services occupations in Brookside are Cleaning & Maintenance (362 | 4.9%), Food Preparation & Serving (315 | 4.2%), Personal Care & Service (271 | 3.6%), Security & Protection (212 | 2.8%), and Firefighting & Prevention (176 | 2.4%).
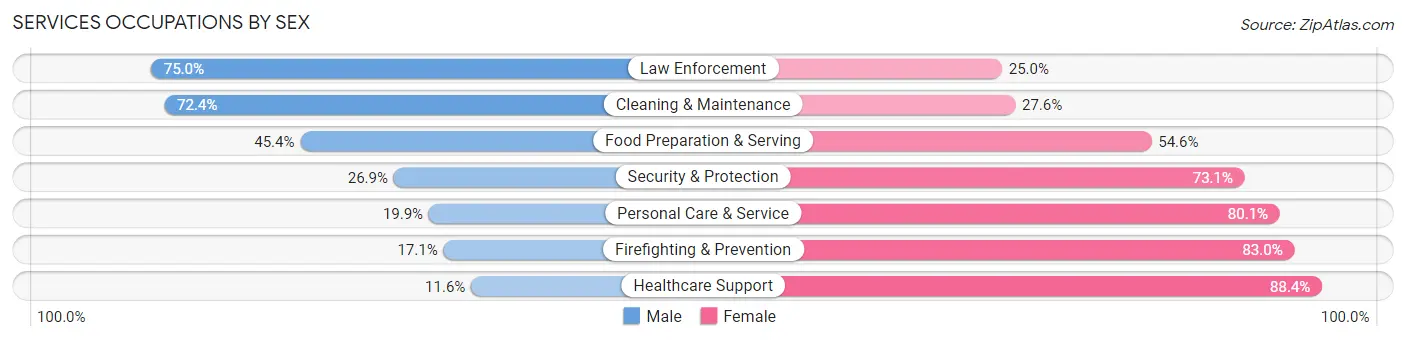
Services Occupations by Sex
Within the Services occupations in Brookside, the most male-oriented occupations are Law Enforcement (75.0%), Cleaning & Maintenance (72.4%), and Food Preparation & Serving (45.4%), while the most female-oriented occupations are Healthcare Support (88.4%), Firefighting & Prevention (83.0%), and Personal Care & Service (80.1%).
| Occupation | Male | Female |
| Healthcare Support | 14 (11.6%) | 107 (88.4%) |
| Security & Protection | 57 (26.9%) | 155 (73.1%) |
| Firefighting & Prevention | 30 (17.1%) | 146 (83.0%) |
| Law Enforcement | 27 (75.0%) | 9 (25.0%) |
| Food Preparation & Serving | 143 (45.4%) | 172 (54.6%) |
| Cleaning & Maintenance | 262 (72.4%) | 100 (27.6%) |
| Personal Care & Service | 54 (19.9%) | 217 (80.1%) |
| Total (Category) | 530 (41.4%) | 751 (58.6%) |
| Total (Overall) | 3,818 (51.1%) | 3,649 (48.9%) |
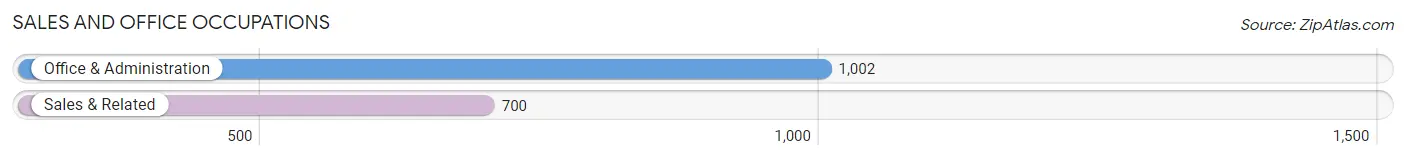
Sales and Office Occupations
The most common Sales and Office occupations in Brookside are Office & Administration (1,002 | 13.4%), and Sales & Related (700 | 9.4%).
Sales and Office Occupations by Sex
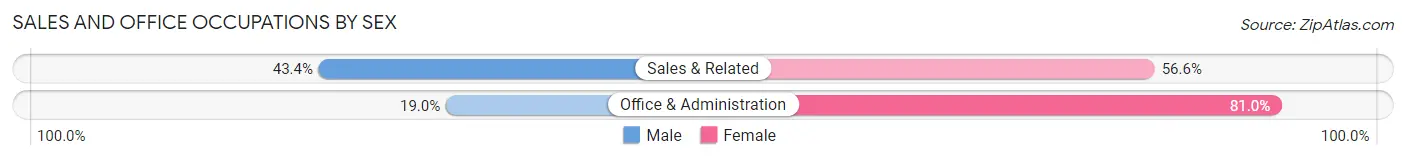
| Occupation | Male | Female |
| Sales & Related | 304 (43.4%) | 396 (56.6%) |
| Office & Administration | 190 (19.0%) | 812 (81.0%) |
| Total (Category) | 494 (29.0%) | 1,208 (71.0%) |
| Total (Overall) | 3,818 (51.1%) | 3,649 (48.9%) |
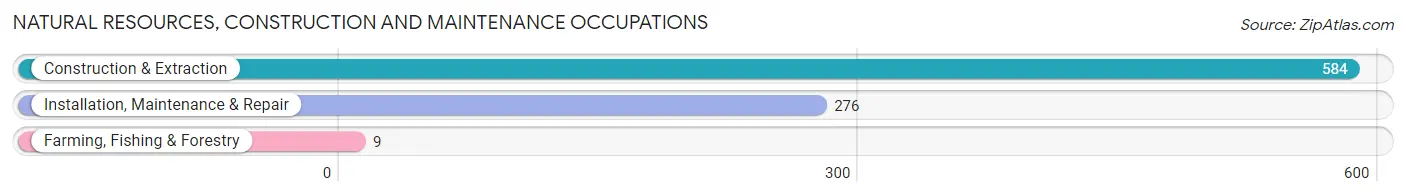
Natural Resources, Construction and Maintenance Occupations
The most common Natural Resources, Construction and Maintenance occupations in Brookside are Construction & Extraction (584 | 7.8%), Installation, Maintenance & Repair (276 | 3.7%), and Farming, Fishing & Forestry (9 | 0.1%).
Natural Resources, Construction and Maintenance Occupations by Sex
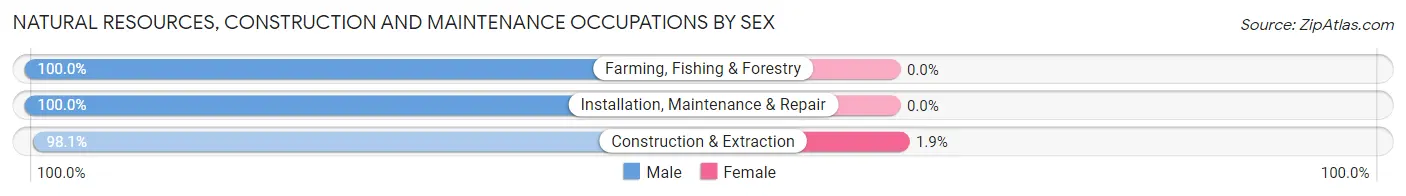
| Occupation | Male | Female |
| Farming, Fishing & Forestry | 9 (100.0%) | 0 (0.0%) |
| Construction & Extraction | 573 (98.1%) | 11 (1.9%) |
| Installation, Maintenance & Repair | 276 (100.0%) | 0 (0.0%) |
| Total (Category) | 858 (98.7%) | 11 (1.3%) |
| Total (Overall) | 3,818 (51.1%) | 3,649 (48.9%) |
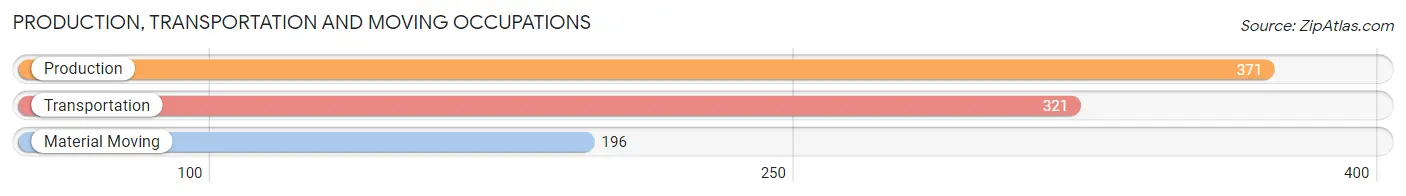
Production, Transportation and Moving Occupations
The most common Production, Transportation and Moving occupations in Brookside are Production (371 | 5.0%), Transportation (321 | 4.3%), and Material Moving (196 | 2.6%).
Production, Transportation and Moving Occupations by Sex
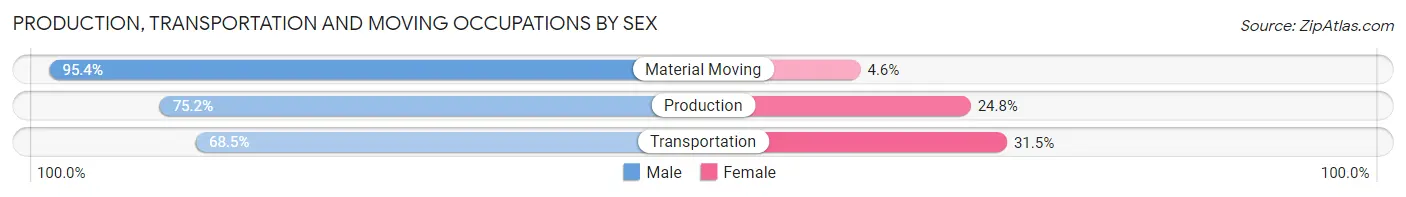
| Occupation | Male | Female |
| Production | 279 (75.2%) | 92 (24.8%) |
| Transportation | 220 (68.5%) | 101 (31.5%) |
| Material Moving | 187 (95.4%) | 9 (4.6%) |
| Total (Category) | 686 (77.2%) | 202 (22.8%) |
| Total (Overall) | 3,818 (51.1%) | 3,649 (48.9%) |
Employment Industries by Sex in Brookside
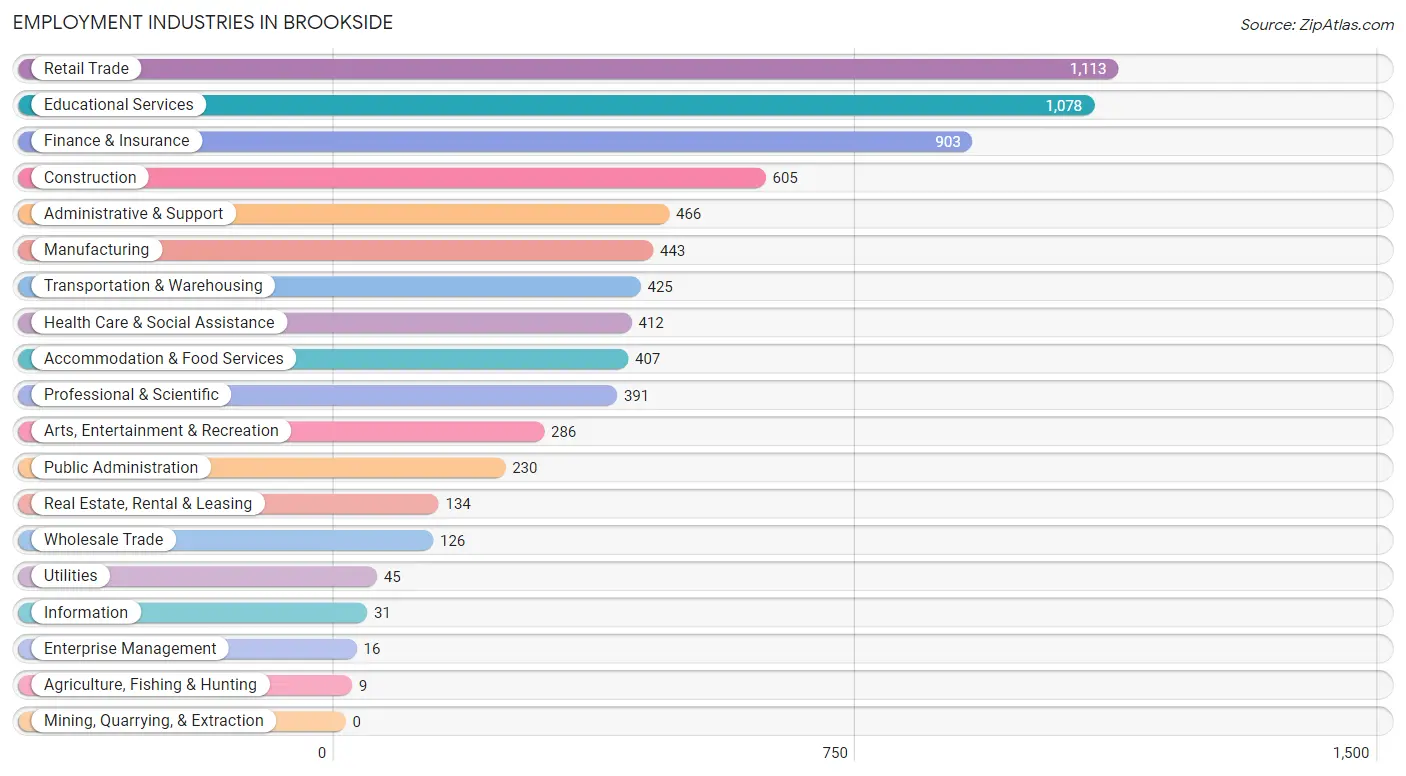
Employment Industries in Brookside
The major employment industries in Brookside include Retail Trade (1,113 | 14.9%), Educational Services (1,078 | 14.4%), Finance & Insurance (903 | 12.1%), Construction (605 | 8.1%), and Administrative & Support (466 | 6.2%).
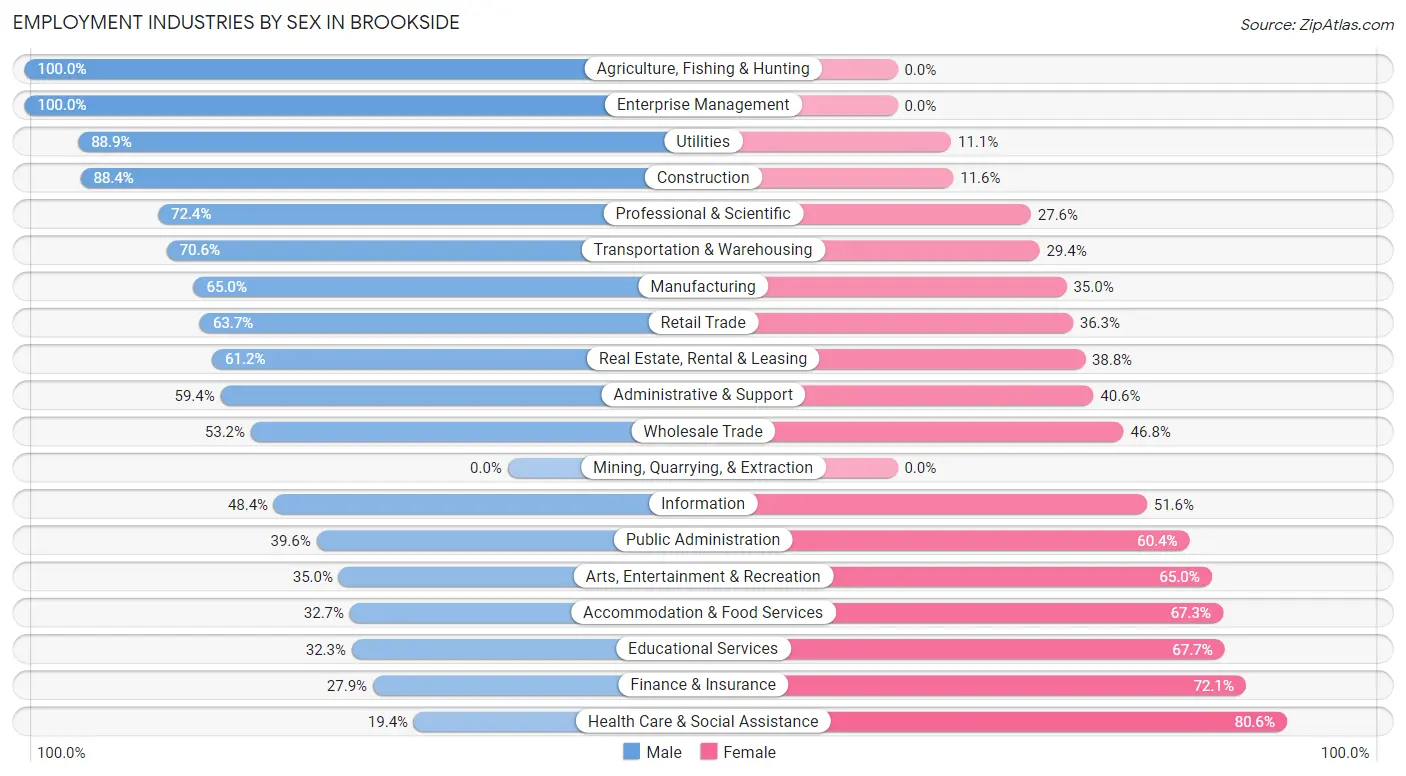
Employment Industries by Sex in Brookside
The Brookside industries that see more men than women are Agriculture, Fishing & Hunting (100.0%), Enterprise Management (100.0%), and Utilities (88.9%), whereas the industries that tend to have a higher number of women are Health Care & Social Assistance (80.6%), Finance & Insurance (72.1%), and Educational Services (67.7%).
| Industry | Male | Female |
| Agriculture, Fishing & Hunting | 9 (100.0%) | 0 (0.0%) |
| Mining, Quarrying, & Extraction | 0 (0.0%) | 0 (0.0%) |
| Construction | 535 (88.4%) | 70 (11.6%) |
| Manufacturing | 288 (65.0%) | 155 (35.0%) |
| Wholesale Trade | 67 (53.2%) | 59 (46.8%) |
| Retail Trade | 709 (63.7%) | 404 (36.3%) |
| Transportation & Warehousing | 300 (70.6%) | 125 (29.4%) |
| Utilities | 40 (88.9%) | 5 (11.1%) |
| Information | 15 (48.4%) | 16 (51.6%) |
| Finance & Insurance | 252 (27.9%) | 651 (72.1%) |
| Real Estate, Rental & Leasing | 82 (61.2%) | 52 (38.8%) |
| Professional & Scientific | 283 (72.4%) | 108 (27.6%) |
| Enterprise Management | 16 (100.0%) | 0 (0.0%) |
| Administrative & Support | 277 (59.4%) | 189 (40.6%) |
| Educational Services | 348 (32.3%) | 730 (67.7%) |
| Health Care & Social Assistance | 80 (19.4%) | 332 (80.6%) |
| Arts, Entertainment & Recreation | 100 (35.0%) | 186 (65.0%) |
| Accommodation & Food Services | 133 (32.7%) | 274 (67.3%) |
| Public Administration | 91 (39.6%) | 139 (60.4%) |
| Total | 3,818 (51.1%) | 3,649 (48.9%) |
Education in Brookside
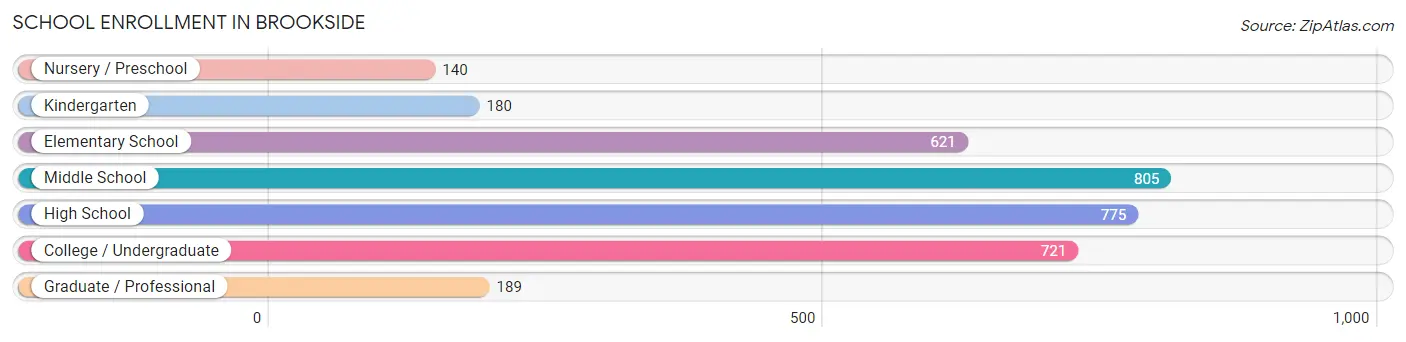
School Enrollment in Brookside
The most common levels of schooling among the 3,431 students in Brookside are middle school (805 | 23.5%), high school (775 | 22.6%), and college / undergraduate (721 | 21.0%).
| School Level | # Students | % Students |
| Nursery / Preschool | 140 | 4.1% |
| Kindergarten | 180 | 5.2% |
| Elementary School | 621 | 18.1% |
| Middle School | 805 | 23.5% |
| High School | 775 | 22.6% |
| College / Undergraduate | 721 | 21.0% |
| Graduate / Professional | 189 | 5.5% |
| Total | 3,431 | 100.0% |
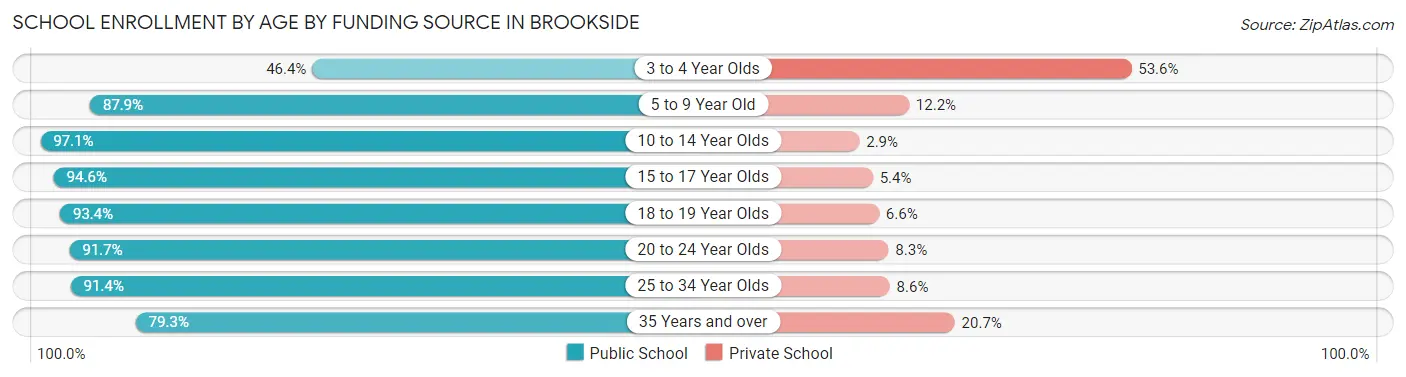
School Enrollment by Age by Funding Source in Brookside
Out of a total of 3,431 students who are enrolled in schools in Brookside, 360 (10.5%) attend a private institution, while the remaining 3,071 (89.5%) are enrolled in public schools. The age group of 3 to 4 year olds has the highest likelihood of being enrolled in private schools, with 75 (53.6% in the age bracket) enrolled. Conversely, the age group of 10 to 14 year olds has the lowest likelihood of being enrolled in a private school, with 935 (97.1% in the age bracket) attending a public institution.
| Age Bracket | Public School | Private School |
| 3 to 4 Year Olds | 65 (46.4%) | 75 (53.6%) |
| 5 to 9 Year Old | 651 (87.8%) | 90 (12.1%) |
| 10 to 14 Year Olds | 935 (97.1%) | 28 (2.9%) |
| 15 to 17 Year Olds | 437 (94.6%) | 25 (5.4%) |
| 18 to 19 Year Olds | 171 (93.4%) | 12 (6.6%) |
| 20 to 24 Year Olds | 253 (91.7%) | 23 (8.3%) |
| 25 to 34 Year Olds | 224 (91.4%) | 21 (8.6%) |
| 35 Years and over | 334 (79.3%) | 87 (20.7%) |
| Total | 3,071 (89.5%) | 360 (10.5%) |
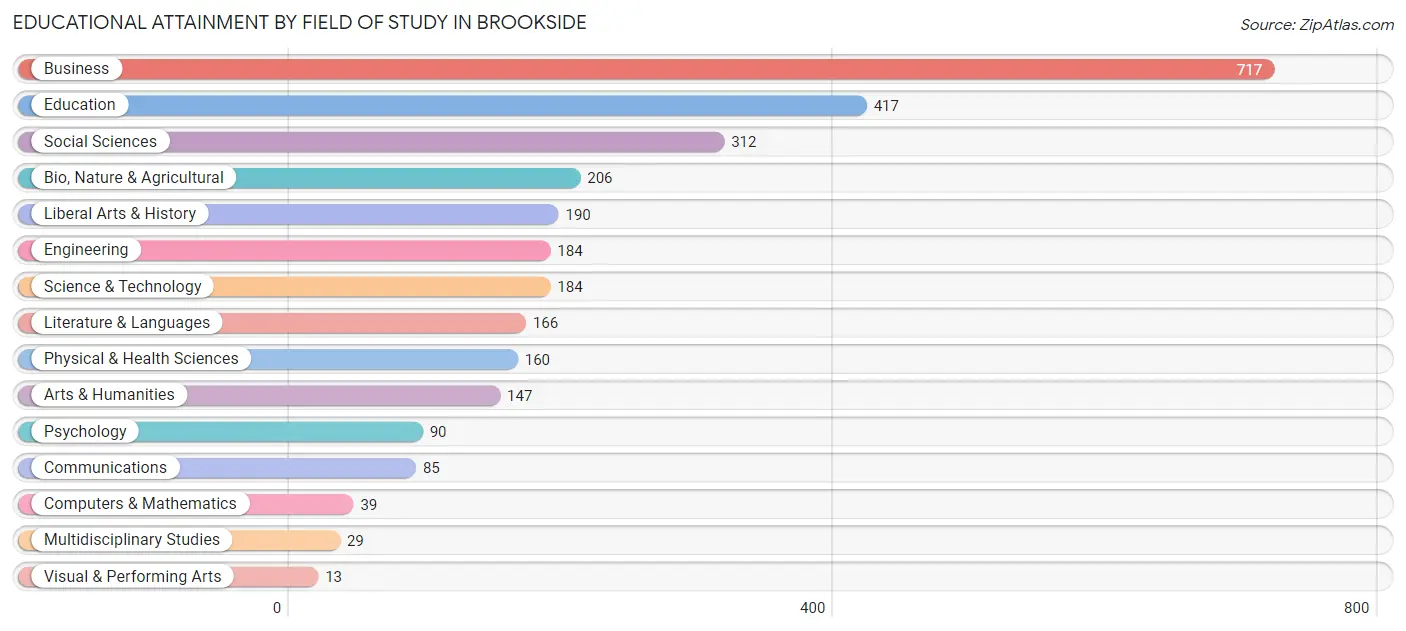
Educational Attainment by Field of Study in Brookside
Business (717 | 24.4%), education (417 | 14.2%), social sciences (312 | 10.6%), bio, nature & agricultural (206 | 7.0%), and liberal arts & history (190 | 6.5%) are the most common fields of study among 2,939 individuals in Brookside who have obtained a bachelor's degree or higher.
| Field of Study | # Graduates | % Graduates |
| Computers & Mathematics | 39 | 1.3% |
| Bio, Nature & Agricultural | 206 | 7.0% |
| Physical & Health Sciences | 160 | 5.4% |
| Psychology | 90 | 3.1% |
| Social Sciences | 312 | 10.6% |
| Engineering | 184 | 6.3% |
| Multidisciplinary Studies | 29 | 1.0% |
| Science & Technology | 184 | 6.3% |
| Business | 717 | 24.4% |
| Education | 417 | 14.2% |
| Literature & Languages | 166 | 5.7% |
| Liberal Arts & History | 190 | 6.5% |
| Visual & Performing Arts | 13 | 0.4% |
| Communications | 85 | 2.9% |
| Arts & Humanities | 147 | 5.0% |
| Total | 2,939 | 100.0% |
Transportation & Commute in Brookside
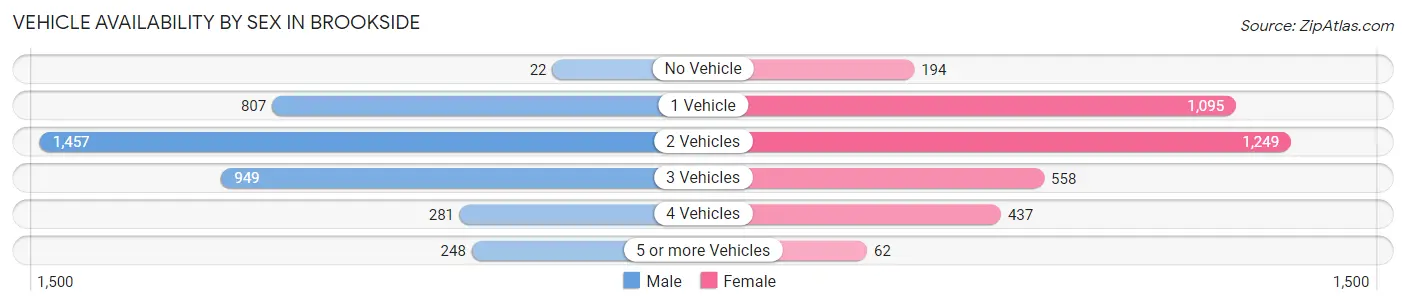
Vehicle Availability by Sex in Brookside
The most prevalent vehicle ownership categories in Brookside are males with 2 vehicles (1,457, accounting for 38.7%) and females with 2 vehicles (1,249, making up 40.5%).
| Vehicles Available | Male | Female |
| No Vehicle | 22 (0.6%) | 194 (5.4%) |
| 1 Vehicle | 807 (21.4%) | 1,095 (30.5%) |
| 2 Vehicles | 1,457 (38.7%) | 1,249 (34.7%) |
| 3 Vehicles | 949 (25.2%) | 558 (15.5%) |
| 4 Vehicles | 281 (7.5%) | 437 (12.2%) |
| 5 or more Vehicles | 248 (6.6%) | 62 (1.7%) |
| Total | 3,764 (100.0%) | 3,595 (100.0%) |
Commute Time in Brookside
The most frequently occuring commute durations in Brookside are 15 to 19 minutes (1,348 commuters, 20.8%), 20 to 24 minutes (1,235 commuters, 19.0%), and 10 to 14 minutes (878 commuters, 13.5%).
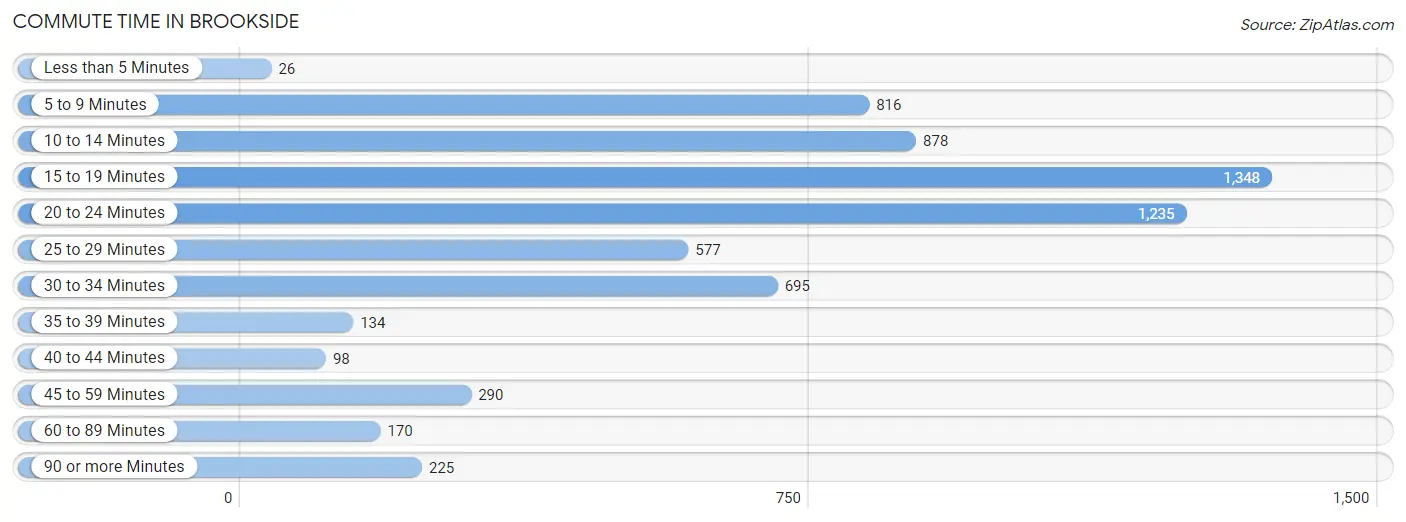
| Commute Time | # Commuters | % Commuters |
| Less than 5 Minutes | 26 | 0.4% |
| 5 to 9 Minutes | 816 | 12.6% |
| 10 to 14 Minutes | 878 | 13.5% |
| 15 to 19 Minutes | 1,348 | 20.8% |
| 20 to 24 Minutes | 1,235 | 19.0% |
| 25 to 29 Minutes | 577 | 8.9% |
| 30 to 34 Minutes | 695 | 10.7% |
| 35 to 39 Minutes | 134 | 2.1% |
| 40 to 44 Minutes | 98 | 1.5% |
| 45 to 59 Minutes | 290 | 4.5% |
| 60 to 89 Minutes | 170 | 2.6% |
| 90 or more Minutes | 225 | 3.5% |
Commute Time by Sex in Brookside
The most common commute times in Brookside are 20 to 24 minutes (709 commuters, 21.2%) for males and 15 to 19 minutes (782 commuters, 24.9%) for females.
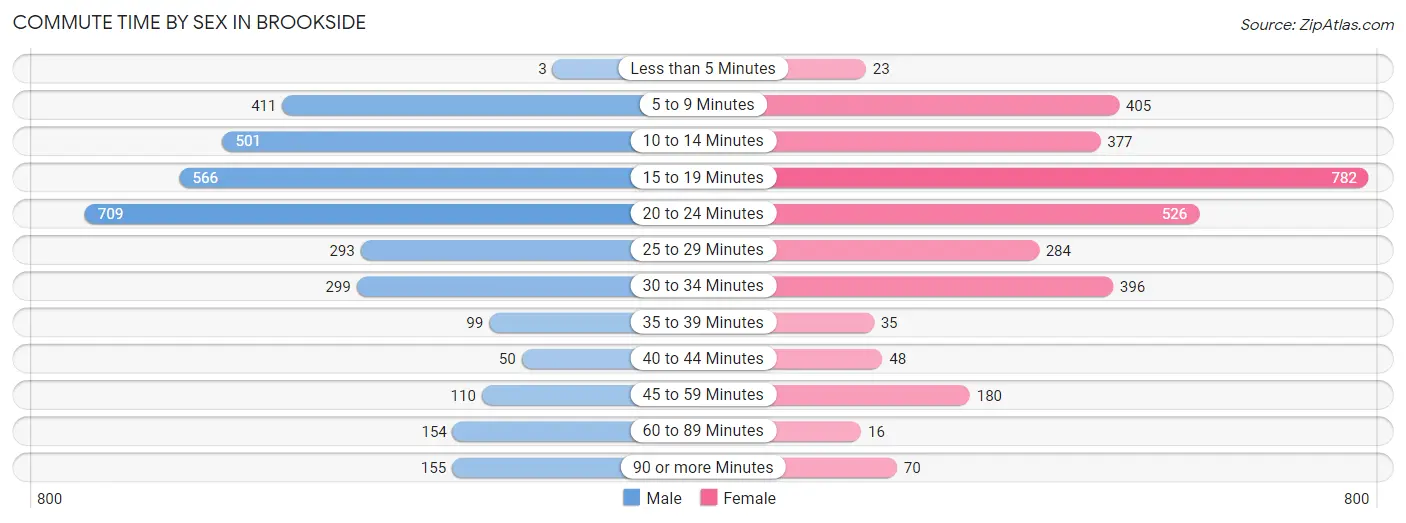
| Commute Time | Male | Female |
| Less than 5 Minutes | 3 (0.1%) | 23 (0.7%) |
| 5 to 9 Minutes | 411 (12.3%) | 405 (12.9%) |
| 10 to 14 Minutes | 501 (15.0%) | 377 (12.0%) |
| 15 to 19 Minutes | 566 (16.9%) | 782 (24.9%) |
| 20 to 24 Minutes | 709 (21.2%) | 526 (16.7%) |
| 25 to 29 Minutes | 293 (8.7%) | 284 (9.0%) |
| 30 to 34 Minutes | 299 (8.9%) | 396 (12.6%) |
| 35 to 39 Minutes | 99 (3.0%) | 35 (1.1%) |
| 40 to 44 Minutes | 50 (1.5%) | 48 (1.5%) |
| 45 to 59 Minutes | 110 (3.3%) | 180 (5.7%) |
| 60 to 89 Minutes | 154 (4.6%) | 16 (0.5%) |
| 90 or more Minutes | 155 (4.6%) | 70 (2.2%) |
Time of Departure to Work by Sex in Brookside
The most frequent times of departure to work in Brookside are 6:30 AM to 6:59 AM (592, 17.7%) for males and 8:00 AM to 8:29 AM (505, 16.1%) for females.
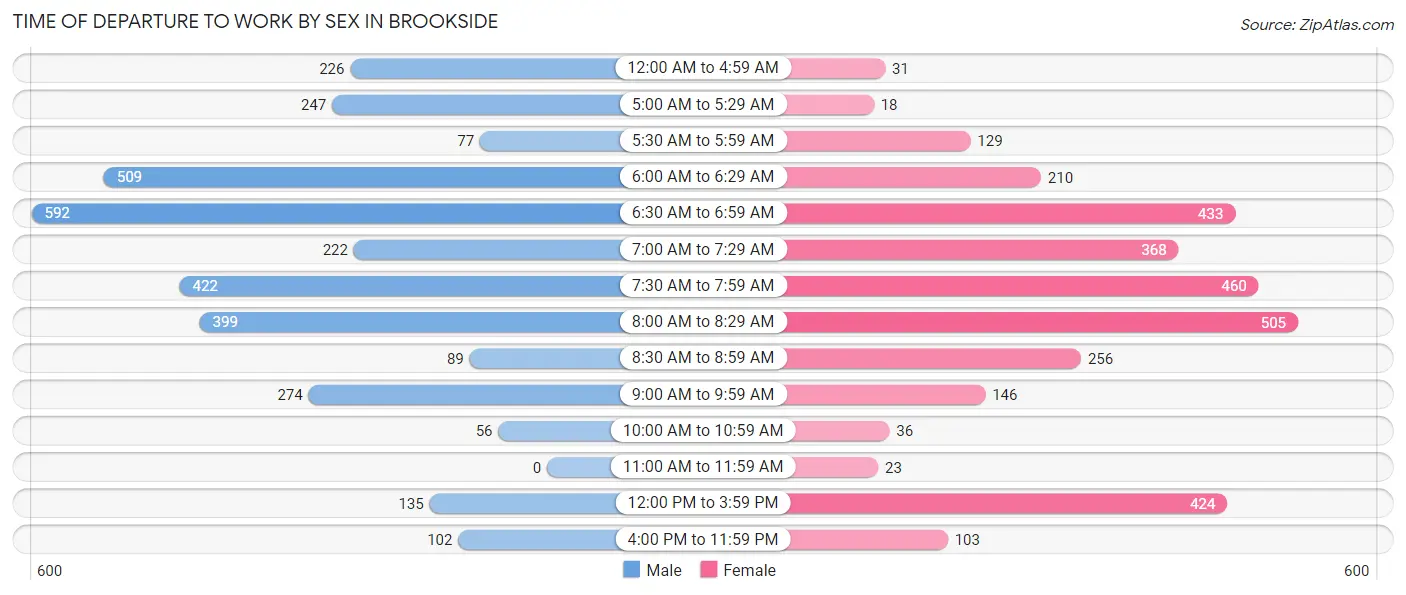
| Time of Departure | Male | Female |
| 12:00 AM to 4:59 AM | 226 (6.8%) | 31 (1.0%) |
| 5:00 AM to 5:29 AM | 247 (7.4%) | 18 (0.6%) |
| 5:30 AM to 5:59 AM | 77 (2.3%) | 129 (4.1%) |
| 6:00 AM to 6:29 AM | 509 (15.2%) | 210 (6.7%) |
| 6:30 AM to 6:59 AM | 592 (17.7%) | 433 (13.8%) |
| 7:00 AM to 7:29 AM | 222 (6.6%) | 368 (11.7%) |
| 7:30 AM to 7:59 AM | 422 (12.6%) | 460 (14.6%) |
| 8:00 AM to 8:29 AM | 399 (11.9%) | 505 (16.1%) |
| 8:30 AM to 8:59 AM | 89 (2.7%) | 256 (8.2%) |
| 9:00 AM to 9:59 AM | 274 (8.2%) | 146 (4.6%) |
| 10:00 AM to 10:59 AM | 56 (1.7%) | 36 (1.1%) |
| 11:00 AM to 11:59 AM | 0 (0.0%) | 23 (0.7%) |
| 12:00 PM to 3:59 PM | 135 (4.0%) | 424 (13.5%) |
| 4:00 PM to 11:59 PM | 102 (3.0%) | 103 (3.3%) |
| Total | 3,350 (100.0%) | 3,142 (100.0%) |
Housing Occupancy in Brookside
Occupancy by Ownership in Brookside
Of the total 5,478 dwellings in Brookside, owner-occupied units account for 3,328 (60.8%), while renter-occupied units make up 2,150 (39.3%).
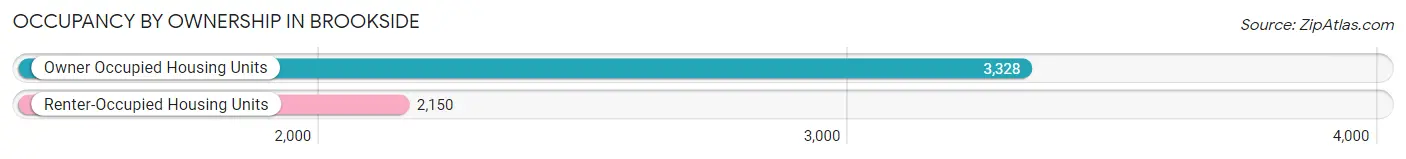
| Occupancy | # Housing Units | % Housing Units |
| Owner Occupied Housing Units | 3,328 | 60.8% |
| Renter-Occupied Housing Units | 2,150 | 39.3% |
| Total Occupied Housing Units | 5,478 | 100.0% |
Occupancy by Household Size in Brookside
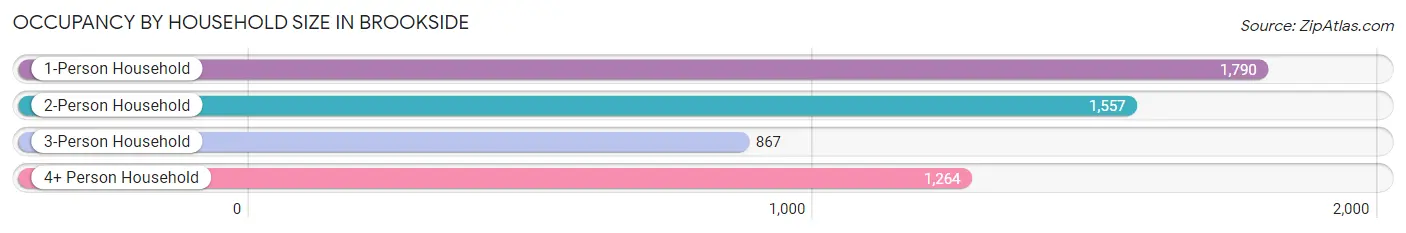
| Household Size | # Housing Units | % Housing Units |
| 1-Person Household | 1,790 | 32.7% |
| 2-Person Household | 1,557 | 28.4% |
| 3-Person Household | 867 | 15.8% |
| 4+ Person Household | 1,264 | 23.1% |
| Total Housing Units | 5,478 | 100.0% |
Occupancy by Ownership by Household Size in Brookside
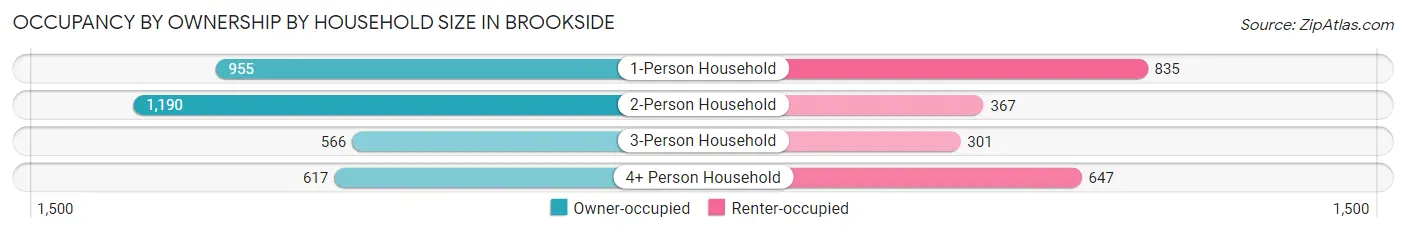
| Household Size | Owner-occupied | Renter-occupied |
| 1-Person Household | 955 (53.3%) | 835 (46.7%) |
| 2-Person Household | 1,190 (76.4%) | 367 (23.6%) |
| 3-Person Household | 566 (65.3%) | 301 (34.7%) |
| 4+ Person Household | 617 (48.8%) | 647 (51.2%) |
| Total Housing Units | 3,328 (60.8%) | 2,150 (39.3%) |
Occupancy by Educational Attainment in Brookside
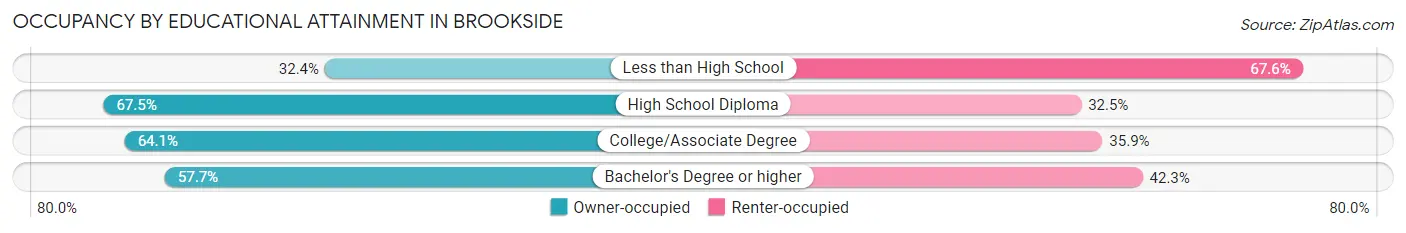
| Household Size | Owner-occupied | Renter-occupied |
| Less than High School | 123 (32.4%) | 257 (67.6%) |
| High School Diploma | 1,168 (67.5%) | 563 (32.5%) |
| College/Associate Degree | 933 (64.1%) | 522 (35.9%) |
| Bachelor's Degree or higher | 1,104 (57.7%) | 808 (42.3%) |
Occupancy by Age of Householder in Brookside
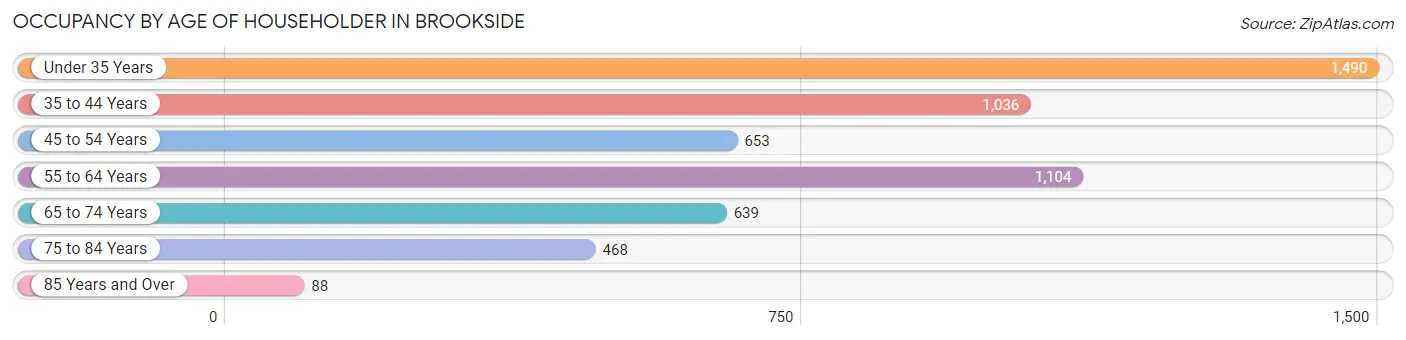
| Age Bracket | # Households | % Households |
| Under 35 Years | 1,490 | 27.2% |
| 35 to 44 Years | 1,036 | 18.9% |
| 45 to 54 Years | 653 | 11.9% |
| 55 to 64 Years | 1,104 | 20.2% |
| 65 to 74 Years | 639 | 11.7% |
| 75 to 84 Years | 468 | 8.5% |
| 85 Years and Over | 88 | 1.6% |
| Total | 5,478 | 100.0% |
Housing Finances in Brookside
Median Income by Occupancy in Brookside
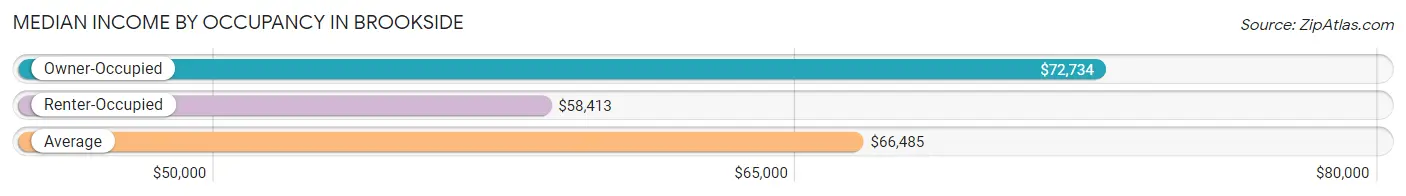
| Occupancy Type | # Households | Median Income |
| Owner-Occupied | 3,328 (60.8%) | $72,734 |
| Renter-Occupied | 2,150 (39.3%) | $58,413 |
| Average | 5,478 (100.0%) | $66,485 |
Occupancy by Householder Income Bracket in Brookside
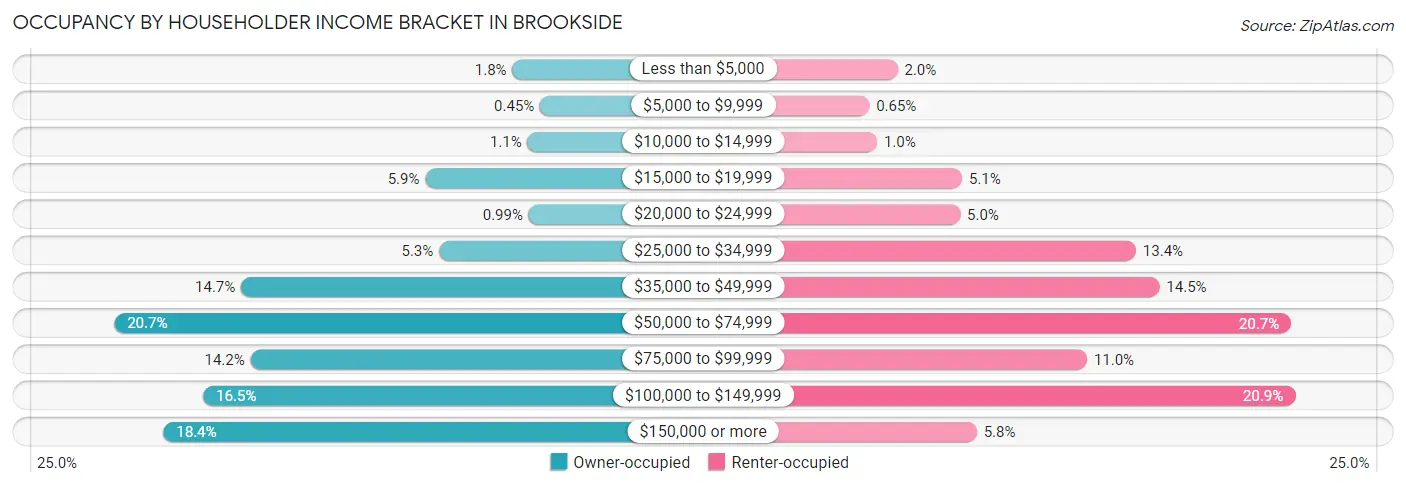
| Income Bracket | Owner-occupied | Renter-occupied |
| Less than $5,000 | 59 (1.8%) | 43 (2.0%) |
| $5,000 to $9,999 | 15 (0.4%) | 14 (0.6%) |
| $10,000 to $14,999 | 35 (1.1%) | 22 (1.0%) |
| $15,000 to $19,999 | 197 (5.9%) | 109 (5.1%) |
| $20,000 to $24,999 | 33 (1.0%) | 107 (5.0%) |
| $25,000 to $34,999 | 175 (5.3%) | 287 (13.4%) |
| $35,000 to $49,999 | 489 (14.7%) | 311 (14.5%) |
| $50,000 to $74,999 | 690 (20.7%) | 446 (20.7%) |
| $75,000 to $99,999 | 474 (14.2%) | 237 (11.0%) |
| $100,000 to $149,999 | 549 (16.5%) | 450 (20.9%) |
| $150,000 or more | 612 (18.4%) | 124 (5.8%) |
| Total | 3,328 (100.0%) | 2,150 (100.0%) |
Monthly Housing Cost Tiers in Brookside
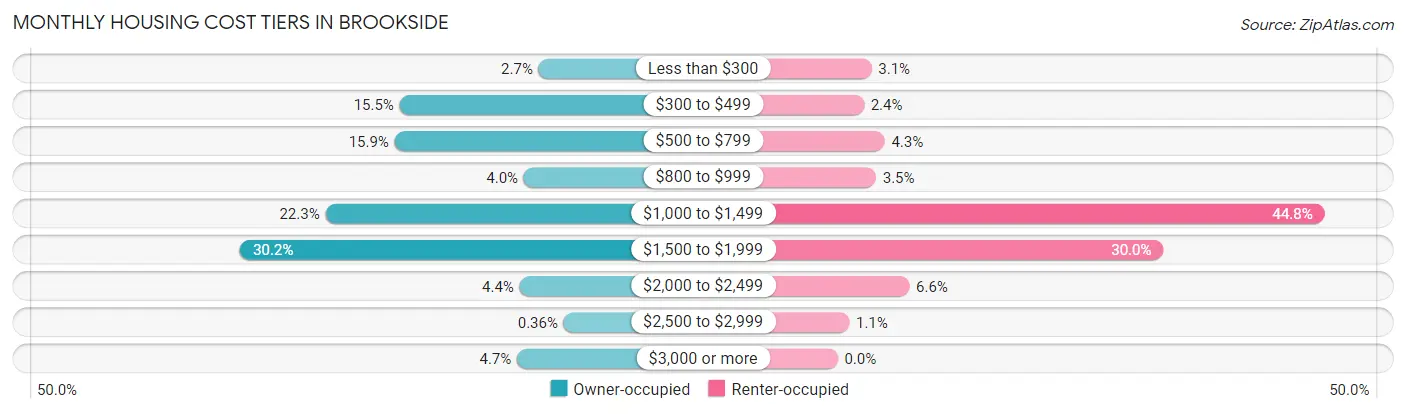
| Monthly Cost | Owner-occupied | Renter-occupied |
| Less than $300 | 89 (2.7%) | 67 (3.1%) |
| $300 to $499 | 515 (15.5%) | 52 (2.4%) |
| $500 to $799 | 530 (15.9%) | 93 (4.3%) |
| $800 to $999 | 134 (4.0%) | 76 (3.5%) |
| $1,000 to $1,499 | 742 (22.3%) | 964 (44.8%) |
| $1,500 to $1,999 | 1,004 (30.2%) | 645 (30.0%) |
| $2,000 to $2,499 | 147 (4.4%) | 142 (6.6%) |
| $2,500 to $2,999 | 12 (0.4%) | 23 (1.1%) |
| $3,000 or more | 155 (4.7%) | 0 (0.0%) |
| Total | 3,328 (100.0%) | 2,150 (100.0%) |
Physical Housing Characteristics in Brookside
Housing Structures in Brookside
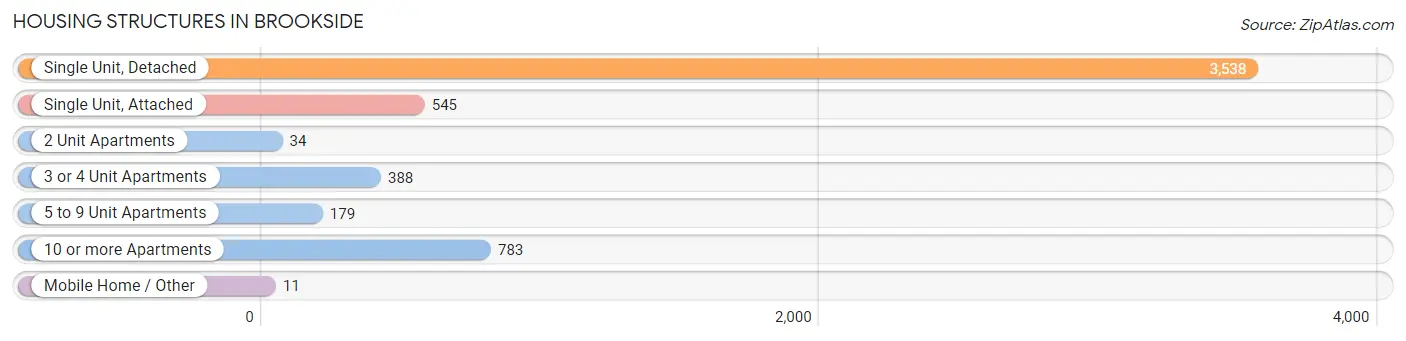
| Structure Type | # Housing Units | % Housing Units |
| Single Unit, Detached | 3,538 | 64.6% |
| Single Unit, Attached | 545 | 10.0% |
| 2 Unit Apartments | 34 | 0.6% |
| 3 or 4 Unit Apartments | 388 | 7.1% |
| 5 to 9 Unit Apartments | 179 | 3.3% |
| 10 or more Apartments | 783 | 14.3% |
| Mobile Home / Other | 11 | 0.2% |
| Total | 5,478 | 100.0% |
Housing Structures by Occupancy in Brookside
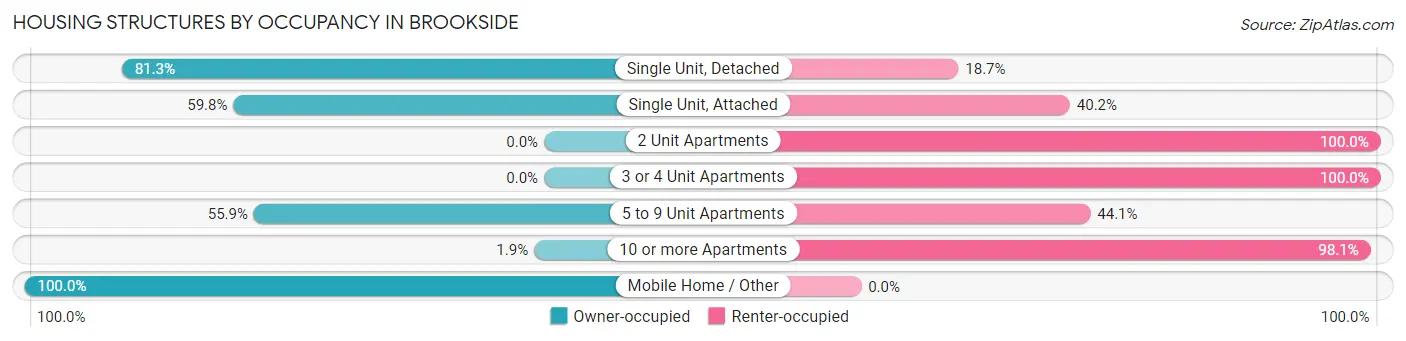
| Structure Type | Owner-occupied | Renter-occupied |
| Single Unit, Detached | 2,876 (81.3%) | 662 (18.7%) |
| Single Unit, Attached | 326 (59.8%) | 219 (40.2%) |
| 2 Unit Apartments | 0 (0.0%) | 34 (100.0%) |
| 3 or 4 Unit Apartments | 0 (0.0%) | 388 (100.0%) |
| 5 to 9 Unit Apartments | 100 (55.9%) | 79 (44.1%) |
| 10 or more Apartments | 15 (1.9%) | 768 (98.1%) |
| Mobile Home / Other | 11 (100.0%) | 0 (0.0%) |
| Total | 3,328 (60.8%) | 2,150 (39.3%) |
Housing Structures by Number of Rooms in Brookside
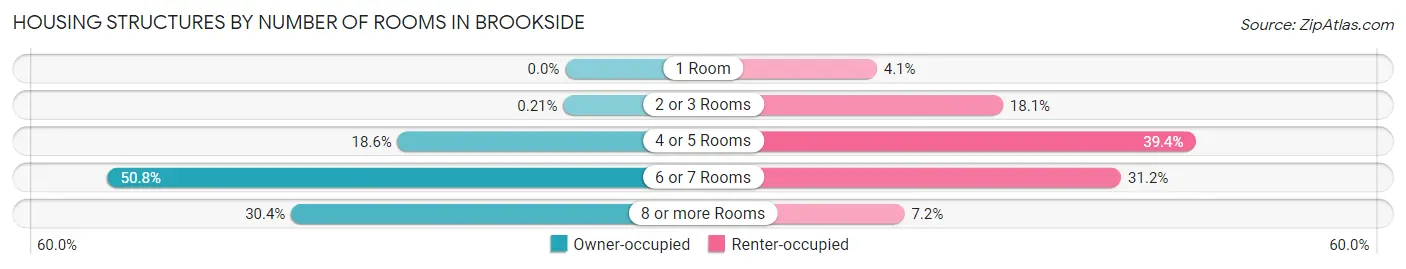
| Number of Rooms | Owner-occupied | Renter-occupied |
| 1 Room | 0 (0.0%) | 88 (4.1%) |
| 2 or 3 Rooms | 7 (0.2%) | 389 (18.1%) |
| 4 or 5 Rooms | 619 (18.6%) | 848 (39.4%) |
| 6 or 7 Rooms | 1,690 (50.8%) | 671 (31.2%) |
| 8 or more Rooms | 1,012 (30.4%) | 154 (7.2%) |
| Total | 3,328 (100.0%) | 2,150 (100.0%) |
Housing Structure by Heating Type in Brookside
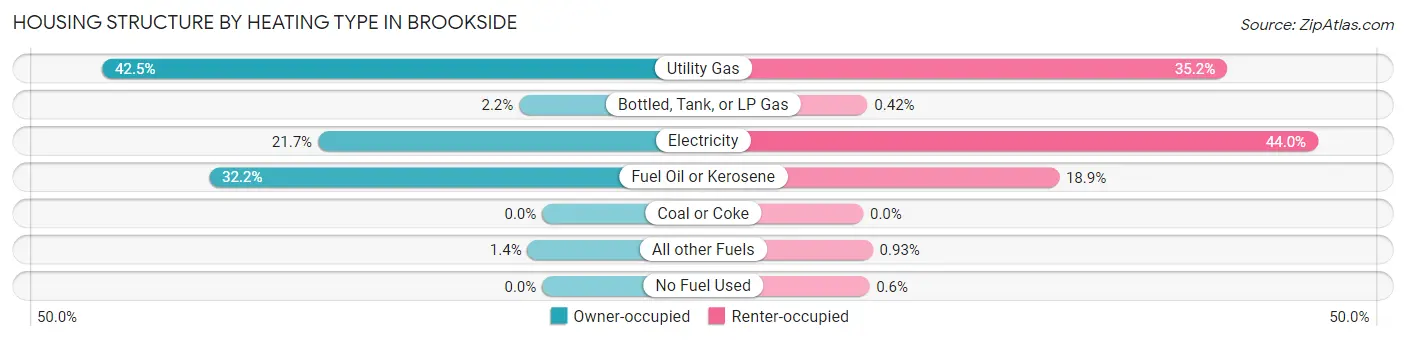
| Heating Type | Owner-occupied | Renter-occupied |
| Utility Gas | 1,415 (42.5%) | 756 (35.2%) |
| Bottled, Tank, or LP Gas | 74 (2.2%) | 9 (0.4%) |
| Electricity | 721 (21.7%) | 945 (44.0%) |
| Fuel Oil or Kerosene | 1,071 (32.2%) | 407 (18.9%) |
| Coal or Coke | 0 (0.0%) | 0 (0.0%) |
| All other Fuels | 47 (1.4%) | 20 (0.9%) |
| No Fuel Used | 0 (0.0%) | 13 (0.6%) |
| Total | 3,328 (100.0%) | 2,150 (100.0%) |
Household Vehicle Usage in Brookside
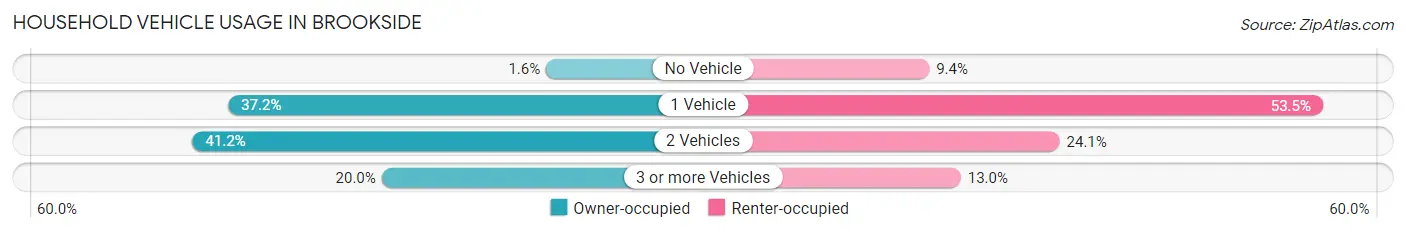
| Vehicles per Household | Owner-occupied | Renter-occupied |
| No Vehicle | 53 (1.6%) | 203 (9.4%) |
| 1 Vehicle | 1,238 (37.2%) | 1,151 (53.5%) |
| 2 Vehicles | 1,371 (41.2%) | 517 (24.0%) |
| 3 or more Vehicles | 666 (20.0%) | 279 (13.0%) |
| Total | 3,328 (100.0%) | 2,150 (100.0%) |
Real Estate & Mortgages in Brookside
Real Estate and Mortgage Overview in Brookside
| Characteristic | Without Mortgage | With Mortgage |
| Housing Units | 1,162 | 2,166 |
| Median Property Value | $242,600 | $242,700 |
| Median Household Income | $63,828 | $511 |
| Monthly Housing Costs | $492 | $155 |
| Real Estate Taxes | $1,484 | $45 |
Property Value by Mortgage Status in Brookside
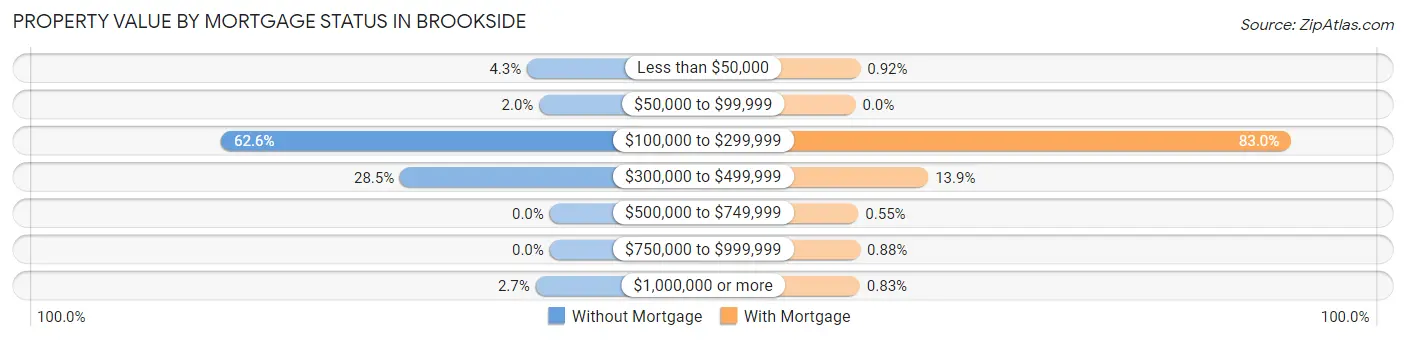
| Property Value | Without Mortgage | With Mortgage |
| Less than $50,000 | 50 (4.3%) | 20 (0.9%) |
| $50,000 to $99,999 | 23 (2.0%) | 0 (0.0%) |
| $100,000 to $299,999 | 727 (62.6%) | 1,797 (83.0%) |
| $300,000 to $499,999 | 331 (28.5%) | 300 (13.9%) |
| $500,000 to $749,999 | 0 (0.0%) | 12 (0.5%) |
| $750,000 to $999,999 | 0 (0.0%) | 19 (0.9%) |
| $1,000,000 or more | 31 (2.7%) | 18 (0.8%) |
| Total | 1,162 (100.0%) | 2,166 (100.0%) |
Household Income by Mortgage Status in Brookside
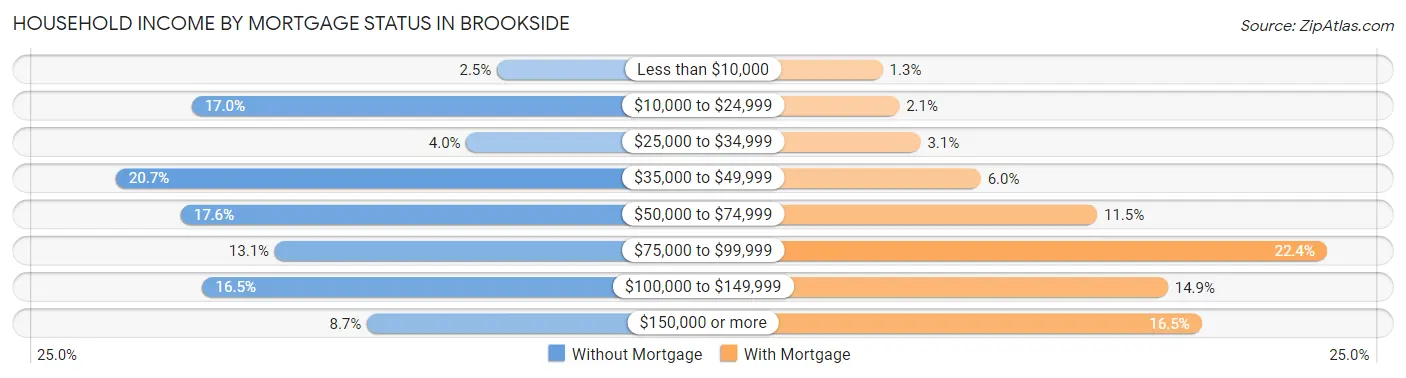
| Household Income | Without Mortgage | With Mortgage |
| Less than $10,000 | 29 (2.5%) | 28 (1.3%) |
| $10,000 to $24,999 | 198 (17.0%) | 45 (2.1%) |
| $25,000 to $34,999 | 46 (4.0%) | 67 (3.1%) |
| $35,000 to $49,999 | 240 (20.6%) | 129 (6.0%) |
| $50,000 to $74,999 | 204 (17.6%) | 249 (11.5%) |
| $75,000 to $99,999 | 152 (13.1%) | 486 (22.4%) |
| $100,000 to $149,999 | 192 (16.5%) | 322 (14.9%) |
| $150,000 or more | 101 (8.7%) | 357 (16.5%) |
| Total | 1,162 (100.0%) | 2,166 (100.0%) |
Property Value to Household Income Ratio in Brookside
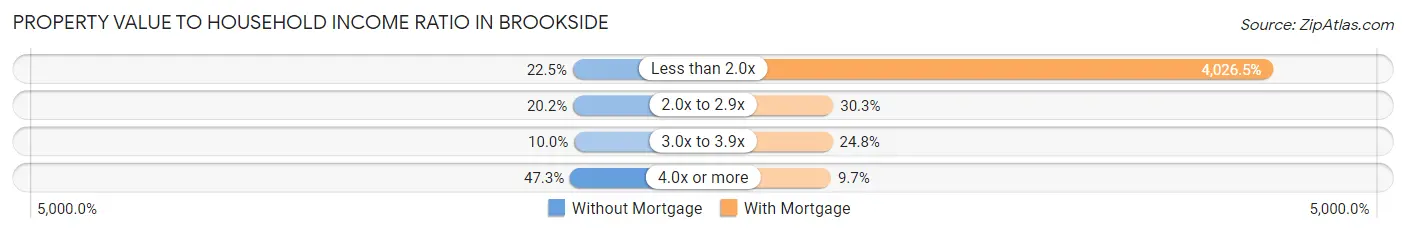
| Value-to-Income Ratio | Without Mortgage | With Mortgage |
| Less than 2.0x | 261 (22.5%) | 87,214 (4,026.5%) |
| 2.0x to 2.9x | 235 (20.2%) | 657 (30.3%) |
| 3.0x to 3.9x | 116 (10.0%) | 538 (24.8%) |
| 4.0x or more | 550 (47.3%) | 211 (9.7%) |
| Total | 1,162 (100.0%) | 2,166 (100.0%) |
Real Estate Taxes by Mortgage Status in Brookside
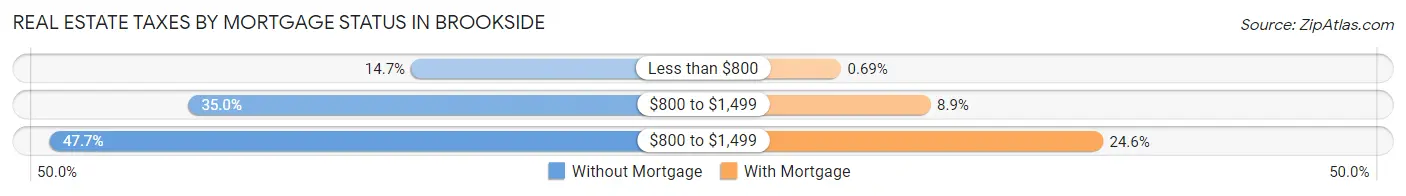
| Property Taxes | Without Mortgage | With Mortgage |
| Less than $800 | 171 (14.7%) | 15 (0.7%) |
| $800 to $1,499 | 407 (35.0%) | 192 (8.9%) |
| $800 to $1,499 | 554 (47.7%) | 533 (24.6%) |
| Total | 1,162 (100.0%) | 2,166 (100.0%) |
Health & Disability in Brookside
Health Insurance Coverage by Age in Brookside
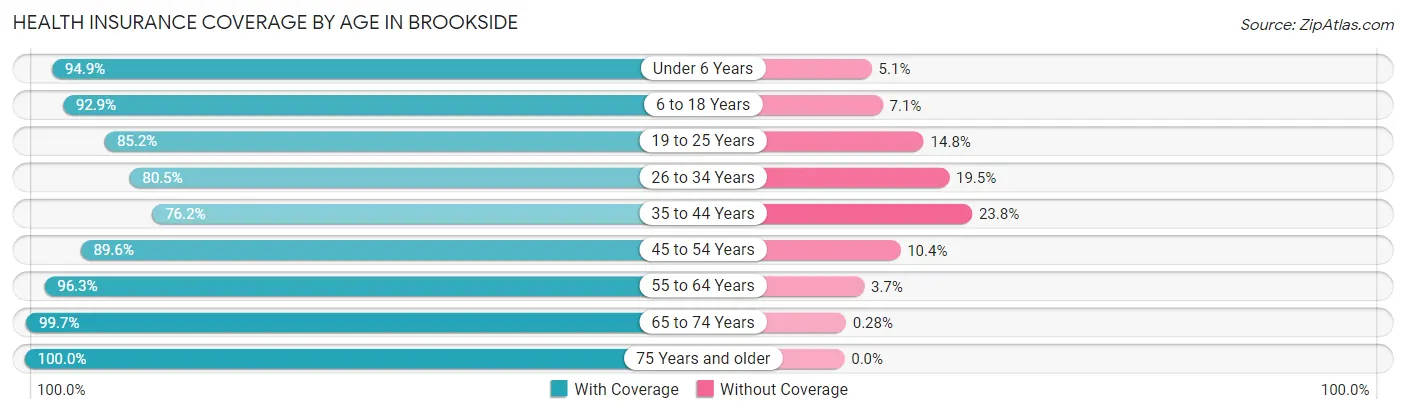
| Age Bracket | With Coverage | Without Coverage |
| Under 6 Years | 1,023 (94.9%) | 55 (5.1%) |
| 6 to 18 Years | 2,080 (92.9%) | 160 (7.1%) |
| 19 to 25 Years | 1,111 (85.2%) | 193 (14.8%) |
| 26 to 34 Years | 2,153 (80.5%) | 523 (19.5%) |
| 35 to 44 Years | 1,677 (76.2%) | 524 (23.8%) |
| 45 to 54 Years | 1,108 (89.6%) | 129 (10.4%) |
| 55 to 64 Years | 1,674 (96.3%) | 64 (3.7%) |
| 65 to 74 Years | 1,050 (99.7%) | 3 (0.3%) |
| 75 Years and older | 743 (100.0%) | 0 (0.0%) |
| Total | 12,619 (88.4%) | 1,651 (11.6%) |
Health Insurance Coverage by Citizenship Status in Brookside
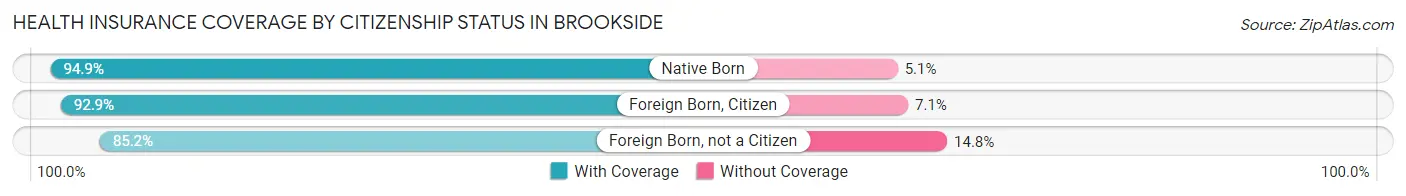
| Citizenship Status | With Coverage | Without Coverage |
| Native Born | 1,023 (94.9%) | 55 (5.1%) |
| Foreign Born, Citizen | 2,080 (92.9%) | 160 (7.1%) |
| Foreign Born, not a Citizen | 1,111 (85.2%) | 193 (14.8%) |
Health Insurance Coverage by Household Income in Brookside
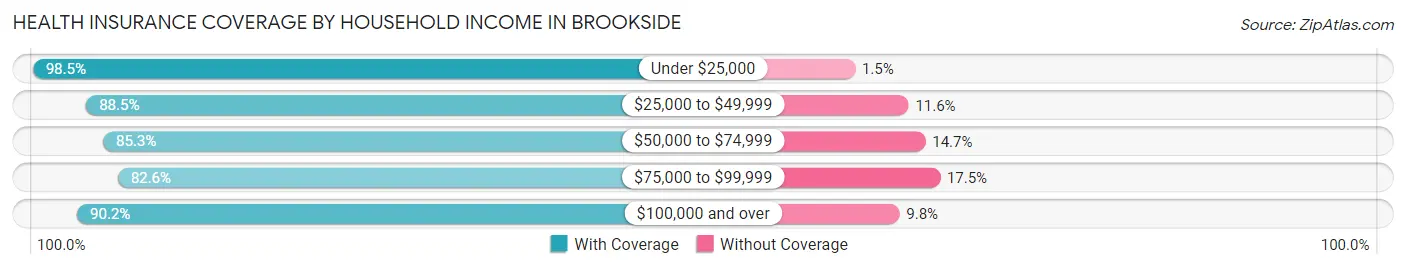
| Household Income | With Coverage | Without Coverage |
| Under $25,000 | 966 (98.5%) | 15 (1.5%) |
| $25,000 to $49,999 | 2,873 (88.4%) | 375 (11.6%) |
| $50,000 to $74,999 | 2,581 (85.3%) | 445 (14.7%) |
| $75,000 to $99,999 | 1,372 (82.6%) | 290 (17.4%) |
| $100,000 and over | 4,800 (90.2%) | 524 (9.8%) |
Public vs Private Health Insurance Coverage by Age in Brookside
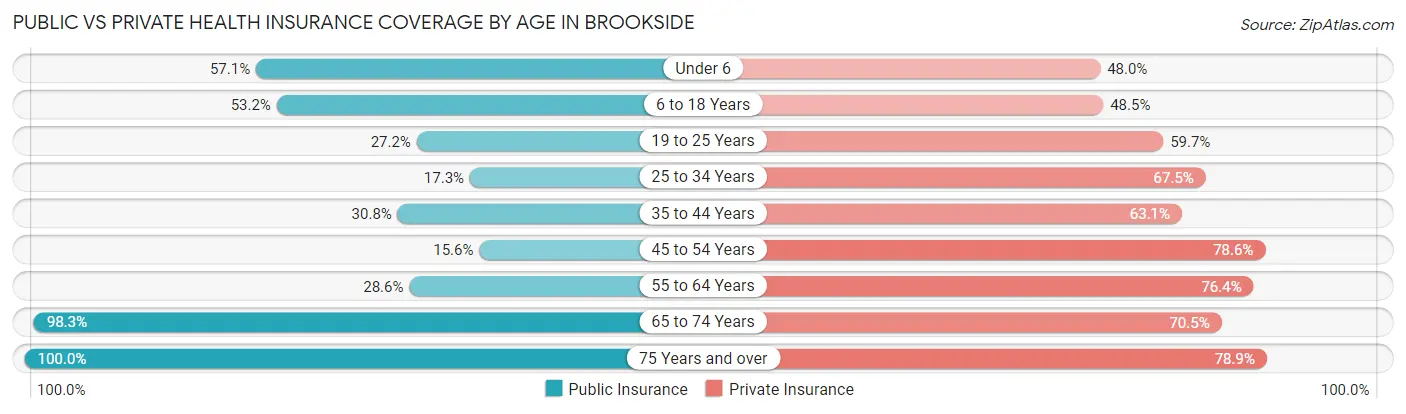
| Age Bracket | Public Insurance | Private Insurance |
| Under 6 | 615 (57.1%) | 517 (48.0%) |
| 6 to 18 Years | 1,192 (53.2%) | 1,087 (48.5%) |
| 19 to 25 Years | 355 (27.2%) | 778 (59.7%) |
| 25 to 34 Years | 464 (17.3%) | 1,807 (67.5%) |
| 35 to 44 Years | 677 (30.8%) | 1,389 (63.1%) |
| 45 to 54 Years | 193 (15.6%) | 972 (78.6%) |
| 55 to 64 Years | 497 (28.6%) | 1,328 (76.4%) |
| 65 to 74 Years | 1,035 (98.3%) | 742 (70.5%) |
| 75 Years and over | 743 (100.0%) | 586 (78.9%) |
| Total | 5,771 (40.4%) | 9,206 (64.5%) |
Disability Status by Sex by Age in Brookside
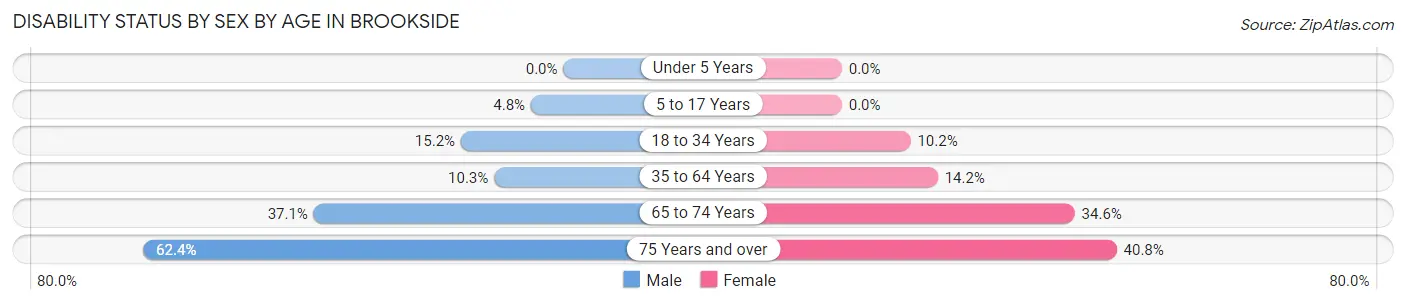
| Age Bracket | Male | Female |
| Under 5 Years | 0 (0.0%) | 0 (0.0%) |
| 5 to 17 Years | 47 (4.8%) | 0 (0.0%) |
| 18 to 34 Years | 304 (15.2%) | 212 (10.2%) |
| 35 to 64 Years | 247 (10.3%) | 395 (14.2%) |
| 65 to 74 Years | 192 (37.1%) | 185 (34.6%) |
| 75 Years and over | 141 (62.4%) | 211 (40.8%) |
Disability Class by Sex by Age in Brookside
Disability Class: Hearing Difficulty
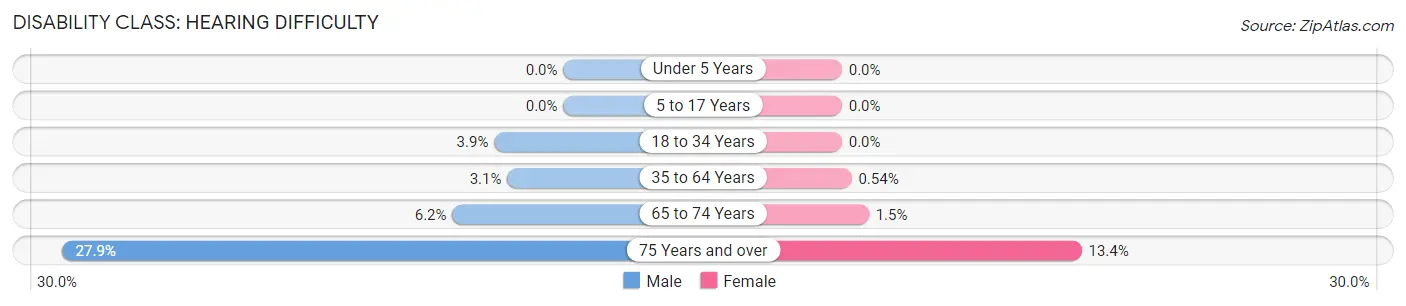
| Age Bracket | Male | Female |
| Under 5 Years | 0 (0.0%) | 0 (0.0%) |
| 5 to 17 Years | 0 (0.0%) | 0 (0.0%) |
| 18 to 34 Years | 77 (3.8%) | 0 (0.0%) |
| 35 to 64 Years | 75 (3.1%) | 15 (0.5%) |
| 65 to 74 Years | 32 (6.2%) | 8 (1.5%) |
| 75 Years and over | 63 (27.9%) | 69 (13.4%) |
Disability Class: Vision Difficulty
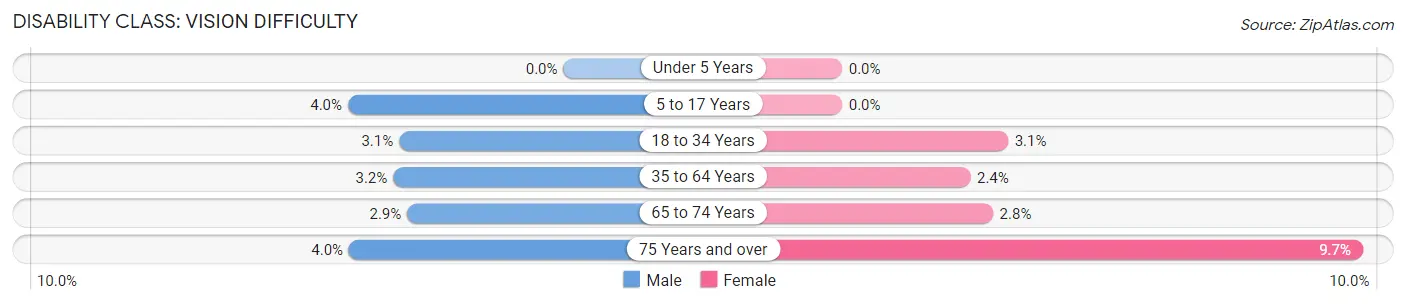
| Age Bracket | Male | Female |
| Under 5 Years | 0 (0.0%) | 0 (0.0%) |
| 5 to 17 Years | 39 (4.0%) | 0 (0.0%) |
| 18 to 34 Years | 61 (3.0%) | 64 (3.1%) |
| 35 to 64 Years | 76 (3.2%) | 66 (2.4%) |
| 65 to 74 Years | 15 (2.9%) | 15 (2.8%) |
| 75 Years and over | 9 (4.0%) | 50 (9.7%) |
Disability Class: Cognitive Difficulty
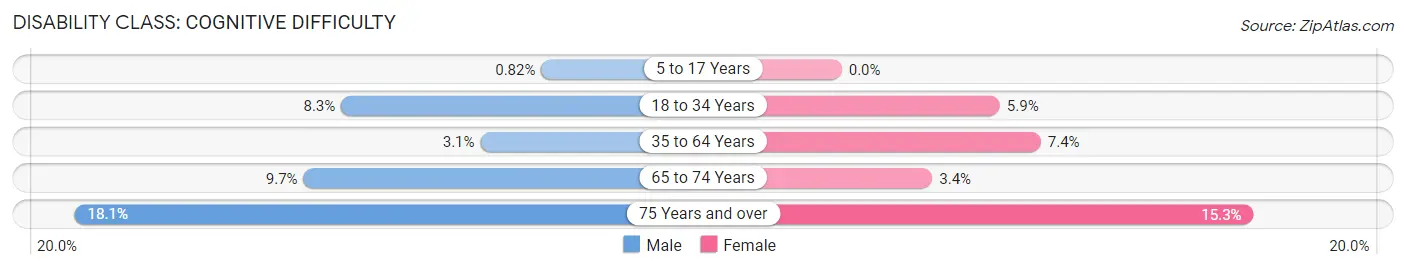
| Age Bracket | Male | Female |
| 5 to 17 Years | 8 (0.8%) | 0 (0.0%) |
| 18 to 34 Years | 165 (8.3%) | 122 (5.9%) |
| 35 to 64 Years | 74 (3.1%) | 205 (7.4%) |
| 65 to 74 Years | 50 (9.7%) | 18 (3.4%) |
| 75 Years and over | 41 (18.1%) | 79 (15.3%) |
Disability Class: Ambulatory Difficulty
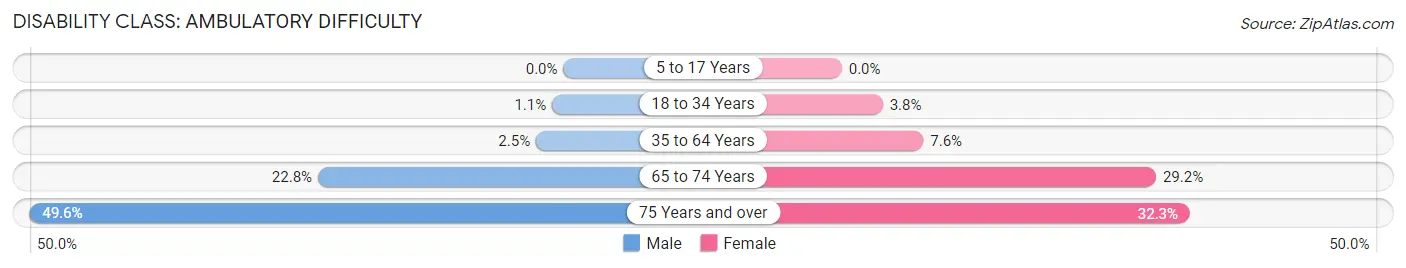
| Age Bracket | Male | Female |
| 5 to 17 Years | 0 (0.0%) | 0 (0.0%) |
| 18 to 34 Years | 21 (1.1%) | 79 (3.8%) |
| 35 to 64 Years | 61 (2.5%) | 210 (7.6%) |
| 65 to 74 Years | 118 (22.8%) | 156 (29.2%) |
| 75 Years and over | 112 (49.6%) | 167 (32.3%) |
Disability Class: Self-Care Difficulty
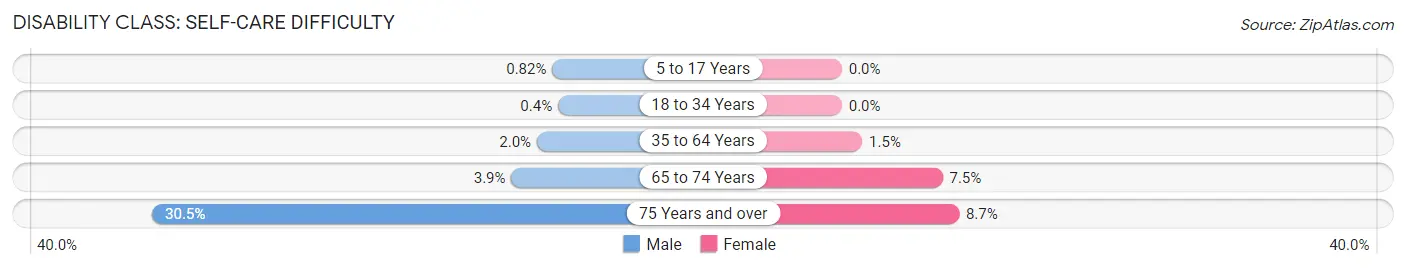
| Age Bracket | Male | Female |
| 5 to 17 Years | 8 (0.8%) | 0 (0.0%) |
| 18 to 34 Years | 8 (0.4%) | 0 (0.0%) |
| 35 to 64 Years | 47 (2.0%) | 42 (1.5%) |
| 65 to 74 Years | 20 (3.9%) | 40 (7.5%) |
| 75 Years and over | 69 (30.5%) | 45 (8.7%) |
Technology Access in Brookside
Computing Device Access in Brookside
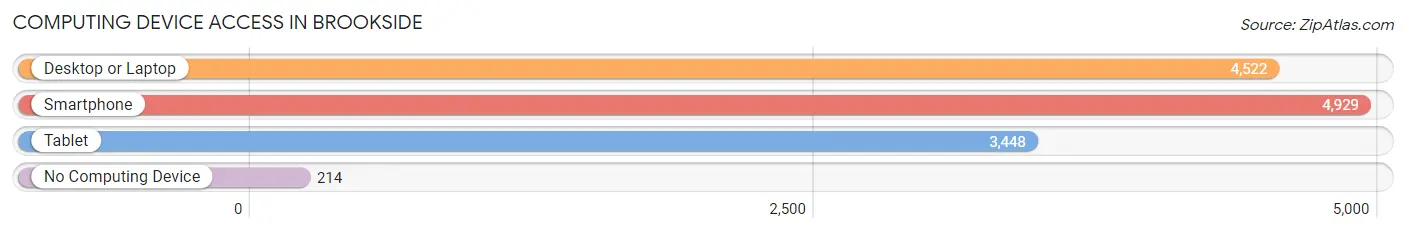
| Device Type | # Households | % Households |
| Desktop or Laptop | 4,522 | 82.6% |
| Smartphone | 4,929 | 90.0% |
| Tablet | 3,448 | 62.9% |
| No Computing Device | 214 | 3.9% |
| Total | 5,478 | 100.0% |
Internet Access in Brookside
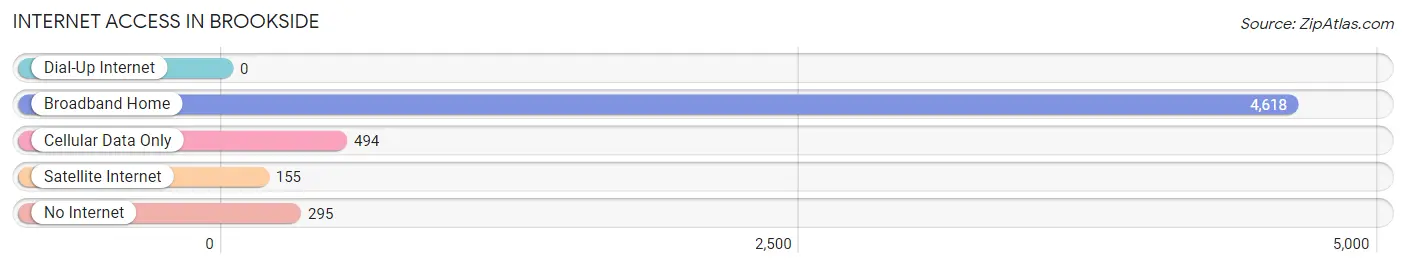
| Internet Type | # Households | % Households |
| Dial-Up Internet | 0 | 0.0% |
| Broadband Home | 4,618 | 84.3% |
| Cellular Data Only | 494 | 9.0% |
| Satellite Internet | 155 | 2.8% |
| No Internet | 295 | 5.4% |
| Total | 5,478 | 100.0% |
Brookside Summary
Brookside is a small unincorporated community located in New Castle County, Delaware. It is situated in the northern part of the county, just south of the Pennsylvania border. The community is bordered by the towns of Hockessin, Glasgow, and Newark.
History
The area that is now Brookside was first settled in the late 1700s by a group of Quakers from Pennsylvania. The Quakers established a small farming community and named it Brookside, after the nearby stream. The community grew slowly over the years, and by the mid-1800s, it had become a thriving agricultural center.
In the early 1900s, the area began to experience a period of rapid growth. The construction of the Pennsylvania Railroad in the area brought new businesses and residents to the area. By the mid-1900s, Brookside had become a popular residential area for commuters to Wilmington and Philadelphia.
Geography
Brookside is located in northern New Castle County, Delaware. It is situated in the northern part of the county, just south of the Pennsylvania border. The community is bordered by the towns of Hockessin, Glasgow, and Newark.
The area is mostly flat, with some rolling hills. The climate is temperate, with hot summers and cold winters. The average annual temperature is around 55 degrees Fahrenheit.
Economy
The economy of Brookside is largely based on agriculture and light industry. The area is home to several small farms, as well as a few larger agricultural operations. The area also has several light industrial businesses, including a plastics factory and a printing company.
The area is also home to several small businesses, including restaurants, retail stores, and professional services. The area is also home to several large employers, including the Christiana Care Health System and the University of Delaware.
Demographics
As of the 2010 census, the population of Brookside was 4,845. The population is largely white (90.3%), with small percentages of African American (4.2%), Asian (2.2%), and Hispanic (2.2%) residents. The median household income is $68,944, and the median home value is $269,000.
The area is served by the Red Clay Consolidated School District. The district includes several elementary schools, a middle school, and a high school. The area is also home to several private schools, including the Wilmington Friends School and the Tower Hill School.
Conclusion
Brookside is a small unincorporated community located in New Castle County, Delaware. It is situated in the northern part of the county, just south of the Pennsylvania border. The community is bordered by the towns of Hockessin, Glasgow, and Newark. The area has a long history of agriculture and light industry, and is home to several small businesses and large employers. The population is largely white, with small percentages of African American, Asian, and Hispanic residents. The area is served by the Red Clay Consolidated School District, as well as several private schools.
Common Questions
What is the Total Population of Brookside?
Total Population of Brookside is 14,331.
What is the Total Male Population of Brookside?
Total Male Population of Brookside is 6,656.
What is the Total Female Population of Brookside?
Total Female Population of Brookside is 7,675.
What is the Ratio of Males per 100 Females in Brookside?
There are 86.72 Males per 100 Females in Brookside.
What is the Ratio of Females per 100 Males in Brookside?
There are 115.31 Females per 100 Males in Brookside.
What is the Median Population Age in Brookside?
Median Population Age in Brookside is 34.5 Years.
What is the Average Family Size in Brookside
Average Family Size in Brookside is 3.4 People.
What is the Average Household Size in Brookside
Average Household Size in Brookside is 2.6 People.
What is Per Capita Income in Brookside?
Per Capita income in Brookside is $34,827.
What is the Median Family Income in Brookside?
Median Family Income in Brookside is $67,958.
What is the Median Household income in Brookside?
Median Household Income in Brookside is $66,485.
What is Income or Wage Gap in Brookside?
Income or Wage Gap in Brookside is 21.6%.
Women in Brookside earn 78.4 cents for every dollar earned by a man.
What is Family Income Deficit in Brookside?
Family Income Deficit in Brookside is $10,597.
Families that are below poverty line in Brookside earn $10,597 less on average than the poverty threshold level.
What is Inequality or Gini Index in Brookside?
Inequality or Gini Index in Brookside is 0.41.
How Large is the Labor Force in Brookside?
There are 7,818 People in the Labor Forcein in Brookside.
What is the Percentage of People in the Labor Force in Brookside?
68.6% of People are in the Labor Force in Brookside.
What is the Unemployment Rate in Brookside?
Unemployment Rate in Brookside is 4.5%.