Cities with the Highest Per Capita Income in Delaware
RELATED REPORTS & OPTIONS
Highest Per Capita Income
Delaware
Compare Cities
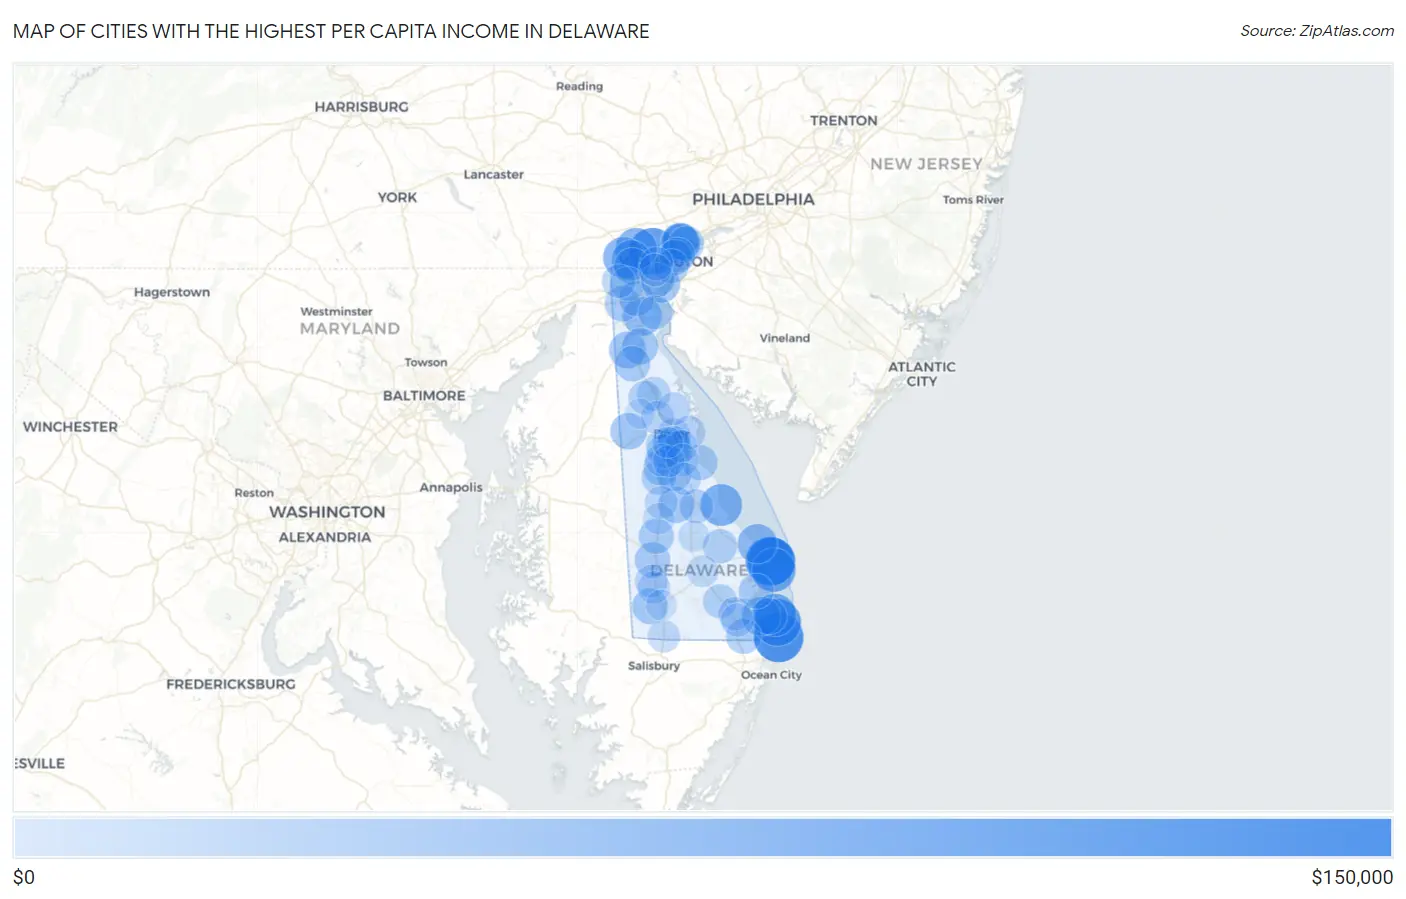
Map of Cities with the Highest Per Capita Income in Delaware
$0
$150,000
Cities with the Highest Per Capita Income in Delaware
| City | Per Capita Income | vs State | vs National | |
| 1. | Fenwick Island | $118,955 | $42,180(+76.8k)#1 | $41,261(+77.7k)#284 |
| 2. | Rehoboth Beach | $114,683 | $42,180(+72.5k)#2 | $41,261(+73.4k)#324 |
| 3. | Henlopen Acres | $110,969 | $42,180(+68.8k)#3 | $41,261(+69.7k)#366 |
| 4. | South Bethany | $104,454 | $42,180(+62.3k)#4 | $41,261(+63.2k)#449 |
| 5. | Greenville | $102,638 | $42,180(+60.5k)#5 | $41,261(+61.4k)#478 |
| 6. | Dewey Beach | $87,153 | $42,180(+45.0k)#6 | $41,261(+45.9k)#781 |
| 7. | Bethany Beach | $80,028 | $42,180(+37.8k)#7 | $41,261(+38.8k)#992 |
| 8. | Slaughter Beach | $76,410 | $42,180(+34.2k)#8 | $41,261(+35.1k)#1,146 |
| 9. | Hockessin | $74,299 | $42,180(+32.1k)#9 | $41,261(+33.0k)#1,256 |
| 10. | North Star | $72,757 | $42,180(+30.6k)#10 | $41,261(+31.5k)#1,337 |
| 11. | Pike Creek | $64,914 | $42,180(+22.7k)#11 | $41,261(+23.7k)#1,926 |
| 12. | Lewes | $63,941 | $42,180(+21.8k)#12 | $41,261(+22.7k)#2,015 |
| 13. | Ardencroft | $61,623 | $42,180(+19.4k)#13 | $41,261(+20.4k)#2,263 |
| 14. | St Georges | $59,574 | $42,180(+17.4k)#14 | $41,261(+18.3k)#2,542 |
| 15. | Millville | $59,054 | $42,180(+16.9k)#15 | $41,261(+17.8k)#2,613 |
| 16. | New Castle | $53,997 | $42,180(+11.8k)#16 | $41,261(+12.7k)#3,420 |
| 17. | Ardentown | $53,403 | $42,180(+11.2k)#17 | $41,261(+12.1k)#3,517 |
| 18. | Arden | $49,135 | $42,180(+6.96k)#18 | $41,261(+7.87k)#4,472 |
| 19. | Pike Creek Valley | $48,651 | $42,180(+6.47k)#19 | $41,261(+7.39k)#4,601 |
| 20. | Middletown | $48,426 | $42,180(+6.25k)#20 | $41,261(+7.17k)#4,666 |
| 21. | Hartly | $47,549 | $42,180(+5.37k)#21 | $41,261(+6.29k)#4,912 |
| 22. | Ocean View | $46,215 | $42,180(+4.04k)#22 | $41,261(+4.95k)#5,330 |
| 23. | Odessa | $45,905 | $42,180(+3.73k)#23 | $41,261(+4.64k)#5,417 |
| 24. | Houston | $45,092 | $42,180(+2.91k)#24 | $41,261(+3.83k)#5,736 |
| 25. | Highland Acres | $44,615 | $42,180(+2.44k)#25 | $41,261(+3.35k)#5,928 |
| 26. | Viola | $43,865 | $42,180(+1.69k)#26 | $41,261(+2.60k)#6,214 |
| 27. | Port Penn | $43,400 | $42,180(+1.22k)#27 | $41,261(+2.14k)#6,431 |
| 28. | Bethel | $42,939 | $42,180(+759)#28 | $41,261(+1.68k)#6,613 |
| 29. | Bridgeville | $42,044 | $42,180(-136)#29 | $41,261(+783)#7,033 |
| 30. | Townsend | $41,503 | $42,180(-677)#30 | $41,261(+242)#7,287 |
| 31. | Glasgow | $41,452 | $42,180(-728)#31 | $41,261(+191)#7,317 |
| 32. | Greenwood | $40,531 | $42,180(-1.65k)#32 | $41,261(-730)#7,795 |
| 33. | Bowers | $40,410 | $42,180(-1.77k)#33 | $41,261(-851)#7,859 |
| 34. | Claymont | $40,226 | $42,180(-1.95k)#34 | $41,261(-1.03k)#7,957 |
| 35. | Edgemoor | $40,072 | $42,180(-2.11k)#35 | $41,261(-1.19k)#8,029 |
| 36. | Selbyville | $39,852 | $42,180(-2.33k)#36 | $41,261(-1.41k)#8,163 |
| 37. | Riverview | $39,745 | $42,180(-2.44k)#37 | $41,261(-1.52k)#8,222 |
| 38. | Long Neck | $39,311 | $42,180(-2.87k)#38 | $41,261(-1.95k)#8,454 |
| 39. | Bellefonte | $38,492 | $42,180(-3.69k)#39 | $41,261(-2.77k)#8,933 |
| 40. | Bear | $38,426 | $42,180(-3.75k)#40 | $41,261(-2.83k)#8,976 |
| 41. | Wilmington | $36,446 | $42,180(-5.73k)#41 | $41,261(-4.82k)#10,343 |
| 42. | Felton | $35,877 | $42,180(-6.30k)#42 | $41,261(-5.38k)#10,810 |
| 43. | Milton | $35,412 | $42,180(-6.77k)#43 | $41,261(-5.85k)#11,204 |
| 44. | Brookside | $34,827 | $42,180(-7.35k)#44 | $41,261(-6.43k)#11,721 |
| 45. | Wilmington Manor | $34,760 | $42,180(-7.42k)#45 | $41,261(-6.50k)#11,783 |
| 46. | Millsboro | $34,247 | $42,180(-7.93k)#46 | $41,261(-7.01k)#12,238 |
| 47. | Milford | $33,823 | $42,180(-8.36k)#47 | $41,261(-7.44k)#12,627 |
| 48. | Delaware City | $32,328 | $42,180(-9.85k)#48 | $41,261(-8.93k)#14,192 |
| 49. | Newark | $32,240 | $42,180(-9.94k)#49 | $41,261(-9.02k)#14,288 |
| 50. | Smyrna | $31,340 | $42,180(-10.8k)#50 | $41,261(-9.92k)#15,274 |
| 51. | Wyoming | $30,914 | $42,180(-11.3k)#51 | $41,261(-10.3k)#15,764 |
| 52. | Elsmere | $30,900 | $42,180(-11.3k)#52 | $41,261(-10.4k)#15,783 |
| 53. | Camden | $30,893 | $42,180(-11.3k)#53 | $41,261(-10.4k)#15,787 |
| 54. | Clayton | $30,652 | $42,180(-11.5k)#54 | $41,261(-10.6k)#16,051 |
| 55. | Dagsboro | $30,317 | $42,180(-11.9k)#55 | $41,261(-10.9k)#16,421 |
| 56. | Frankford | $29,879 | $42,180(-12.3k)#56 | $41,261(-11.4k)#16,930 |
| 57. | Rising Sun Lebanon | $29,812 | $42,180(-12.4k)#57 | $41,261(-11.4k)#17,002 |
| 58. | Dover | $29,796 | $42,180(-12.4k)#58 | $41,261(-11.5k)#17,026 |
| 59. | Cheswold | $29,680 | $42,180(-12.5k)#59 | $41,261(-11.6k)#17,167 |
| 60. | Little Creek | $29,443 | $42,180(-12.7k)#60 | $41,261(-11.8k)#17,434 |
| 61. | Kent Acres | $28,900 | $42,180(-13.3k)#61 | $41,261(-12.4k)#18,078 |
| 62. | Leipsic | $28,375 | $42,180(-13.8k)#62 | $41,261(-12.9k)#18,677 |
| 63. | Newport | $27,838 | $42,180(-14.3k)#63 | $41,261(-13.4k)#19,323 |
| 64. | Harrington | $27,550 | $42,180(-14.6k)#64 | $41,261(-13.7k)#19,699 |
| 65. | Seaford | $26,952 | $42,180(-15.2k)#65 | $41,261(-14.3k)#20,443 |
| 66. | Woodside | $26,368 | $42,180(-15.8k)#66 | $41,261(-14.9k)#21,148 |
| 67. | Blades | $26,045 | $42,180(-16.1k)#67 | $41,261(-15.2k)#21,540 |
| 68. | Dover Base Housing | $25,705 | $42,180(-16.5k)#68 | $41,261(-15.6k)#21,940 |
| 69. | Delmar | $25,221 | $42,180(-17.0k)#69 | $41,261(-16.0k)#22,509 |
| 70. | Magnolia | $25,069 | $42,180(-17.1k)#70 | $41,261(-16.2k)#22,677 |
| 71. | Frederica | $24,666 | $42,180(-17.5k)#71 | $41,261(-16.6k)#23,140 |
| 72. | Georgetown | $22,640 | $42,180(-19.5k)#72 | $41,261(-18.6k)#25,221 |
| 73. | Lincoln | $22,592 | $42,180(-19.6k)#73 | $41,261(-18.7k)#25,277 |
| 74. | Woodside East | $22,233 | $42,180(-19.9k)#74 | $41,261(-19.0k)#25,612 |
| 75. | Ellendale | $20,258 | $42,180(-21.9k)#75 | $41,261(-21.0k)#27,195 |
| 76. | Farmington | $19,899 | $42,180(-22.3k)#76 | $41,261(-21.4k)#27,464 |
| 77. | Rodney Village | $18,256 | $42,180(-23.9k)#77 | $41,261(-23.0k)#28,403 |
| 78. | Laurel | $16,378 | $42,180(-25.8k)#78 | $41,261(-24.9k)#29,206 |
| 79. | Kenton | $13,531 | $42,180(-28.6k)#79 | $41,261(-27.7k)#30,046 |
1
Common Questions
What are the Top 10 Cities with the Highest Per Capita Income in Delaware?
Top 10 Cities with the Highest Per Capita Income in Delaware are:
#1
$118,955
#2
$114,683
#3
$110,969
#4
$104,454
#5
$102,638
#6
$87,153
#7
$80,028
#8
$76,410
#9
$74,299
#10
$72,757
What city has the Highest Per Capita Income in Delaware?
Fenwick Island has the Highest Per Capita Income in Delaware with $118,955.
What is the Per Capita Income in the State of Delaware?
Per Capita Income in Delaware is $42,180.
What is the Per Capita Income in the United States?
Per Capita Income in the United States is $41,261.