Newport, DE
Newport Map
Newport Overview
1,145
TOTAL POPULATION
611
MALE POPULATION
534
FEMALE POPULATION
114.42
MALES / 100 FEMALES
87.40
FEMALES / 100 MALES
28.3
MEDIAN AGE
3.7
AVG FAMILY SIZE
3.0
AVG HOUSEHOLD SIZE
$27,838
PER CAPITA INCOME
$71,719
AVG FAMILY INCOME
$62,875
AVG HOUSEHOLD INCOME
2.5%
WAGE / INCOME GAP [ % ]
97.5¢/ $1
WAGE / INCOME GAP [ $ ]
0.40
INEQUALITY / GINI INDEX
571
LABOR FORCE [ PEOPLE ]
63.9%
PERCENT IN LABOR FORCE
5.3%
UNEMPLOYMENT RATE
Newport Area Codes
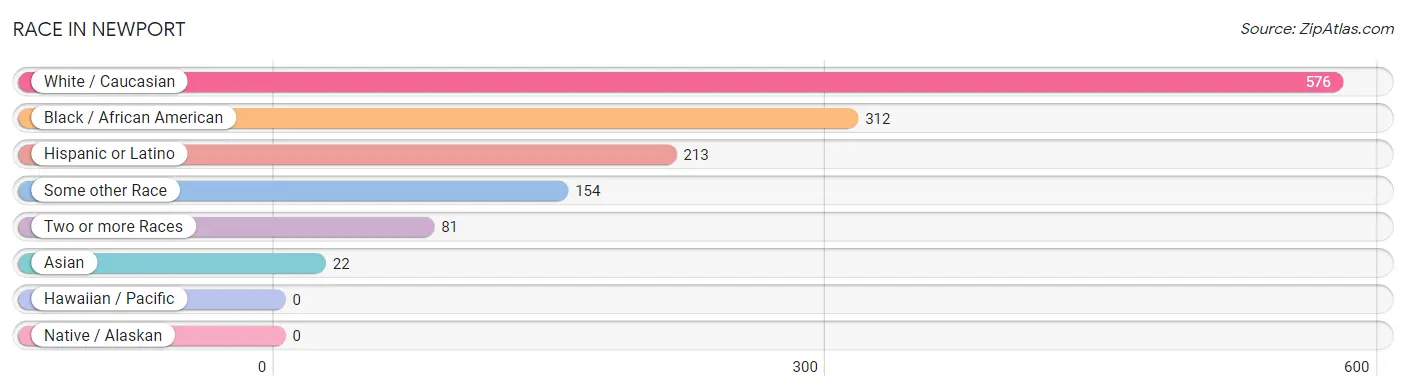
Race in Newport
The most populous races in Newport are White / Caucasian (576 | 50.3%), Black / African American (312 | 27.3%), and Hispanic or Latino (213 | 18.6%).
| Race | # Population | % Population |
| Asian | 22 | 1.9% |
| Black / African American | 312 | 27.3% |
| Hawaiian / Pacific | 0 | 0.0% |
| Hispanic or Latino | 213 | 18.6% |
| Native / Alaskan | 0 | 0.0% |
| White / Caucasian | 576 | 50.3% |
| Two or more Races | 81 | 7.1% |
| Some other Race | 154 | 13.5% |
| Total | 1,145 | 100.0% |
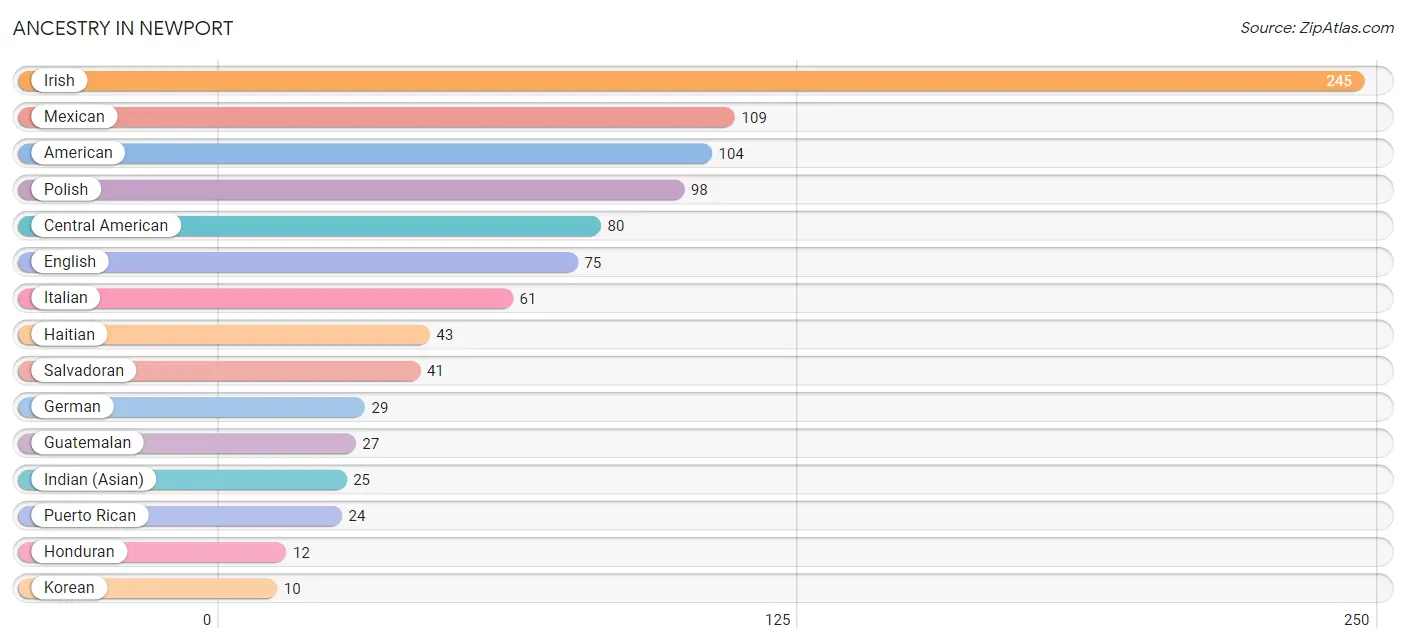
Ancestry in Newport
The most populous ancestries reported in Newport are Irish (245 | 21.4%), Mexican (109 | 9.5%), American (104 | 9.1%), Polish (98 | 8.6%), and Central American (80 | 7.0%), together accounting for 55.5% of all Newport residents.
| Ancestry | # Population | % Population |
| American | 104 | 9.1% |
| Central American | 80 | 7.0% |
| English | 75 | 6.6% |
| European | 8 | 0.7% |
| French | 9 | 0.8% |
| German | 29 | 2.5% |
| Guatemalan | 27 | 2.4% |
| Haitian | 43 | 3.8% |
| Honduran | 12 | 1.1% |
| Indian (Asian) | 25 | 2.2% |
| Inupiat | 3 | 0.3% |
| Irish | 245 | 21.4% |
| Italian | 61 | 5.3% |
| Korean | 10 | 0.9% |
| Lithuanian | 8 | 0.7% |
| Mexican | 109 | 9.5% |
| Polish | 98 | 8.6% |
| Puerto Rican | 24 | 2.1% |
| Salvadoran | 41 | 3.6% | View All 19 Rows |
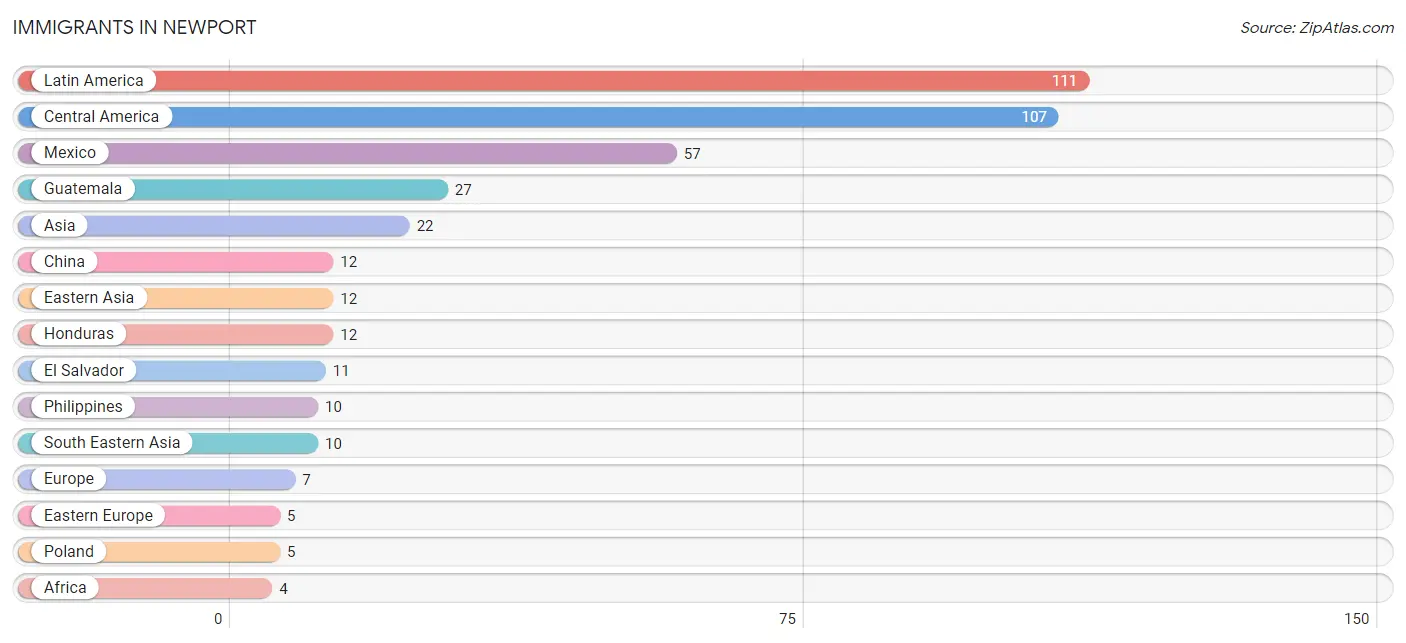
Immigrants in Newport
The most numerous immigrant groups reported in Newport came from Latin America (111 | 9.7%), Central America (107 | 9.3%), Mexico (57 | 5.0%), Guatemala (27 | 2.4%), and Asia (22 | 1.9%), together accounting for 28.3% of all Newport residents.
| Immigration Origin | # Population | % Population |
| Africa | 4 | 0.4% |
| Asia | 22 | 1.9% |
| Caribbean | 4 | 0.4% |
| Central America | 107 | 9.3% |
| China | 12 | 1.1% |
| Eastern Asia | 12 | 1.1% |
| Eastern Europe | 5 | 0.4% |
| El Salvador | 11 | 1.0% |
| Europe | 7 | 0.6% |
| Guatemala | 27 | 2.4% |
| Honduras | 12 | 1.1% |
| Italy | 2 | 0.2% |
| Latin America | 111 | 9.7% |
| Liberia | 4 | 0.4% |
| Mexico | 57 | 5.0% |
| Philippines | 10 | 0.9% |
| Poland | 5 | 0.4% |
| South Eastern Asia | 10 | 0.9% |
| Southern Europe | 2 | 0.2% |
| St. Vincent and the Grenadines | 4 | 0.4% |
| Western Africa | 4 | 0.4% | View All 21 Rows |
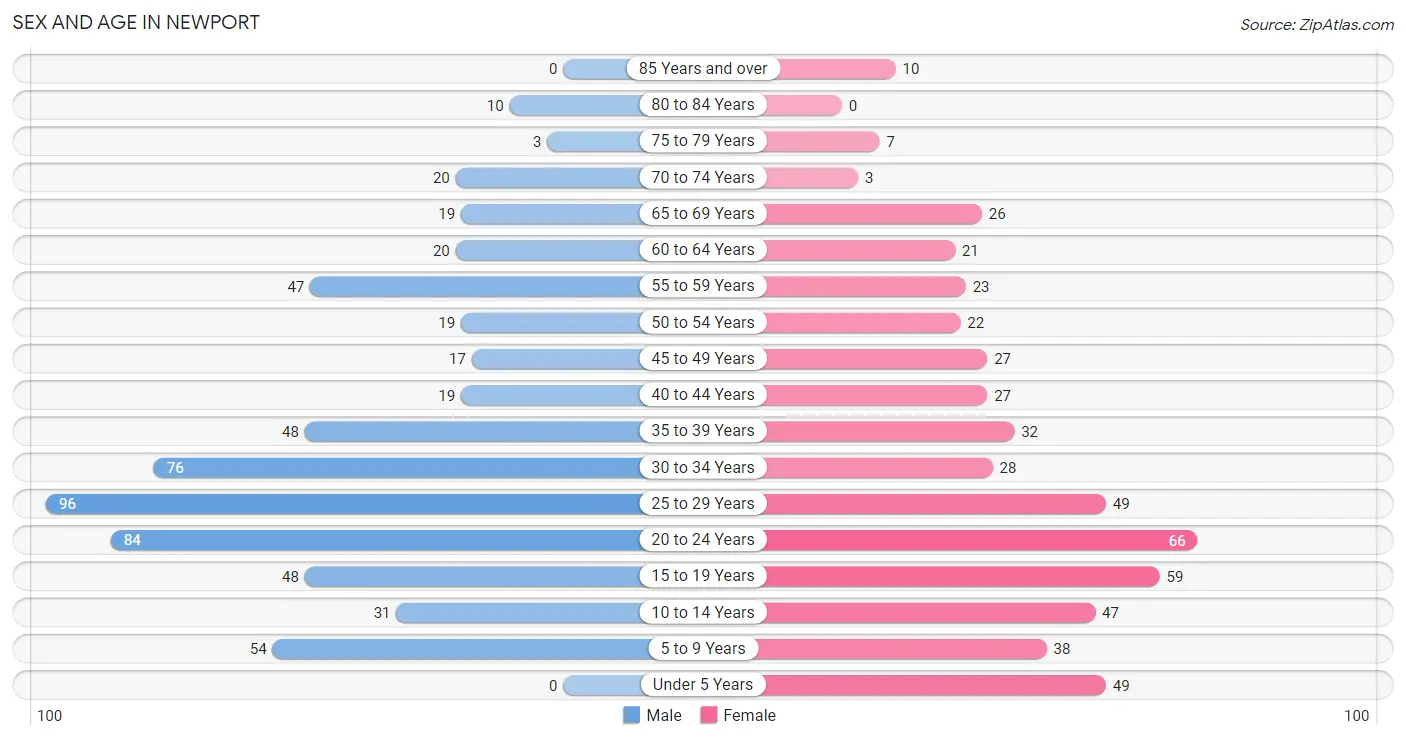
Sex and Age in Newport
Sex and Age in Newport
The most populous age groups in Newport are 25 to 29 Years (96 | 15.7%) for men and 20 to 24 Years (66 | 12.4%) for women.
| Age Bracket | Male | Female |
| Under 5 Years | 0 (0.0%) | 49 (9.2%) |
| 5 to 9 Years | 54 (8.8%) | 38 (7.1%) |
| 10 to 14 Years | 31 (5.1%) | 47 (8.8%) |
| 15 to 19 Years | 48 (7.9%) | 59 (11.1%) |
| 20 to 24 Years | 84 (13.8%) | 66 (12.4%) |
| 25 to 29 Years | 96 (15.7%) | 49 (9.2%) |
| 30 to 34 Years | 76 (12.4%) | 28 (5.2%) |
| 35 to 39 Years | 48 (7.9%) | 32 (6.0%) |
| 40 to 44 Years | 19 (3.1%) | 27 (5.1%) |
| 45 to 49 Years | 17 (2.8%) | 27 (5.1%) |
| 50 to 54 Years | 19 (3.1%) | 22 (4.1%) |
| 55 to 59 Years | 47 (7.7%) | 23 (4.3%) |
| 60 to 64 Years | 20 (3.3%) | 21 (3.9%) |
| 65 to 69 Years | 19 (3.1%) | 26 (4.9%) |
| 70 to 74 Years | 20 (3.3%) | 3 (0.6%) |
| 75 to 79 Years | 3 (0.5%) | 7 (1.3%) |
| 80 to 84 Years | 10 (1.6%) | 0 (0.0%) |
| 85 Years and over | 0 (0.0%) | 10 (1.9%) |
| Total | 611 (100.0%) | 534 (100.0%) |
Families and Households in Newport
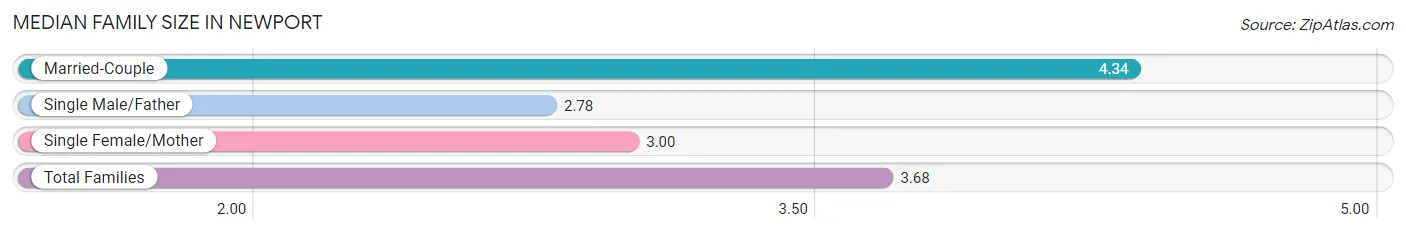
Median Family Size in Newport
The median family size in Newport is 3.68 persons per family, with married-couple families (142 | 55.7%) accounting for the largest median family size of 4.34 persons per family. On the other hand, single male/father families (79 | 31.0%) represent the smallest median family size with 2.78 persons per family.
| Family Type | # Families | Family Size |
| Married-Couple | 142 (55.7%) | 4.34 |
| Single Male/Father | 79 (31.0%) | 2.78 |
| Single Female/Mother | 34 (13.3%) | 3.00 |
| Total Families | 255 (100.0%) | 3.68 |
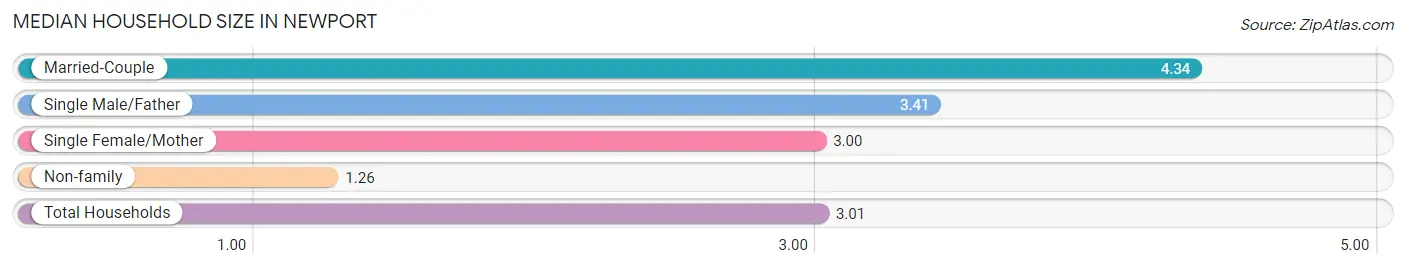
Median Household Size in Newport
The median household size in Newport is 3.01 persons per household, with married-couple households (142 | 37.4%) accounting for the largest median household size of 4.34 persons per household. non-family households (125 | 32.9%) represent the smallest median household size with 1.26 persons per household.
| Household Type | # Households | Household Size |
| Married-Couple | 142 (37.4%) | 4.34 |
| Single Male/Father | 79 (20.8%) | 3.41 |
| Single Female/Mother | 34 (8.9%) | 3.00 |
| Non-family | 125 (32.9%) | 1.26 |
| Total Households | 380 (100.0%) | 3.01 |
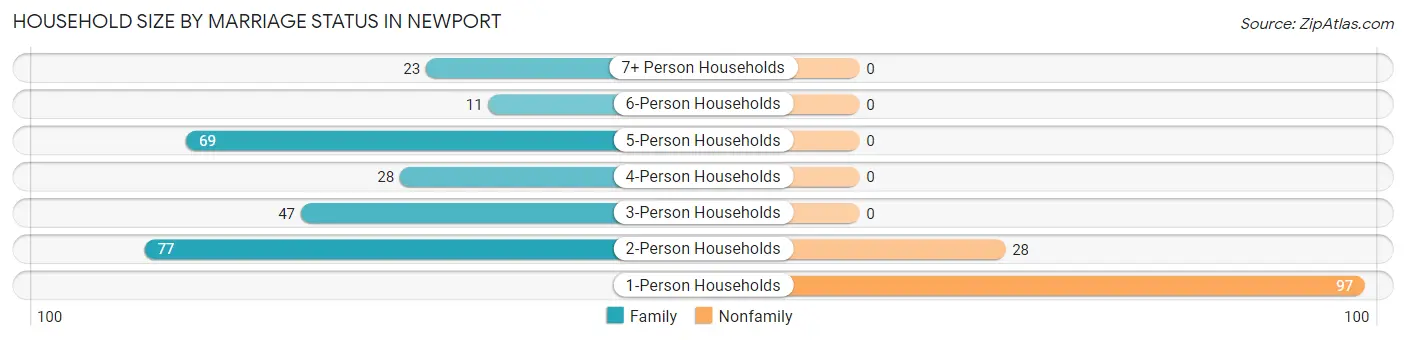
Household Size by Marriage Status in Newport
Out of a total of 380 households in Newport, 255 (67.1%) are family households, while 125 (32.9%) are nonfamily households. The most numerous type of family households are 2-person households, comprising 77, and the most common type of nonfamily households are 1-person households, comprising 97.
| Household Size | Family Households | Nonfamily Households |
| 1-Person Households | - | 97 (25.5%) |
| 2-Person Households | 77 (20.3%) | 28 (7.4%) |
| 3-Person Households | 47 (12.4%) | 0 (0.0%) |
| 4-Person Households | 28 (7.4%) | 0 (0.0%) |
| 5-Person Households | 69 (18.2%) | 0 (0.0%) |
| 6-Person Households | 11 (2.9%) | 0 (0.0%) |
| 7+ Person Households | 23 (6.0%) | 0 (0.0%) |
| Total | 255 (67.1%) | 125 (32.9%) |
Female Fertility in Newport
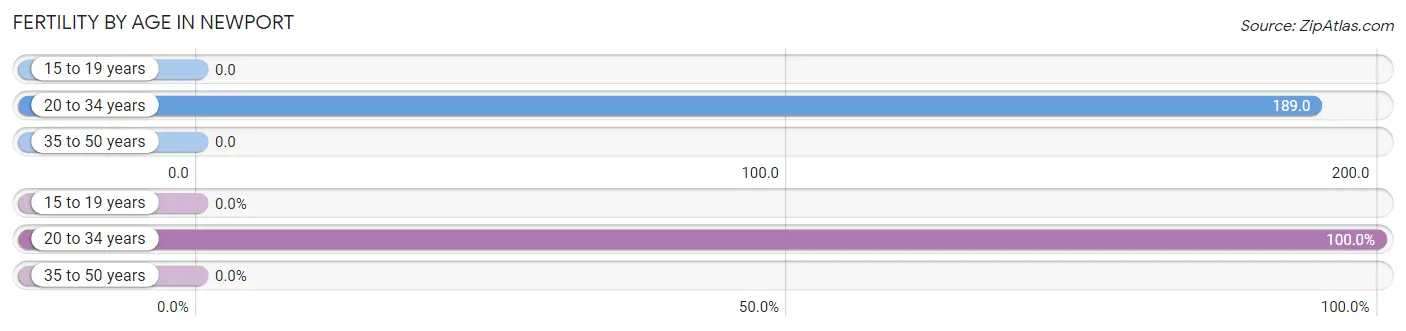
Fertility by Age in Newport
Average fertility rate in Newport is 94.0 births per 1,000 women. Women in the age bracket of 20 to 34 years have the highest fertility rate with 189.0 births per 1,000 women. Women in the age bracket of 20 to 34 years acount for 100.0% of all women with births.
| Age Bracket | Women with Births | Births / 1,000 Women |
| 15 to 19 years | 0 (0.0%) | 0.0 |
| 20 to 34 years | 27 (100.0%) | 189.0 |
| 35 to 50 years | 0 (0.0%) | 0.0 |
| Total | 27 (100.0%) | 94.0 |
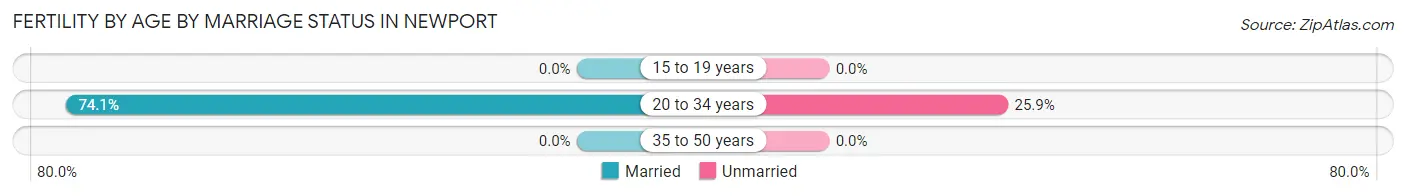
Fertility by Age by Marriage Status in Newport
74.1% of women with births (27) in Newport are married. The highest percentage of unmarried women with births falls into 20 to 34 years age bracket with 25.9% of them unmarried at the time of birth, while the lowest percentage of unmarried women with births belong to 20 to 34 years age bracket with 25.9% of them unmarried.
| Age Bracket | Married | Unmarried |
| 15 to 19 years | 0 (0.0%) | 0 (0.0%) |
| 20 to 34 years | 20 (74.1%) | 7 (25.9%) |
| 35 to 50 years | 0 (0.0%) | 0 (0.0%) |
| Total | 20 (74.1%) | 7 (25.9%) |
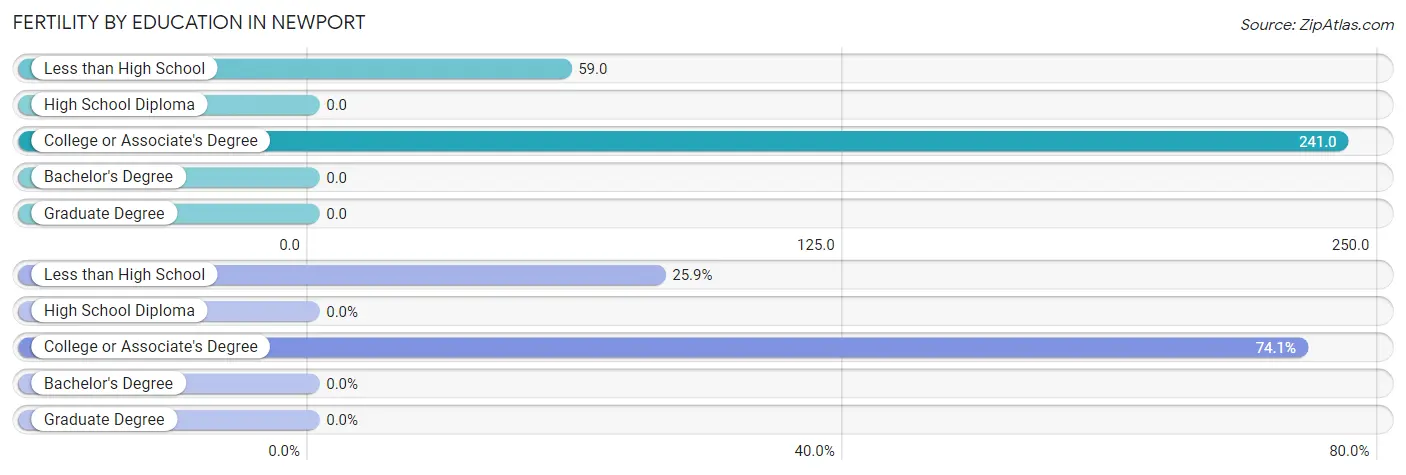
Fertility by Education in Newport
| Educational Attainment | Women with Births | Births / 1,000 Women |
| Less than High School | 7 (25.9%) | 59.0 |
| High School Diploma | 0 (0.0%) | 0.0 |
| College or Associate's Degree | 20 (74.1%) | 241.0 |
| Bachelor's Degree | 0 (0.0%) | 0.0 |
| Graduate Degree | 0 (0.0%) | 0.0 |
| Total | 27 (100.0%) | 94.0 |
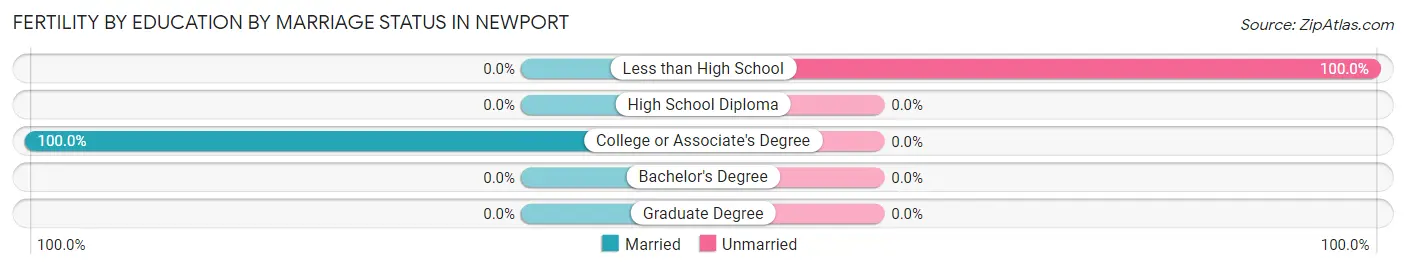
Fertility by Education by Marriage Status in Newport
25.9% of women with births in Newport are unmarried. Women with the educational attainment of college or associate's degree are most likely to be married with 100.0% of them married at childbirth, while women with the educational attainment of less than high school are least likely to be married with 100.0% of them unmarried at childbirth.
| Educational Attainment | Married | Unmarried |
| Less than High School | 0 (0.0%) | 7 (100.0%) |
| High School Diploma | 0 (0.0%) | 0 (0.0%) |
| College or Associate's Degree | 20 (100.0%) | 0 (0.0%) |
| Bachelor's Degree | 0 (0.0%) | 0 (0.0%) |
| Graduate Degree | 0 (0.0%) | 0 (0.0%) |
| Total | 20 (74.1%) | 7 (25.9%) |
Income in Newport
Income Overview in Newport
Per Capita Income in Newport is $27,838, while median incomes of families and households are $71,719 and $62,875 respectively.
| Characteristic | Number | Measure |
| Per Capita Income | 1,145 | $27,838 |
| Median Family Income | 255 | $71,719 |
| Mean Family Income | 255 | $96,625 |
| Median Household Income | 380 | $62,875 |
| Mean Household Income | 380 | $80,247 |
| Income Deficit | 255 | $0 |
| Wage / Income Gap (%) | 1,145 | 2.54% |
| Wage / Income Gap ($) | 1,145 | 97.46¢ per $1 |
| Gini / Inequality Index | 1,145 | 0.40 |
Earnings by Sex in Newport
Average Earnings in Newport are $34,329, $34,630 for men and $33,750 for women, a difference of 2.5%.
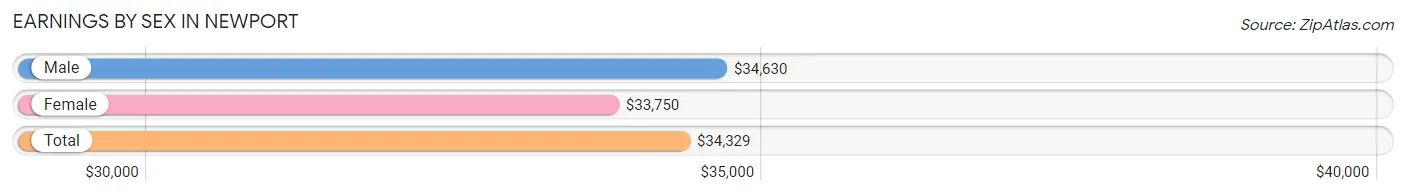
| Sex | Number | Average Earnings |
| Male | 370 (64.5%) | $34,630 |
| Female | 204 (35.5%) | $33,750 |
| Total | 574 (100.0%) | $34,329 |
Earnings by Sex by Income Bracket in Newport
The most common earnings brackets in Newport are $25,000 to $29,999 for men (69 | 18.6%) and $75,000 to $99,999 for women (32 | 15.7%).
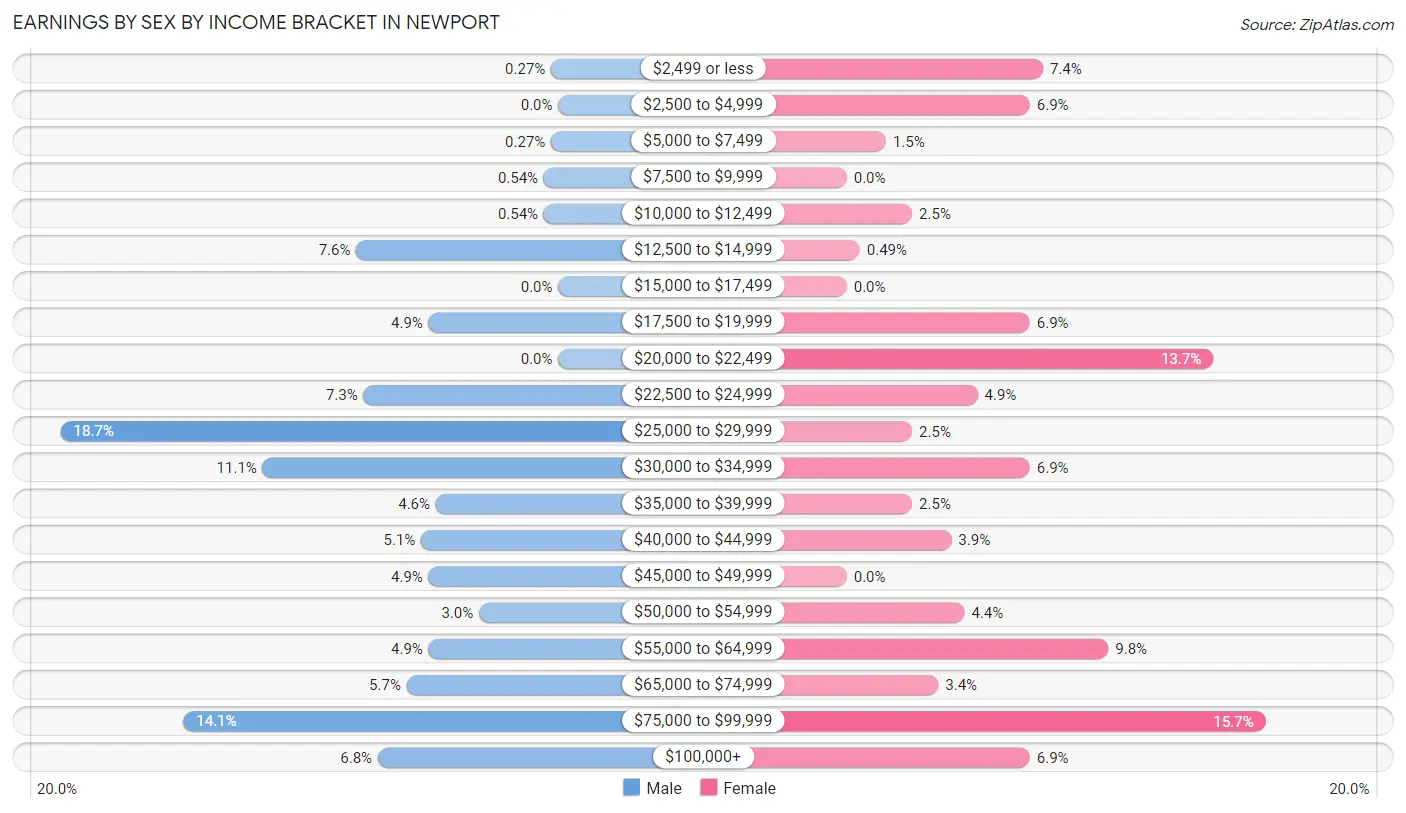
| Income | Male | Female |
| $2,499 or less | 1 (0.3%) | 15 (7.3%) |
| $2,500 to $4,999 | 0 (0.0%) | 14 (6.9%) |
| $5,000 to $7,499 | 1 (0.3%) | 3 (1.5%) |
| $7,500 to $9,999 | 2 (0.5%) | 0 (0.0%) |
| $10,000 to $12,499 | 2 (0.5%) | 5 (2.5%) |
| $12,500 to $14,999 | 28 (7.6%) | 1 (0.5%) |
| $15,000 to $17,499 | 0 (0.0%) | 0 (0.0%) |
| $17,500 to $19,999 | 18 (4.9%) | 14 (6.9%) |
| $20,000 to $22,499 | 0 (0.0%) | 28 (13.7%) |
| $22,500 to $24,999 | 27 (7.3%) | 10 (4.9%) |
| $25,000 to $29,999 | 69 (18.6%) | 5 (2.5%) |
| $30,000 to $34,999 | 41 (11.1%) | 14 (6.9%) |
| $35,000 to $39,999 | 17 (4.6%) | 5 (2.5%) |
| $40,000 to $44,999 | 19 (5.1%) | 8 (3.9%) |
| $45,000 to $49,999 | 18 (4.9%) | 0 (0.0%) |
| $50,000 to $54,999 | 11 (3.0%) | 9 (4.4%) |
| $55,000 to $64,999 | 18 (4.9%) | 20 (9.8%) |
| $65,000 to $74,999 | 21 (5.7%) | 7 (3.4%) |
| $75,000 to $99,999 | 52 (14.1%) | 32 (15.7%) |
| $100,000+ | 25 (6.8%) | 14 (6.9%) |
| Total | 370 (100.0%) | 204 (100.0%) |
Earnings by Sex by Educational Attainment in Newport
Average earnings in Newport are $37,000 for men and $54,167 for women, a difference of 31.7%. Men with an educational attainment of less than high school enjoy the highest average annual earnings of $55,972, while those with bachelor's degree education earn the least with $24,688. Women with an educational attainment of college or associate's degree earn the most with the average annual earnings of $77,813, while those with high school diploma education have the smallest earnings of $20,688.
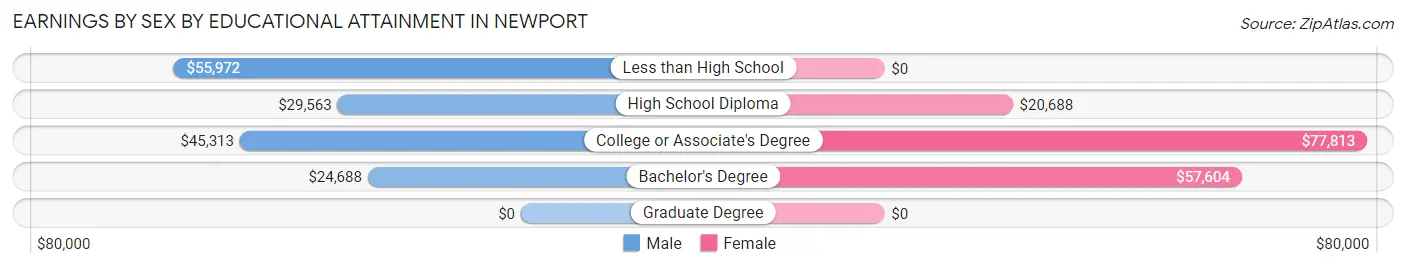
| Educational Attainment | Male Income | Female Income |
| Less than High School | $55,972 | $0 |
| High School Diploma | $29,563 | $20,688 |
| College or Associate's Degree | $45,313 | $77,813 |
| Bachelor's Degree | $24,688 | $57,604 |
| Graduate Degree | - | - |
| Total | $37,000 | $54,167 |
Family Income in Newport
Family Income Brackets in Newport
According to the Newport family income data, there are 87 families falling into the $50,000 to $74,999 income range, which is the most common income bracket and makes up 34.1% of all families.
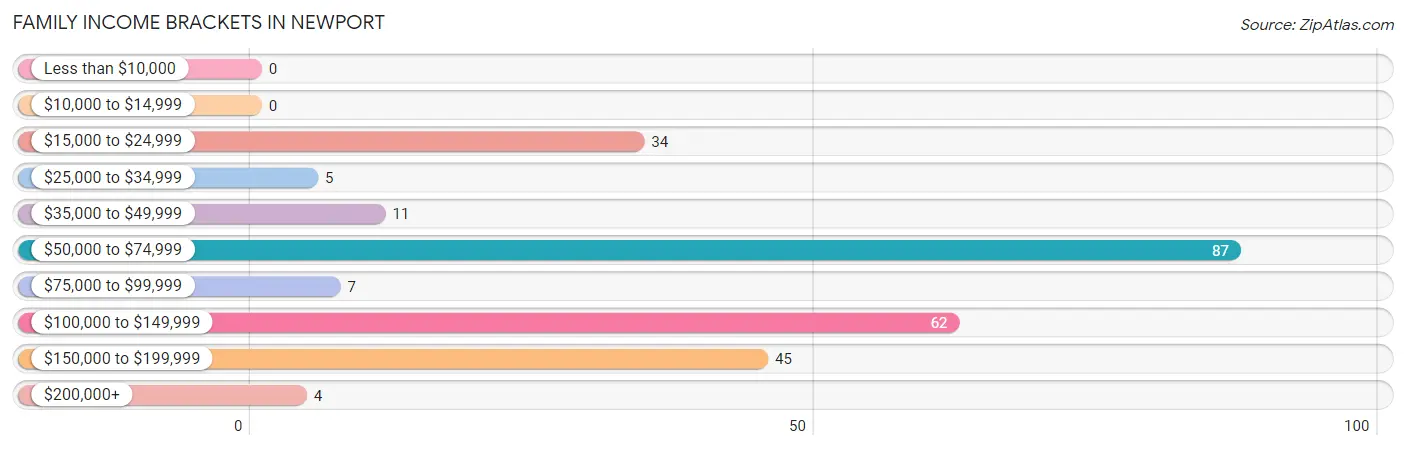
| Income Bracket | # Families | % Families |
| Less than $10,000 | 0 | 0.0% |
| $10,000 to $14,999 | 0 | 0.0% |
| $15,000 to $24,999 | 34 | 13.3% |
| $25,000 to $34,999 | 5 | 2.0% |
| $35,000 to $49,999 | 11 | 4.3% |
| $50,000 to $74,999 | 87 | 34.1% |
| $75,000 to $99,999 | 7 | 2.7% |
| $100,000 to $149,999 | 62 | 24.3% |
| $150,000 to $199,999 | 45 | 17.6% |
| $200,000+ | 4 | 1.6% |
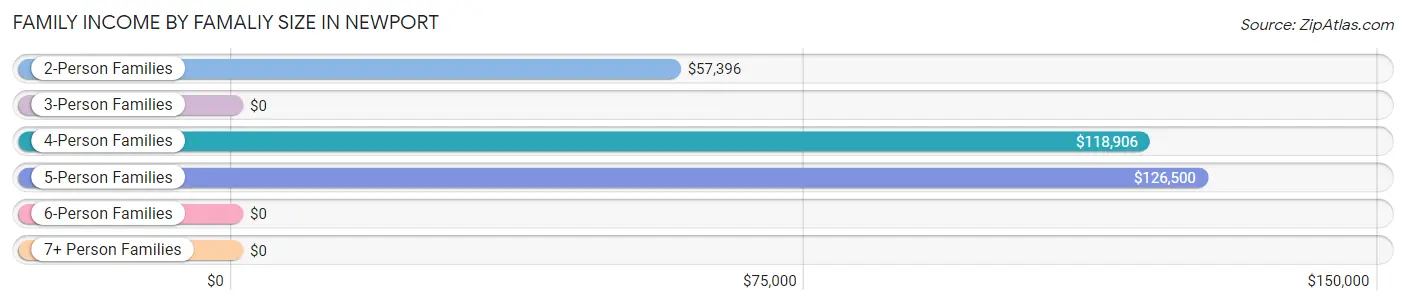
Family Income by Famaliy Size in Newport
5-person families (62 | 24.3%) account for the highest median family income in Newport with $126,500 per family, while 4-person families (23 | 9.0%) have the highest median income of $29,726 per family member.
| Income Bracket | # Families | Median Income |
| 2-Person Families | 103 (40.4%) | $57,396 |
| 3-Person Families | 33 (12.9%) | $0 |
| 4-Person Families | 23 (9.0%) | $118,906 |
| 5-Person Families | 62 (24.3%) | $126,500 |
| 6-Person Families | 11 (4.3%) | $0 |
| 7+ Person Families | 23 (9.0%) | $0 |
| Total | 255 (100.0%) | $71,719 |
Family Income by Number of Earners in Newport
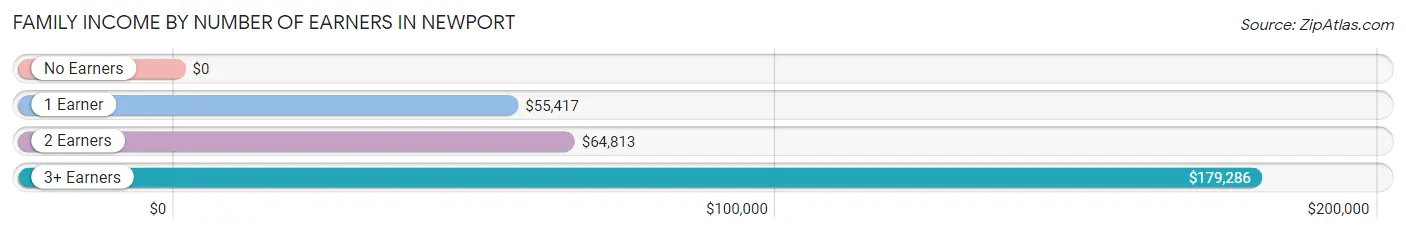
| Number of Earners | # Families | Median Income |
| No Earners | 21 (8.2%) | $0 |
| 1 Earner | 87 (34.1%) | $55,417 |
| 2 Earners | 107 (42.0%) | $64,813 |
| 3+ Earners | 40 (15.7%) | $179,286 |
| Total | 255 (100.0%) | $71,719 |
Household Income in Newport
Household Income Brackets in Newport
With 90 households falling in the category, the $50,000 to $74,999 income range is the most frequent in Newport, accounting for 23.7% of all households. In contrast, only 4 households (1.1%) fall into the $200,000+ income bracket, making it the least populous group.
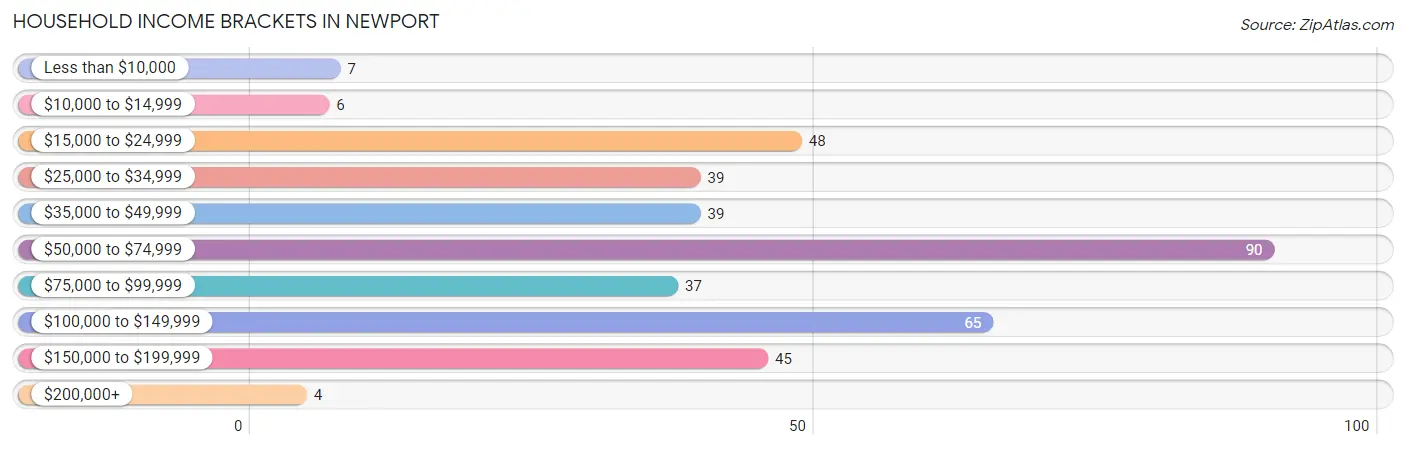
| Income Bracket | # Households | % Households |
| Less than $10,000 | 7 | 1.8% |
| $10,000 to $14,999 | 6 | 1.6% |
| $15,000 to $24,999 | 48 | 12.6% |
| $25,000 to $34,999 | 39 | 10.3% |
| $35,000 to $49,999 | 39 | 10.3% |
| $50,000 to $74,999 | 90 | 23.7% |
| $75,000 to $99,999 | 37 | 9.7% |
| $100,000 to $149,999 | 65 | 17.1% |
| $150,000 to $199,999 | 45 | 11.8% |
| $200,000+ | 4 | 1.1% |
Household Income by Householder Age in Newport
The median household income in Newport is $62,875, with the highest median household income of $71,875 found in the 45 to 64 years age bracket for the primary householder. A total of 126 households (33.2%) fall into this category. Meanwhile, the 15 to 24 years age bracket for the primary householder has the lowest median household income of $0, with 47 households (12.4%) in this group.
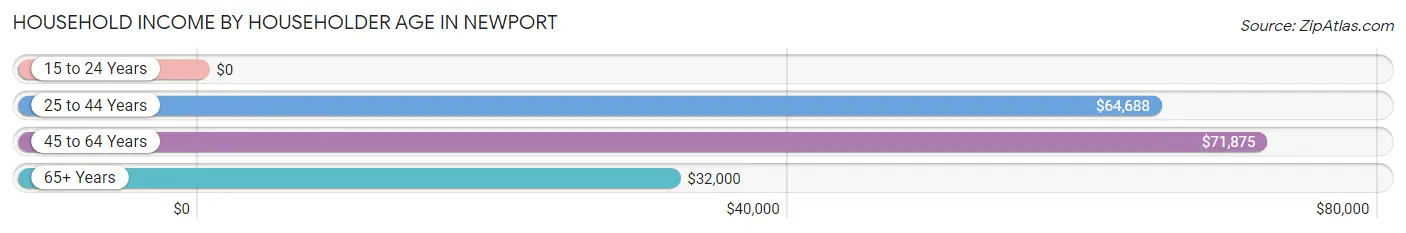
| Income Bracket | # Households | Median Income |
| 15 to 24 Years | 47 (12.4%) | $0 |
| 25 to 44 Years | 141 (37.1%) | $64,688 |
| 45 to 64 Years | 126 (33.2%) | $71,875 |
| 65+ Years | 66 (17.4%) | $32,000 |
| Total | 380 (100.0%) | $62,875 |
Poverty in Newport
Income Below Poverty by Sex and Age in Newport
With 2.1% poverty level for males and 18.7% for females among the residents of Newport, 25 to 34 year old males and 12 to 14 year old females are the most vulnerable to poverty, with 12 males (7.0%) and 15 females (83.3%) in their respective age groups living below the poverty level.
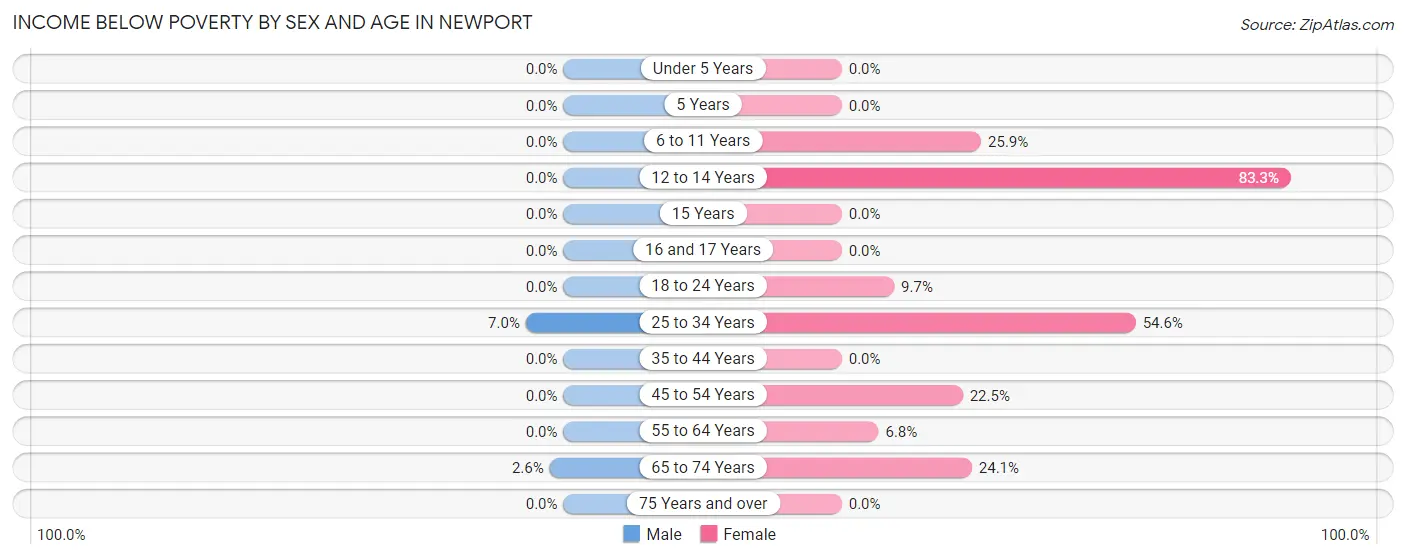
| Age Bracket | Male | Female |
| Under 5 Years | 0 (0.0%) | 0 (0.0%) |
| 5 Years | 0 (0.0%) | 0 (0.0%) |
| 6 to 11 Years | 0 (0.0%) | 15 (25.9%) |
| 12 to 14 Years | 0 (0.0%) | 15 (83.3%) |
| 15 Years | 0 (0.0%) | 0 (0.0%) |
| 16 and 17 Years | 0 (0.0%) | 0 (0.0%) |
| 18 to 24 Years | 0 (0.0%) | 7 (9.7%) |
| 25 to 34 Years | 12 (7.0%) | 42 (54.5%) |
| 35 to 44 Years | 0 (0.0%) | 0 (0.0%) |
| 45 to 54 Years | 0 (0.0%) | 11 (22.5%) |
| 55 to 64 Years | 0 (0.0%) | 3 (6.8%) |
| 65 to 74 Years | 1 (2.6%) | 7 (24.1%) |
| 75 Years and over | 0 (0.0%) | 0 (0.0%) |
| Total | 13 (2.1%) | 100 (18.7%) |
Income Above Poverty by Sex and Age in Newport
According to the poverty statistics in Newport, males aged 5 years and females aged under 5 years are the age groups that are most secure financially, with 100.0% of males and 100.0% of females in these age groups living above the poverty line.
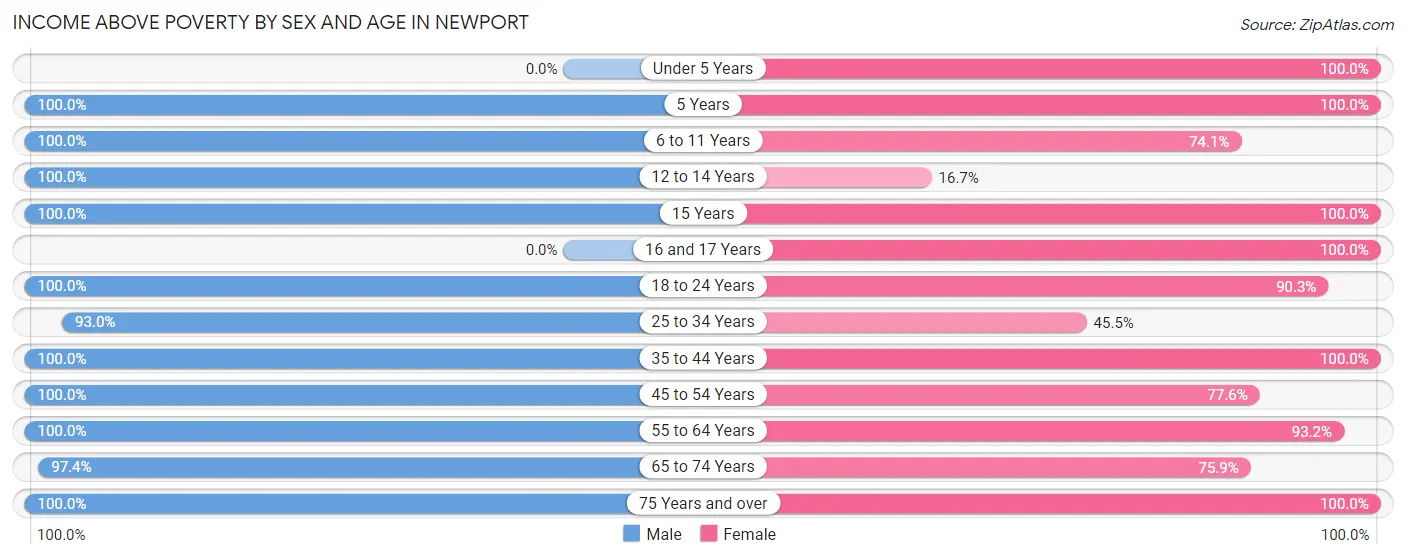
| Age Bracket | Male | Female |
| Under 5 Years | 0 (0.0%) | 49 (100.0%) |
| 5 Years | 17 (100.0%) | 9 (100.0%) |
| 6 to 11 Years | 52 (100.0%) | 43 (74.1%) |
| 12 to 14 Years | 16 (100.0%) | 3 (16.7%) |
| 15 Years | 10 (100.0%) | 22 (100.0%) |
| 16 and 17 Years | 0 (0.0%) | 31 (100.0%) |
| 18 to 24 Years | 122 (100.0%) | 65 (90.3%) |
| 25 to 34 Years | 160 (93.0%) | 35 (45.5%) |
| 35 to 44 Years | 67 (100.0%) | 59 (100.0%) |
| 45 to 54 Years | 36 (100.0%) | 38 (77.5%) |
| 55 to 64 Years | 67 (100.0%) | 41 (93.2%) |
| 65 to 74 Years | 38 (97.4%) | 22 (75.9%) |
| 75 Years and over | 13 (100.0%) | 17 (100.0%) |
| Total | 598 (97.9%) | 434 (81.3%) |
Income Below Poverty Among Married-Couple Families in Newport
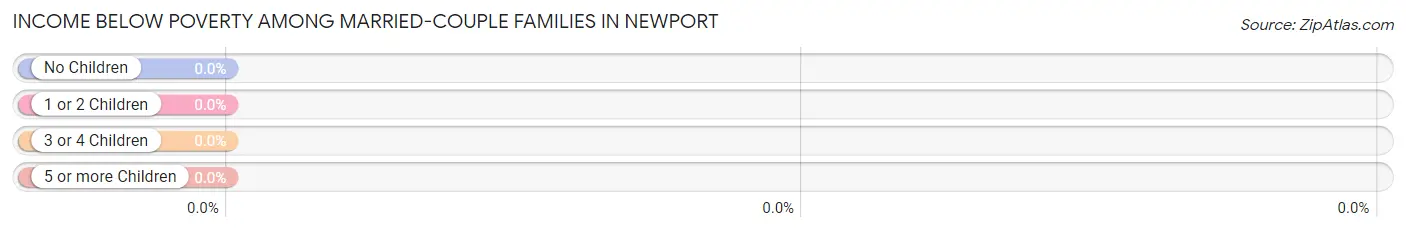
| Children | Above Poverty | Below Poverty |
| No Children | 43 (100.0%) | 0 (0.0%) |
| 1 or 2 Children | 49 (100.0%) | 0 (0.0%) |
| 3 or 4 Children | 50 (100.0%) | 0 (0.0%) |
| 5 or more Children | 0 (0.0%) | 0 (0.0%) |
| Total | 142 (100.0%) | 0 (0.0%) |
Income Below Poverty Among Single-Parent Households in Newport
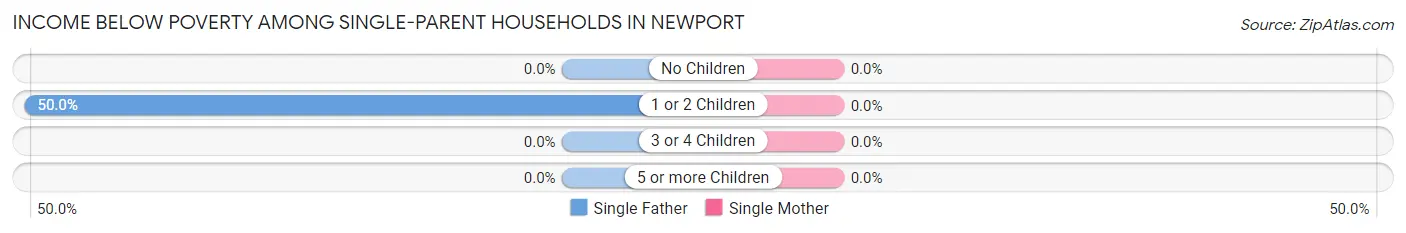
| Children | Single Father | Single Mother |
| No Children | 0 (0.0%) | 0 (0.0%) |
| 1 or 2 Children | 12 (50.0%) | 0 (0.0%) |
| 3 or 4 Children | 0 (0.0%) | 0 (0.0%) |
| 5 or more Children | 0 (0.0%) | 0 (0.0%) |
| Total | 12 (15.2%) | 0 (0.0%) |
Income Below Poverty Among Married-Couple vs Single-Parent Households in Newport

| Children | Married-Couple Families | Single-Parent Households |
| No Children | 0 (0.0%) | 0 (0.0%) |
| 1 or 2 Children | 0 (0.0%) | 12 (26.7%) |
| 3 or 4 Children | 0 (0.0%) | 0 (0.0%) |
| 5 or more Children | 0 (0.0%) | 0 (0.0%) |
| Total | 0 (0.0%) | 12 (10.6%) |
Employment Characteristics in Newport
Employment by Class of Employer in Newport
Among the 527 employed individuals in Newport, private company employees (343 | 65.1%), not-for-profit organizations (48 | 9.1%), and self-employed (incorporated) (45 | 8.5%) make up the most common classes of employment.
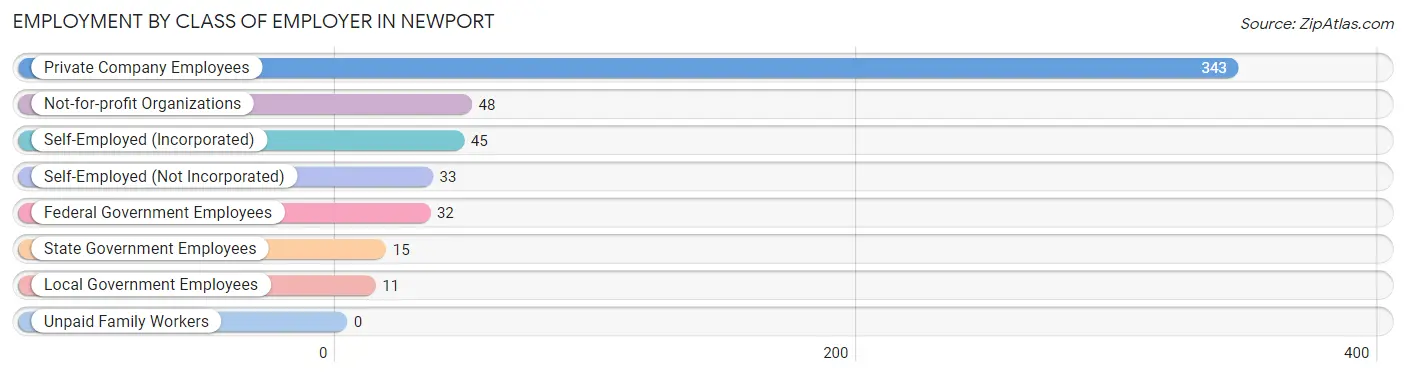
| Employer Class | # Employees | % Employees |
| Private Company Employees | 343 | 65.1% |
| Self-Employed (Incorporated) | 45 | 8.5% |
| Self-Employed (Not Incorporated) | 33 | 6.3% |
| Not-for-profit Organizations | 48 | 9.1% |
| Local Government Employees | 11 | 2.1% |
| State Government Employees | 15 | 2.9% |
| Federal Government Employees | 32 | 6.1% |
| Unpaid Family Workers | 0 | 0.0% |
| Total | 527 | 100.0% |
Employment Status by Age in Newport
According to the labor force statistics for Newport, out of the total population over 16 years of age (894), 63.9% or 571 individuals are in the labor force, with 5.3% or 30 of them unemployed. The age group with the highest labor force participation rate is 30 to 34 years, with 100.0% or 104 individuals in the labor force. Within the labor force, the 16 to 19 years age range has the highest percentage of unemployed individuals, with 30.8% or 8 of them being unemployed.
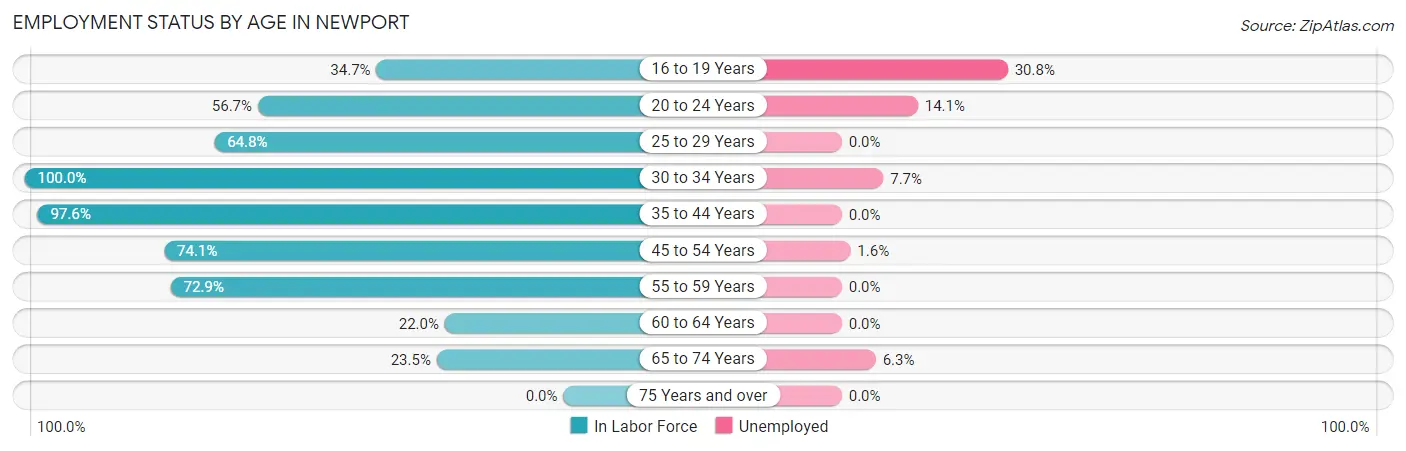
| Age Bracket | In Labor Force | Unemployed |
| 16 to 19 Years | 26 (34.7%) | 8 (30.8%) |
| 20 to 24 Years | 85 (56.7%) | 12 (14.1%) |
| 25 to 29 Years | 94 (64.8%) | 0 (0.0%) |
| 30 to 34 Years | 104 (100.0%) | 8 (7.7%) |
| 35 to 44 Years | 123 (97.6%) | 0 (0.0%) |
| 45 to 54 Years | 63 (74.1%) | 1 (1.6%) |
| 55 to 59 Years | 51 (72.9%) | 0 (0.0%) |
| 60 to 64 Years | 9 (22.0%) | 0 (0.0%) |
| 65 to 74 Years | 16 (23.5%) | 1 (6.3%) |
| 75 Years and over | 0 (0.0%) | 0 (0.0%) |
| Total | 571 (63.9%) | 30 (5.3%) |
Employment Status by Educational Attainment in Newport
According to labor force statistics for Newport, 77.8% of individuals (444) out of the total population between 25 and 64 years of age (571) are in the labor force, with 2.0% or 9 of them being unemployed. The group with the highest labor force participation rate are those with the educational attainment of college / associate degree, with 96.9% or 125 individuals in the labor force. Within the labor force, individuals with high school diploma education have the highest percentage of unemployment, with 4.8% or 8 of them being unemployed.
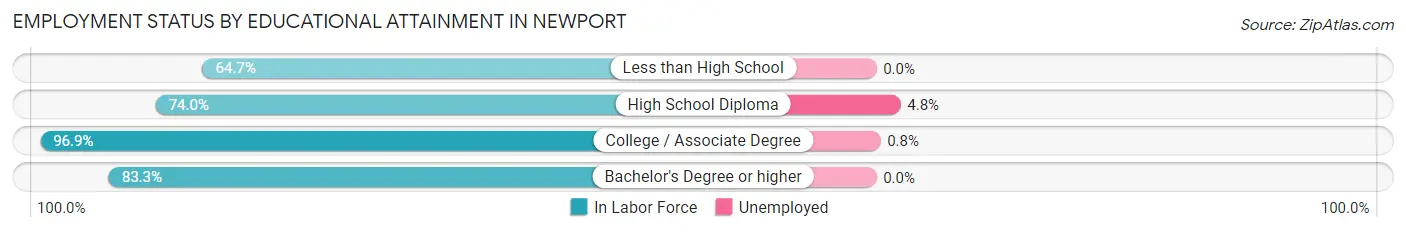
| Educational Attainment | In Labor Force | Unemployed |
| Less than High School | 99 (64.7%) | 0 (0.0%) |
| High School Diploma | 165 (74.0%) | 11 (4.8%) |
| College / Associate Degree | 125 (96.9%) | 1 (0.8%) |
| Bachelor's Degree or higher | 55 (83.3%) | 0 (0.0%) |
| Total | 444 (77.8%) | 11 (2.0%) |
Employment Occupations by Sex in Newport
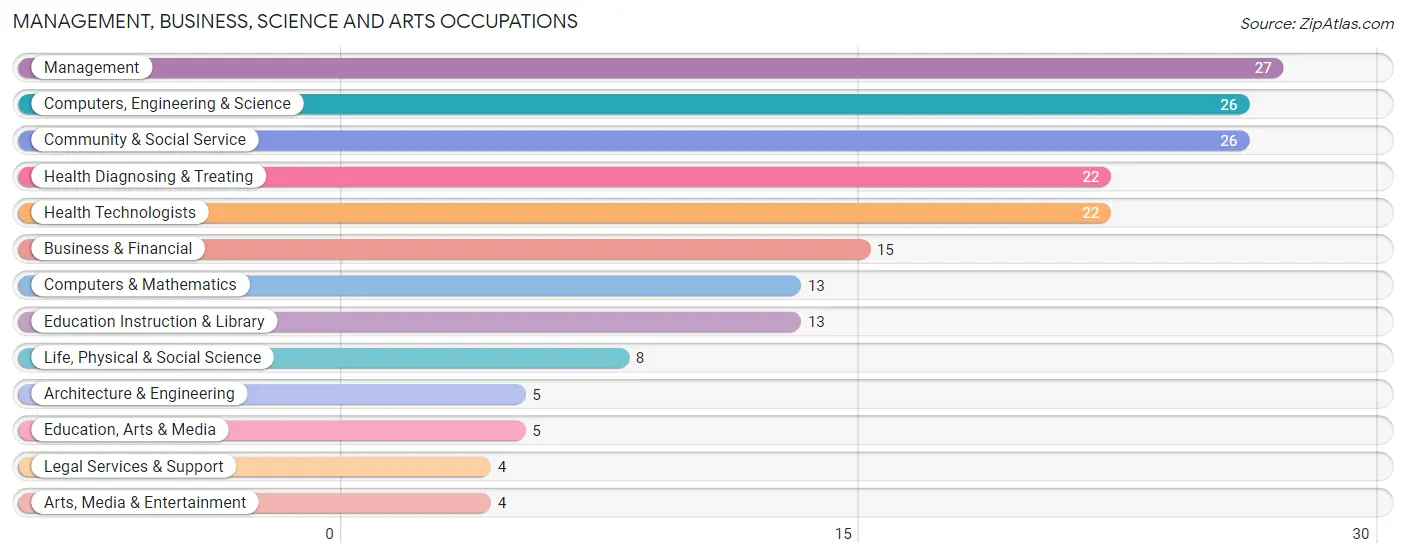
Management, Business, Science and Arts Occupations
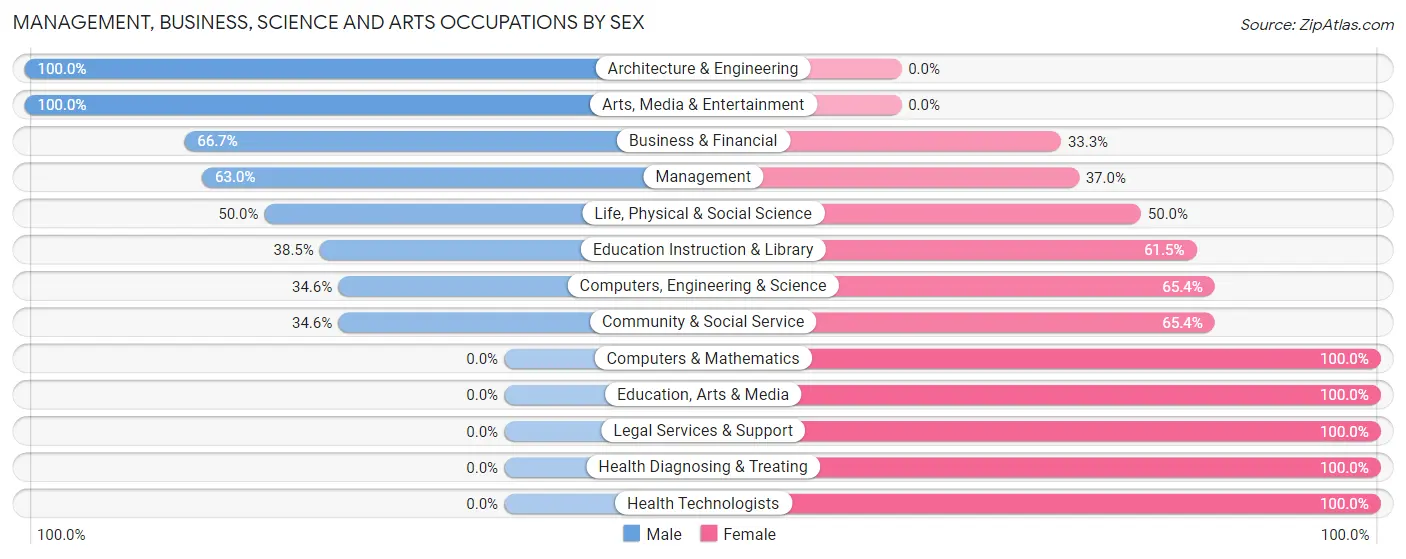
The most common Management, Business, Science and Arts occupations in Newport are Management (27 | 5.0%), Computers, Engineering & Science (26 | 4.8%), Community & Social Service (26 | 4.8%), Health Diagnosing & Treating (22 | 4.1%), and Health Technologists (22 | 4.1%).
Management, Business, Science and Arts Occupations by Sex
Within the Management, Business, Science and Arts occupations in Newport, the most male-oriented occupations are Architecture & Engineering (100.0%), Arts, Media & Entertainment (100.0%), and Business & Financial (66.7%), while the most female-oriented occupations are Computers & Mathematics (100.0%), Education, Arts & Media (100.0%), and Legal Services & Support (100.0%).
| Occupation | Male | Female |
| Management | 17 (63.0%) | 10 (37.0%) |
| Business & Financial | 10 (66.7%) | 5 (33.3%) |
| Computers, Engineering & Science | 9 (34.6%) | 17 (65.4%) |
| Computers & Mathematics | 0 (0.0%) | 13 (100.0%) |
| Architecture & Engineering | 5 (100.0%) | 0 (0.0%) |
| Life, Physical & Social Science | 4 (50.0%) | 4 (50.0%) |
| Community & Social Service | 9 (34.6%) | 17 (65.4%) |
| Education, Arts & Media | 0 (0.0%) | 5 (100.0%) |
| Legal Services & Support | 0 (0.0%) | 4 (100.0%) |
| Education Instruction & Library | 5 (38.5%) | 8 (61.5%) |
| Arts, Media & Entertainment | 4 (100.0%) | 0 (0.0%) |
| Health Diagnosing & Treating | 0 (0.0%) | 22 (100.0%) |
| Health Technologists | 0 (0.0%) | 22 (100.0%) |
| Total (Category) | 45 (38.8%) | 71 (61.2%) |
| Total (Overall) | 361 (66.7%) | 180 (33.3%) |
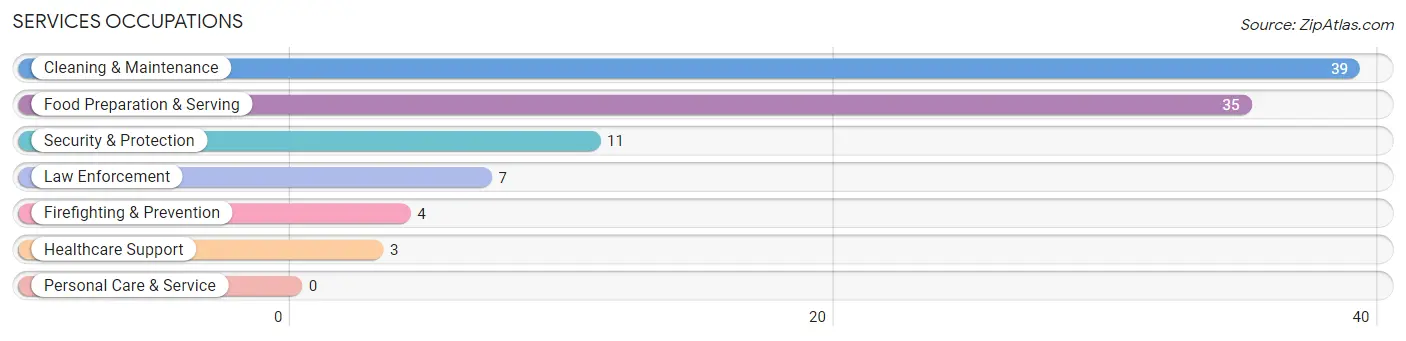
Services Occupations
The most common Services occupations in Newport are Cleaning & Maintenance (39 | 7.2%), Food Preparation & Serving (35 | 6.5%), Security & Protection (11 | 2.0%), Law Enforcement (7 | 1.3%), and Firefighting & Prevention (4 | 0.7%).
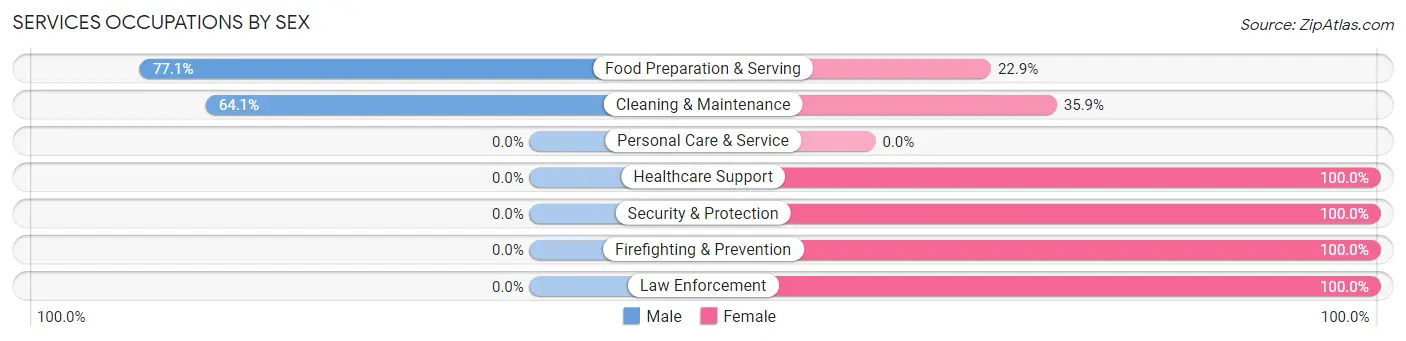
Services Occupations by Sex
Within the Services occupations in Newport, the most male-oriented occupations are Food Preparation & Serving (77.1%), and Cleaning & Maintenance (64.1%), while the most female-oriented occupations are Healthcare Support (100.0%), Security & Protection (100.0%), and Firefighting & Prevention (100.0%).
| Occupation | Male | Female |
| Healthcare Support | 0 (0.0%) | 3 (100.0%) |
| Security & Protection | 0 (0.0%) | 11 (100.0%) |
| Firefighting & Prevention | 0 (0.0%) | 4 (100.0%) |
| Law Enforcement | 0 (0.0%) | 7 (100.0%) |
| Food Preparation & Serving | 27 (77.1%) | 8 (22.9%) |
| Cleaning & Maintenance | 25 (64.1%) | 14 (35.9%) |
| Personal Care & Service | 0 (0.0%) | 0 (0.0%) |
| Total (Category) | 52 (59.1%) | 36 (40.9%) |
| Total (Overall) | 361 (66.7%) | 180 (33.3%) |
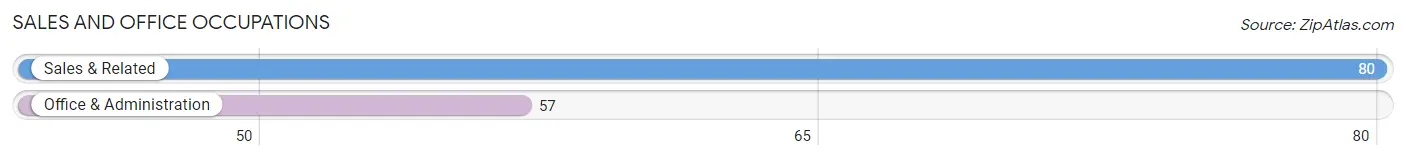
Sales and Office Occupations
The most common Sales and Office occupations in Newport are Sales & Related (80 | 14.8%), and Office & Administration (57 | 10.5%).
Sales and Office Occupations by Sex
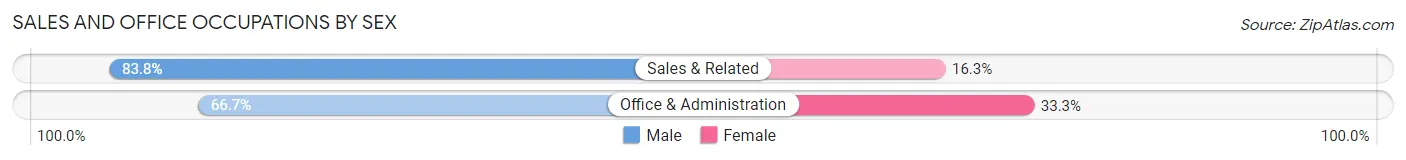
| Occupation | Male | Female |
| Sales & Related | 67 (83.8%) | 13 (16.3%) |
| Office & Administration | 38 (66.7%) | 19 (33.3%) |
| Total (Category) | 105 (76.6%) | 32 (23.4%) |
| Total (Overall) | 361 (66.7%) | 180 (33.3%) |
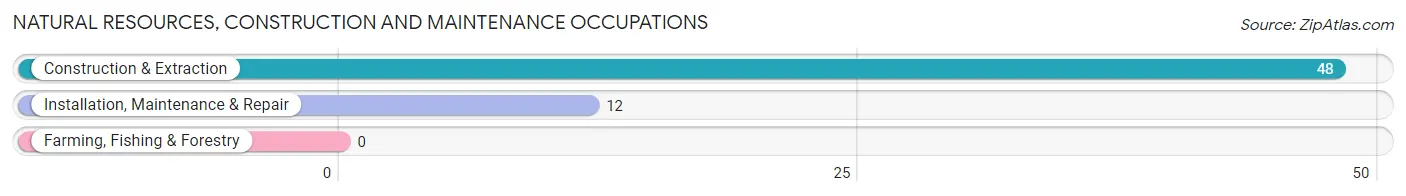
Natural Resources, Construction and Maintenance Occupations
The most common Natural Resources, Construction and Maintenance occupations in Newport are Construction & Extraction (48 | 8.9%), and Installation, Maintenance & Repair (12 | 2.2%).
Natural Resources, Construction and Maintenance Occupations by Sex
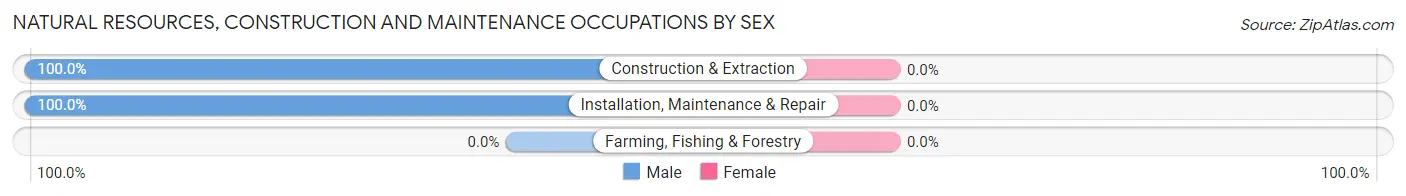
| Occupation | Male | Female |
| Farming, Fishing & Forestry | 0 (0.0%) | 0 (0.0%) |
| Construction & Extraction | 48 (100.0%) | 0 (0.0%) |
| Installation, Maintenance & Repair | 12 (100.0%) | 0 (0.0%) |
| Total (Category) | 60 (100.0%) | 0 (0.0%) |
| Total (Overall) | 361 (66.7%) | 180 (33.3%) |
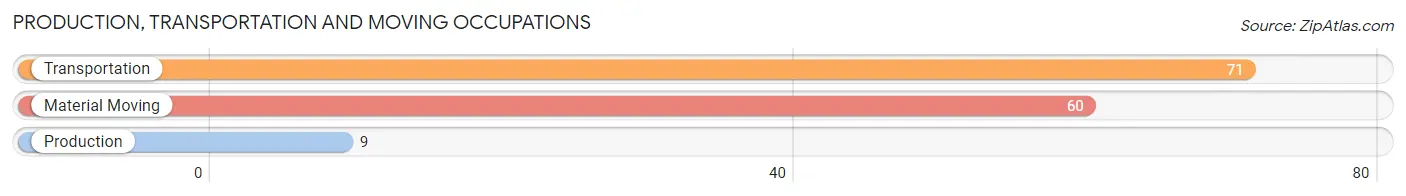
Production, Transportation and Moving Occupations
The most common Production, Transportation and Moving occupations in Newport are Transportation (71 | 13.1%), Material Moving (60 | 11.1%), and Production (9 | 1.7%).
Production, Transportation and Moving Occupations by Sex
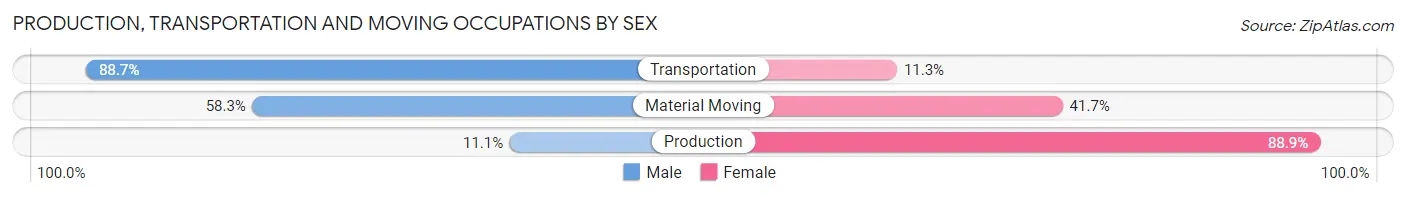
| Occupation | Male | Female |
| Production | 1 (11.1%) | 8 (88.9%) |
| Transportation | 63 (88.7%) | 8 (11.3%) |
| Material Moving | 35 (58.3%) | 25 (41.7%) |
| Total (Category) | 99 (70.7%) | 41 (29.3%) |
| Total (Overall) | 361 (66.7%) | 180 (33.3%) |
Employment Industries by Sex in Newport
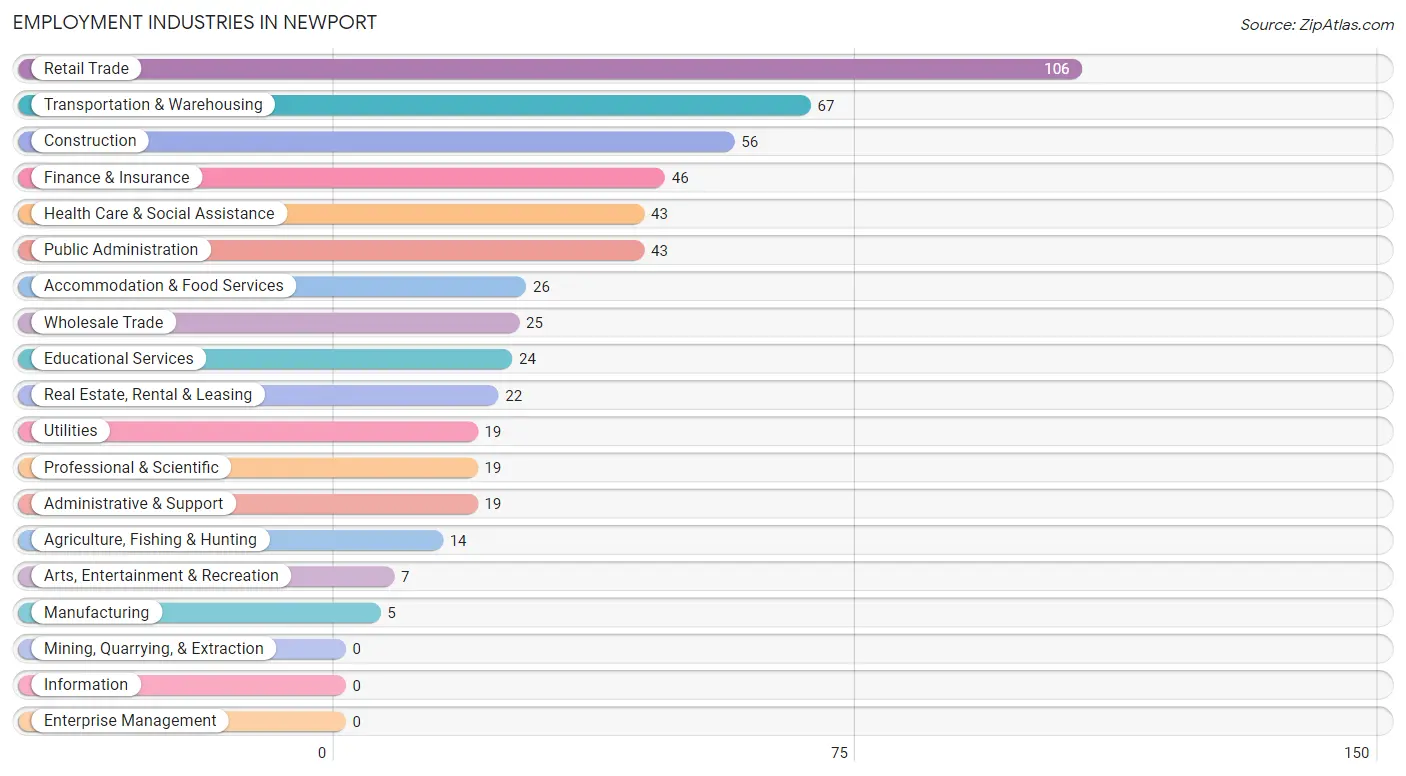
Employment Industries in Newport
The major employment industries in Newport include Retail Trade (106 | 19.6%), Transportation & Warehousing (67 | 12.4%), Construction (56 | 10.3%), Finance & Insurance (46 | 8.5%), and Health Care & Social Assistance (43 | 8.0%).
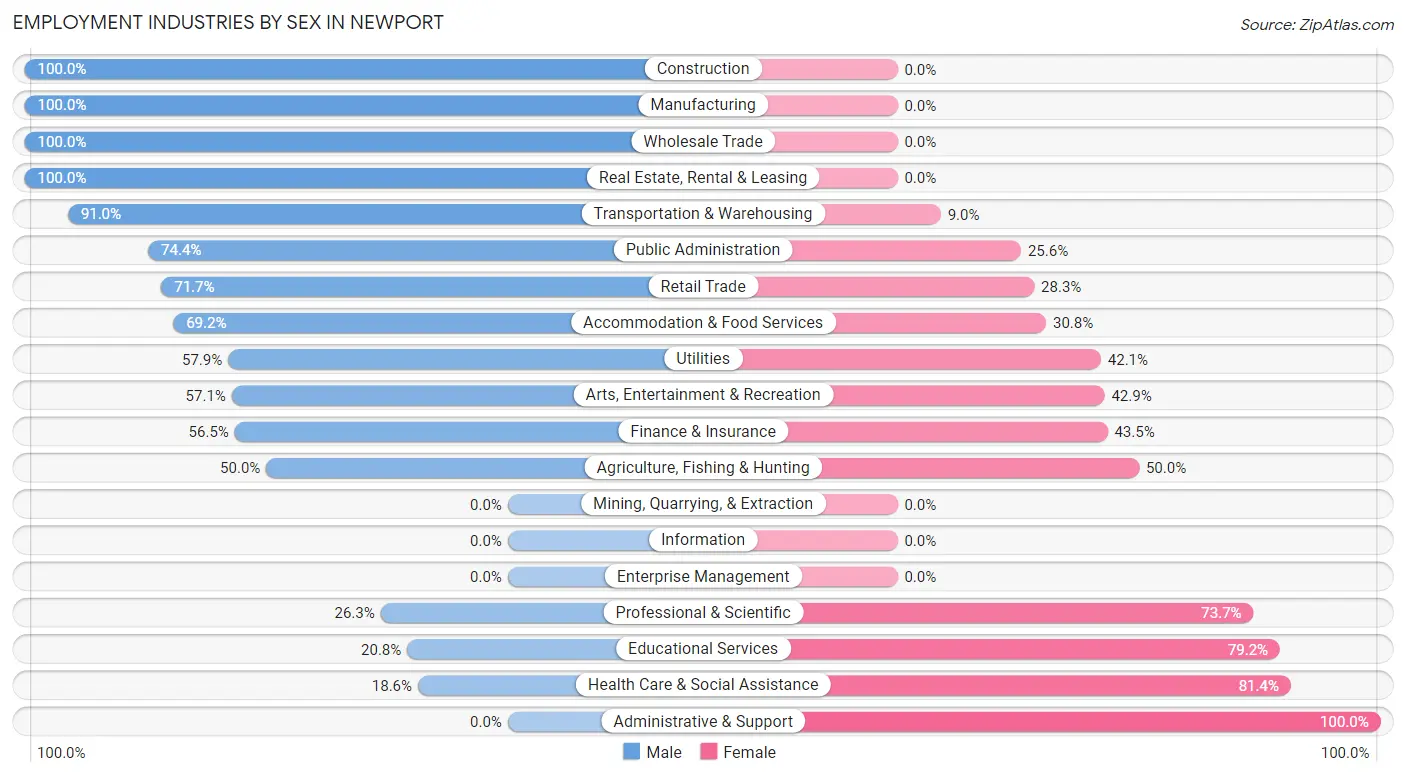
Employment Industries by Sex in Newport
The Newport industries that see more men than women are Construction (100.0%), Manufacturing (100.0%), and Wholesale Trade (100.0%), whereas the industries that tend to have a higher number of women are Administrative & Support (100.0%), Health Care & Social Assistance (81.4%), and Educational Services (79.2%).
| Industry | Male | Female |
| Agriculture, Fishing & Hunting | 7 (50.0%) | 7 (50.0%) |
| Mining, Quarrying, & Extraction | 0 (0.0%) | 0 (0.0%) |
| Construction | 56 (100.0%) | 0 (0.0%) |
| Manufacturing | 5 (100.0%) | 0 (0.0%) |
| Wholesale Trade | 25 (100.0%) | 0 (0.0%) |
| Retail Trade | 76 (71.7%) | 30 (28.3%) |
| Transportation & Warehousing | 61 (91.0%) | 6 (9.0%) |
| Utilities | 11 (57.9%) | 8 (42.1%) |
| Information | 0 (0.0%) | 0 (0.0%) |
| Finance & Insurance | 26 (56.5%) | 20 (43.5%) |
| Real Estate, Rental & Leasing | 22 (100.0%) | 0 (0.0%) |
| Professional & Scientific | 5 (26.3%) | 14 (73.7%) |
| Enterprise Management | 0 (0.0%) | 0 (0.0%) |
| Administrative & Support | 0 (0.0%) | 19 (100.0%) |
| Educational Services | 5 (20.8%) | 19 (79.2%) |
| Health Care & Social Assistance | 8 (18.6%) | 35 (81.4%) |
| Arts, Entertainment & Recreation | 4 (57.1%) | 3 (42.9%) |
| Accommodation & Food Services | 18 (69.2%) | 8 (30.8%) |
| Public Administration | 32 (74.4%) | 11 (25.6%) |
| Total | 361 (66.7%) | 180 (33.3%) |
Education in Newport
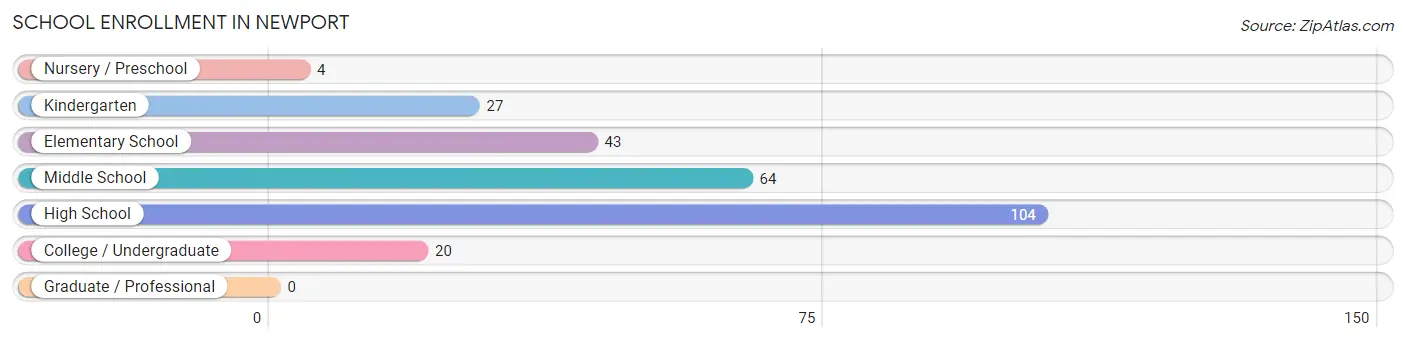
School Enrollment in Newport
The most common levels of schooling among the 262 students in Newport are high school (104 | 39.7%), middle school (64 | 24.4%), and elementary school (43 | 16.4%).
| School Level | # Students | % Students |
| Nursery / Preschool | 4 | 1.5% |
| Kindergarten | 27 | 10.3% |
| Elementary School | 43 | 16.4% |
| Middle School | 64 | 24.4% |
| High School | 104 | 39.7% |
| College / Undergraduate | 20 | 7.6% |
| Graduate / Professional | 0 | 0.0% |
| Total | 262 | 100.0% |
School Enrollment by Age by Funding Source in Newport
Out of a total of 262 students who are enrolled in schools in Newport, 30 (11.5%) attend a private institution, while the remaining 232 (88.5%) are enrolled in public schools. The age group of 25 to 34 year olds has the highest likelihood of being enrolled in private schools, with 3 (100.0% in the age bracket) enrolled. Conversely, the age group of 18 to 19 year olds has the lowest likelihood of being enrolled in a private school, with 32 (100.0% in the age bracket) attending a public institution.
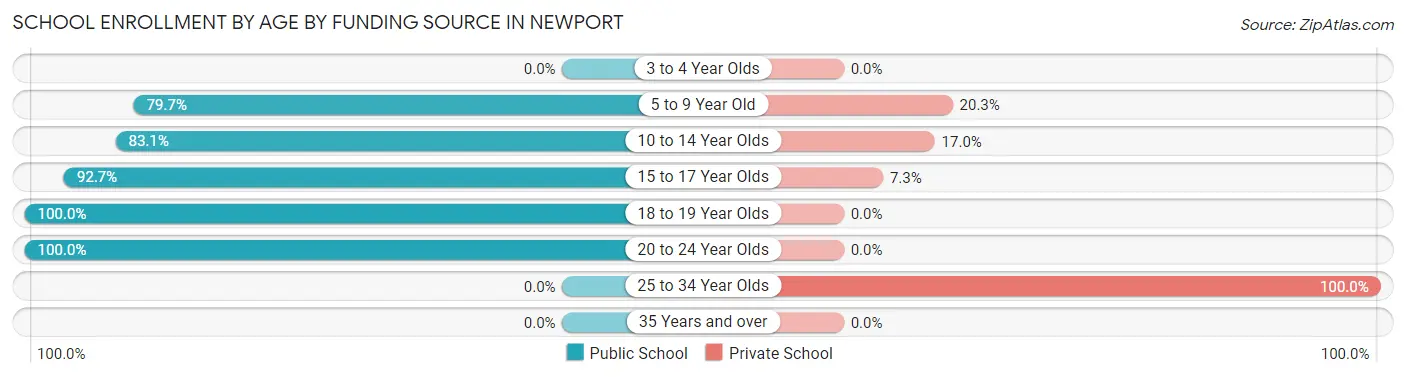
| Age Bracket | Public School | Private School |
| 3 to 4 Year Olds | 0 (0.0%) | 0 (0.0%) |
| 5 to 9 Year Old | 55 (79.7%) | 14 (20.3%) |
| 10 to 14 Year Olds | 49 (83.1%) | 10 (17.0%) |
| 15 to 17 Year Olds | 38 (92.7%) | 3 (7.3%) |
| 18 to 19 Year Olds | 32 (100.0%) | 0 (0.0%) |
| 20 to 24 Year Olds | 58 (100.0%) | 0 (0.0%) |
| 25 to 34 Year Olds | 0 (0.0%) | 3 (100.0%) |
| 35 Years and over | 0 (0.0%) | 0 (0.0%) |
| Total | 232 (88.5%) | 30 (11.5%) |
Educational Attainment by Field of Study in Newport
Education (24 | 29.3%), business (21 | 25.6%), arts & humanities (11 | 13.4%), psychology (6 | 7.3%), and multidisciplinary studies (5 | 6.1%) are the most common fields of study among 82 individuals in Newport who have obtained a bachelor's degree or higher.
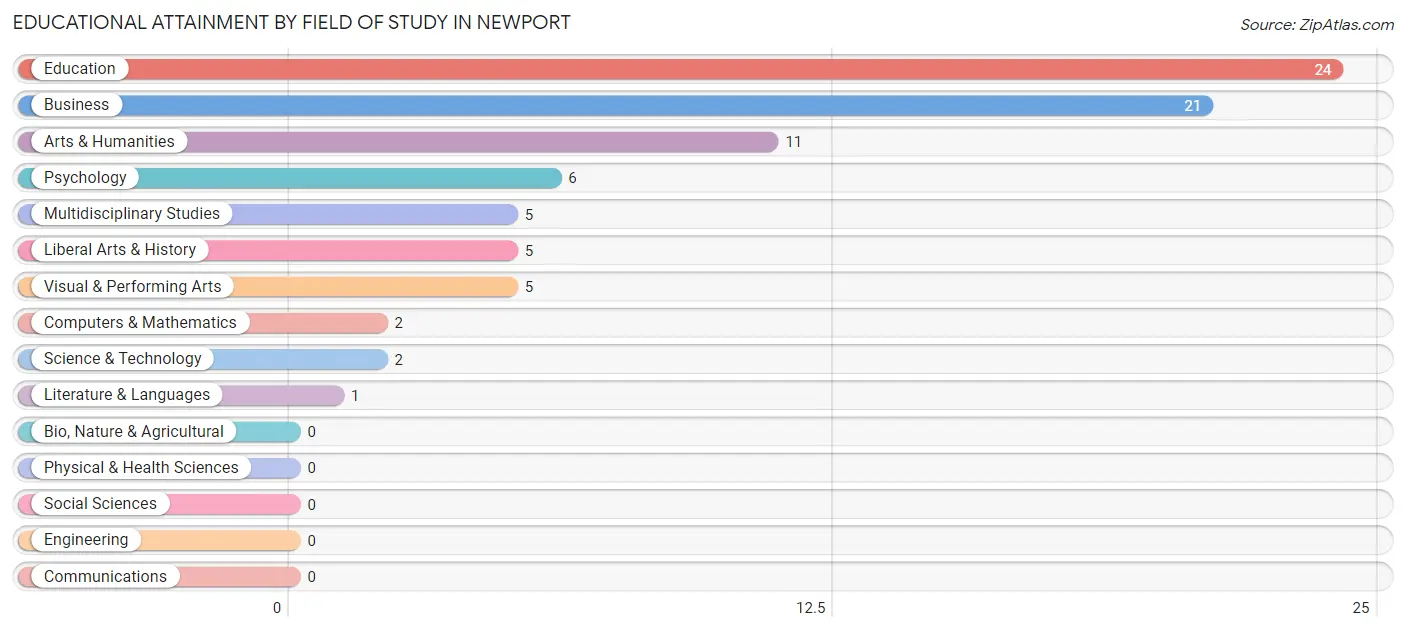
| Field of Study | # Graduates | % Graduates |
| Computers & Mathematics | 2 | 2.4% |
| Bio, Nature & Agricultural | 0 | 0.0% |
| Physical & Health Sciences | 0 | 0.0% |
| Psychology | 6 | 7.3% |
| Social Sciences | 0 | 0.0% |
| Engineering | 0 | 0.0% |
| Multidisciplinary Studies | 5 | 6.1% |
| Science & Technology | 2 | 2.4% |
| Business | 21 | 25.6% |
| Education | 24 | 29.3% |
| Literature & Languages | 1 | 1.2% |
| Liberal Arts & History | 5 | 6.1% |
| Visual & Performing Arts | 5 | 6.1% |
| Communications | 0 | 0.0% |
| Arts & Humanities | 11 | 13.4% |
| Total | 82 | 100.0% |
Transportation & Commute in Newport
Vehicle Availability by Sex in Newport
The most prevalent vehicle ownership categories in Newport are males with 2 vehicles (177, accounting for 49.0%) and females with 2 vehicles (73, making up 106.6%).
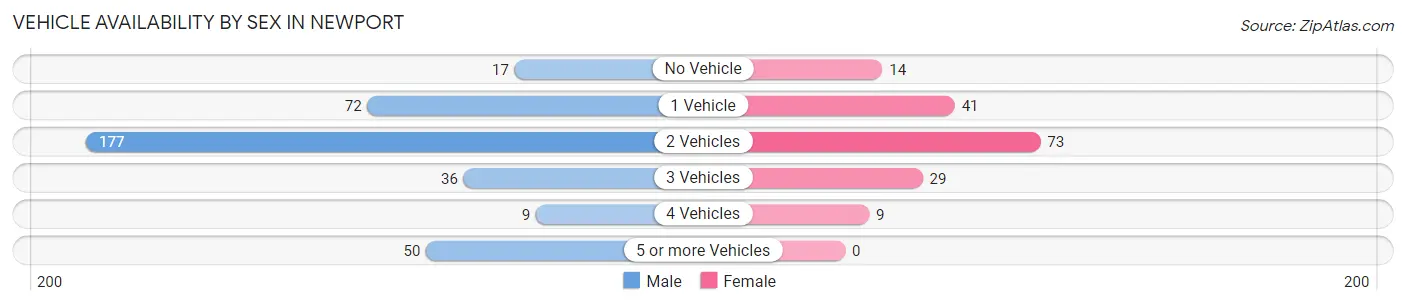
| Vehicles Available | Male | Female |
| No Vehicle | 17 (4.7%) | 14 (8.4%) |
| 1 Vehicle | 72 (19.9%) | 41 (24.7%) |
| 2 Vehicles | 177 (49.0%) | 73 (44.0%) |
| 3 Vehicles | 36 (10.0%) | 29 (17.5%) |
| 4 Vehicles | 9 (2.5%) | 9 (5.4%) |
| 5 or more Vehicles | 50 (13.9%) | 0 (0.0%) |
| Total | 361 (100.0%) | 166 (100.0%) |
Commute Time in Newport
The most frequently occuring commute durations in Newport are 10 to 14 minutes (123 commuters, 24.2%), 30 to 34 minutes (74 commuters, 14.6%), and 25 to 29 minutes (64 commuters, 12.6%).
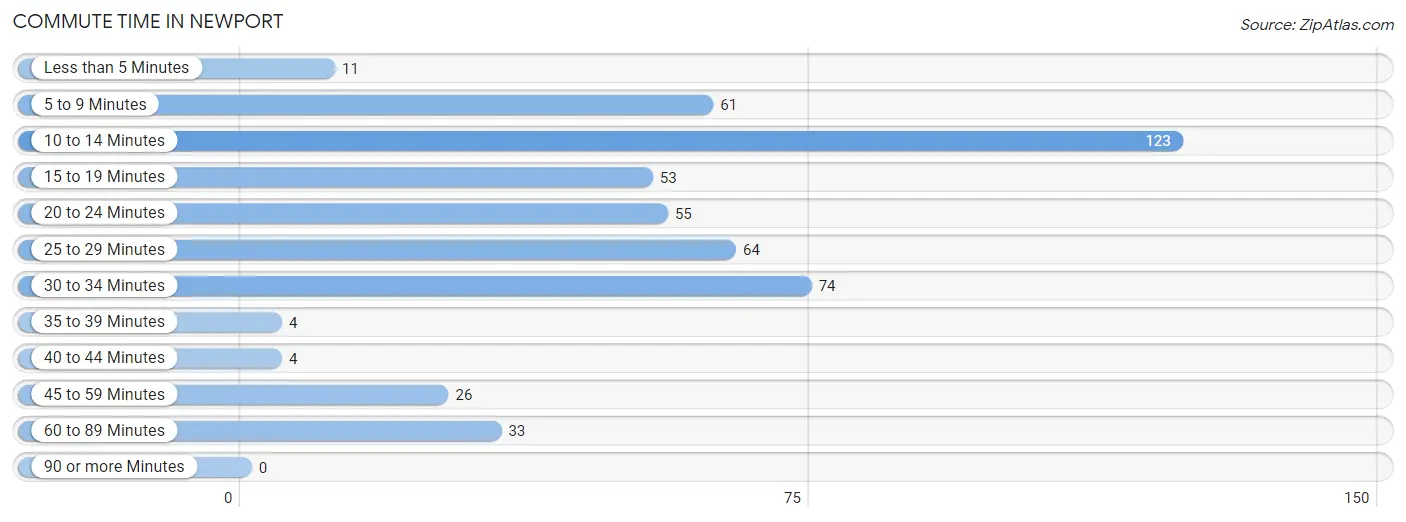
| Commute Time | # Commuters | % Commuters |
| Less than 5 Minutes | 11 | 2.2% |
| 5 to 9 Minutes | 61 | 12.0% |
| 10 to 14 Minutes | 123 | 24.2% |
| 15 to 19 Minutes | 53 | 10.4% |
| 20 to 24 Minutes | 55 | 10.8% |
| 25 to 29 Minutes | 64 | 12.6% |
| 30 to 34 Minutes | 74 | 14.6% |
| 35 to 39 Minutes | 4 | 0.8% |
| 40 to 44 Minutes | 4 | 0.8% |
| 45 to 59 Minutes | 26 | 5.1% |
| 60 to 89 Minutes | 33 | 6.5% |
| 90 or more Minutes | 0 | 0.0% |
Commute Time by Sex in Newport
The most common commute times in Newport are 10 to 14 minutes (70 commuters, 19.7%) for males and 10 to 14 minutes (53 commuters, 34.9%) for females.
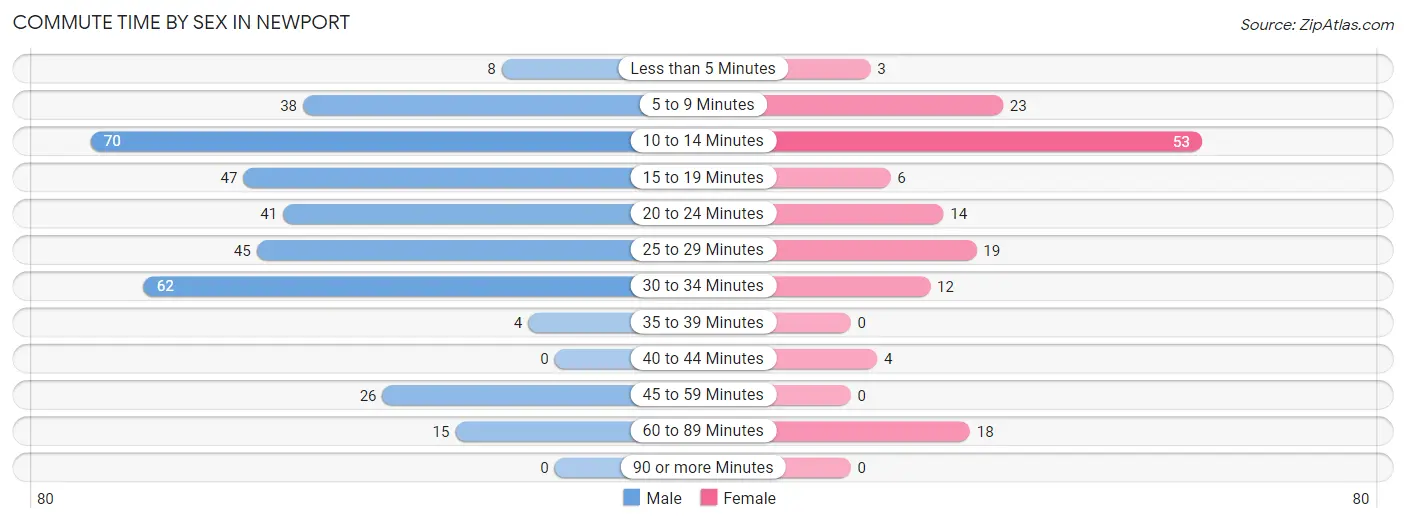
| Commute Time | Male | Female |
| Less than 5 Minutes | 8 (2.2%) | 3 (2.0%) |
| 5 to 9 Minutes | 38 (10.7%) | 23 (15.1%) |
| 10 to 14 Minutes | 70 (19.7%) | 53 (34.9%) |
| 15 to 19 Minutes | 47 (13.2%) | 6 (4.0%) |
| 20 to 24 Minutes | 41 (11.5%) | 14 (9.2%) |
| 25 to 29 Minutes | 45 (12.6%) | 19 (12.5%) |
| 30 to 34 Minutes | 62 (17.4%) | 12 (7.9%) |
| 35 to 39 Minutes | 4 (1.1%) | 0 (0.0%) |
| 40 to 44 Minutes | 0 (0.0%) | 4 (2.6%) |
| 45 to 59 Minutes | 26 (7.3%) | 0 (0.0%) |
| 60 to 89 Minutes | 15 (4.2%) | 18 (11.8%) |
| 90 or more Minutes | 0 (0.0%) | 0 (0.0%) |
Time of Departure to Work by Sex in Newport
The most frequent times of departure to work in Newport are 7:00 AM to 7:29 AM (95, 26.7%) for males and 7:30 AM to 7:59 AM (28, 18.4%) for females.
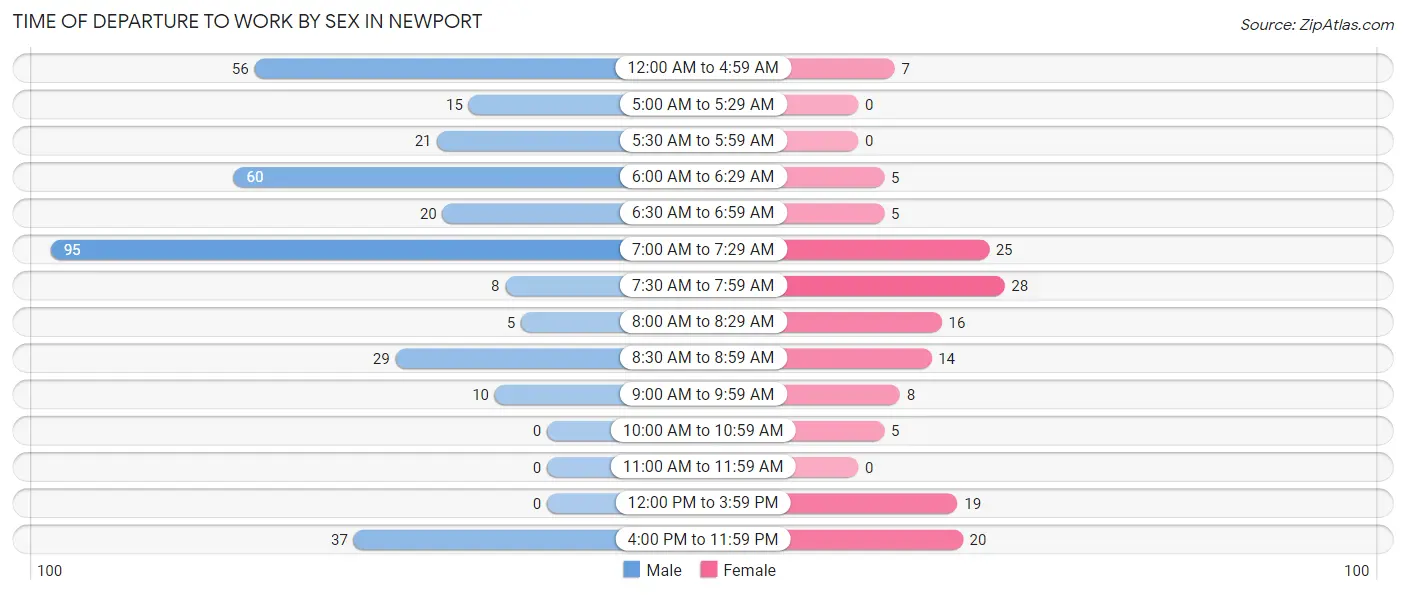
| Time of Departure | Male | Female |
| 12:00 AM to 4:59 AM | 56 (15.7%) | 7 (4.6%) |
| 5:00 AM to 5:29 AM | 15 (4.2%) | 0 (0.0%) |
| 5:30 AM to 5:59 AM | 21 (5.9%) | 0 (0.0%) |
| 6:00 AM to 6:29 AM | 60 (16.9%) | 5 (3.3%) |
| 6:30 AM to 6:59 AM | 20 (5.6%) | 5 (3.3%) |
| 7:00 AM to 7:29 AM | 95 (26.7%) | 25 (16.5%) |
| 7:30 AM to 7:59 AM | 8 (2.2%) | 28 (18.4%) |
| 8:00 AM to 8:29 AM | 5 (1.4%) | 16 (10.5%) |
| 8:30 AM to 8:59 AM | 29 (8.2%) | 14 (9.2%) |
| 9:00 AM to 9:59 AM | 10 (2.8%) | 8 (5.3%) |
| 10:00 AM to 10:59 AM | 0 (0.0%) | 5 (3.3%) |
| 11:00 AM to 11:59 AM | 0 (0.0%) | 0 (0.0%) |
| 12:00 PM to 3:59 PM | 0 (0.0%) | 19 (12.5%) |
| 4:00 PM to 11:59 PM | 37 (10.4%) | 20 (13.2%) |
| Total | 356 (100.0%) | 152 (100.0%) |
Housing Occupancy in Newport
Occupancy by Ownership in Newport
Of the total 380 dwellings in Newport, owner-occupied units account for 147 (38.7%), while renter-occupied units make up 233 (61.3%).
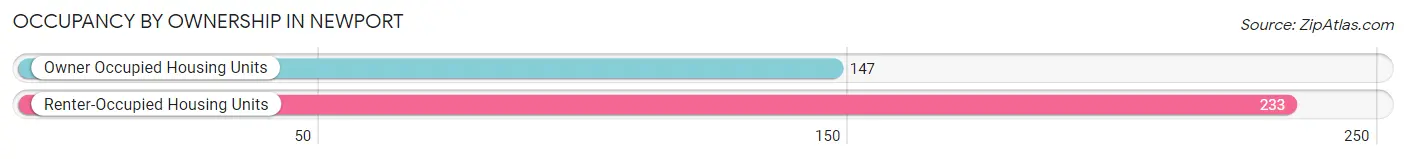
| Occupancy | # Housing Units | % Housing Units |
| Owner Occupied Housing Units | 147 | 38.7% |
| Renter-Occupied Housing Units | 233 | 61.3% |
| Total Occupied Housing Units | 380 | 100.0% |
Occupancy by Household Size in Newport
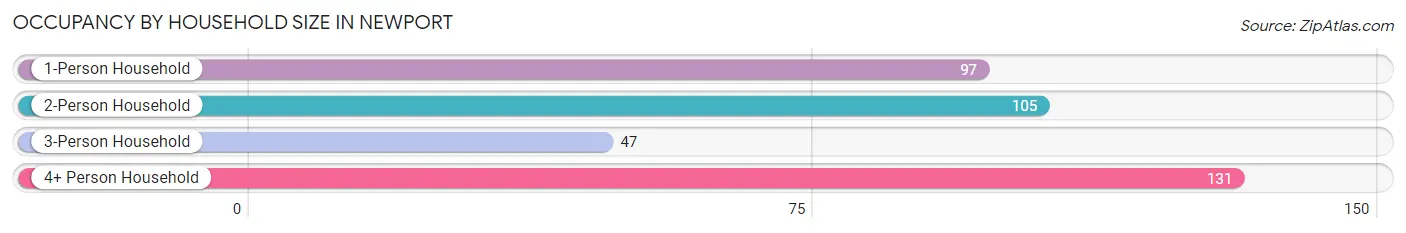
| Household Size | # Housing Units | % Housing Units |
| 1-Person Household | 97 | 25.5% |
| 2-Person Household | 105 | 27.6% |
| 3-Person Household | 47 | 12.4% |
| 4+ Person Household | 131 | 34.5% |
| Total Housing Units | 380 | 100.0% |
Occupancy by Ownership by Household Size in Newport
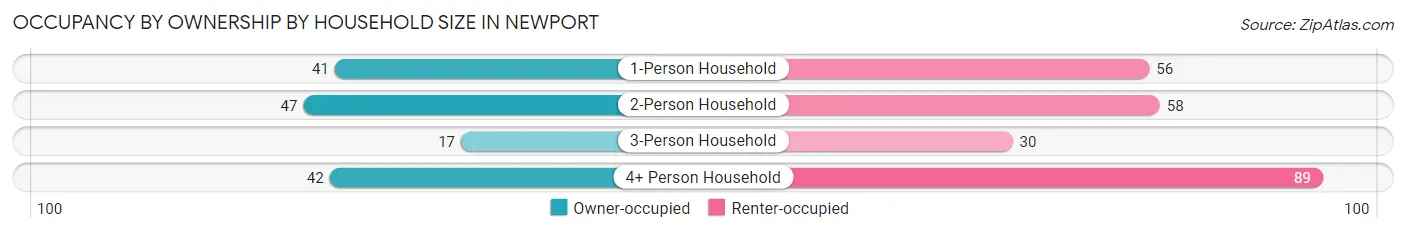
| Household Size | Owner-occupied | Renter-occupied |
| 1-Person Household | 41 (42.3%) | 56 (57.7%) |
| 2-Person Household | 47 (44.8%) | 58 (55.2%) |
| 3-Person Household | 17 (36.2%) | 30 (63.8%) |
| 4+ Person Household | 42 (32.1%) | 89 (67.9%) |
| Total Housing Units | 147 (38.7%) | 233 (61.3%) |
Occupancy by Educational Attainment in Newport
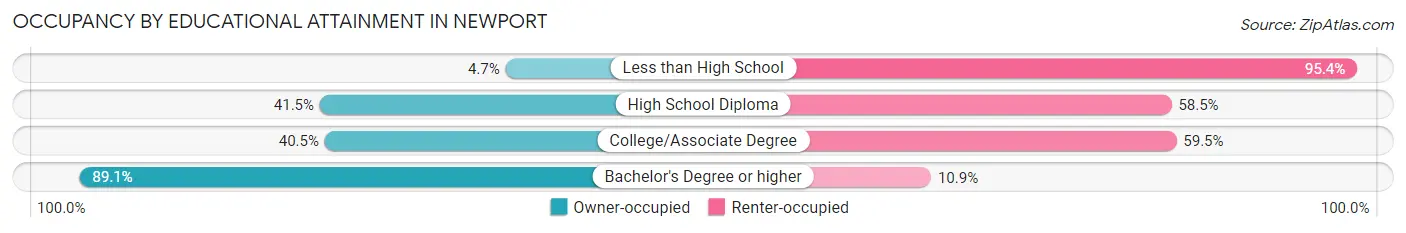
| Household Size | Owner-occupied | Renter-occupied |
| Less than High School | 4 (4.6%) | 82 (95.4%) |
| High School Diploma | 68 (41.5%) | 96 (58.5%) |
| College/Associate Degree | 34 (40.5%) | 50 (59.5%) |
| Bachelor's Degree or higher | 41 (89.1%) | 5 (10.9%) |
Occupancy by Age of Householder in Newport
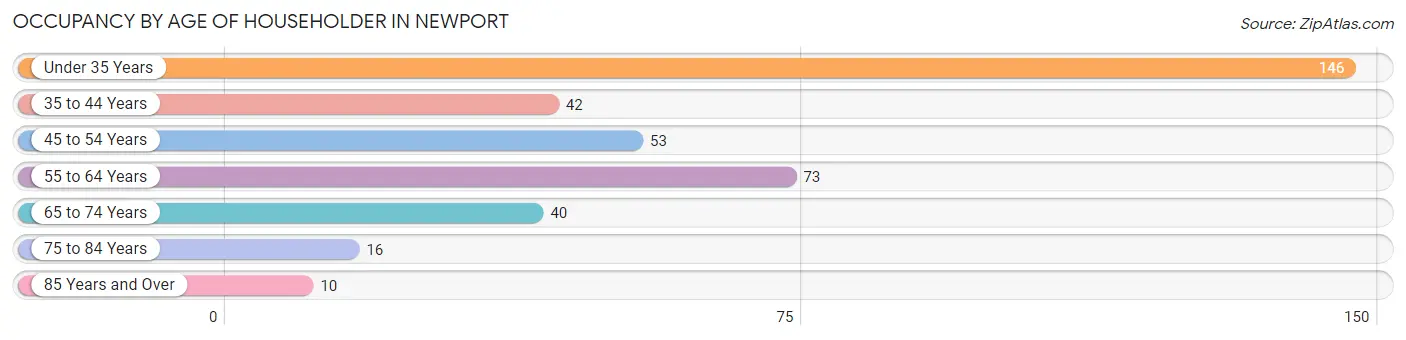
| Age Bracket | # Households | % Households |
| Under 35 Years | 146 | 38.4% |
| 35 to 44 Years | 42 | 11.1% |
| 45 to 54 Years | 53 | 14.0% |
| 55 to 64 Years | 73 | 19.2% |
| 65 to 74 Years | 40 | 10.5% |
| 75 to 84 Years | 16 | 4.2% |
| 85 Years and Over | 10 | 2.6% |
| Total | 380 | 100.0% |
Housing Finances in Newport
Median Income by Occupancy in Newport
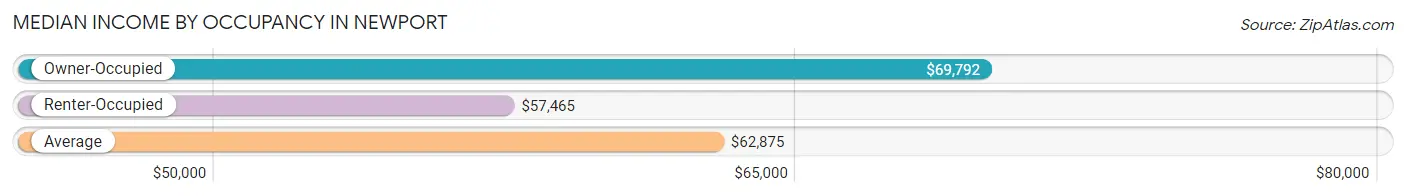
| Occupancy Type | # Households | Median Income |
| Owner-Occupied | 147 (38.7%) | $69,792 |
| Renter-Occupied | 233 (61.3%) | $57,465 |
| Average | 380 (100.0%) | $62,875 |
Occupancy by Householder Income Bracket in Newport
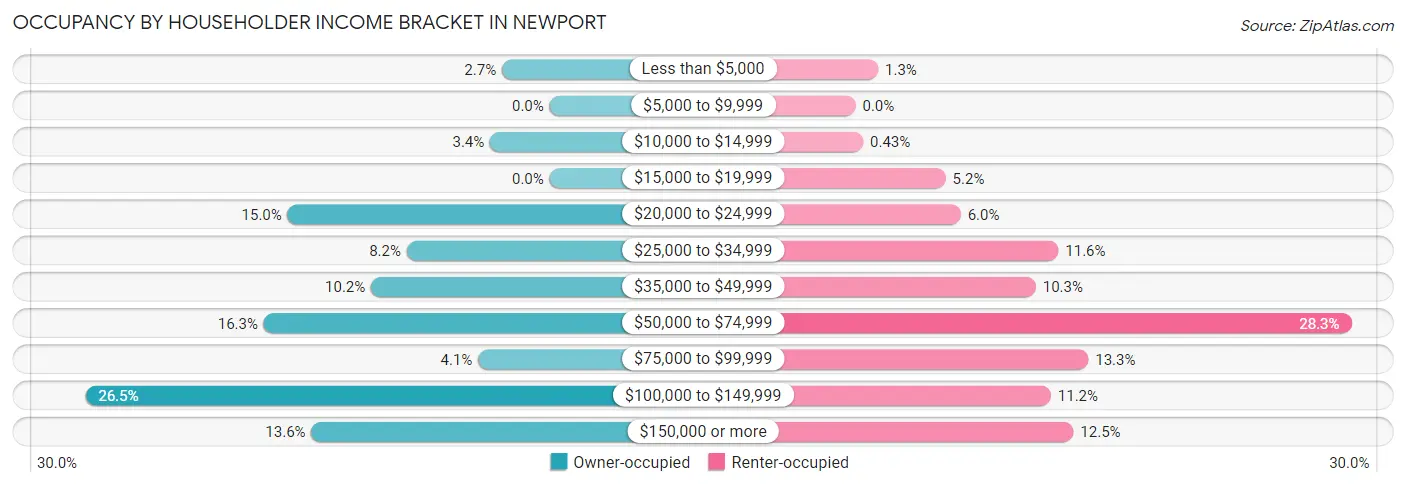
| Income Bracket | Owner-occupied | Renter-occupied |
| Less than $5,000 | 4 (2.7%) | 3 (1.3%) |
| $5,000 to $9,999 | 0 (0.0%) | 0 (0.0%) |
| $10,000 to $14,999 | 5 (3.4%) | 1 (0.4%) |
| $15,000 to $19,999 | 0 (0.0%) | 12 (5.1%) |
| $20,000 to $24,999 | 22 (15.0%) | 14 (6.0%) |
| $25,000 to $34,999 | 12 (8.2%) | 27 (11.6%) |
| $35,000 to $49,999 | 15 (10.2%) | 24 (10.3%) |
| $50,000 to $74,999 | 24 (16.3%) | 66 (28.3%) |
| $75,000 to $99,999 | 6 (4.1%) | 31 (13.3%) |
| $100,000 to $149,999 | 39 (26.5%) | 26 (11.2%) |
| $150,000 or more | 20 (13.6%) | 29 (12.4%) |
| Total | 147 (100.0%) | 233 (100.0%) |
Monthly Housing Cost Tiers in Newport
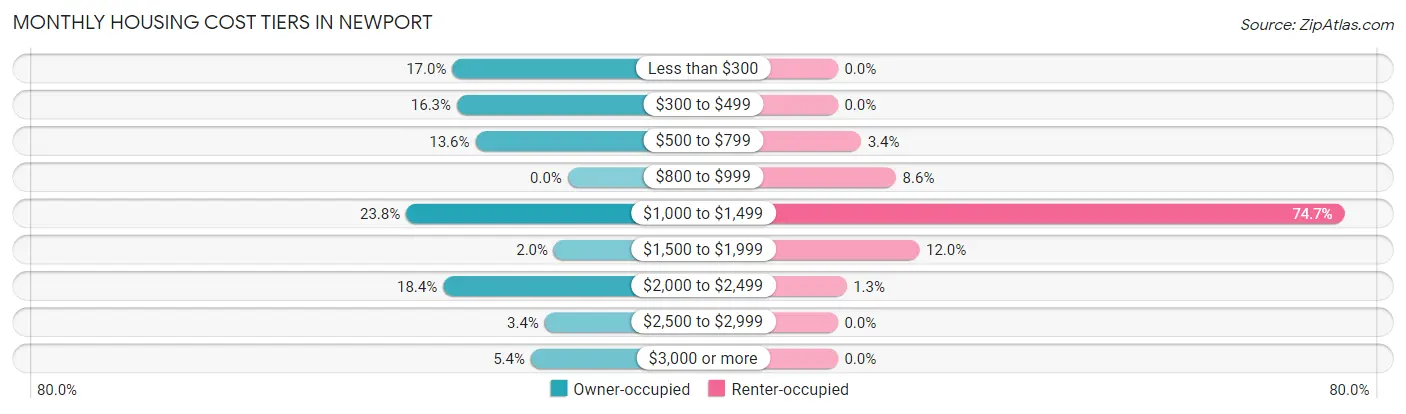
| Monthly Cost | Owner-occupied | Renter-occupied |
| Less than $300 | 25 (17.0%) | 0 (0.0%) |
| $300 to $499 | 24 (16.3%) | 0 (0.0%) |
| $500 to $799 | 20 (13.6%) | 8 (3.4%) |
| $800 to $999 | 0 (0.0%) | 20 (8.6%) |
| $1,000 to $1,499 | 35 (23.8%) | 174 (74.7%) |
| $1,500 to $1,999 | 3 (2.0%) | 28 (12.0%) |
| $2,000 to $2,499 | 27 (18.4%) | 3 (1.3%) |
| $2,500 to $2,999 | 5 (3.4%) | 0 (0.0%) |
| $3,000 or more | 8 (5.4%) | 0 (0.0%) |
| Total | 147 (100.0%) | 233 (100.0%) |
Physical Housing Characteristics in Newport
Housing Structures in Newport
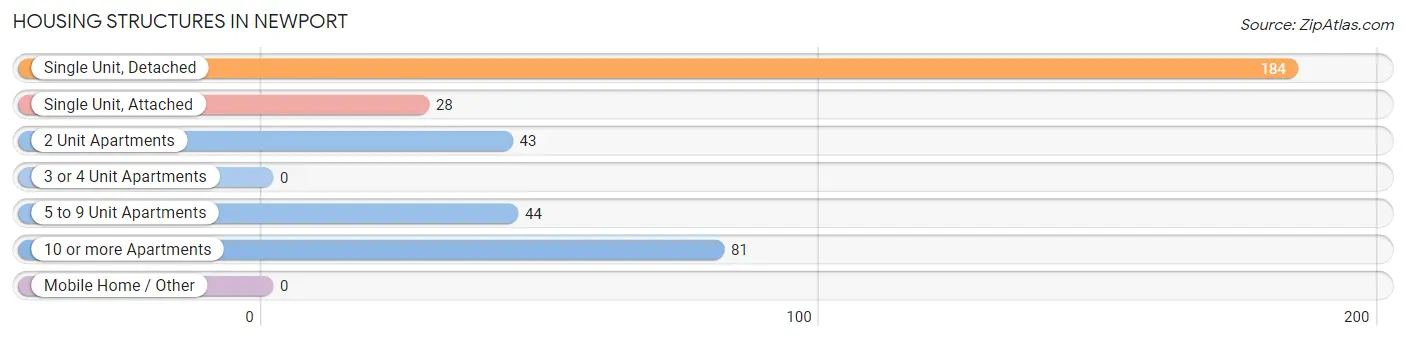
| Structure Type | # Housing Units | % Housing Units |
| Single Unit, Detached | 184 | 48.4% |
| Single Unit, Attached | 28 | 7.4% |
| 2 Unit Apartments | 43 | 11.3% |
| 3 or 4 Unit Apartments | 0 | 0.0% |
| 5 to 9 Unit Apartments | 44 | 11.6% |
| 10 or more Apartments | 81 | 21.3% |
| Mobile Home / Other | 0 | 0.0% |
| Total | 380 | 100.0% |
Housing Structures by Occupancy in Newport
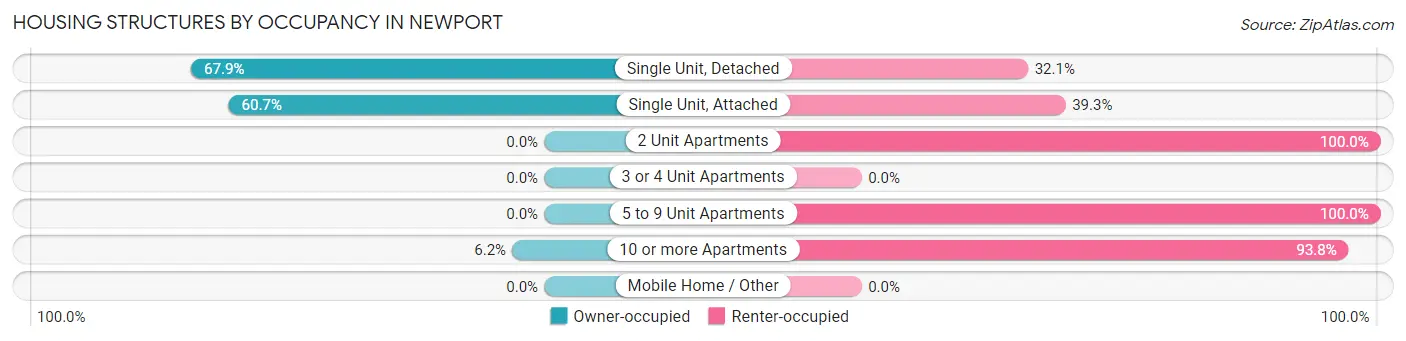
| Structure Type | Owner-occupied | Renter-occupied |
| Single Unit, Detached | 125 (67.9%) | 59 (32.1%) |
| Single Unit, Attached | 17 (60.7%) | 11 (39.3%) |
| 2 Unit Apartments | 0 (0.0%) | 43 (100.0%) |
| 3 or 4 Unit Apartments | 0 (0.0%) | 0 (0.0%) |
| 5 to 9 Unit Apartments | 0 (0.0%) | 44 (100.0%) |
| 10 or more Apartments | 5 (6.2%) | 76 (93.8%) |
| Mobile Home / Other | 0 (0.0%) | 0 (0.0%) |
| Total | 147 (38.7%) | 233 (61.3%) |
Housing Structures by Number of Rooms in Newport
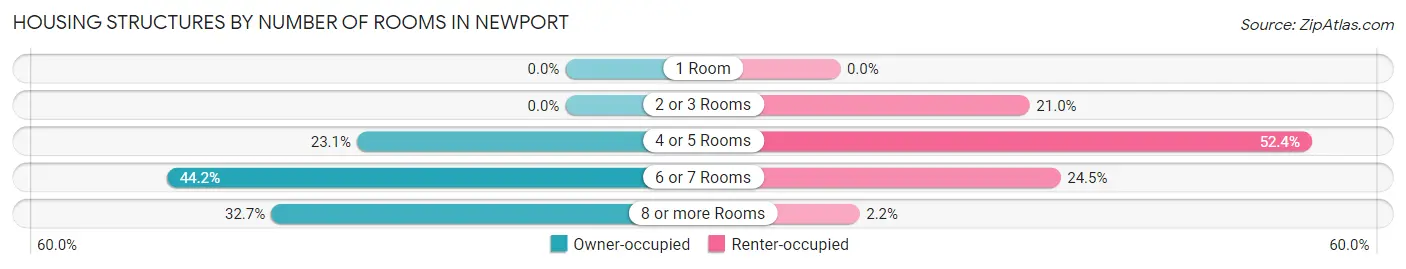
| Number of Rooms | Owner-occupied | Renter-occupied |
| 1 Room | 0 (0.0%) | 0 (0.0%) |
| 2 or 3 Rooms | 0 (0.0%) | 49 (21.0%) |
| 4 or 5 Rooms | 34 (23.1%) | 122 (52.4%) |
| 6 or 7 Rooms | 65 (44.2%) | 57 (24.5%) |
| 8 or more Rooms | 48 (32.7%) | 5 (2.1%) |
| Total | 147 (100.0%) | 233 (100.0%) |
Housing Structure by Heating Type in Newport
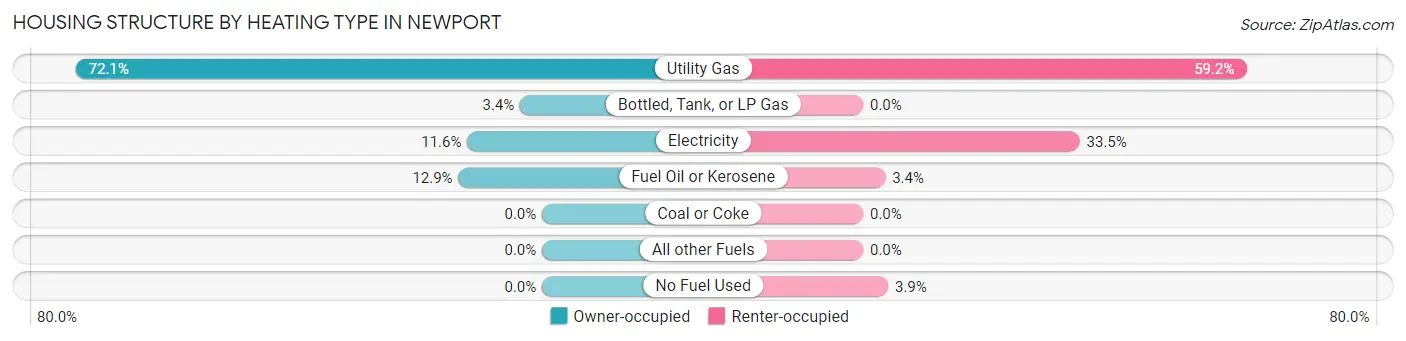
| Heating Type | Owner-occupied | Renter-occupied |
| Utility Gas | 106 (72.1%) | 138 (59.2%) |
| Bottled, Tank, or LP Gas | 5 (3.4%) | 0 (0.0%) |
| Electricity | 17 (11.6%) | 78 (33.5%) |
| Fuel Oil or Kerosene | 19 (12.9%) | 8 (3.4%) |
| Coal or Coke | 0 (0.0%) | 0 (0.0%) |
| All other Fuels | 0 (0.0%) | 0 (0.0%) |
| No Fuel Used | 0 (0.0%) | 9 (3.9%) |
| Total | 147 (100.0%) | 233 (100.0%) |
Household Vehicle Usage in Newport
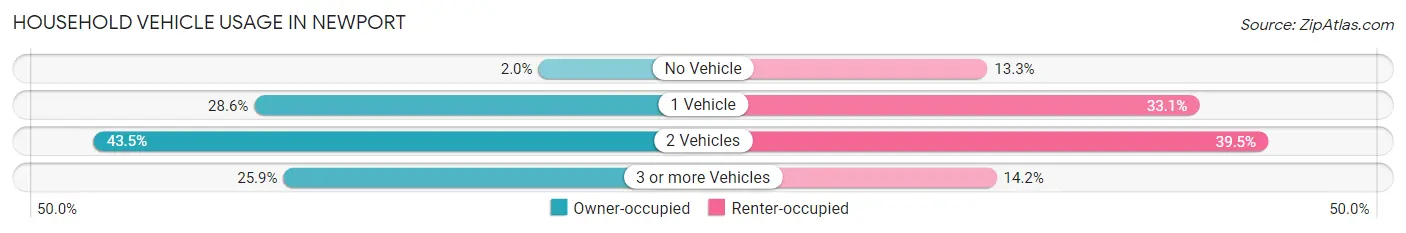
| Vehicles per Household | Owner-occupied | Renter-occupied |
| No Vehicle | 3 (2.0%) | 31 (13.3%) |
| 1 Vehicle | 42 (28.6%) | 77 (33.1%) |
| 2 Vehicles | 64 (43.5%) | 92 (39.5%) |
| 3 or more Vehicles | 38 (25.9%) | 33 (14.2%) |
| Total | 147 (100.0%) | 233 (100.0%) |
Real Estate & Mortgages in Newport
Real Estate and Mortgage Overview in Newport
| Characteristic | Without Mortgage | With Mortgage |
| Housing Units | 57 | 90 |
| Median Property Value | $231,700 | $270,800 |
| Median Household Income | $31,250 | $18 |
| Monthly Housing Costs | $315 | $8 |
| Real Estate Taxes | $772 | $0 |
Property Value by Mortgage Status in Newport
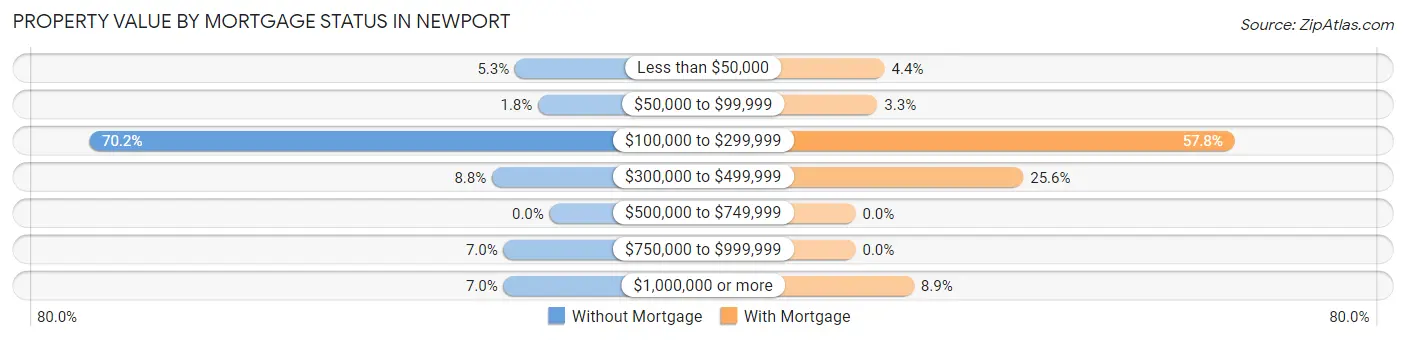
| Property Value | Without Mortgage | With Mortgage |
| Less than $50,000 | 3 (5.3%) | 4 (4.4%) |
| $50,000 to $99,999 | 1 (1.8%) | 3 (3.3%) |
| $100,000 to $299,999 | 40 (70.2%) | 52 (57.8%) |
| $300,000 to $499,999 | 5 (8.8%) | 23 (25.6%) |
| $500,000 to $749,999 | 0 (0.0%) | 0 (0.0%) |
| $750,000 to $999,999 | 4 (7.0%) | 0 (0.0%) |
| $1,000,000 or more | 4 (7.0%) | 8 (8.9%) |
| Total | 57 (100.0%) | 90 (100.0%) |
Household Income by Mortgage Status in Newport
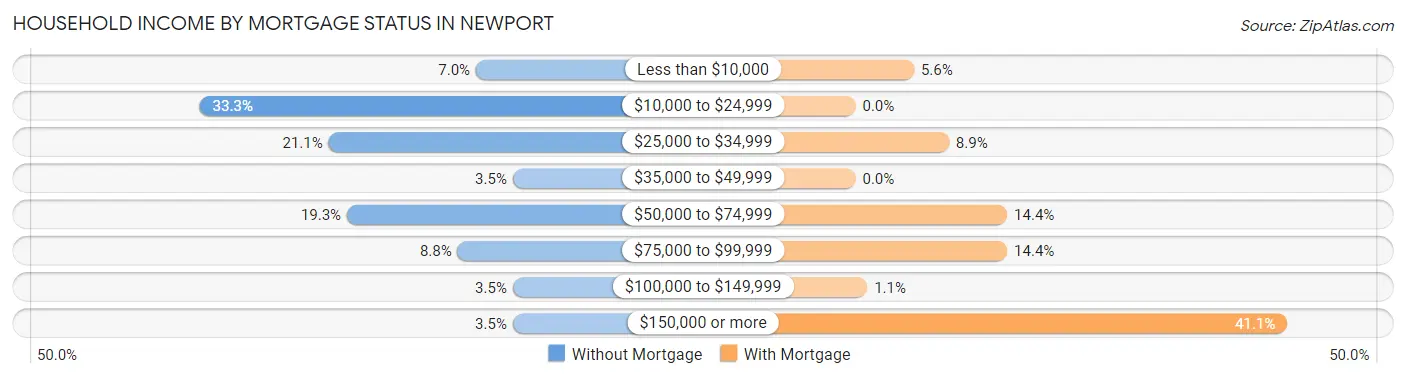
| Household Income | Without Mortgage | With Mortgage |
| Less than $10,000 | 4 (7.0%) | 5 (5.6%) |
| $10,000 to $24,999 | 19 (33.3%) | 0 (0.0%) |
| $25,000 to $34,999 | 12 (21.0%) | 8 (8.9%) |
| $35,000 to $49,999 | 2 (3.5%) | 0 (0.0%) |
| $50,000 to $74,999 | 11 (19.3%) | 13 (14.4%) |
| $75,000 to $99,999 | 5 (8.8%) | 13 (14.4%) |
| $100,000 to $149,999 | 2 (3.5%) | 1 (1.1%) |
| $150,000 or more | 2 (3.5%) | 37 (41.1%) |
| Total | 57 (100.0%) | 90 (100.0%) |
Property Value to Household Income Ratio in Newport
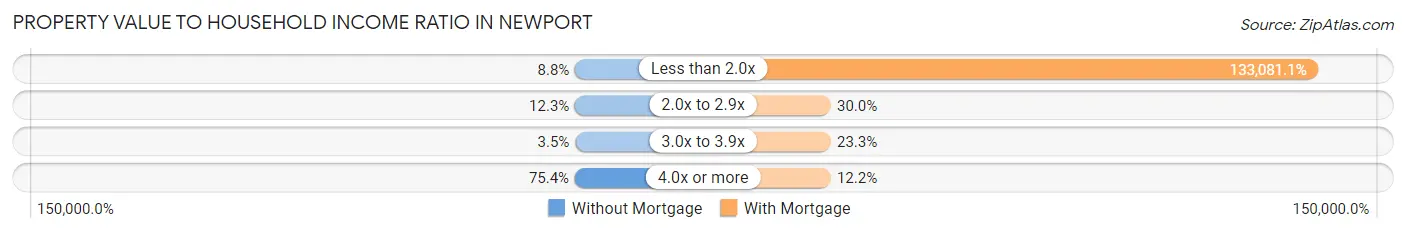
| Value-to-Income Ratio | Without Mortgage | With Mortgage |
| Less than 2.0x | 5 (8.8%) | 119,773 (133,081.1%) |
| 2.0x to 2.9x | 7 (12.3%) | 27 (30.0%) |
| 3.0x to 3.9x | 2 (3.5%) | 21 (23.3%) |
| 4.0x or more | 43 (75.4%) | 11 (12.2%) |
| Total | 57 (100.0%) | 90 (100.0%) |
Real Estate Taxes by Mortgage Status in Newport
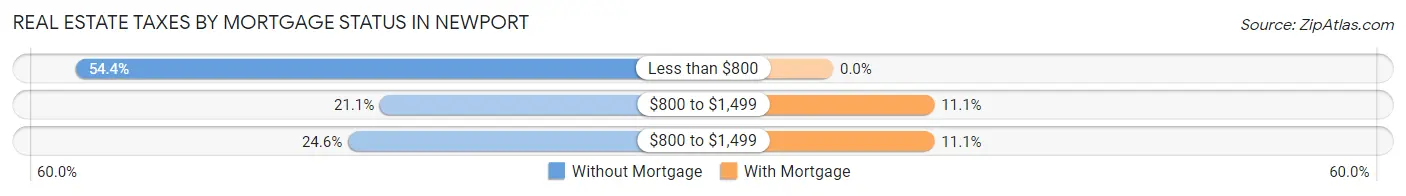
| Property Taxes | Without Mortgage | With Mortgage |
| Less than $800 | 31 (54.4%) | 0 (0.0%) |
| $800 to $1,499 | 12 (21.0%) | 10 (11.1%) |
| $800 to $1,499 | 14 (24.6%) | 10 (11.1%) |
| Total | 57 (100.0%) | 90 (100.0%) |
Health & Disability in Newport
Health Insurance Coverage by Age in Newport
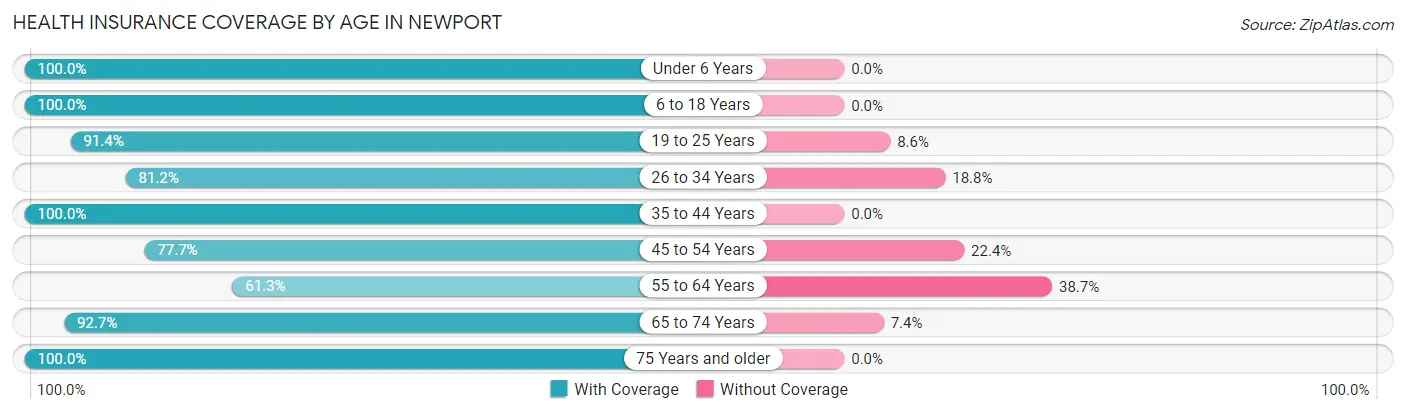
| Age Bracket | With Coverage | Without Coverage |
| Under 6 Years | 75 (100.0%) | 0 (0.0%) |
| 6 to 18 Years | 224 (100.0%) | 0 (0.0%) |
| 19 to 25 Years | 171 (91.4%) | 16 (8.6%) |
| 26 to 34 Years | 194 (81.2%) | 45 (18.8%) |
| 35 to 44 Years | 126 (100.0%) | 0 (0.0%) |
| 45 to 54 Years | 66 (77.6%) | 19 (22.4%) |
| 55 to 64 Years | 68 (61.3%) | 43 (38.7%) |
| 65 to 74 Years | 63 (92.6%) | 5 (7.3%) |
| 75 Years and older | 30 (100.0%) | 0 (0.0%) |
| Total | 1,017 (88.8%) | 128 (11.2%) |
Health Insurance Coverage by Citizenship Status in Newport
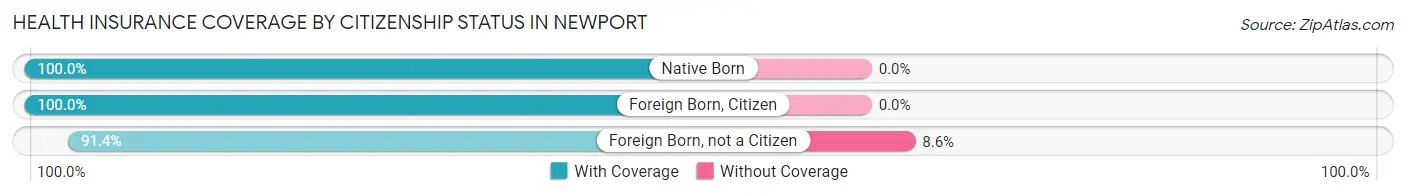
| Citizenship Status | With Coverage | Without Coverage |
| Native Born | 75 (100.0%) | 0 (0.0%) |
| Foreign Born, Citizen | 224 (100.0%) | 0 (0.0%) |
| Foreign Born, not a Citizen | 171 (91.4%) | 16 (8.6%) |
Health Insurance Coverage by Household Income in Newport
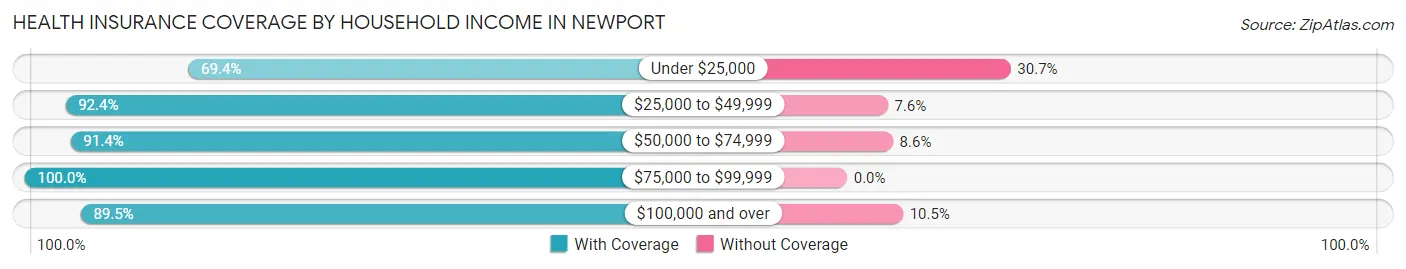
| Household Income | With Coverage | Without Coverage |
| Under $25,000 | 86 (69.4%) | 38 (30.6%) |
| $25,000 to $49,999 | 97 (92.4%) | 8 (7.6%) |
| $50,000 to $74,999 | 330 (91.4%) | 31 (8.6%) |
| $75,000 to $99,999 | 67 (100.0%) | 0 (0.0%) |
| $100,000 and over | 436 (89.5%) | 51 (10.5%) |
Public vs Private Health Insurance Coverage by Age in Newport
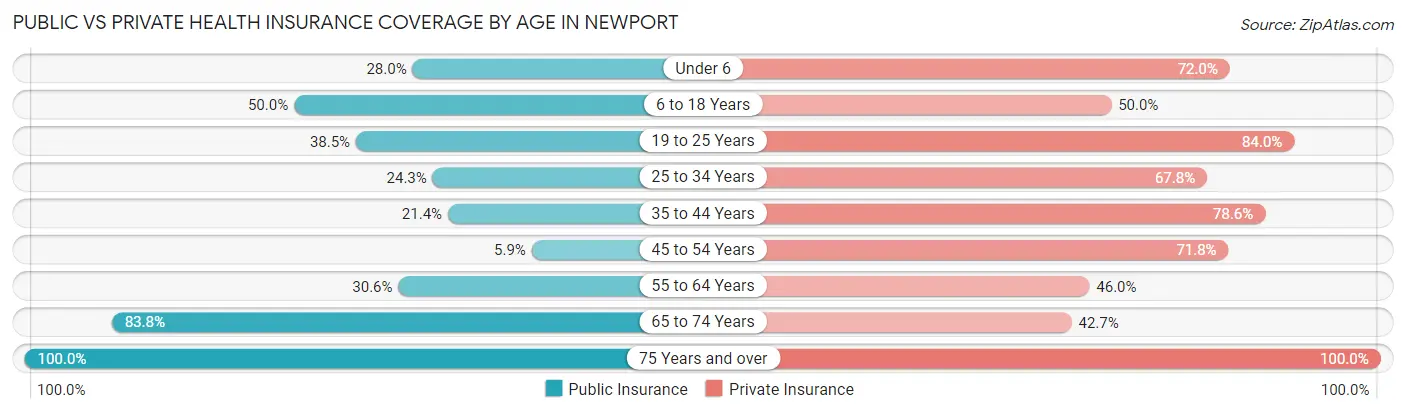
| Age Bracket | Public Insurance | Private Insurance |
| Under 6 | 21 (28.0%) | 54 (72.0%) |
| 6 to 18 Years | 112 (50.0%) | 112 (50.0%) |
| 19 to 25 Years | 72 (38.5%) | 157 (84.0%) |
| 25 to 34 Years | 58 (24.3%) | 162 (67.8%) |
| 35 to 44 Years | 27 (21.4%) | 99 (78.6%) |
| 45 to 54 Years | 5 (5.9%) | 61 (71.8%) |
| 55 to 64 Years | 34 (30.6%) | 51 (46.0%) |
| 65 to 74 Years | 57 (83.8%) | 29 (42.6%) |
| 75 Years and over | 30 (100.0%) | 30 (100.0%) |
| Total | 416 (36.3%) | 755 (65.9%) |
Disability Status by Sex by Age in Newport
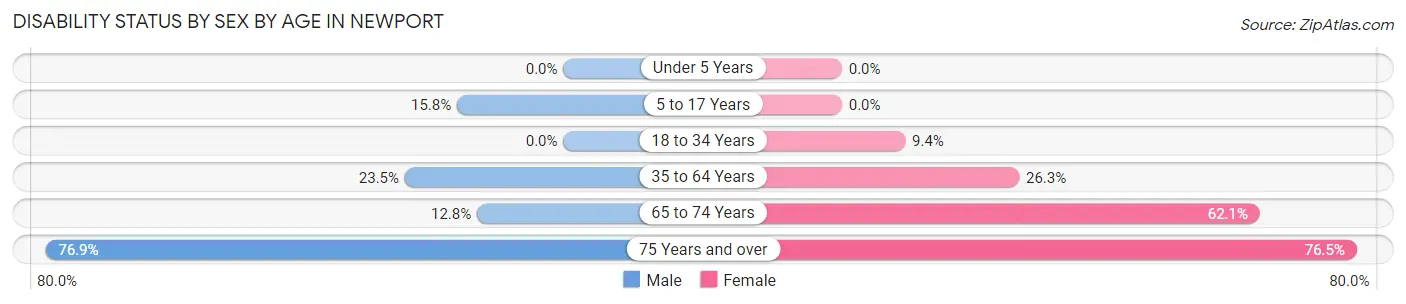
| Age Bracket | Male | Female |
| Under 5 Years | 0 (0.0%) | 0 (0.0%) |
| 5 to 17 Years | 15 (15.8%) | 0 (0.0%) |
| 18 to 34 Years | 0 (0.0%) | 14 (9.4%) |
| 35 to 64 Years | 40 (23.5%) | 40 (26.3%) |
| 65 to 74 Years | 5 (12.8%) | 18 (62.1%) |
| 75 Years and over | 10 (76.9%) | 13 (76.5%) |
Disability Class by Sex by Age in Newport
Disability Class: Hearing Difficulty
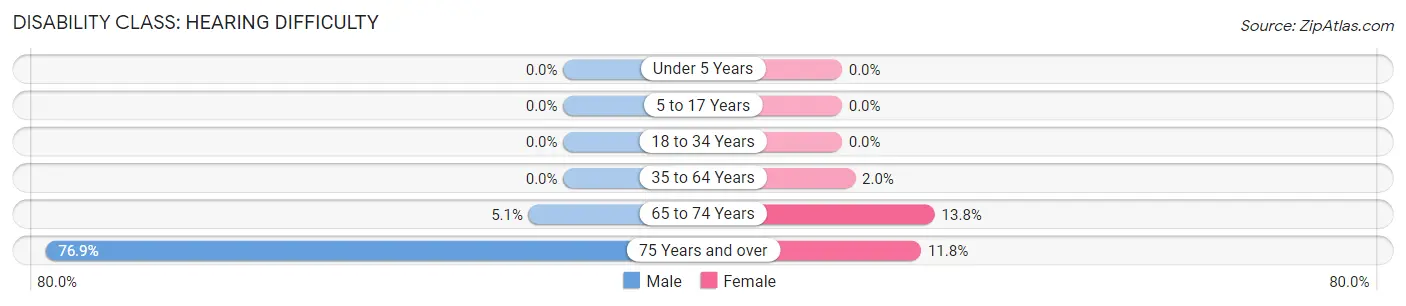
| Age Bracket | Male | Female |
| Under 5 Years | 0 (0.0%) | 0 (0.0%) |
| 5 to 17 Years | 0 (0.0%) | 0 (0.0%) |
| 18 to 34 Years | 0 (0.0%) | 0 (0.0%) |
| 35 to 64 Years | 0 (0.0%) | 3 (2.0%) |
| 65 to 74 Years | 2 (5.1%) | 4 (13.8%) |
| 75 Years and over | 10 (76.9%) | 2 (11.8%) |
Disability Class: Vision Difficulty
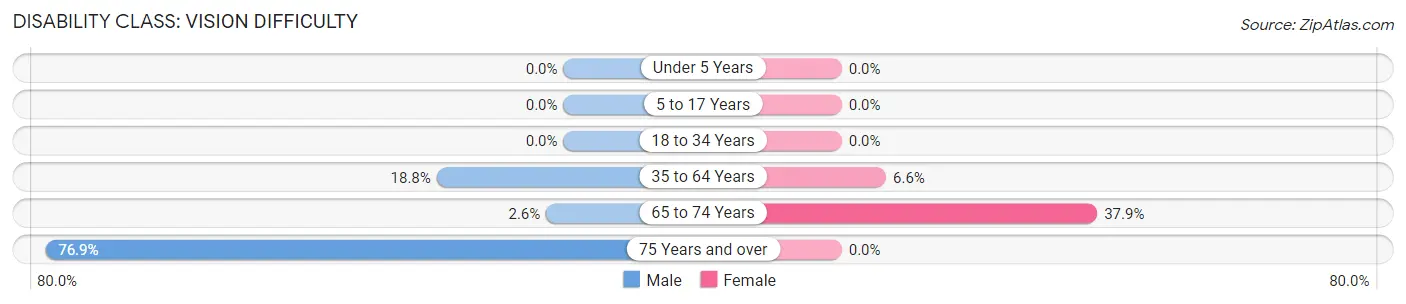
| Age Bracket | Male | Female |
| Under 5 Years | 0 (0.0%) | 0 (0.0%) |
| 5 to 17 Years | 0 (0.0%) | 0 (0.0%) |
| 18 to 34 Years | 0 (0.0%) | 0 (0.0%) |
| 35 to 64 Years | 32 (18.8%) | 10 (6.6%) |
| 65 to 74 Years | 1 (2.6%) | 11 (37.9%) |
| 75 Years and over | 10 (76.9%) | 0 (0.0%) |
Disability Class: Cognitive Difficulty
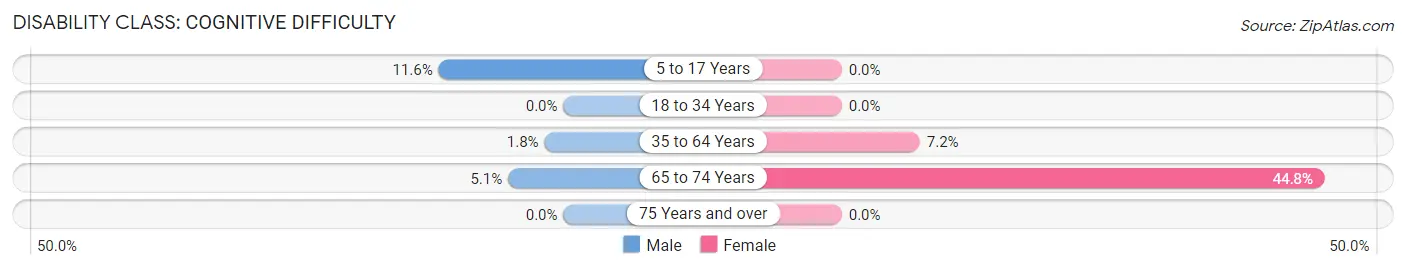
| Age Bracket | Male | Female |
| 5 to 17 Years | 11 (11.6%) | 0 (0.0%) |
| 18 to 34 Years | 0 (0.0%) | 0 (0.0%) |
| 35 to 64 Years | 3 (1.8%) | 11 (7.2%) |
| 65 to 74 Years | 2 (5.1%) | 13 (44.8%) |
| 75 Years and over | 0 (0.0%) | 0 (0.0%) |
Disability Class: Ambulatory Difficulty
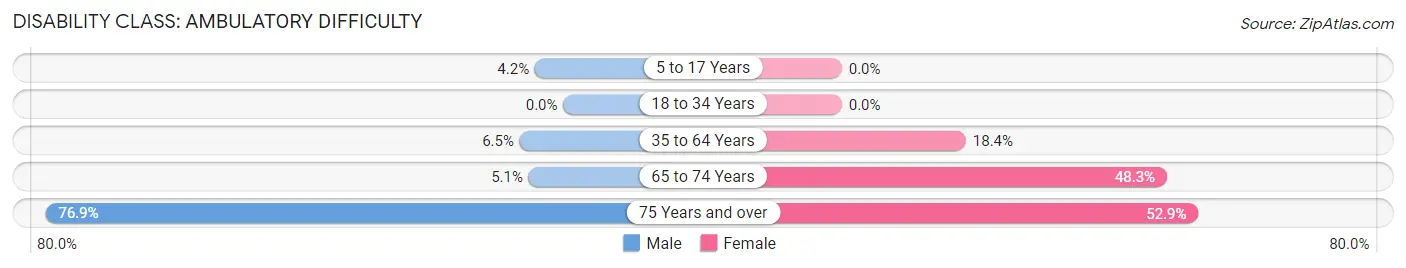
| Age Bracket | Male | Female |
| 5 to 17 Years | 4 (4.2%) | 0 (0.0%) |
| 18 to 34 Years | 0 (0.0%) | 0 (0.0%) |
| 35 to 64 Years | 11 (6.5%) | 28 (18.4%) |
| 65 to 74 Years | 2 (5.1%) | 14 (48.3%) |
| 75 Years and over | 10 (76.9%) | 9 (52.9%) |
Disability Class: Self-Care Difficulty
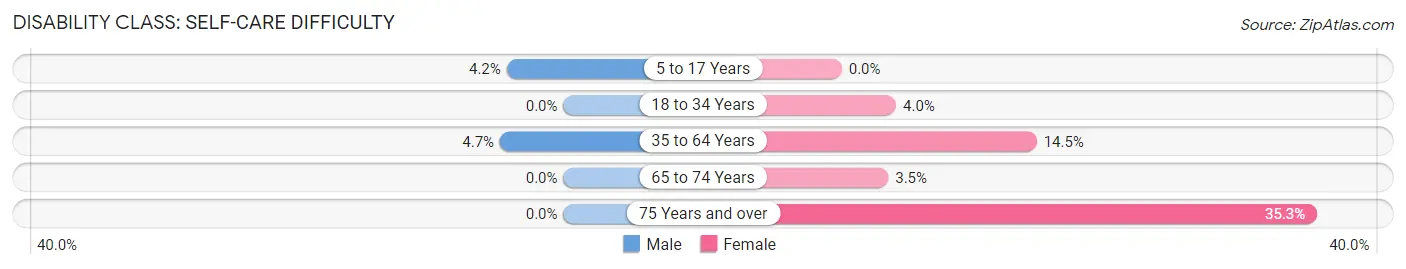
| Age Bracket | Male | Female |
| 5 to 17 Years | 4 (4.2%) | 0 (0.0%) |
| 18 to 34 Years | 0 (0.0%) | 6 (4.0%) |
| 35 to 64 Years | 8 (4.7%) | 22 (14.5%) |
| 65 to 74 Years | 0 (0.0%) | 1 (3.5%) |
| 75 Years and over | 0 (0.0%) | 6 (35.3%) |
Technology Access in Newport
Computing Device Access in Newport
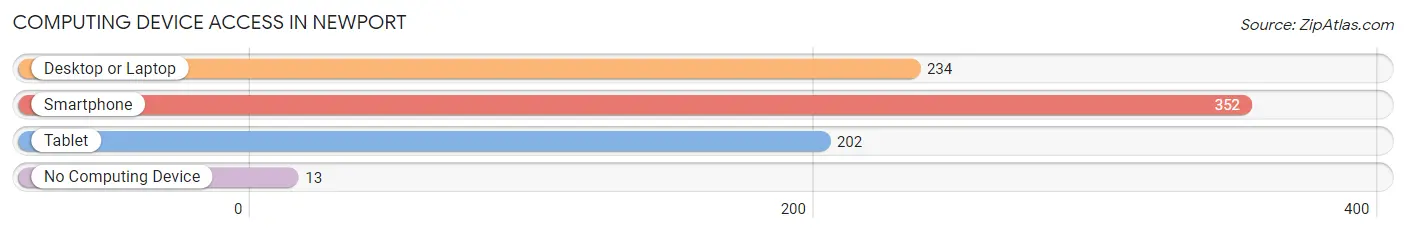
| Device Type | # Households | % Households |
| Desktop or Laptop | 234 | 61.6% |
| Smartphone | 352 | 92.6% |
| Tablet | 202 | 53.2% |
| No Computing Device | 13 | 3.4% |
| Total | 380 | 100.0% |
Internet Access in Newport
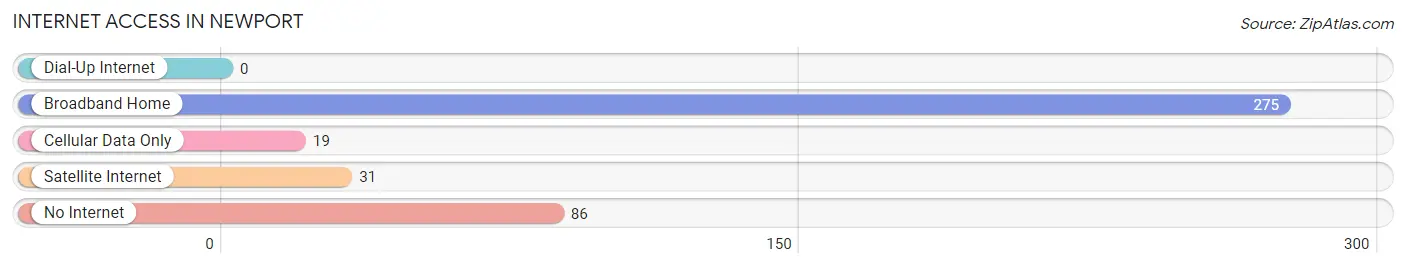
| Internet Type | # Households | % Households |
| Dial-Up Internet | 0 | 0.0% |
| Broadband Home | 275 | 72.4% |
| Cellular Data Only | 19 | 5.0% |
| Satellite Internet | 31 | 8.2% |
| No Internet | 86 | 22.6% |
| Total | 380 | 100.0% |
Newport Summary
Newport is a small town located in New Castle County, Delaware. It is situated on the Christina River, just south of Wilmington. The town has a population of approximately 2,000 people and is part of the Greater Wilmington metropolitan area.
History
Newport was first settled in 1680 by Swedish immigrants. The town was originally known as “New Sweden” and was part of the Dutch colony of New Netherland. In 1682, the Dutch took control of the area and renamed it “Newport” after the city of Newport, Rhode Island. The town was incorporated in 1739 and was an important port for the shipping of goods and passengers. During the American Revolution, Newport was a major supplier of food and supplies to the Continental Army.
In the 19th century, Newport became an important industrial center. The town was home to several mills, including a paper mill, a cotton mill, and a woolen mill. The town also had a large shipbuilding industry. In the late 19th century, the town was a popular summer resort for wealthy Philadelphians.
Geography
Newport is located in New Castle County, Delaware. It is situated on the Christina River, just south of Wilmington. The town is bordered by the towns of Wilmington, Claymont, and Edgemoor. The town covers an area of 1.3 square miles and has a population of approximately 2,000 people.
The town is located in a humid subtropical climate zone and experiences hot, humid summers and mild winters. The average annual temperature is around 60 degrees Fahrenheit. The town receives an average of 44 inches of precipitation per year.
Economy
Newport’s economy is largely based on manufacturing and services. The town is home to several manufacturing companies, including a paper mill, a cotton mill, and a woolen mill. The town also has a large shipbuilding industry.
The town is also home to several service-based businesses, including restaurants, retail stores, and professional services. The town is also home to several educational institutions, including the University of Delaware and Delaware State University.
Demographics
As of the 2010 census, the population of Newport was 2,000. The racial makeup of the town was 79.2% White, 14.2% African American, 0.7% Native American, 0.7% Asian, 0.1% Pacific Islander, and 4.8% from other races. The median household income was $45,000 and the median family income was $50,000.
The town is home to a diverse population. The town is home to a large number of immigrants from Latin America, Asia, and Europe. The town also has a large number of African American residents. The town is also home to a large number of retirees.
Common Questions
What is the Total Population of Newport?
Total Population of Newport is 1,145.
What is the Total Male Population of Newport?
Total Male Population of Newport is 611.
What is the Total Female Population of Newport?
Total Female Population of Newport is 534.
What is the Ratio of Males per 100 Females in Newport?
There are 114.42 Males per 100 Females in Newport.
What is the Ratio of Females per 100 Males in Newport?
There are 87.40 Females per 100 Males in Newport.
What is the Median Population Age in Newport?
Median Population Age in Newport is 28.3 Years.
What is the Average Family Size in Newport
Average Family Size in Newport is 3.7 People.
What is the Average Household Size in Newport
Average Household Size in Newport is 3.0 People.
What is Per Capita Income in Newport?
Per Capita income in Newport is $27,838.
What is the Median Family Income in Newport?
Median Family Income in Newport is $71,719.
What is the Median Household income in Newport?
Median Household Income in Newport is $62,875.
What is Income or Wage Gap in Newport?
Income or Wage Gap in Newport is 2.5%.
Women in Newport earn 97.5 cents for every dollar earned by a man.
What is Inequality or Gini Index in Newport?
Inequality or Gini Index in Newport is 0.40.
How Large is the Labor Force in Newport?
There are 571 People in the Labor Forcein in Newport.
What is the Percentage of People in the Labor Force in Newport?
63.9% of People are in the Labor Force in Newport.
What is the Unemployment Rate in Newport?
Unemployment Rate in Newport is 5.3%.