Bowers, DE
Bowers Map
Bowers Overview
336
TOTAL POPULATION
136
MALE POPULATION
200
FEMALE POPULATION
68.00
MALES / 100 FEMALES
147.06
FEMALES / 100 MALES
61.8
MEDIAN AGE
2.8
AVG FAMILY SIZE
2.5
AVG HOUSEHOLD SIZE
$40,410
PER CAPITA INCOME
$80,714
AVG FAMILY INCOME
$69,500
AVG HOUSEHOLD INCOME
38.6%
WAGE / INCOME GAP [ % ]
61.4¢/ $1
WAGE / INCOME GAP [ $ ]
0.40
INEQUALITY / GINI INDEX
112
LABOR FORCE [ PEOPLE ]
35.3%
PERCENT IN LABOR FORCE
8.9%
UNEMPLOYMENT RATE
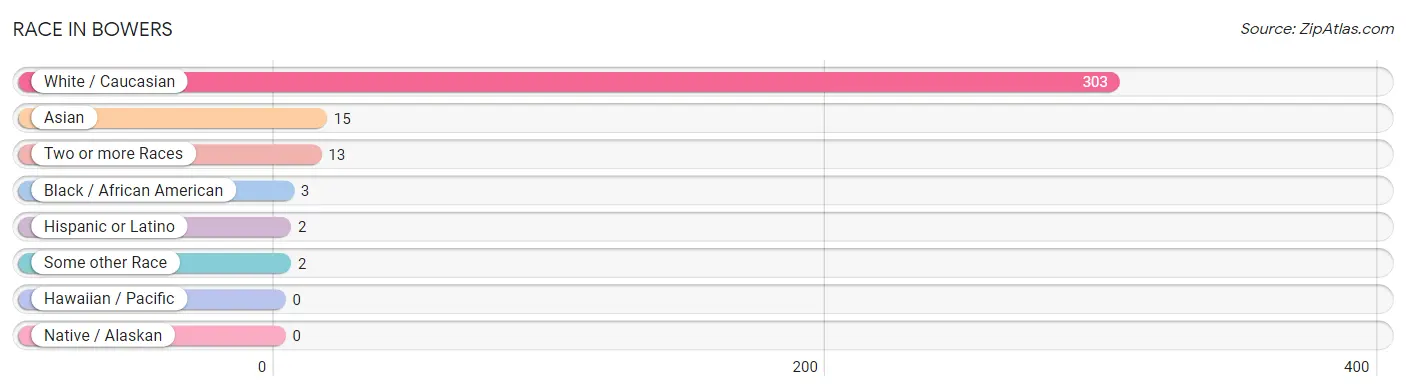
Race in Bowers
The most populous races in Bowers are White / Caucasian (303 | 90.2%), Asian (15 | 4.5%), and Two or more Races (13 | 3.9%).
| Race | # Population | % Population |
| Asian | 15 | 4.5% |
| Black / African American | 3 | 0.9% |
| Hawaiian / Pacific | 0 | 0.0% |
| Hispanic or Latino | 2 | 0.6% |
| Native / Alaskan | 0 | 0.0% |
| White / Caucasian | 303 | 90.2% |
| Two or more Races | 13 | 3.9% |
| Some other Race | 2 | 0.6% |
| Total | 336 | 100.0% |
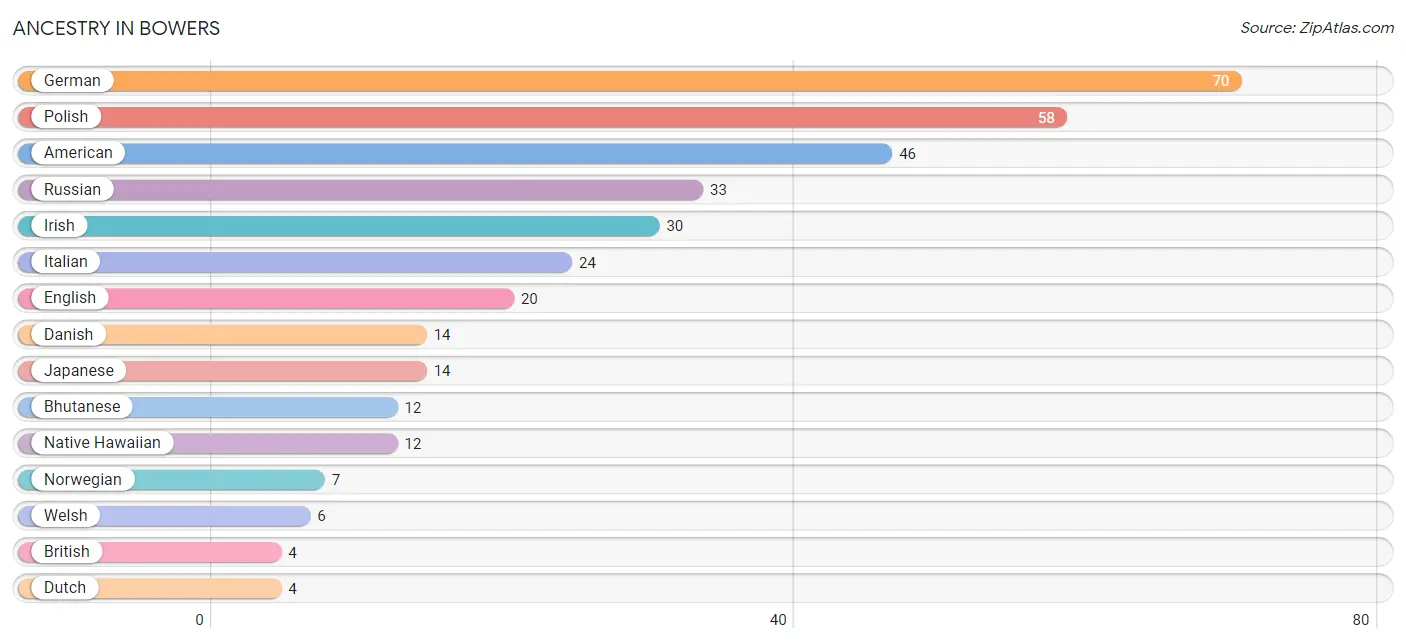
Ancestry in Bowers
The most populous ancestries reported in Bowers are German (70 | 20.8%), Polish (58 | 17.3%), American (46 | 13.7%), Russian (33 | 9.8%), and Irish (30 | 8.9%), together accounting for 70.5% of all Bowers residents.
| Ancestry | # Population | % Population |
| American | 46 | 13.7% |
| Bhutanese | 12 | 3.6% |
| British | 4 | 1.2% |
| Burmese | 1 | 0.3% |
| Cherokee | 1 | 0.3% |
| Cuban | 2 | 0.6% |
| Czech | 2 | 0.6% |
| Danish | 14 | 4.2% |
| Delaware | 1 | 0.3% |
| Dutch | 4 | 1.2% |
| English | 20 | 5.9% |
| French | 2 | 0.6% |
| French Canadian | 3 | 0.9% |
| German | 70 | 20.8% |
| Greek | 4 | 1.2% |
| Irish | 30 | 8.9% |
| Italian | 24 | 7.1% |
| Japanese | 14 | 4.2% |
| Native Hawaiian | 12 | 3.6% |
| Norwegian | 7 | 2.1% |
| Pennsylvania German | 1 | 0.3% |
| Polish | 58 | 17.3% |
| Russian | 33 | 9.8% |
| Scandinavian | 1 | 0.3% |
| Scotch-Irish | 2 | 0.6% |
| Scottish | 4 | 1.2% |
| Swedish | 1 | 0.3% |
| Ukrainian | 2 | 0.6% |
| Welsh | 6 | 1.8% | View All 29 Rows |
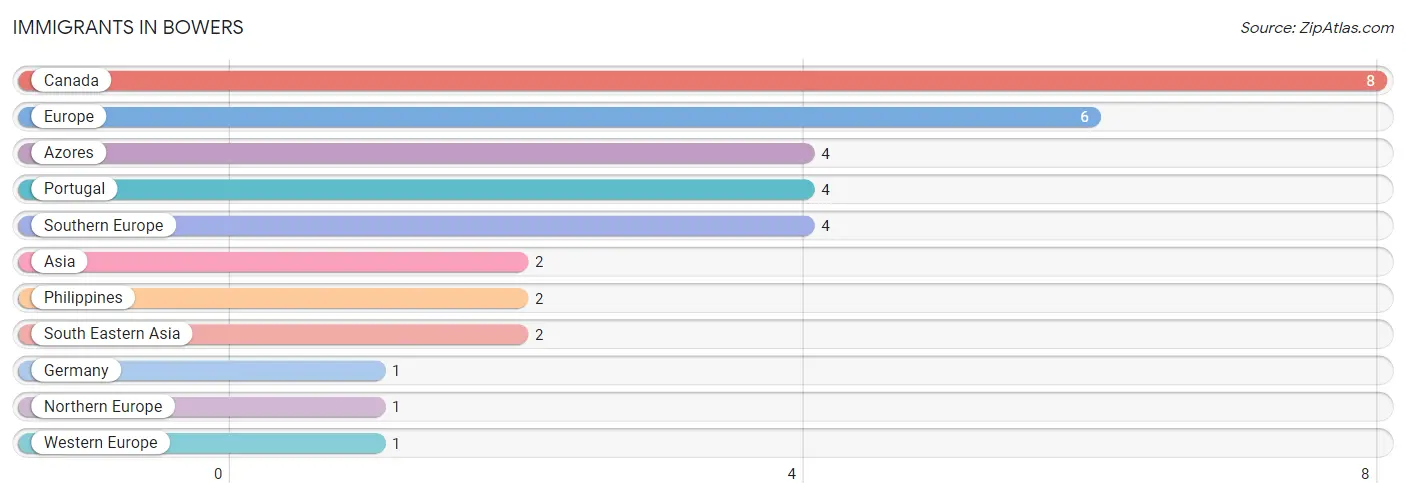
Immigrants in Bowers
The most numerous immigrant groups reported in Bowers came from Canada (8 | 2.4%), Europe (6 | 1.8%), Azores (4 | 1.2%), Portugal (4 | 1.2%), and Southern Europe (4 | 1.2%), together accounting for 7.7% of all Bowers residents.
| Immigration Origin | # Population | % Population |
| Asia | 2 | 0.6% |
| Azores | 4 | 1.2% |
| Canada | 8 | 2.4% |
| Europe | 6 | 1.8% |
| Germany | 1 | 0.3% |
| Northern Europe | 1 | 0.3% |
| Philippines | 2 | 0.6% |
| Portugal | 4 | 1.2% |
| South Eastern Asia | 2 | 0.6% |
| Southern Europe | 4 | 1.2% |
| Western Europe | 1 | 0.3% | View All 11 Rows |
Sex and Age in Bowers
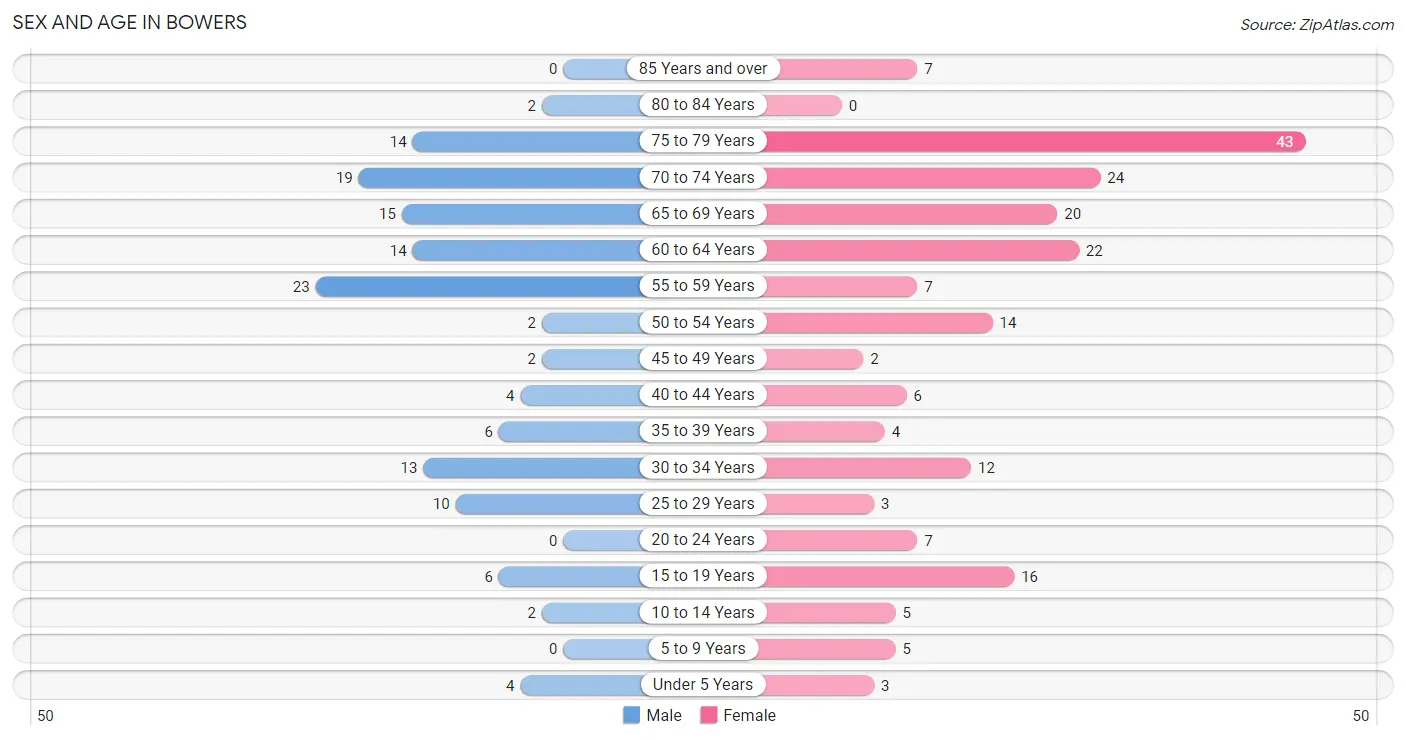
Sex and Age in Bowers
The most populous age groups in Bowers are 55 to 59 Years (23 | 16.9%) for men and 75 to 79 Years (43 | 21.5%) for women.
| Age Bracket | Male | Female |
| Under 5 Years | 4 (2.9%) | 3 (1.5%) |
| 5 to 9 Years | 0 (0.0%) | 5 (2.5%) |
| 10 to 14 Years | 2 (1.5%) | 5 (2.5%) |
| 15 to 19 Years | 6 (4.4%) | 16 (8.0%) |
| 20 to 24 Years | 0 (0.0%) | 7 (3.5%) |
| 25 to 29 Years | 10 (7.3%) | 3 (1.5%) |
| 30 to 34 Years | 13 (9.6%) | 12 (6.0%) |
| 35 to 39 Years | 6 (4.4%) | 4 (2.0%) |
| 40 to 44 Years | 4 (2.9%) | 6 (3.0%) |
| 45 to 49 Years | 2 (1.5%) | 2 (1.0%) |
| 50 to 54 Years | 2 (1.5%) | 14 (7.0%) |
| 55 to 59 Years | 23 (16.9%) | 7 (3.5%) |
| 60 to 64 Years | 14 (10.3%) | 22 (11.0%) |
| 65 to 69 Years | 15 (11.0%) | 20 (10.0%) |
| 70 to 74 Years | 19 (14.0%) | 24 (12.0%) |
| 75 to 79 Years | 14 (10.3%) | 43 (21.5%) |
| 80 to 84 Years | 2 (1.5%) | 0 (0.0%) |
| 85 Years and over | 0 (0.0%) | 7 (3.5%) |
| Total | 136 (100.0%) | 200 (100.0%) |
Families and Households in Bowers
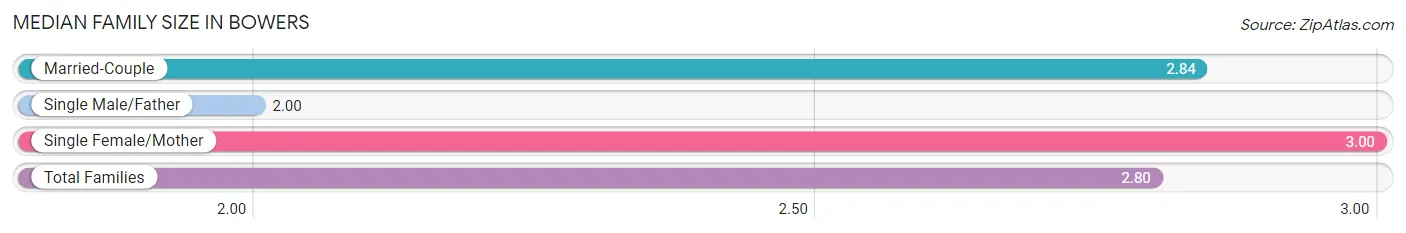
Median Family Size in Bowers
The median family size in Bowers is 2.80 persons per family, with single female/mother families (9 | 8.8%) accounting for the largest median family size of 3 persons per family. On the other hand, single male/father families (6 | 5.9%) represent the smallest median family size with 2.00 persons per family.
| Family Type | # Families | Family Size |
| Married-Couple | 87 (85.3%) | 2.84 |
| Single Male/Father | 6 (5.9%) | 2.00 |
| Single Female/Mother | 9 (8.8%) | 3.00 |
| Total Families | 102 (100.0%) | 2.80 |
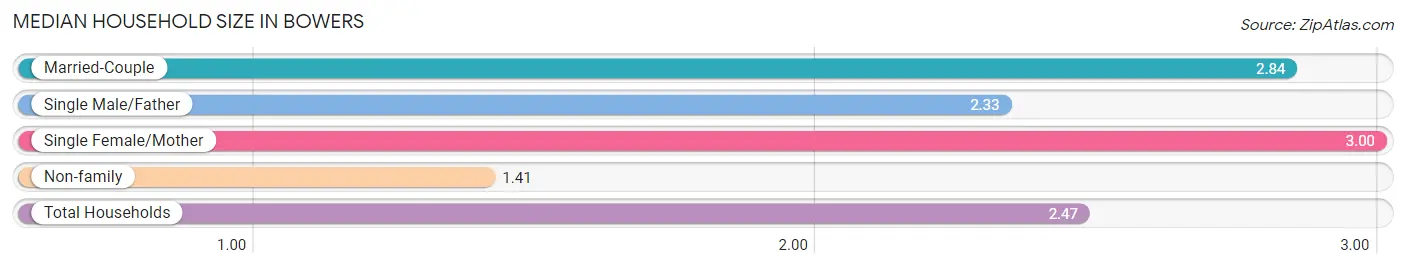
Median Household Size in Bowers
The median household size in Bowers is 2.47 persons per household, with single female/mother households (9 | 6.6%) accounting for the largest median household size of 3 persons per household. non-family households (34 | 25.0%) represent the smallest median household size with 1.41 persons per household.
| Household Type | # Households | Household Size |
| Married-Couple | 87 (64.0%) | 2.84 |
| Single Male/Father | 6 (4.4%) | 2.33 |
| Single Female/Mother | 9 (6.6%) | 3.00 |
| Non-family | 34 (25.0%) | 1.41 |
| Total Households | 136 (100.0%) | 2.47 |
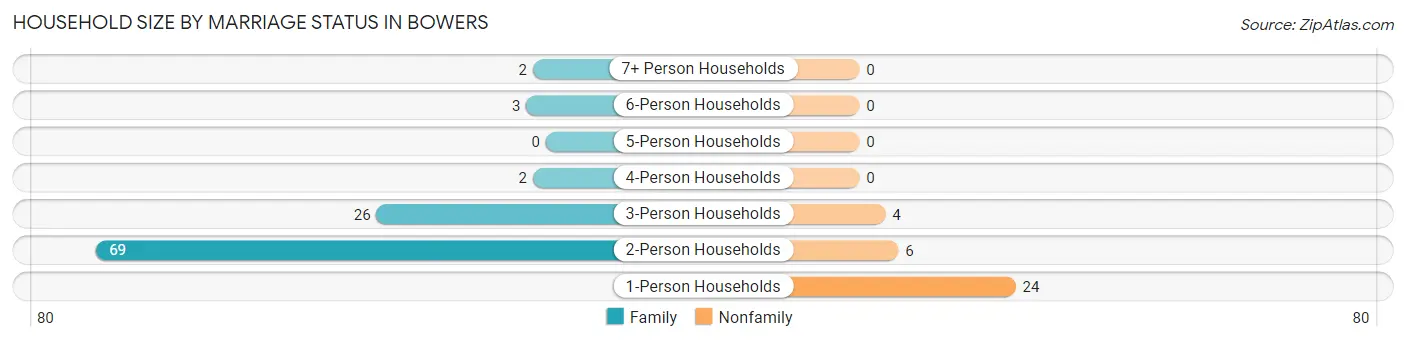
Household Size by Marriage Status in Bowers
Out of a total of 136 households in Bowers, 102 (75.0%) are family households, while 34 (25.0%) are nonfamily households. The most numerous type of family households are 2-person households, comprising 69, and the most common type of nonfamily households are 1-person households, comprising 24.
| Household Size | Family Households | Nonfamily Households |
| 1-Person Households | - | 24 (17.6%) |
| 2-Person Households | 69 (50.7%) | 6 (4.4%) |
| 3-Person Households | 26 (19.1%) | 4 (2.9%) |
| 4-Person Households | 2 (1.5%) | 0 (0.0%) |
| 5-Person Households | 0 (0.0%) | 0 (0.0%) |
| 6-Person Households | 3 (2.2%) | 0 (0.0%) |
| 7+ Person Households | 2 (1.5%) | 0 (0.0%) |
| Total | 102 (75.0%) | 34 (25.0%) |
Female Fertility in Bowers
Fertility by Age in Bowers
Average fertility rate in Bowers is 59.0 births per 1,000 women. Women in the age bracket of 20 to 34 years have the highest fertility rate with 136.0 births per 1,000 women. Women in the age bracket of 20 to 34 years acount for 100.0% of all women with births.
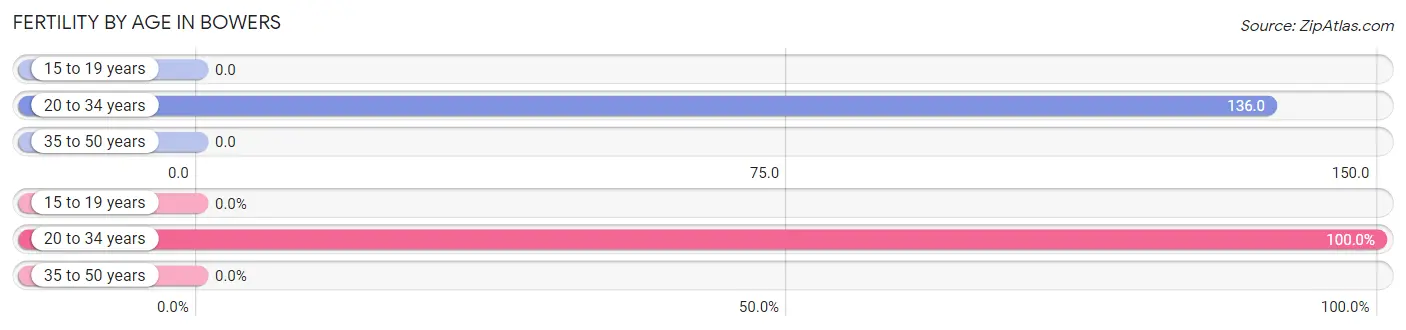
| Age Bracket | Women with Births | Births / 1,000 Women |
| 15 to 19 years | 0 (0.0%) | 0.0 |
| 20 to 34 years | 3 (100.0%) | 136.0 |
| 35 to 50 years | 0 (0.0%) | 0.0 |
| Total | 3 (100.0%) | 59.0 |
Fertility by Age by Marriage Status in Bowers
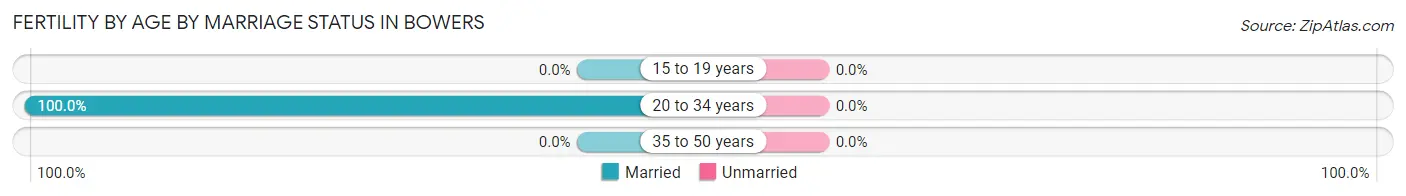
| Age Bracket | Married | Unmarried |
| 15 to 19 years | 0 (0.0%) | 0 (0.0%) |
| 20 to 34 years | 3 (100.0%) | 0 (0.0%) |
| 35 to 50 years | 0 (0.0%) | 0 (0.0%) |
| Total | 3 (100.0%) | 0 (0.0%) |
Fertility by Education in Bowers
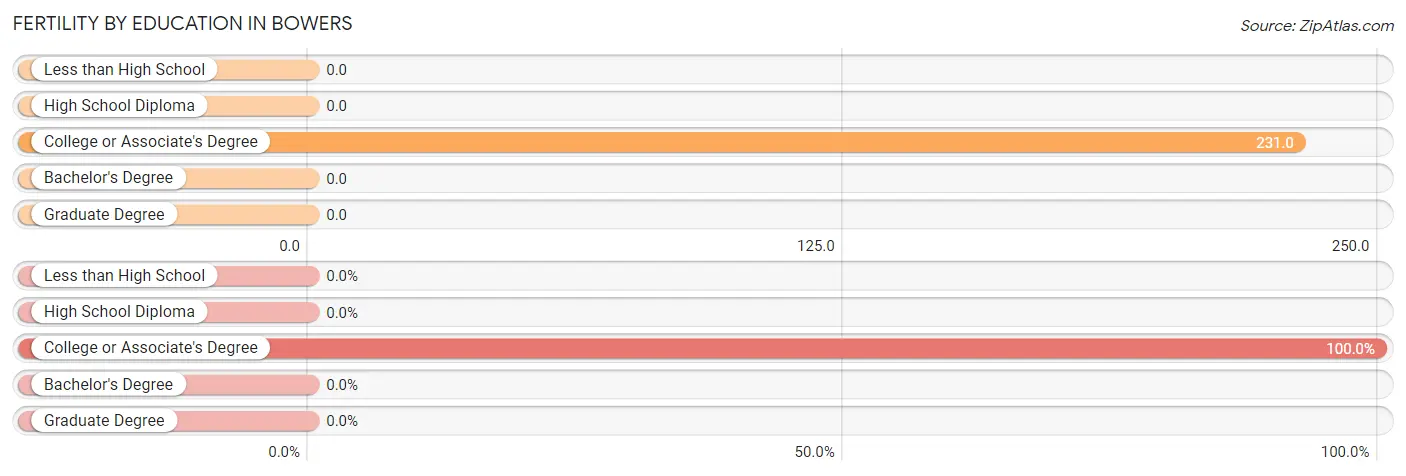
| Educational Attainment | Women with Births | Births / 1,000 Women |
| Less than High School | 0 (0.0%) | 0.0 |
| High School Diploma | 0 (0.0%) | 0.0 |
| College or Associate's Degree | 3 (100.0%) | 231.0 |
| Bachelor's Degree | 0 (0.0%) | 0.0 |
| Graduate Degree | 0 (0.0%) | 0.0 |
| Total | 3 (100.0%) | 59.0 |
Fertility by Education by Marriage Status in Bowers
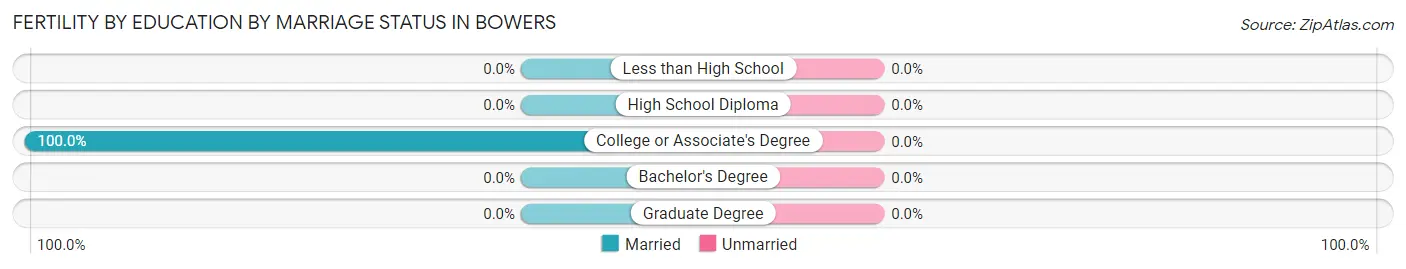
| Educational Attainment | Married | Unmarried |
| Less than High School | 0 (0.0%) | 0 (0.0%) |
| High School Diploma | 0 (0.0%) | 0 (0.0%) |
| College or Associate's Degree | 3 (100.0%) | 0 (0.0%) |
| Bachelor's Degree | 0 (0.0%) | 0 (0.0%) |
| Graduate Degree | 0 (0.0%) | 0 (0.0%) |
| Total | 3 (100.0%) | 0 (0.0%) |
Income in Bowers
Income Overview in Bowers
Per Capita Income in Bowers is $40,410, while median incomes of families and households are $80,714 and $69,500 respectively.
| Characteristic | Number | Measure |
| Per Capita Income | 336 | $40,410 |
| Median Family Income | 102 | $80,714 |
| Mean Family Income | 102 | $100,905 |
| Median Household Income | 136 | $69,500 |
| Mean Household Income | 136 | $88,763 |
| Income Deficit | 102 | $0 |
| Wage / Income Gap (%) | 336 | 38.63% |
| Wage / Income Gap ($) | 336 | 61.37¢ per $1 |
| Gini / Inequality Index | 336 | 0.40 |
Earnings by Sex in Bowers
Average Earnings in Bowers are $48,438, $57,708 for men and $35,417 for women, a difference of 38.6%.
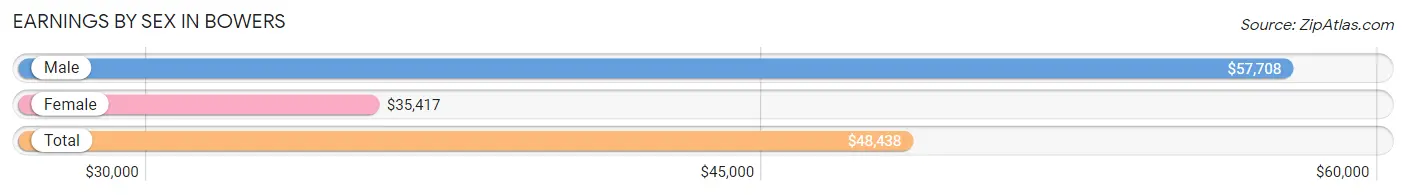
| Sex | Number | Average Earnings |
| Male | 64 (52.5%) | $57,708 |
| Female | 58 (47.5%) | $35,417 |
| Total | 122 (100.0%) | $48,438 |
Earnings by Sex by Income Bracket in Bowers
The most common earnings brackets in Bowers are $55,000 to $64,999 for men (14 | 21.9%) and $25,000 to $29,999 for women (13 | 22.4%).
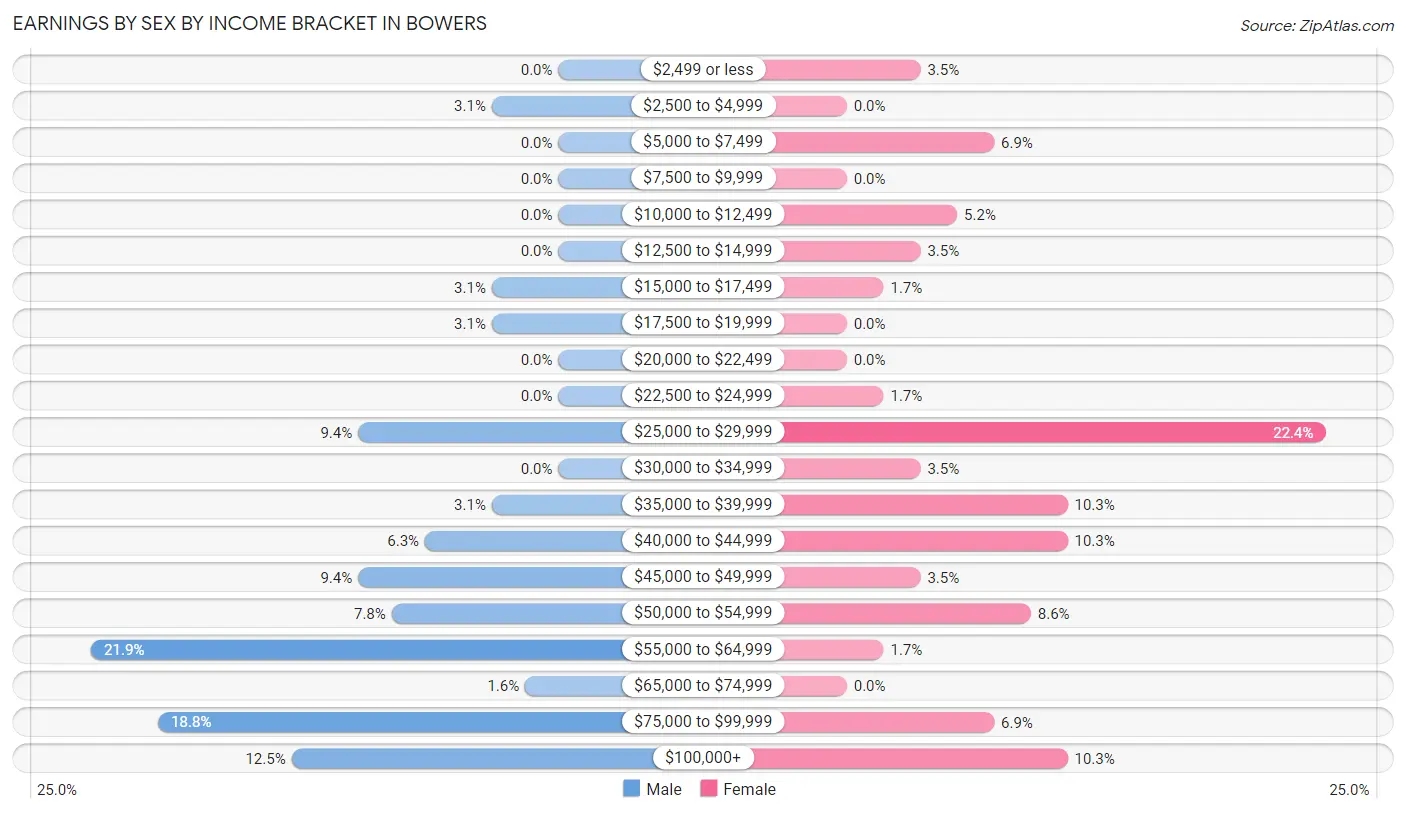
| Income | Male | Female |
| $2,499 or less | 0 (0.0%) | 2 (3.5%) |
| $2,500 to $4,999 | 2 (3.1%) | 0 (0.0%) |
| $5,000 to $7,499 | 0 (0.0%) | 4 (6.9%) |
| $7,500 to $9,999 | 0 (0.0%) | 0 (0.0%) |
| $10,000 to $12,499 | 0 (0.0%) | 3 (5.2%) |
| $12,500 to $14,999 | 0 (0.0%) | 2 (3.5%) |
| $15,000 to $17,499 | 2 (3.1%) | 1 (1.7%) |
| $17,500 to $19,999 | 2 (3.1%) | 0 (0.0%) |
| $20,000 to $22,499 | 0 (0.0%) | 0 (0.0%) |
| $22,500 to $24,999 | 0 (0.0%) | 1 (1.7%) |
| $25,000 to $29,999 | 6 (9.4%) | 13 (22.4%) |
| $30,000 to $34,999 | 0 (0.0%) | 2 (3.5%) |
| $35,000 to $39,999 | 2 (3.1%) | 6 (10.3%) |
| $40,000 to $44,999 | 4 (6.2%) | 6 (10.3%) |
| $45,000 to $49,999 | 6 (9.4%) | 2 (3.5%) |
| $50,000 to $54,999 | 5 (7.8%) | 5 (8.6%) |
| $55,000 to $64,999 | 14 (21.9%) | 1 (1.7%) |
| $65,000 to $74,999 | 1 (1.6%) | 0 (0.0%) |
| $75,000 to $99,999 | 12 (18.8%) | 4 (6.9%) |
| $100,000+ | 8 (12.5%) | 6 (10.3%) |
| Total | 64 (100.0%) | 58 (100.0%) |
Earnings by Sex by Educational Attainment in Bowers
Average earnings in Bowers are $57,708 for men and $43,333 for women, a difference of 24.9%. Men with an educational attainment of bachelor's degree enjoy the highest average annual earnings of $59,219, while those with college or associate's degree education earn the least with $41,250. Women with an educational attainment of bachelor's degree earn the most with the average annual earnings of $52,917, while those with college or associate's degree education have the smallest earnings of $43,333.
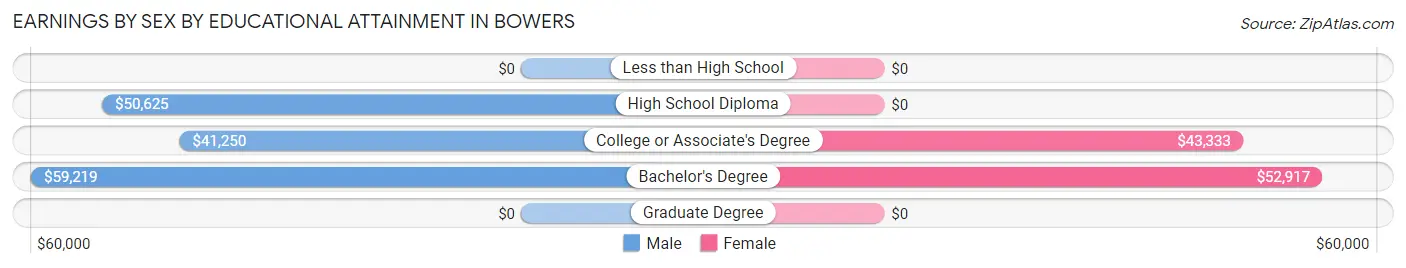
| Educational Attainment | Male Income | Female Income |
| Less than High School | - | - |
| High School Diploma | $50,625 | $0 |
| College or Associate's Degree | $41,250 | $43,333 |
| Bachelor's Degree | $59,219 | $52,917 |
| Graduate Degree | - | - |
| Total | $57,708 | $43,333 |
Family Income in Bowers
Family Income Brackets in Bowers
According to the Bowers family income data, there are 28 families falling into the $50,000 to $74,999 income range, which is the most common income bracket and makes up 27.5% of all families.
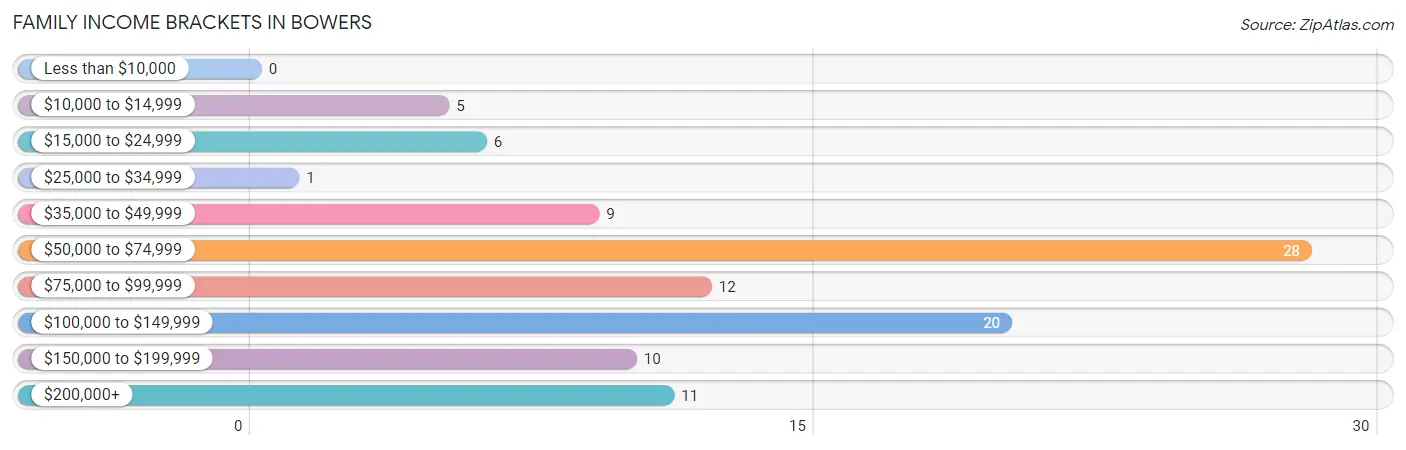
| Income Bracket | # Families | % Families |
| Less than $10,000 | 0 | 0.0% |
| $10,000 to $14,999 | 5 | 4.9% |
| $15,000 to $24,999 | 6 | 5.9% |
| $25,000 to $34,999 | 1 | 1.0% |
| $35,000 to $49,999 | 9 | 8.8% |
| $50,000 to $74,999 | 28 | 27.5% |
| $75,000 to $99,999 | 12 | 11.8% |
| $100,000 to $149,999 | 20 | 19.6% |
| $150,000 to $199,999 | 10 | 9.8% |
| $200,000+ | 11 | 10.8% |
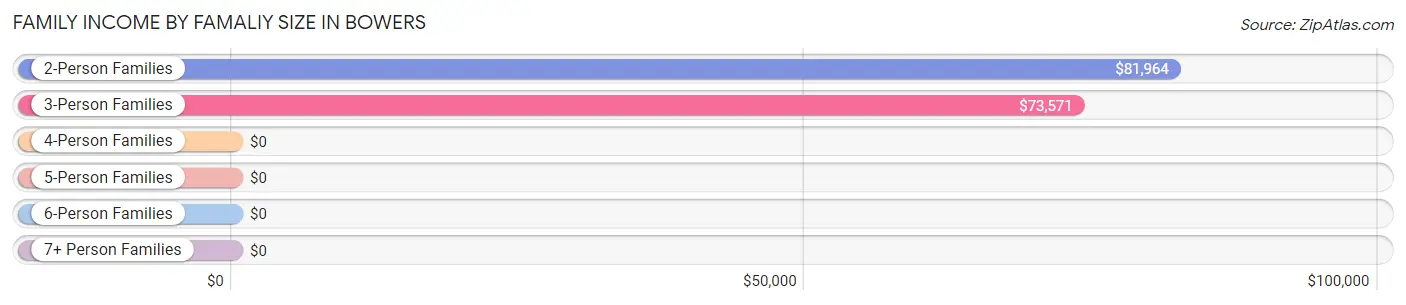
Family Income by Famaliy Size in Bowers
2-person families (71 | 69.6%) account for the highest median family income in Bowers with $81,964 per family, while 2-person families (71 | 69.6%) have the highest median income of $40,982 per family member.
| Income Bracket | # Families | Median Income |
| 2-Person Families | 71 (69.6%) | $81,964 |
| 3-Person Families | 24 (23.5%) | $73,571 |
| 4-Person Families | 2 (2.0%) | $0 |
| 5-Person Families | 0 (0.0%) | $0 |
| 6-Person Families | 3 (2.9%) | $0 |
| 7+ Person Families | 2 (2.0%) | $0 |
| Total | 102 (100.0%) | $80,714 |
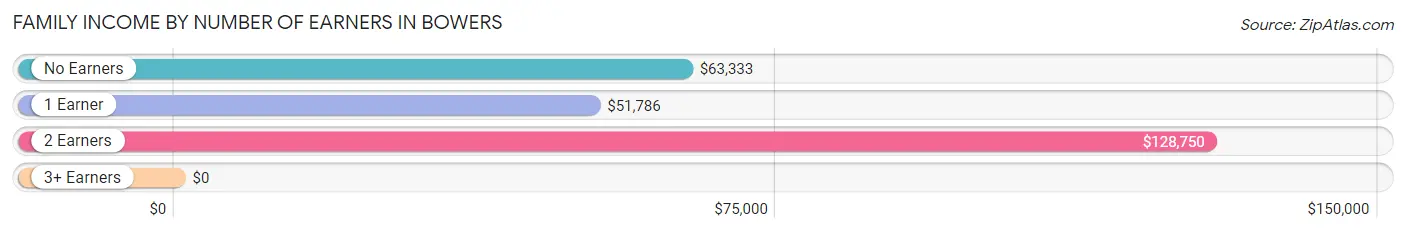
Family Income by Number of Earners in Bowers
| Number of Earners | # Families | Median Income |
| No Earners | 46 (45.1%) | $63,333 |
| 1 Earner | 18 (17.6%) | $51,786 |
| 2 Earners | 28 (27.5%) | $128,750 |
| 3+ Earners | 10 (9.8%) | $0 |
| Total | 102 (100.0%) | $80,714 |
Household Income in Bowers
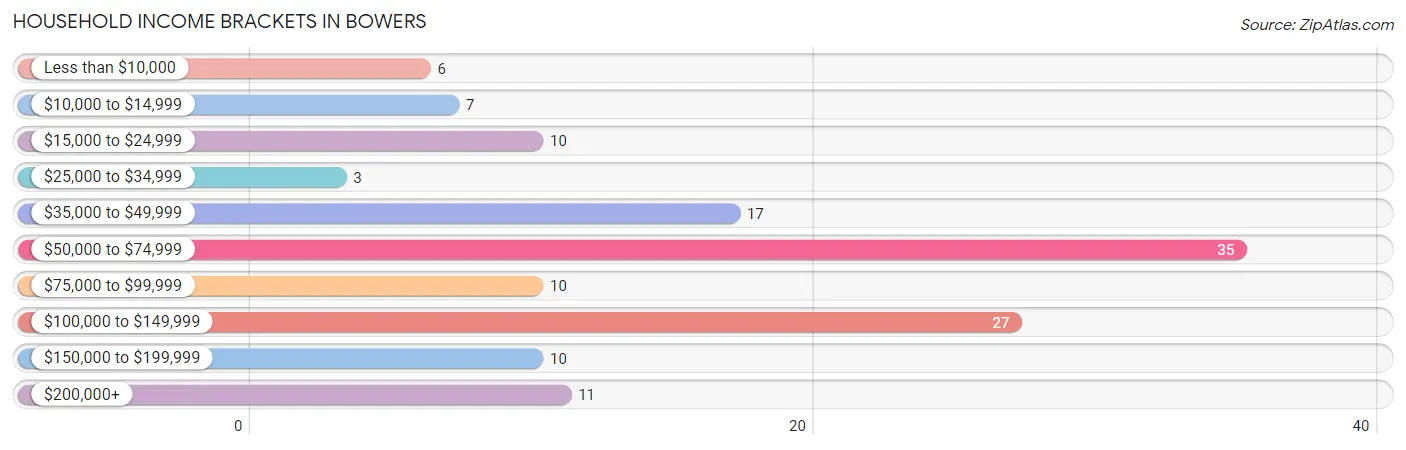
Household Income Brackets in Bowers
With 35 households falling in the category, the $50,000 to $74,999 income range is the most frequent in Bowers, accounting for 25.7% of all households. In contrast, only 3 households (2.2%) fall into the $25,000 to $34,999 income bracket, making it the least populous group.
| Income Bracket | # Households | % Households |
| Less than $10,000 | 6 | 4.4% |
| $10,000 to $14,999 | 7 | 5.1% |
| $15,000 to $24,999 | 10 | 7.4% |
| $25,000 to $34,999 | 3 | 2.2% |
| $35,000 to $49,999 | 17 | 12.5% |
| $50,000 to $74,999 | 35 | 25.7% |
| $75,000 to $99,999 | 10 | 7.4% |
| $100,000 to $149,999 | 27 | 19.9% |
| $150,000 to $199,999 | 10 | 7.4% |
| $200,000+ | 11 | 8.1% |
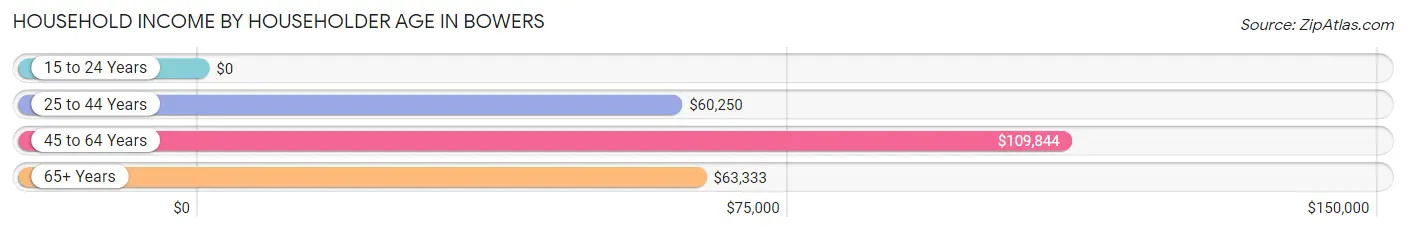
Household Income by Householder Age in Bowers
The median household income in Bowers is $69,500, with the highest median household income of $109,844 found in the 45 to 64 years age bracket for the primary householder. A total of 43 households (31.6%) fall into this category.
| Income Bracket | # Households | Median Income |
| 15 to 24 Years | 0 (0.0%) | $0 |
| 25 to 44 Years | 25 (18.4%) | $60,250 |
| 45 to 64 Years | 43 (31.6%) | $109,844 |
| 65+ Years | 68 (50.0%) | $63,333 |
| Total | 136 (100.0%) | $69,500 |
Poverty in Bowers
Income Below Poverty by Sex and Age in Bowers
With 11.0% poverty level for males and 9.5% for females among the residents of Bowers, 18 to 24 year old males and 35 to 44 year old females are the most vulnerable to poverty, with 6 males (100.0%) and 5 females (50.0%) in their respective age groups living below the poverty level.
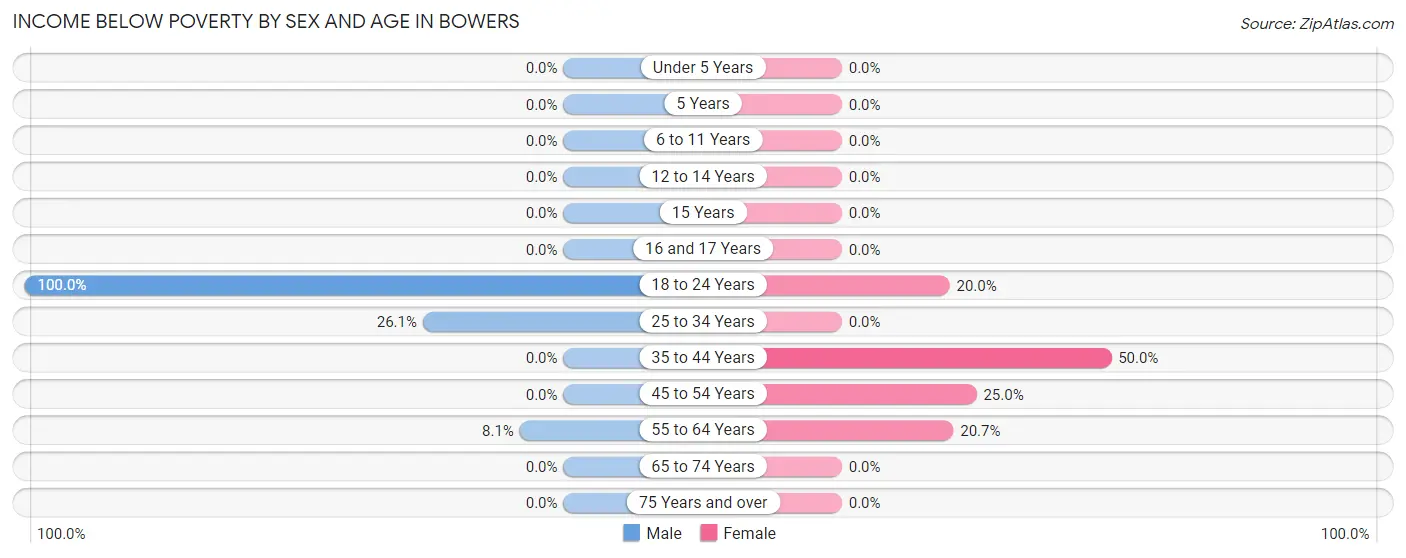
| Age Bracket | Male | Female |
| Under 5 Years | 0 (0.0%) | 0 (0.0%) |
| 5 Years | 0 (0.0%) | 0 (0.0%) |
| 6 to 11 Years | 0 (0.0%) | 0 (0.0%) |
| 12 to 14 Years | 0 (0.0%) | 0 (0.0%) |
| 15 Years | 0 (0.0%) | 0 (0.0%) |
| 16 and 17 Years | 0 (0.0%) | 0 (0.0%) |
| 18 to 24 Years | 6 (100.0%) | 4 (20.0%) |
| 25 to 34 Years | 6 (26.1%) | 0 (0.0%) |
| 35 to 44 Years | 0 (0.0%) | 5 (50.0%) |
| 45 to 54 Years | 0 (0.0%) | 4 (25.0%) |
| 55 to 64 Years | 3 (8.1%) | 6 (20.7%) |
| 65 to 74 Years | 0 (0.0%) | 0 (0.0%) |
| 75 Years and over | 0 (0.0%) | 0 (0.0%) |
| Total | 15 (11.0%) | 19 (9.5%) |
Income Above Poverty by Sex and Age in Bowers
According to the poverty statistics in Bowers, males aged under 5 years and females aged under 5 years are the age groups that are most secure financially, with 100.0% of males and 100.0% of females in these age groups living above the poverty line.
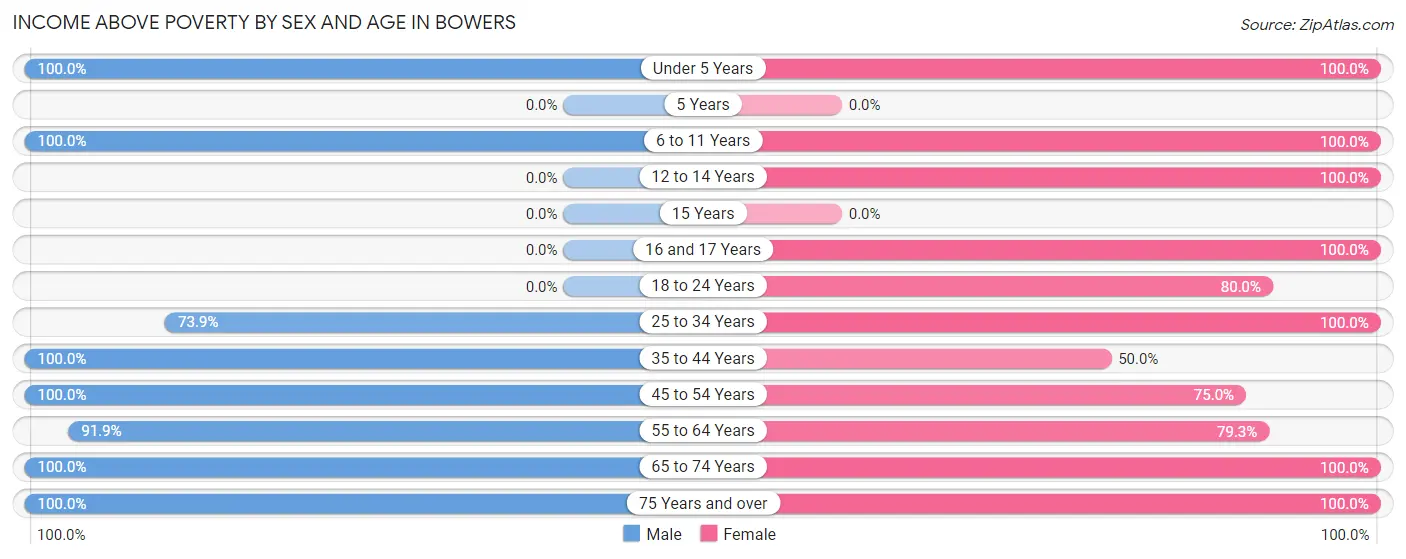
| Age Bracket | Male | Female |
| Under 5 Years | 4 (100.0%) | 3 (100.0%) |
| 5 Years | 0 (0.0%) | 0 (0.0%) |
| 6 to 11 Years | 2 (100.0%) | 7 (100.0%) |
| 12 to 14 Years | 0 (0.0%) | 3 (100.0%) |
| 15 Years | 0 (0.0%) | 0 (0.0%) |
| 16 and 17 Years | 0 (0.0%) | 3 (100.0%) |
| 18 to 24 Years | 0 (0.0%) | 16 (80.0%) |
| 25 to 34 Years | 17 (73.9%) | 15 (100.0%) |
| 35 to 44 Years | 10 (100.0%) | 5 (50.0%) |
| 45 to 54 Years | 4 (100.0%) | 12 (75.0%) |
| 55 to 64 Years | 34 (91.9%) | 23 (79.3%) |
| 65 to 74 Years | 34 (100.0%) | 44 (100.0%) |
| 75 Years and over | 16 (100.0%) | 50 (100.0%) |
| Total | 121 (89.0%) | 181 (90.5%) |
Income Below Poverty Among Married-Couple Families in Bowers
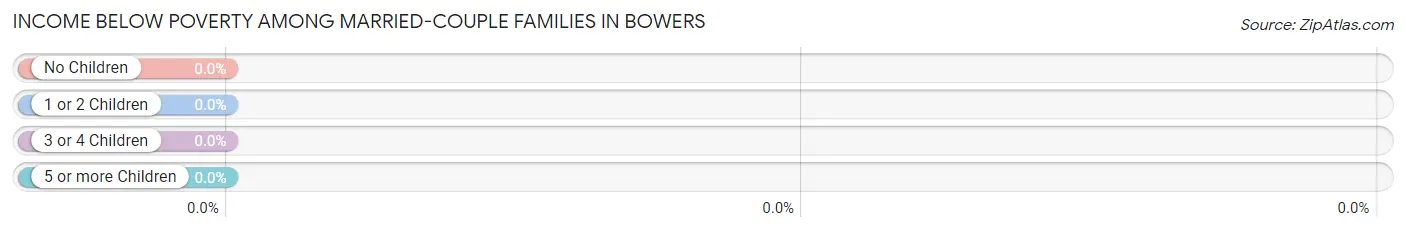
| Children | Above Poverty | Below Poverty |
| No Children | 80 (100.0%) | 0 (0.0%) |
| 1 or 2 Children | 4 (100.0%) | 0 (0.0%) |
| 3 or 4 Children | 3 (100.0%) | 0 (0.0%) |
| 5 or more Children | 0 (0.0%) | 0 (0.0%) |
| Total | 87 (100.0%) | 0 (0.0%) |
Income Below Poverty Among Single-Parent Households in Bowers
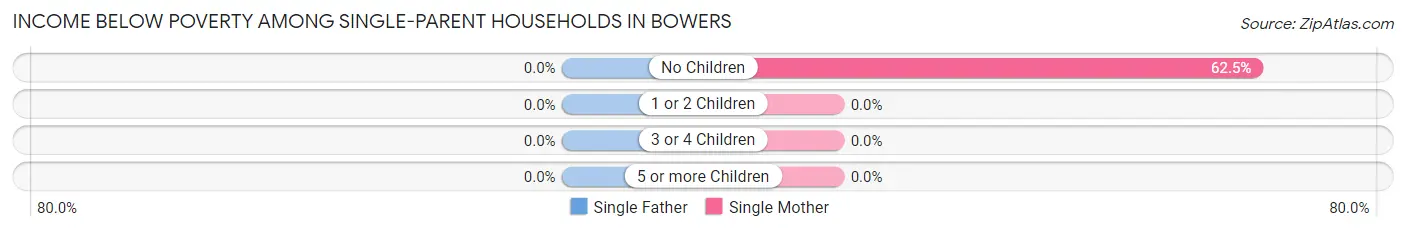
| Children | Single Father | Single Mother |
| No Children | 0 (0.0%) | 5 (62.5%) |
| 1 or 2 Children | 0 (0.0%) | 0 (0.0%) |
| 3 or 4 Children | 0 (0.0%) | 0 (0.0%) |
| 5 or more Children | 0 (0.0%) | 0 (0.0%) |
| Total | 0 (0.0%) | 5 (55.6%) |
Income Below Poverty Among Married-Couple vs Single-Parent Households in Bowers
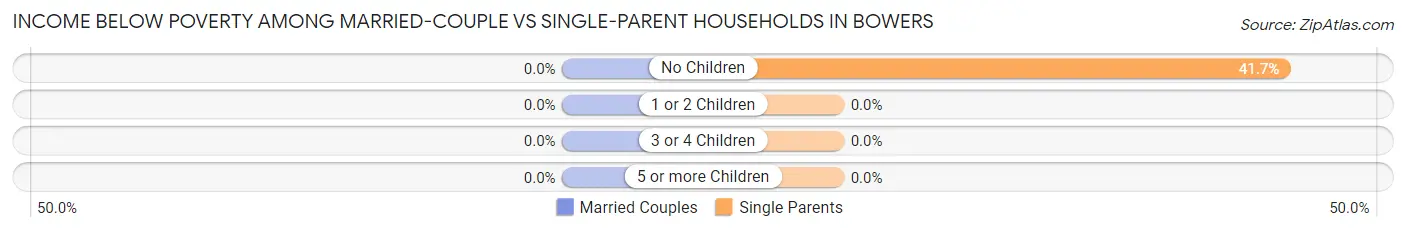
| Children | Married-Couple Families | Single-Parent Households |
| No Children | 0 (0.0%) | 5 (41.7%) |
| 1 or 2 Children | 0 (0.0%) | 0 (0.0%) |
| 3 or 4 Children | 0 (0.0%) | 0 (0.0%) |
| 5 or more Children | 0 (0.0%) | 0 (0.0%) |
| Total | 0 (0.0%) | 5 (33.3%) |
Employment Characteristics in Bowers
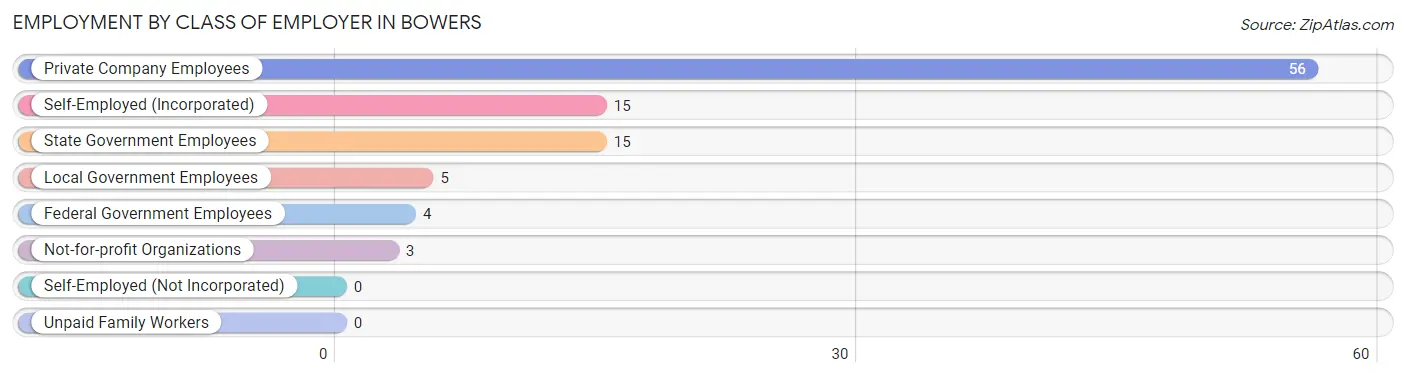
Employment by Class of Employer in Bowers
Among the 98 employed individuals in Bowers, private company employees (56 | 57.1%), self-employed (incorporated) (15 | 15.3%), and state government employees (15 | 15.3%) make up the most common classes of employment.
| Employer Class | # Employees | % Employees |
| Private Company Employees | 56 | 57.1% |
| Self-Employed (Incorporated) | 15 | 15.3% |
| Self-Employed (Not Incorporated) | 0 | 0.0% |
| Not-for-profit Organizations | 3 | 3.1% |
| Local Government Employees | 5 | 5.1% |
| State Government Employees | 15 | 15.3% |
| Federal Government Employees | 4 | 4.1% |
| Unpaid Family Workers | 0 | 0.0% |
| Total | 98 | 100.0% |
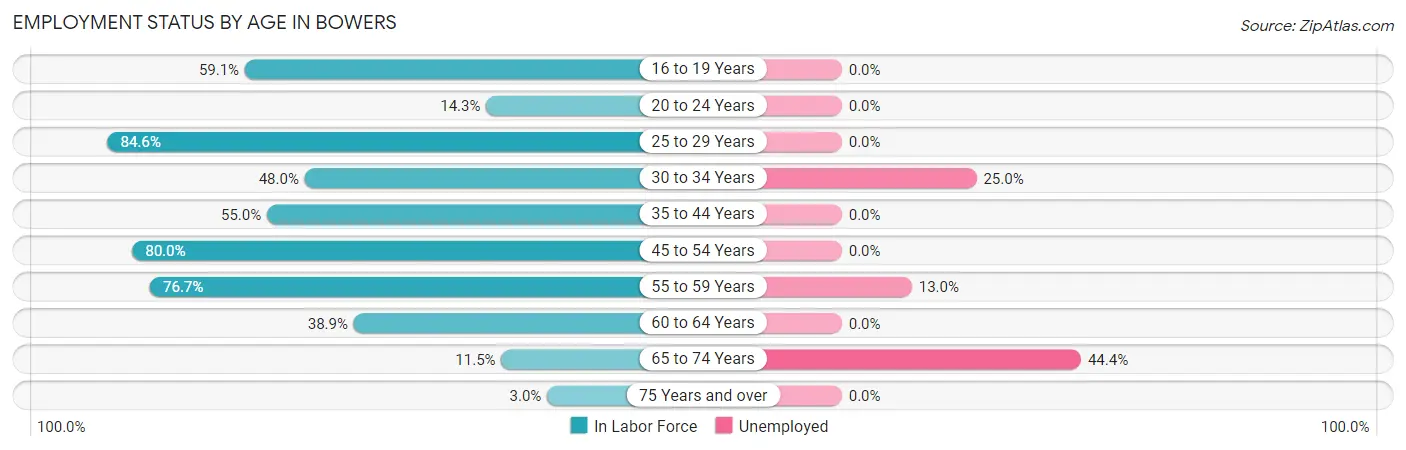
Employment Status by Age in Bowers
According to the labor force statistics for Bowers, out of the total population over 16 years of age (317), 35.3% or 112 individuals are in the labor force, with 8.9% or 10 of them unemployed. The age group with the highest labor force participation rate is 25 to 29 years, with 84.6% or 11 individuals in the labor force. Within the labor force, the 65 to 74 years age range has the highest percentage of unemployed individuals, with 44.4% or 4 of them being unemployed.
| Age Bracket | In Labor Force | Unemployed |
| 16 to 19 Years | 13 (59.1%) | 0 (0.0%) |
| 20 to 24 Years | 1 (14.3%) | 0 (0.0%) |
| 25 to 29 Years | 11 (84.6%) | 0 (0.0%) |
| 30 to 34 Years | 12 (48.0%) | 3 (25.0%) |
| 35 to 44 Years | 11 (55.0%) | 0 (0.0%) |
| 45 to 54 Years | 16 (80.0%) | 0 (0.0%) |
| 55 to 59 Years | 23 (76.7%) | 3 (13.0%) |
| 60 to 64 Years | 14 (38.9%) | 0 (0.0%) |
| 65 to 74 Years | 9 (11.5%) | 4 (44.4%) |
| 75 Years and over | 2 (3.0%) | 0 (0.0%) |
| Total | 112 (35.3%) | 10 (8.9%) |
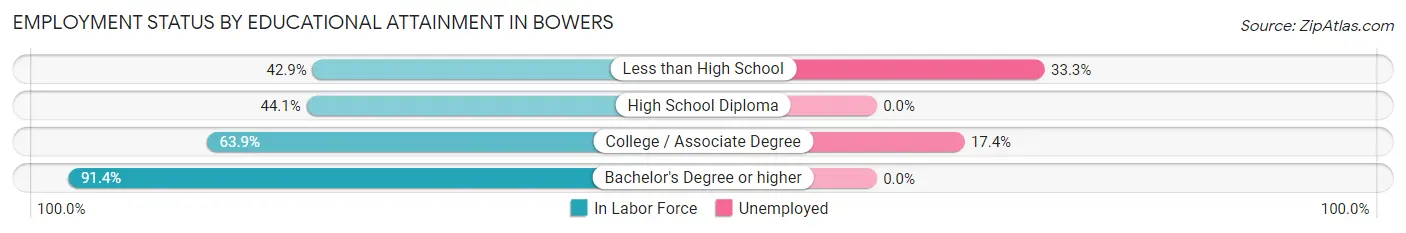
Employment Status by Educational Attainment in Bowers
According to labor force statistics for Bowers, 60.4% of individuals (87) out of the total population between 25 and 64 years of age (144) are in the labor force, with 6.9% or 6 of them being unemployed. The group with the highest labor force participation rate are those with the educational attainment of bachelor's degree or higher, with 91.4% or 32 individuals in the labor force. Within the labor force, individuals with less than high school education have the highest percentage of unemployment, with 33.3% or 2 of them being unemployed.
| Educational Attainment | In Labor Force | Unemployed |
| Less than High School | 6 (42.9%) | 5 (33.3%) |
| High School Diploma | 26 (44.1%) | 0 (0.0%) |
| College / Associate Degree | 23 (63.9%) | 6 (17.4%) |
| Bachelor's Degree or higher | 32 (91.4%) | 0 (0.0%) |
| Total | 87 (60.4%) | 10 (6.9%) |
Employment Occupations by Sex in Bowers
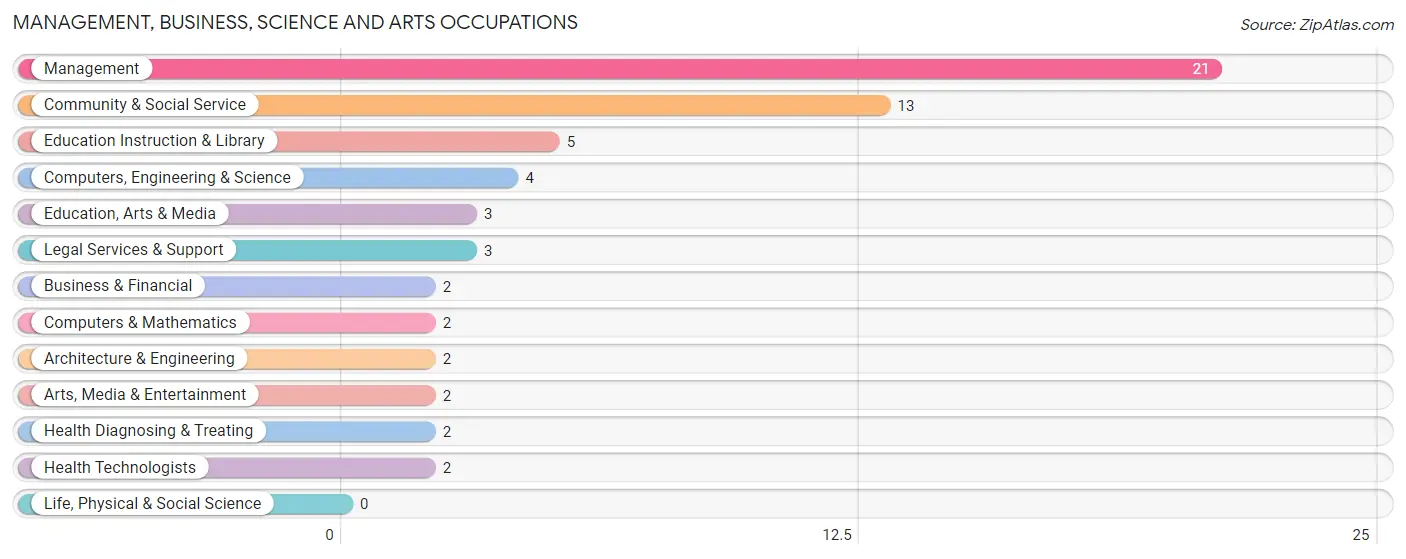
Management, Business, Science and Arts Occupations
The most common Management, Business, Science and Arts occupations in Bowers are Management (21 | 20.6%), Community & Social Service (13 | 12.8%), Education Instruction & Library (5 | 4.9%), Computers, Engineering & Science (4 | 3.9%), and Education, Arts & Media (3 | 2.9%).
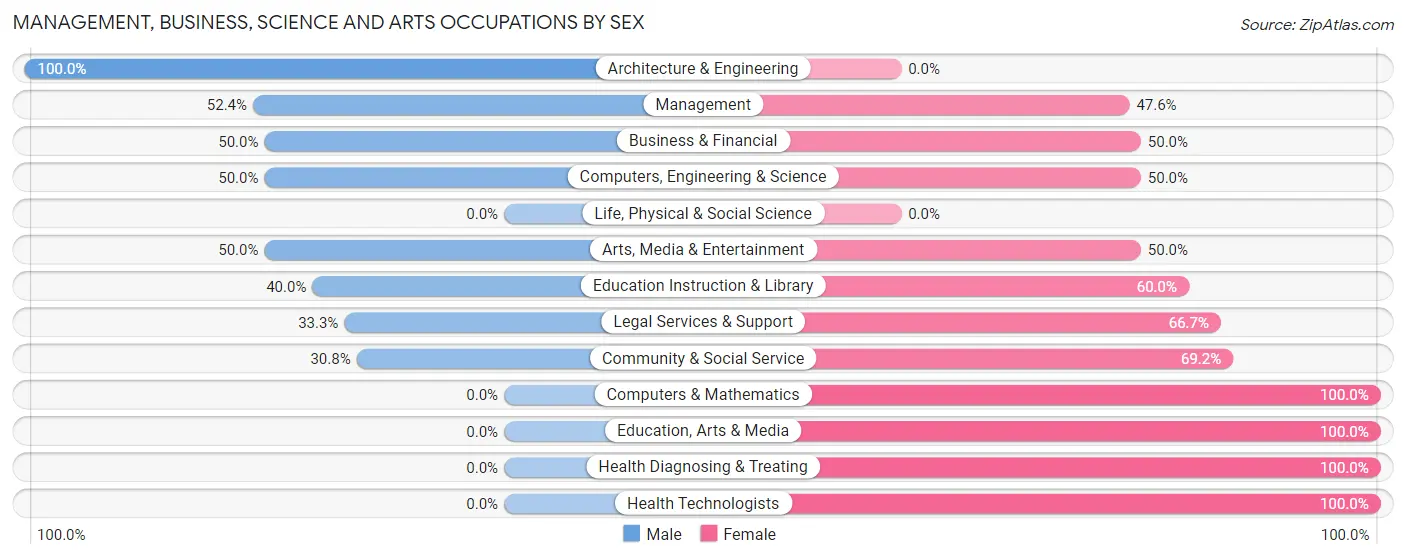
Management, Business, Science and Arts Occupations by Sex
Within the Management, Business, Science and Arts occupations in Bowers, the most male-oriented occupations are Architecture & Engineering (100.0%), Management (52.4%), and Business & Financial (50.0%), while the most female-oriented occupations are Computers & Mathematics (100.0%), Education, Arts & Media (100.0%), and Health Diagnosing & Treating (100.0%).
| Occupation | Male | Female |
| Management | 11 (52.4%) | 10 (47.6%) |
| Business & Financial | 1 (50.0%) | 1 (50.0%) |
| Computers, Engineering & Science | 2 (50.0%) | 2 (50.0%) |
| Computers & Mathematics | 0 (0.0%) | 2 (100.0%) |
| Architecture & Engineering | 2 (100.0%) | 0 (0.0%) |
| Life, Physical & Social Science | 0 (0.0%) | 0 (0.0%) |
| Community & Social Service | 4 (30.8%) | 9 (69.2%) |
| Education, Arts & Media | 0 (0.0%) | 3 (100.0%) |
| Legal Services & Support | 1 (33.3%) | 2 (66.7%) |
| Education Instruction & Library | 2 (40.0%) | 3 (60.0%) |
| Arts, Media & Entertainment | 1 (50.0%) | 1 (50.0%) |
| Health Diagnosing & Treating | 0 (0.0%) | 2 (100.0%) |
| Health Technologists | 0 (0.0%) | 2 (100.0%) |
| Total (Category) | 18 (42.9%) | 24 (57.1%) |
| Total (Overall) | 55 (53.9%) | 47 (46.1%) |
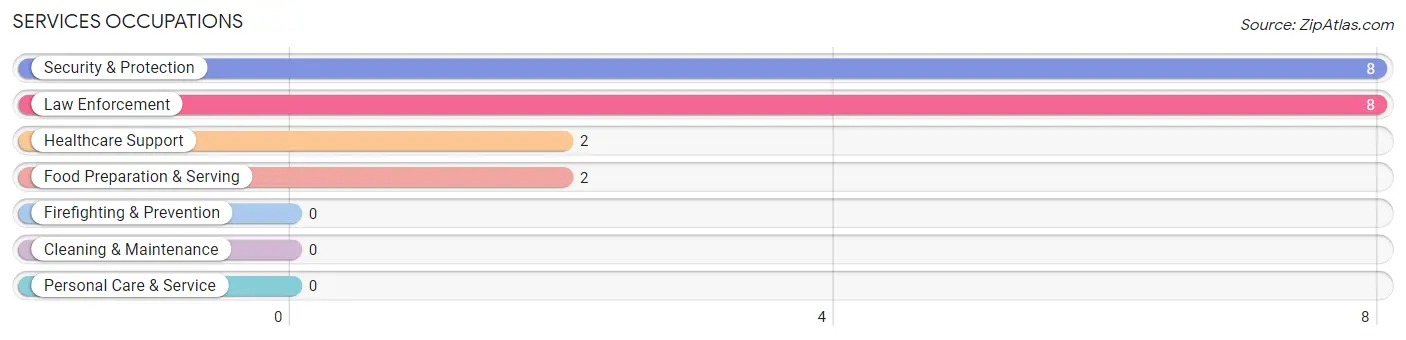
Services Occupations
The most common Services occupations in Bowers are Security & Protection (8 | 7.8%), Law Enforcement (8 | 7.8%), Healthcare Support (2 | 2.0%), and Food Preparation & Serving (2 | 2.0%).
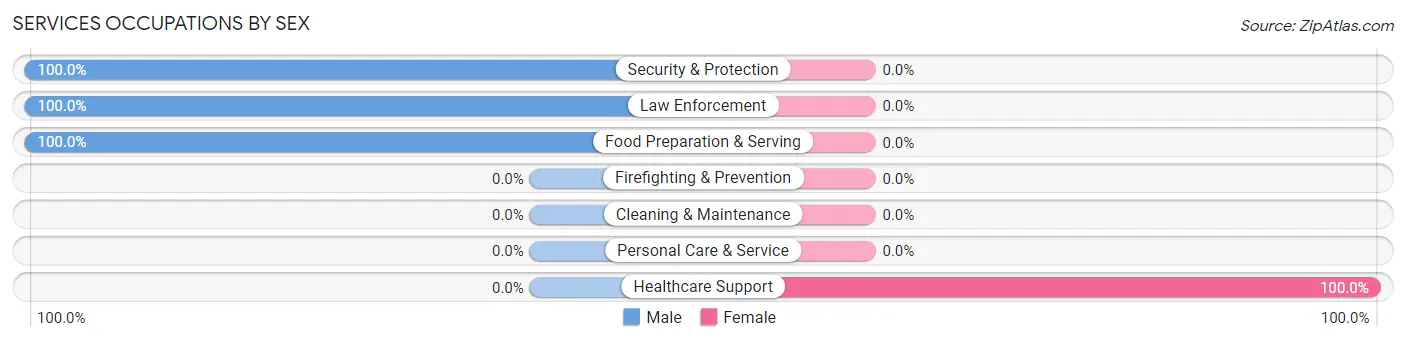
Services Occupations by Sex
| Occupation | Male | Female |
| Healthcare Support | 0 (0.0%) | 2 (100.0%) |
| Security & Protection | 8 (100.0%) | 0 (0.0%) |
| Firefighting & Prevention | 0 (0.0%) | 0 (0.0%) |
| Law Enforcement | 8 (100.0%) | 0 (0.0%) |
| Food Preparation & Serving | 2 (100.0%) | 0 (0.0%) |
| Cleaning & Maintenance | 0 (0.0%) | 0 (0.0%) |
| Personal Care & Service | 0 (0.0%) | 0 (0.0%) |
| Total (Category) | 10 (83.3%) | 2 (16.7%) |
| Total (Overall) | 55 (53.9%) | 47 (46.1%) |
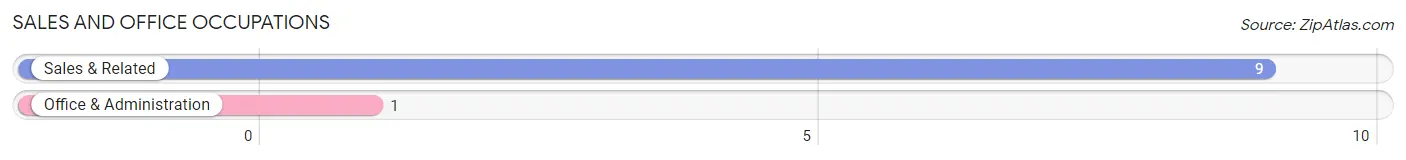
Sales and Office Occupations
The most common Sales and Office occupations in Bowers are Sales & Related (9 | 8.8%), and Office & Administration (1 | 1.0%).
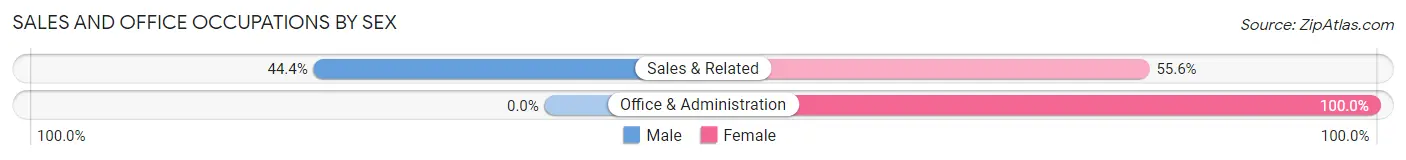
Sales and Office Occupations by Sex
| Occupation | Male | Female |
| Sales & Related | 4 (44.4%) | 5 (55.6%) |
| Office & Administration | 0 (0.0%) | 1 (100.0%) |
| Total (Category) | 4 (40.0%) | 6 (60.0%) |
| Total (Overall) | 55 (53.9%) | 47 (46.1%) |
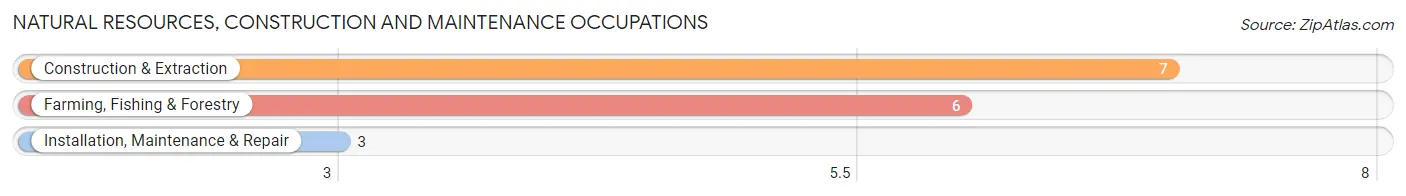
Natural Resources, Construction and Maintenance Occupations
The most common Natural Resources, Construction and Maintenance occupations in Bowers are Construction & Extraction (7 | 6.9%), Farming, Fishing & Forestry (6 | 5.9%), and Installation, Maintenance & Repair (3 | 2.9%).
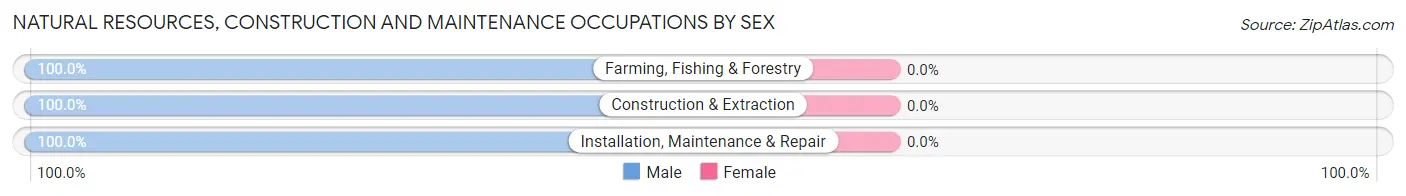
Natural Resources, Construction and Maintenance Occupations by Sex
| Occupation | Male | Female |
| Farming, Fishing & Forestry | 6 (100.0%) | 0 (0.0%) |
| Construction & Extraction | 7 (100.0%) | 0 (0.0%) |
| Installation, Maintenance & Repair | 3 (100.0%) | 0 (0.0%) |
| Total (Category) | 16 (100.0%) | 0 (0.0%) |
| Total (Overall) | 55 (53.9%) | 47 (46.1%) |
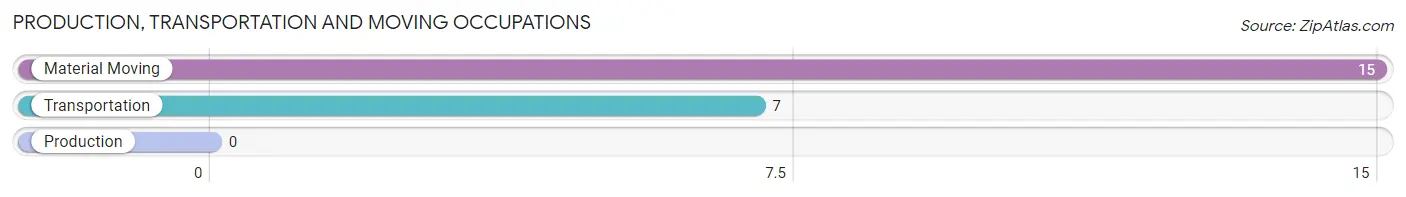
Production, Transportation and Moving Occupations
The most common Production, Transportation and Moving occupations in Bowers are Material Moving (15 | 14.7%), and Transportation (7 | 6.9%).
Production, Transportation and Moving Occupations by Sex
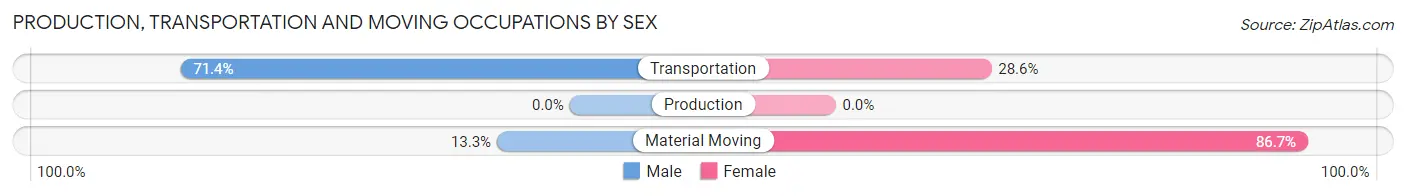
| Occupation | Male | Female |
| Production | 0 (0.0%) | 0 (0.0%) |
| Transportation | 5 (71.4%) | 2 (28.6%) |
| Material Moving | 2 (13.3%) | 13 (86.7%) |
| Total (Category) | 7 (31.8%) | 15 (68.2%) |
| Total (Overall) | 55 (53.9%) | 47 (46.1%) |
Employment Industries by Sex in Bowers
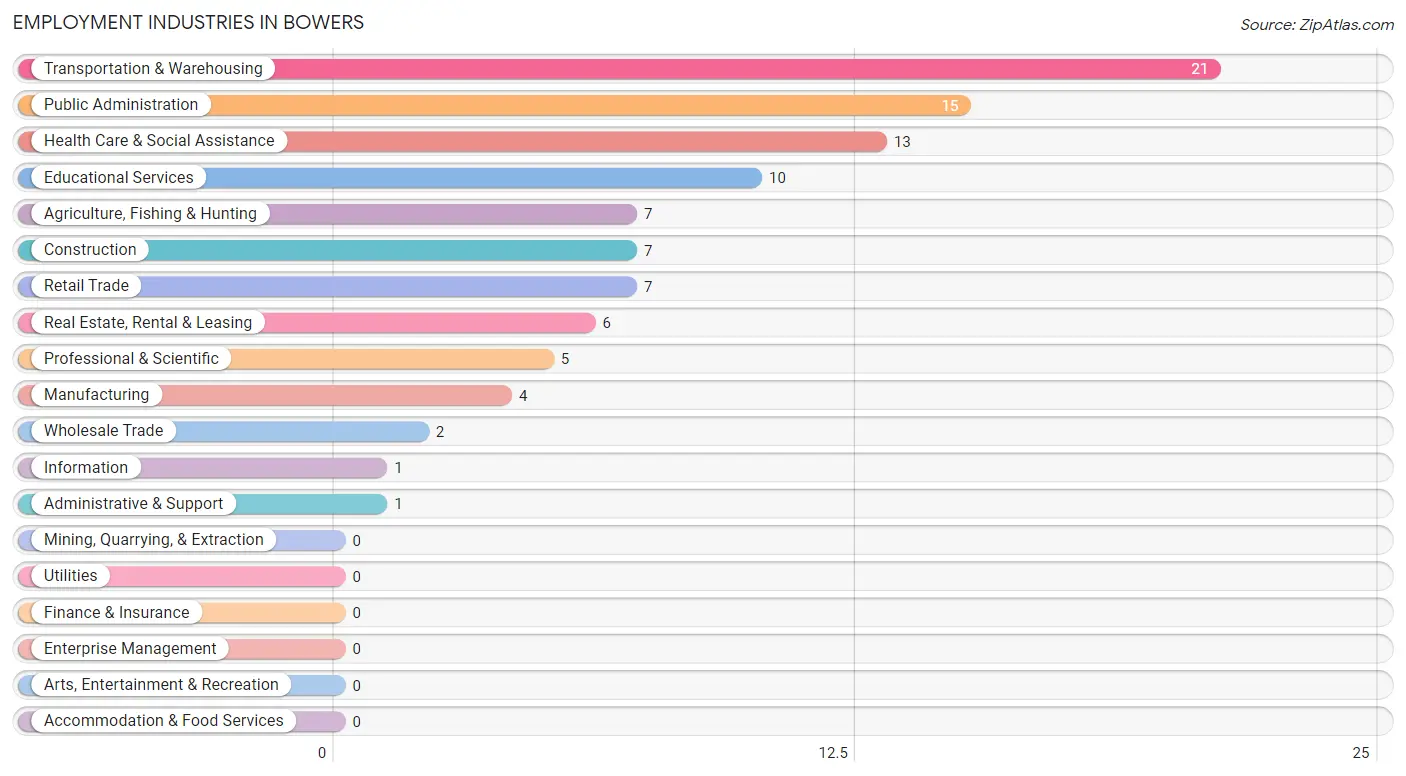
Employment Industries in Bowers
The major employment industries in Bowers include Transportation & Warehousing (21 | 20.6%), Public Administration (15 | 14.7%), Health Care & Social Assistance (13 | 12.8%), Educational Services (10 | 9.8%), and Agriculture, Fishing & Hunting (7 | 6.9%).
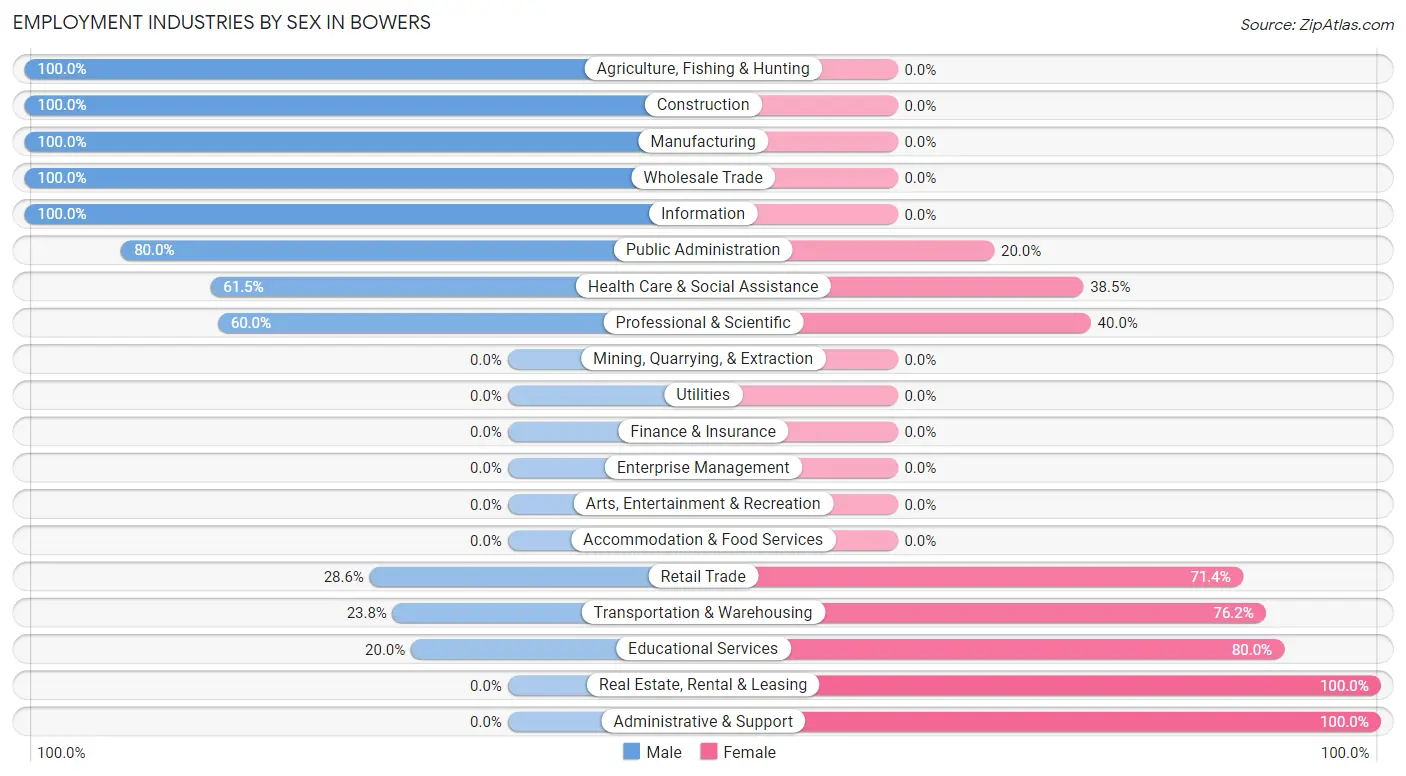
Employment Industries by Sex in Bowers
The Bowers industries that see more men than women are Agriculture, Fishing & Hunting (100.0%), Construction (100.0%), and Manufacturing (100.0%), whereas the industries that tend to have a higher number of women are Real Estate, Rental & Leasing (100.0%), Administrative & Support (100.0%), and Educational Services (80.0%).
| Industry | Male | Female |
| Agriculture, Fishing & Hunting | 7 (100.0%) | 0 (0.0%) |
| Mining, Quarrying, & Extraction | 0 (0.0%) | 0 (0.0%) |
| Construction | 7 (100.0%) | 0 (0.0%) |
| Manufacturing | 4 (100.0%) | 0 (0.0%) |
| Wholesale Trade | 2 (100.0%) | 0 (0.0%) |
| Retail Trade | 2 (28.6%) | 5 (71.4%) |
| Transportation & Warehousing | 5 (23.8%) | 16 (76.2%) |
| Utilities | 0 (0.0%) | 0 (0.0%) |
| Information | 1 (100.0%) | 0 (0.0%) |
| Finance & Insurance | 0 (0.0%) | 0 (0.0%) |
| Real Estate, Rental & Leasing | 0 (0.0%) | 6 (100.0%) |
| Professional & Scientific | 3 (60.0%) | 2 (40.0%) |
| Enterprise Management | 0 (0.0%) | 0 (0.0%) |
| Administrative & Support | 0 (0.0%) | 1 (100.0%) |
| Educational Services | 2 (20.0%) | 8 (80.0%) |
| Health Care & Social Assistance | 8 (61.5%) | 5 (38.5%) |
| Arts, Entertainment & Recreation | 0 (0.0%) | 0 (0.0%) |
| Accommodation & Food Services | 0 (0.0%) | 0 (0.0%) |
| Public Administration | 12 (80.0%) | 3 (20.0%) |
| Total | 55 (53.9%) | 47 (46.1%) |
Education in Bowers
School Enrollment in Bowers
The most common levels of schooling among the 30 students in Bowers are college / undergraduate (10 | 33.3%), middle school (7 | 23.3%), and elementary school (5 | 16.7%).
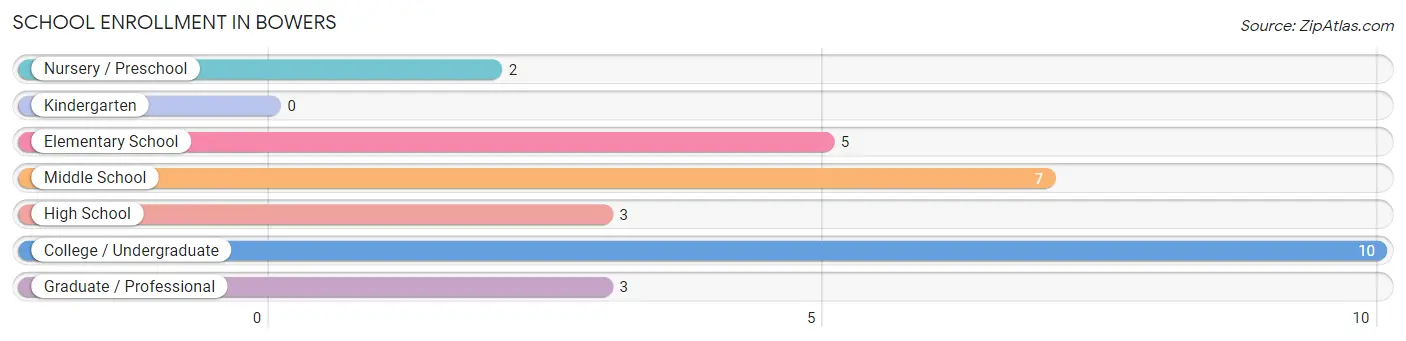
| School Level | # Students | % Students |
| Nursery / Preschool | 2 | 6.7% |
| Kindergarten | 0 | 0.0% |
| Elementary School | 5 | 16.7% |
| Middle School | 7 | 23.3% |
| High School | 3 | 10.0% |
| College / Undergraduate | 10 | 33.3% |
| Graduate / Professional | 3 | 10.0% |
| Total | 30 | 100.0% |
School Enrollment by Age by Funding Source in Bowers
Out of a total of 30 students who are enrolled in schools in Bowers, 4 (13.3%) attend a private institution, while the remaining 26 (86.7%) are enrolled in public schools. The age group of 3 to 4 year olds has the highest likelihood of being enrolled in private schools, with 2 (100.0% in the age bracket) enrolled. Conversely, the age group of 5 to 9 year old has the lowest likelihood of being enrolled in a private school, with 5 (100.0% in the age bracket) attending a public institution.
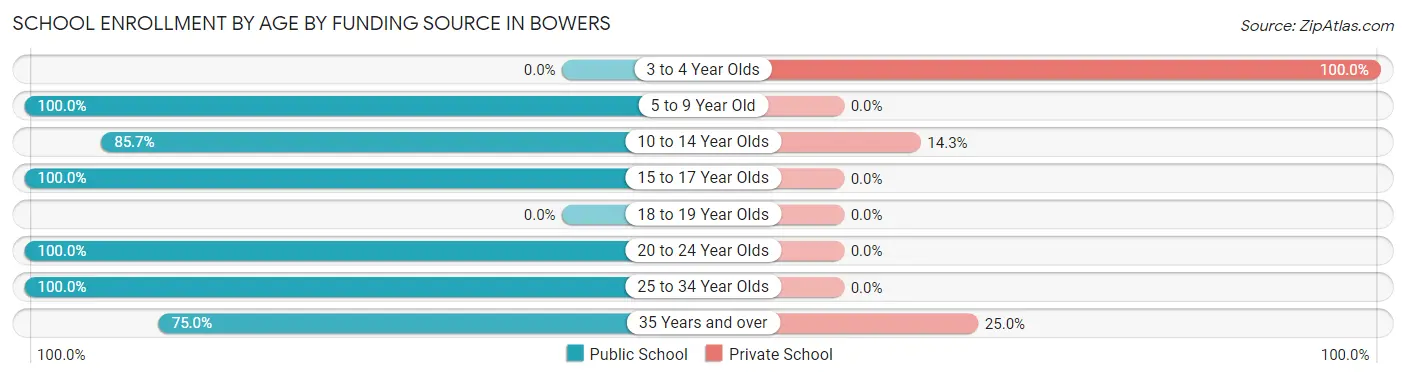
| Age Bracket | Public School | Private School |
| 3 to 4 Year Olds | 0 (0.0%) | 2 (100.0%) |
| 5 to 9 Year Old | 5 (100.0%) | 0 (0.0%) |
| 10 to 14 Year Olds | 6 (85.7%) | 1 (14.3%) |
| 15 to 17 Year Olds | 3 (100.0%) | 0 (0.0%) |
| 18 to 19 Year Olds | 0 (0.0%) | 0 (0.0%) |
| 20 to 24 Year Olds | 1 (100.0%) | 0 (0.0%) |
| 25 to 34 Year Olds | 8 (100.0%) | 0 (0.0%) |
| 35 Years and over | 3 (75.0%) | 1 (25.0%) |
| Total | 26 (86.7%) | 4 (13.3%) |
Educational Attainment by Field of Study in Bowers
Education (43 | 46.2%), business (19 | 20.4%), science & technology (14 | 15.0%), bio, nature & agricultural (4 | 4.3%), and visual & performing arts (3 | 3.2%) are the most common fields of study among 93 individuals in Bowers who have obtained a bachelor's degree or higher.
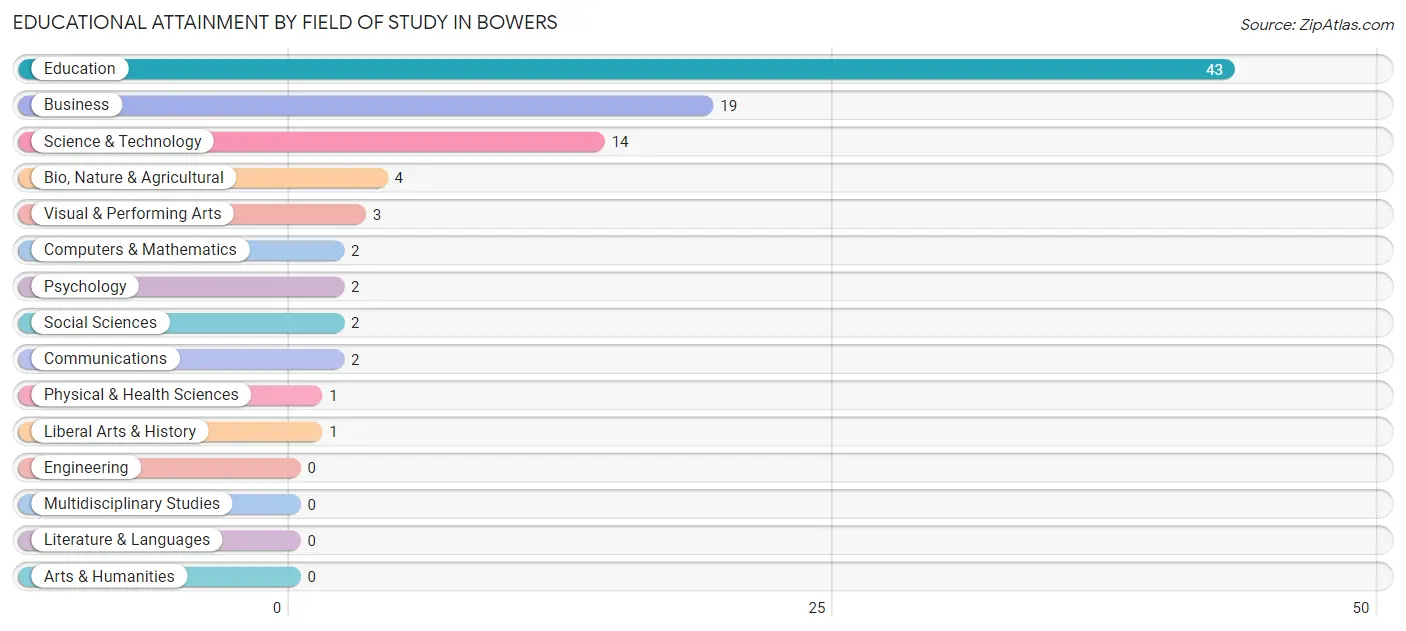
| Field of Study | # Graduates | % Graduates |
| Computers & Mathematics | 2 | 2.1% |
| Bio, Nature & Agricultural | 4 | 4.3% |
| Physical & Health Sciences | 1 | 1.1% |
| Psychology | 2 | 2.1% |
| Social Sciences | 2 | 2.1% |
| Engineering | 0 | 0.0% |
| Multidisciplinary Studies | 0 | 0.0% |
| Science & Technology | 14 | 15.0% |
| Business | 19 | 20.4% |
| Education | 43 | 46.2% |
| Literature & Languages | 0 | 0.0% |
| Liberal Arts & History | 1 | 1.1% |
| Visual & Performing Arts | 3 | 3.2% |
| Communications | 2 | 2.1% |
| Arts & Humanities | 0 | 0.0% |
| Total | 93 | 100.0% |
Transportation & Commute in Bowers
Vehicle Availability by Sex in Bowers
The most prevalent vehicle ownership categories in Bowers are males with 1 vehicle (23, accounting for 45.1%) and females with 1 vehicle (24, making up 48.9%).
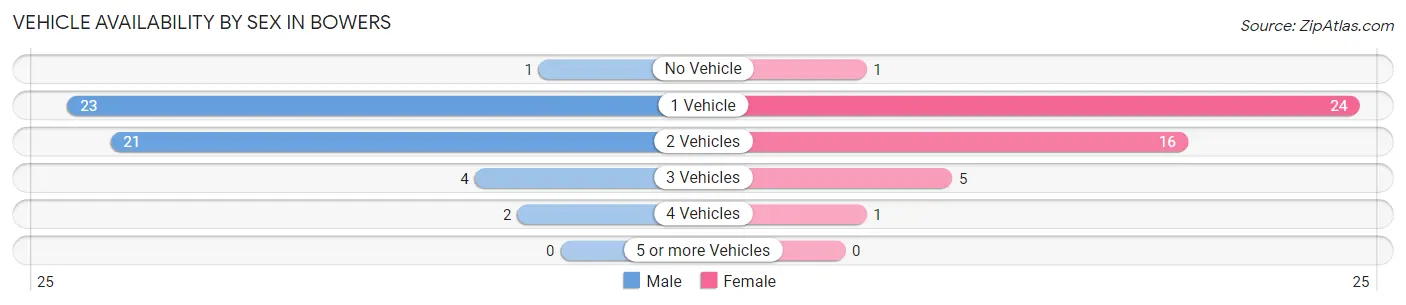
| Vehicles Available | Male | Female |
| No Vehicle | 1 (2.0%) | 1 (2.1%) |
| 1 Vehicle | 23 (45.1%) | 24 (51.1%) |
| 2 Vehicles | 21 (41.2%) | 16 (34.0%) |
| 3 Vehicles | 4 (7.8%) | 5 (10.6%) |
| 4 Vehicles | 2 (3.9%) | 1 (2.1%) |
| 5 or more Vehicles | 0 (0.0%) | 0 (0.0%) |
| Total | 51 (100.0%) | 47 (100.0%) |
Commute Time in Bowers
The most frequently occuring commute durations in Bowers are 5 to 9 minutes (22 commuters, 23.9%), 60 to 89 minutes (22 commuters, 23.9%), and 15 to 19 minutes (14 commuters, 15.2%).
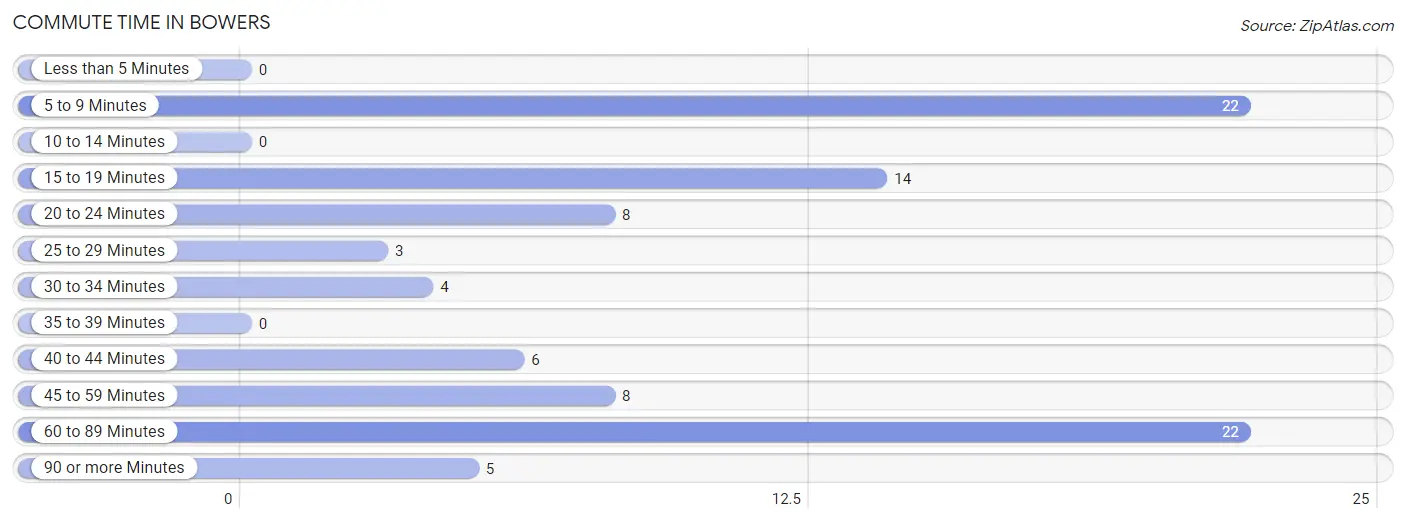
| Commute Time | # Commuters | % Commuters |
| Less than 5 Minutes | 0 | 0.0% |
| 5 to 9 Minutes | 22 | 23.9% |
| 10 to 14 Minutes | 0 | 0.0% |
| 15 to 19 Minutes | 14 | 15.2% |
| 20 to 24 Minutes | 8 | 8.7% |
| 25 to 29 Minutes | 3 | 3.3% |
| 30 to 34 Minutes | 4 | 4.3% |
| 35 to 39 Minutes | 0 | 0.0% |
| 40 to 44 Minutes | 6 | 6.5% |
| 45 to 59 Minutes | 8 | 8.7% |
| 60 to 89 Minutes | 22 | 23.9% |
| 90 or more Minutes | 5 | 5.4% |
Commute Time by Sex in Bowers
The most common commute times in Bowers are 60 to 89 minutes (17 commuters, 34.7%) for males and 5 to 9 minutes (14 commuters, 32.6%) for females.
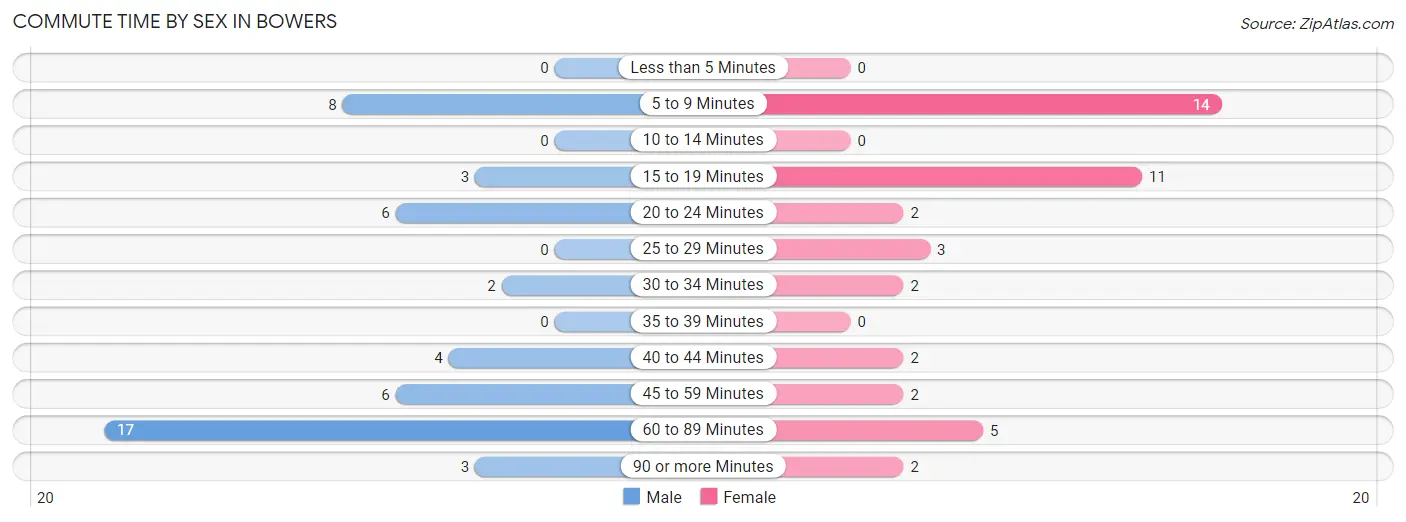
| Commute Time | Male | Female |
| Less than 5 Minutes | 0 (0.0%) | 0 (0.0%) |
| 5 to 9 Minutes | 8 (16.3%) | 14 (32.6%) |
| 10 to 14 Minutes | 0 (0.0%) | 0 (0.0%) |
| 15 to 19 Minutes | 3 (6.1%) | 11 (25.6%) |
| 20 to 24 Minutes | 6 (12.2%) | 2 (4.6%) |
| 25 to 29 Minutes | 0 (0.0%) | 3 (7.0%) |
| 30 to 34 Minutes | 2 (4.1%) | 2 (4.6%) |
| 35 to 39 Minutes | 0 (0.0%) | 0 (0.0%) |
| 40 to 44 Minutes | 4 (8.2%) | 2 (4.6%) |
| 45 to 59 Minutes | 6 (12.2%) | 2 (4.6%) |
| 60 to 89 Minutes | 17 (34.7%) | 5 (11.6%) |
| 90 or more Minutes | 3 (6.1%) | 2 (4.6%) |
Time of Departure to Work by Sex in Bowers
The most frequent times of departure to work in Bowers are 7:00 AM to 7:29 AM (12, 24.5%) for males and 8:00 AM to 8:29 AM (17, 39.5%) for females.
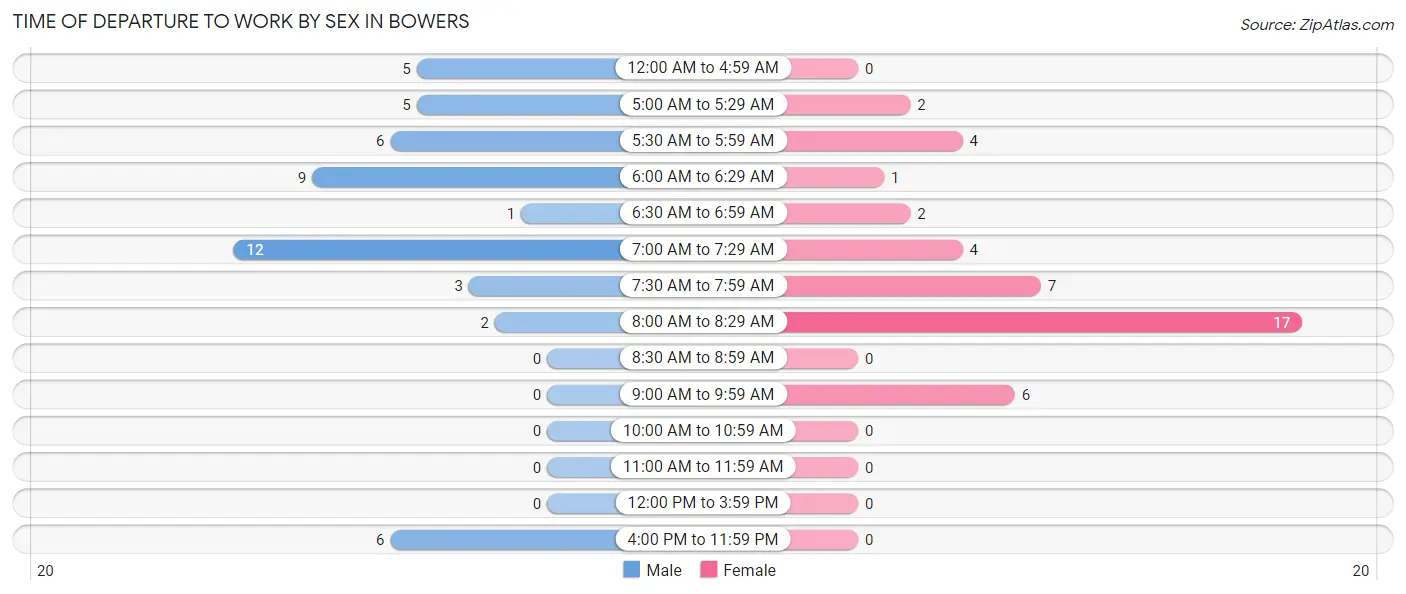
| Time of Departure | Male | Female |
| 12:00 AM to 4:59 AM | 5 (10.2%) | 0 (0.0%) |
| 5:00 AM to 5:29 AM | 5 (10.2%) | 2 (4.6%) |
| 5:30 AM to 5:59 AM | 6 (12.2%) | 4 (9.3%) |
| 6:00 AM to 6:29 AM | 9 (18.4%) | 1 (2.3%) |
| 6:30 AM to 6:59 AM | 1 (2.0%) | 2 (4.6%) |
| 7:00 AM to 7:29 AM | 12 (24.5%) | 4 (9.3%) |
| 7:30 AM to 7:59 AM | 3 (6.1%) | 7 (16.3%) |
| 8:00 AM to 8:29 AM | 2 (4.1%) | 17 (39.5%) |
| 8:30 AM to 8:59 AM | 0 (0.0%) | 0 (0.0%) |
| 9:00 AM to 9:59 AM | 0 (0.0%) | 6 (14.0%) |
| 10:00 AM to 10:59 AM | 0 (0.0%) | 0 (0.0%) |
| 11:00 AM to 11:59 AM | 0 (0.0%) | 0 (0.0%) |
| 12:00 PM to 3:59 PM | 0 (0.0%) | 0 (0.0%) |
| 4:00 PM to 11:59 PM | 6 (12.2%) | 0 (0.0%) |
| Total | 49 (100.0%) | 43 (100.0%) |
Housing Occupancy in Bowers
Occupancy by Ownership in Bowers
Of the total 136 dwellings in Bowers, owner-occupied units account for 115 (84.6%), while renter-occupied units make up 21 (15.4%).
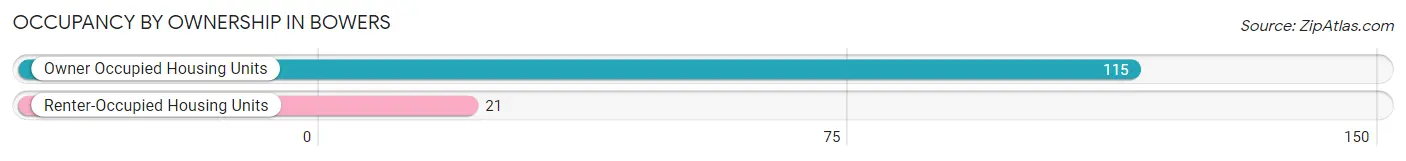
| Occupancy | # Housing Units | % Housing Units |
| Owner Occupied Housing Units | 115 | 84.6% |
| Renter-Occupied Housing Units | 21 | 15.4% |
| Total Occupied Housing Units | 136 | 100.0% |
Occupancy by Household Size in Bowers
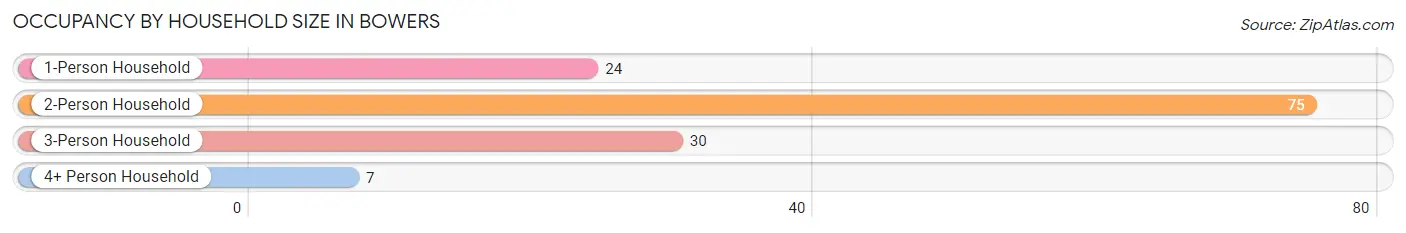
| Household Size | # Housing Units | % Housing Units |
| 1-Person Household | 24 | 17.6% |
| 2-Person Household | 75 | 55.1% |
| 3-Person Household | 30 | 22.1% |
| 4+ Person Household | 7 | 5.1% |
| Total Housing Units | 136 | 100.0% |
Occupancy by Ownership by Household Size in Bowers
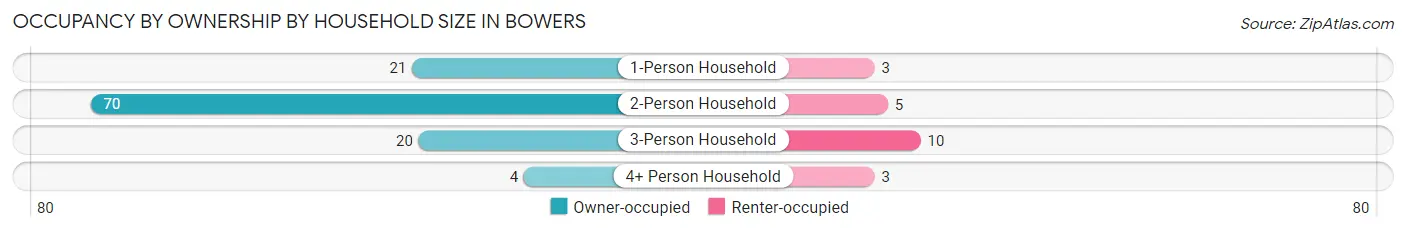
| Household Size | Owner-occupied | Renter-occupied |
| 1-Person Household | 21 (87.5%) | 3 (12.5%) |
| 2-Person Household | 70 (93.3%) | 5 (6.7%) |
| 3-Person Household | 20 (66.7%) | 10 (33.3%) |
| 4+ Person Household | 4 (57.1%) | 3 (42.9%) |
| Total Housing Units | 115 (84.6%) | 21 (15.4%) |
Occupancy by Educational Attainment in Bowers
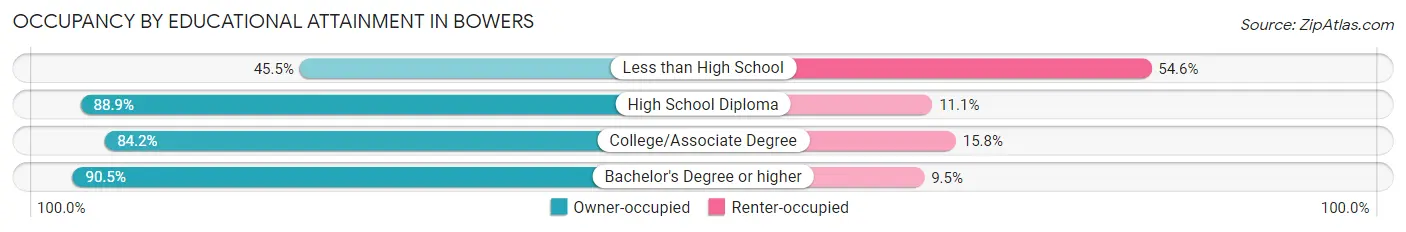
| Household Size | Owner-occupied | Renter-occupied |
| Less than High School | 5 (45.5%) | 6 (54.5%) |
| High School Diploma | 40 (88.9%) | 5 (11.1%) |
| College/Associate Degree | 32 (84.2%) | 6 (15.8%) |
| Bachelor's Degree or higher | 38 (90.5%) | 4 (9.5%) |
Occupancy by Age of Householder in Bowers
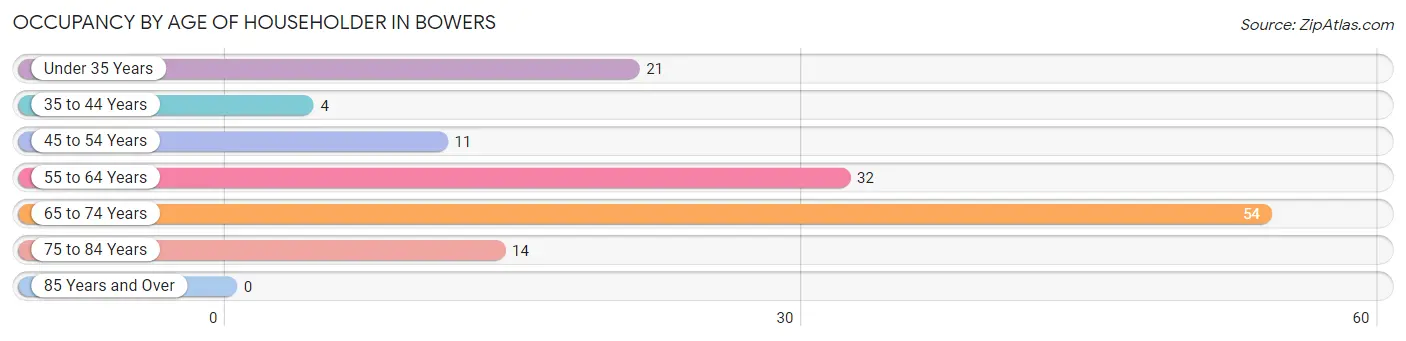
| Age Bracket | # Households | % Households |
| Under 35 Years | 21 | 15.4% |
| 35 to 44 Years | 4 | 2.9% |
| 45 to 54 Years | 11 | 8.1% |
| 55 to 64 Years | 32 | 23.5% |
| 65 to 74 Years | 54 | 39.7% |
| 75 to 84 Years | 14 | 10.3% |
| 85 Years and Over | 0 | 0.0% |
| Total | 136 | 100.0% |
Housing Finances in Bowers
Median Income by Occupancy in Bowers
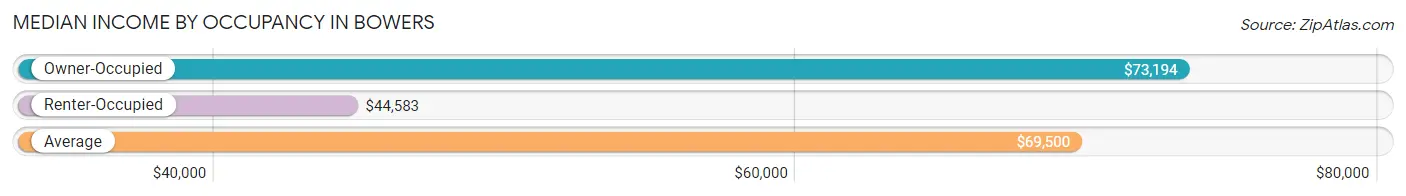
| Occupancy Type | # Households | Median Income |
| Owner-Occupied | 115 (84.6%) | $73,194 |
| Renter-Occupied | 21 (15.4%) | $44,583 |
| Average | 136 (100.0%) | $69,500 |
Occupancy by Householder Income Bracket in Bowers
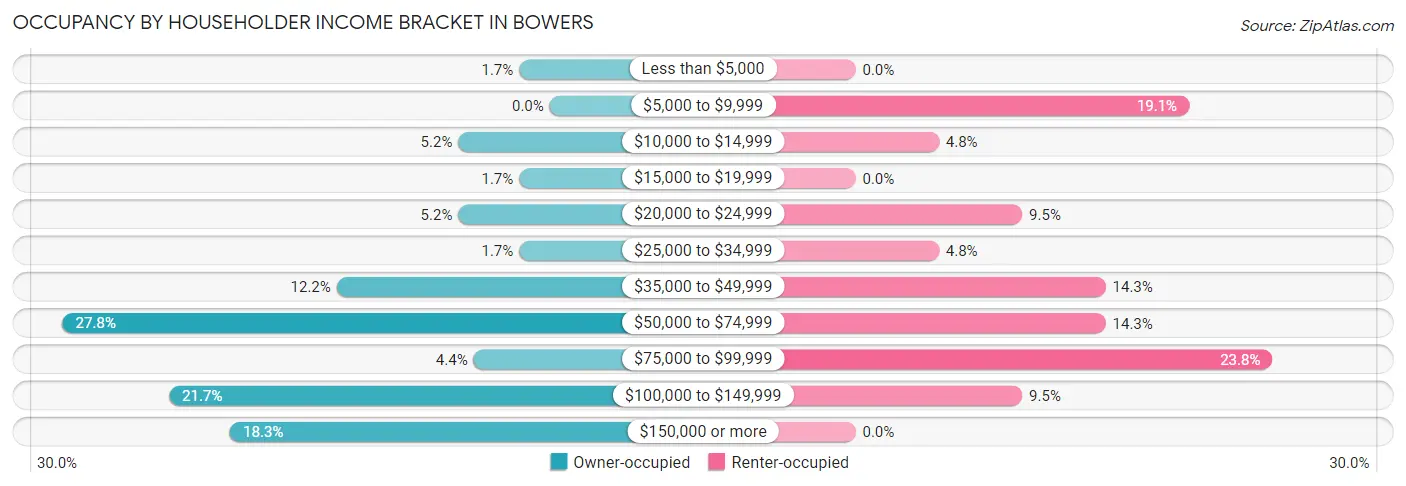
| Income Bracket | Owner-occupied | Renter-occupied |
| Less than $5,000 | 2 (1.7%) | 0 (0.0%) |
| $5,000 to $9,999 | 0 (0.0%) | 4 (19.1%) |
| $10,000 to $14,999 | 6 (5.2%) | 1 (4.8%) |
| $15,000 to $19,999 | 2 (1.7%) | 0 (0.0%) |
| $20,000 to $24,999 | 6 (5.2%) | 2 (9.5%) |
| $25,000 to $34,999 | 2 (1.7%) | 1 (4.8%) |
| $35,000 to $49,999 | 14 (12.2%) | 3 (14.3%) |
| $50,000 to $74,999 | 32 (27.8%) | 3 (14.3%) |
| $75,000 to $99,999 | 5 (4.3%) | 5 (23.8%) |
| $100,000 to $149,999 | 25 (21.7%) | 2 (9.5%) |
| $150,000 or more | 21 (18.3%) | 0 (0.0%) |
| Total | 115 (100.0%) | 21 (100.0%) |
Monthly Housing Cost Tiers in Bowers
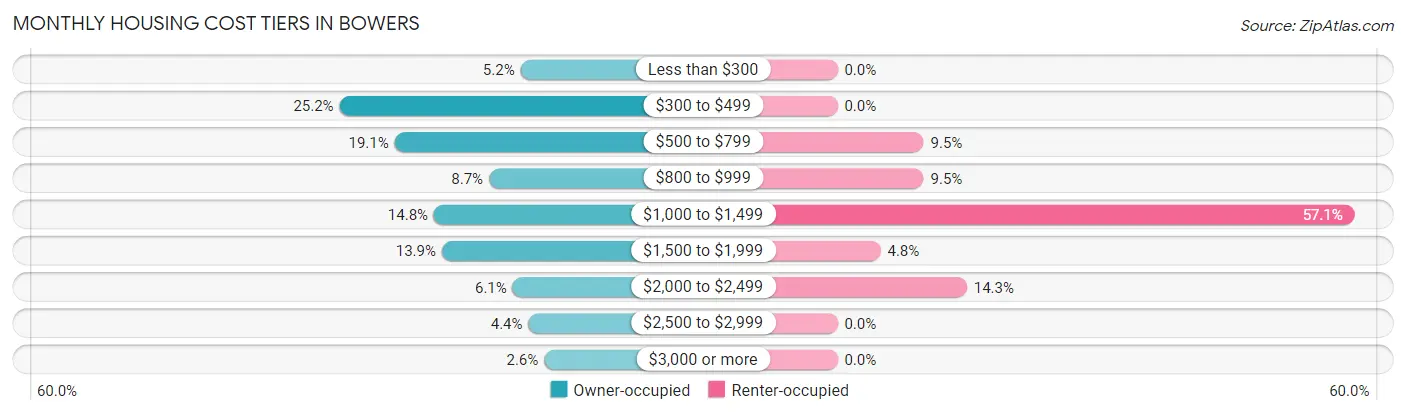
| Monthly Cost | Owner-occupied | Renter-occupied |
| Less than $300 | 6 (5.2%) | 0 (0.0%) |
| $300 to $499 | 29 (25.2%) | 0 (0.0%) |
| $500 to $799 | 22 (19.1%) | 2 (9.5%) |
| $800 to $999 | 10 (8.7%) | 2 (9.5%) |
| $1,000 to $1,499 | 17 (14.8%) | 12 (57.1%) |
| $1,500 to $1,999 | 16 (13.9%) | 1 (4.8%) |
| $2,000 to $2,499 | 7 (6.1%) | 3 (14.3%) |
| $2,500 to $2,999 | 5 (4.3%) | 0 (0.0%) |
| $3,000 or more | 3 (2.6%) | 0 (0.0%) |
| Total | 115 (100.0%) | 21 (100.0%) |
Physical Housing Characteristics in Bowers
Housing Structures in Bowers
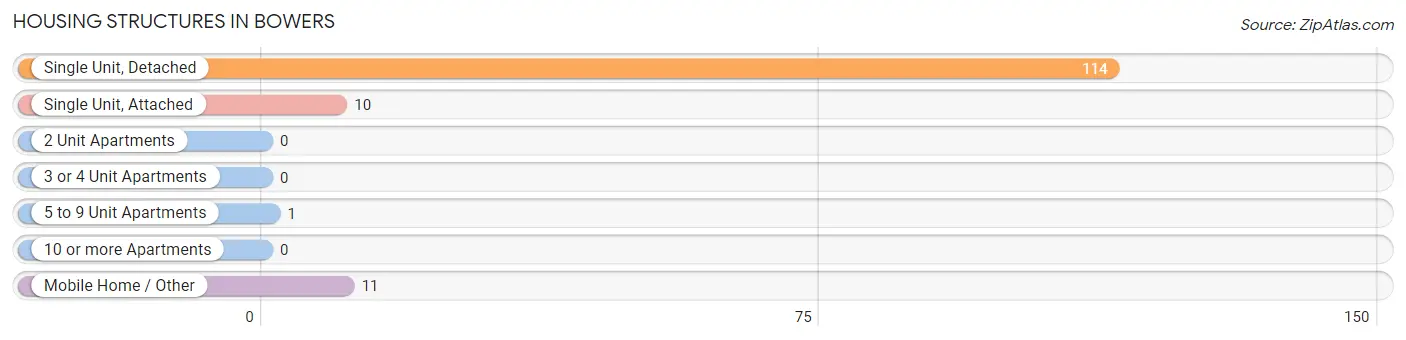
| Structure Type | # Housing Units | % Housing Units |
| Single Unit, Detached | 114 | 83.8% |
| Single Unit, Attached | 10 | 7.3% |
| 2 Unit Apartments | 0 | 0.0% |
| 3 or 4 Unit Apartments | 0 | 0.0% |
| 5 to 9 Unit Apartments | 1 | 0.7% |
| 10 or more Apartments | 0 | 0.0% |
| Mobile Home / Other | 11 | 8.1% |
| Total | 136 | 100.0% |
Housing Structures by Occupancy in Bowers
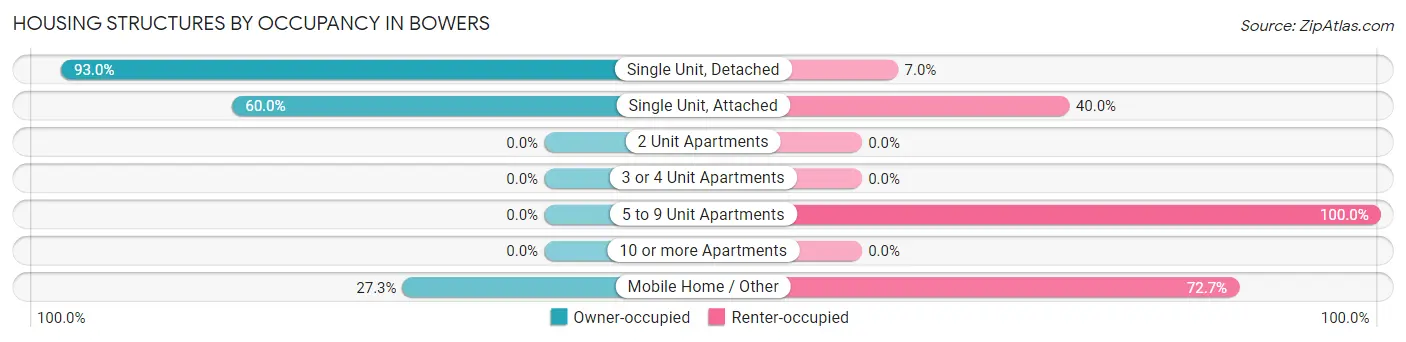
| Structure Type | Owner-occupied | Renter-occupied |
| Single Unit, Detached | 106 (93.0%) | 8 (7.0%) |
| Single Unit, Attached | 6 (60.0%) | 4 (40.0%) |
| 2 Unit Apartments | 0 (0.0%) | 0 (0.0%) |
| 3 or 4 Unit Apartments | 0 (0.0%) | 0 (0.0%) |
| 5 to 9 Unit Apartments | 0 (0.0%) | 1 (100.0%) |
| 10 or more Apartments | 0 (0.0%) | 0 (0.0%) |
| Mobile Home / Other | 3 (27.3%) | 8 (72.7%) |
| Total | 115 (84.6%) | 21 (15.4%) |
Housing Structures by Number of Rooms in Bowers
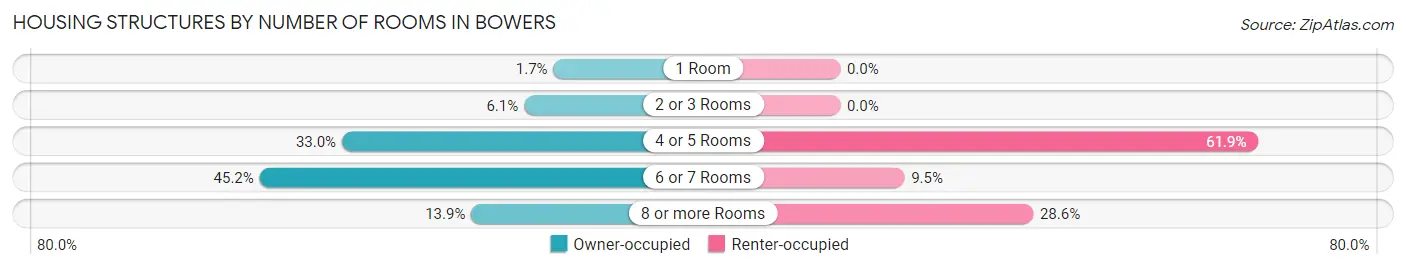
| Number of Rooms | Owner-occupied | Renter-occupied |
| 1 Room | 2 (1.7%) | 0 (0.0%) |
| 2 or 3 Rooms | 7 (6.1%) | 0 (0.0%) |
| 4 or 5 Rooms | 38 (33.0%) | 13 (61.9%) |
| 6 or 7 Rooms | 52 (45.2%) | 2 (9.5%) |
| 8 or more Rooms | 16 (13.9%) | 6 (28.6%) |
| Total | 115 (100.0%) | 21 (100.0%) |
Housing Structure by Heating Type in Bowers
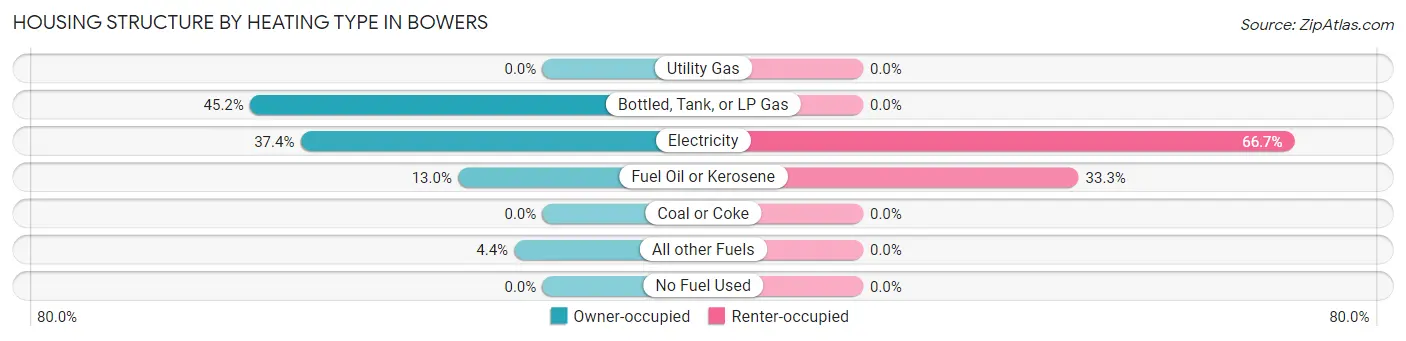
| Heating Type | Owner-occupied | Renter-occupied |
| Utility Gas | 0 (0.0%) | 0 (0.0%) |
| Bottled, Tank, or LP Gas | 52 (45.2%) | 0 (0.0%) |
| Electricity | 43 (37.4%) | 14 (66.7%) |
| Fuel Oil or Kerosene | 15 (13.0%) | 7 (33.3%) |
| Coal or Coke | 0 (0.0%) | 0 (0.0%) |
| All other Fuels | 5 (4.3%) | 0 (0.0%) |
| No Fuel Used | 0 (0.0%) | 0 (0.0%) |
| Total | 115 (100.0%) | 21 (100.0%) |
Household Vehicle Usage in Bowers
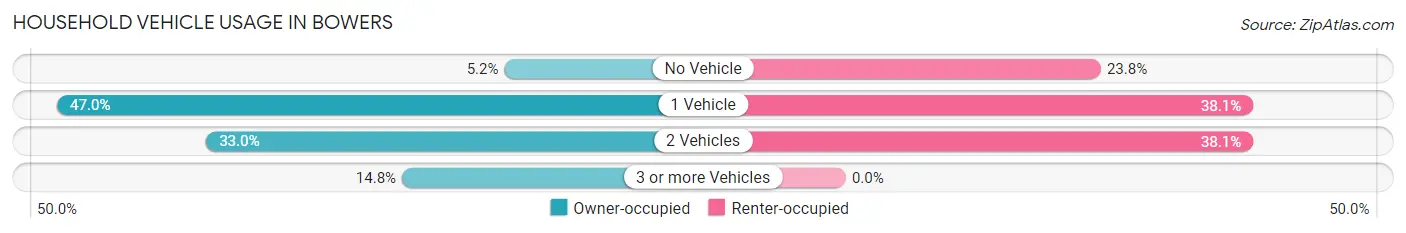
| Vehicles per Household | Owner-occupied | Renter-occupied |
| No Vehicle | 6 (5.2%) | 5 (23.8%) |
| 1 Vehicle | 54 (47.0%) | 8 (38.1%) |
| 2 Vehicles | 38 (33.0%) | 8 (38.1%) |
| 3 or more Vehicles | 17 (14.8%) | 0 (0.0%) |
| Total | 115 (100.0%) | 21 (100.0%) |
Real Estate & Mortgages in Bowers
Real Estate and Mortgage Overview in Bowers
| Characteristic | Without Mortgage | With Mortgage |
| Housing Units | 66 | 49 |
| Median Property Value | $250,000 | $265,900 |
| Median Household Income | $62,500 | $17 |
| Monthly Housing Costs | $488 | $3 |
| Real Estate Taxes | $1,213 | $4 |
Property Value by Mortgage Status in Bowers
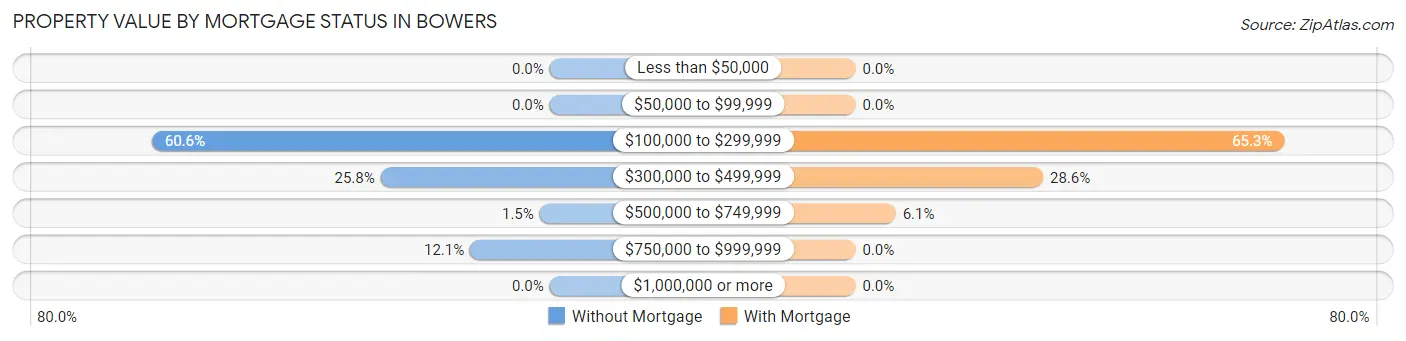
| Property Value | Without Mortgage | With Mortgage |
| Less than $50,000 | 0 (0.0%) | 0 (0.0%) |
| $50,000 to $99,999 | 0 (0.0%) | 0 (0.0%) |
| $100,000 to $299,999 | 40 (60.6%) | 32 (65.3%) |
| $300,000 to $499,999 | 17 (25.8%) | 14 (28.6%) |
| $500,000 to $749,999 | 1 (1.5%) | 3 (6.1%) |
| $750,000 to $999,999 | 8 (12.1%) | 0 (0.0%) |
| $1,000,000 or more | 0 (0.0%) | 0 (0.0%) |
| Total | 66 (100.0%) | 49 (100.0%) |
Household Income by Mortgage Status in Bowers
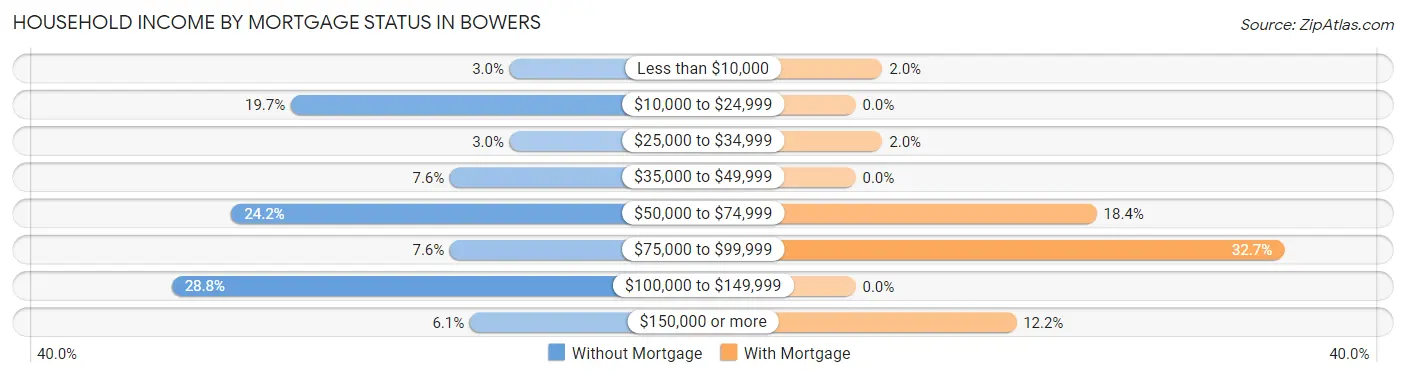
| Household Income | Without Mortgage | With Mortgage |
| Less than $10,000 | 2 (3.0%) | 1 (2.0%) |
| $10,000 to $24,999 | 13 (19.7%) | 0 (0.0%) |
| $25,000 to $34,999 | 2 (3.0%) | 1 (2.0%) |
| $35,000 to $49,999 | 5 (7.6%) | 0 (0.0%) |
| $50,000 to $74,999 | 16 (24.2%) | 9 (18.4%) |
| $75,000 to $99,999 | 5 (7.6%) | 16 (32.7%) |
| $100,000 to $149,999 | 19 (28.8%) | 0 (0.0%) |
| $150,000 or more | 4 (6.1%) | 6 (12.2%) |
| Total | 66 (100.0%) | 49 (100.0%) |
Property Value to Household Income Ratio in Bowers
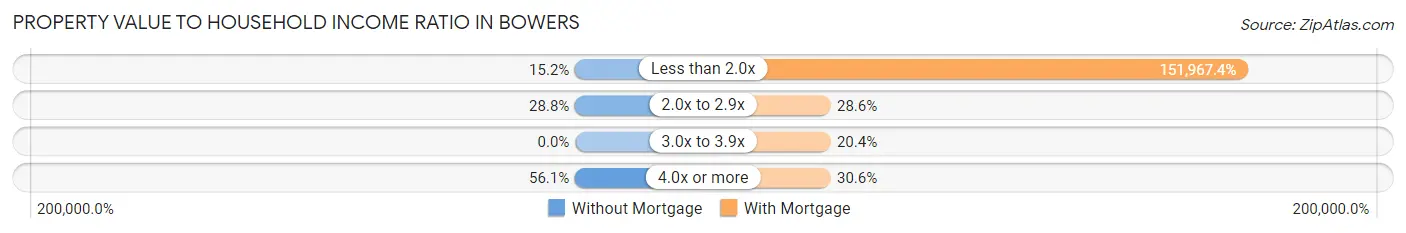
| Value-to-Income Ratio | Without Mortgage | With Mortgage |
| Less than 2.0x | 10 (15.1%) | 74,464 (151,967.4%) |
| 2.0x to 2.9x | 19 (28.8%) | 14 (28.6%) |
| 3.0x to 3.9x | 0 (0.0%) | 10 (20.4%) |
| 4.0x or more | 37 (56.1%) | 15 (30.6%) |
| Total | 66 (100.0%) | 49 (100.0%) |
Real Estate Taxes by Mortgage Status in Bowers
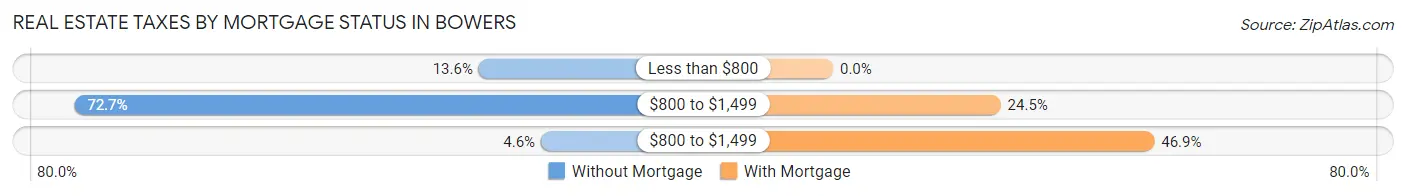
| Property Taxes | Without Mortgage | With Mortgage |
| Less than $800 | 9 (13.6%) | 0 (0.0%) |
| $800 to $1,499 | 48 (72.7%) | 12 (24.5%) |
| $800 to $1,499 | 3 (4.5%) | 23 (46.9%) |
| Total | 66 (100.0%) | 49 (100.0%) |
Health & Disability in Bowers
Health Insurance Coverage by Age in Bowers
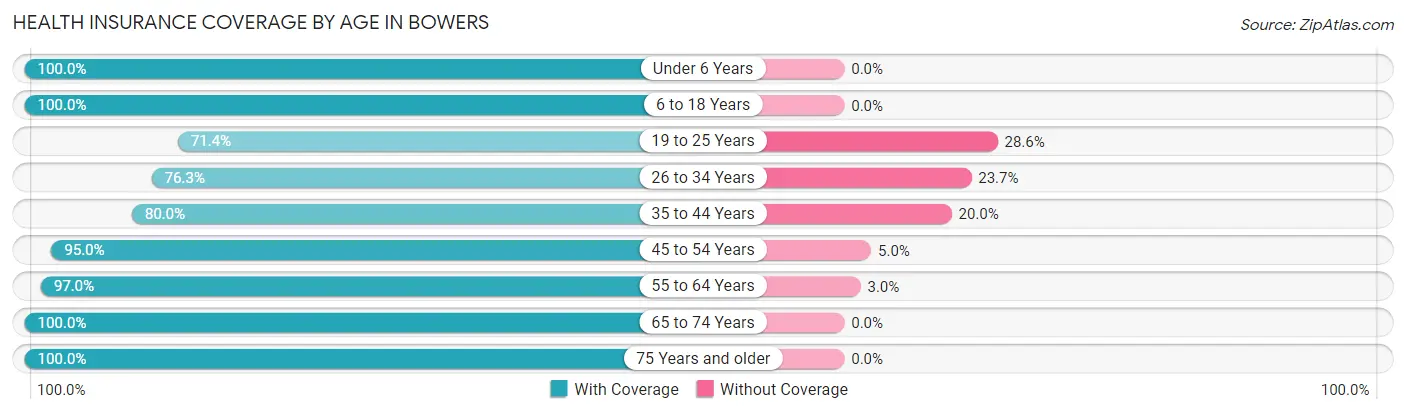
| Age Bracket | With Coverage | Without Coverage |
| Under 6 Years | 7 (100.0%) | 0 (0.0%) |
| 6 to 18 Years | 34 (100.0%) | 0 (0.0%) |
| 19 to 25 Years | 5 (71.4%) | 2 (28.6%) |
| 26 to 34 Years | 29 (76.3%) | 9 (23.7%) |
| 35 to 44 Years | 16 (80.0%) | 4 (20.0%) |
| 45 to 54 Years | 19 (95.0%) | 1 (5.0%) |
| 55 to 64 Years | 64 (97.0%) | 2 (3.0%) |
| 65 to 74 Years | 78 (100.0%) | 0 (0.0%) |
| 75 Years and older | 66 (100.0%) | 0 (0.0%) |
| Total | 318 (94.6%) | 18 (5.4%) |
Health Insurance Coverage by Citizenship Status in Bowers
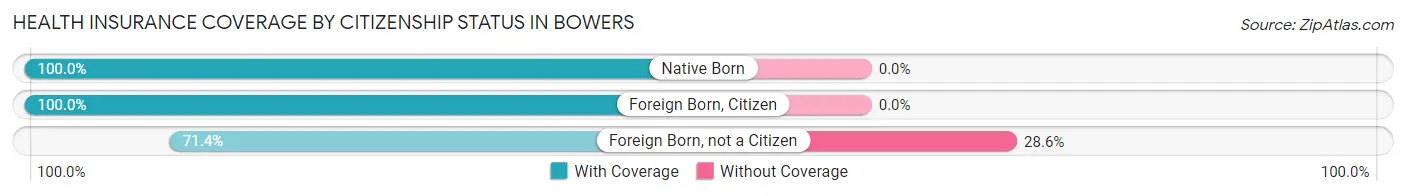
| Citizenship Status | With Coverage | Without Coverage |
| Native Born | 7 (100.0%) | 0 (0.0%) |
| Foreign Born, Citizen | 34 (100.0%) | 0 (0.0%) |
| Foreign Born, not a Citizen | 5 (71.4%) | 2 (28.6%) |
Health Insurance Coverage by Household Income in Bowers
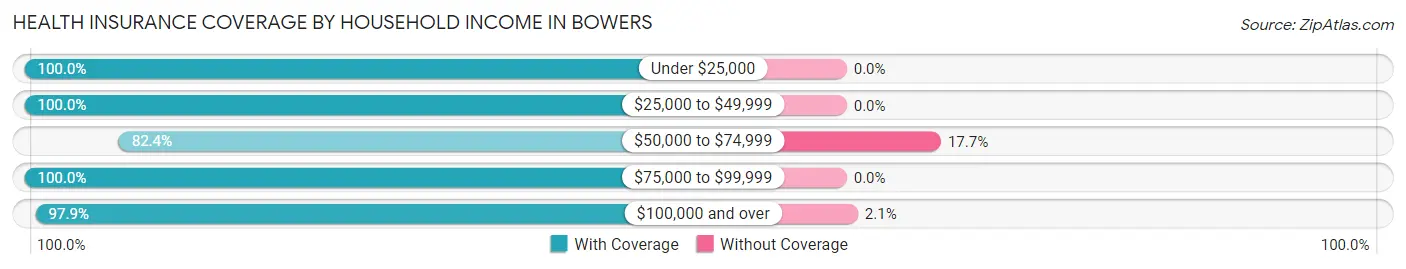
| Household Income | With Coverage | Without Coverage |
| Under $25,000 | 49 (100.0%) | 0 (0.0%) |
| $25,000 to $49,999 | 35 (100.0%) | 0 (0.0%) |
| $50,000 to $74,999 | 70 (82.4%) | 15 (17.6%) |
| $75,000 to $99,999 | 23 (100.0%) | 0 (0.0%) |
| $100,000 and over | 141 (97.9%) | 3 (2.1%) |
Public vs Private Health Insurance Coverage by Age in Bowers
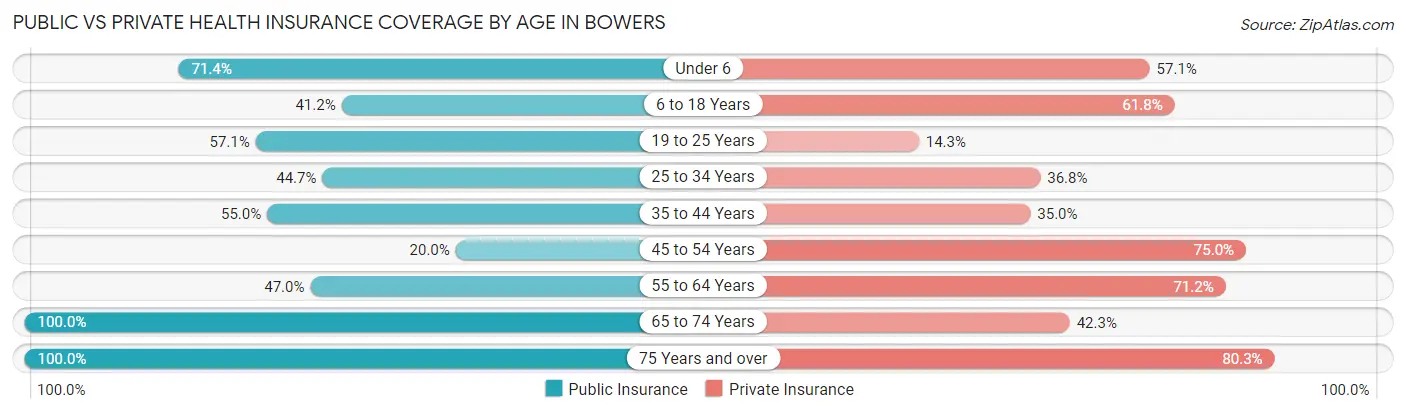
| Age Bracket | Public Insurance | Private Insurance |
| Under 6 | 5 (71.4%) | 4 (57.1%) |
| 6 to 18 Years | 14 (41.2%) | 21 (61.8%) |
| 19 to 25 Years | 4 (57.1%) | 1 (14.3%) |
| 25 to 34 Years | 17 (44.7%) | 14 (36.8%) |
| 35 to 44 Years | 11 (55.0%) | 7 (35.0%) |
| 45 to 54 Years | 4 (20.0%) | 15 (75.0%) |
| 55 to 64 Years | 31 (47.0%) | 47 (71.2%) |
| 65 to 74 Years | 78 (100.0%) | 33 (42.3%) |
| 75 Years and over | 66 (100.0%) | 53 (80.3%) |
| Total | 230 (68.4%) | 195 (58.0%) |
Disability Status by Sex by Age in Bowers
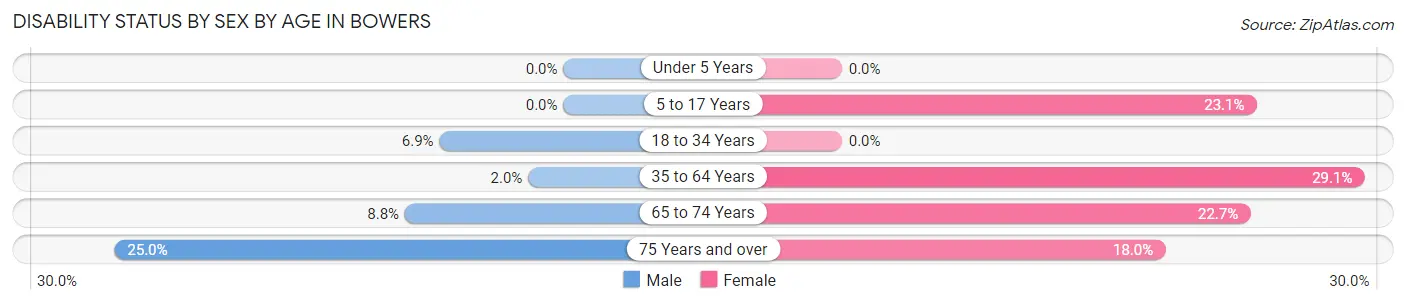
| Age Bracket | Male | Female |
| Under 5 Years | 0 (0.0%) | 0 (0.0%) |
| 5 to 17 Years | 0 (0.0%) | 3 (23.1%) |
| 18 to 34 Years | 2 (6.9%) | 0 (0.0%) |
| 35 to 64 Years | 1 (2.0%) | 16 (29.1%) |
| 65 to 74 Years | 3 (8.8%) | 10 (22.7%) |
| 75 Years and over | 4 (25.0%) | 9 (18.0%) |
Disability Class by Sex by Age in Bowers
Disability Class: Hearing Difficulty
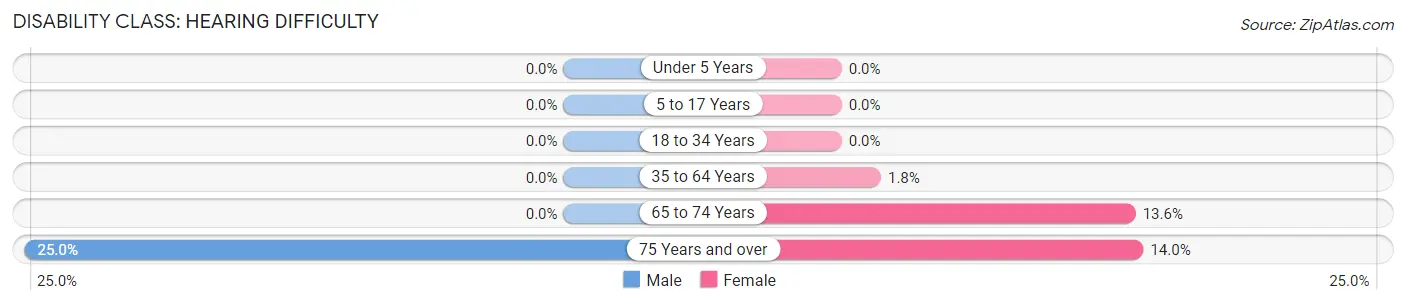
| Age Bracket | Male | Female |
| Under 5 Years | 0 (0.0%) | 0 (0.0%) |
| 5 to 17 Years | 0 (0.0%) | 0 (0.0%) |
| 18 to 34 Years | 0 (0.0%) | 0 (0.0%) |
| 35 to 64 Years | 0 (0.0%) | 1 (1.8%) |
| 65 to 74 Years | 0 (0.0%) | 6 (13.6%) |
| 75 Years and over | 4 (25.0%) | 7 (14.0%) |
Disability Class: Vision Difficulty
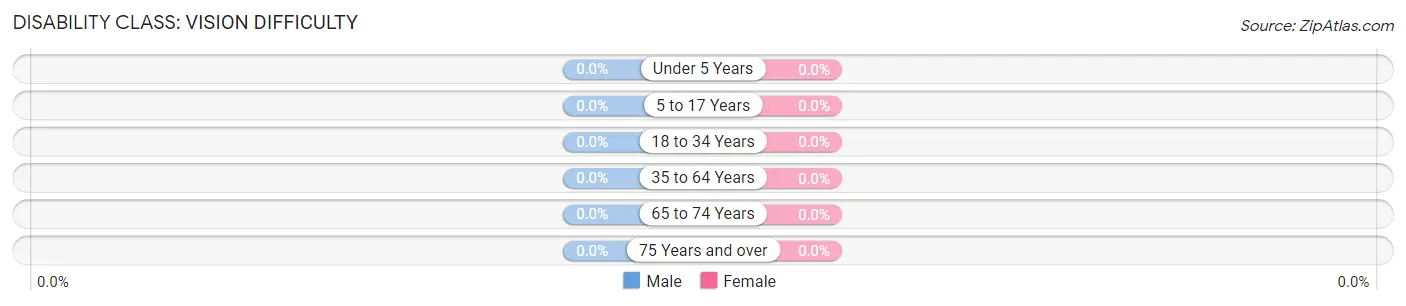
| Age Bracket | Male | Female |
| Under 5 Years | 0 (0.0%) | 0 (0.0%) |
| 5 to 17 Years | 0 (0.0%) | 0 (0.0%) |
| 18 to 34 Years | 0 (0.0%) | 0 (0.0%) |
| 35 to 64 Years | 0 (0.0%) | 0 (0.0%) |
| 65 to 74 Years | 0 (0.0%) | 0 (0.0%) |
| 75 Years and over | 0 (0.0%) | 0 (0.0%) |
Disability Class: Cognitive Difficulty
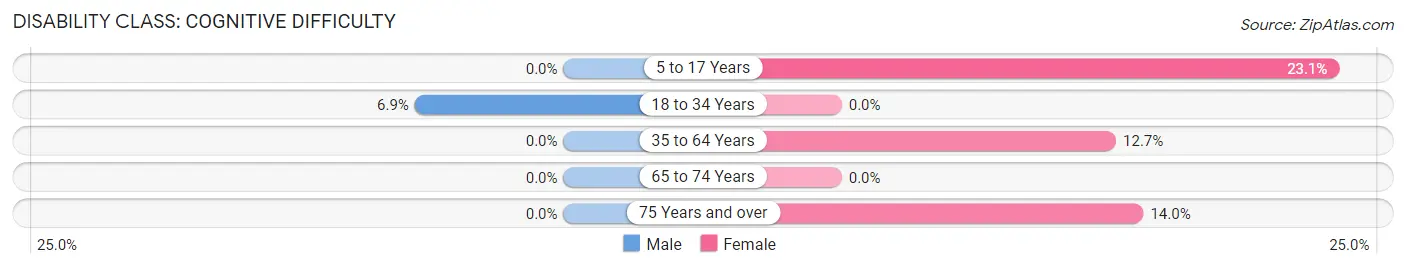
| Age Bracket | Male | Female |
| 5 to 17 Years | 0 (0.0%) | 3 (23.1%) |
| 18 to 34 Years | 2 (6.9%) | 0 (0.0%) |
| 35 to 64 Years | 0 (0.0%) | 7 (12.7%) |
| 65 to 74 Years | 0 (0.0%) | 0 (0.0%) |
| 75 Years and over | 0 (0.0%) | 7 (14.0%) |
Disability Class: Ambulatory Difficulty
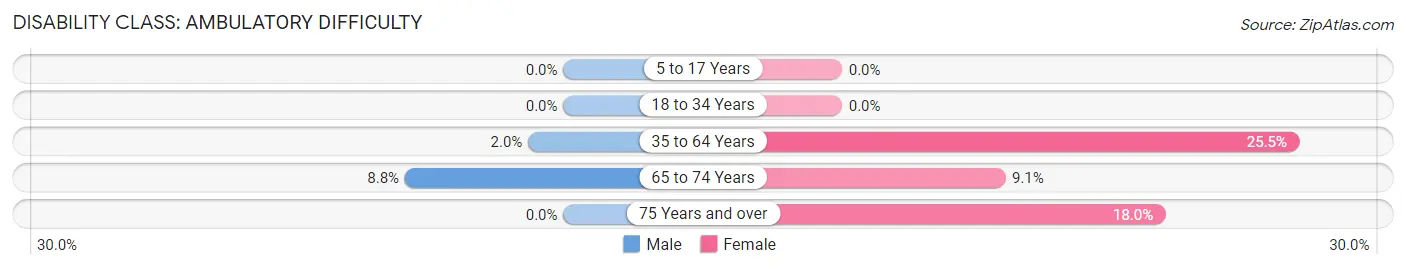
| Age Bracket | Male | Female |
| 5 to 17 Years | 0 (0.0%) | 0 (0.0%) |
| 18 to 34 Years | 0 (0.0%) | 0 (0.0%) |
| 35 to 64 Years | 1 (2.0%) | 14 (25.5%) |
| 65 to 74 Years | 3 (8.8%) | 4 (9.1%) |
| 75 Years and over | 0 (0.0%) | 9 (18.0%) |
Disability Class: Self-Care Difficulty
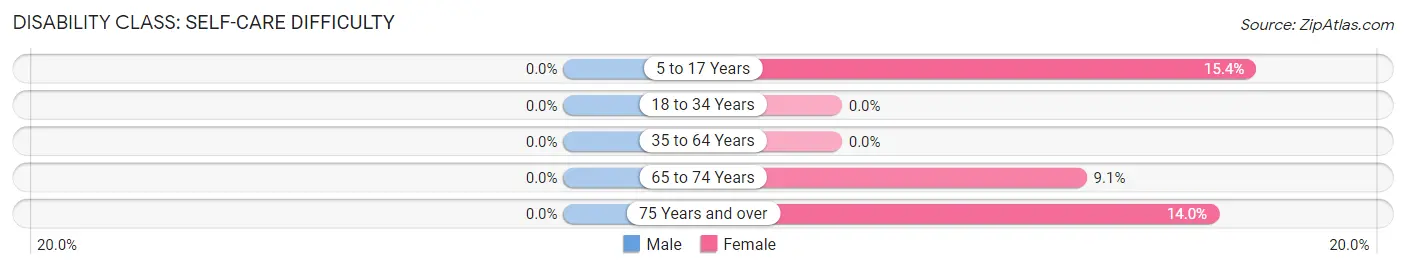
| Age Bracket | Male | Female |
| 5 to 17 Years | 0 (0.0%) | 2 (15.4%) |
| 18 to 34 Years | 0 (0.0%) | 0 (0.0%) |
| 35 to 64 Years | 0 (0.0%) | 0 (0.0%) |
| 65 to 74 Years | 0 (0.0%) | 4 (9.1%) |
| 75 Years and over | 0 (0.0%) | 7 (14.0%) |
Technology Access in Bowers
Computing Device Access in Bowers
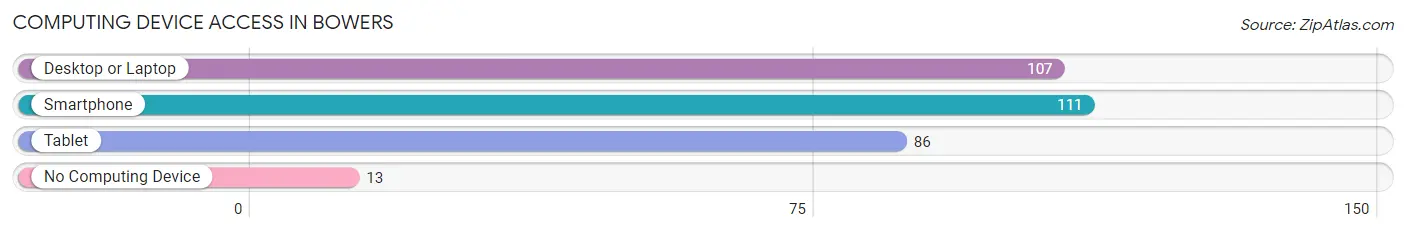
| Device Type | # Households | % Households |
| Desktop or Laptop | 107 | 78.7% |
| Smartphone | 111 | 81.6% |
| Tablet | 86 | 63.2% |
| No Computing Device | 13 | 9.6% |
| Total | 136 | 100.0% |
Internet Access in Bowers
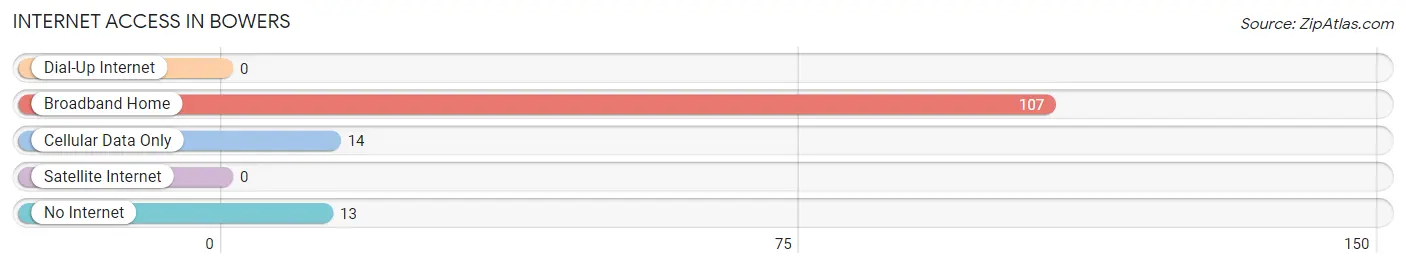
| Internet Type | # Households | % Households |
| Dial-Up Internet | 0 | 0.0% |
| Broadband Home | 107 | 78.7% |
| Cellular Data Only | 14 | 10.3% |
| Satellite Internet | 0 | 0.0% |
| No Internet | 13 | 9.6% |
| Total | 136 | 100.0% |
Bowers Summary
DE History
Delaware is one of the original 13 colonies and was the first state to ratify the Constitution in 1787. The state was originally inhabited by Native American tribes, including the Lenape, Nanticoke, and Susquehannock. The first European settlers arrived in the early 1600s, led by Dutch and Swedish explorers. The Dutch established the first permanent settlement in 1631, and the area was later taken over by the English in 1664. The colony of Delaware was established in 1703, and the state was named after the Delaware River, which was named after Thomas West, the 3rd Baron De La Warr.
During the American Revolution, Delaware was a major supplier of gunpowder and other supplies to the Continental Army. After the war, the state became a major center of commerce and industry, with the port of Wilmington becoming a major hub for trade. In the 19th century, Delaware was a major producer of iron and steel, and the state was also home to several large shipbuilding companies.
DE Geography
Delaware is located in the Mid-Atlantic region of the United States, bordered by Pennsylvania to the north, Maryland to the south, and the Atlantic Ocean to the east. The state is divided into three counties: New Castle, Kent, and Sussex. The state has a total area of 1,954 square miles, making it the second smallest state in the country.
The state is mostly flat, with the highest point being Ebright Azimuth, which is located in New Castle County and has an elevation of 447 feet. The state is home to several rivers, including the Delaware River, which forms the eastern border of the state. The state also has several lakes, including Silver Lake, which is located in Kent County.
DE Economy
Delaware has a diverse economy, with the largest sectors being finance, manufacturing, and tourism. The state is home to several large financial institutions, including Bank of America, JPMorgan Chase, and Citigroup. The state is also home to several large manufacturing companies, including DuPont, AstraZeneca, and W.L. Gore & Associates.
The state is also a major tourist destination, with the beaches of Rehoboth and Dewey being popular destinations. The state also has several historical sites, including the First State National Historical Park and the Fort Delaware State Park.
DE Demographics
As of 2019, Delaware had a population of 973,764, making it the 45th most populous state in the country. The state has a population density of 545 people per square mile, making it the 8th most densely populated state in the country. The state is home to a diverse population, with the largest ethnic groups being White (63.2%), Black or African American (21.2%), and Hispanic or Latino (9.7%).
The median household income in Delaware is $62,852, and the median home value is $239,400. The state has a poverty rate of 11.2%, and the unemployment rate is 4.2%. The largest cities in the state are Wilmington, Dover, and Newark.
Common Questions
What is the Total Population of Bowers?
Total Population of Bowers is 336.
What is the Total Male Population of Bowers?
Total Male Population of Bowers is 136.
What is the Total Female Population of Bowers?
Total Female Population of Bowers is 200.
What is the Ratio of Males per 100 Females in Bowers?
There are 68.00 Males per 100 Females in Bowers.
What is the Ratio of Females per 100 Males in Bowers?
There are 147.06 Females per 100 Males in Bowers.
What is the Median Population Age in Bowers?
Median Population Age in Bowers is 61.8 Years.
What is the Average Family Size in Bowers
Average Family Size in Bowers is 2.8 People.
What is the Average Household Size in Bowers
Average Household Size in Bowers is 2.5 People.
What is Per Capita Income in Bowers?
Per Capita income in Bowers is $40,410.
What is the Median Family Income in Bowers?
Median Family Income in Bowers is $80,714.
What is the Median Household income in Bowers?
Median Household Income in Bowers is $69,500.
What is Income or Wage Gap in Bowers?
Income or Wage Gap in Bowers is 38.6%.
Women in Bowers earn 61.4 cents for every dollar earned by a man.
What is Inequality or Gini Index in Bowers?
Inequality or Gini Index in Bowers is 0.40.
How Large is the Labor Force in Bowers?
There are 112 People in the Labor Forcein in Bowers.
What is the Percentage of People in the Labor Force in Bowers?
35.3% of People are in the Labor Force in Bowers.
What is the Unemployment Rate in Bowers?
Unemployment Rate in Bowers is 8.9%.