Lewes, DE
Lewes Map
Lewes Overview
3,339
TOTAL POPULATION
1,686
MALE POPULATION
1,653
FEMALE POPULATION
102.00
MALES / 100 FEMALES
98.04
FEMALES / 100 MALES
66.5
MEDIAN AGE
2.2
AVG FAMILY SIZE
2.0
AVG HOUSEHOLD SIZE
$63,941
PER CAPITA INCOME
$112,969
AVG FAMILY INCOME
$87,458
AVG HOUSEHOLD INCOME
30.4%
WAGE / INCOME GAP [ % ]
69.6¢/ $1
WAGE / INCOME GAP [ $ ]
0.46
INEQUALITY / GINI INDEX
1,198
LABOR FORCE [ PEOPLE ]
38.1%
PERCENT IN LABOR FORCE
1.0%
UNEMPLOYMENT RATE
Lewes Zip Codes
Lewes Area Codes
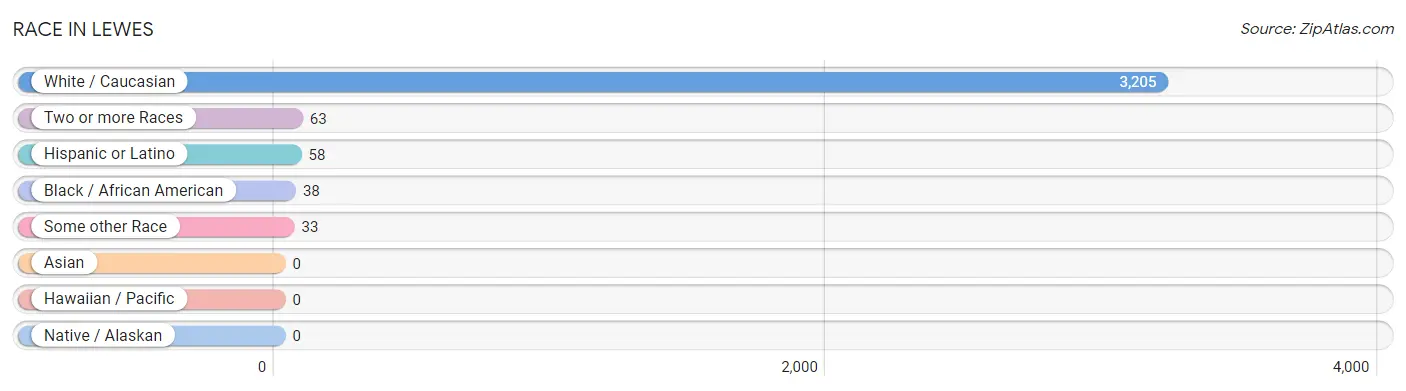
Race in Lewes
The most populous races in Lewes are White / Caucasian (3,205 | 96.0%), Two or more Races (63 | 1.9%), and Hispanic or Latino (58 | 1.7%).
| Race | # Population | % Population |
| Asian | 0 | 0.0% |
| Black / African American | 38 | 1.1% |
| Hawaiian / Pacific | 0 | 0.0% |
| Hispanic or Latino | 58 | 1.7% |
| Native / Alaskan | 0 | 0.0% |
| White / Caucasian | 3,205 | 96.0% |
| Two or more Races | 63 | 1.9% |
| Some other Race | 33 | 1.0% |
| Total | 3,339 | 100.0% |
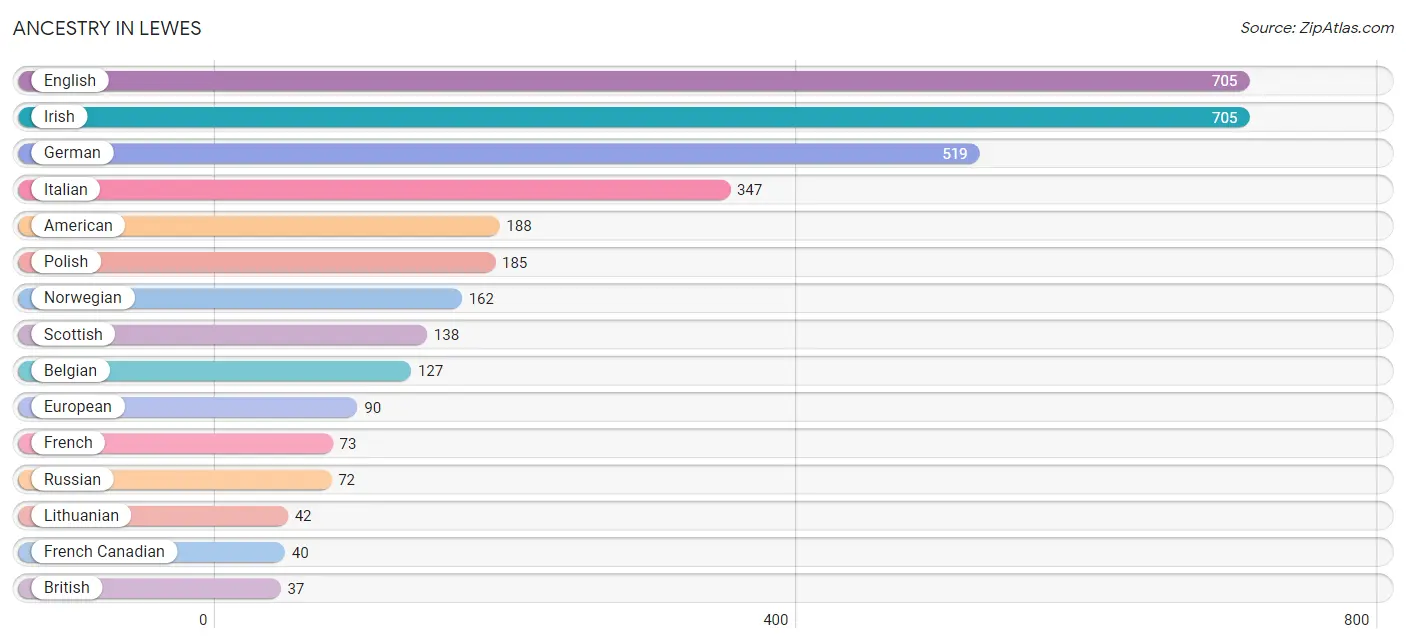
Ancestry in Lewes
The most populous ancestries reported in Lewes are English (705 | 21.1%), Irish (705 | 21.1%), German (519 | 15.5%), Italian (347 | 10.4%), and American (188 | 5.6%), together accounting for 73.8% of all Lewes residents.
| Ancestry | # Population | % Population |
| American | 188 | 5.6% |
| Belgian | 127 | 3.8% |
| British | 37 | 1.1% |
| Burmese | 3 | 0.1% |
| Cuban | 6 | 0.2% |
| Czech | 8 | 0.2% |
| Danish | 8 | 0.2% |
| Dutch | 23 | 0.7% |
| Eastern European | 8 | 0.2% |
| Ecuadorian | 33 | 1.0% |
| English | 705 | 21.1% |
| European | 90 | 2.7% |
| French | 73 | 2.2% |
| French Canadian | 40 | 1.2% |
| German | 519 | 15.5% |
| Hungarian | 26 | 0.8% |
| Irish | 705 | 21.1% |
| Italian | 347 | 10.4% |
| Latvian | 13 | 0.4% |
| Lithuanian | 42 | 1.3% |
| Mexican | 10 | 0.3% |
| Norwegian | 162 | 4.9% |
| Pennsylvania German | 13 | 0.4% |
| Polish | 185 | 5.5% |
| Russian | 72 | 2.2% |
| Scotch-Irish | 14 | 0.4% |
| Scottish | 138 | 4.1% |
| Slovak | 16 | 0.5% |
| South American | 33 | 1.0% |
| Spanish | 5 | 0.2% |
| Swedish | 24 | 0.7% |
| Swiss | 22 | 0.7% |
| Ukrainian | 7 | 0.2% |
| Welsh | 13 | 0.4% | View All 34 Rows |
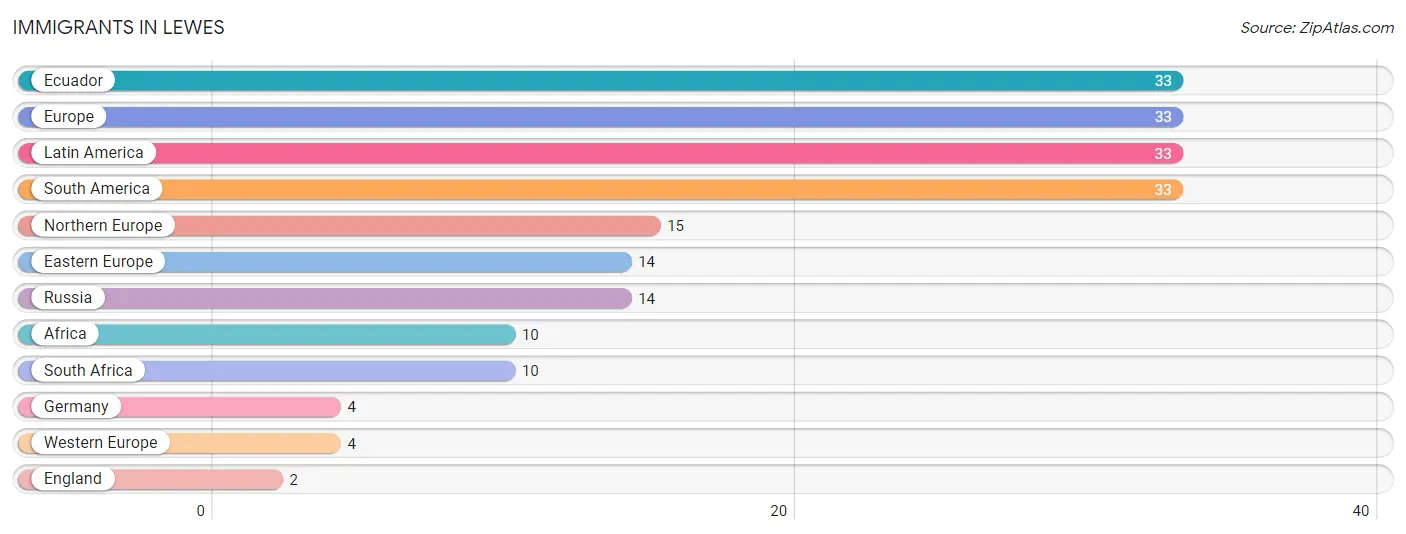
Immigrants in Lewes
The most numerous immigrant groups reported in Lewes came from Ecuador (33 | 1.0%), Europe (33 | 1.0%), Latin America (33 | 1.0%), South America (33 | 1.0%), and Northern Europe (15 | 0.4%), together accounting for 4.4% of all Lewes residents.
| Immigration Origin | # Population | % Population |
| Africa | 10 | 0.3% |
| Eastern Europe | 14 | 0.4% |
| Ecuador | 33 | 1.0% |
| England | 2 | 0.1% |
| Europe | 33 | 1.0% |
| Germany | 4 | 0.1% |
| Latin America | 33 | 1.0% |
| Northern Europe | 15 | 0.4% |
| Russia | 14 | 0.4% |
| South Africa | 10 | 0.3% |
| South America | 33 | 1.0% |
| Western Europe | 4 | 0.1% | View All 12 Rows |
Sex and Age in Lewes
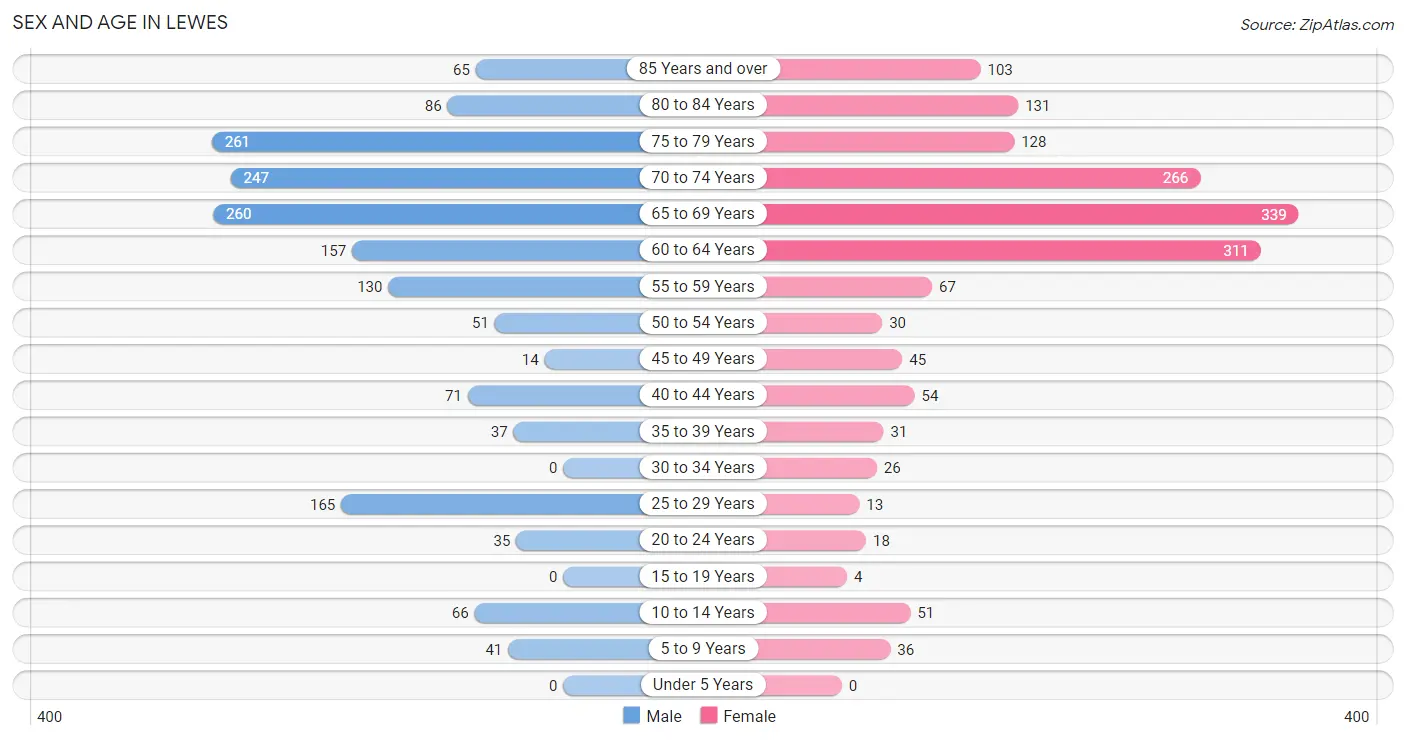
Sex and Age in Lewes
The most populous age groups in Lewes are 75 to 79 Years (261 | 15.5%) for men and 65 to 69 Years (339 | 20.5%) for women.
| Age Bracket | Male | Female |
| Under 5 Years | 0 (0.0%) | 0 (0.0%) |
| 5 to 9 Years | 41 (2.4%) | 36 (2.2%) |
| 10 to 14 Years | 66 (3.9%) | 51 (3.1%) |
| 15 to 19 Years | 0 (0.0%) | 4 (0.2%) |
| 20 to 24 Years | 35 (2.1%) | 18 (1.1%) |
| 25 to 29 Years | 165 (9.8%) | 13 (0.8%) |
| 30 to 34 Years | 0 (0.0%) | 26 (1.6%) |
| 35 to 39 Years | 37 (2.2%) | 31 (1.9%) |
| 40 to 44 Years | 71 (4.2%) | 54 (3.3%) |
| 45 to 49 Years | 14 (0.8%) | 45 (2.7%) |
| 50 to 54 Years | 51 (3.0%) | 30 (1.8%) |
| 55 to 59 Years | 130 (7.7%) | 67 (4.1%) |
| 60 to 64 Years | 157 (9.3%) | 311 (18.8%) |
| 65 to 69 Years | 260 (15.4%) | 339 (20.5%) |
| 70 to 74 Years | 247 (14.6%) | 266 (16.1%) |
| 75 to 79 Years | 261 (15.5%) | 128 (7.7%) |
| 80 to 84 Years | 86 (5.1%) | 131 (7.9%) |
| 85 Years and over | 65 (3.9%) | 103 (6.2%) |
| Total | 1,686 (100.0%) | 1,653 (100.0%) |
Families and Households in Lewes
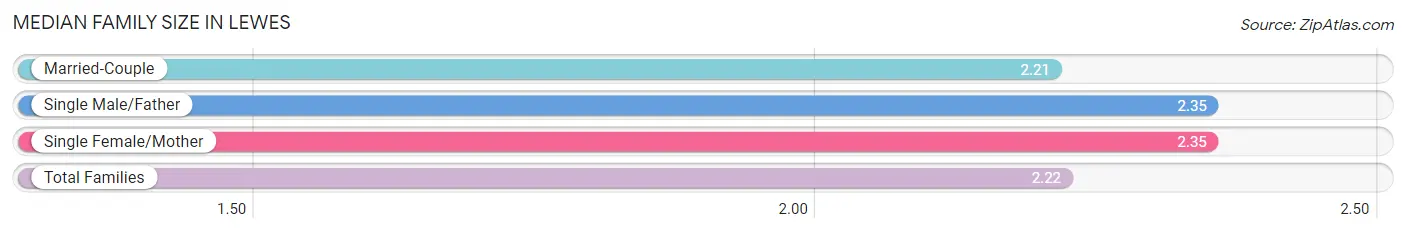
Median Family Size in Lewes
The median family size in Lewes is 2.22 persons per family, with single male/father families (31 | 2.7%) accounting for the largest median family size of 2.35 persons per family. On the other hand, married-couple families (1,043 | 91.7%) represent the smallest median family size with 2.21 persons per family.
| Family Type | # Families | Family Size |
| Married-Couple | 1,043 (91.7%) | 2.21 |
| Single Male/Father | 31 (2.7%) | 2.35 |
| Single Female/Mother | 63 (5.5%) | 2.35 |
| Total Families | 1,137 (100.0%) | 2.22 |
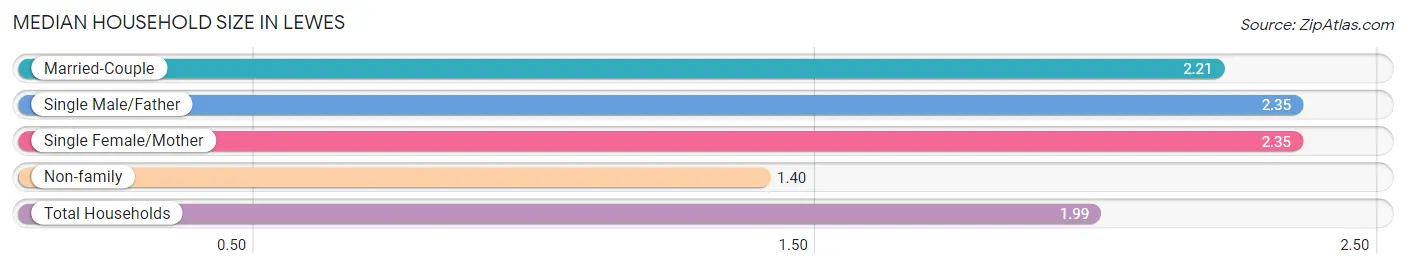
Median Household Size in Lewes
The median household size in Lewes is 1.99 persons per household, with single male/father households (31 | 1.9%) accounting for the largest median household size of 2.35 persons per household. non-family households (454 | 28.5%) represent the smallest median household size with 1.40 persons per household.
| Household Type | # Households | Household Size |
| Married-Couple | 1,043 (65.6%) | 2.21 |
| Single Male/Father | 31 (1.9%) | 2.35 |
| Single Female/Mother | 63 (4.0%) | 2.35 |
| Non-family | 454 (28.5%) | 1.40 |
| Total Households | 1,591 (100.0%) | 1.99 |
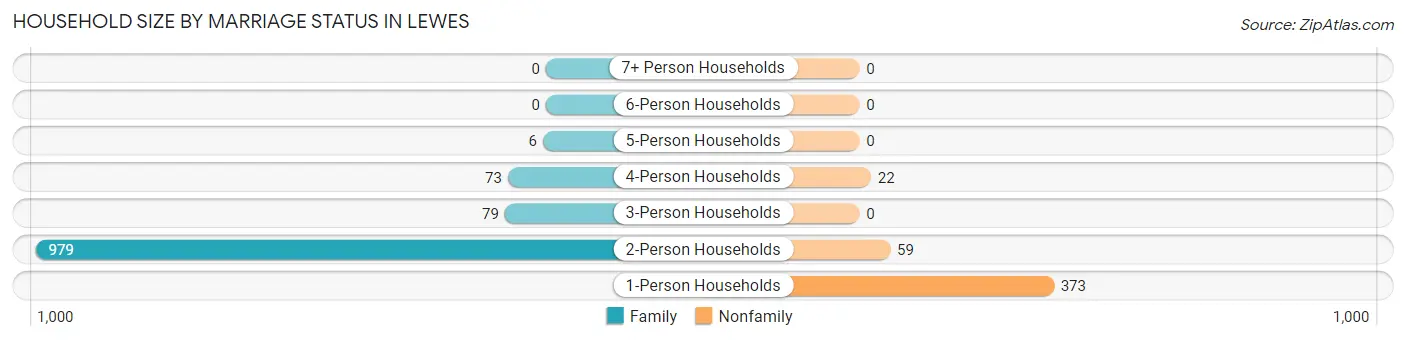
Household Size by Marriage Status in Lewes
Out of a total of 1,591 households in Lewes, 1,137 (71.5%) are family households, while 454 (28.5%) are nonfamily households. The most numerous type of family households are 2-person households, comprising 979, and the most common type of nonfamily households are 1-person households, comprising 373.
| Household Size | Family Households | Nonfamily Households |
| 1-Person Households | - | 373 (23.4%) |
| 2-Person Households | 979 (61.5%) | 59 (3.7%) |
| 3-Person Households | 79 (5.0%) | 0 (0.0%) |
| 4-Person Households | 73 (4.6%) | 22 (1.4%) |
| 5-Person Households | 6 (0.4%) | 0 (0.0%) |
| 6-Person Households | 0 (0.0%) | 0 (0.0%) |
| 7+ Person Households | 0 (0.0%) | 0 (0.0%) |
| Total | 1,137 (71.5%) | 454 (28.5%) |
Female Fertility in Lewes
Fertility by Age in Lewes
| Age Bracket | Women with Births | Births / 1,000 Women |
| 15 to 19 years | 0 (0.0%) | 0.0 |
| 20 to 34 years | 0 (0.0%) | 0.0 |
| 35 to 50 years | 0 (0.0%) | 0.0 |
| Total | 0 (0.0%) | 0.0 |
Fertility by Age by Marriage Status in Lewes
| Age Bracket | Married | Unmarried |
| 15 to 19 years | 0 (0.0%) | 0 (0.0%) |
| 20 to 34 years | 0 (0.0%) | 0 (0.0%) |
| 35 to 50 years | 0 (0.0%) | 0 (0.0%) |
| Total | 0 (0.0%) | 0 (0.0%) |
Fertility by Education in Lewes
| Educational Attainment | Women with Births | Births / 1,000 Women |
| Less than High School | 0 (0.0%) | 0.0 |
| High School Diploma | 0 (0.0%) | 0.0 |
| College or Associate's Degree | 0 (0.0%) | 0.0 |
| Bachelor's Degree | 0 (0.0%) | 0.0 |
| Graduate Degree | 0 (0.0%) | 0.0 |
| Total | 0 (0.0%) | 0.0 |
Fertility by Education by Marriage Status in Lewes
| Educational Attainment | Married | Unmarried |
| Less than High School | 0 (0.0%) | 0 (0.0%) |
| High School Diploma | 0 (0.0%) | 0 (0.0%) |
| College or Associate's Degree | 0 (0.0%) | 0 (0.0%) |
| Bachelor's Degree | 0 (0.0%) | 0 (0.0%) |
| Graduate Degree | 0 (0.0%) | 0 (0.0%) |
| Total | 0 (0.0%) | 0 (0.0%) |
Income in Lewes
Income Overview in Lewes
Per Capita Income in Lewes is $63,941, while median incomes of families and households are $112,969 and $87,458 respectively.
| Characteristic | Number | Measure |
| Per Capita Income | 3,339 | $63,941 |
| Median Family Income | 1,137 | $112,969 |
| Mean Family Income | 1,137 | $158,971 |
| Median Household Income | 1,591 | $87,458 |
| Mean Household Income | 1,591 | $136,766 |
| Income Deficit | 1,137 | $0 |
| Wage / Income Gap (%) | 3,339 | 30.43% |
| Wage / Income Gap ($) | 3,339 | 69.57¢ per $1 |
| Gini / Inequality Index | 3,339 | 0.46 |
Earnings by Sex in Lewes
Average Earnings in Lewes are $42,106, $50,867 for men and $35,387 for women, a difference of 30.4%.
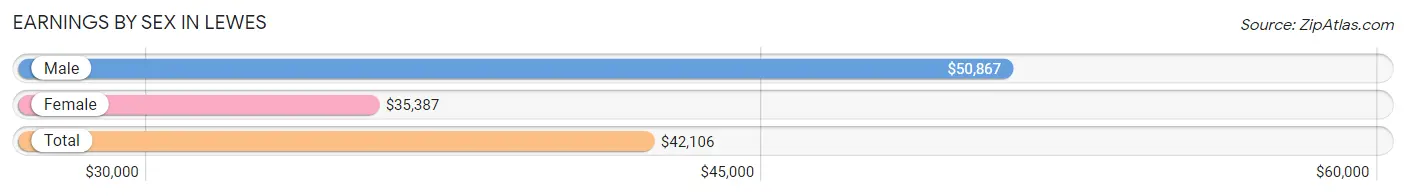
| Sex | Number | Average Earnings |
| Male | 832 (58.5%) | $50,867 |
| Female | 591 (41.5%) | $35,387 |
| Total | 1,423 (100.0%) | $42,106 |
Earnings by Sex by Income Bracket in Lewes
The most common earnings brackets in Lewes are $100,000+ for men (231 | 27.8%) and $75,000 to $99,999 for women (94 | 15.9%).
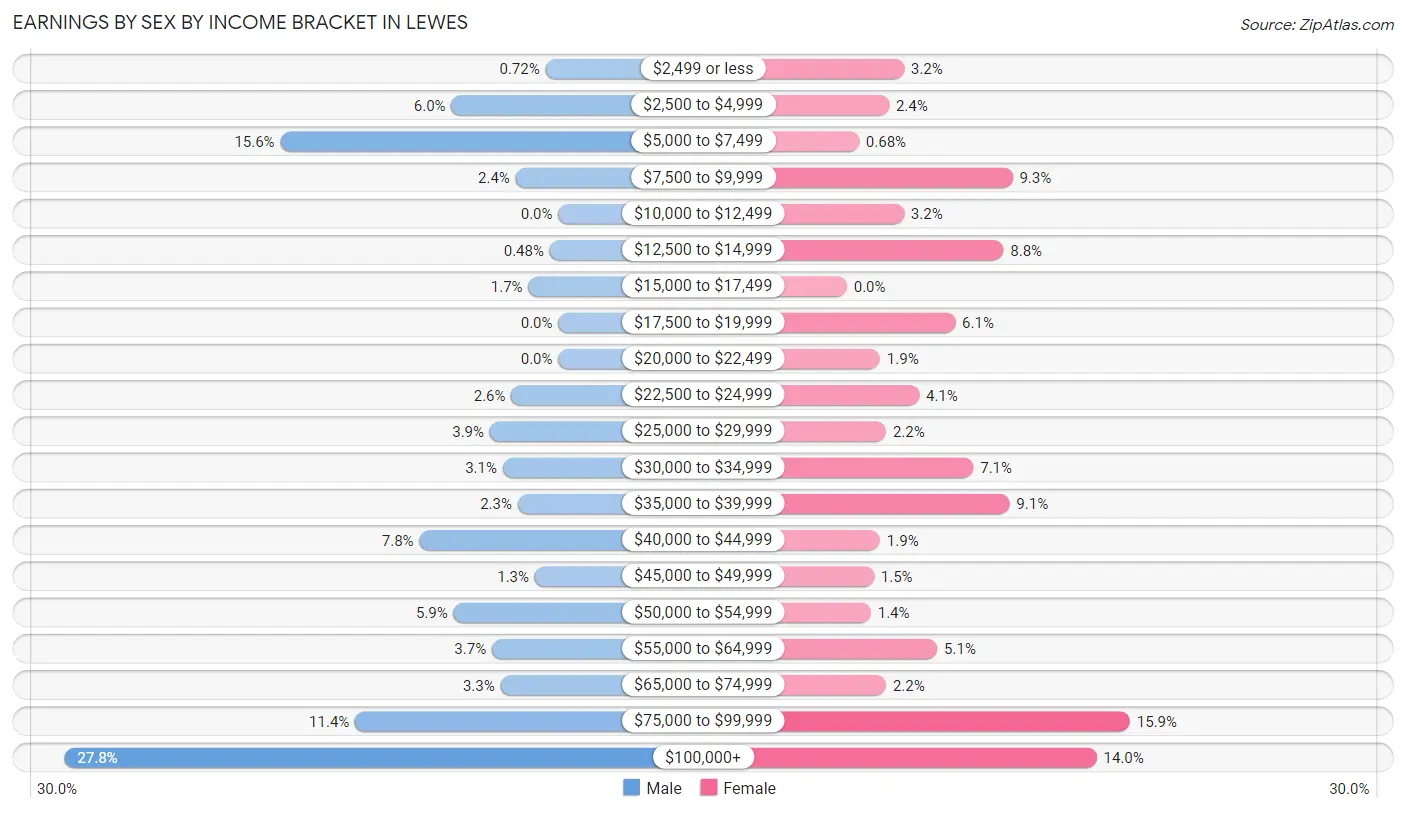
| Income | Male | Female |
| $2,499 or less | 6 (0.7%) | 19 (3.2%) |
| $2,500 to $4,999 | 50 (6.0%) | 14 (2.4%) |
| $5,000 to $7,499 | 130 (15.6%) | 4 (0.7%) |
| $7,500 to $9,999 | 20 (2.4%) | 55 (9.3%) |
| $10,000 to $12,499 | 0 (0.0%) | 19 (3.2%) |
| $12,500 to $14,999 | 4 (0.5%) | 52 (8.8%) |
| $15,000 to $17,499 | 14 (1.7%) | 0 (0.0%) |
| $17,500 to $19,999 | 0 (0.0%) | 36 (6.1%) |
| $20,000 to $22,499 | 0 (0.0%) | 11 (1.9%) |
| $22,500 to $24,999 | 22 (2.6%) | 24 (4.1%) |
| $25,000 to $29,999 | 32 (3.8%) | 13 (2.2%) |
| $30,000 to $34,999 | 26 (3.1%) | 42 (7.1%) |
| $35,000 to $39,999 | 19 (2.3%) | 54 (9.1%) |
| $40,000 to $44,999 | 65 (7.8%) | 11 (1.9%) |
| $45,000 to $49,999 | 11 (1.3%) | 9 (1.5%) |
| $50,000 to $54,999 | 49 (5.9%) | 8 (1.3%) |
| $55,000 to $64,999 | 31 (3.7%) | 30 (5.1%) |
| $65,000 to $74,999 | 27 (3.3%) | 13 (2.2%) |
| $75,000 to $99,999 | 95 (11.4%) | 94 (15.9%) |
| $100,000+ | 231 (27.8%) | 83 (14.0%) |
| Total | 832 (100.0%) | 591 (100.0%) |
Earnings by Sex by Educational Attainment in Lewes
Average earnings in Lewes are $51,097 for men and $35,923 for women, a difference of 29.7%. Men with an educational attainment of bachelor's degree enjoy the highest average annual earnings of $96,039, while those with high school diploma education earn the least with $30,433. Women with an educational attainment of graduate degree earn the most with the average annual earnings of $42,386, while those with bachelor's degree education have the smallest earnings of $30,481.
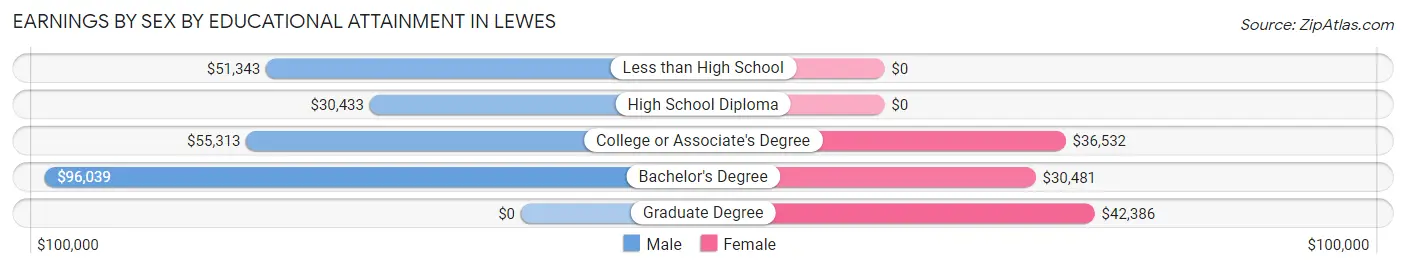
| Educational Attainment | Male Income | Female Income |
| Less than High School | $51,343 | $0 |
| High School Diploma | $30,433 | $0 |
| College or Associate's Degree | $55,313 | $36,532 |
| Bachelor's Degree | $96,039 | $30,481 |
| Graduate Degree | - | - |
| Total | $51,097 | $35,923 |
Family Income in Lewes
Family Income Brackets in Lewes
According to the Lewes family income data, there are 279 families falling into the $100,000 to $149,999 income range, which is the most common income bracket and makes up 24.5% of all families.
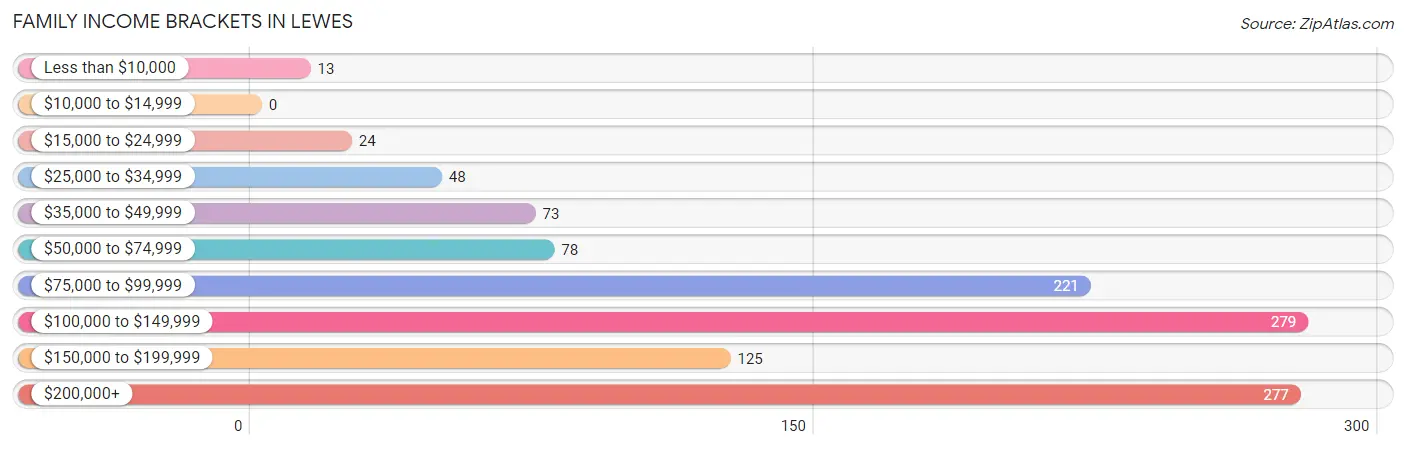
| Income Bracket | # Families | % Families |
| Less than $10,000 | 13 | 1.1% |
| $10,000 to $14,999 | 0 | 0.0% |
| $15,000 to $24,999 | 24 | 2.1% |
| $25,000 to $34,999 | 48 | 4.2% |
| $35,000 to $49,999 | 73 | 6.4% |
| $50,000 to $74,999 | 78 | 6.9% |
| $75,000 to $99,999 | 221 | 19.4% |
| $100,000 to $149,999 | 279 | 24.5% |
| $150,000 to $199,999 | 125 | 11.0% |
| $200,000+ | 277 | 24.4% |
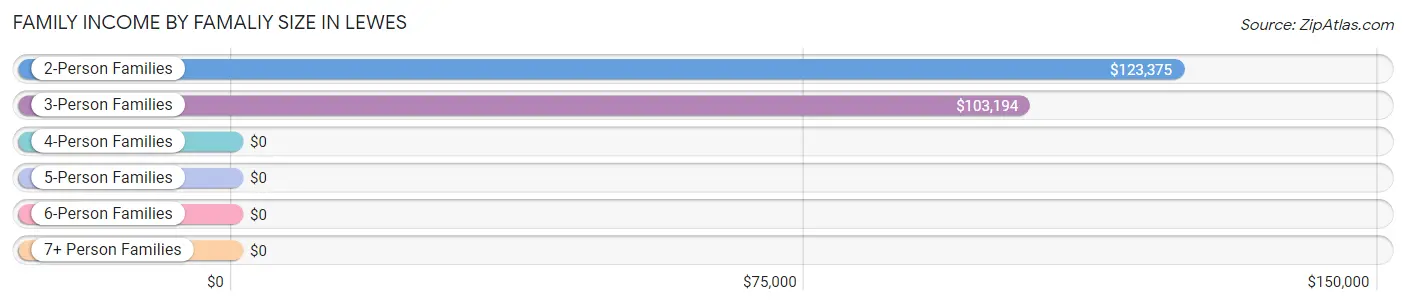
Family Income by Famaliy Size in Lewes
2-person families (989 | 87.0%) account for the highest median family income in Lewes with $123,375 per family, while 2-person families (989 | 87.0%) have the highest median income of $61,688 per family member.
| Income Bracket | # Families | Median Income |
| 2-Person Families | 989 (87.0%) | $123,375 |
| 3-Person Families | 69 (6.1%) | $103,194 |
| 4-Person Families | 73 (6.4%) | $0 |
| 5-Person Families | 6 (0.5%) | $0 |
| 6-Person Families | 0 (0.0%) | $0 |
| 7+ Person Families | 0 (0.0%) | $0 |
| Total | 1,137 (100.0%) | $112,969 |
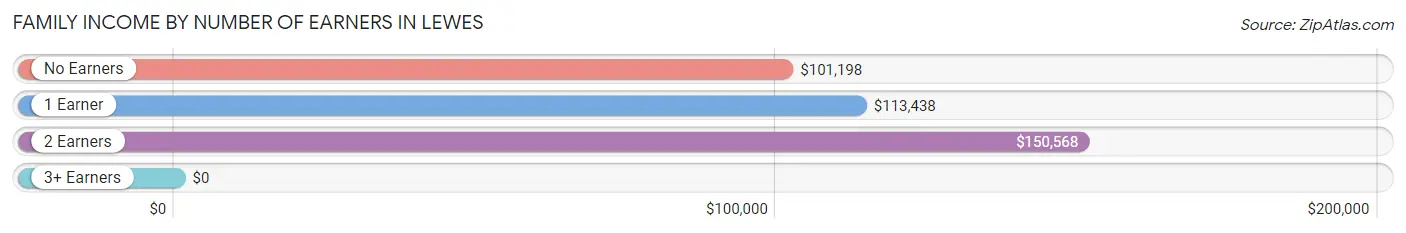
Family Income by Number of Earners in Lewes
| Number of Earners | # Families | Median Income |
| No Earners | 383 (33.7%) | $101,198 |
| 1 Earner | 388 (34.1%) | $113,438 |
| 2 Earners | 353 (31.0%) | $150,568 |
| 3+ Earners | 13 (1.1%) | $0 |
| Total | 1,137 (100.0%) | $112,969 |
Household Income in Lewes
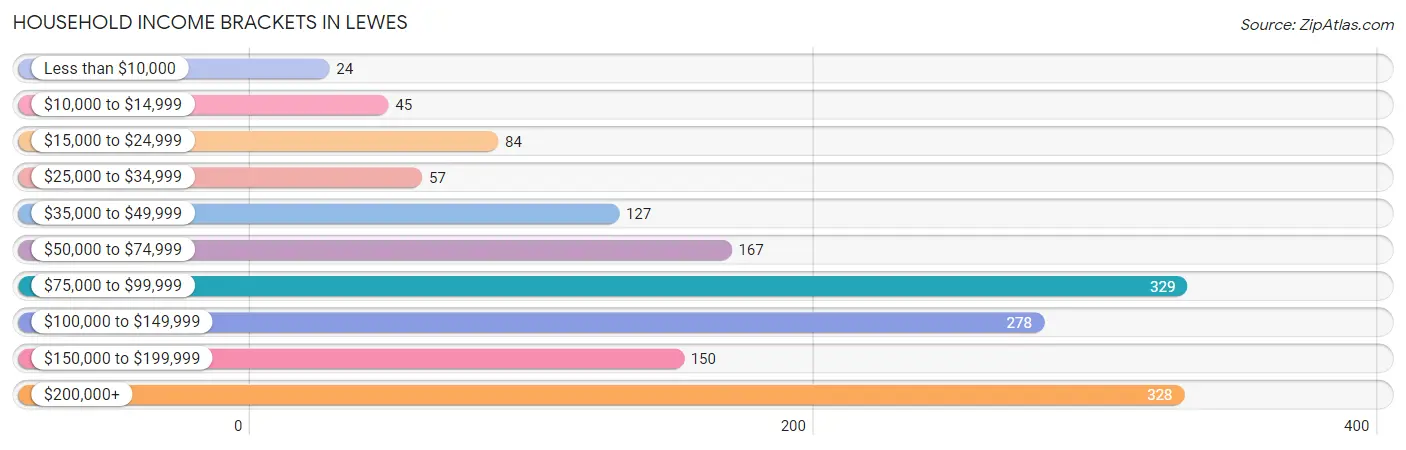
Household Income Brackets in Lewes
With 329 households falling in the category, the $75,000 to $99,999 income range is the most frequent in Lewes, accounting for 20.7% of all households. In contrast, only 24 households (1.5%) fall into the less than $10,000 income bracket, making it the least populous group.
| Income Bracket | # Households | % Households |
| Less than $10,000 | 24 | 1.5% |
| $10,000 to $14,999 | 45 | 2.8% |
| $15,000 to $24,999 | 84 | 5.3% |
| $25,000 to $34,999 | 57 | 3.6% |
| $35,000 to $49,999 | 127 | 8.0% |
| $50,000 to $74,999 | 167 | 10.5% |
| $75,000 to $99,999 | 329 | 20.7% |
| $100,000 to $149,999 | 278 | 17.5% |
| $150,000 to $199,999 | 150 | 9.4% |
| $200,000+ | 328 | 20.6% |
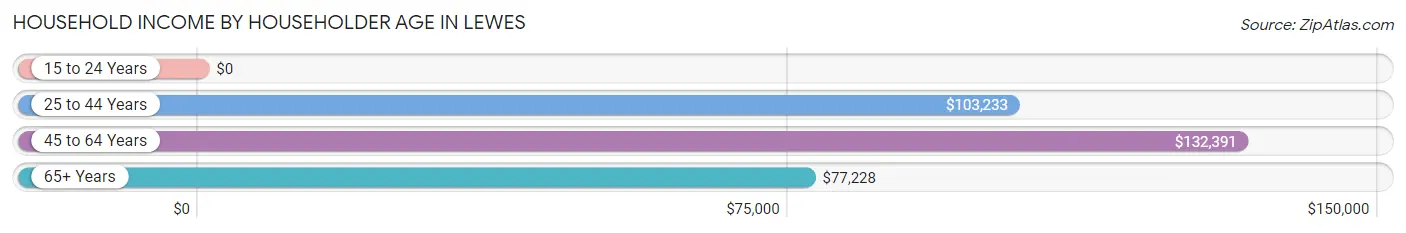
Household Income by Householder Age in Lewes
The median household income in Lewes is $87,458, with the highest median household income of $132,391 found in the 45 to 64 years age bracket for the primary householder. A total of 432 households (27.2%) fall into this category.
| Income Bracket | # Households | Median Income |
| 15 to 24 Years | 0 (0.0%) | $0 |
| 25 to 44 Years | 141 (8.9%) | $103,233 |
| 45 to 64 Years | 432 (27.2%) | $132,391 |
| 65+ Years | 1,018 (64.0%) | $77,228 |
| Total | 1,591 (100.0%) | $87,458 |
Poverty in Lewes
Income Below Poverty by Sex and Age in Lewes
With 5.7% poverty level for males and 6.0% for females among the residents of Lewes, 35 to 44 year old males and 12 to 14 year old females are the most vulnerable to poverty, with 13 males (12.4%) and 12 females (38.7%) in their respective age groups living below the poverty level.
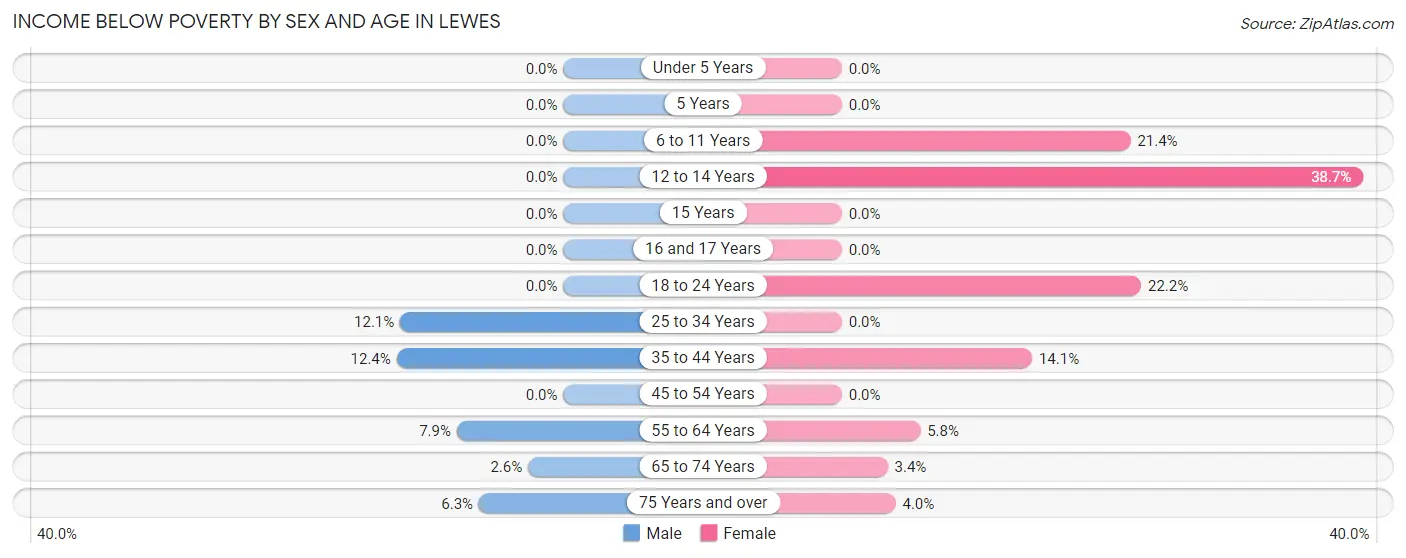
| Age Bracket | Male | Female |
| Under 5 Years | 0 (0.0%) | 0 (0.0%) |
| 5 Years | 0 (0.0%) | 0 (0.0%) |
| 6 to 11 Years | 0 (0.0%) | 12 (21.4%) |
| 12 to 14 Years | 0 (0.0%) | 12 (38.7%) |
| 15 Years | 0 (0.0%) | 0 (0.0%) |
| 16 and 17 Years | 0 (0.0%) | 0 (0.0%) |
| 18 to 24 Years | 0 (0.0%) | 4 (22.2%) |
| 25 to 34 Years | 20 (12.1%) | 0 (0.0%) |
| 35 to 44 Years | 13 (12.4%) | 12 (14.1%) |
| 45 to 54 Years | 0 (0.0%) | 0 (0.0%) |
| 55 to 64 Years | 22 (7.9%) | 22 (5.8%) |
| 65 to 74 Years | 13 (2.6%) | 20 (3.4%) |
| 75 Years and over | 23 (6.3%) | 11 (4.0%) |
| Total | 91 (5.7%) | 93 (6.0%) |
Income Above Poverty by Sex and Age in Lewes
According to the poverty statistics in Lewes, males aged 6 to 11 years and females aged 16 and 17 years are the age groups that are most secure financially, with 100.0% of males and 100.0% of females in these age groups living above the poverty line.
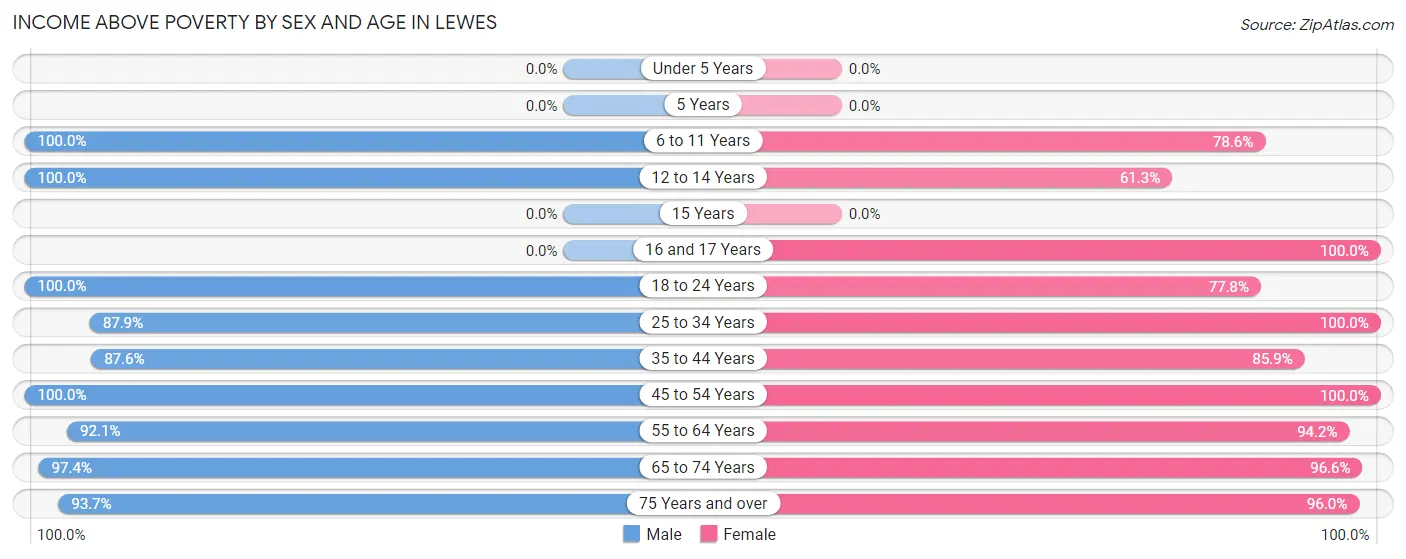
| Age Bracket | Male | Female |
| Under 5 Years | 0 (0.0%) | 0 (0.0%) |
| 5 Years | 0 (0.0%) | 0 (0.0%) |
| 6 to 11 Years | 67 (100.0%) | 44 (78.6%) |
| 12 to 14 Years | 40 (100.0%) | 19 (61.3%) |
| 15 Years | 0 (0.0%) | 0 (0.0%) |
| 16 and 17 Years | 0 (0.0%) | 4 (100.0%) |
| 18 to 24 Years | 35 (100.0%) | 14 (77.8%) |
| 25 to 34 Years | 145 (87.9%) | 39 (100.0%) |
| 35 to 44 Years | 92 (87.6%) | 73 (85.9%) |
| 45 to 54 Years | 57 (100.0%) | 75 (100.0%) |
| 55 to 64 Years | 256 (92.1%) | 356 (94.2%) |
| 65 to 74 Years | 483 (97.4%) | 569 (96.6%) |
| 75 Years and over | 344 (93.7%) | 265 (96.0%) |
| Total | 1,519 (94.4%) | 1,458 (94.0%) |
Income Below Poverty Among Married-Couple Families in Lewes
The poverty statistics for married-couple families in Lewes show that 2.3% or 24 of the total 1,043 families live below the poverty line. Families with 1 or 2 children have the highest poverty rate of 13.4%, comprising of 13 families. On the other hand, families with no children have the lowest poverty rate of 1.2%, which includes 11 families.
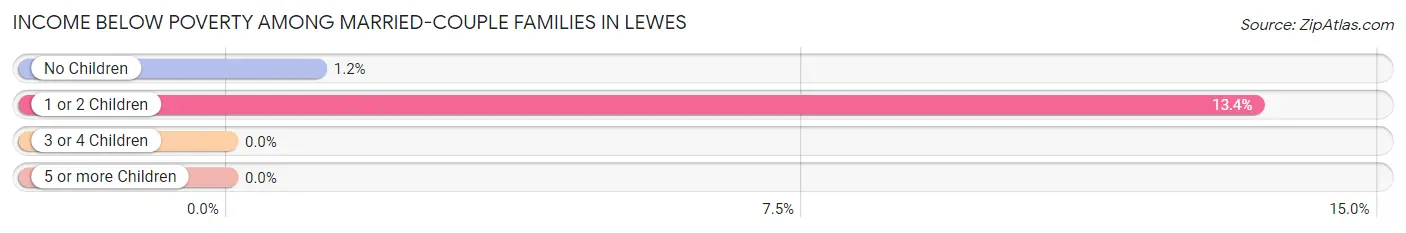
| Children | Above Poverty | Below Poverty |
| No Children | 935 (98.8%) | 11 (1.2%) |
| 1 or 2 Children | 84 (86.6%) | 13 (13.4%) |
| 3 or 4 Children | 0 (0.0%) | 0 (0.0%) |
| 5 or more Children | 0 (0.0%) | 0 (0.0%) |
| Total | 1,019 (97.7%) | 24 (2.3%) |
Income Below Poverty Among Single-Parent Households in Lewes
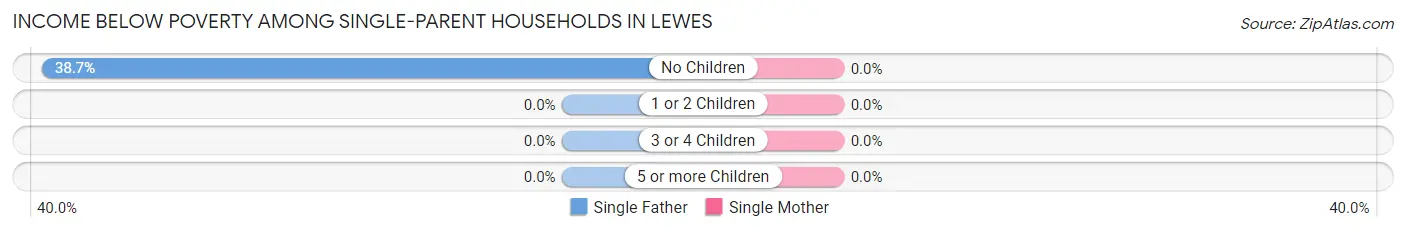
| Children | Single Father | Single Mother |
| No Children | 12 (38.7%) | 0 (0.0%) |
| 1 or 2 Children | 0 (0.0%) | 0 (0.0%) |
| 3 or 4 Children | 0 (0.0%) | 0 (0.0%) |
| 5 or more Children | 0 (0.0%) | 0 (0.0%) |
| Total | 12 (38.7%) | 0 (0.0%) |
Income Below Poverty Among Married-Couple vs Single-Parent Households in Lewes
The poverty data for Lewes shows that 24 of the married-couple family households (2.3%) and 12 of the single-parent households (12.8%) are living below the poverty level. Within the married-couple family households, those with 1 or 2 children have the highest poverty rate, with 13 households (13.4%) falling below the poverty line. Among the single-parent households, those with no children have the highest poverty rate, with 12 household (14.0%) living below poverty.
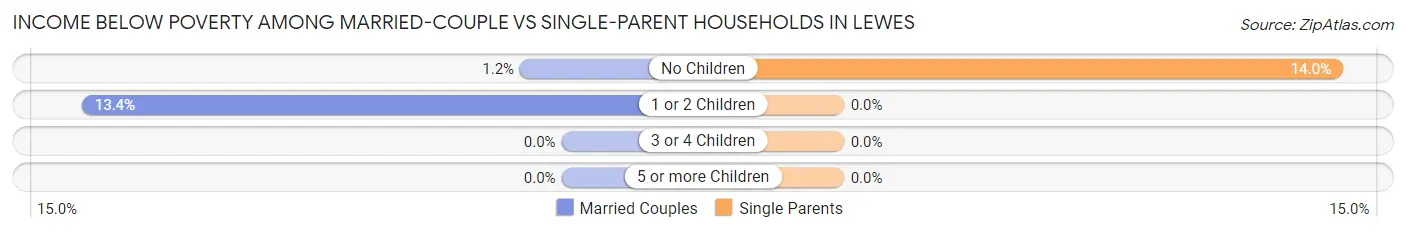
| Children | Married-Couple Families | Single-Parent Households |
| No Children | 11 (1.2%) | 12 (14.0%) |
| 1 or 2 Children | 13 (13.4%) | 0 (0.0%) |
| 3 or 4 Children | 0 (0.0%) | 0 (0.0%) |
| 5 or more Children | 0 (0.0%) | 0 (0.0%) |
| Total | 24 (2.3%) | 12 (12.8%) |
Employment Characteristics in Lewes
Employment by Class of Employer in Lewes
Among the 1,177 employed individuals in Lewes, private company employees (528 | 44.9%), self-employed (incorporated) (173 | 14.7%), and state government employees (144 | 12.2%) make up the most common classes of employment.
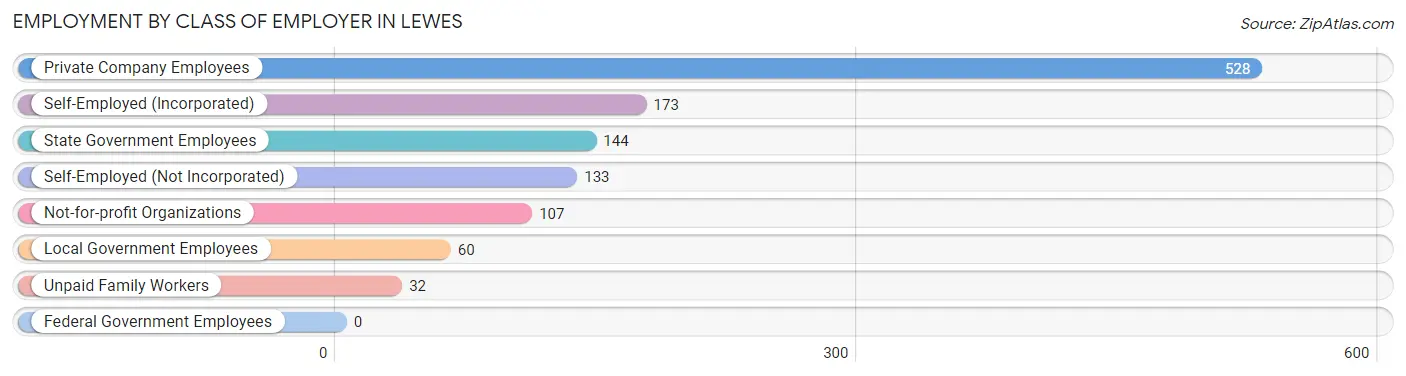
| Employer Class | # Employees | % Employees |
| Private Company Employees | 528 | 44.9% |
| Self-Employed (Incorporated) | 173 | 14.7% |
| Self-Employed (Not Incorporated) | 133 | 11.3% |
| Not-for-profit Organizations | 107 | 9.1% |
| Local Government Employees | 60 | 5.1% |
| State Government Employees | 144 | 12.2% |
| Federal Government Employees | 0 | 0.0% |
| Unpaid Family Workers | 32 | 2.7% |
| Total | 1,177 | 100.0% |
Employment Status by Age in Lewes
According to the labor force statistics for Lewes, out of the total population over 16 years of age (3,145), 38.1% or 1,198 individuals are in the labor force, with 1.0% or 12 of them unemployed. The age group with the highest labor force participation rate is 30 to 34 years, with 100.0% or 26 individuals in the labor force. Within the labor force, the 60 to 64 years age range has the highest percentage of unemployed individuals, with 4.3% or 12 of them being unemployed.
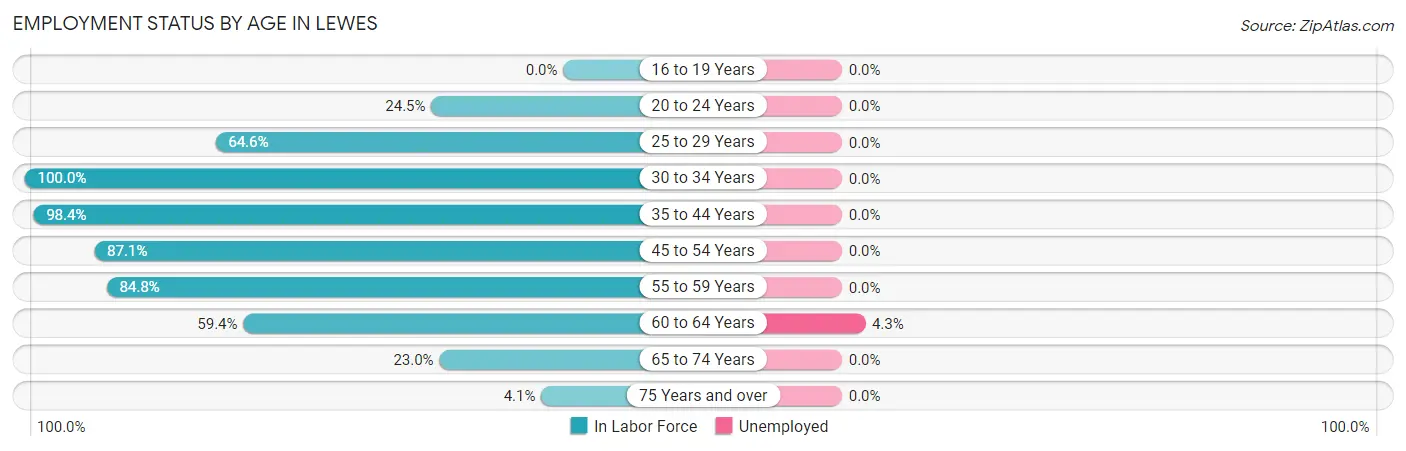
| Age Bracket | In Labor Force | Unemployed |
| 16 to 19 Years | 0 (0.0%) | 0 (0.0%) |
| 20 to 24 Years | 13 (24.5%) | 0 (0.0%) |
| 25 to 29 Years | 115 (64.6%) | 0 (0.0%) |
| 30 to 34 Years | 26 (100.0%) | 0 (0.0%) |
| 35 to 44 Years | 190 (98.4%) | 0 (0.0%) |
| 45 to 54 Years | 122 (87.1%) | 0 (0.0%) |
| 55 to 59 Years | 167 (84.8%) | 0 (0.0%) |
| 60 to 64 Years | 278 (59.4%) | 12 (4.3%) |
| 65 to 74 Years | 256 (23.0%) | 0 (0.0%) |
| 75 Years and over | 32 (4.1%) | 0 (0.0%) |
| Total | 1,198 (38.1%) | 12 (1.0%) |
Employment Status by Educational Attainment in Lewes
According to labor force statistics for Lewes, 74.7% of individuals (898) out of the total population between 25 and 64 years of age (1,202) are in the labor force, with 1.3% or 12 of them being unemployed. The group with the highest labor force participation rate are those with the educational attainment of bachelor's degree or higher, with 80.0% or 601 individuals in the labor force. Within the labor force, individuals with less than high school education have the highest percentage of unemployment, with 13.6% or 12 of them being unemployed.
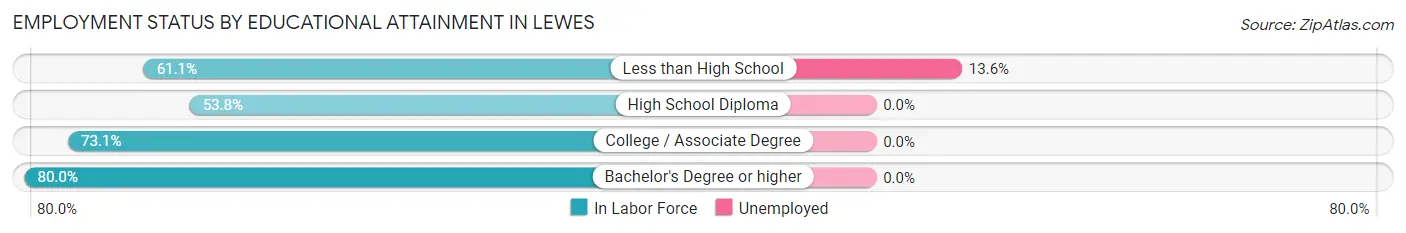
| Educational Attainment | In Labor Force | Unemployed |
| Less than High School | 88 (61.1%) | 20 (13.6%) |
| High School Diploma | 43 (53.8%) | 0 (0.0%) |
| College / Associate Degree | 166 (73.1%) | 0 (0.0%) |
| Bachelor's Degree or higher | 601 (80.0%) | 0 (0.0%) |
| Total | 898 (74.7%) | 16 (1.3%) |
Employment Occupations by Sex in Lewes
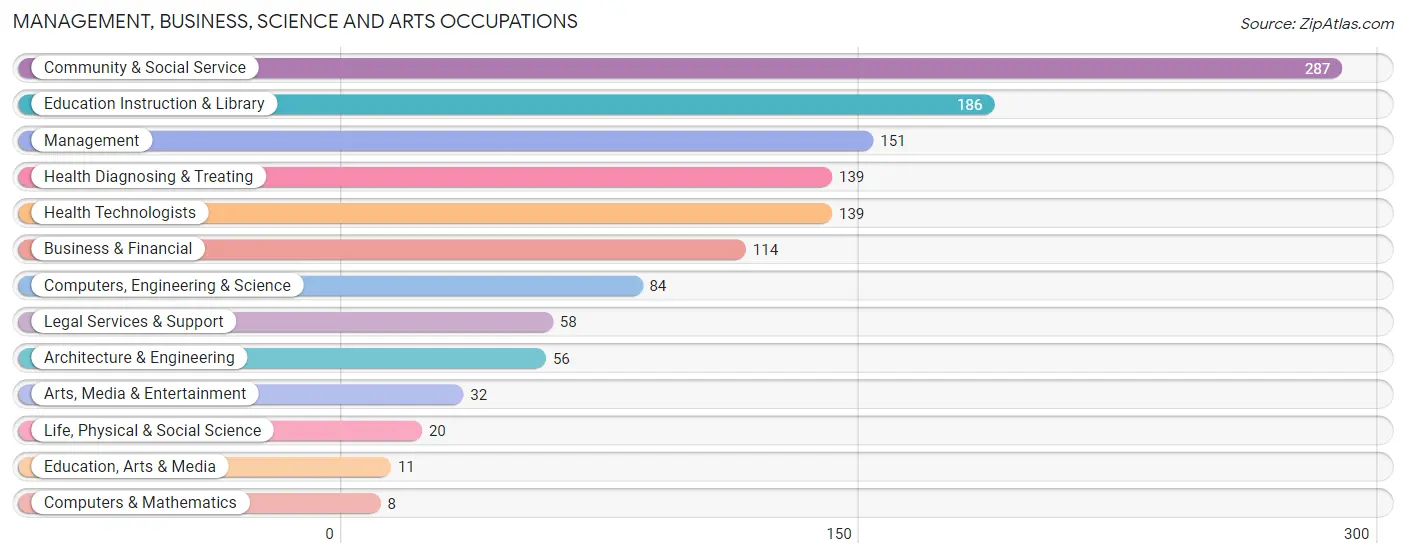
Management, Business, Science and Arts Occupations
The most common Management, Business, Science and Arts occupations in Lewes are Community & Social Service (287 | 24.2%), Education Instruction & Library (186 | 15.7%), Management (151 | 12.7%), Health Diagnosing & Treating (139 | 11.7%), and Health Technologists (139 | 11.7%).
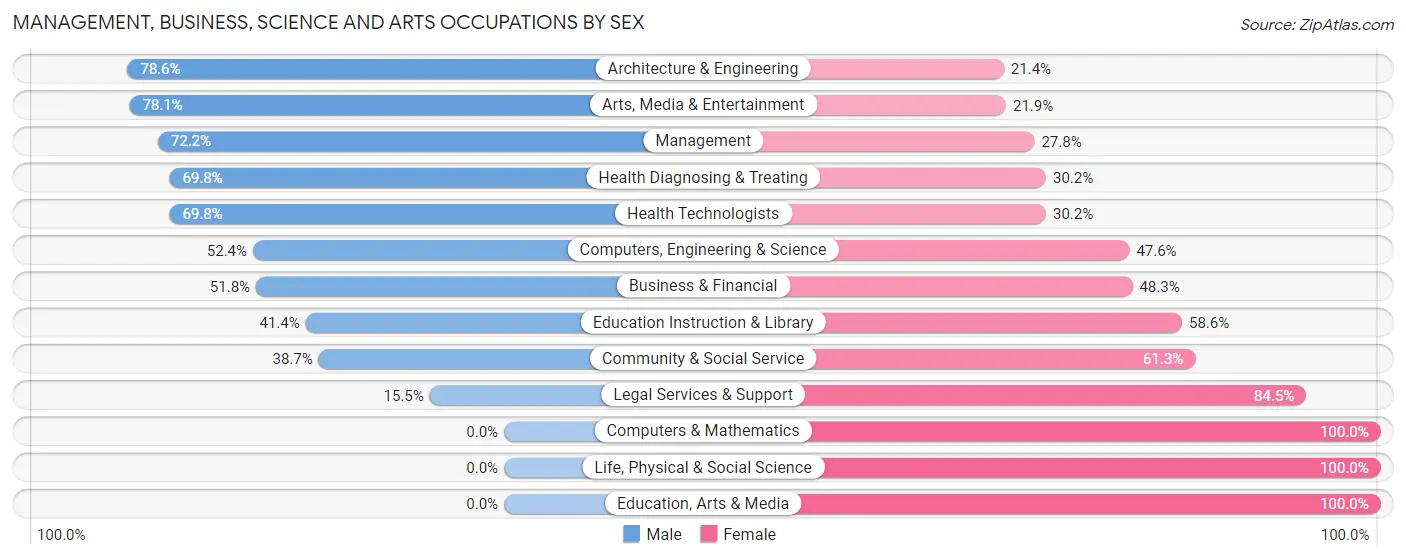
Management, Business, Science and Arts Occupations by Sex
Within the Management, Business, Science and Arts occupations in Lewes, the most male-oriented occupations are Architecture & Engineering (78.6%), Arts, Media & Entertainment (78.1%), and Management (72.2%), while the most female-oriented occupations are Computers & Mathematics (100.0%), Life, Physical & Social Science (100.0%), and Education, Arts & Media (100.0%).
| Occupation | Male | Female |
| Management | 109 (72.2%) | 42 (27.8%) |
| Business & Financial | 59 (51.7%) | 55 (48.2%) |
| Computers, Engineering & Science | 44 (52.4%) | 40 (47.6%) |
| Computers & Mathematics | 0 (0.0%) | 8 (100.0%) |
| Architecture & Engineering | 44 (78.6%) | 12 (21.4%) |
| Life, Physical & Social Science | 0 (0.0%) | 20 (100.0%) |
| Community & Social Service | 111 (38.7%) | 176 (61.3%) |
| Education, Arts & Media | 0 (0.0%) | 11 (100.0%) |
| Legal Services & Support | 9 (15.5%) | 49 (84.5%) |
| Education Instruction & Library | 77 (41.4%) | 109 (58.6%) |
| Arts, Media & Entertainment | 25 (78.1%) | 7 (21.9%) |
| Health Diagnosing & Treating | 97 (69.8%) | 42 (30.2%) |
| Health Technologists | 97 (69.8%) | 42 (30.2%) |
| Total (Category) | 420 (54.2%) | 355 (45.8%) |
| Total (Overall) | 667 (56.2%) | 520 (43.8%) |
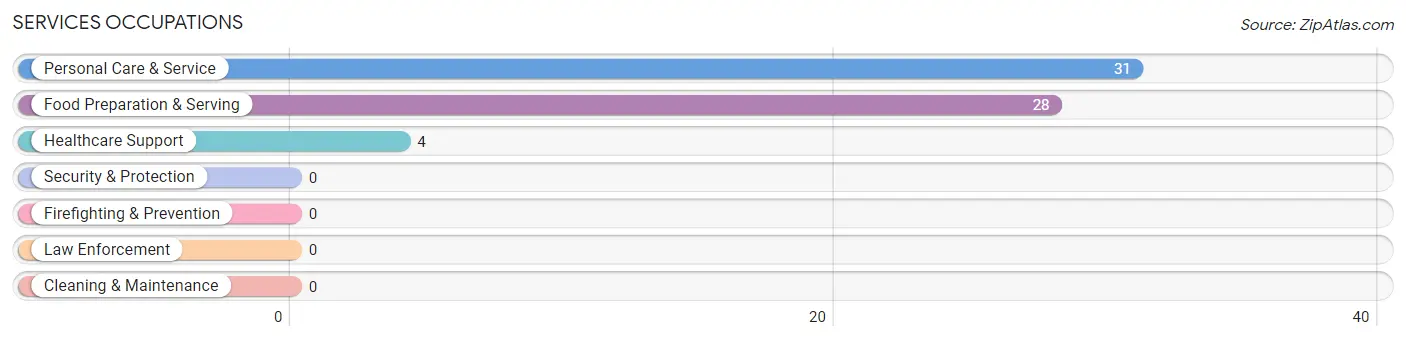
Services Occupations
The most common Services occupations in Lewes are Personal Care & Service (31 | 2.6%), Food Preparation & Serving (28 | 2.4%), and Healthcare Support (4 | 0.3%).
Services Occupations by Sex
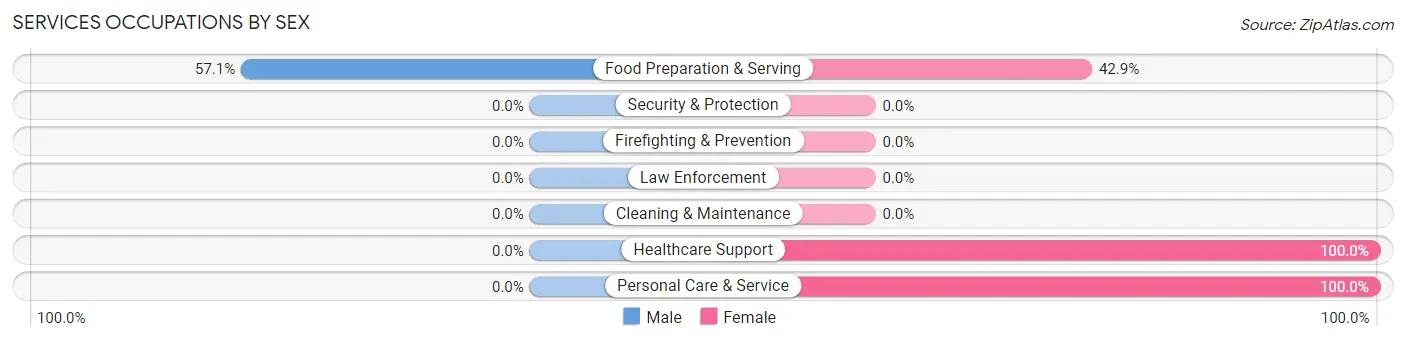
| Occupation | Male | Female |
| Healthcare Support | 0 (0.0%) | 4 (100.0%) |
| Security & Protection | 0 (0.0%) | 0 (0.0%) |
| Firefighting & Prevention | 0 (0.0%) | 0 (0.0%) |
| Law Enforcement | 0 (0.0%) | 0 (0.0%) |
| Food Preparation & Serving | 16 (57.1%) | 12 (42.9%) |
| Cleaning & Maintenance | 0 (0.0%) | 0 (0.0%) |
| Personal Care & Service | 0 (0.0%) | 31 (100.0%) |
| Total (Category) | 16 (25.4%) | 47 (74.6%) |
| Total (Overall) | 667 (56.2%) | 520 (43.8%) |
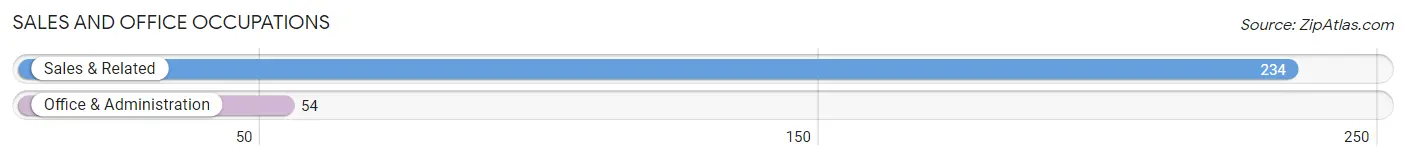
Sales and Office Occupations
The most common Sales and Office occupations in Lewes are Sales & Related (234 | 19.7%), and Office & Administration (54 | 4.5%).
Sales and Office Occupations by Sex
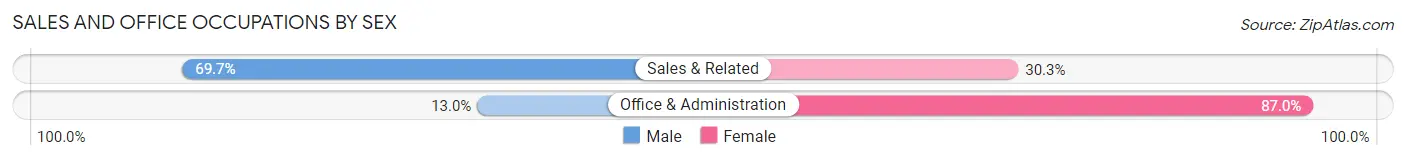
| Occupation | Male | Female |
| Sales & Related | 163 (69.7%) | 71 (30.3%) |
| Office & Administration | 7 (13.0%) | 47 (87.0%) |
| Total (Category) | 170 (59.0%) | 118 (41.0%) |
| Total (Overall) | 667 (56.2%) | 520 (43.8%) |
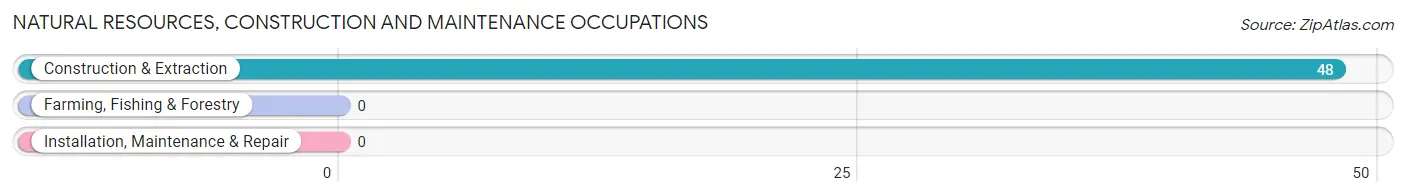
Natural Resources, Construction and Maintenance Occupations
The most common Natural Resources, Construction and Maintenance occupations in Lewes are , and Construction & Extraction (48 | 4.0%).
Natural Resources, Construction and Maintenance Occupations by Sex
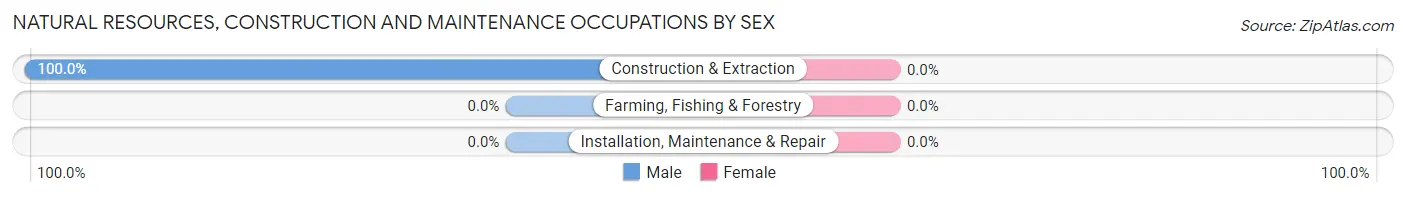
| Occupation | Male | Female |
| Farming, Fishing & Forestry | 0 (0.0%) | 0 (0.0%) |
| Construction & Extraction | 48 (100.0%) | 0 (0.0%) |
| Installation, Maintenance & Repair | 0 (0.0%) | 0 (0.0%) |
| Total (Category) | 48 (100.0%) | 0 (0.0%) |
| Total (Overall) | 667 (56.2%) | 520 (43.8%) |
Production, Transportation and Moving Occupations
The most common Production, Transportation and Moving occupations in Lewes are , and Production (13 | 1.1%).
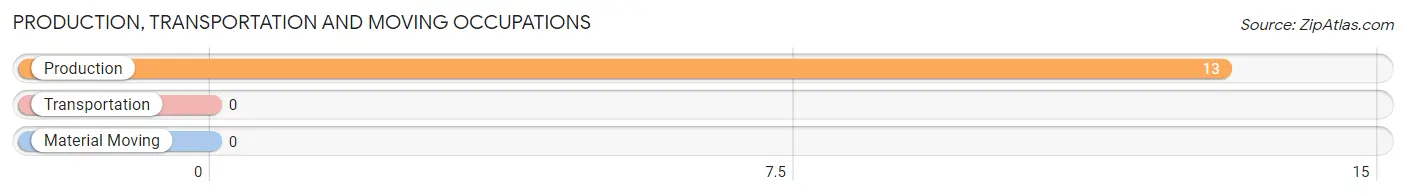
Production, Transportation and Moving Occupations by Sex
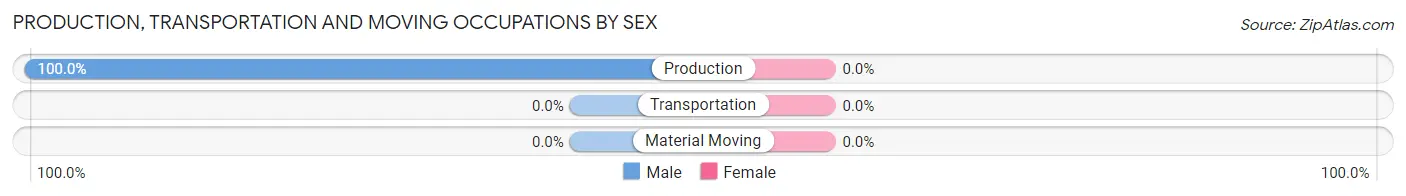
| Occupation | Male | Female |
| Production | 13 (100.0%) | 0 (0.0%) |
| Transportation | 0 (0.0%) | 0 (0.0%) |
| Material Moving | 0 (0.0%) | 0 (0.0%) |
| Total (Category) | 13 (100.0%) | 0 (0.0%) |
| Total (Overall) | 667 (56.2%) | 520 (43.8%) |
Employment Industries by Sex in Lewes
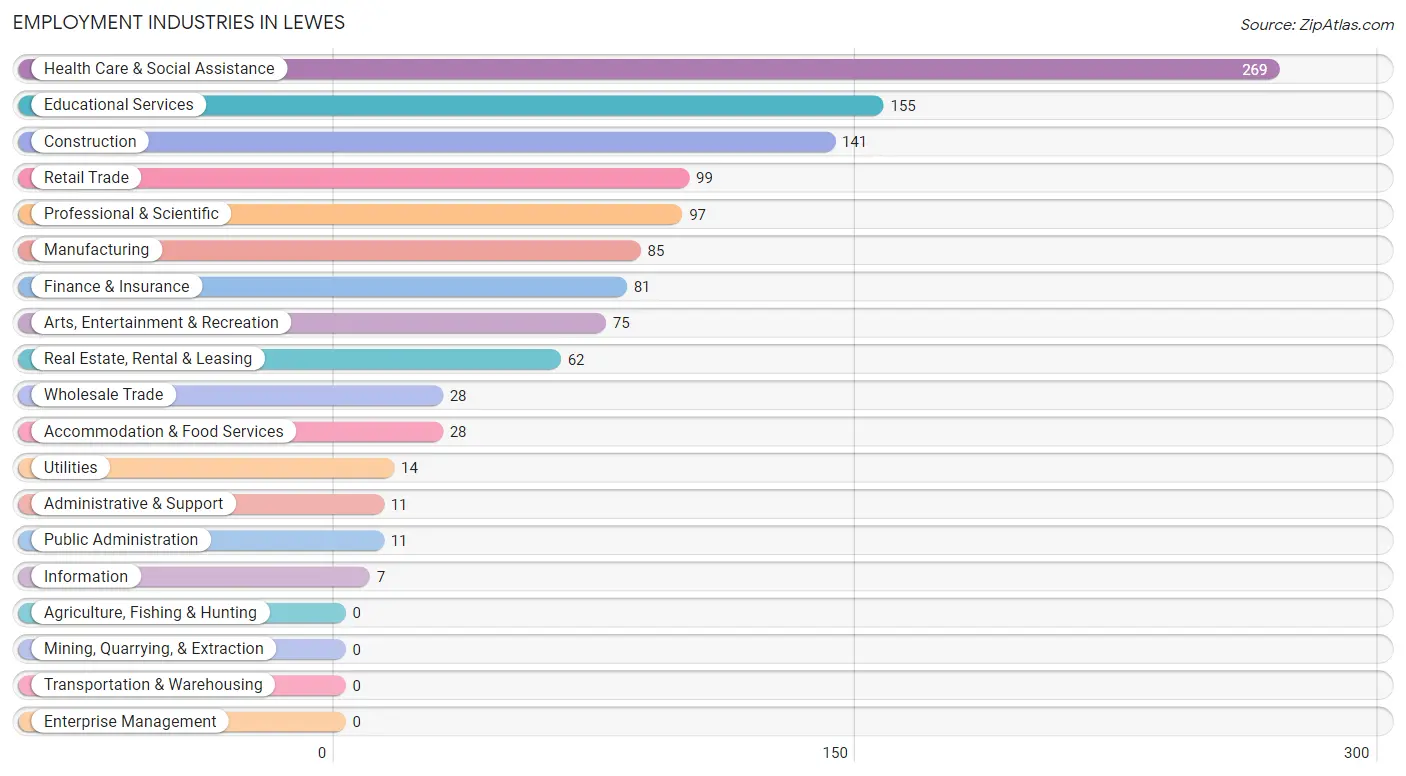
Employment Industries in Lewes
The major employment industries in Lewes include Health Care & Social Assistance (269 | 22.7%), Educational Services (155 | 13.1%), Construction (141 | 11.9%), Retail Trade (99 | 8.3%), and Professional & Scientific (97 | 8.2%).
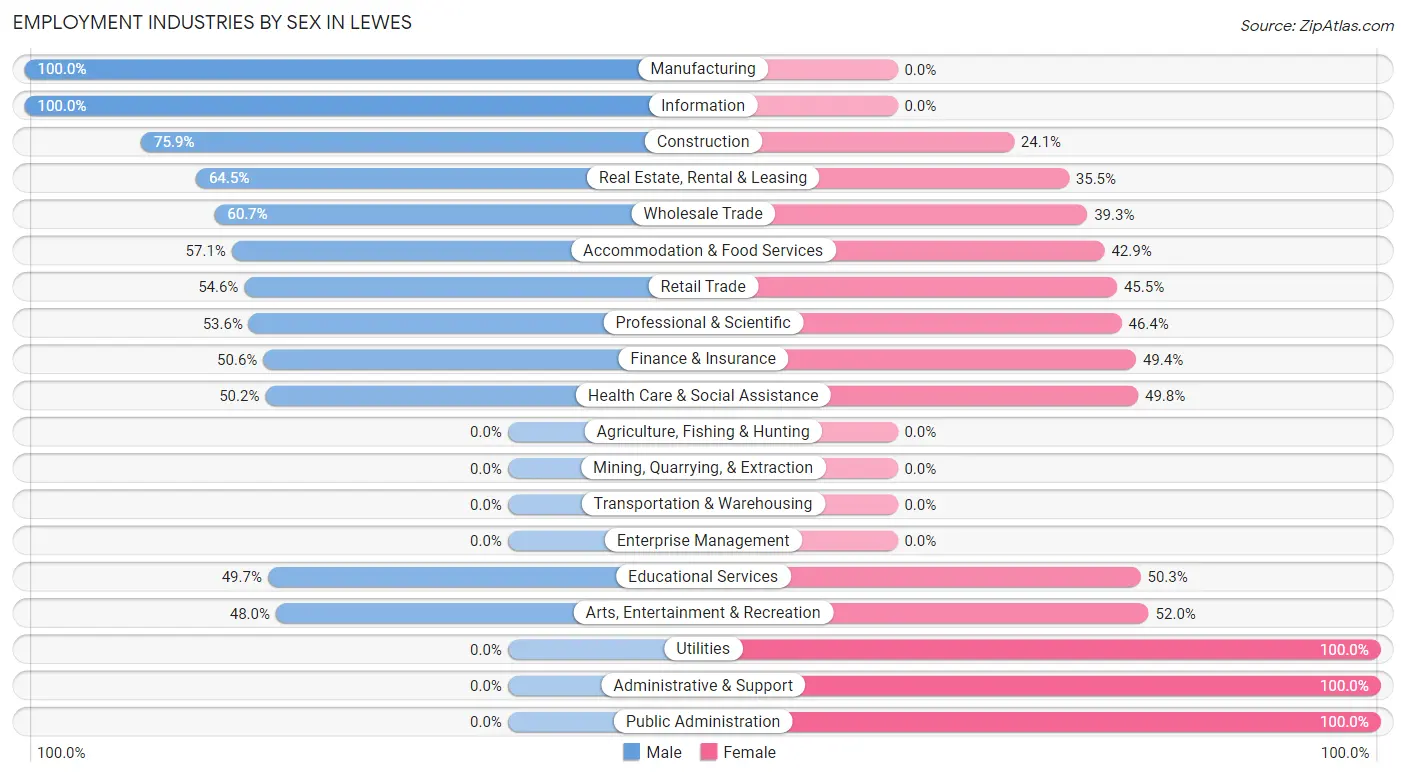
Employment Industries by Sex in Lewes
The Lewes industries that see more men than women are Manufacturing (100.0%), Information (100.0%), and Construction (75.9%), whereas the industries that tend to have a higher number of women are Utilities (100.0%), Administrative & Support (100.0%), and Public Administration (100.0%).
| Industry | Male | Female |
| Agriculture, Fishing & Hunting | 0 (0.0%) | 0 (0.0%) |
| Mining, Quarrying, & Extraction | 0 (0.0%) | 0 (0.0%) |
| Construction | 107 (75.9%) | 34 (24.1%) |
| Manufacturing | 85 (100.0%) | 0 (0.0%) |
| Wholesale Trade | 17 (60.7%) | 11 (39.3%) |
| Retail Trade | 54 (54.5%) | 45 (45.5%) |
| Transportation & Warehousing | 0 (0.0%) | 0 (0.0%) |
| Utilities | 0 (0.0%) | 14 (100.0%) |
| Information | 7 (100.0%) | 0 (0.0%) |
| Finance & Insurance | 41 (50.6%) | 40 (49.4%) |
| Real Estate, Rental & Leasing | 40 (64.5%) | 22 (35.5%) |
| Professional & Scientific | 52 (53.6%) | 45 (46.4%) |
| Enterprise Management | 0 (0.0%) | 0 (0.0%) |
| Administrative & Support | 0 (0.0%) | 11 (100.0%) |
| Educational Services | 77 (49.7%) | 78 (50.3%) |
| Health Care & Social Assistance | 135 (50.2%) | 134 (49.8%) |
| Arts, Entertainment & Recreation | 36 (48.0%) | 39 (52.0%) |
| Accommodation & Food Services | 16 (57.1%) | 12 (42.9%) |
| Public Administration | 0 (0.0%) | 11 (100.0%) |
| Total | 667 (56.2%) | 520 (43.8%) |
Education in Lewes
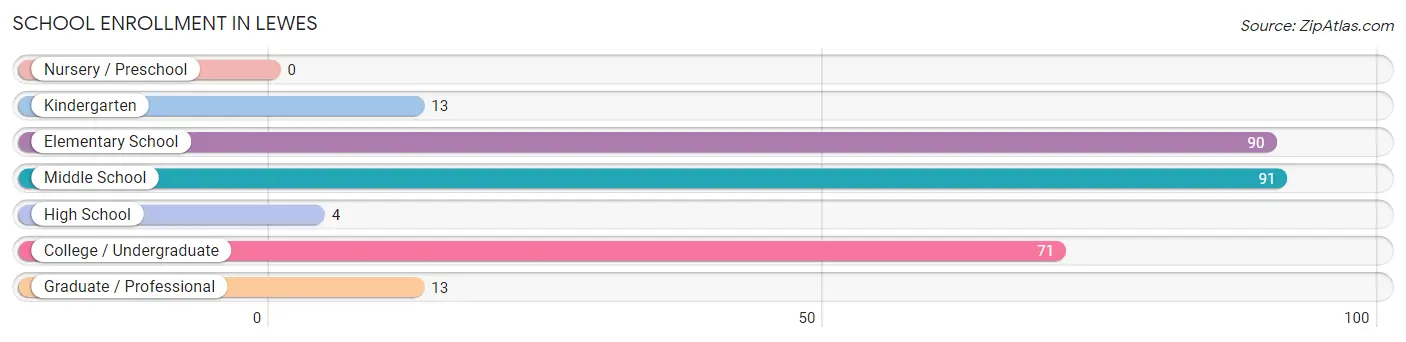
School Enrollment in Lewes
The most common levels of schooling among the 282 students in Lewes are middle school (91 | 32.3%), elementary school (90 | 31.9%), and college / undergraduate (71 | 25.2%).
| School Level | # Students | % Students |
| Nursery / Preschool | 0 | 0.0% |
| Kindergarten | 13 | 4.6% |
| Elementary School | 90 | 31.9% |
| Middle School | 91 | 32.3% |
| High School | 4 | 1.4% |
| College / Undergraduate | 71 | 25.2% |
| Graduate / Professional | 13 | 4.6% |
| Total | 282 | 100.0% |
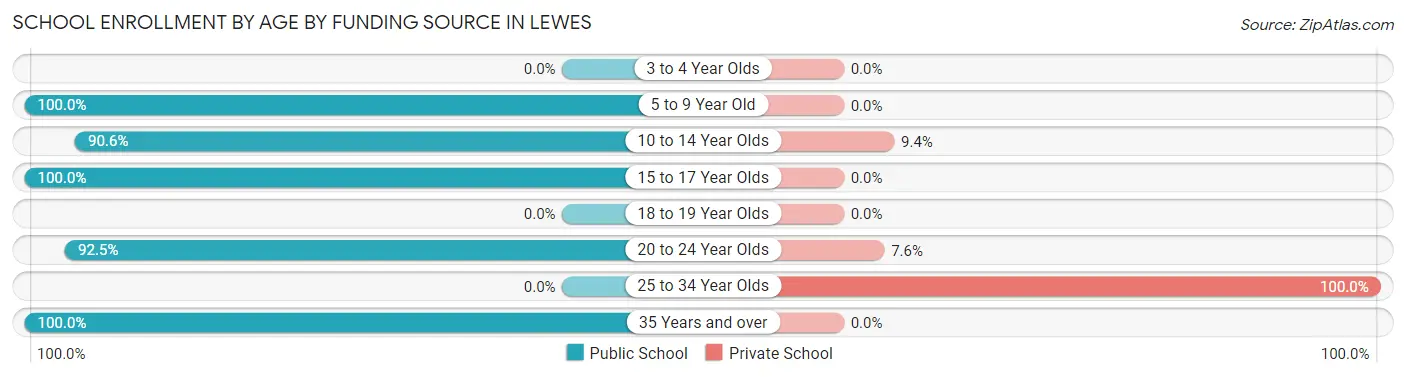
School Enrollment by Age by Funding Source in Lewes
Out of a total of 282 students who are enrolled in schools in Lewes, 28 (9.9%) attend a private institution, while the remaining 254 (90.1%) are enrolled in public schools. The age group of 25 to 34 year olds has the highest likelihood of being enrolled in private schools, with 13 (100.0% in the age bracket) enrolled. Conversely, the age group of 5 to 9 year old has the lowest likelihood of being enrolled in a private school, with 77 (100.0% in the age bracket) attending a public institution.
| Age Bracket | Public School | Private School |
| 3 to 4 Year Olds | 0 (0.0%) | 0 (0.0%) |
| 5 to 9 Year Old | 77 (100.0%) | 0 (0.0%) |
| 10 to 14 Year Olds | 106 (90.6%) | 11 (9.4%) |
| 15 to 17 Year Olds | 4 (100.0%) | 0 (0.0%) |
| 18 to 19 Year Olds | 0 (0.0%) | 0 (0.0%) |
| 20 to 24 Year Olds | 49 (92.4%) | 4 (7.5%) |
| 25 to 34 Year Olds | 0 (0.0%) | 13 (100.0%) |
| 35 Years and over | 18 (100.0%) | 0 (0.0%) |
| Total | 254 (90.1%) | 28 (9.9%) |
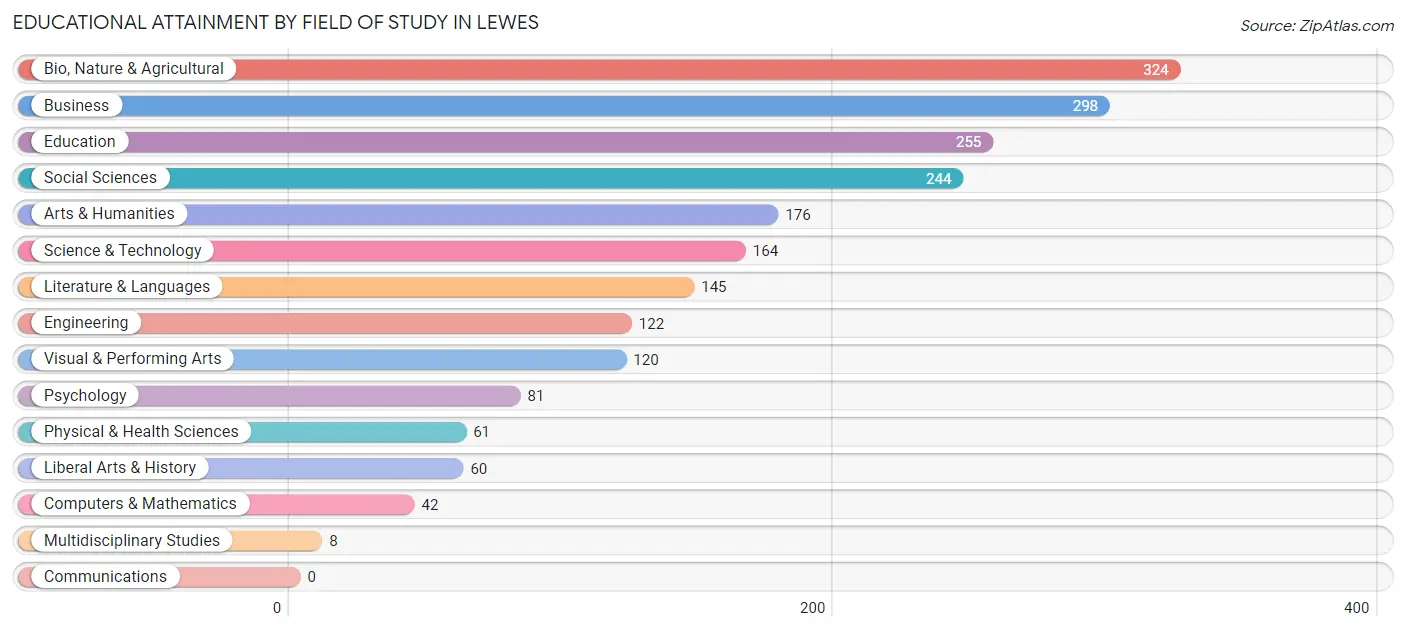
Educational Attainment by Field of Study in Lewes
Bio, nature & agricultural (324 | 15.4%), business (298 | 14.2%), education (255 | 12.1%), social sciences (244 | 11.6%), and arts & humanities (176 | 8.4%) are the most common fields of study among 2,100 individuals in Lewes who have obtained a bachelor's degree or higher.
| Field of Study | # Graduates | % Graduates |
| Computers & Mathematics | 42 | 2.0% |
| Bio, Nature & Agricultural | 324 | 15.4% |
| Physical & Health Sciences | 61 | 2.9% |
| Psychology | 81 | 3.9% |
| Social Sciences | 244 | 11.6% |
| Engineering | 122 | 5.8% |
| Multidisciplinary Studies | 8 | 0.4% |
| Science & Technology | 164 | 7.8% |
| Business | 298 | 14.2% |
| Education | 255 | 12.1% |
| Literature & Languages | 145 | 6.9% |
| Liberal Arts & History | 60 | 2.9% |
| Visual & Performing Arts | 120 | 5.7% |
| Communications | 0 | 0.0% |
| Arts & Humanities | 176 | 8.4% |
| Total | 2,100 | 100.0% |
Transportation & Commute in Lewes
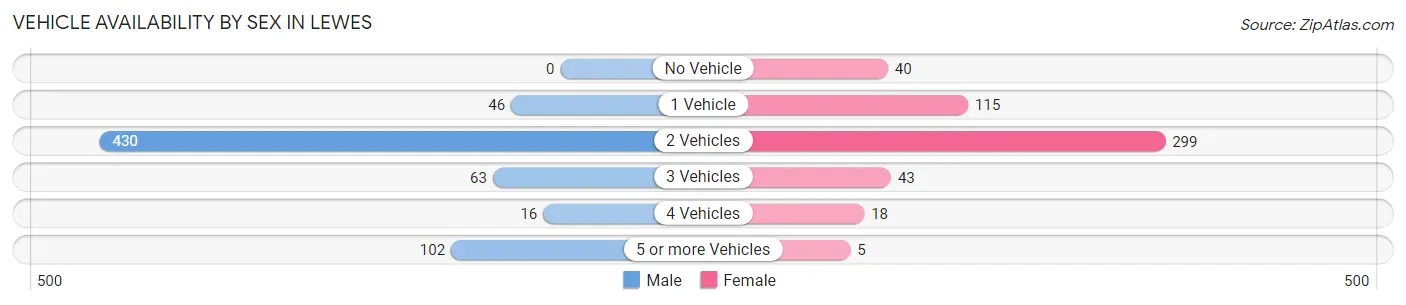
Vehicle Availability by Sex in Lewes
The most prevalent vehicle ownership categories in Lewes are males with 2 vehicles (430, accounting for 65.4%) and females with 2 vehicles (299, making up 82.7%).
| Vehicles Available | Male | Female |
| No Vehicle | 0 (0.0%) | 40 (7.7%) |
| 1 Vehicle | 46 (7.0%) | 115 (22.1%) |
| 2 Vehicles | 430 (65.4%) | 299 (57.5%) |
| 3 Vehicles | 63 (9.6%) | 43 (8.3%) |
| 4 Vehicles | 16 (2.4%) | 18 (3.5%) |
| 5 or more Vehicles | 102 (15.5%) | 5 (1.0%) |
| Total | 657 (100.0%) | 520 (100.0%) |
Commute Time in Lewes
The most frequently occuring commute durations in Lewes are 10 to 14 minutes (186 commuters, 20.7%), 5 to 9 minutes (175 commuters, 19.4%), and 60 to 89 minutes (116 commuters, 12.9%).
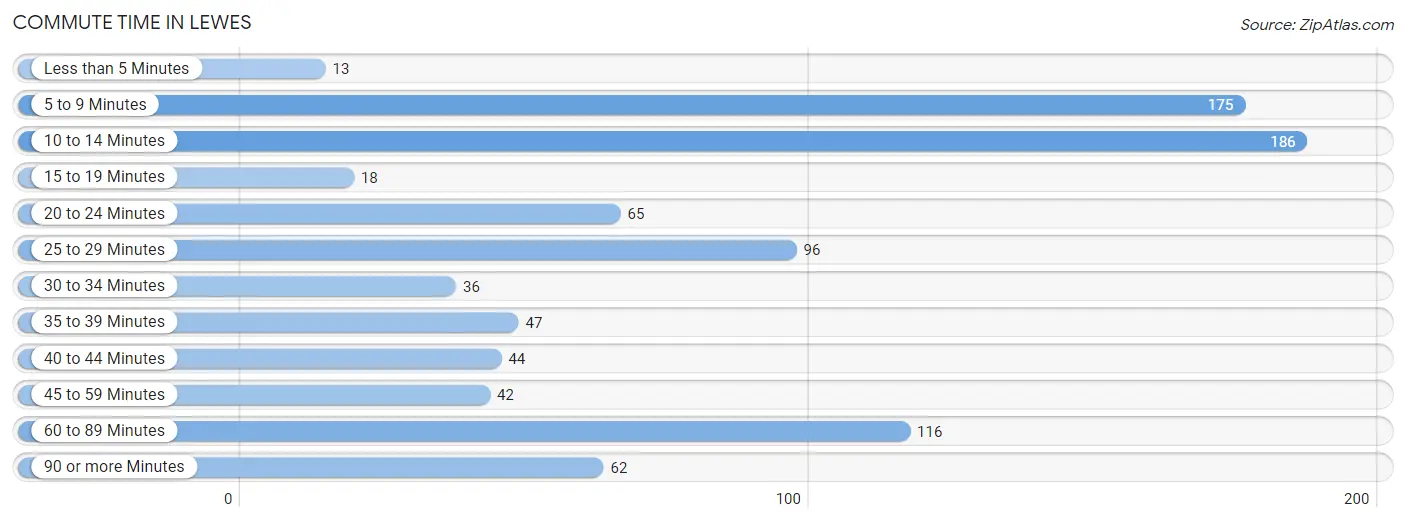
| Commute Time | # Commuters | % Commuters |
| Less than 5 Minutes | 13 | 1.4% |
| 5 to 9 Minutes | 175 | 19.4% |
| 10 to 14 Minutes | 186 | 20.7% |
| 15 to 19 Minutes | 18 | 2.0% |
| 20 to 24 Minutes | 65 | 7.2% |
| 25 to 29 Minutes | 96 | 10.7% |
| 30 to 34 Minutes | 36 | 4.0% |
| 35 to 39 Minutes | 47 | 5.2% |
| 40 to 44 Minutes | 44 | 4.9% |
| 45 to 59 Minutes | 42 | 4.7% |
| 60 to 89 Minutes | 116 | 12.9% |
| 90 or more Minutes | 62 | 6.9% |
Commute Time by Sex in Lewes
The most common commute times in Lewes are 10 to 14 minutes (124 commuters, 25.9%) for males and 5 to 9 minutes (143 commuters, 33.9%) for females.
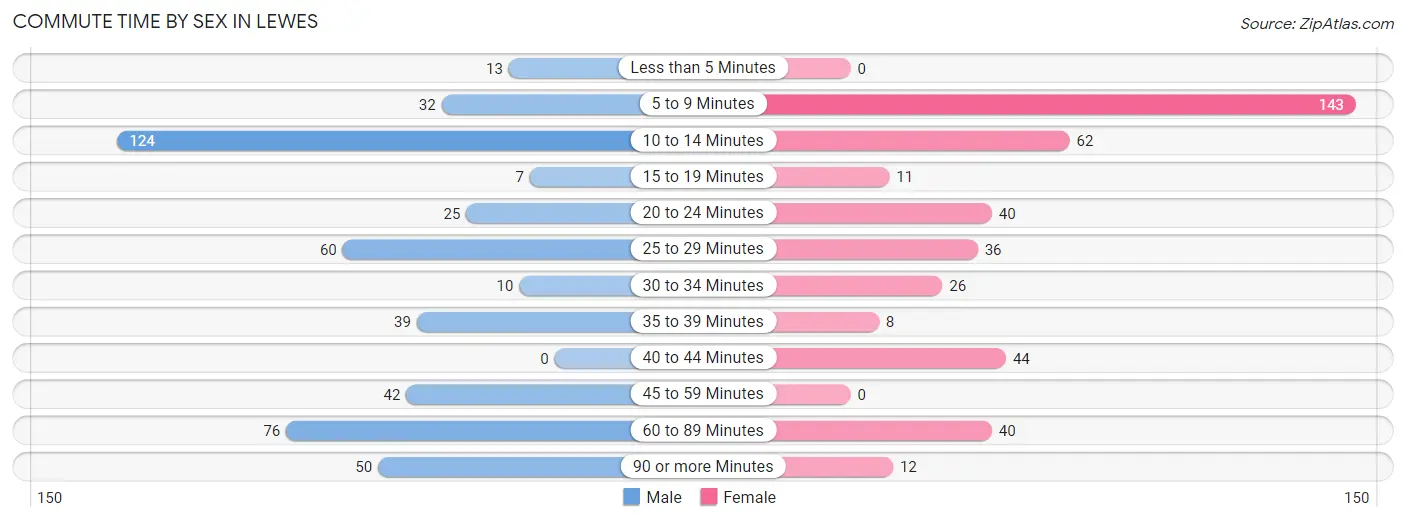
| Commute Time | Male | Female |
| Less than 5 Minutes | 13 (2.7%) | 0 (0.0%) |
| 5 to 9 Minutes | 32 (6.7%) | 143 (33.9%) |
| 10 to 14 Minutes | 124 (25.9%) | 62 (14.7%) |
| 15 to 19 Minutes | 7 (1.5%) | 11 (2.6%) |
| 20 to 24 Minutes | 25 (5.2%) | 40 (9.5%) |
| 25 to 29 Minutes | 60 (12.6%) | 36 (8.5%) |
| 30 to 34 Minutes | 10 (2.1%) | 26 (6.2%) |
| 35 to 39 Minutes | 39 (8.2%) | 8 (1.9%) |
| 40 to 44 Minutes | 0 (0.0%) | 44 (10.4%) |
| 45 to 59 Minutes | 42 (8.8%) | 0 (0.0%) |
| 60 to 89 Minutes | 76 (15.9%) | 40 (9.5%) |
| 90 or more Minutes | 50 (10.5%) | 12 (2.8%) |
Time of Departure to Work by Sex in Lewes
The most frequent times of departure to work in Lewes are 7:30 AM to 7:59 AM (77, 16.1%) for males and 7:30 AM to 7:59 AM (110, 26.1%) for females.
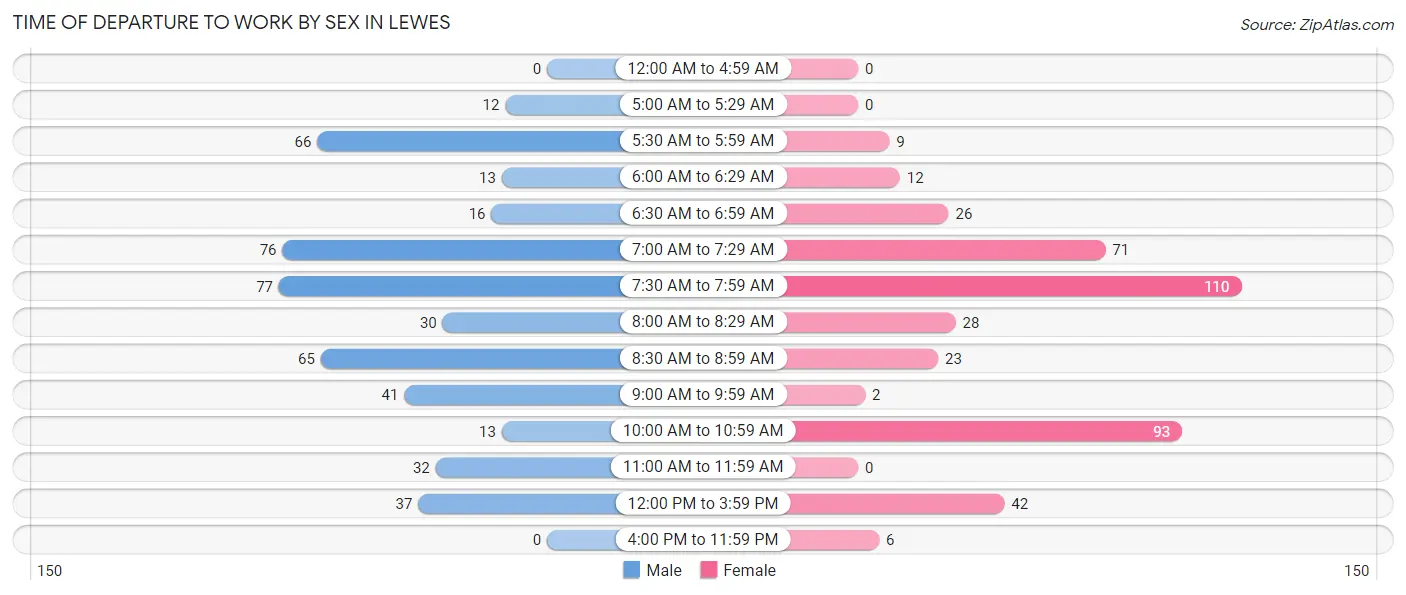
| Time of Departure | Male | Female |
| 12:00 AM to 4:59 AM | 0 (0.0%) | 0 (0.0%) |
| 5:00 AM to 5:29 AM | 12 (2.5%) | 0 (0.0%) |
| 5:30 AM to 5:59 AM | 66 (13.8%) | 9 (2.1%) |
| 6:00 AM to 6:29 AM | 13 (2.7%) | 12 (2.8%) |
| 6:30 AM to 6:59 AM | 16 (3.4%) | 26 (6.2%) |
| 7:00 AM to 7:29 AM | 76 (15.9%) | 71 (16.8%) |
| 7:30 AM to 7:59 AM | 77 (16.1%) | 110 (26.1%) |
| 8:00 AM to 8:29 AM | 30 (6.3%) | 28 (6.6%) |
| 8:30 AM to 8:59 AM | 65 (13.6%) | 23 (5.4%) |
| 9:00 AM to 9:59 AM | 41 (8.6%) | 2 (0.5%) |
| 10:00 AM to 10:59 AM | 13 (2.7%) | 93 (22.0%) |
| 11:00 AM to 11:59 AM | 32 (6.7%) | 0 (0.0%) |
| 12:00 PM to 3:59 PM | 37 (7.7%) | 42 (10.0%) |
| 4:00 PM to 11:59 PM | 0 (0.0%) | 6 (1.4%) |
| Total | 478 (100.0%) | 422 (100.0%) |
Housing Occupancy in Lewes
Occupancy by Ownership in Lewes
Of the total 1,591 dwellings in Lewes, owner-occupied units account for 1,356 (85.2%), while renter-occupied units make up 235 (14.8%).
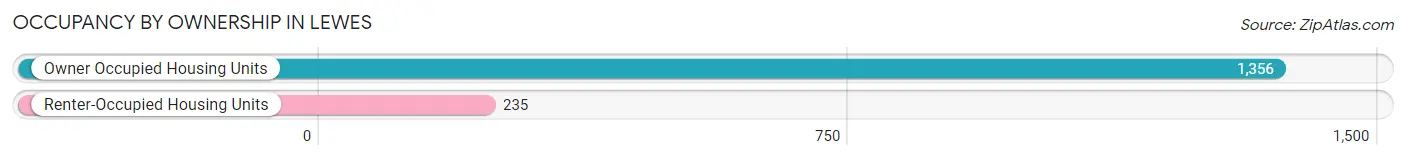
| Occupancy | # Housing Units | % Housing Units |
| Owner Occupied Housing Units | 1,356 | 85.2% |
| Renter-Occupied Housing Units | 235 | 14.8% |
| Total Occupied Housing Units | 1,591 | 100.0% |
Occupancy by Household Size in Lewes
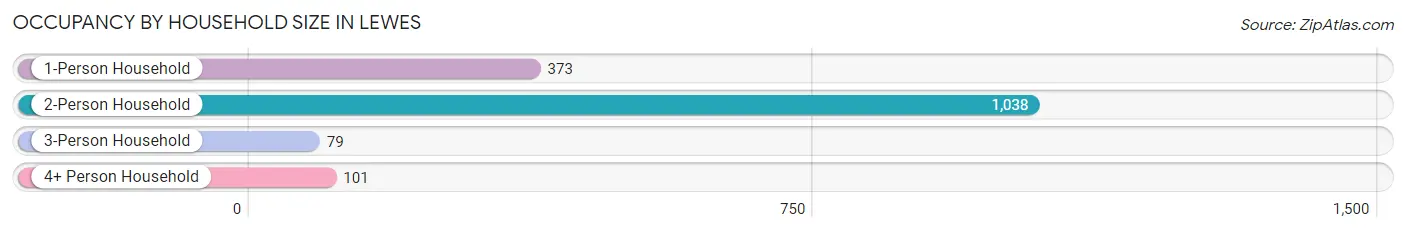
| Household Size | # Housing Units | % Housing Units |
| 1-Person Household | 373 | 23.4% |
| 2-Person Household | 1,038 | 65.2% |
| 3-Person Household | 79 | 5.0% |
| 4+ Person Household | 101 | 6.4% |
| Total Housing Units | 1,591 | 100.0% |
Occupancy by Ownership by Household Size in Lewes
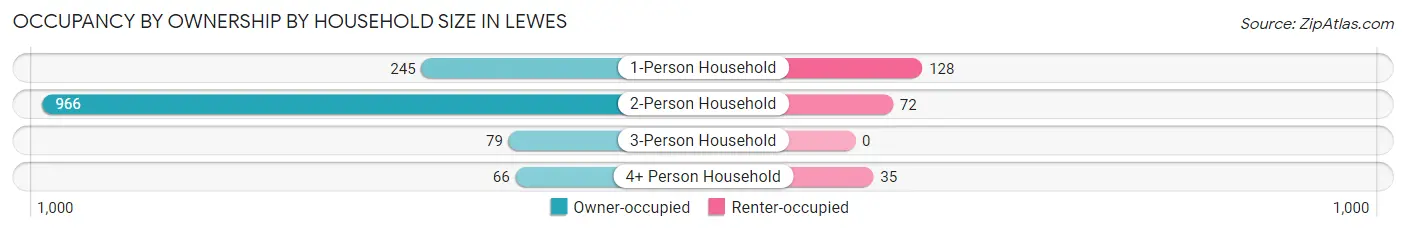
| Household Size | Owner-occupied | Renter-occupied |
| 1-Person Household | 245 (65.7%) | 128 (34.3%) |
| 2-Person Household | 966 (93.1%) | 72 (6.9%) |
| 3-Person Household | 79 (100.0%) | 0 (0.0%) |
| 4+ Person Household | 66 (65.3%) | 35 (34.6%) |
| Total Housing Units | 1,356 (85.2%) | 235 (14.8%) |
Occupancy by Educational Attainment in Lewes
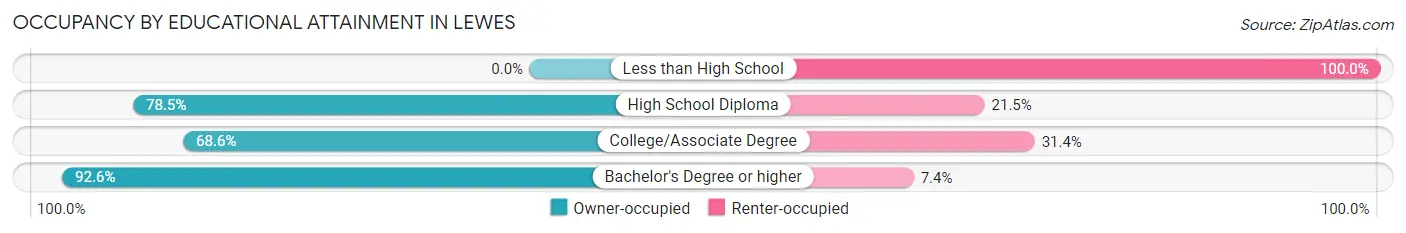
| Household Size | Owner-occupied | Renter-occupied |
| Less than High School | 0 (0.0%) | 23 (100.0%) |
| High School Diploma | 157 (78.5%) | 43 (21.5%) |
| College/Associate Degree | 192 (68.6%) | 88 (31.4%) |
| Bachelor's Degree or higher | 1,007 (92.6%) | 81 (7.4%) |
Occupancy by Age of Householder in Lewes
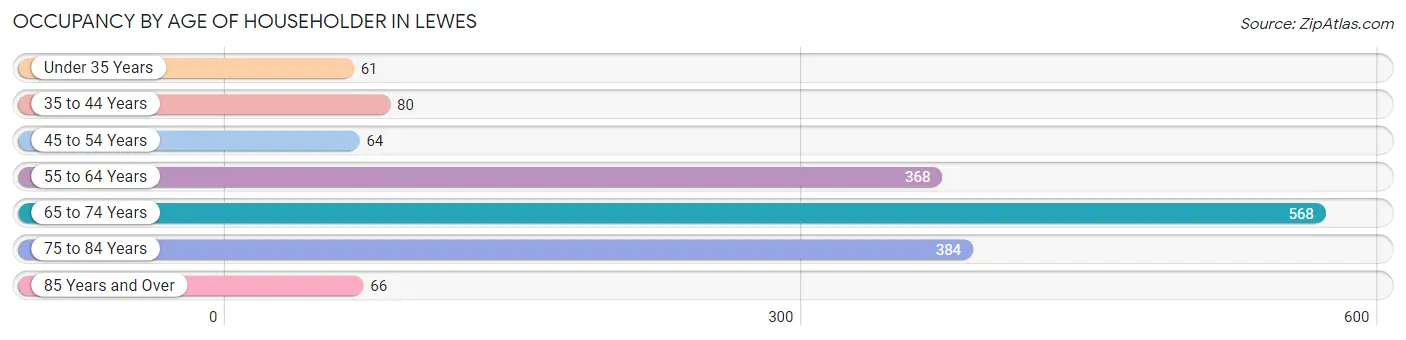
| Age Bracket | # Households | % Households |
| Under 35 Years | 61 | 3.8% |
| 35 to 44 Years | 80 | 5.0% |
| 45 to 54 Years | 64 | 4.0% |
| 55 to 64 Years | 368 | 23.1% |
| 65 to 74 Years | 568 | 35.7% |
| 75 to 84 Years | 384 | 24.1% |
| 85 Years and Over | 66 | 4.2% |
| Total | 1,591 | 100.0% |
Housing Finances in Lewes
Median Income by Occupancy in Lewes
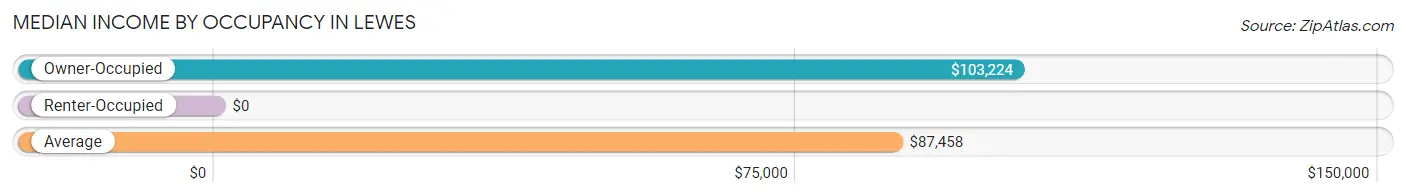
| Occupancy Type | # Households | Median Income |
| Owner-Occupied | 1,356 (85.2%) | $103,224 |
| Renter-Occupied | 235 (14.8%) | $0 |
| Average | 1,591 (100.0%) | $87,458 |
Occupancy by Householder Income Bracket in Lewes
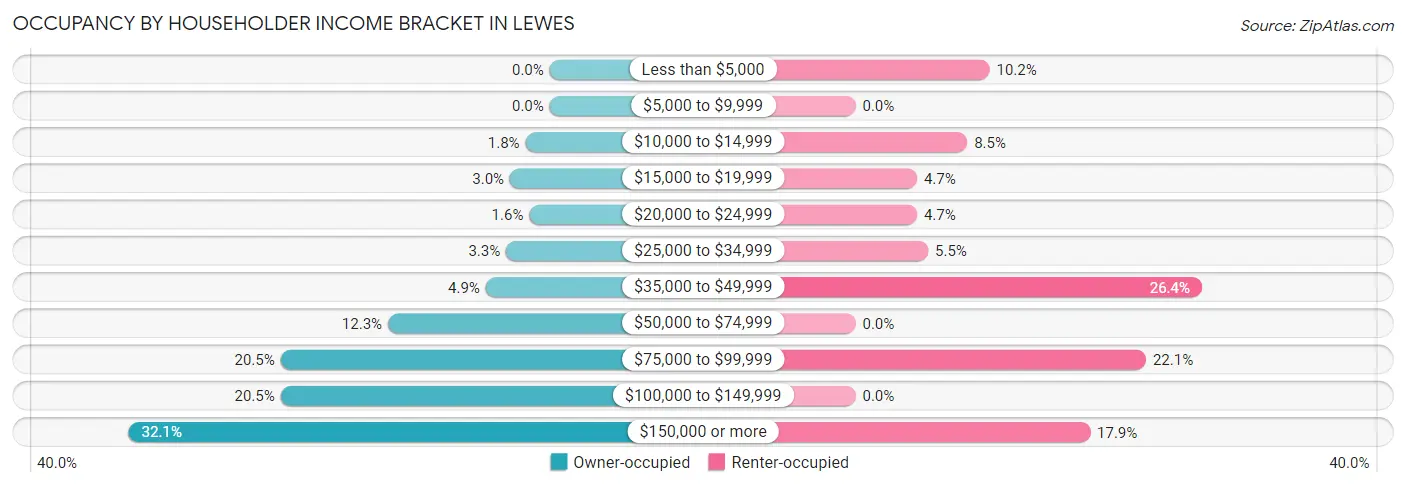
| Income Bracket | Owner-occupied | Renter-occupied |
| Less than $5,000 | 0 (0.0%) | 24 (10.2%) |
| $5,000 to $9,999 | 0 (0.0%) | 0 (0.0%) |
| $10,000 to $14,999 | 25 (1.8%) | 20 (8.5%) |
| $15,000 to $19,999 | 41 (3.0%) | 11 (4.7%) |
| $20,000 to $24,999 | 21 (1.5%) | 11 (4.7%) |
| $25,000 to $34,999 | 45 (3.3%) | 13 (5.5%) |
| $35,000 to $49,999 | 66 (4.9%) | 62 (26.4%) |
| $50,000 to $74,999 | 167 (12.3%) | 0 (0.0%) |
| $75,000 to $99,999 | 278 (20.5%) | 52 (22.1%) |
| $100,000 to $149,999 | 278 (20.5%) | 0 (0.0%) |
| $150,000 or more | 435 (32.1%) | 42 (17.9%) |
| Total | 1,356 (100.0%) | 235 (100.0%) |
Monthly Housing Cost Tiers in Lewes
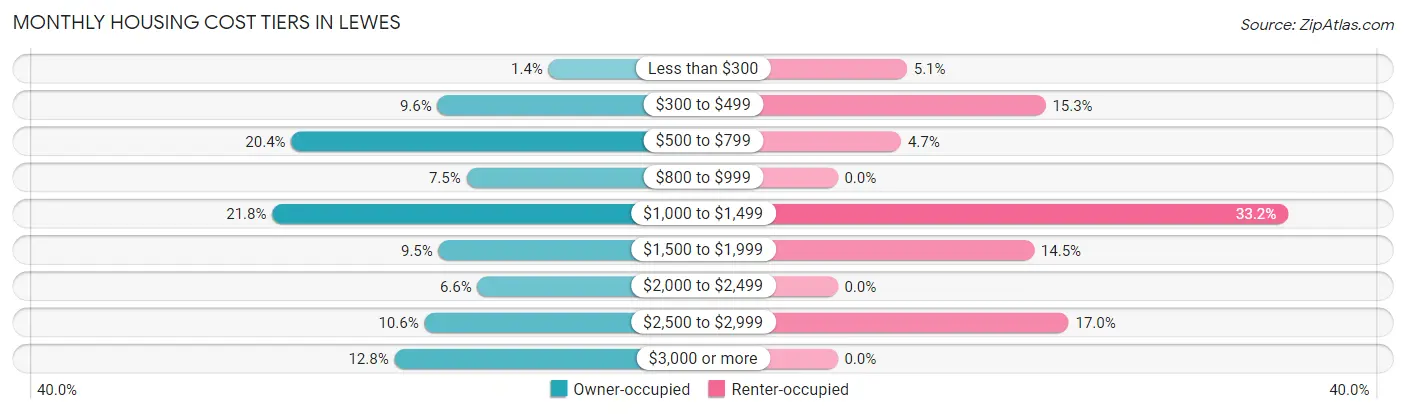
| Monthly Cost | Owner-occupied | Renter-occupied |
| Less than $300 | 19 (1.4%) | 12 (5.1%) |
| $300 to $499 | 130 (9.6%) | 36 (15.3%) |
| $500 to $799 | 276 (20.3%) | 11 (4.7%) |
| $800 to $999 | 101 (7.4%) | 0 (0.0%) |
| $1,000 to $1,499 | 295 (21.8%) | 78 (33.2%) |
| $1,500 to $1,999 | 129 (9.5%) | 34 (14.5%) |
| $2,000 to $2,499 | 90 (6.6%) | 0 (0.0%) |
| $2,500 to $2,999 | 143 (10.5%) | 40 (17.0%) |
| $3,000 or more | 173 (12.8%) | 0 (0.0%) |
| Total | 1,356 (100.0%) | 235 (100.0%) |
Physical Housing Characteristics in Lewes
Housing Structures in Lewes
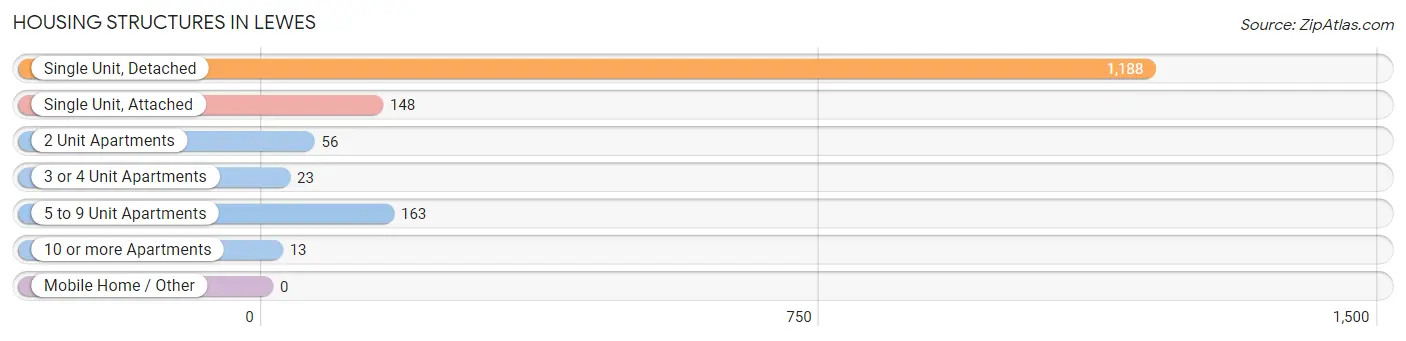
| Structure Type | # Housing Units | % Housing Units |
| Single Unit, Detached | 1,188 | 74.7% |
| Single Unit, Attached | 148 | 9.3% |
| 2 Unit Apartments | 56 | 3.5% |
| 3 or 4 Unit Apartments | 23 | 1.5% |
| 5 to 9 Unit Apartments | 163 | 10.2% |
| 10 or more Apartments | 13 | 0.8% |
| Mobile Home / Other | 0 | 0.0% |
| Total | 1,591 | 100.0% |
Housing Structures by Occupancy in Lewes
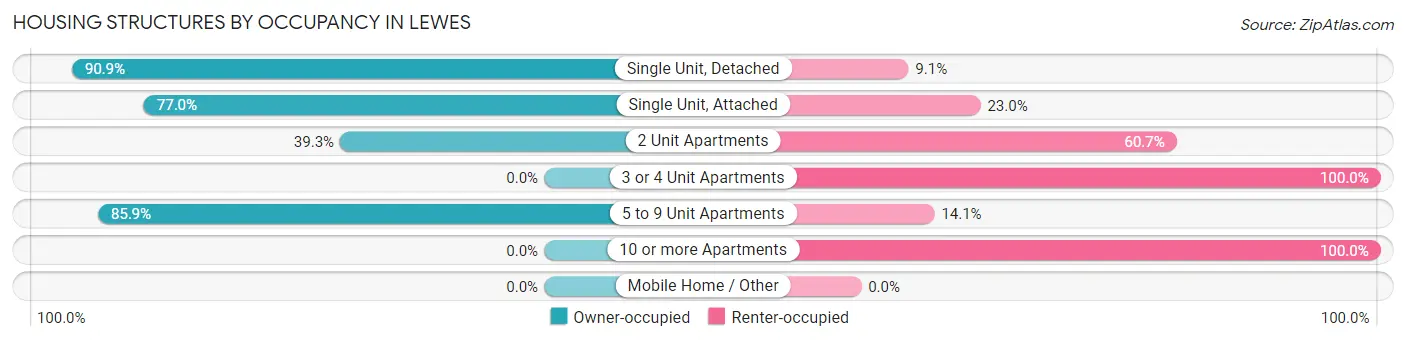
| Structure Type | Owner-occupied | Renter-occupied |
| Single Unit, Detached | 1,080 (90.9%) | 108 (9.1%) |
| Single Unit, Attached | 114 (77.0%) | 34 (23.0%) |
| 2 Unit Apartments | 22 (39.3%) | 34 (60.7%) |
| 3 or 4 Unit Apartments | 0 (0.0%) | 23 (100.0%) |
| 5 to 9 Unit Apartments | 140 (85.9%) | 23 (14.1%) |
| 10 or more Apartments | 0 (0.0%) | 13 (100.0%) |
| Mobile Home / Other | 0 (0.0%) | 0 (0.0%) |
| Total | 1,356 (85.2%) | 235 (14.8%) |
Housing Structures by Number of Rooms in Lewes
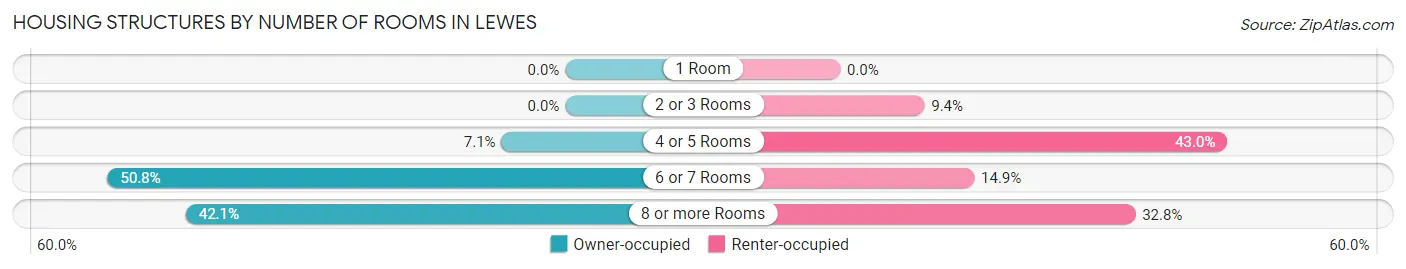
| Number of Rooms | Owner-occupied | Renter-occupied |
| 1 Room | 0 (0.0%) | 0 (0.0%) |
| 2 or 3 Rooms | 0 (0.0%) | 22 (9.4%) |
| 4 or 5 Rooms | 96 (7.1%) | 101 (43.0%) |
| 6 or 7 Rooms | 689 (50.8%) | 35 (14.9%) |
| 8 or more Rooms | 571 (42.1%) | 77 (32.8%) |
| Total | 1,356 (100.0%) | 235 (100.0%) |
Housing Structure by Heating Type in Lewes
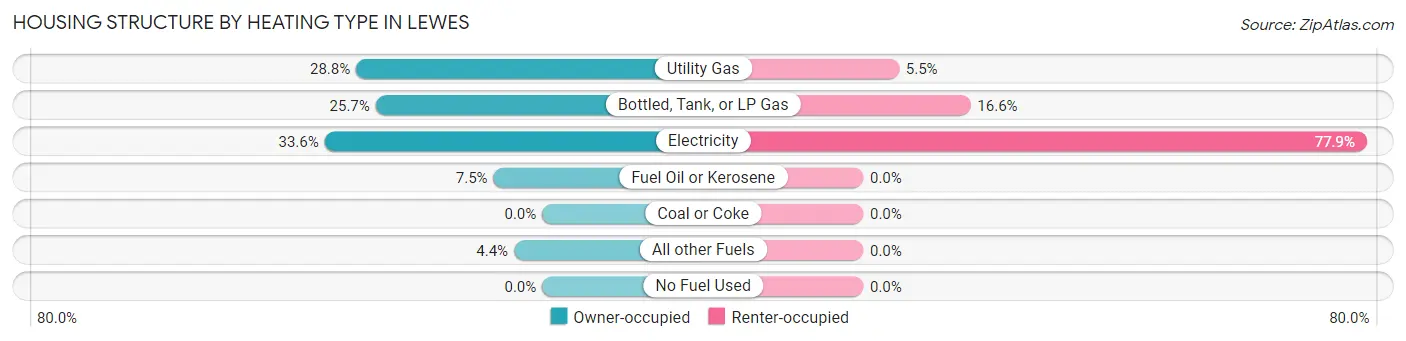
| Heating Type | Owner-occupied | Renter-occupied |
| Utility Gas | 390 (28.8%) | 13 (5.5%) |
| Bottled, Tank, or LP Gas | 349 (25.7%) | 39 (16.6%) |
| Electricity | 456 (33.6%) | 183 (77.9%) |
| Fuel Oil or Kerosene | 102 (7.5%) | 0 (0.0%) |
| Coal or Coke | 0 (0.0%) | 0 (0.0%) |
| All other Fuels | 59 (4.3%) | 0 (0.0%) |
| No Fuel Used | 0 (0.0%) | 0 (0.0%) |
| Total | 1,356 (100.0%) | 235 (100.0%) |
Household Vehicle Usage in Lewes
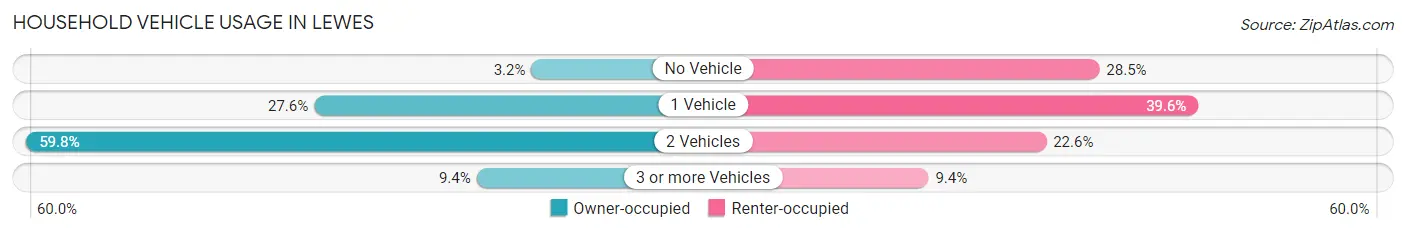
| Vehicles per Household | Owner-occupied | Renter-occupied |
| No Vehicle | 44 (3.2%) | 67 (28.5%) |
| 1 Vehicle | 374 (27.6%) | 93 (39.6%) |
| 2 Vehicles | 811 (59.8%) | 53 (22.6%) |
| 3 or more Vehicles | 127 (9.4%) | 22 (9.4%) |
| Total | 1,356 (100.0%) | 235 (100.0%) |
Real Estate & Mortgages in Lewes
Real Estate and Mortgage Overview in Lewes
| Characteristic | Without Mortgage | With Mortgage |
| Housing Units | 766 | 590 |
| Median Property Value | $794,900 | $746,500 |
| Median Household Income | $77,065 | $320 |
| Monthly Housing Costs | $741 | $173 |
| Real Estate Taxes | $2,246 | $0 |
Property Value by Mortgage Status in Lewes
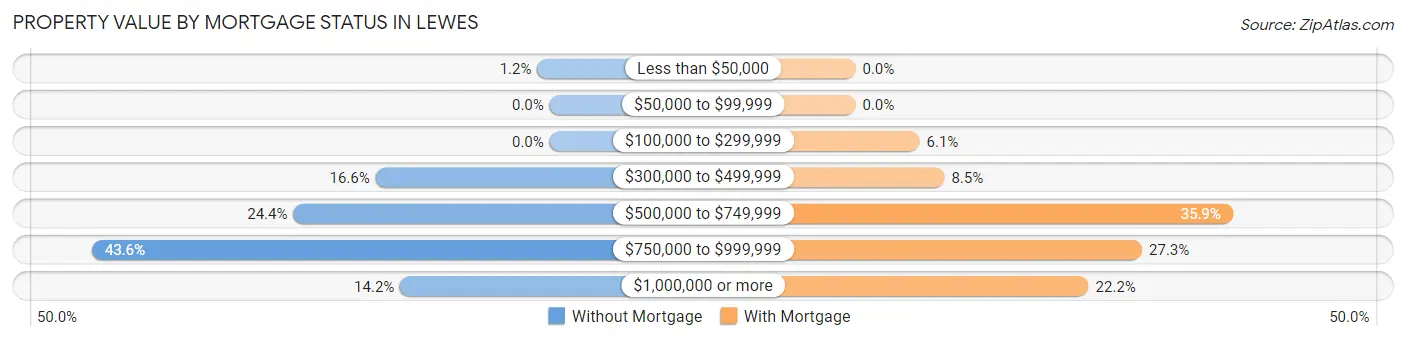
| Property Value | Without Mortgage | With Mortgage |
| Less than $50,000 | 9 (1.2%) | 0 (0.0%) |
| $50,000 to $99,999 | 0 (0.0%) | 0 (0.0%) |
| $100,000 to $299,999 | 0 (0.0%) | 36 (6.1%) |
| $300,000 to $499,999 | 127 (16.6%) | 50 (8.5%) |
| $500,000 to $749,999 | 187 (24.4%) | 212 (35.9%) |
| $750,000 to $999,999 | 334 (43.6%) | 161 (27.3%) |
| $1,000,000 or more | 109 (14.2%) | 131 (22.2%) |
| Total | 766 (100.0%) | 590 (100.0%) |
Household Income by Mortgage Status in Lewes
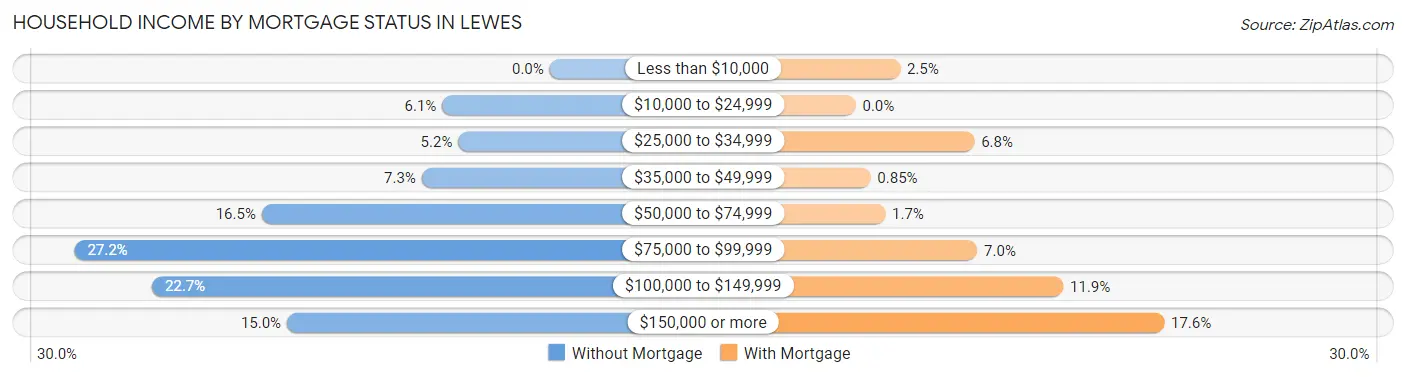
| Household Income | Without Mortgage | With Mortgage |
| Less than $10,000 | 0 (0.0%) | 15 (2.5%) |
| $10,000 to $24,999 | 47 (6.1%) | 0 (0.0%) |
| $25,000 to $34,999 | 40 (5.2%) | 40 (6.8%) |
| $35,000 to $49,999 | 56 (7.3%) | 5 (0.9%) |
| $50,000 to $74,999 | 126 (16.5%) | 10 (1.7%) |
| $75,000 to $99,999 | 208 (27.2%) | 41 (7.0%) |
| $100,000 to $149,999 | 174 (22.7%) | 70 (11.9%) |
| $150,000 or more | 115 (15.0%) | 104 (17.6%) |
| Total | 766 (100.0%) | 590 (100.0%) |
Property Value to Household Income Ratio in Lewes
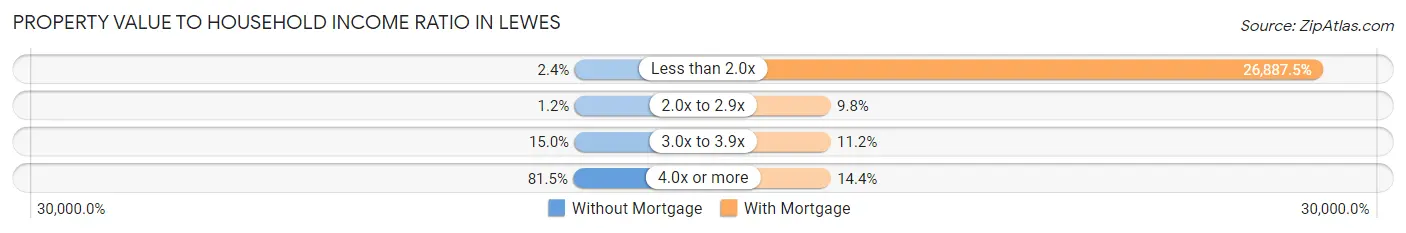
| Value-to-Income Ratio | Without Mortgage | With Mortgage |
| Less than 2.0x | 18 (2.4%) | 158,636 (26,887.5%) |
| 2.0x to 2.9x | 9 (1.2%) | 58 (9.8%) |
| 3.0x to 3.9x | 115 (15.0%) | 66 (11.2%) |
| 4.0x or more | 624 (81.5%) | 85 (14.4%) |
| Total | 766 (100.0%) | 590 (100.0%) |
Real Estate Taxes by Mortgage Status in Lewes
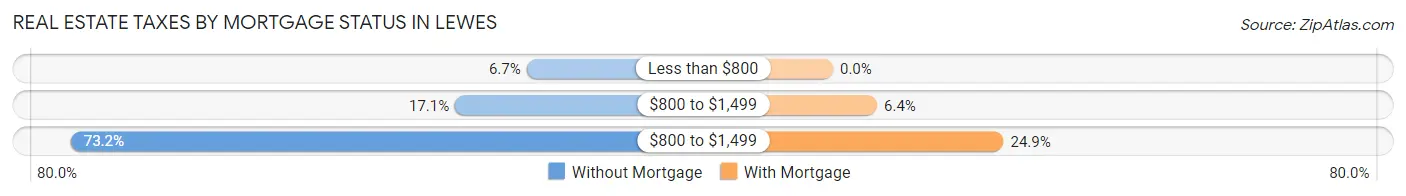
| Property Taxes | Without Mortgage | With Mortgage |
| Less than $800 | 51 (6.7%) | 0 (0.0%) |
| $800 to $1,499 | 131 (17.1%) | 38 (6.4%) |
| $800 to $1,499 | 561 (73.2%) | 147 (24.9%) |
| Total | 766 (100.0%) | 590 (100.0%) |
Health & Disability in Lewes
Health Insurance Coverage by Age in Lewes
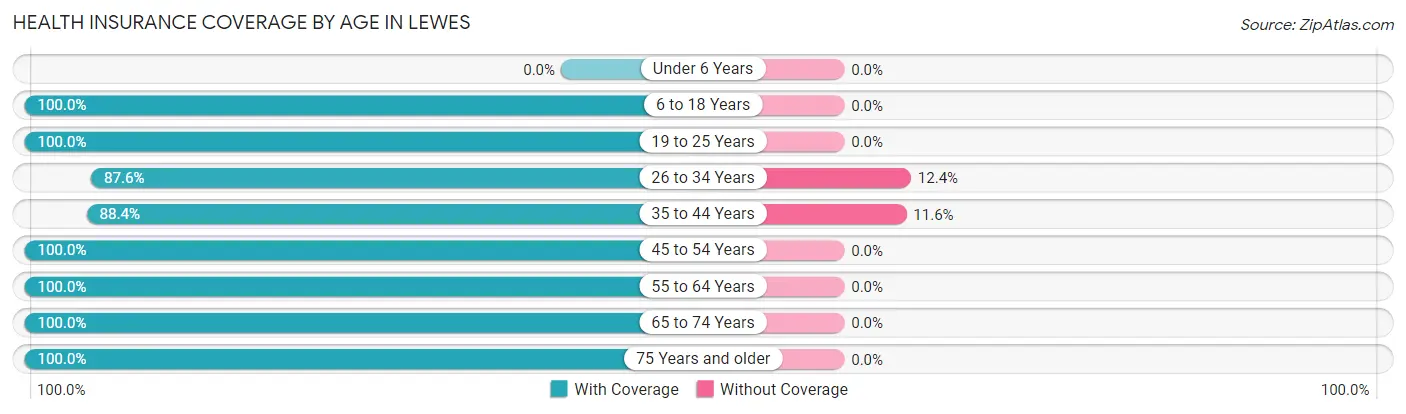
| Age Bracket | With Coverage | Without Coverage |
| Under 6 Years | 0 (0.0%) | 0 (0.0%) |
| 6 to 18 Years | 198 (100.0%) | 0 (0.0%) |
| 19 to 25 Years | 96 (100.0%) | 0 (0.0%) |
| 26 to 34 Years | 141 (87.6%) | 20 (12.4%) |
| 35 to 44 Years | 168 (88.4%) | 22 (11.6%) |
| 45 to 54 Years | 132 (100.0%) | 0 (0.0%) |
| 55 to 64 Years | 656 (100.0%) | 0 (0.0%) |
| 65 to 74 Years | 1,085 (100.0%) | 0 (0.0%) |
| 75 Years and older | 643 (100.0%) | 0 (0.0%) |
| Total | 3,119 (98.7%) | 42 (1.3%) |
Health Insurance Coverage by Citizenship Status in Lewes
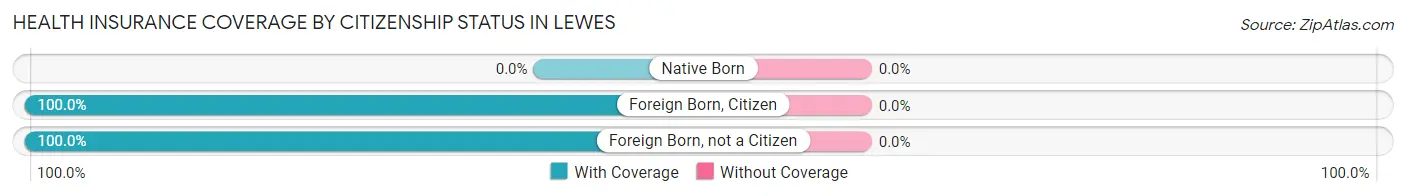
| Citizenship Status | With Coverage | Without Coverage |
| Native Born | 0 (0.0%) | 0 (0.0%) |
| Foreign Born, Citizen | 198 (100.0%) | 0 (0.0%) |
| Foreign Born, not a Citizen | 96 (100.0%) | 0 (0.0%) |
Health Insurance Coverage by Household Income in Lewes
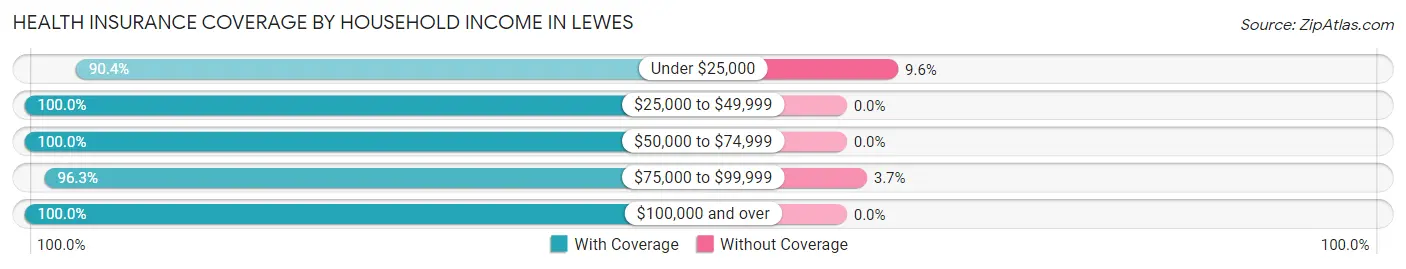
| Household Income | With Coverage | Without Coverage |
| Under $25,000 | 188 (90.4%) | 20 (9.6%) |
| $25,000 to $49,999 | 348 (100.0%) | 0 (0.0%) |
| $50,000 to $74,999 | 247 (100.0%) | 0 (0.0%) |
| $75,000 to $99,999 | 567 (96.3%) | 22 (3.7%) |
| $100,000 and over | 1,769 (100.0%) | 0 (0.0%) |
Public vs Private Health Insurance Coverage by Age in Lewes
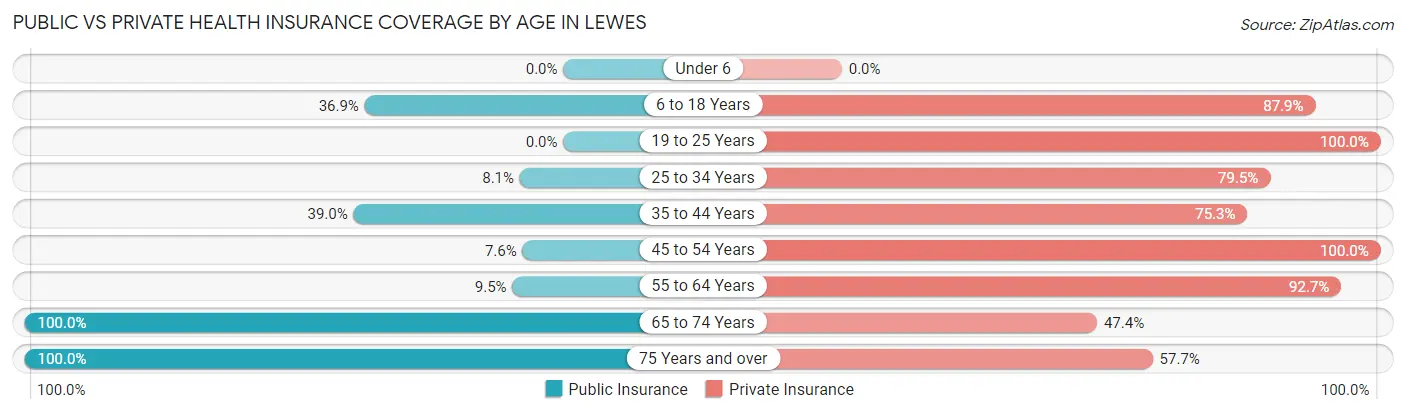
| Age Bracket | Public Insurance | Private Insurance |
| Under 6 | 0 (0.0%) | 0 (0.0%) |
| 6 to 18 Years | 73 (36.9%) | 174 (87.9%) |
| 19 to 25 Years | 0 (0.0%) | 96 (100.0%) |
| 25 to 34 Years | 13 (8.1%) | 128 (79.5%) |
| 35 to 44 Years | 74 (39.0%) | 143 (75.3%) |
| 45 to 54 Years | 10 (7.6%) | 132 (100.0%) |
| 55 to 64 Years | 62 (9.5%) | 608 (92.7%) |
| 65 to 74 Years | 1,085 (100.0%) | 514 (47.4%) |
| 75 Years and over | 643 (100.0%) | 371 (57.7%) |
| Total | 1,960 (62.0%) | 2,166 (68.5%) |
Disability Status by Sex by Age in Lewes
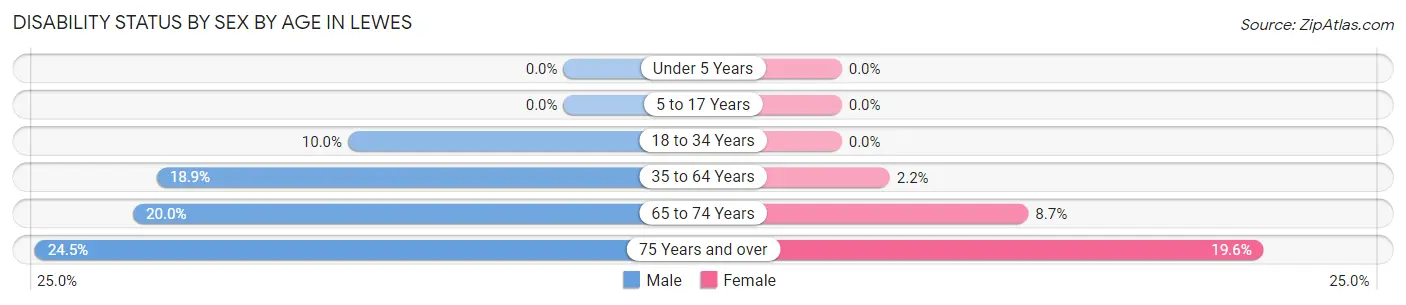
| Age Bracket | Male | Female |
| Under 5 Years | 0 (0.0%) | 0 (0.0%) |
| 5 to 17 Years | 0 (0.0%) | 0 (0.0%) |
| 18 to 34 Years | 20 (10.0%) | 0 (0.0%) |
| 35 to 64 Years | 83 (18.9%) | 12 (2.2%) |
| 65 to 74 Years | 99 (20.0%) | 51 (8.7%) |
| 75 Years and over | 90 (24.5%) | 54 (19.6%) |
Disability Class by Sex by Age in Lewes
Disability Class: Hearing Difficulty
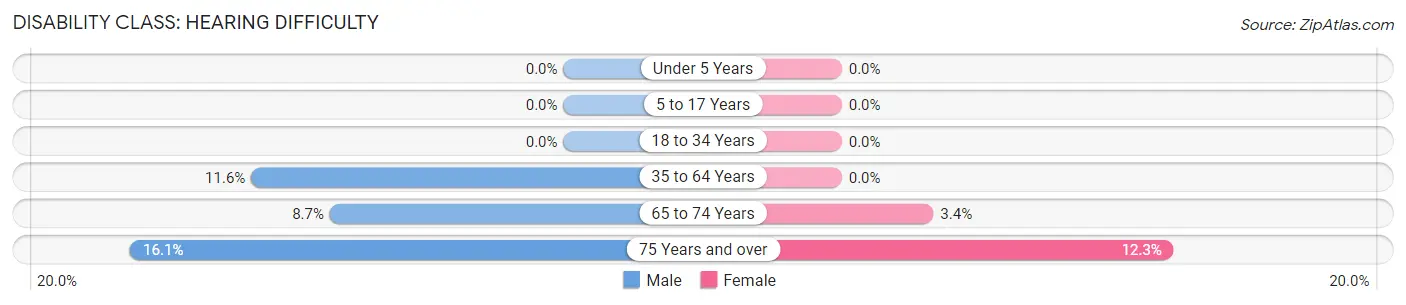
| Age Bracket | Male | Female |
| Under 5 Years | 0 (0.0%) | 0 (0.0%) |
| 5 to 17 Years | 0 (0.0%) | 0 (0.0%) |
| 18 to 34 Years | 0 (0.0%) | 0 (0.0%) |
| 35 to 64 Years | 51 (11.6%) | 0 (0.0%) |
| 65 to 74 Years | 43 (8.7%) | 20 (3.4%) |
| 75 Years and over | 59 (16.1%) | 34 (12.3%) |
Disability Class: Vision Difficulty
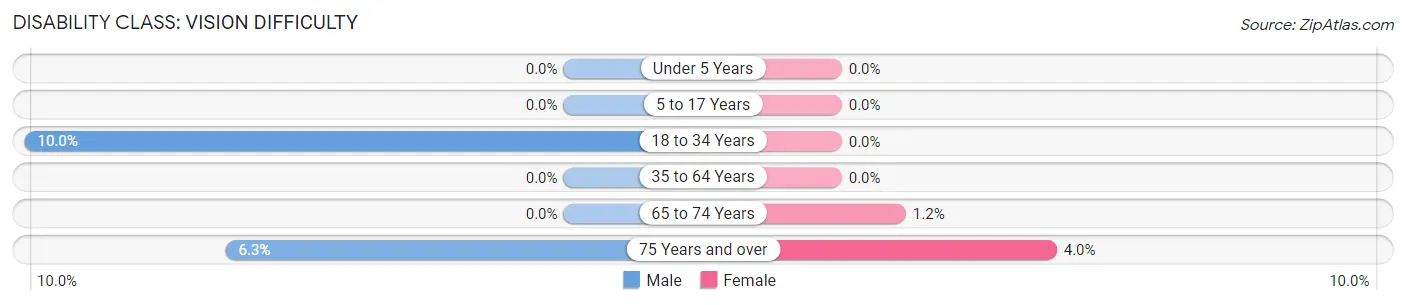
| Age Bracket | Male | Female |
| Under 5 Years | 0 (0.0%) | 0 (0.0%) |
| 5 to 17 Years | 0 (0.0%) | 0 (0.0%) |
| 18 to 34 Years | 20 (10.0%) | 0 (0.0%) |
| 35 to 64 Years | 0 (0.0%) | 0 (0.0%) |
| 65 to 74 Years | 0 (0.0%) | 7 (1.2%) |
| 75 Years and over | 23 (6.3%) | 11 (4.0%) |
Disability Class: Cognitive Difficulty
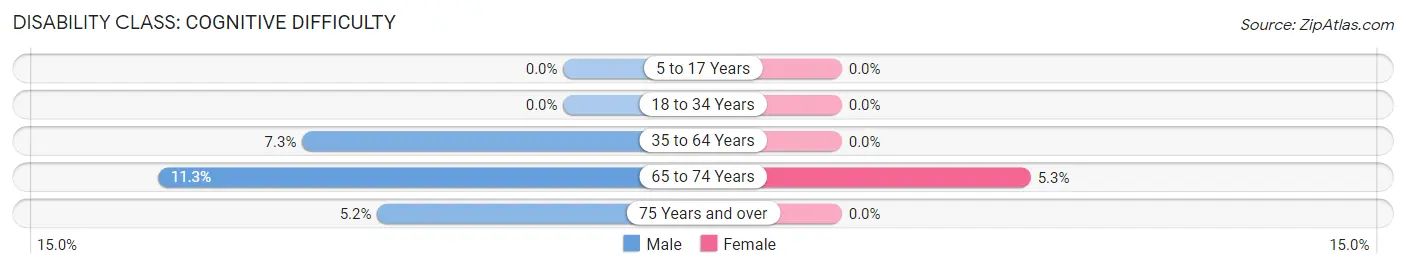
| Age Bracket | Male | Female |
| 5 to 17 Years | 0 (0.0%) | 0 (0.0%) |
| 18 to 34 Years | 0 (0.0%) | 0 (0.0%) |
| 35 to 64 Years | 32 (7.3%) | 0 (0.0%) |
| 65 to 74 Years | 56 (11.3%) | 31 (5.3%) |
| 75 Years and over | 19 (5.2%) | 0 (0.0%) |
Disability Class: Ambulatory Difficulty
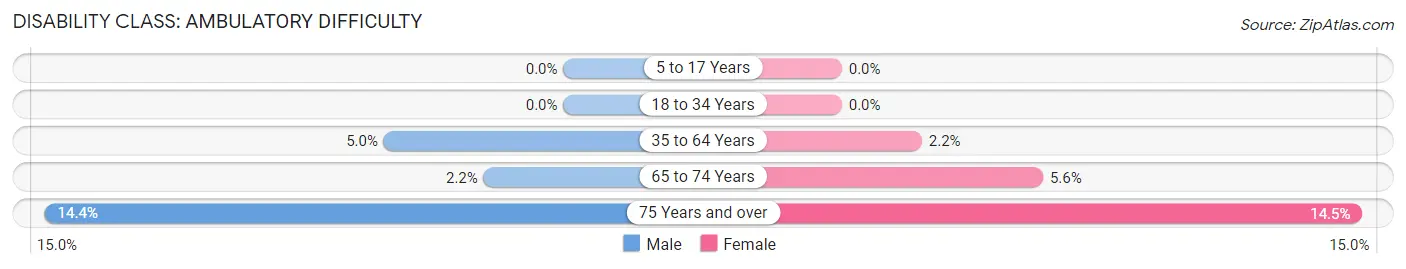
| Age Bracket | Male | Female |
| 5 to 17 Years | 0 (0.0%) | 0 (0.0%) |
| 18 to 34 Years | 0 (0.0%) | 0 (0.0%) |
| 35 to 64 Years | 22 (5.0%) | 12 (2.2%) |
| 65 to 74 Years | 11 (2.2%) | 33 (5.6%) |
| 75 Years and over | 53 (14.4%) | 40 (14.5%) |
Disability Class: Self-Care Difficulty
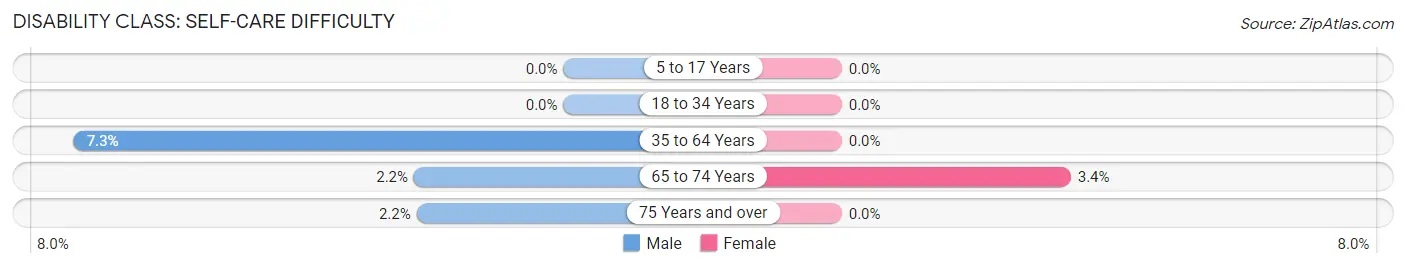
| Age Bracket | Male | Female |
| 5 to 17 Years | 0 (0.0%) | 0 (0.0%) |
| 18 to 34 Years | 0 (0.0%) | 0 (0.0%) |
| 35 to 64 Years | 32 (7.3%) | 0 (0.0%) |
| 65 to 74 Years | 11 (2.2%) | 20 (3.4%) |
| 75 Years and over | 8 (2.2%) | 0 (0.0%) |
Technology Access in Lewes
Computing Device Access in Lewes
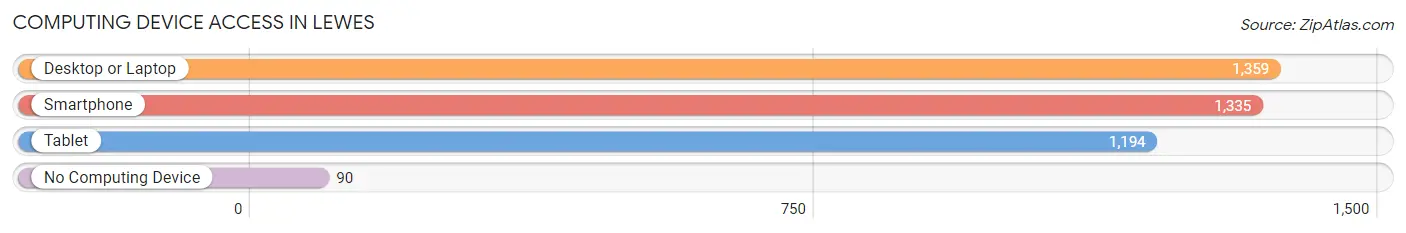
| Device Type | # Households | % Households |
| Desktop or Laptop | 1,359 | 85.4% |
| Smartphone | 1,335 | 83.9% |
| Tablet | 1,194 | 75.0% |
| No Computing Device | 90 | 5.7% |
| Total | 1,591 | 100.0% |
Internet Access in Lewes
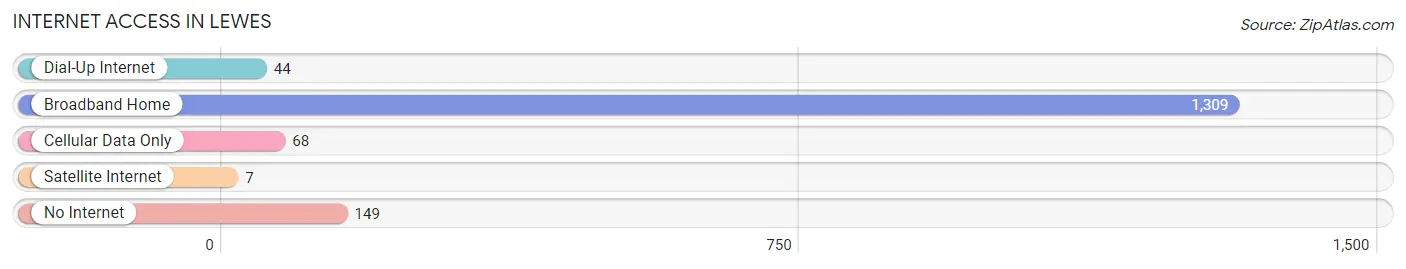
| Internet Type | # Households | % Households |
| Dial-Up Internet | 44 | 2.8% |
| Broadband Home | 1,309 | 82.3% |
| Cellular Data Only | 68 | 4.3% |
| Satellite Internet | 7 | 0.4% |
| No Internet | 149 | 9.4% |
| Total | 1,591 | 100.0% |
Lewes Summary
Lewes, Delaware is a small town located in Sussex County, Delaware. It is situated on the Delaware Bay, just south of the Maryland border. The town has a population of 3,085 as of the 2010 census, making it the second-smallest incorporated city in the state. Lewes is known for its historic charm, its beaches, and its proximity to the Atlantic Ocean.
History
Lewes was founded in 1631 by Dutch settlers, making it the oldest town in Delaware. The town was originally called Zwaanendael, which means “Valley of Swans” in Dutch. The town was renamed Lewes in 1682, after the town of Lewes in England.
Lewes was an important port during the colonial era, and was the site of the first lighthouse in the United States. The town was also the site of the first naval battle of the American Revolution, the Battle of Lewes.
During the 19th century, Lewes was a popular resort town, and many of the town’s historic buildings date from this period. The town was also the site of the first life-saving station in the United States, established in 1876.
Geography
Lewes is located at the mouth of the Delaware Bay, just south of the Maryland border. The town is situated on a peninsula, with the Atlantic Ocean to the east and the Delaware Bay to the west. The town is bordered by the towns of Rehoboth Beach to the north and Milton to the south.
The town has a total area of 4.2 square miles, of which 3.9 square miles is land and 0.3 square miles is water. The town is located in a humid subtropical climate zone, with hot, humid summers and mild winters.
Economy
The economy of Lewes is largely based on tourism. The town is a popular destination for beachgoers, and is home to several resorts and hotels. The town is also home to several restaurants, shops, and other businesses catering to tourists.
The town is also home to several marinas, which provide services to recreational boaters. The town is also home to several boatyards, which provide services to commercial fishermen.
Demographics
As of the 2010 census, the population of Lewes was 3,085. The racial makeup of the town was 94.3% White, 2.2% African American, 0.7% Native American, 0.7% Asian, 0.2% Pacific Islander, 0.7% from other races, and 1.2% from two or more races. Hispanic or Latino of any race were 2.2% of the population.
The median income for a household in the town was $50,977, and the median income for a family was $60,977. The per capita income for the town was $30,977. About 8.2% of families and 10.2% of the population were below the poverty line, including 14.2% of those under age 18 and 5.2% of those age 65 or over.
Common Questions
What is the Total Population of Lewes?
Total Population of Lewes is 3,339.
What is the Total Male Population of Lewes?
Total Male Population of Lewes is 1,686.
What is the Total Female Population of Lewes?
Total Female Population of Lewes is 1,653.
What is the Ratio of Males per 100 Females in Lewes?
There are 102.00 Males per 100 Females in Lewes.
What is the Ratio of Females per 100 Males in Lewes?
There are 98.04 Females per 100 Males in Lewes.
What is the Median Population Age in Lewes?
Median Population Age in Lewes is 66.5 Years.
What is the Average Family Size in Lewes
Average Family Size in Lewes is 2.2 People.
What is the Average Household Size in Lewes
Average Household Size in Lewes is 2.0 People.
What is Per Capita Income in Lewes?
Per Capita income in Lewes is $63,941.
What is the Median Family Income in Lewes?
Median Family Income in Lewes is $112,969.
What is the Median Household income in Lewes?
Median Household Income in Lewes is $87,458.
What is Income or Wage Gap in Lewes?
Income or Wage Gap in Lewes is 30.4%.
Women in Lewes earn 69.6 cents for every dollar earned by a man.
What is Inequality or Gini Index in Lewes?
Inequality or Gini Index in Lewes is 0.46.
How Large is the Labor Force in Lewes?
There are 1,198 People in the Labor Forcein in Lewes.
What is the Percentage of People in the Labor Force in Lewes?
38.1% of People are in the Labor Force in Lewes.
What is the Unemployment Rate in Lewes?
Unemployment Rate in Lewes is 1.0%.