Fenwick Island, DE
Fenwick Island Map
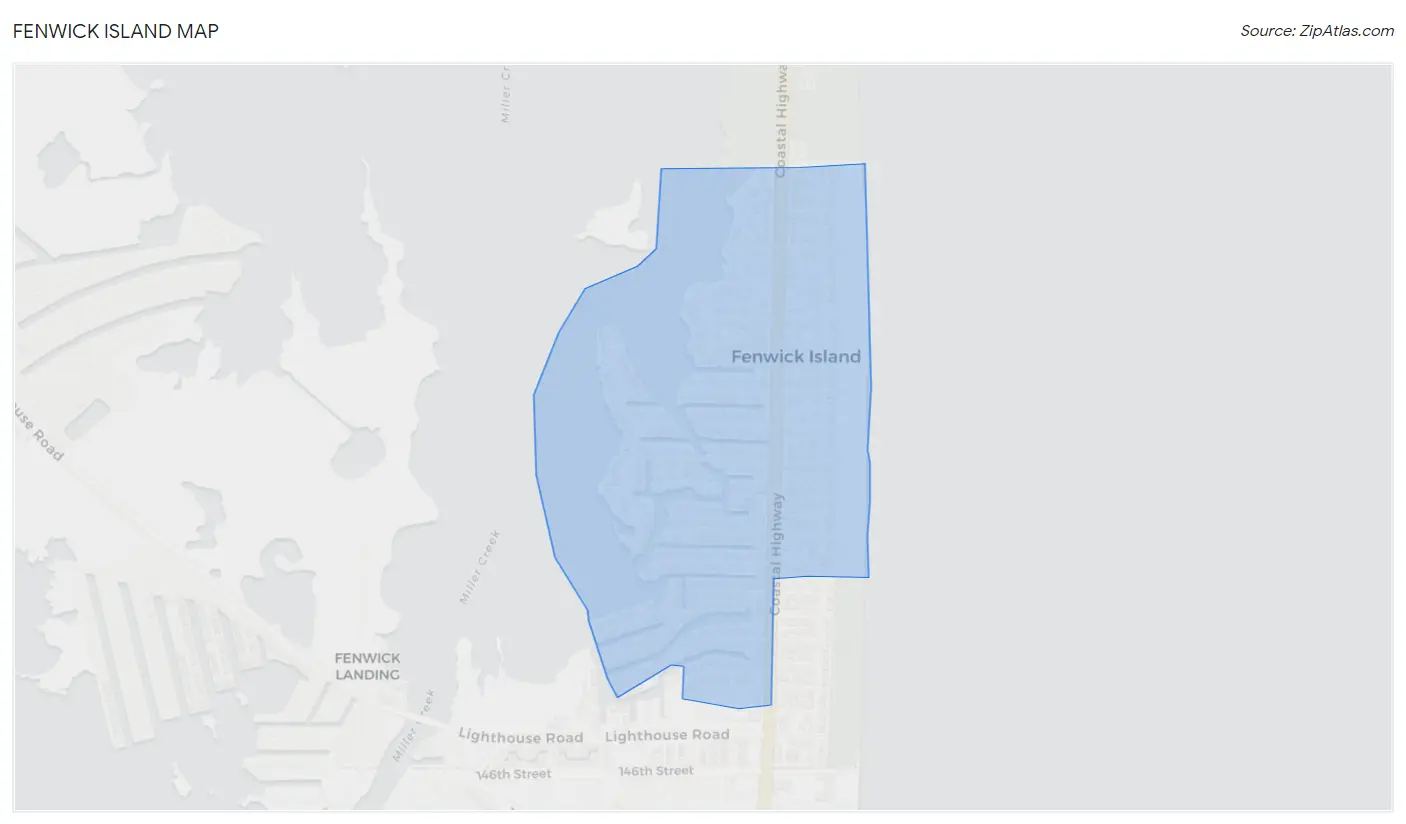
Fenwick Island Overview
350
TOTAL POPULATION
161
MALE POPULATION
189
FEMALE POPULATION
85.19
MALES / 100 FEMALES
117.39
FEMALES / 100 MALES
70.1
MEDIAN AGE
2.1
AVG FAMILY SIZE
1.8
AVG HOUSEHOLD SIZE
$118,955
PER CAPITA INCOME
$178,125
AVG FAMILY INCOME
$118,438
AVG HOUSEHOLD INCOME
0.54
INEQUALITY / GINI INDEX
107
LABOR FORCE [ PEOPLE ]
31.6%
PERCENT IN LABOR FORCE
Fenwick Island Zip Codes
Fenwick Island Area Codes
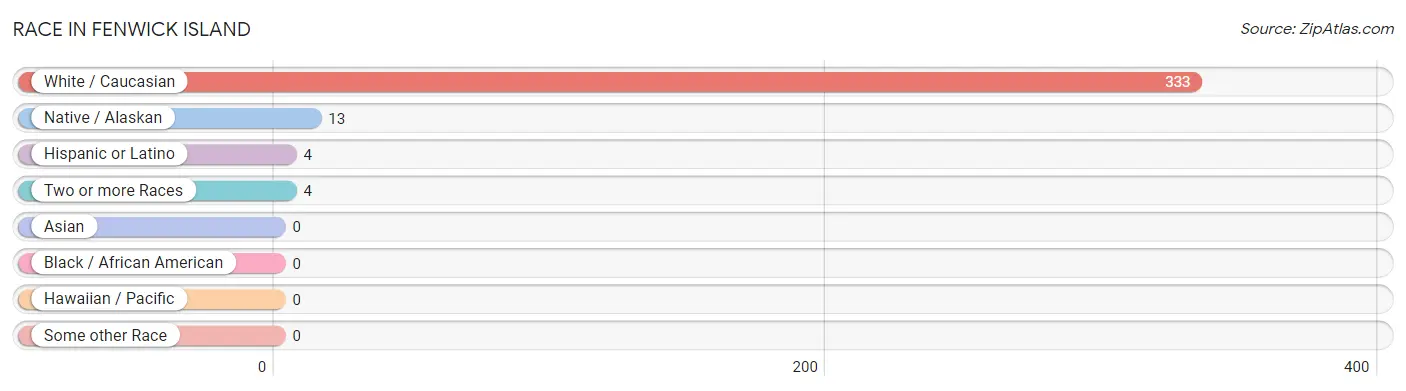
Race in Fenwick Island
The most populous races in Fenwick Island are White / Caucasian (333 | 95.1%), Native / Alaskan (13 | 3.7%), and Hispanic or Latino (4 | 1.1%).
| Race | # Population | % Population |
| Asian | 0 | 0.0% |
| Black / African American | 0 | 0.0% |
| Hawaiian / Pacific | 0 | 0.0% |
| Hispanic or Latino | 4 | 1.1% |
| Native / Alaskan | 13 | 3.7% |
| White / Caucasian | 333 | 95.1% |
| Two or more Races | 4 | 1.1% |
| Some other Race | 0 | 0.0% |
| Total | 350 | 100.0% |
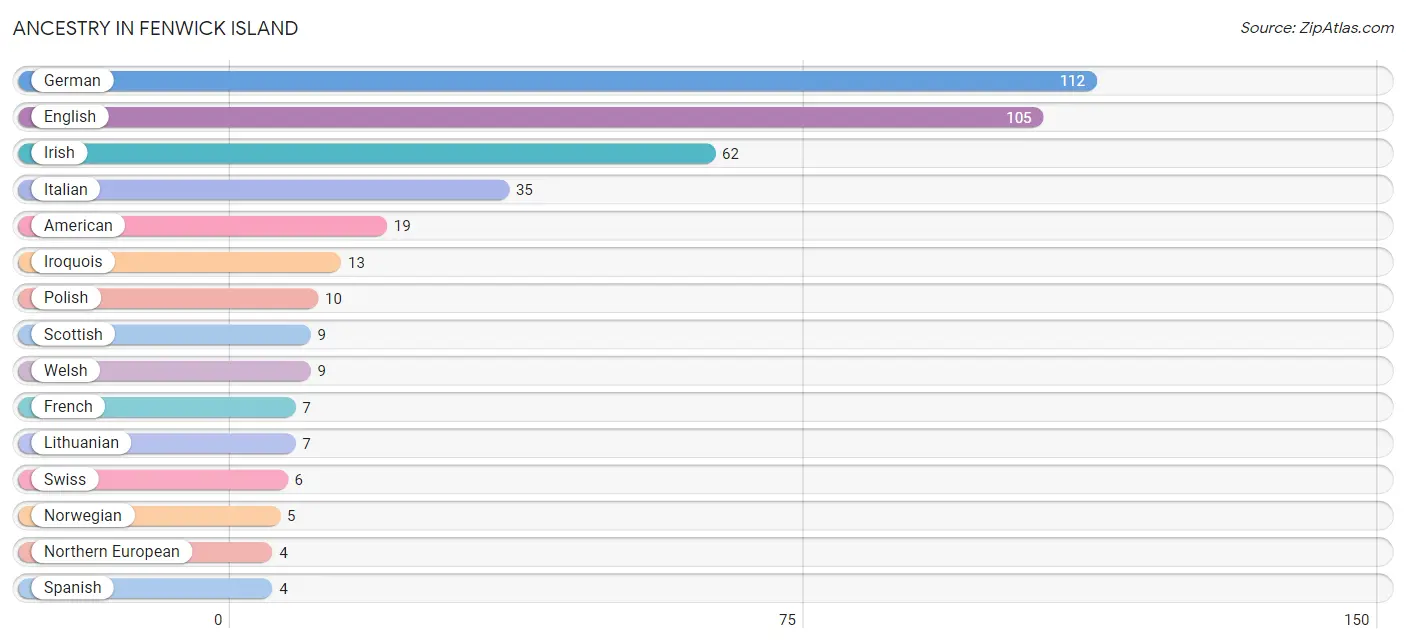
Ancestry in Fenwick Island
The most populous ancestries reported in Fenwick Island are German (112 | 32.0%), English (105 | 30.0%), Irish (62 | 17.7%), Italian (35 | 10.0%), and American (19 | 5.4%), together accounting for 95.1% of all Fenwick Island residents.
| Ancestry | # Population | % Population |
| American | 19 | 5.4% |
| Arab | 2 | 0.6% |
| Croatian | 3 | 0.9% |
| Czech | 1 | 0.3% |
| Dutch | 2 | 0.6% |
| English | 105 | 30.0% |
| Estonian | 2 | 0.6% |
| European | 2 | 0.6% |
| French | 7 | 2.0% |
| French Canadian | 1 | 0.3% |
| German | 112 | 32.0% |
| Hungarian | 3 | 0.9% |
| Irish | 62 | 17.7% |
| Iroquois | 13 | 3.7% |
| Italian | 35 | 10.0% |
| Lebanese | 2 | 0.6% |
| Lithuanian | 7 | 2.0% |
| Northern European | 4 | 1.1% |
| Norwegian | 5 | 1.4% |
| Polish | 10 | 2.9% |
| Scandinavian | 2 | 0.6% |
| Scotch-Irish | 2 | 0.6% |
| Scottish | 9 | 2.6% |
| Slovak | 1 | 0.3% |
| Spanish | 4 | 1.1% |
| Swedish | 2 | 0.6% |
| Swiss | 6 | 1.7% |
| Ukrainian | 2 | 0.6% |
| Welsh | 9 | 2.6% | View All 29 Rows |
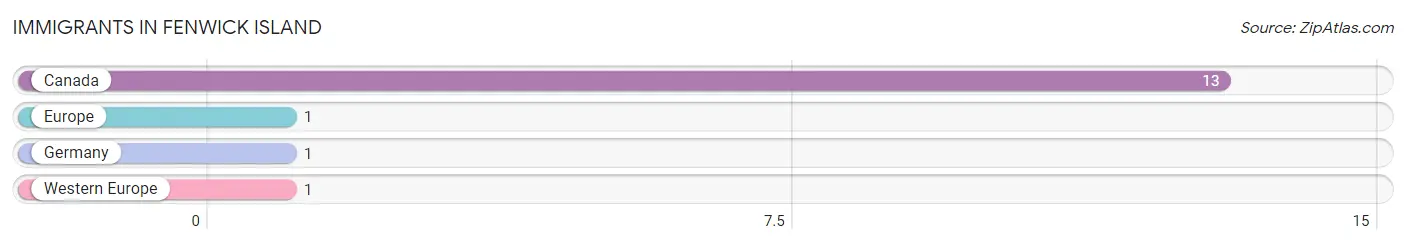
Immigrants in Fenwick Island
The most numerous immigrant groups reported in Fenwick Island came from Canada (13 | 3.7%), Europe (1 | 0.3%), Germany (1 | 0.3%), and Western Europe (1 | 0.3%), together accounting for 4.6% of all Fenwick Island residents.
| Immigration Origin | # Population | % Population |
| Canada | 13 | 3.7% |
| Europe | 1 | 0.3% |
| Germany | 1 | 0.3% |
| Western Europe | 1 | 0.3% | View All 4 Rows |
Sex and Age in Fenwick Island
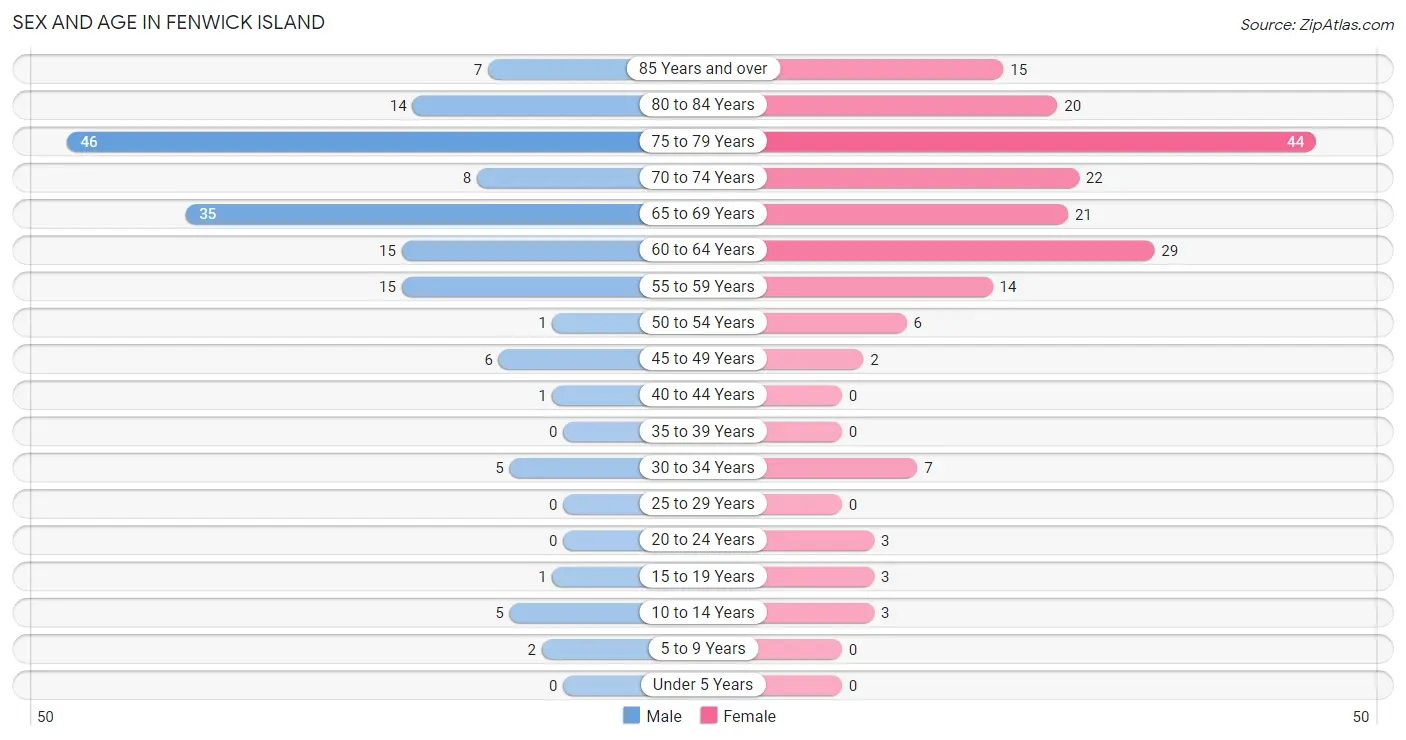
Sex and Age in Fenwick Island
The most populous age groups in Fenwick Island are 75 to 79 Years (46 | 28.6%) for men and 75 to 79 Years (44 | 23.3%) for women.
| Age Bracket | Male | Female |
| Under 5 Years | 0 (0.0%) | 0 (0.0%) |
| 5 to 9 Years | 2 (1.2%) | 0 (0.0%) |
| 10 to 14 Years | 5 (3.1%) | 3 (1.6%) |
| 15 to 19 Years | 1 (0.6%) | 3 (1.6%) |
| 20 to 24 Years | 0 (0.0%) | 3 (1.6%) |
| 25 to 29 Years | 0 (0.0%) | 0 (0.0%) |
| 30 to 34 Years | 5 (3.1%) | 7 (3.7%) |
| 35 to 39 Years | 0 (0.0%) | 0 (0.0%) |
| 40 to 44 Years | 1 (0.6%) | 0 (0.0%) |
| 45 to 49 Years | 6 (3.7%) | 2 (1.1%) |
| 50 to 54 Years | 1 (0.6%) | 6 (3.2%) |
| 55 to 59 Years | 15 (9.3%) | 14 (7.4%) |
| 60 to 64 Years | 15 (9.3%) | 29 (15.3%) |
| 65 to 69 Years | 35 (21.7%) | 21 (11.1%) |
| 70 to 74 Years | 8 (5.0%) | 22 (11.6%) |
| 75 to 79 Years | 46 (28.6%) | 44 (23.3%) |
| 80 to 84 Years | 14 (8.7%) | 20 (10.6%) |
| 85 Years and over | 7 (4.3%) | 15 (7.9%) |
| Total | 161 (100.0%) | 189 (100.0%) |
Families and Households in Fenwick Island
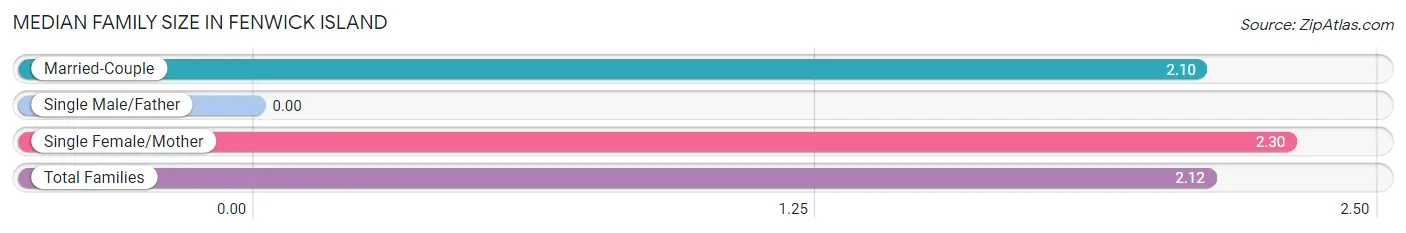
Median Family Size in Fenwick Island
| Family Type | # Families | Family Size |
| Married-Couple | 117 (92.1%) | 2.10 |
| Single Male/Father | 0 (0.0%) | - |
| Single Female/Mother | 10 (7.9%) | 2.30 |
| Total Families | 127 (100.0%) | 2.12 |
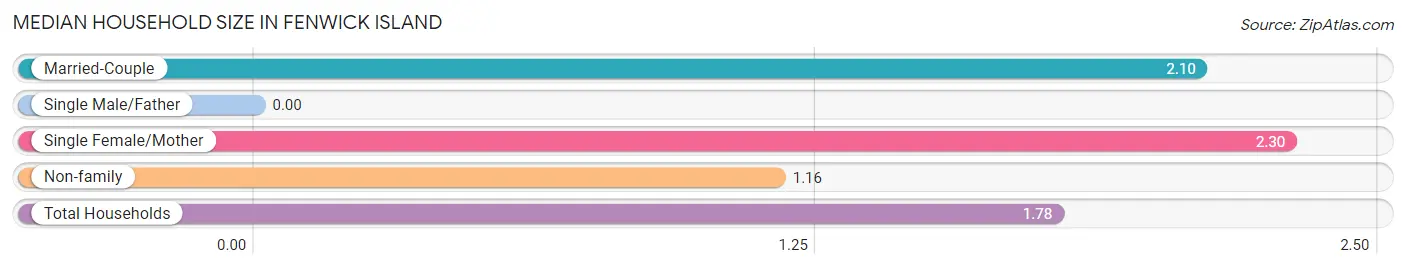
Median Household Size in Fenwick Island
| Household Type | # Households | Household Size |
| Married-Couple | 117 (59.4%) | 2.10 |
| Single Male/Father | 0 (0.0%) | - |
| Single Female/Mother | 10 (5.1%) | 2.30 |
| Non-family | 70 (35.5%) | 1.16 |
| Total Households | 197 (100.0%) | 1.78 |
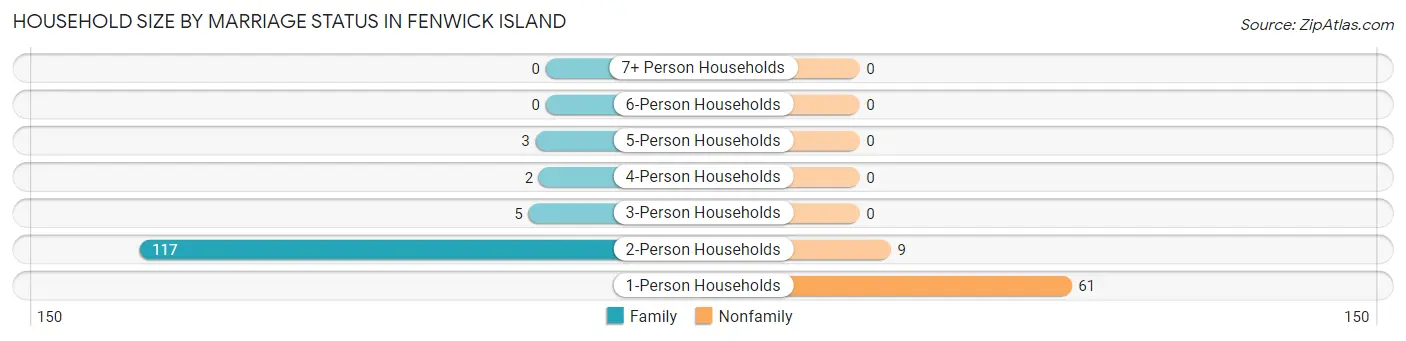
Household Size by Marriage Status in Fenwick Island
Out of a total of 197 households in Fenwick Island, 127 (64.5%) are family households, while 70 (35.5%) are nonfamily households. The most numerous type of family households are 2-person households, comprising 117, and the most common type of nonfamily households are 1-person households, comprising 61.
| Household Size | Family Households | Nonfamily Households |
| 1-Person Households | - | 61 (31.0%) |
| 2-Person Households | 117 (59.4%) | 9 (4.6%) |
| 3-Person Households | 5 (2.5%) | 0 (0.0%) |
| 4-Person Households | 2 (1.0%) | 0 (0.0%) |
| 5-Person Households | 3 (1.5%) | 0 (0.0%) |
| 6-Person Households | 0 (0.0%) | 0 (0.0%) |
| 7+ Person Households | 0 (0.0%) | 0 (0.0%) |
| Total | 127 (64.5%) | 70 (35.5%) |
Female Fertility in Fenwick Island
Fertility by Age in Fenwick Island
| Age Bracket | Women with Births | Births / 1,000 Women |
| 15 to 19 years | 0 (0.0%) | 0.0 |
| 20 to 34 years | 0 (0.0%) | 0.0 |
| 35 to 50 years | 0 (0.0%) | 0.0 |
| Total | 0 (0.0%) | 0.0 |
Fertility by Age by Marriage Status in Fenwick Island
| Age Bracket | Married | Unmarried |
| 15 to 19 years | 0 (0.0%) | 0 (0.0%) |
| 20 to 34 years | 0 (0.0%) | 0 (0.0%) |
| 35 to 50 years | 0 (0.0%) | 0 (0.0%) |
| Total | 0 (0.0%) | 0 (0.0%) |
Fertility by Education in Fenwick Island
| Educational Attainment | Women with Births | Births / 1,000 Women |
| Less than High School | 0 (0.0%) | 0.0 |
| High School Diploma | 0 (0.0%) | 0.0 |
| College or Associate's Degree | 0 (0.0%) | 0.0 |
| Bachelor's Degree | 0 (0.0%) | 0.0 |
| Graduate Degree | 0 (0.0%) | 0.0 |
| Total | 0 (0.0%) | 0.0 |
Fertility by Education by Marriage Status in Fenwick Island
| Educational Attainment | Married | Unmarried |
| Less than High School | 0 (0.0%) | 0 (0.0%) |
| High School Diploma | 0 (0.0%) | 0 (0.0%) |
| College or Associate's Degree | 0 (0.0%) | 0 (0.0%) |
| Bachelor's Degree | 0 (0.0%) | 0 (0.0%) |
| Graduate Degree | 0 (0.0%) | 0 (0.0%) |
| Total | 0 (0.0%) | 0 (0.0%) |
Income in Fenwick Island
Income Overview in Fenwick Island
Per Capita Income in Fenwick Island is $118,955, while median incomes of families and households are $178,125 and $118,438 respectively.
| Characteristic | Number | Measure |
| Per Capita Income | 350 | $118,955 |
| Median Family Income | 127 | $178,125 |
| Mean Family Income | 127 | $266,854 |
| Median Household Income | 197 | $118,438 |
| Mean Household Income | 197 | $211,020 |
| Income Deficit | 127 | $0 |
| Wage / Income Gap (%) | 350 | 0.00% |
| Wage / Income Gap ($) | 350 | 100.00¢ per $1 |
| Gini / Inequality Index | 350 | 0.54 |
Earnings by Sex in Fenwick Island
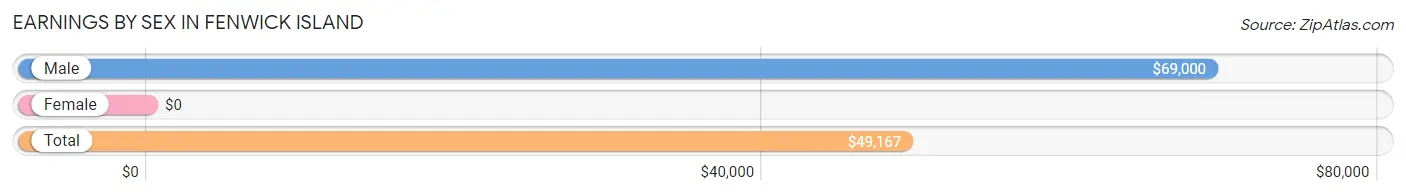
| Sex | Number | Average Earnings |
| Male | 66 (47.1%) | $69,000 |
| Female | 74 (52.9%) | $0 |
| Total | 140 (100.0%) | $49,167 |
Earnings by Sex by Income Bracket in Fenwick Island
The most common earnings brackets in Fenwick Island are $100,000+ for men (28 | 42.4%) and $2,500 to $4,999 for women (20 | 27.0%).
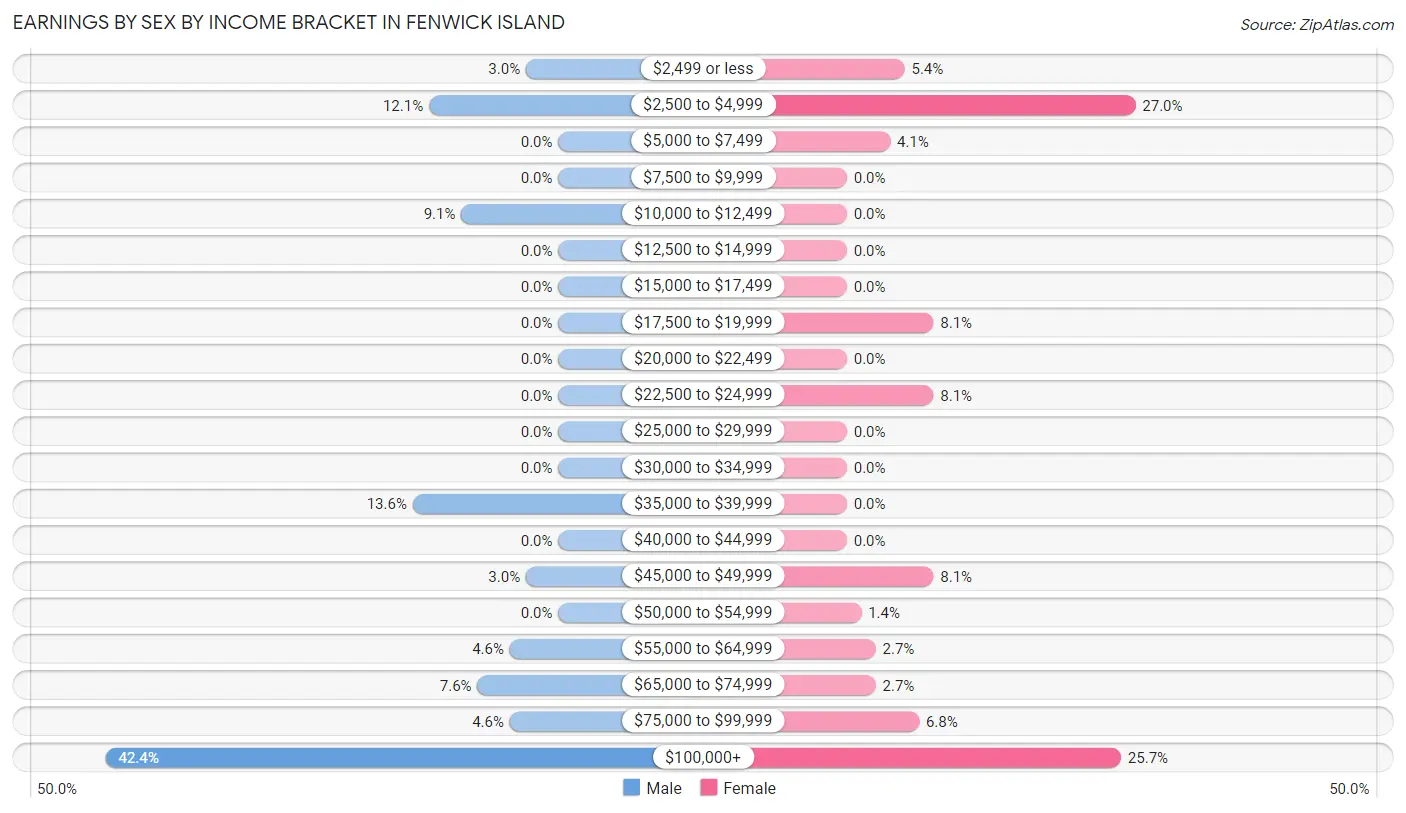
| Income | Male | Female |
| $2,499 or less | 2 (3.0%) | 4 (5.4%) |
| $2,500 to $4,999 | 8 (12.1%) | 20 (27.0%) |
| $5,000 to $7,499 | 0 (0.0%) | 3 (4.1%) |
| $7,500 to $9,999 | 0 (0.0%) | 0 (0.0%) |
| $10,000 to $12,499 | 6 (9.1%) | 0 (0.0%) |
| $12,500 to $14,999 | 0 (0.0%) | 0 (0.0%) |
| $15,000 to $17,499 | 0 (0.0%) | 0 (0.0%) |
| $17,500 to $19,999 | 0 (0.0%) | 6 (8.1%) |
| $20,000 to $22,499 | 0 (0.0%) | 0 (0.0%) |
| $22,500 to $24,999 | 0 (0.0%) | 6 (8.1%) |
| $25,000 to $29,999 | 0 (0.0%) | 0 (0.0%) |
| $30,000 to $34,999 | 0 (0.0%) | 0 (0.0%) |
| $35,000 to $39,999 | 9 (13.6%) | 0 (0.0%) |
| $40,000 to $44,999 | 0 (0.0%) | 0 (0.0%) |
| $45,000 to $49,999 | 2 (3.0%) | 6 (8.1%) |
| $50,000 to $54,999 | 0 (0.0%) | 1 (1.3%) |
| $55,000 to $64,999 | 3 (4.5%) | 2 (2.7%) |
| $65,000 to $74,999 | 5 (7.6%) | 2 (2.7%) |
| $75,000 to $99,999 | 3 (4.5%) | 5 (6.8%) |
| $100,000+ | 28 (42.4%) | 19 (25.7%) |
| Total | 66 (100.0%) | 74 (100.0%) |
Earnings by Sex by Educational Attainment in Fenwick Island
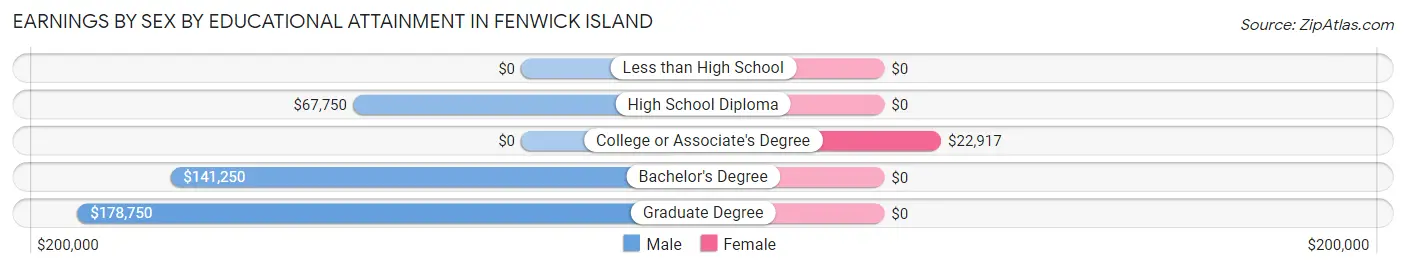
| Educational Attainment | Male Income | Female Income |
| Less than High School | - | - |
| High School Diploma | $67,750 | $0 |
| College or Associate's Degree | - | - |
| Bachelor's Degree | $141,250 | $0 |
| Graduate Degree | $178,750 | $0 |
| Total | $69,250 | $0 |
Family Income in Fenwick Island
Family Income Brackets in Fenwick Island
According to the Fenwick Island family income data, there are 54 families falling into the $200,000+ income range, which is the most common income bracket and makes up 42.5% of all families.
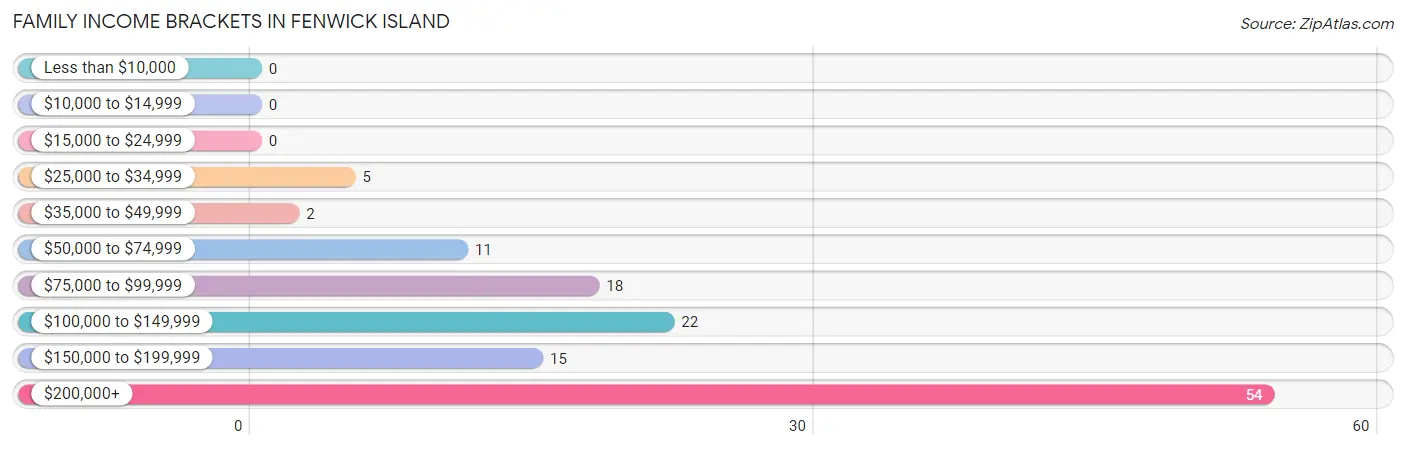
| Income Bracket | # Families | % Families |
| Less than $10,000 | 0 | 0.0% |
| $10,000 to $14,999 | 0 | 0.0% |
| $15,000 to $24,999 | 0 | 0.0% |
| $25,000 to $34,999 | 5 | 3.9% |
| $35,000 to $49,999 | 2 | 1.6% |
| $50,000 to $74,999 | 11 | 8.7% |
| $75,000 to $99,999 | 18 | 14.2% |
| $100,000 to $149,999 | 22 | 17.3% |
| $150,000 to $199,999 | 15 | 11.8% |
| $200,000+ | 54 | 42.5% |
Family Income by Famaliy Size in Fenwick Island
2-person families (117 | 92.1%) account for the highest median family income in Fenwick Island with $178,125 per family, while 2-person families (117 | 92.1%) have the highest median income of $89,062 per family member.
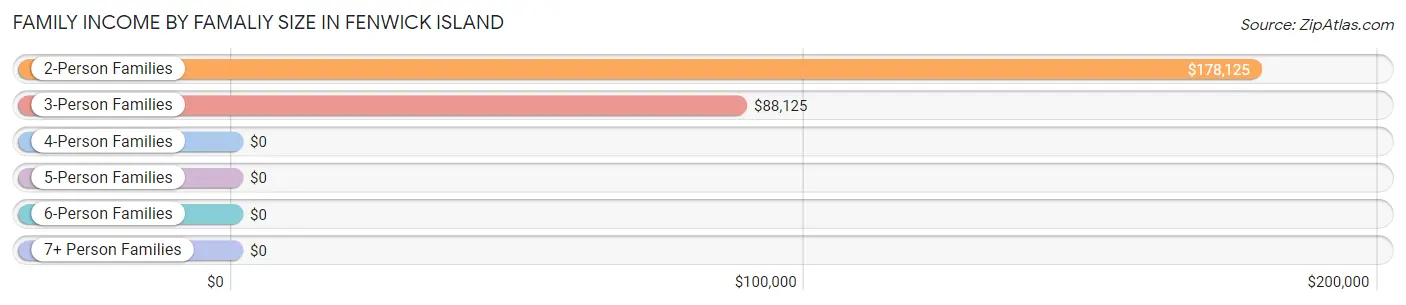
| Income Bracket | # Families | Median Income |
| 2-Person Families | 117 (92.1%) | $178,125 |
| 3-Person Families | 5 (3.9%) | $88,125 |
| 4-Person Families | 2 (1.6%) | $0 |
| 5-Person Families | 3 (2.4%) | $0 |
| 6-Person Families | 0 (0.0%) | $0 |
| 7+ Person Families | 0 (0.0%) | $0 |
| Total | 127 (100.0%) | $178,125 |
Family Income by Number of Earners in Fenwick Island
The median family income in Fenwick Island is $178,125, with families comprising 3+ earners (4) having the highest median family income of $250,001, while families with no earners (53) have the lowest median family income of $145,625, accounting for 3.2% and 41.7% of families, respectively.
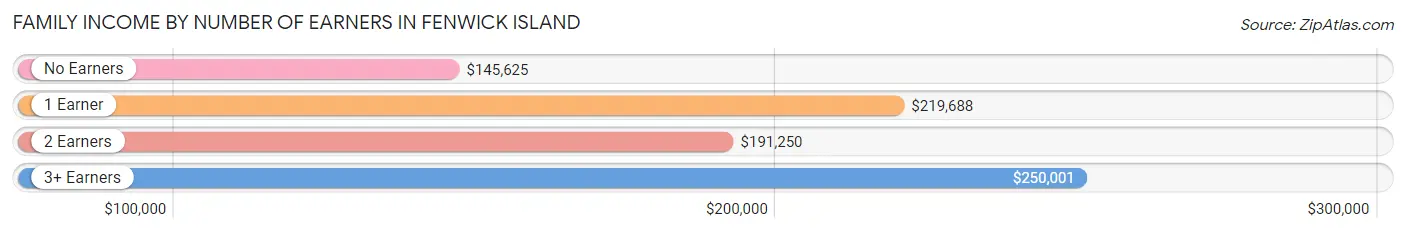
| Number of Earners | # Families | Median Income |
| No Earners | 53 (41.7%) | $145,625 |
| 1 Earner | 41 (32.3%) | $219,688 |
| 2 Earners | 29 (22.8%) | $191,250 |
| 3+ Earners | 4 (3.2%) | $250,001 |
| Total | 127 (100.0%) | $178,125 |
Household Income in Fenwick Island
Household Income Brackets in Fenwick Island
With 64 households falling in the category, the $200,000+ income range is the most frequent in Fenwick Island, accounting for 32.5% of all households.
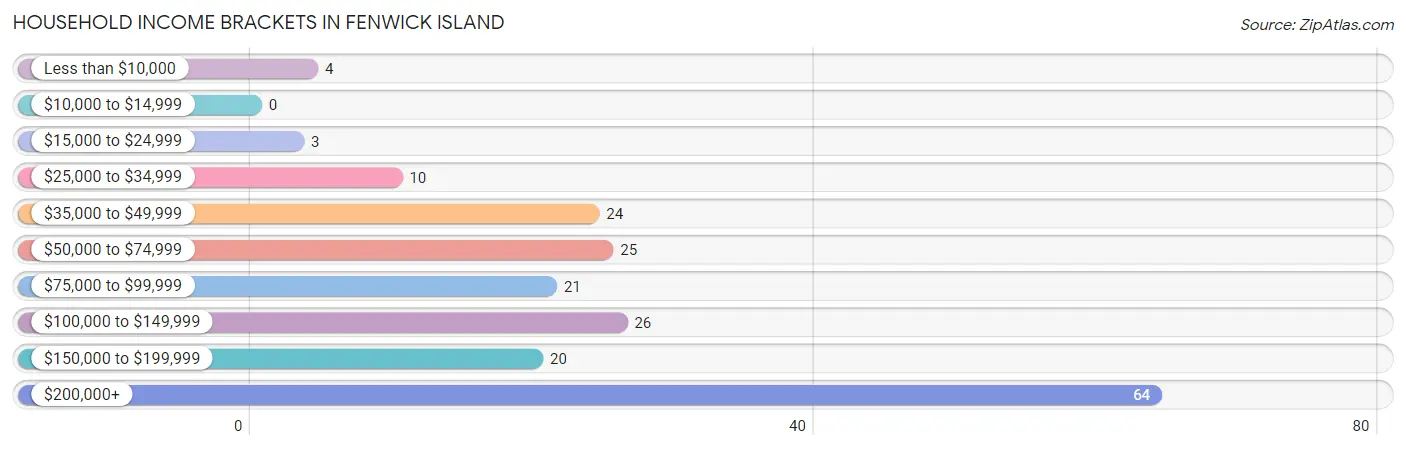
| Income Bracket | # Households | % Households |
| Less than $10,000 | 4 | 2.0% |
| $10,000 to $14,999 | 0 | 0.0% |
| $15,000 to $24,999 | 3 | 1.5% |
| $25,000 to $34,999 | 10 | 5.1% |
| $35,000 to $49,999 | 24 | 12.2% |
| $50,000 to $74,999 | 25 | 12.7% |
| $75,000 to $99,999 | 21 | 10.7% |
| $100,000 to $149,999 | 26 | 13.2% |
| $150,000 to $199,999 | 20 | 10.2% |
| $200,000+ | 64 | 32.5% |
Household Income by Householder Age in Fenwick Island
The median household income in Fenwick Island is $118,438, with the highest median household income of $101,250 found in the 65+ years age bracket for the primary householder. A total of 139 households (70.6%) fall into this category. Meanwhile, the 15 to 24 years age bracket for the primary householder has the lowest median household income of $0, with 1 households (0.5%) in this group.
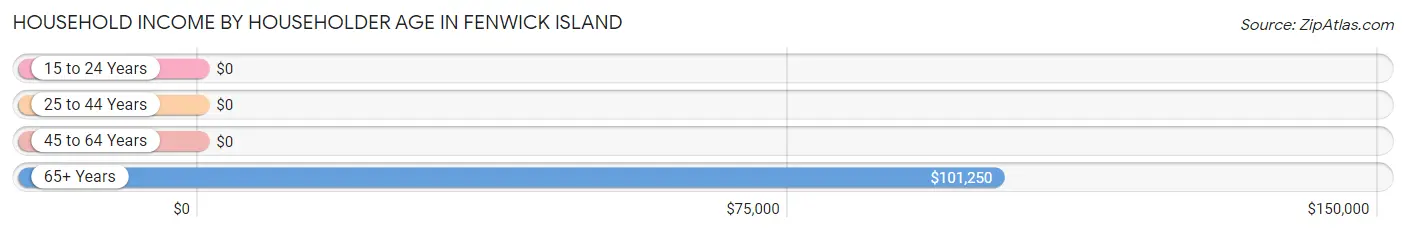
| Income Bracket | # Households | Median Income |
| 15 to 24 Years | 1 (0.5%) | $0 |
| 25 to 44 Years | 7 (3.5%) | $0 |
| 45 to 64 Years | 50 (25.4%) | $0 |
| 65+ Years | 139 (70.6%) | $101,250 |
| Total | 197 (100.0%) | $118,438 |
Poverty in Fenwick Island
Income Below Poverty by Sex and Age in Fenwick Island
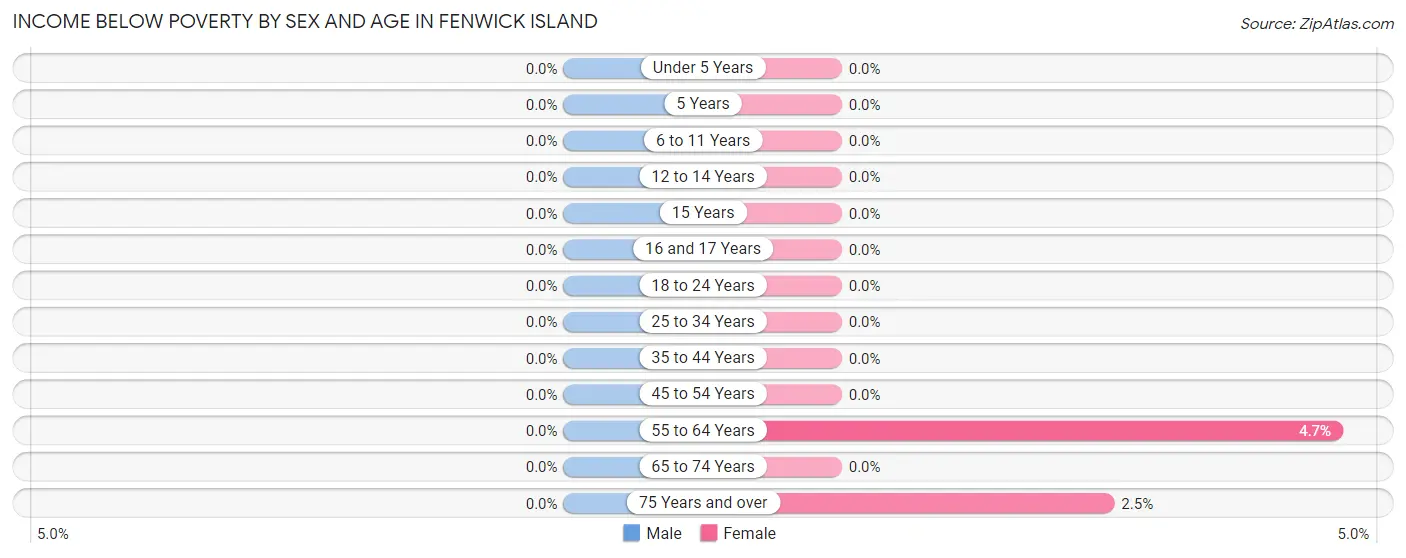
| Age Bracket | Male | Female |
| Under 5 Years | 0 (0.0%) | 0 (0.0%) |
| 5 Years | 0 (0.0%) | 0 (0.0%) |
| 6 to 11 Years | 0 (0.0%) | 0 (0.0%) |
| 12 to 14 Years | 0 (0.0%) | 0 (0.0%) |
| 15 Years | 0 (0.0%) | 0 (0.0%) |
| 16 and 17 Years | 0 (0.0%) | 0 (0.0%) |
| 18 to 24 Years | 0 (0.0%) | 0 (0.0%) |
| 25 to 34 Years | 0 (0.0%) | 0 (0.0%) |
| 35 to 44 Years | 0 (0.0%) | 0 (0.0%) |
| 45 to 54 Years | 0 (0.0%) | 0 (0.0%) |
| 55 to 64 Years | 0 (0.0%) | 2 (4.6%) |
| 65 to 74 Years | 0 (0.0%) | 0 (0.0%) |
| 75 Years and over | 0 (0.0%) | 2 (2.5%) |
| Total | 0 (0.0%) | 4 (2.1%) |
Income Above Poverty by Sex and Age in Fenwick Island
According to the poverty statistics in Fenwick Island, males aged 6 to 11 years and females aged 12 to 14 years are the age groups that are most secure financially, with 100.0% of males and 100.0% of females in these age groups living above the poverty line.
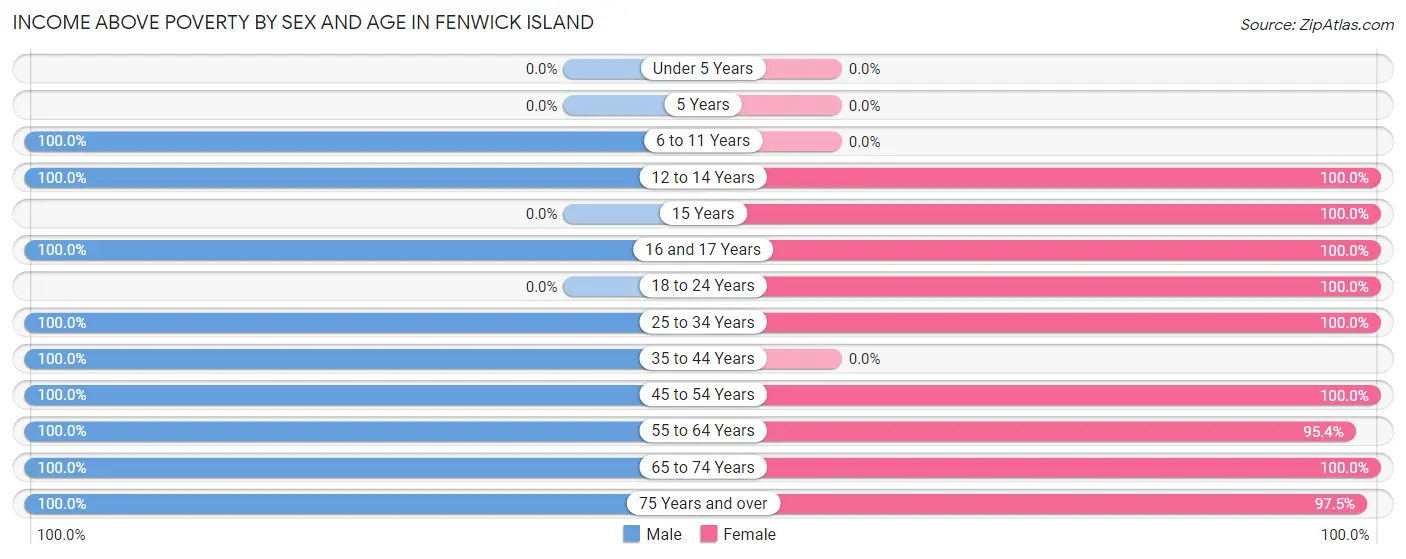
| Age Bracket | Male | Female |
| Under 5 Years | 0 (0.0%) | 0 (0.0%) |
| 5 Years | 0 (0.0%) | 0 (0.0%) |
| 6 to 11 Years | 2 (100.0%) | 0 (0.0%) |
| 12 to 14 Years | 5 (100.0%) | 3 (100.0%) |
| 15 Years | 0 (0.0%) | 1 (100.0%) |
| 16 and 17 Years | 1 (100.0%) | 2 (100.0%) |
| 18 to 24 Years | 0 (0.0%) | 3 (100.0%) |
| 25 to 34 Years | 5 (100.0%) | 7 (100.0%) |
| 35 to 44 Years | 1 (100.0%) | 0 (0.0%) |
| 45 to 54 Years | 7 (100.0%) | 8 (100.0%) |
| 55 to 64 Years | 30 (100.0%) | 41 (95.4%) |
| 65 to 74 Years | 43 (100.0%) | 43 (100.0%) |
| 75 Years and over | 67 (100.0%) | 77 (97.5%) |
| Total | 161 (100.0%) | 185 (97.9%) |
Income Below Poverty Among Married-Couple Families in Fenwick Island
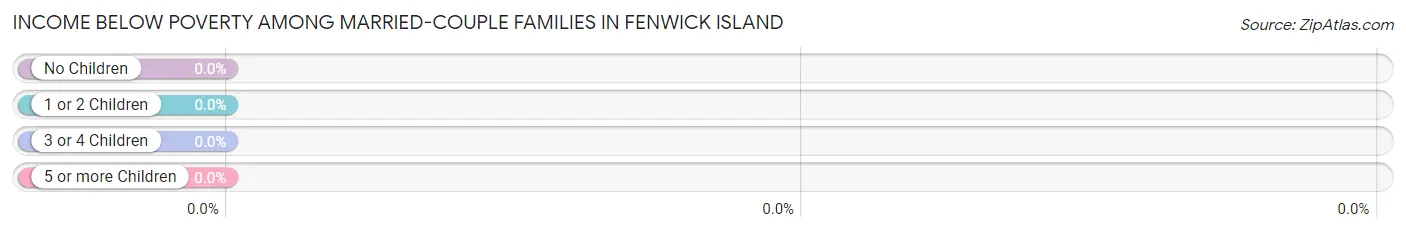
| Children | Above Poverty | Below Poverty |
| No Children | 109 (100.0%) | 0 (0.0%) |
| 1 or 2 Children | 6 (100.0%) | 0 (0.0%) |
| 3 or 4 Children | 2 (100.0%) | 0 (0.0%) |
| 5 or more Children | 0 (0.0%) | 0 (0.0%) |
| Total | 117 (100.0%) | 0 (0.0%) |
Income Below Poverty Among Single-Parent Households in Fenwick Island
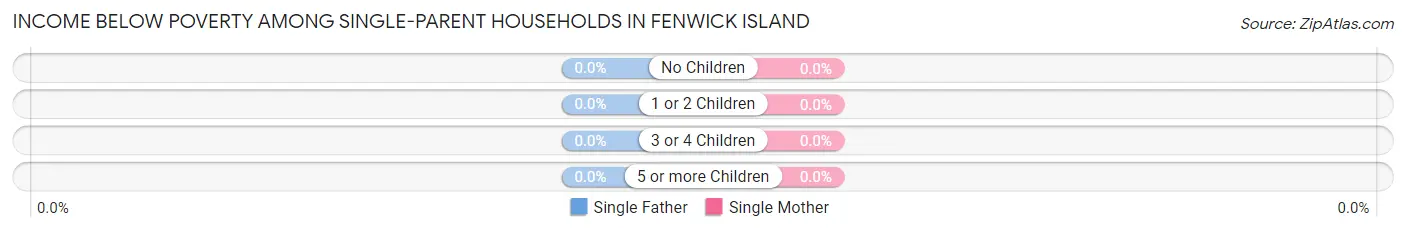
| Children | Single Father | Single Mother |
| No Children | 0 (0.0%) | 0 (0.0%) |
| 1 or 2 Children | 0 (0.0%) | 0 (0.0%) |
| 3 or 4 Children | 0 (0.0%) | 0 (0.0%) |
| 5 or more Children | 0 (0.0%) | 0 (0.0%) |
| Total | 0 (0.0%) | 0 (0.0%) |
Income Below Poverty Among Married-Couple vs Single-Parent Households in Fenwick Island
| Children | Married-Couple Families | Single-Parent Households |
| No Children | 0 (0.0%) | 0 (0.0%) |
| 1 or 2 Children | 0 (0.0%) | 0 (0.0%) |
| 3 or 4 Children | 0 (0.0%) | 0 (0.0%) |
| 5 or more Children | 0 (0.0%) | 0 (0.0%) |
| Total | 0 (0.0%) | 0 (0.0%) |
Employment Characteristics in Fenwick Island
Employment by Class of Employer in Fenwick Island
Among the 105 employed individuals in Fenwick Island, private company employees (57 | 54.3%), self-employed (incorporated) (20 | 19.1%), and self-employed (not incorporated) (15 | 14.3%) make up the most common classes of employment.
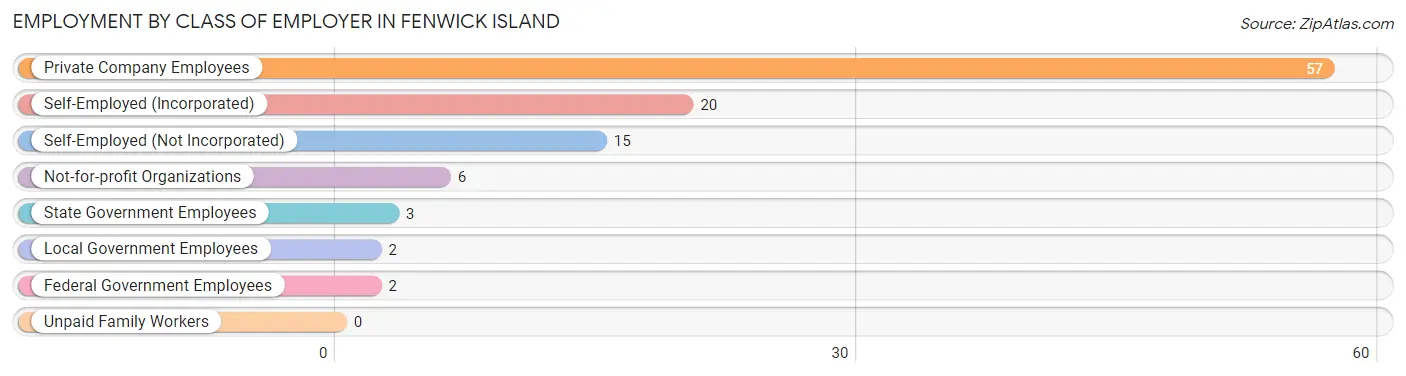
| Employer Class | # Employees | % Employees |
| Private Company Employees | 57 | 54.3% |
| Self-Employed (Incorporated) | 20 | 19.1% |
| Self-Employed (Not Incorporated) | 15 | 14.3% |
| Not-for-profit Organizations | 6 | 5.7% |
| Local Government Employees | 2 | 1.9% |
| State Government Employees | 3 | 2.9% |
| Federal Government Employees | 2 | 1.9% |
| Unpaid Family Workers | 0 | 0.0% |
| Total | 105 | 100.0% |
Employment Status by Age in Fenwick Island
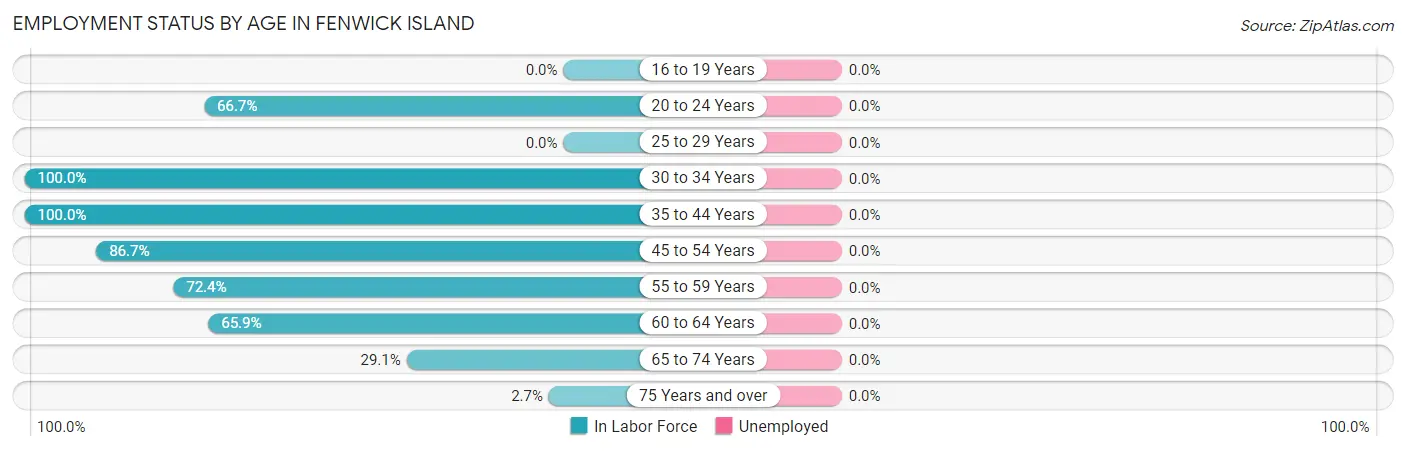
| Age Bracket | In Labor Force | Unemployed |
| 16 to 19 Years | 0 (0.0%) | 0 (0.0%) |
| 20 to 24 Years | 2 (66.7%) | 0 (0.0%) |
| 25 to 29 Years | 0 (0.0%) | 0 (0.0%) |
| 30 to 34 Years | 12 (100.0%) | 0 (0.0%) |
| 35 to 44 Years | 1 (100.0%) | 0 (0.0%) |
| 45 to 54 Years | 13 (86.7%) | 0 (0.0%) |
| 55 to 59 Years | 21 (72.4%) | 0 (0.0%) |
| 60 to 64 Years | 29 (65.9%) | 0 (0.0%) |
| 65 to 74 Years | 25 (29.1%) | 0 (0.0%) |
| 75 Years and over | 4 (2.7%) | 0 (0.0%) |
| Total | 107 (31.6%) | 0 (0.0%) |
Employment Status by Educational Attainment in Fenwick Island
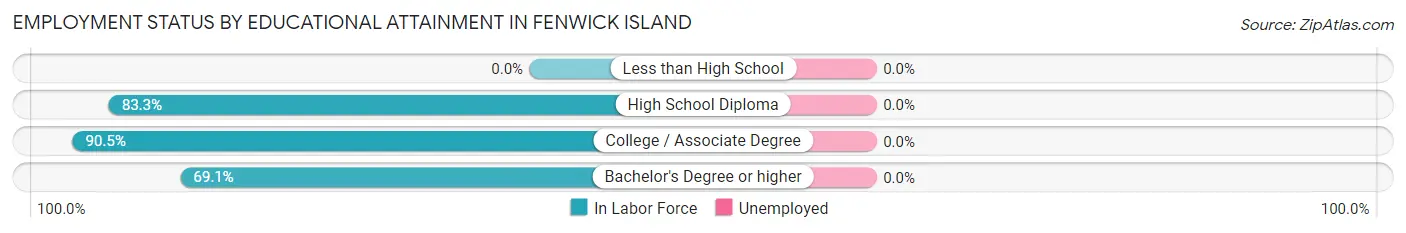
| Educational Attainment | In Labor Force | Unemployed |
| Less than High School | 0 (0.0%) | 0 (0.0%) |
| High School Diploma | 10 (83.3%) | 0 (0.0%) |
| College / Associate Degree | 19 (90.5%) | 0 (0.0%) |
| Bachelor's Degree or higher | 47 (69.1%) | 0 (0.0%) |
| Total | 76 (75.2%) | 0 (0.0%) |
Employment Occupations by Sex in Fenwick Island
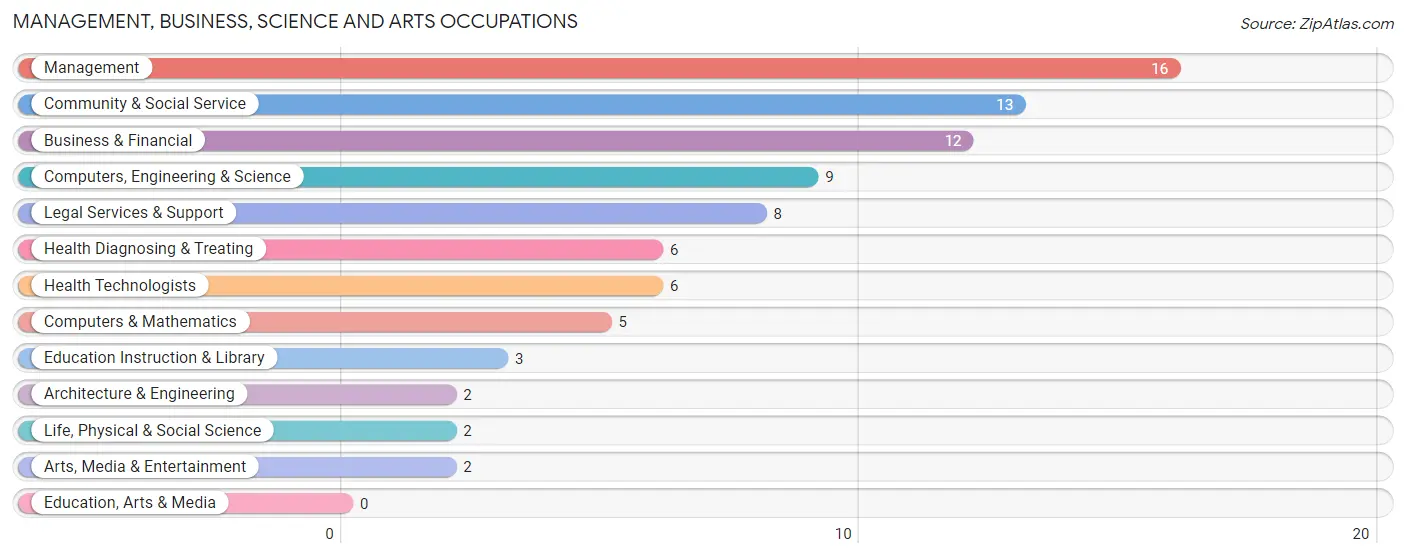
Management, Business, Science and Arts Occupations
The most common Management, Business, Science and Arts occupations in Fenwick Island are Management (16 | 14.9%), Community & Social Service (13 | 12.1%), Business & Financial (12 | 11.2%), Computers, Engineering & Science (9 | 8.4%), and Legal Services & Support (8 | 7.5%).
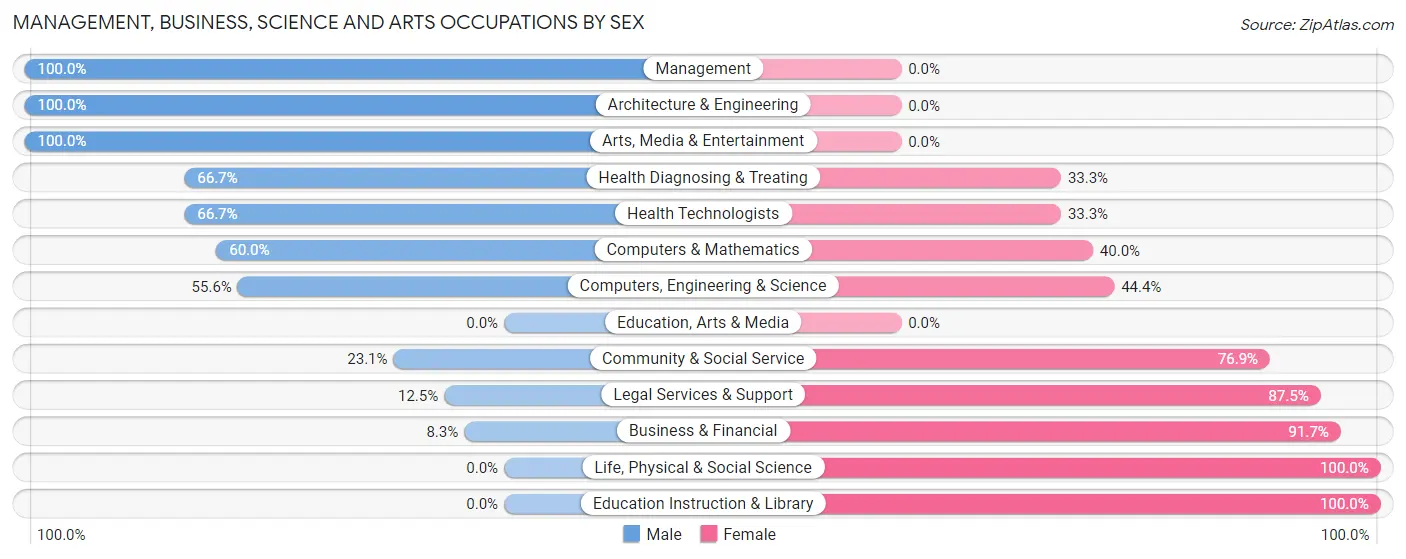
Management, Business, Science and Arts Occupations by Sex
Within the Management, Business, Science and Arts occupations in Fenwick Island, the most male-oriented occupations are Management (100.0%), Architecture & Engineering (100.0%), and Arts, Media & Entertainment (100.0%), while the most female-oriented occupations are Life, Physical & Social Science (100.0%), Education Instruction & Library (100.0%), and Business & Financial (91.7%).
| Occupation | Male | Female |
| Management | 16 (100.0%) | 0 (0.0%) |
| Business & Financial | 1 (8.3%) | 11 (91.7%) |
| Computers, Engineering & Science | 5 (55.6%) | 4 (44.4%) |
| Computers & Mathematics | 3 (60.0%) | 2 (40.0%) |
| Architecture & Engineering | 2 (100.0%) | 0 (0.0%) |
| Life, Physical & Social Science | 0 (0.0%) | 2 (100.0%) |
| Community & Social Service | 3 (23.1%) | 10 (76.9%) |
| Education, Arts & Media | 0 (0.0%) | 0 (0.0%) |
| Legal Services & Support | 1 (12.5%) | 7 (87.5%) |
| Education Instruction & Library | 0 (0.0%) | 3 (100.0%) |
| Arts, Media & Entertainment | 2 (100.0%) | 0 (0.0%) |
| Health Diagnosing & Treating | 4 (66.7%) | 2 (33.3%) |
| Health Technologists | 4 (66.7%) | 2 (33.3%) |
| Total (Category) | 29 (51.8%) | 27 (48.2%) |
| Total (Overall) | 53 (49.5%) | 54 (50.5%) |
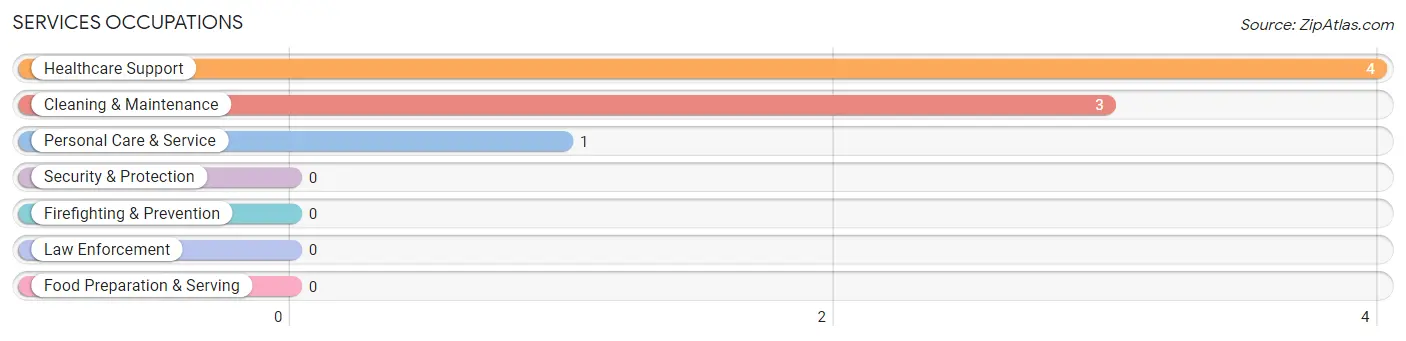
Services Occupations
The most common Services occupations in Fenwick Island are Healthcare Support (4 | 3.7%), Cleaning & Maintenance (3 | 2.8%), and Personal Care & Service (1 | 0.9%).
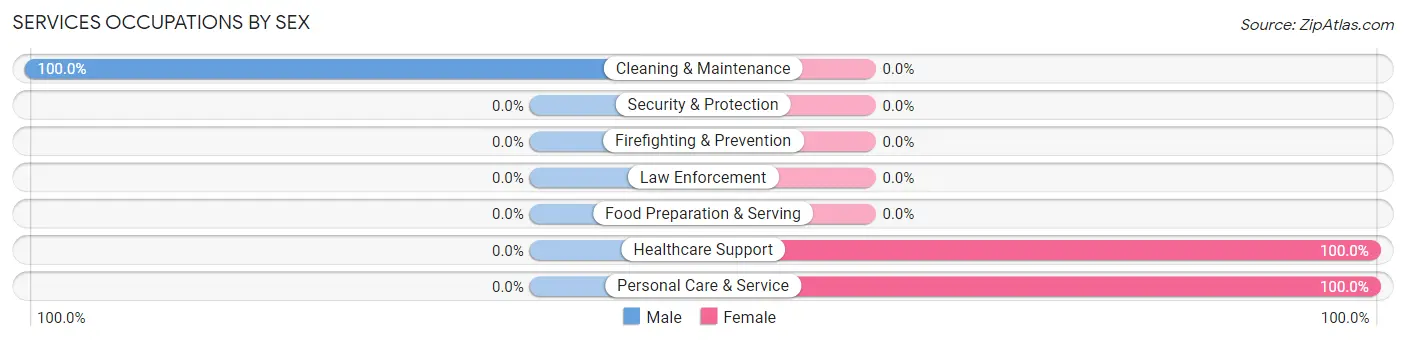
Services Occupations by Sex
| Occupation | Male | Female |
| Healthcare Support | 0 (0.0%) | 4 (100.0%) |
| Security & Protection | 0 (0.0%) | 0 (0.0%) |
| Firefighting & Prevention | 0 (0.0%) | 0 (0.0%) |
| Law Enforcement | 0 (0.0%) | 0 (0.0%) |
| Food Preparation & Serving | 0 (0.0%) | 0 (0.0%) |
| Cleaning & Maintenance | 3 (100.0%) | 0 (0.0%) |
| Personal Care & Service | 0 (0.0%) | 1 (100.0%) |
| Total (Category) | 3 (37.5%) | 5 (62.5%) |
| Total (Overall) | 53 (49.5%) | 54 (50.5%) |
Sales and Office Occupations
The most common Sales and Office occupations in Fenwick Island are Sales & Related (32 | 29.9%), and Office & Administration (4 | 3.7%).
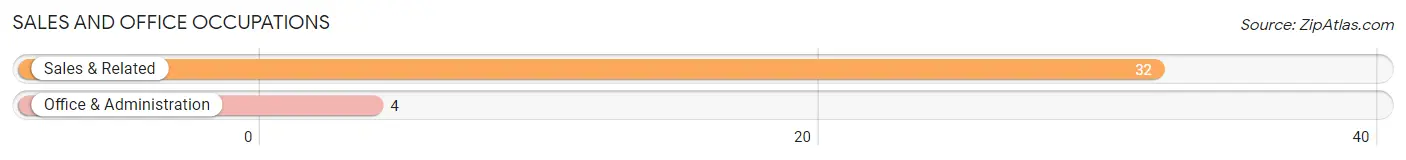
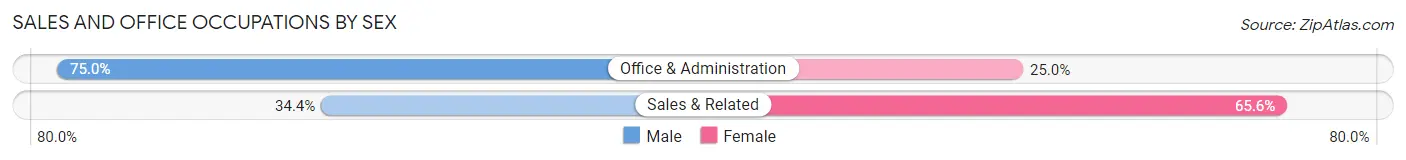
Sales and Office Occupations by Sex
| Occupation | Male | Female |
| Sales & Related | 11 (34.4%) | 21 (65.6%) |
| Office & Administration | 3 (75.0%) | 1 (25.0%) |
| Total (Category) | 14 (38.9%) | 22 (61.1%) |
| Total (Overall) | 53 (49.5%) | 54 (50.5%) |
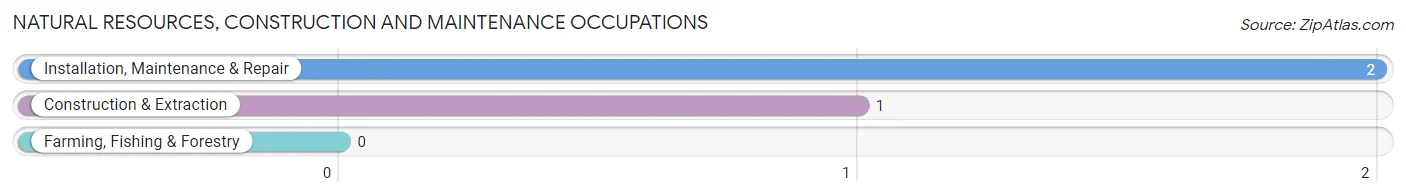
Natural Resources, Construction and Maintenance Occupations
The most common Natural Resources, Construction and Maintenance occupations in Fenwick Island are Installation, Maintenance & Repair (2 | 1.9%), and Construction & Extraction (1 | 0.9%).
Natural Resources, Construction and Maintenance Occupations by Sex

| Occupation | Male | Female |
| Farming, Fishing & Forestry | 0 (0.0%) | 0 (0.0%) |
| Construction & Extraction | 1 (100.0%) | 0 (0.0%) |
| Installation, Maintenance & Repair | 2 (100.0%) | 0 (0.0%) |
| Total (Category) | 3 (100.0%) | 0 (0.0%) |
| Total (Overall) | 53 (49.5%) | 54 (50.5%) |
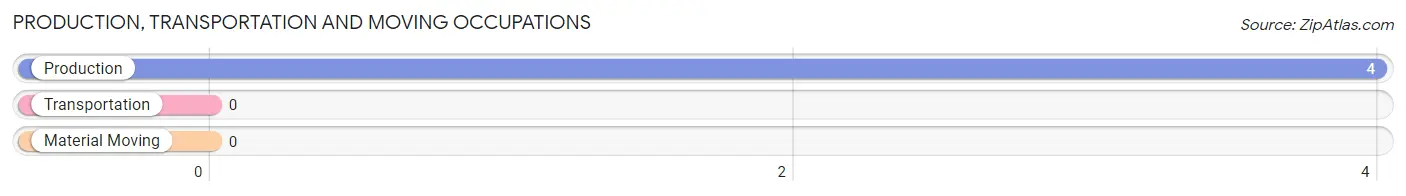
Production, Transportation and Moving Occupations
The most common Production, Transportation and Moving occupations in Fenwick Island are , and Production (4 | 3.7%).
Production, Transportation and Moving Occupations by Sex
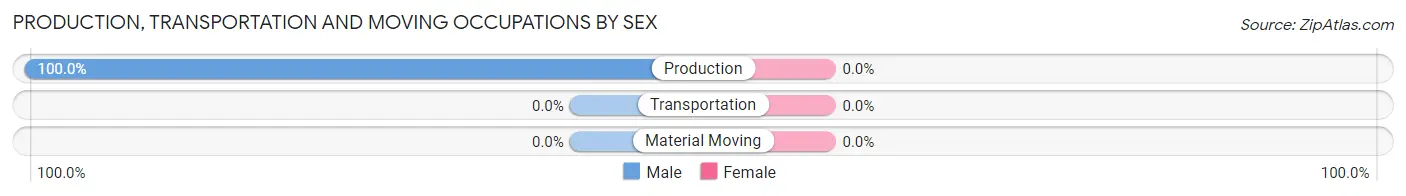
| Occupation | Male | Female |
| Production | 4 (100.0%) | 0 (0.0%) |
| Transportation | 0 (0.0%) | 0 (0.0%) |
| Material Moving | 0 (0.0%) | 0 (0.0%) |
| Total (Category) | 4 (100.0%) | 0 (0.0%) |
| Total (Overall) | 53 (49.5%) | 54 (50.5%) |
Employment Industries by Sex in Fenwick Island
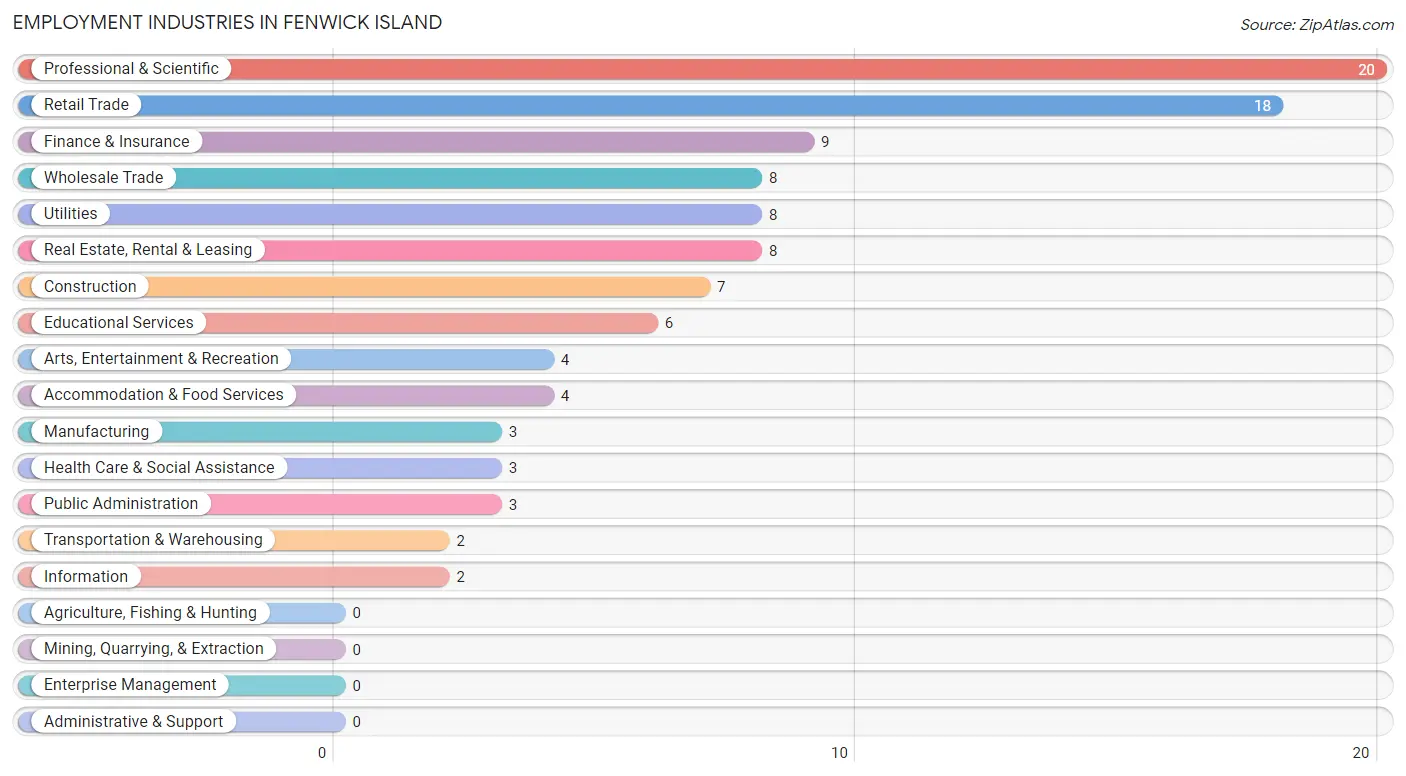
Employment Industries in Fenwick Island
The major employment industries in Fenwick Island include Professional & Scientific (20 | 18.7%), Retail Trade (18 | 16.8%), Finance & Insurance (9 | 8.4%), Wholesale Trade (8 | 7.5%), and Utilities (8 | 7.5%).
Employment Industries by Sex in Fenwick Island
The Fenwick Island industries that see more men than women are Manufacturing (100.0%), Wholesale Trade (100.0%), and Information (100.0%), whereas the industries that tend to have a higher number of women are Transportation & Warehousing (100.0%), Educational Services (100.0%), and Health Care & Social Assistance (100.0%).
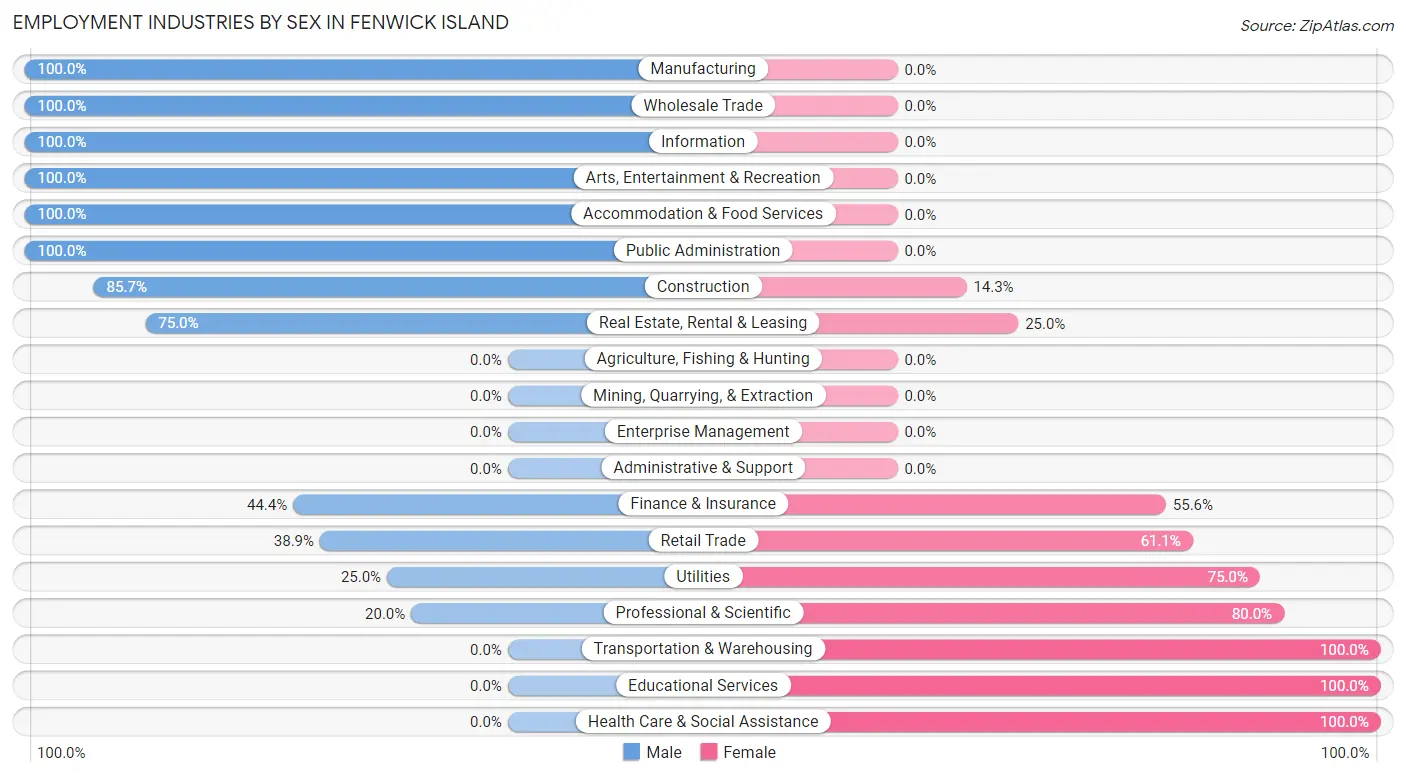
| Industry | Male | Female |
| Agriculture, Fishing & Hunting | 0 (0.0%) | 0 (0.0%) |
| Mining, Quarrying, & Extraction | 0 (0.0%) | 0 (0.0%) |
| Construction | 6 (85.7%) | 1 (14.3%) |
| Manufacturing | 3 (100.0%) | 0 (0.0%) |
| Wholesale Trade | 8 (100.0%) | 0 (0.0%) |
| Retail Trade | 7 (38.9%) | 11 (61.1%) |
| Transportation & Warehousing | 0 (0.0%) | 2 (100.0%) |
| Utilities | 2 (25.0%) | 6 (75.0%) |
| Information | 2 (100.0%) | 0 (0.0%) |
| Finance & Insurance | 4 (44.4%) | 5 (55.6%) |
| Real Estate, Rental & Leasing | 6 (75.0%) | 2 (25.0%) |
| Professional & Scientific | 4 (20.0%) | 16 (80.0%) |
| Enterprise Management | 0 (0.0%) | 0 (0.0%) |
| Administrative & Support | 0 (0.0%) | 0 (0.0%) |
| Educational Services | 0 (0.0%) | 6 (100.0%) |
| Health Care & Social Assistance | 0 (0.0%) | 3 (100.0%) |
| Arts, Entertainment & Recreation | 4 (100.0%) | 0 (0.0%) |
| Accommodation & Food Services | 4 (100.0%) | 0 (0.0%) |
| Public Administration | 3 (100.0%) | 0 (0.0%) |
| Total | 53 (49.5%) | 54 (50.5%) |
Education in Fenwick Island
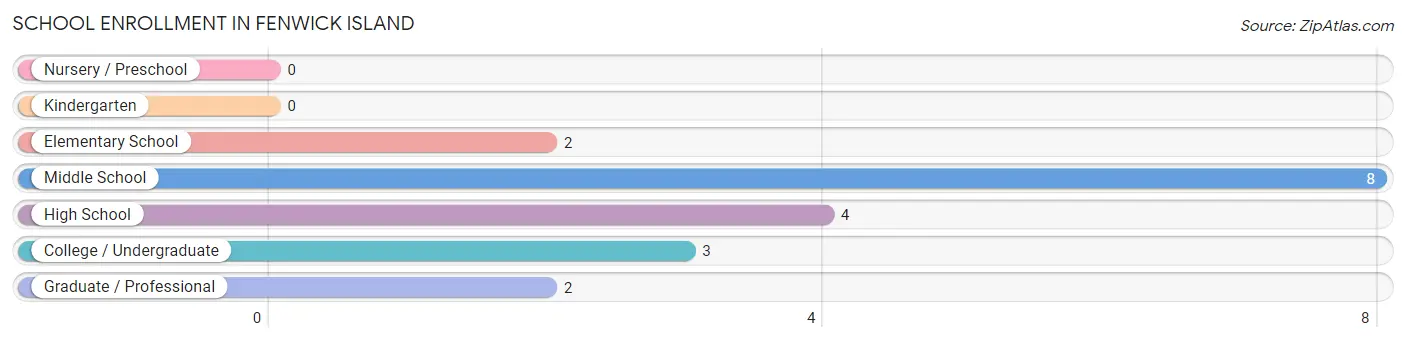
School Enrollment in Fenwick Island
The most common levels of schooling among the 19 students in Fenwick Island are middle school (8 | 42.1%), high school (4 | 21.0%), and college / undergraduate (3 | 15.8%).
| School Level | # Students | % Students |
| Nursery / Preschool | 0 | 0.0% |
| Kindergarten | 0 | 0.0% |
| Elementary School | 2 | 10.5% |
| Middle School | 8 | 42.1% |
| High School | 4 | 21.0% |
| College / Undergraduate | 3 | 15.8% |
| Graduate / Professional | 2 | 10.5% |
| Total | 19 | 100.0% |
School Enrollment by Age by Funding Source in Fenwick Island
Out of a total of 19 students who are enrolled in schools in Fenwick Island, 7 (36.8%) attend a private institution, while the remaining 12 (63.2%) are enrolled in public schools. The age group of 5 to 9 year old has the highest likelihood of being enrolled in private schools, with 2 (100.0% in the age bracket) enrolled. Conversely, the age group of 15 to 17 year olds has the lowest likelihood of being enrolled in a private school, with 4 (100.0% in the age bracket) attending a public institution.
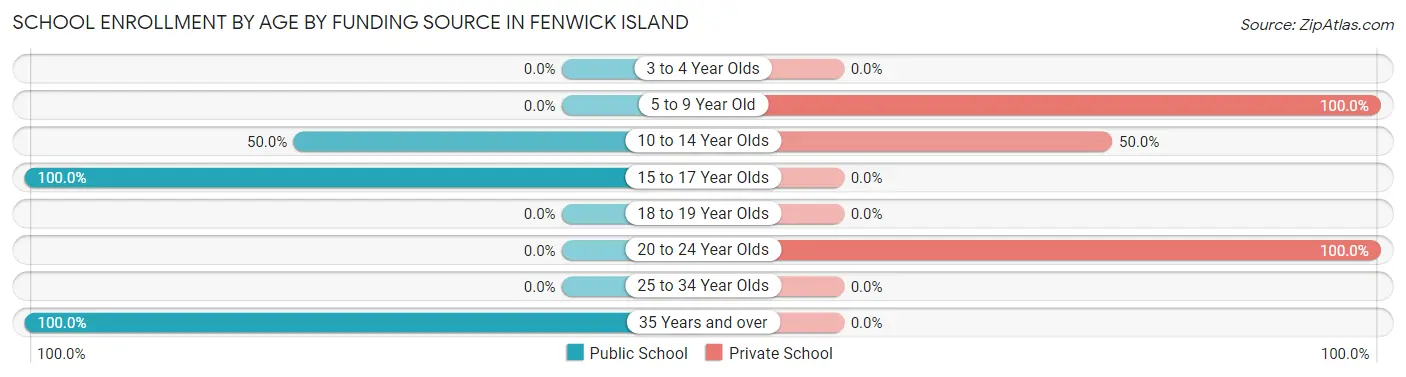
| Age Bracket | Public School | Private School |
| 3 to 4 Year Olds | 0 (0.0%) | 0 (0.0%) |
| 5 to 9 Year Old | 0 (0.0%) | 2 (100.0%) |
| 10 to 14 Year Olds | 4 (50.0%) | 4 (50.0%) |
| 15 to 17 Year Olds | 4 (100.0%) | 0 (0.0%) |
| 18 to 19 Year Olds | 0 (0.0%) | 0 (0.0%) |
| 20 to 24 Year Olds | 0 (0.0%) | 1 (100.0%) |
| 25 to 34 Year Olds | 0 (0.0%) | 0 (0.0%) |
| 35 Years and over | 4 (100.0%) | 0 (0.0%) |
| Total | 12 (63.2%) | 7 (36.8%) |
Educational Attainment by Field of Study in Fenwick Island
Business (49 | 22.9%), science & technology (31 | 14.5%), engineering (25 | 11.7%), social sciences (19 | 8.9%), and bio, nature & agricultural (16 | 7.5%) are the most common fields of study among 214 individuals in Fenwick Island who have obtained a bachelor's degree or higher.
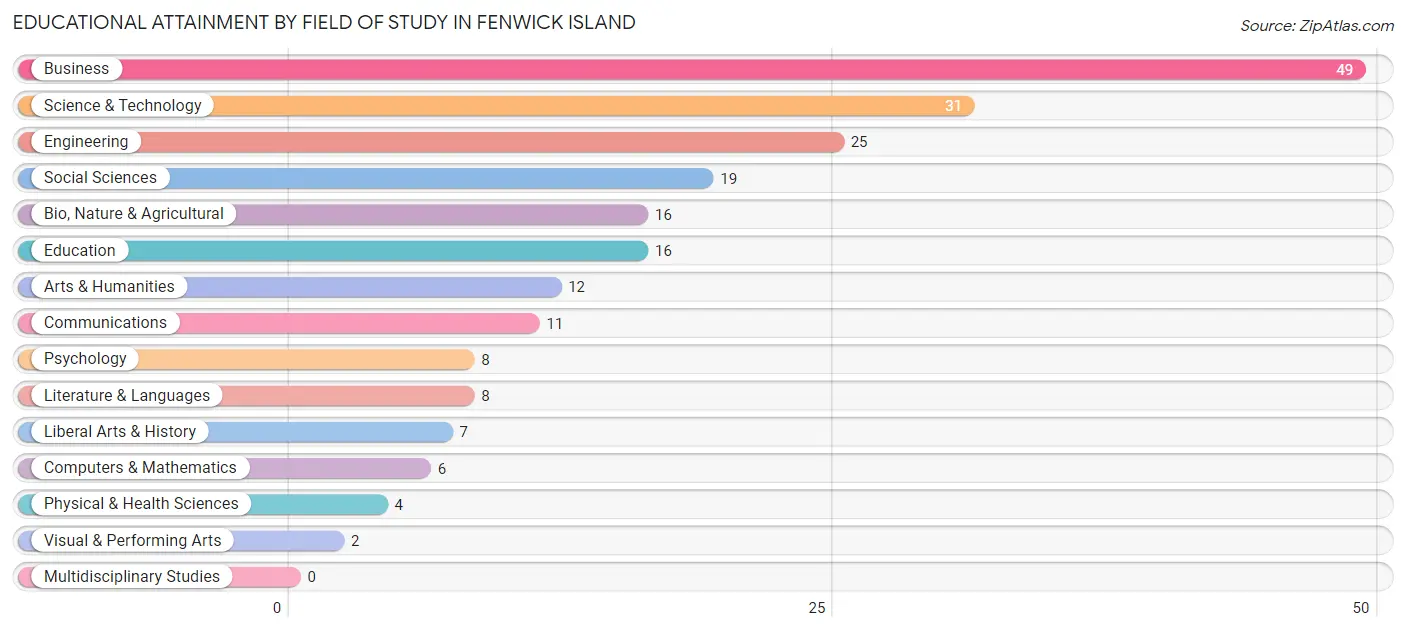
| Field of Study | # Graduates | % Graduates |
| Computers & Mathematics | 6 | 2.8% |
| Bio, Nature & Agricultural | 16 | 7.5% |
| Physical & Health Sciences | 4 | 1.9% |
| Psychology | 8 | 3.7% |
| Social Sciences | 19 | 8.9% |
| Engineering | 25 | 11.7% |
| Multidisciplinary Studies | 0 | 0.0% |
| Science & Technology | 31 | 14.5% |
| Business | 49 | 22.9% |
| Education | 16 | 7.5% |
| Literature & Languages | 8 | 3.7% |
| Liberal Arts & History | 7 | 3.3% |
| Visual & Performing Arts | 2 | 0.9% |
| Communications | 11 | 5.1% |
| Arts & Humanities | 12 | 5.6% |
| Total | 214 | 100.0% |
Transportation & Commute in Fenwick Island
Vehicle Availability by Sex in Fenwick Island
The most prevalent vehicle ownership categories in Fenwick Island are males with 2 vehicles (36, accounting for 70.6%) and females with 2 vehicles (29, making up 66.7%).
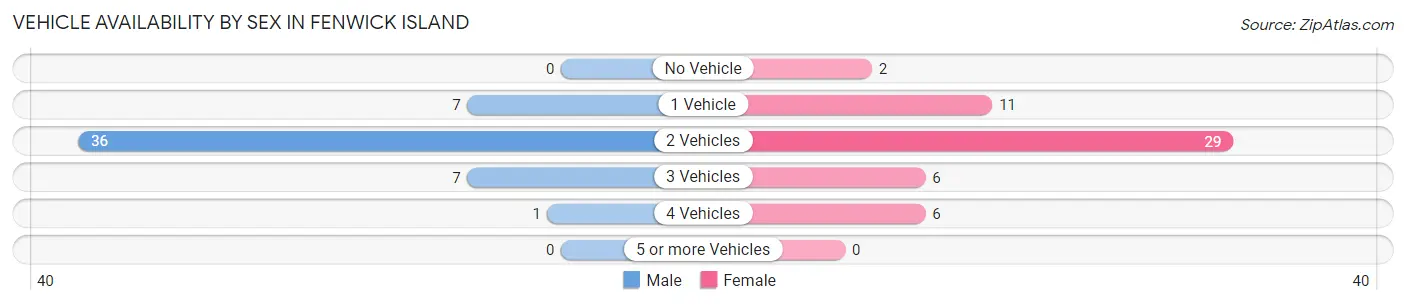
| Vehicles Available | Male | Female |
| No Vehicle | 0 (0.0%) | 2 (3.7%) |
| 1 Vehicle | 7 (13.7%) | 11 (20.4%) |
| 2 Vehicles | 36 (70.6%) | 29 (53.7%) |
| 3 Vehicles | 7 (13.7%) | 6 (11.1%) |
| 4 Vehicles | 1 (2.0%) | 6 (11.1%) |
| 5 or more Vehicles | 0 (0.0%) | 0 (0.0%) |
| Total | 51 (100.0%) | 54 (100.0%) |
Commute Time in Fenwick Island
The most frequently occuring commute durations in Fenwick Island are 20 to 24 minutes (21 commuters, 28.4%), 5 to 9 minutes (14 commuters, 18.9%), and 45 to 59 minutes (10 commuters, 13.5%).
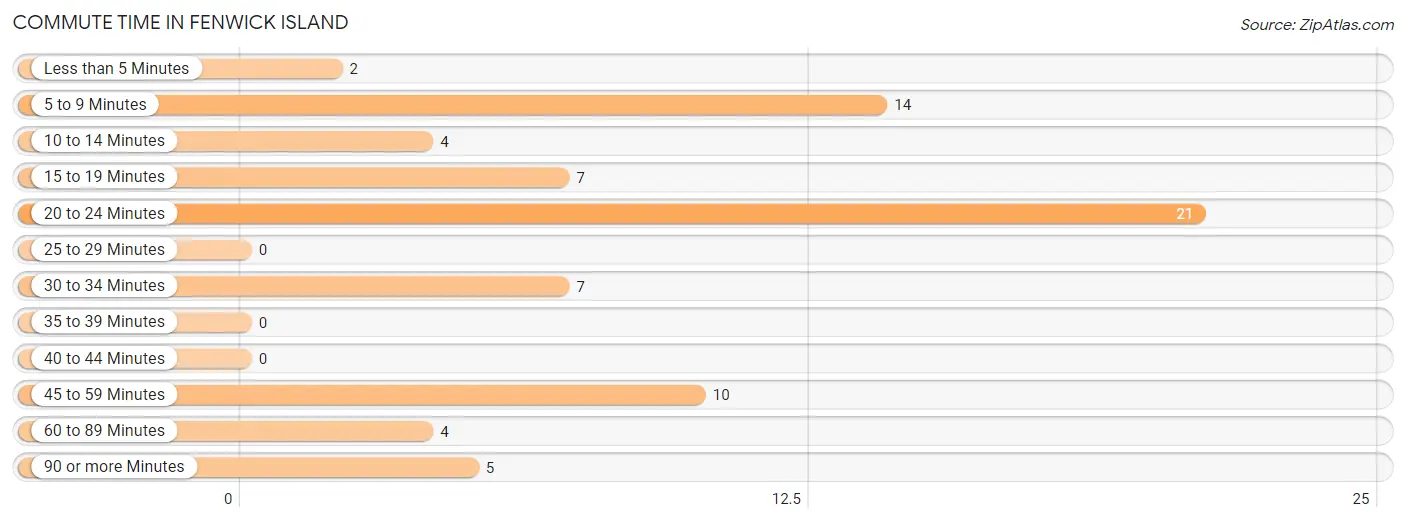
| Commute Time | # Commuters | % Commuters |
| Less than 5 Minutes | 2 | 2.7% |
| 5 to 9 Minutes | 14 | 18.9% |
| 10 to 14 Minutes | 4 | 5.4% |
| 15 to 19 Minutes | 7 | 9.5% |
| 20 to 24 Minutes | 21 | 28.4% |
| 25 to 29 Minutes | 0 | 0.0% |
| 30 to 34 Minutes | 7 | 9.5% |
| 35 to 39 Minutes | 0 | 0.0% |
| 40 to 44 Minutes | 0 | 0.0% |
| 45 to 59 Minutes | 10 | 13.5% |
| 60 to 89 Minutes | 4 | 5.4% |
| 90 or more Minutes | 5 | 6.8% |
Commute Time by Sex in Fenwick Island
The most common commute times in Fenwick Island are 5 to 9 minutes (11 commuters, 31.4%) for males and 20 to 24 minutes (18 commuters, 46.2%) for females.
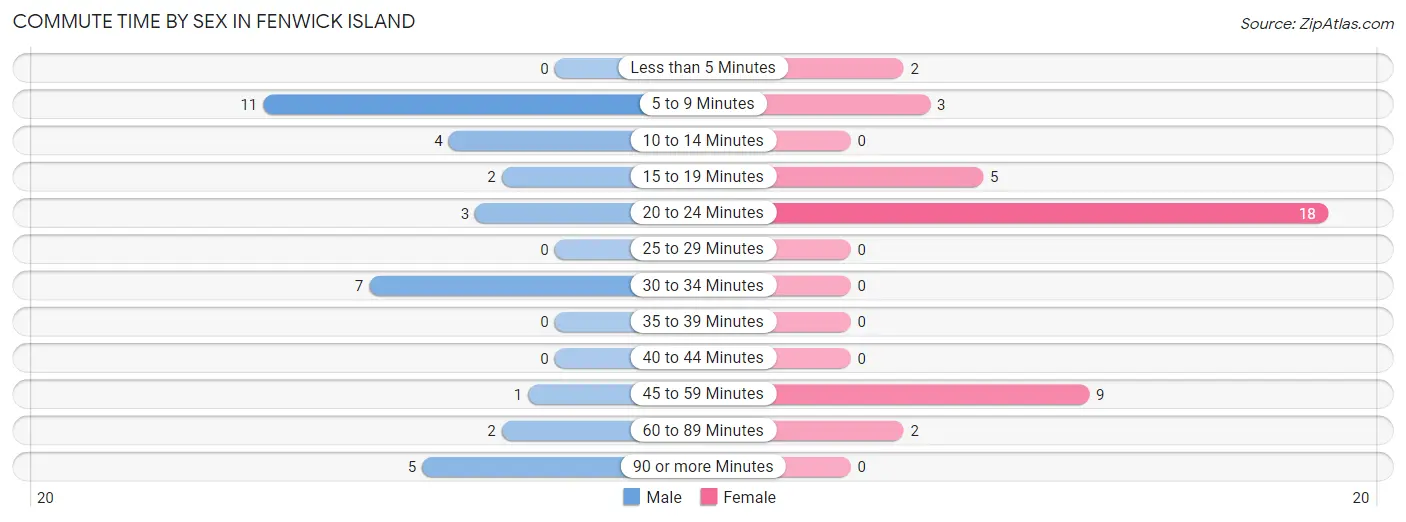
| Commute Time | Male | Female |
| Less than 5 Minutes | 0 (0.0%) | 2 (5.1%) |
| 5 to 9 Minutes | 11 (31.4%) | 3 (7.7%) |
| 10 to 14 Minutes | 4 (11.4%) | 0 (0.0%) |
| 15 to 19 Minutes | 2 (5.7%) | 5 (12.8%) |
| 20 to 24 Minutes | 3 (8.6%) | 18 (46.2%) |
| 25 to 29 Minutes | 0 (0.0%) | 0 (0.0%) |
| 30 to 34 Minutes | 7 (20.0%) | 0 (0.0%) |
| 35 to 39 Minutes | 0 (0.0%) | 0 (0.0%) |
| 40 to 44 Minutes | 0 (0.0%) | 0 (0.0%) |
| 45 to 59 Minutes | 1 (2.9%) | 9 (23.1%) |
| 60 to 89 Minutes | 2 (5.7%) | 2 (5.1%) |
| 90 or more Minutes | 5 (14.3%) | 0 (0.0%) |
Time of Departure to Work by Sex in Fenwick Island
The most frequent times of departure to work in Fenwick Island are 7:00 AM to 7:29 AM (11, 31.4%) for males and 8:00 AM to 8:29 AM (11, 28.2%) for females.
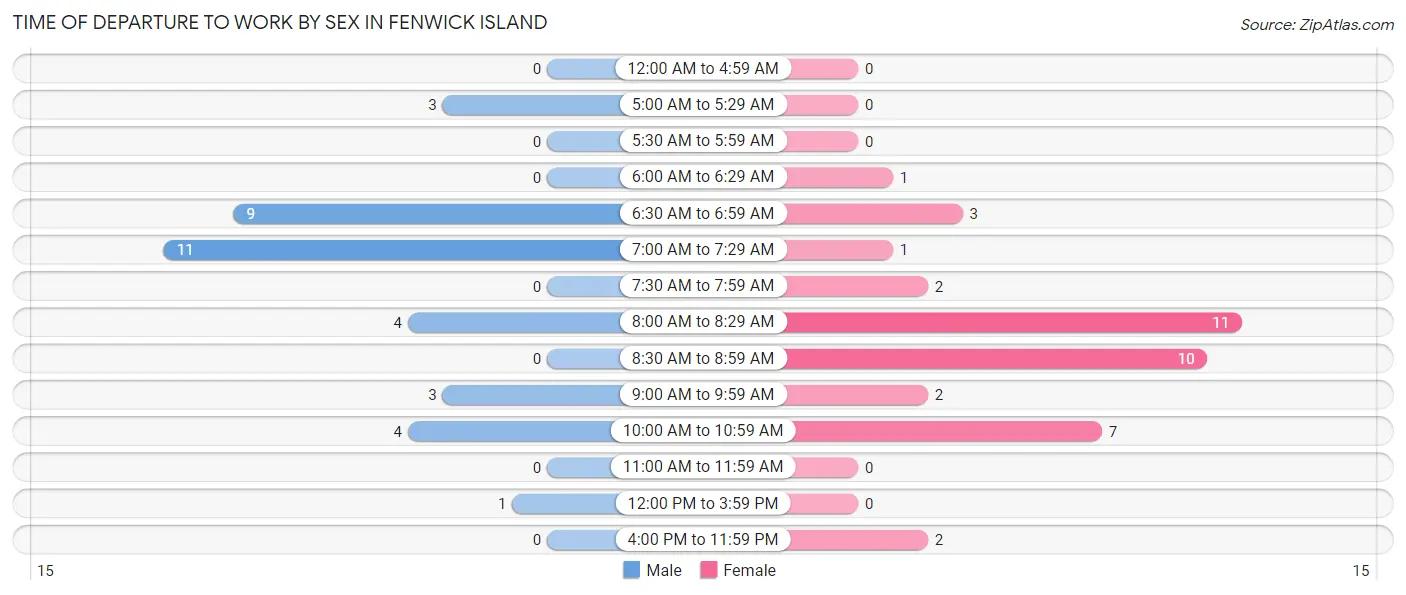
| Time of Departure | Male | Female |
| 12:00 AM to 4:59 AM | 0 (0.0%) | 0 (0.0%) |
| 5:00 AM to 5:29 AM | 3 (8.6%) | 0 (0.0%) |
| 5:30 AM to 5:59 AM | 0 (0.0%) | 0 (0.0%) |
| 6:00 AM to 6:29 AM | 0 (0.0%) | 1 (2.6%) |
| 6:30 AM to 6:59 AM | 9 (25.7%) | 3 (7.7%) |
| 7:00 AM to 7:29 AM | 11 (31.4%) | 1 (2.6%) |
| 7:30 AM to 7:59 AM | 0 (0.0%) | 2 (5.1%) |
| 8:00 AM to 8:29 AM | 4 (11.4%) | 11 (28.2%) |
| 8:30 AM to 8:59 AM | 0 (0.0%) | 10 (25.6%) |
| 9:00 AM to 9:59 AM | 3 (8.6%) | 2 (5.1%) |
| 10:00 AM to 10:59 AM | 4 (11.4%) | 7 (17.9%) |
| 11:00 AM to 11:59 AM | 0 (0.0%) | 0 (0.0%) |
| 12:00 PM to 3:59 PM | 1 (2.9%) | 0 (0.0%) |
| 4:00 PM to 11:59 PM | 0 (0.0%) | 2 (5.1%) |
| Total | 35 (100.0%) | 39 (100.0%) |
Housing Occupancy in Fenwick Island
Occupancy by Ownership in Fenwick Island
Of the total 197 dwellings in Fenwick Island, owner-occupied units account for 194 (98.5%), while renter-occupied units make up 3 (1.5%).
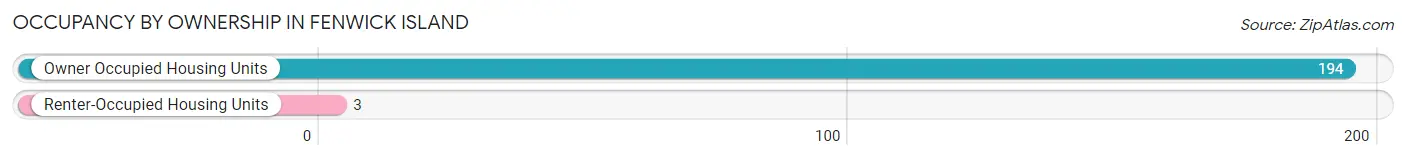
| Occupancy | # Housing Units | % Housing Units |
| Owner Occupied Housing Units | 194 | 98.5% |
| Renter-Occupied Housing Units | 3 | 1.5% |
| Total Occupied Housing Units | 197 | 100.0% |
Occupancy by Household Size in Fenwick Island
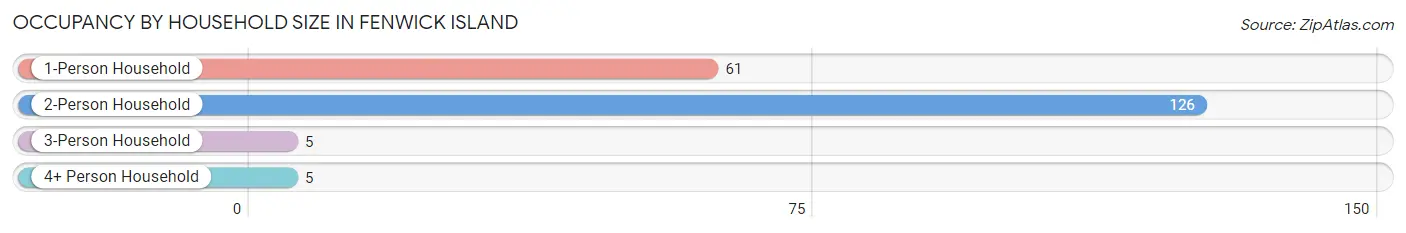
| Household Size | # Housing Units | % Housing Units |
| 1-Person Household | 61 | 31.0% |
| 2-Person Household | 126 | 64.0% |
| 3-Person Household | 5 | 2.5% |
| 4+ Person Household | 5 | 2.5% |
| Total Housing Units | 197 | 100.0% |
Occupancy by Ownership by Household Size in Fenwick Island
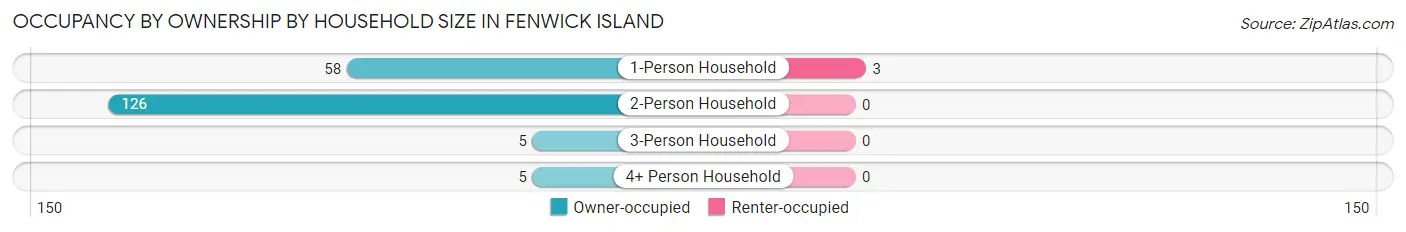
| Household Size | Owner-occupied | Renter-occupied |
| 1-Person Household | 58 (95.1%) | 3 (4.9%) |
| 2-Person Household | 126 (100.0%) | 0 (0.0%) |
| 3-Person Household | 5 (100.0%) | 0 (0.0%) |
| 4+ Person Household | 5 (100.0%) | 0 (0.0%) |
| Total Housing Units | 194 (98.5%) | 3 (1.5%) |
Occupancy by Educational Attainment in Fenwick Island
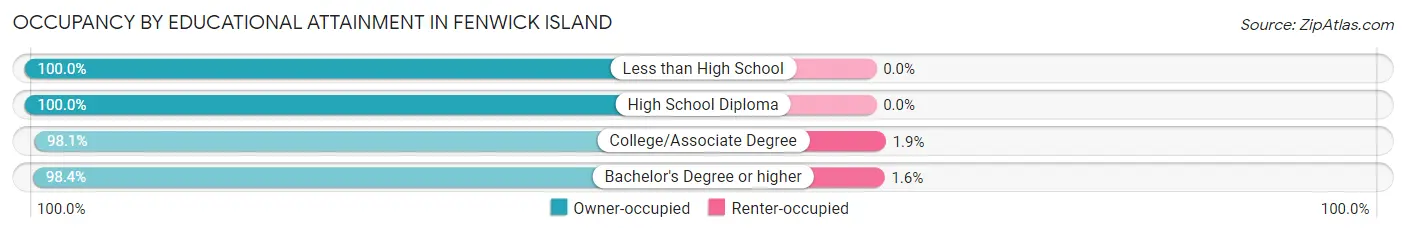
| Household Size | Owner-occupied | Renter-occupied |
| Less than High School | 7 (100.0%) | 0 (0.0%) |
| High School Diploma | 15 (100.0%) | 0 (0.0%) |
| College/Associate Degree | 52 (98.1%) | 1 (1.9%) |
| Bachelor's Degree or higher | 120 (98.4%) | 2 (1.6%) |
Occupancy by Age of Householder in Fenwick Island
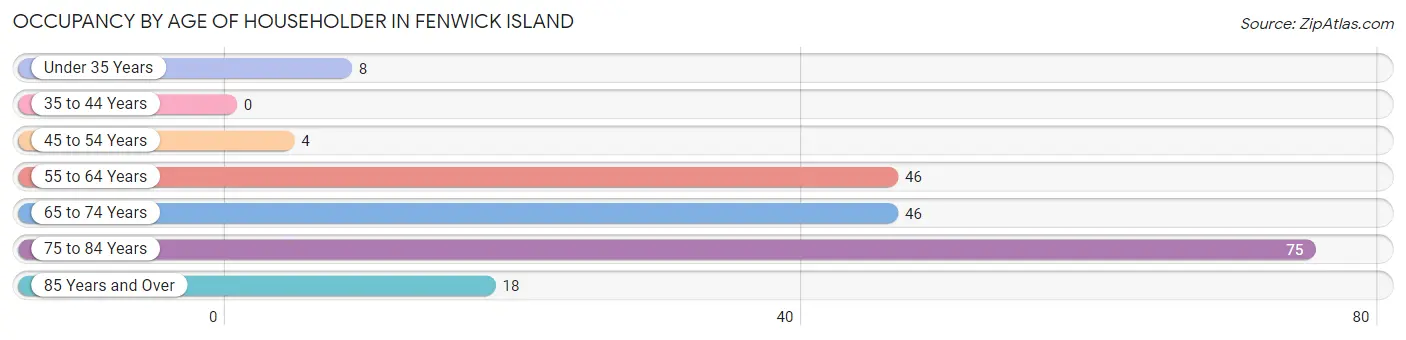
| Age Bracket | # Households | % Households |
| Under 35 Years | 8 | 4.1% |
| 35 to 44 Years | 0 | 0.0% |
| 45 to 54 Years | 4 | 2.0% |
| 55 to 64 Years | 46 | 23.4% |
| 65 to 74 Years | 46 | 23.4% |
| 75 to 84 Years | 75 | 38.1% |
| 85 Years and Over | 18 | 9.1% |
| Total | 197 | 100.0% |
Housing Finances in Fenwick Island
Median Income by Occupancy in Fenwick Island
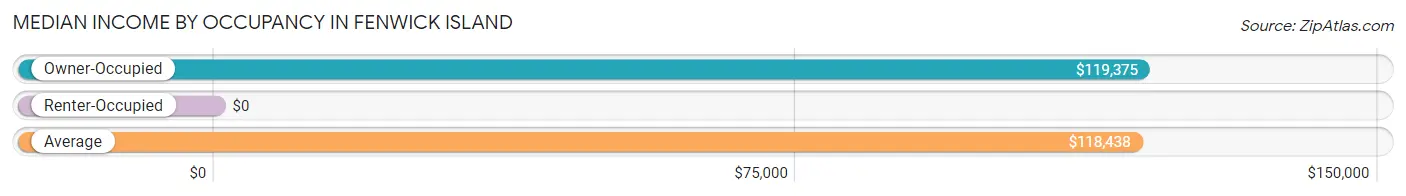
| Occupancy Type | # Households | Median Income |
| Owner-Occupied | 194 (98.5%) | $119,375 |
| Renter-Occupied | 3 (1.5%) | $0 |
| Average | 197 (100.0%) | $118,438 |
Occupancy by Householder Income Bracket in Fenwick Island
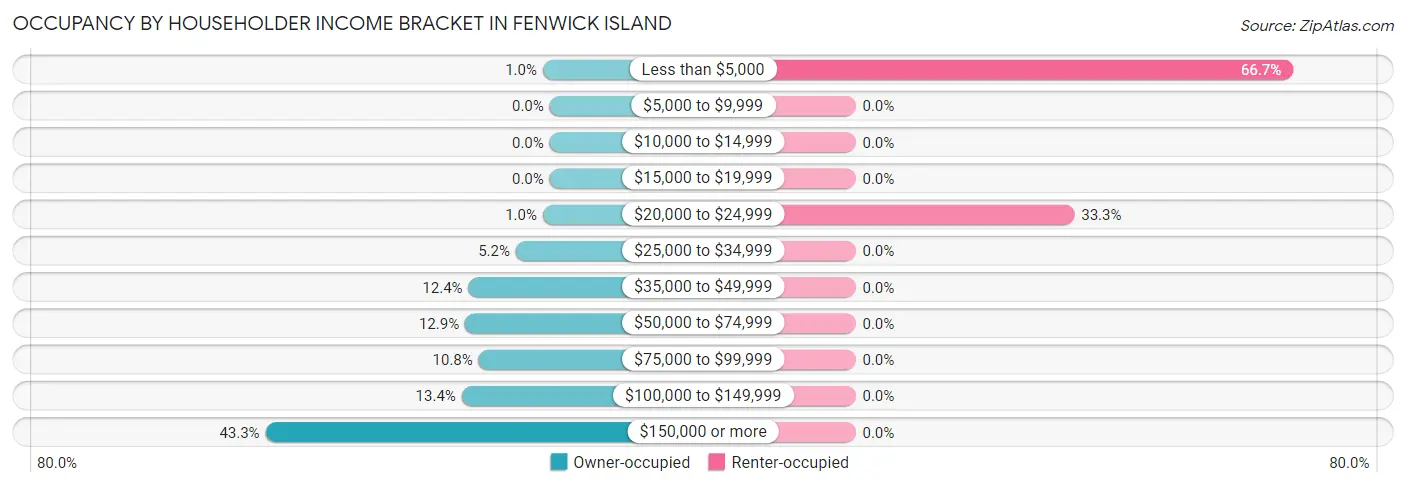
| Income Bracket | Owner-occupied | Renter-occupied |
| Less than $5,000 | 2 (1.0%) | 2 (66.7%) |
| $5,000 to $9,999 | 0 (0.0%) | 0 (0.0%) |
| $10,000 to $14,999 | 0 (0.0%) | 0 (0.0%) |
| $15,000 to $19,999 | 0 (0.0%) | 0 (0.0%) |
| $20,000 to $24,999 | 2 (1.0%) | 1 (33.3%) |
| $25,000 to $34,999 | 10 (5.1%) | 0 (0.0%) |
| $35,000 to $49,999 | 24 (12.4%) | 0 (0.0%) |
| $50,000 to $74,999 | 25 (12.9%) | 0 (0.0%) |
| $75,000 to $99,999 | 21 (10.8%) | 0 (0.0%) |
| $100,000 to $149,999 | 26 (13.4%) | 0 (0.0%) |
| $150,000 or more | 84 (43.3%) | 0 (0.0%) |
| Total | 194 (100.0%) | 3 (100.0%) |
Monthly Housing Cost Tiers in Fenwick Island
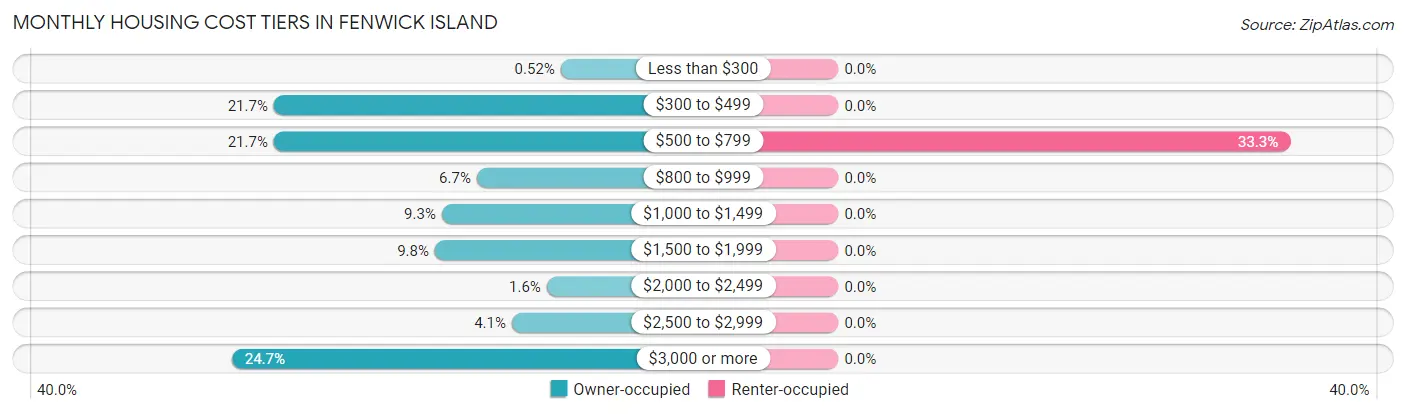
| Monthly Cost | Owner-occupied | Renter-occupied |
| Less than $300 | 1 (0.5%) | 0 (0.0%) |
| $300 to $499 | 42 (21.6%) | 0 (0.0%) |
| $500 to $799 | 42 (21.6%) | 1 (33.3%) |
| $800 to $999 | 13 (6.7%) | 0 (0.0%) |
| $1,000 to $1,499 | 18 (9.3%) | 0 (0.0%) |
| $1,500 to $1,999 | 19 (9.8%) | 0 (0.0%) |
| $2,000 to $2,499 | 3 (1.5%) | 0 (0.0%) |
| $2,500 to $2,999 | 8 (4.1%) | 0 (0.0%) |
| $3,000 or more | 48 (24.7%) | 0 (0.0%) |
| Total | 194 (100.0%) | 3 (100.0%) |
Physical Housing Characteristics in Fenwick Island
Housing Structures in Fenwick Island
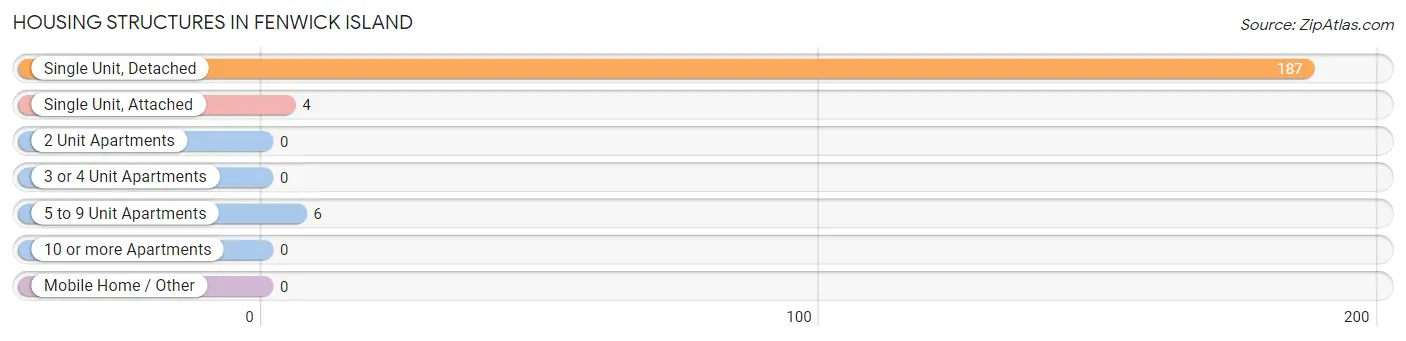
| Structure Type | # Housing Units | % Housing Units |
| Single Unit, Detached | 187 | 94.9% |
| Single Unit, Attached | 4 | 2.0% |
| 2 Unit Apartments | 0 | 0.0% |
| 3 or 4 Unit Apartments | 0 | 0.0% |
| 5 to 9 Unit Apartments | 6 | 3.0% |
| 10 or more Apartments | 0 | 0.0% |
| Mobile Home / Other | 0 | 0.0% |
| Total | 197 | 100.0% |
Housing Structures by Occupancy in Fenwick Island
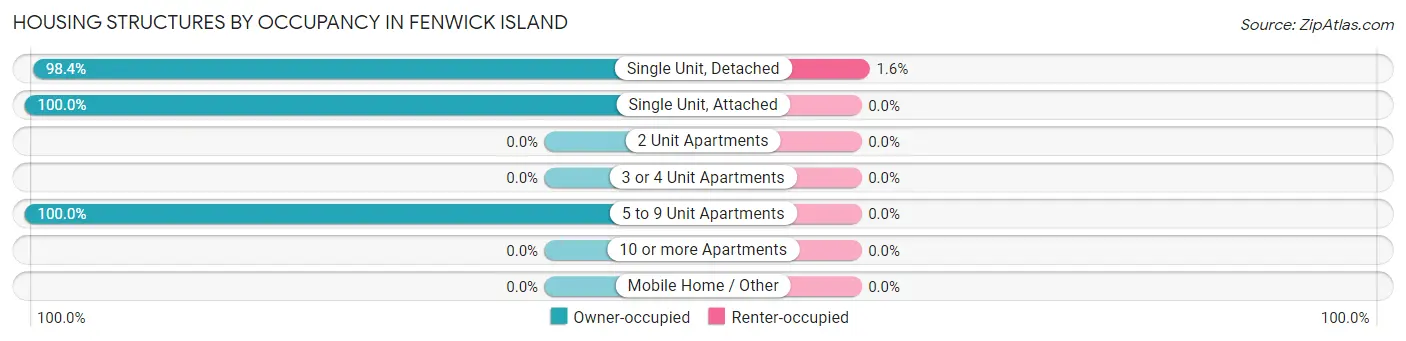
| Structure Type | Owner-occupied | Renter-occupied |
| Single Unit, Detached | 184 (98.4%) | 3 (1.6%) |
| Single Unit, Attached | 4 (100.0%) | 0 (0.0%) |
| 2 Unit Apartments | 0 (0.0%) | 0 (0.0%) |
| 3 or 4 Unit Apartments | 0 (0.0%) | 0 (0.0%) |
| 5 to 9 Unit Apartments | 6 (100.0%) | 0 (0.0%) |
| 10 or more Apartments | 0 (0.0%) | 0 (0.0%) |
| Mobile Home / Other | 0 (0.0%) | 0 (0.0%) |
| Total | 194 (98.5%) | 3 (1.5%) |
Housing Structures by Number of Rooms in Fenwick Island
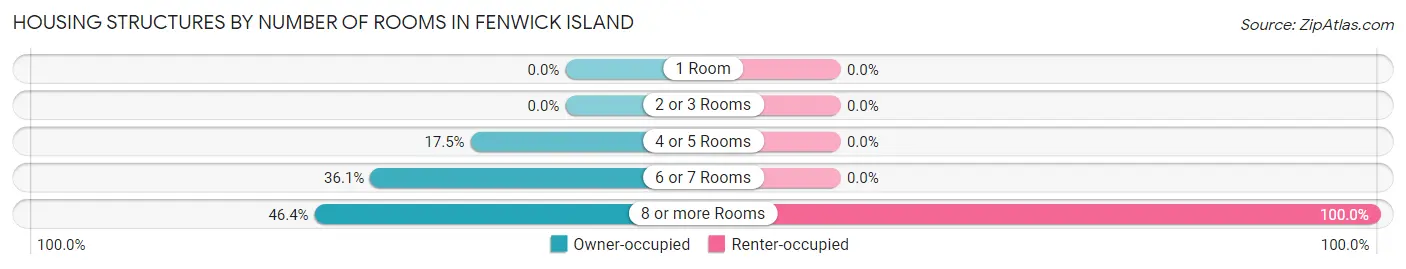
| Number of Rooms | Owner-occupied | Renter-occupied |
| 1 Room | 0 (0.0%) | 0 (0.0%) |
| 2 or 3 Rooms | 0 (0.0%) | 0 (0.0%) |
| 4 or 5 Rooms | 34 (17.5%) | 0 (0.0%) |
| 6 or 7 Rooms | 70 (36.1%) | 0 (0.0%) |
| 8 or more Rooms | 90 (46.4%) | 3 (100.0%) |
| Total | 194 (100.0%) | 3 (100.0%) |
Housing Structure by Heating Type in Fenwick Island
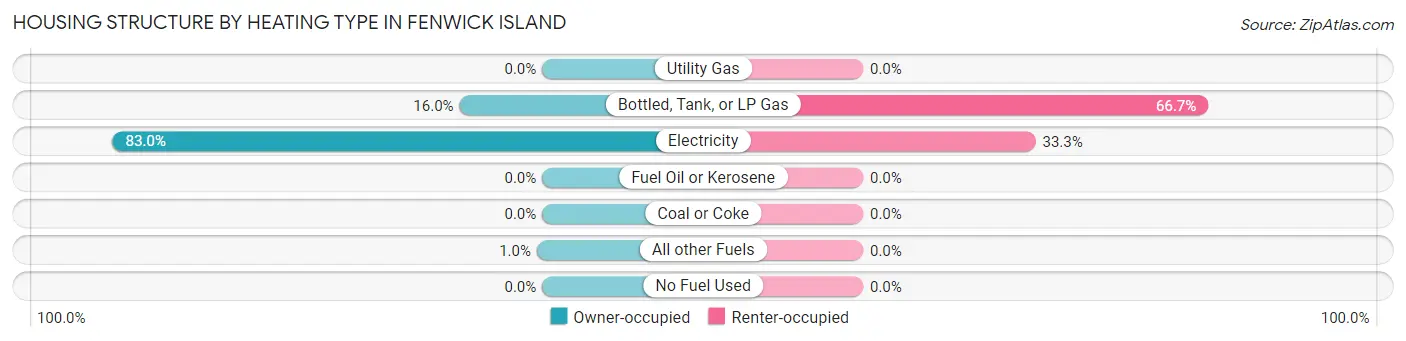
| Heating Type | Owner-occupied | Renter-occupied |
| Utility Gas | 0 (0.0%) | 0 (0.0%) |
| Bottled, Tank, or LP Gas | 31 (16.0%) | 2 (66.7%) |
| Electricity | 161 (83.0%) | 1 (33.3%) |
| Fuel Oil or Kerosene | 0 (0.0%) | 0 (0.0%) |
| Coal or Coke | 0 (0.0%) | 0 (0.0%) |
| All other Fuels | 2 (1.0%) | 0 (0.0%) |
| No Fuel Used | 0 (0.0%) | 0 (0.0%) |
| Total | 194 (100.0%) | 3 (100.0%) |
Household Vehicle Usage in Fenwick Island
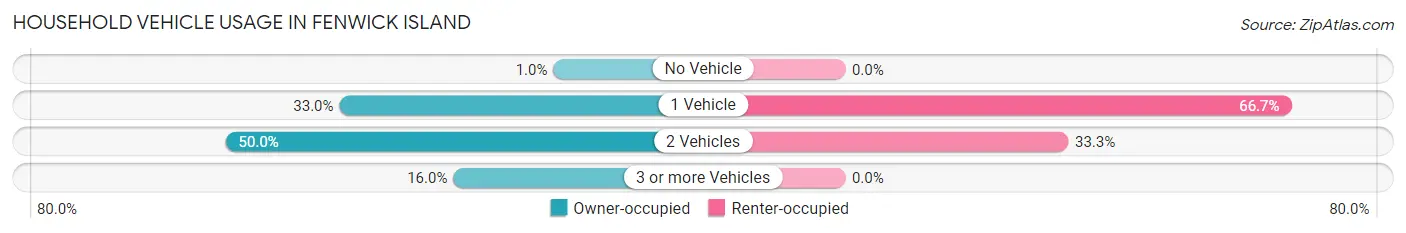
| Vehicles per Household | Owner-occupied | Renter-occupied |
| No Vehicle | 2 (1.0%) | 0 (0.0%) |
| 1 Vehicle | 64 (33.0%) | 2 (66.7%) |
| 2 Vehicles | 97 (50.0%) | 1 (33.3%) |
| 3 or more Vehicles | 31 (16.0%) | 0 (0.0%) |
| Total | 194 (100.0%) | 3 (100.0%) |
Real Estate & Mortgages in Fenwick Island
Real Estate and Mortgage Overview in Fenwick Island
| Characteristic | Without Mortgage | With Mortgage |
| Housing Units | 115 | 79 |
| Median Property Value | $1,086,500 | $1,437,500 |
| Median Household Income | $105,938 | $43 |
| Monthly Housing Costs | $625 | $48 |
| Real Estate Taxes | $2,403 | $0 |
Property Value by Mortgage Status in Fenwick Island
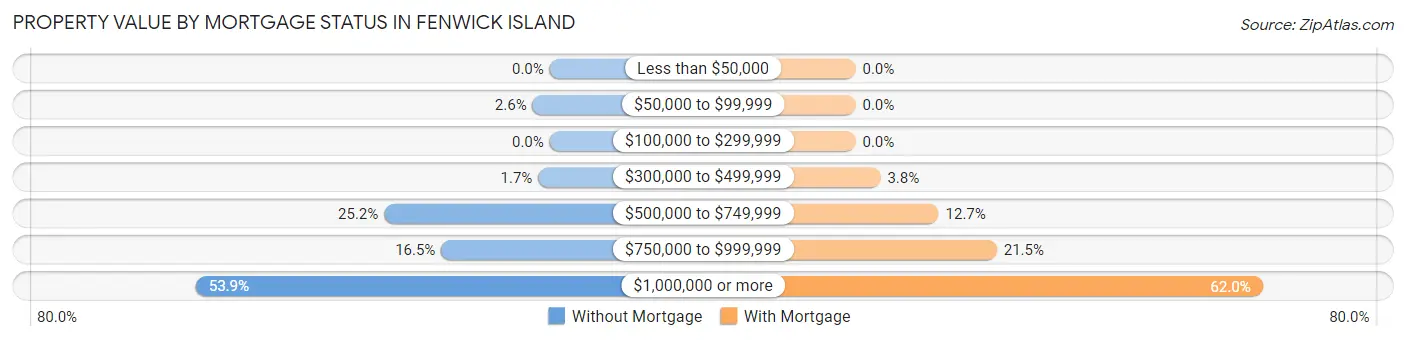
| Property Value | Without Mortgage | With Mortgage |
| Less than $50,000 | 0 (0.0%) | 0 (0.0%) |
| $50,000 to $99,999 | 3 (2.6%) | 0 (0.0%) |
| $100,000 to $299,999 | 0 (0.0%) | 0 (0.0%) |
| $300,000 to $499,999 | 2 (1.7%) | 3 (3.8%) |
| $500,000 to $749,999 | 29 (25.2%) | 10 (12.7%) |
| $750,000 to $999,999 | 19 (16.5%) | 17 (21.5%) |
| $1,000,000 or more | 62 (53.9%) | 49 (62.0%) |
| Total | 115 (100.0%) | 79 (100.0%) |
Household Income by Mortgage Status in Fenwick Island
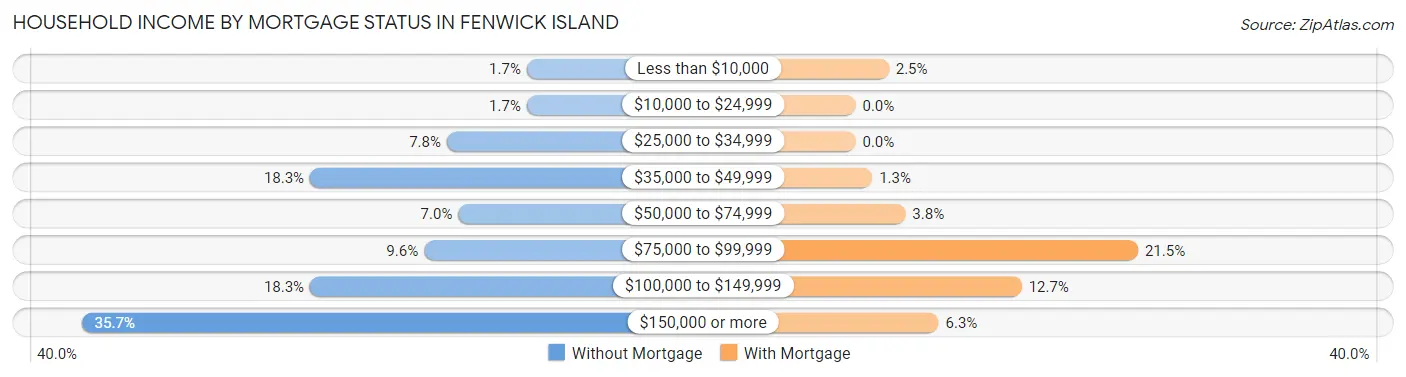
| Household Income | Without Mortgage | With Mortgage |
| Less than $10,000 | 2 (1.7%) | 2 (2.5%) |
| $10,000 to $24,999 | 2 (1.7%) | 0 (0.0%) |
| $25,000 to $34,999 | 9 (7.8%) | 0 (0.0%) |
| $35,000 to $49,999 | 21 (18.3%) | 1 (1.3%) |
| $50,000 to $74,999 | 8 (7.0%) | 3 (3.8%) |
| $75,000 to $99,999 | 11 (9.6%) | 17 (21.5%) |
| $100,000 to $149,999 | 21 (18.3%) | 10 (12.7%) |
| $150,000 or more | 41 (35.6%) | 5 (6.3%) |
| Total | 115 (100.0%) | 79 (100.0%) |
Property Value to Household Income Ratio in Fenwick Island
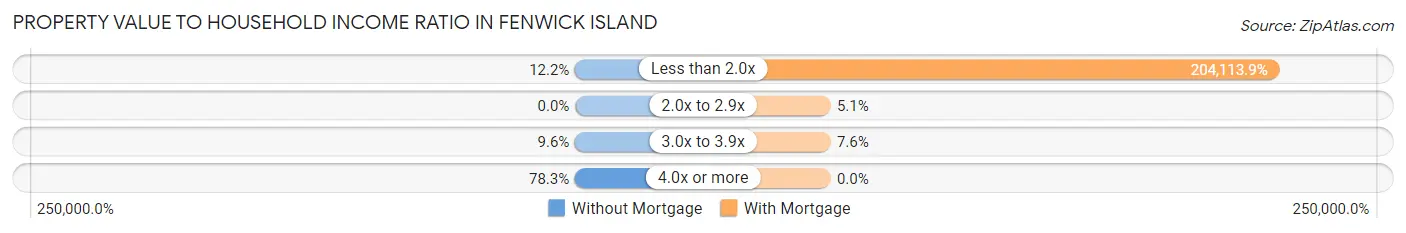
| Value-to-Income Ratio | Without Mortgage | With Mortgage |
| Less than 2.0x | 14 (12.2%) | 161,250 (204,113.9%) |
| 2.0x to 2.9x | 0 (0.0%) | 4 (5.1%) |
| 3.0x to 3.9x | 11 (9.6%) | 6 (7.6%) |
| 4.0x or more | 90 (78.3%) | 0 (0.0%) |
| Total | 115 (100.0%) | 79 (100.0%) |
Real Estate Taxes by Mortgage Status in Fenwick Island
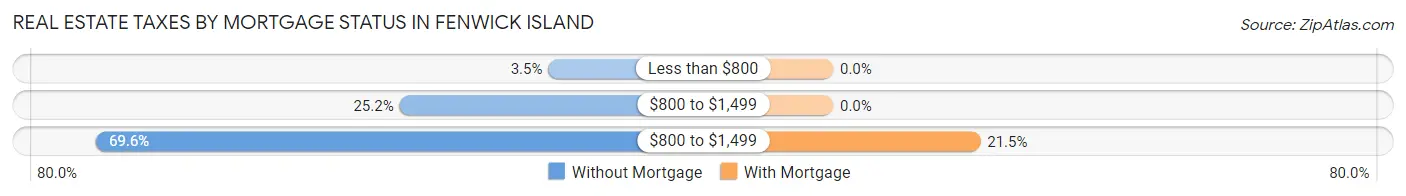
| Property Taxes | Without Mortgage | With Mortgage |
| Less than $800 | 4 (3.5%) | 0 (0.0%) |
| $800 to $1,499 | 29 (25.2%) | 0 (0.0%) |
| $800 to $1,499 | 80 (69.6%) | 17 (21.5%) |
| Total | 115 (100.0%) | 79 (100.0%) |
Health & Disability in Fenwick Island
Health Insurance Coverage by Age in Fenwick Island
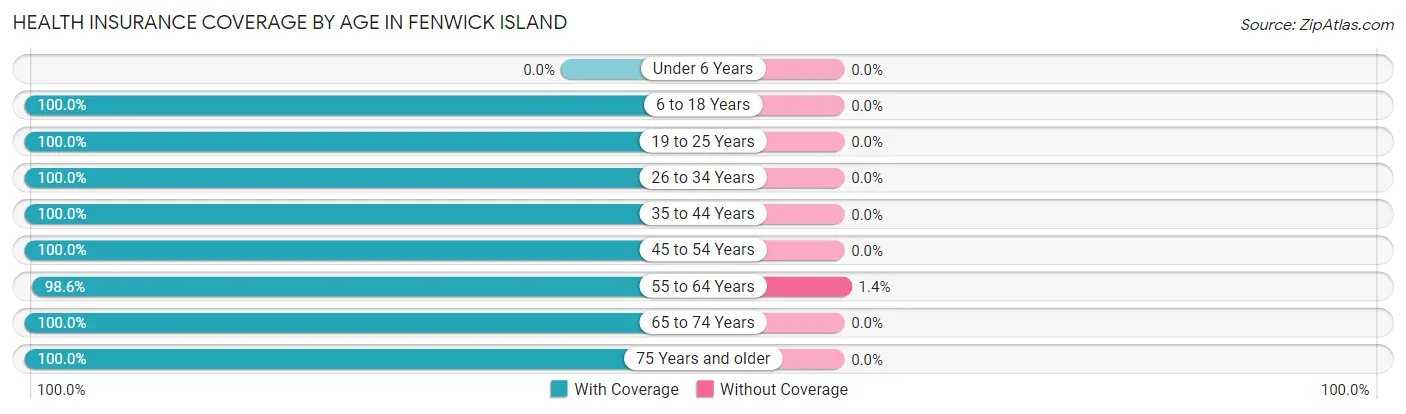
| Age Bracket | With Coverage | Without Coverage |
| Under 6 Years | 0 (0.0%) | 0 (0.0%) |
| 6 to 18 Years | 14 (100.0%) | 0 (0.0%) |
| 19 to 25 Years | 3 (100.0%) | 0 (0.0%) |
| 26 to 34 Years | 12 (100.0%) | 0 (0.0%) |
| 35 to 44 Years | 1 (100.0%) | 0 (0.0%) |
| 45 to 54 Years | 15 (100.0%) | 0 (0.0%) |
| 55 to 64 Years | 72 (98.6%) | 1 (1.4%) |
| 65 to 74 Years | 86 (100.0%) | 0 (0.0%) |
| 75 Years and older | 146 (100.0%) | 0 (0.0%) |
| Total | 349 (99.7%) | 1 (0.3%) |
Health Insurance Coverage by Citizenship Status in Fenwick Island
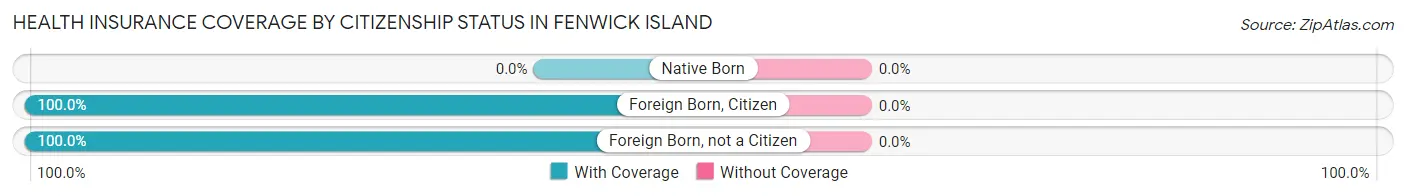
| Citizenship Status | With Coverage | Without Coverage |
| Native Born | 0 (0.0%) | 0 (0.0%) |
| Foreign Born, Citizen | 14 (100.0%) | 0 (0.0%) |
| Foreign Born, not a Citizen | 3 (100.0%) | 0 (0.0%) |
Health Insurance Coverage by Household Income in Fenwick Island
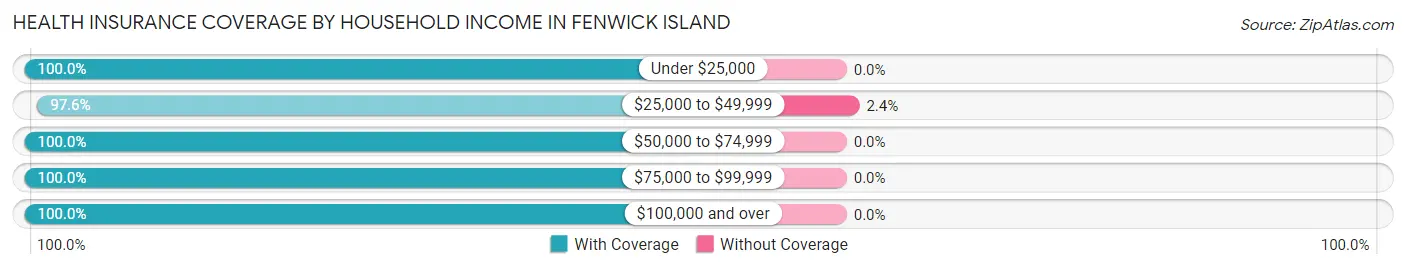
| Household Income | With Coverage | Without Coverage |
| Under $25,000 | 7 (100.0%) | 0 (0.0%) |
| $25,000 to $49,999 | 41 (97.6%) | 1 (2.4%) |
| $50,000 to $74,999 | 42 (100.0%) | 0 (0.0%) |
| $75,000 to $99,999 | 39 (100.0%) | 0 (0.0%) |
| $100,000 and over | 220 (100.0%) | 0 (0.0%) |
Public vs Private Health Insurance Coverage by Age in Fenwick Island
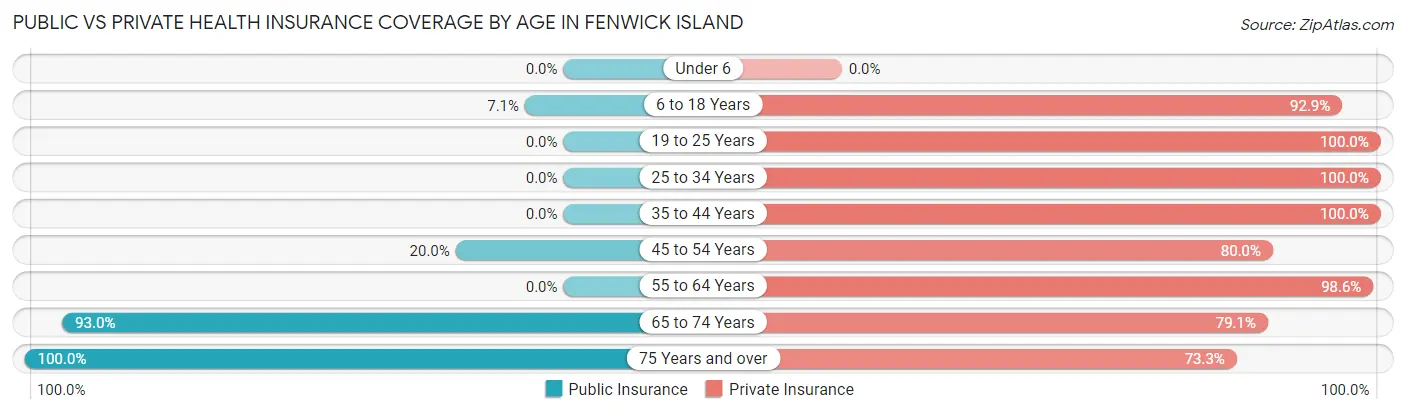
| Age Bracket | Public Insurance | Private Insurance |
| Under 6 | 0 (0.0%) | 0 (0.0%) |
| 6 to 18 Years | 1 (7.1%) | 13 (92.9%) |
| 19 to 25 Years | 0 (0.0%) | 3 (100.0%) |
| 25 to 34 Years | 0 (0.0%) | 12 (100.0%) |
| 35 to 44 Years | 0 (0.0%) | 1 (100.0%) |
| 45 to 54 Years | 3 (20.0%) | 12 (80.0%) |
| 55 to 64 Years | 0 (0.0%) | 72 (98.6%) |
| 65 to 74 Years | 80 (93.0%) | 68 (79.1%) |
| 75 Years and over | 146 (100.0%) | 107 (73.3%) |
| Total | 230 (65.7%) | 288 (82.3%) |
Disability Status by Sex by Age in Fenwick Island
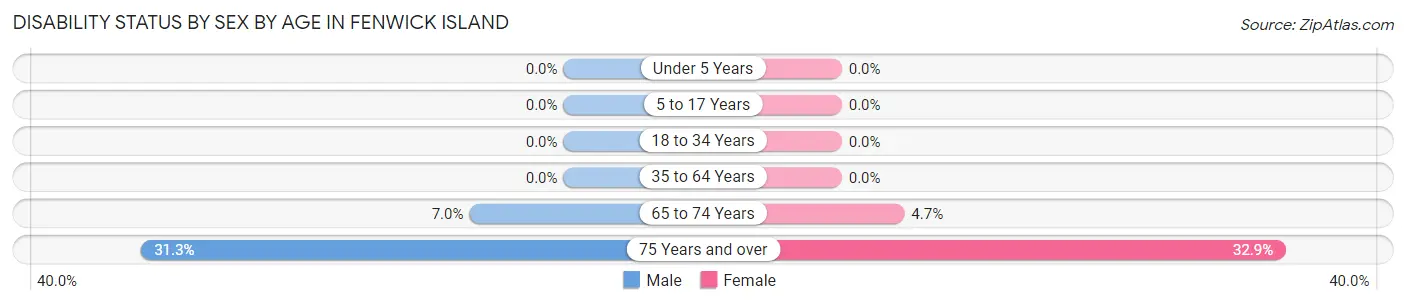
| Age Bracket | Male | Female |
| Under 5 Years | 0 (0.0%) | 0 (0.0%) |
| 5 to 17 Years | 0 (0.0%) | 0 (0.0%) |
| 18 to 34 Years | 0 (0.0%) | 0 (0.0%) |
| 35 to 64 Years | 0 (0.0%) | 0 (0.0%) |
| 65 to 74 Years | 3 (7.0%) | 2 (4.6%) |
| 75 Years and over | 21 (31.3%) | 26 (32.9%) |
Disability Class by Sex by Age in Fenwick Island
Disability Class: Hearing Difficulty
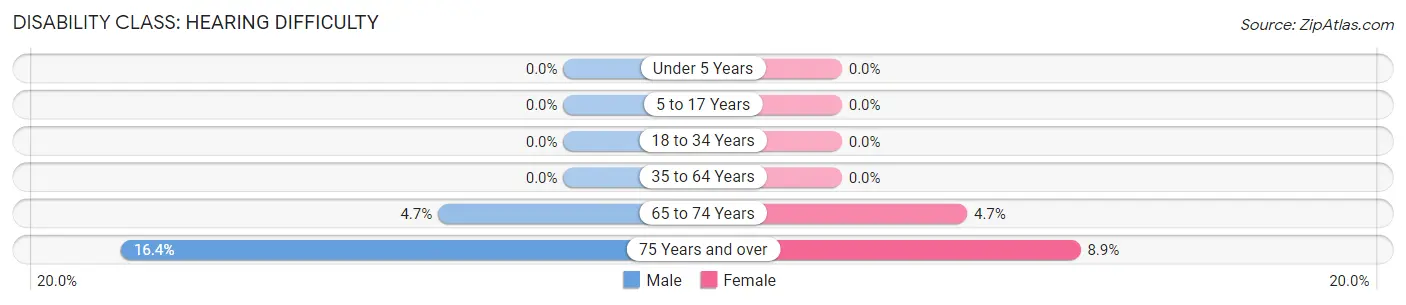
| Age Bracket | Male | Female |
| Under 5 Years | 0 (0.0%) | 0 (0.0%) |
| 5 to 17 Years | 0 (0.0%) | 0 (0.0%) |
| 18 to 34 Years | 0 (0.0%) | 0 (0.0%) |
| 35 to 64 Years | 0 (0.0%) | 0 (0.0%) |
| 65 to 74 Years | 2 (4.6%) | 2 (4.6%) |
| 75 Years and over | 11 (16.4%) | 7 (8.9%) |
Disability Class: Vision Difficulty
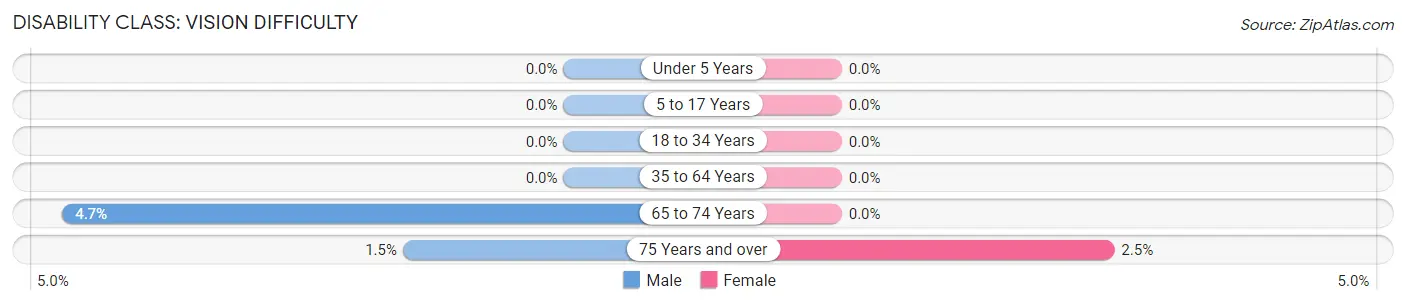
| Age Bracket | Male | Female |
| Under 5 Years | 0 (0.0%) | 0 (0.0%) |
| 5 to 17 Years | 0 (0.0%) | 0 (0.0%) |
| 18 to 34 Years | 0 (0.0%) | 0 (0.0%) |
| 35 to 64 Years | 0 (0.0%) | 0 (0.0%) |
| 65 to 74 Years | 2 (4.6%) | 0 (0.0%) |
| 75 Years and over | 1 (1.5%) | 2 (2.5%) |
Disability Class: Cognitive Difficulty
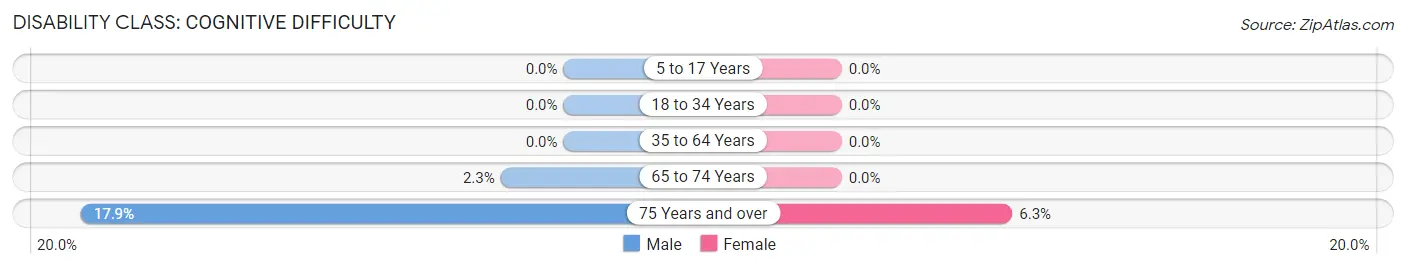
| Age Bracket | Male | Female |
| 5 to 17 Years | 0 (0.0%) | 0 (0.0%) |
| 18 to 34 Years | 0 (0.0%) | 0 (0.0%) |
| 35 to 64 Years | 0 (0.0%) | 0 (0.0%) |
| 65 to 74 Years | 1 (2.3%) | 0 (0.0%) |
| 75 Years and over | 12 (17.9%) | 5 (6.3%) |
Disability Class: Ambulatory Difficulty
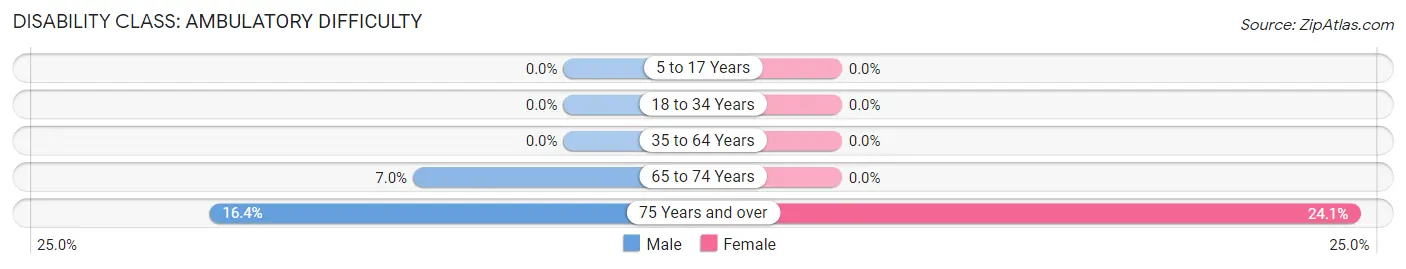
| Age Bracket | Male | Female |
| 5 to 17 Years | 0 (0.0%) | 0 (0.0%) |
| 18 to 34 Years | 0 (0.0%) | 0 (0.0%) |
| 35 to 64 Years | 0 (0.0%) | 0 (0.0%) |
| 65 to 74 Years | 3 (7.0%) | 0 (0.0%) |
| 75 Years and over | 11 (16.4%) | 19 (24.0%) |
Disability Class: Self-Care Difficulty
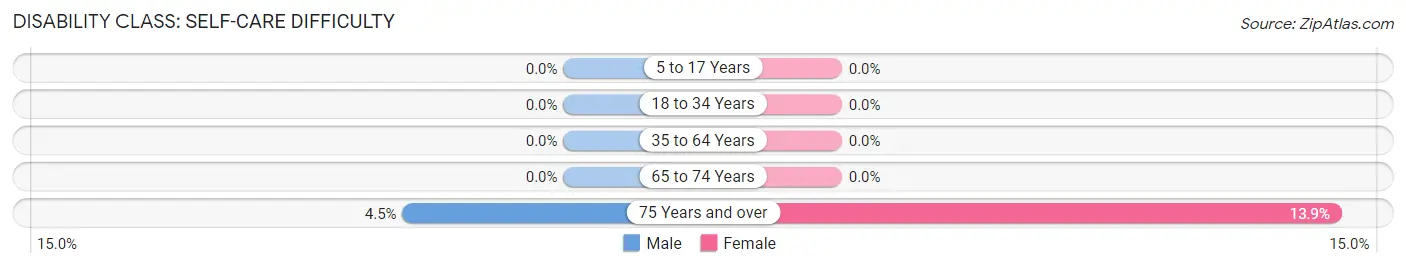
| Age Bracket | Male | Female |
| 5 to 17 Years | 0 (0.0%) | 0 (0.0%) |
| 18 to 34 Years | 0 (0.0%) | 0 (0.0%) |
| 35 to 64 Years | 0 (0.0%) | 0 (0.0%) |
| 65 to 74 Years | 0 (0.0%) | 0 (0.0%) |
| 75 Years and over | 3 (4.5%) | 11 (13.9%) |
Technology Access in Fenwick Island
Computing Device Access in Fenwick Island
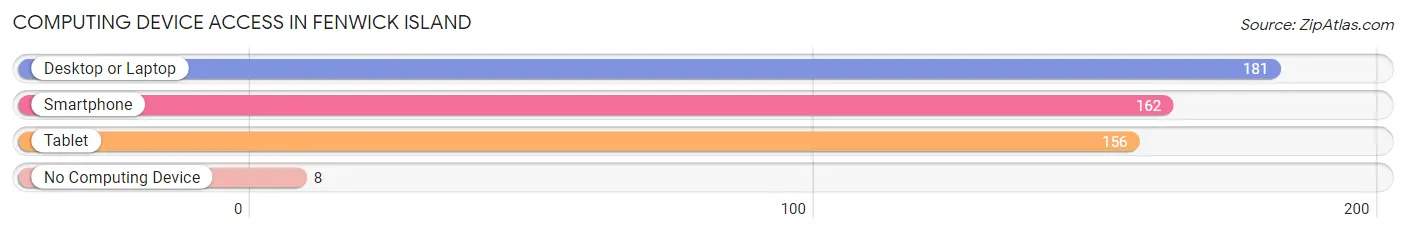
| Device Type | # Households | % Households |
| Desktop or Laptop | 181 | 91.9% |
| Smartphone | 162 | 82.2% |
| Tablet | 156 | 79.2% |
| No Computing Device | 8 | 4.1% |
| Total | 197 | 100.0% |
Internet Access in Fenwick Island
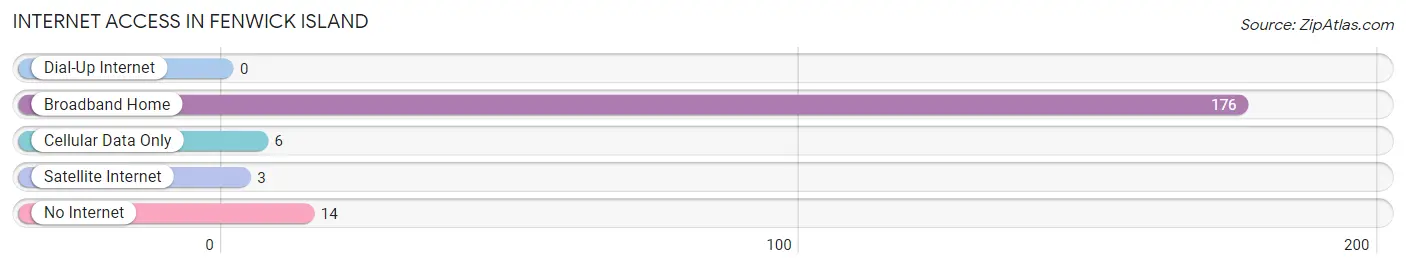
| Internet Type | # Households | % Households |
| Dial-Up Internet | 0 | 0.0% |
| Broadband Home | 176 | 89.3% |
| Cellular Data Only | 6 | 3.0% |
| Satellite Internet | 3 | 1.5% |
| No Internet | 14 | 7.1% |
| Total | 197 | 100.0% |
Fenwick Island Summary
Fenwick Island is a small town located in Sussex County, Delaware, United States. It is situated on the Atlantic Ocean, just south of the Maryland border. The town is part of the Ocean View Metropolitan Statistical Area and is a popular summer destination for beachgoers.
History
Fenwick Island was first settled in the late 1600s by English colonists. The town was named after Thomas Fenwick, a prominent landowner in the area. In the early 1800s, the town was a popular destination for wealthy families from Philadelphia and Baltimore. The town was incorporated in 1953 and has since become a popular summer destination for beachgoers.
Geography
Fenwick Island is located in Sussex County, Delaware, United States. It is situated on the Atlantic Ocean, just south of the Maryland border. The town is bordered by the towns of Bethany Beach to the north and Ocean City, Maryland to the south. The town is located on a barrier island, which is separated from the mainland by the Indian River Bay. The town has a total area of 1.2 square miles, all of which is land.
Economy
Fenwick Island’s economy is largely based on tourism. The town is a popular summer destination for beachgoers and is home to several hotels, restaurants, and shops. The town also has a thriving fishing industry, with several charter boats offering deep sea fishing trips.
Demographics
As of the 2010 census, Fenwick Island had a population of 369. The racial makeup of the town was 97.3% White, 0.3% African American, 0.3% Native American, 0.8% Asian, and 1.3% from other races. The median household income was $50,000 and the median family income was $60,000. The per capita income was $30,000.
Conclusion
Fenwick Island is a small town located in Sussex County, Delaware, United States. It is situated on the Atlantic Ocean, just south of the Maryland border. The town is part of the Ocean View Metropolitan Statistical Area and is a popular summer destination for beachgoers. The town’s economy is largely based on tourism and fishing. As of the 2010 census, Fenwick Island had a population of 369. The racial makeup of the town was 97.3% White, 0.3% African American, 0.3% Native American, 0.8% Asian, and 1.3% from other races. The median household income was $50,000 and the median family income was $60,000. The per capita income was $30,000.
Common Questions
What is the Total Population of Fenwick Island?
Total Population of Fenwick Island is 350.
What is the Total Male Population of Fenwick Island?
Total Male Population of Fenwick Island is 161.
What is the Total Female Population of Fenwick Island?
Total Female Population of Fenwick Island is 189.
What is the Ratio of Males per 100 Females in Fenwick Island?
There are 85.19 Males per 100 Females in Fenwick Island.
What is the Ratio of Females per 100 Males in Fenwick Island?
There are 117.39 Females per 100 Males in Fenwick Island.
What is the Median Population Age in Fenwick Island?
Median Population Age in Fenwick Island is 70.1 Years.
What is the Average Family Size in Fenwick Island
Average Family Size in Fenwick Island is 2.1 People.
What is the Average Household Size in Fenwick Island
Average Household Size in Fenwick Island is 1.8 People.
What is Per Capita Income in Fenwick Island?
Per Capita income in Fenwick Island is $118,955.
What is the Median Family Income in Fenwick Island?
Median Family Income in Fenwick Island is $178,125.
What is the Median Household income in Fenwick Island?
Median Household Income in Fenwick Island is $118,438.
What is Inequality or Gini Index in Fenwick Island?
Inequality or Gini Index in Fenwick Island is 0.54.
How Large is the Labor Force in Fenwick Island?
There are 107 People in the Labor Forcein in Fenwick Island.
What is the Percentage of People in the Labor Force in Fenwick Island?
31.6% of People are in the Labor Force in Fenwick Island.