Richville, OH
Richville Map
Richville Overview
3,023
TOTAL POPULATION
1,665
MALE POPULATION
1,358
FEMALE POPULATION
122.61
MALES / 100 FEMALES
81.56
FEMALES / 100 MALES
50.0
MEDIAN AGE
2.8
AVG FAMILY SIZE
2.2
AVG HOUSEHOLD SIZE
$38,272
PER CAPITA INCOME
$96,974
AVG FAMILY INCOME
$75,074
AVG HOUSEHOLD INCOME
48.8%
WAGE / INCOME GAP [ % ]
51.2¢/ $1
WAGE / INCOME GAP [ $ ]
0.36
INEQUALITY / GINI INDEX
1,664
LABOR FORCE [ PEOPLE ]
62.4%
PERCENT IN LABOR FORCE
2.7%
UNEMPLOYMENT RATE
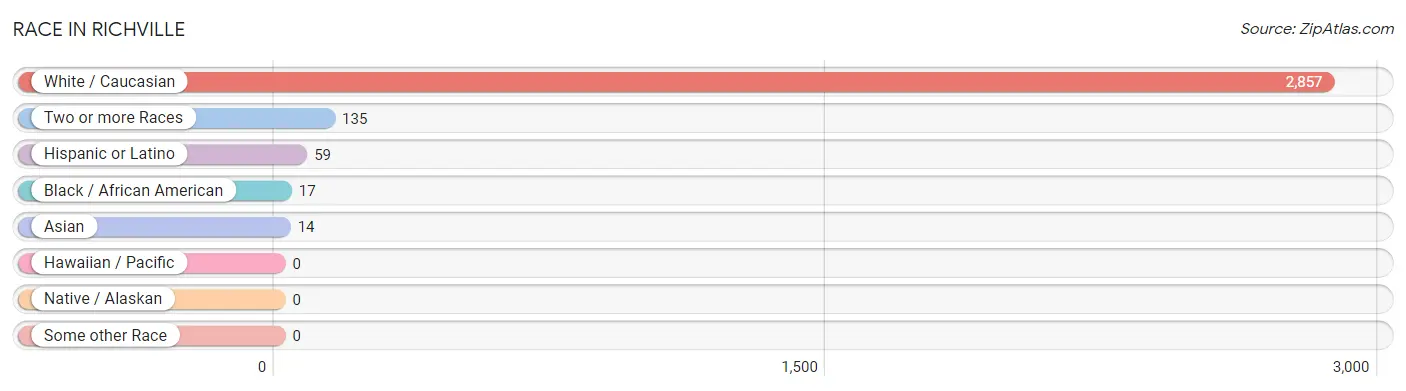
Race in Richville
The most populous races in Richville are White / Caucasian (2,857 | 94.5%), Two or more Races (135 | 4.5%), and Hispanic or Latino (59 | 1.9%).
| Race | # Population | % Population |
| Asian | 14 | 0.5% |
| Black / African American | 17 | 0.6% |
| Hawaiian / Pacific | 0 | 0.0% |
| Hispanic or Latino | 59 | 1.9% |
| Native / Alaskan | 0 | 0.0% |
| White / Caucasian | 2,857 | 94.5% |
| Two or more Races | 135 | 4.5% |
| Some other Race | 0 | 0.0% |
| Total | 3,023 | 100.0% |
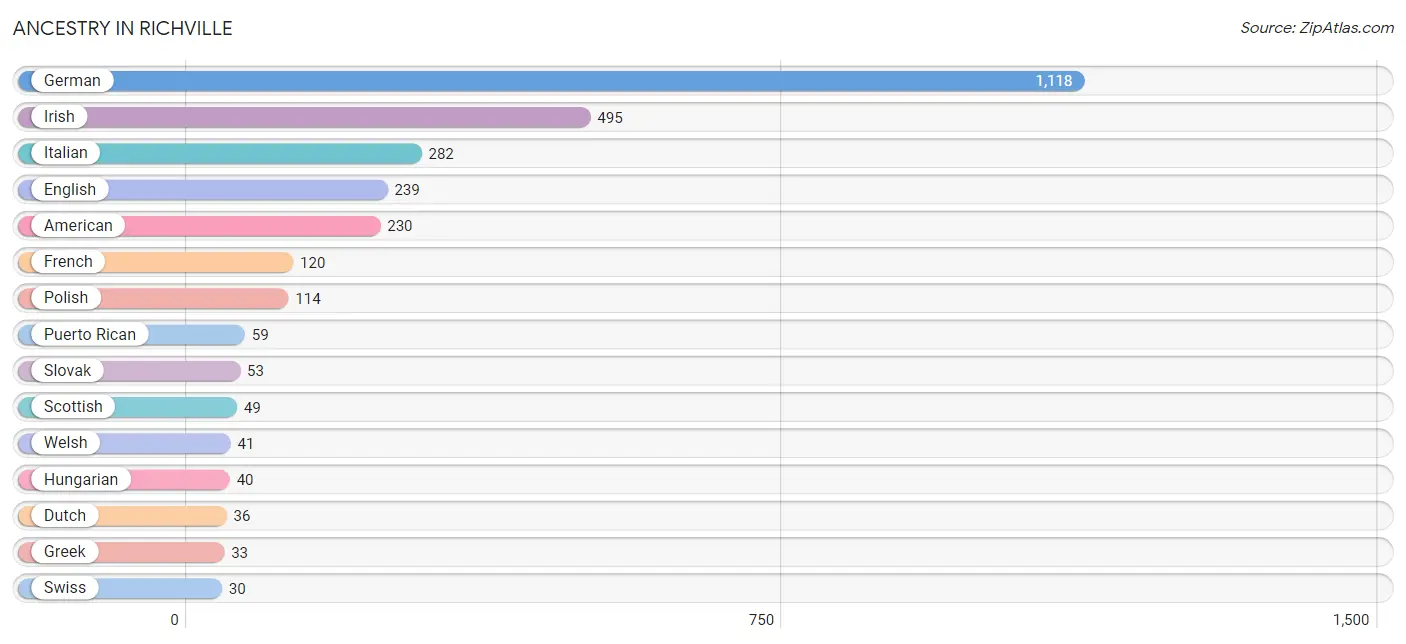
Ancestry in Richville
The most populous ancestries reported in Richville are German (1,118 | 37.0%), Irish (495 | 16.4%), Italian (282 | 9.3%), English (239 | 7.9%), and American (230 | 7.6%), together accounting for 78.2% of all Richville residents.
| Ancestry | # Population | % Population |
| African | 5 | 0.2% |
| American | 230 | 7.6% |
| Bhutanese | 14 | 0.5% |
| Blackfeet | 9 | 0.3% |
| British | 8 | 0.3% |
| Cherokee | 17 | 0.6% |
| Chippewa | 10 | 0.3% |
| Choctaw | 7 | 0.2% |
| Croatian | 21 | 0.7% |
| Czechoslovakian | 20 | 0.7% |
| Dutch | 36 | 1.2% |
| Eastern European | 9 | 0.3% |
| English | 239 | 7.9% |
| European | 12 | 0.4% |
| French | 120 | 4.0% |
| French Canadian | 10 | 0.3% |
| German | 1,118 | 37.0% |
| Greek | 33 | 1.1% |
| Hungarian | 40 | 1.3% |
| Irish | 495 | 16.4% |
| Italian | 282 | 9.3% |
| Lithuanian | 10 | 0.3% |
| Nigerian | 5 | 0.2% |
| Pennsylvania German | 13 | 0.4% |
| Polish | 114 | 3.8% |
| Puerto Rican | 59 | 1.9% |
| Russian | 9 | 0.3% |
| Scandinavian | 18 | 0.6% |
| Scotch-Irish | 13 | 0.4% |
| Scottish | 49 | 1.6% |
| Slavic | 7 | 0.2% |
| Slovak | 53 | 1.8% |
| Slovene | 23 | 0.8% |
| Subsaharan African | 10 | 0.3% |
| Swiss | 30 | 1.0% |
| Welsh | 41 | 1.4% |
| Yugoslavian | 9 | 0.3% | View All 37 Rows |
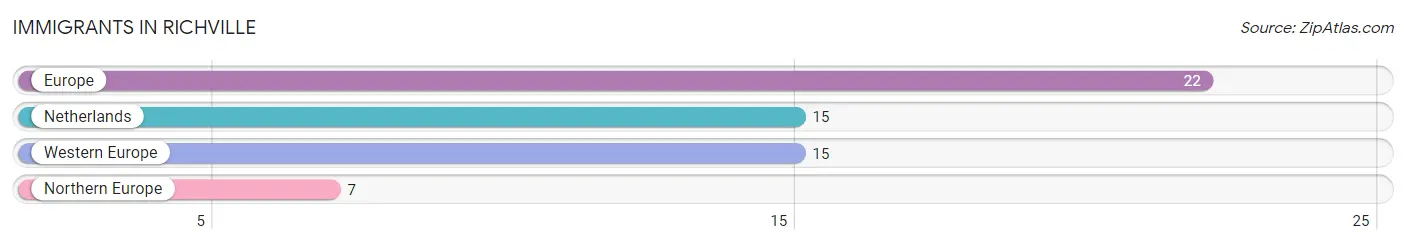
Immigrants in Richville
The most numerous immigrant groups reported in Richville came from Europe (22 | 0.7%), Netherlands (15 | 0.5%), Western Europe (15 | 0.5%), and Northern Europe (7 | 0.2%), together accounting for 2.0% of all Richville residents.
| Immigration Origin | # Population | % Population |
| Europe | 22 | 0.7% |
| Netherlands | 15 | 0.5% |
| Northern Europe | 7 | 0.2% |
| Western Europe | 15 | 0.5% | View All 4 Rows |
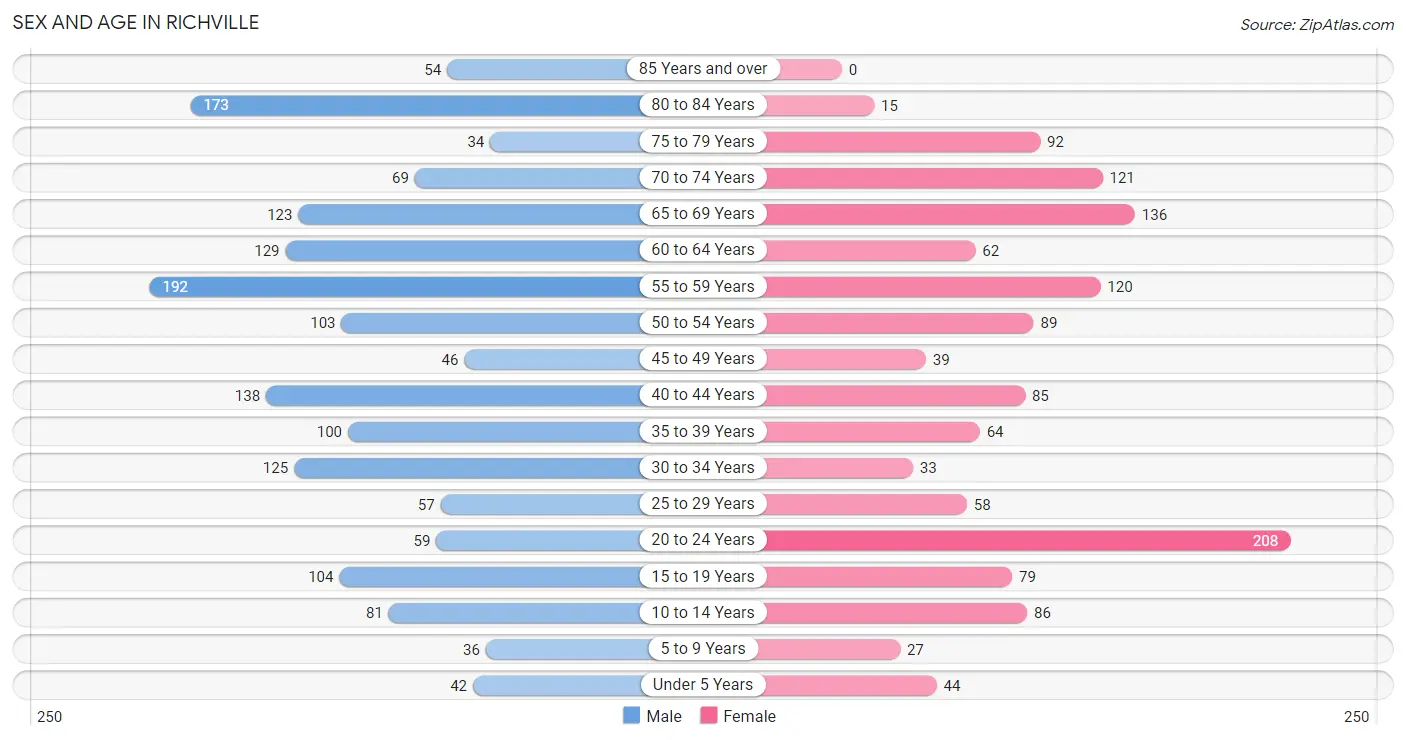
Sex and Age in Richville
Sex and Age in Richville
The most populous age groups in Richville are 55 to 59 Years (192 | 11.5%) for men and 20 to 24 Years (208 | 15.3%) for women.
| Age Bracket | Male | Female |
| Under 5 Years | 42 (2.5%) | 44 (3.2%) |
| 5 to 9 Years | 36 (2.2%) | 27 (2.0%) |
| 10 to 14 Years | 81 (4.9%) | 86 (6.3%) |
| 15 to 19 Years | 104 (6.2%) | 79 (5.8%) |
| 20 to 24 Years | 59 (3.5%) | 208 (15.3%) |
| 25 to 29 Years | 57 (3.4%) | 58 (4.3%) |
| 30 to 34 Years | 125 (7.5%) | 33 (2.4%) |
| 35 to 39 Years | 100 (6.0%) | 64 (4.7%) |
| 40 to 44 Years | 138 (8.3%) | 85 (6.3%) |
| 45 to 49 Years | 46 (2.8%) | 39 (2.9%) |
| 50 to 54 Years | 103 (6.2%) | 89 (6.6%) |
| 55 to 59 Years | 192 (11.5%) | 120 (8.8%) |
| 60 to 64 Years | 129 (7.7%) | 62 (4.6%) |
| 65 to 69 Years | 123 (7.4%) | 136 (10.0%) |
| 70 to 74 Years | 69 (4.1%) | 121 (8.9%) |
| 75 to 79 Years | 34 (2.0%) | 92 (6.8%) |
| 80 to 84 Years | 173 (10.4%) | 15 (1.1%) |
| 85 Years and over | 54 (3.2%) | 0 (0.0%) |
| Total | 1,665 (100.0%) | 1,358 (100.0%) |
Families and Households in Richville
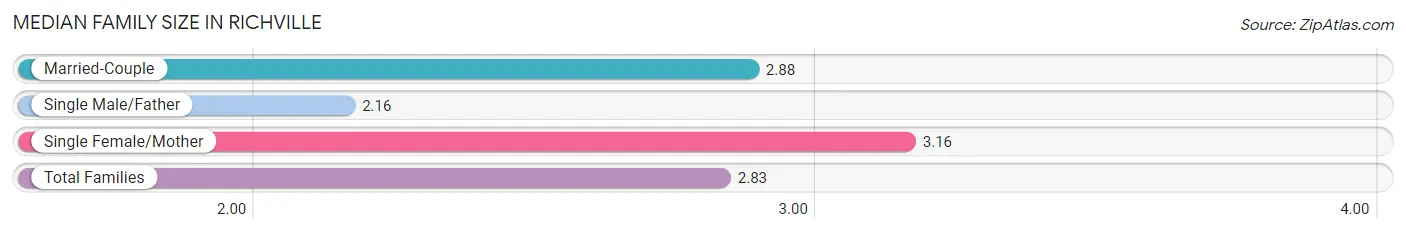
Median Family Size in Richville
The median family size in Richville is 2.83 persons per family, with single female/mother families (49 | 5.5%) accounting for the largest median family size of 3.16 persons per family. On the other hand, single male/father families (87 | 9.7%) represent the smallest median family size with 2.16 persons per family.
| Family Type | # Families | Family Size |
| Married-Couple | 758 (84.8%) | 2.88 |
| Single Male/Father | 87 (9.7%) | 2.16 |
| Single Female/Mother | 49 (5.5%) | 3.16 |
| Total Families | 894 (100.0%) | 2.83 |
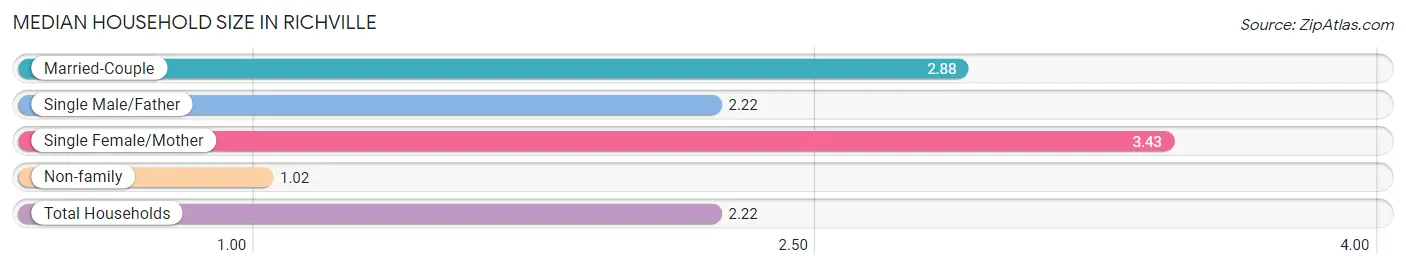
Median Household Size in Richville
The median household size in Richville is 2.22 persons per household, with single female/mother households (49 | 3.6%) accounting for the largest median household size of 3.43 persons per household. non-family households (462 | 34.1%) represent the smallest median household size with 1.02 persons per household.
| Household Type | # Households | Household Size |
| Married-Couple | 758 (55.9%) | 2.88 |
| Single Male/Father | 87 (6.4%) | 2.22 |
| Single Female/Mother | 49 (3.6%) | 3.43 |
| Non-family | 462 (34.1%) | 1.02 |
| Total Households | 1,356 (100.0%) | 2.22 |
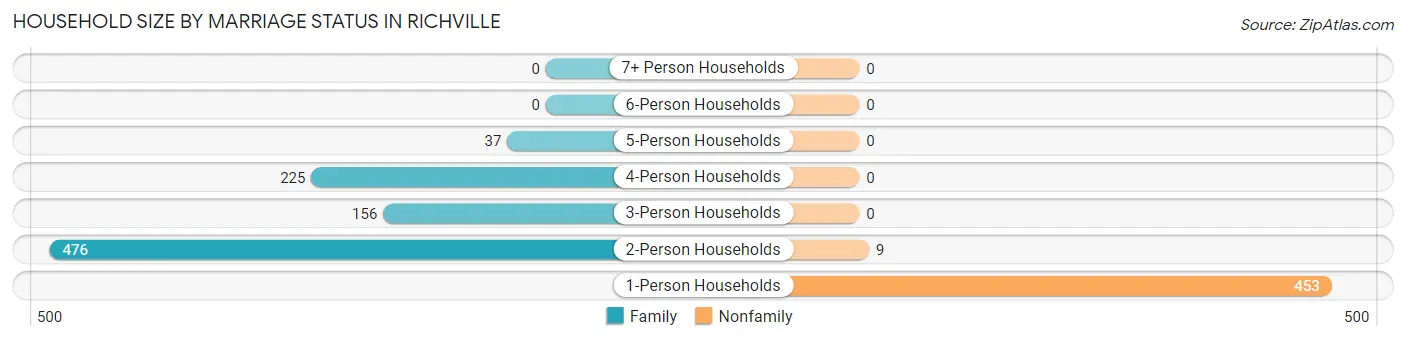
Household Size by Marriage Status in Richville
Out of a total of 1,356 households in Richville, 894 (65.9%) are family households, while 462 (34.1%) are nonfamily households. The most numerous type of family households are 2-person households, comprising 476, and the most common type of nonfamily households are 1-person households, comprising 453.
| Household Size | Family Households | Nonfamily Households |
| 1-Person Households | - | 453 (33.4%) |
| 2-Person Households | 476 (35.1%) | 9 (0.7%) |
| 3-Person Households | 156 (11.5%) | 0 (0.0%) |
| 4-Person Households | 225 (16.6%) | 0 (0.0%) |
| 5-Person Households | 37 (2.7%) | 0 (0.0%) |
| 6-Person Households | 0 (0.0%) | 0 (0.0%) |
| 7+ Person Households | 0 (0.0%) | 0 (0.0%) |
| Total | 894 (65.9%) | 462 (34.1%) |
Female Fertility in Richville
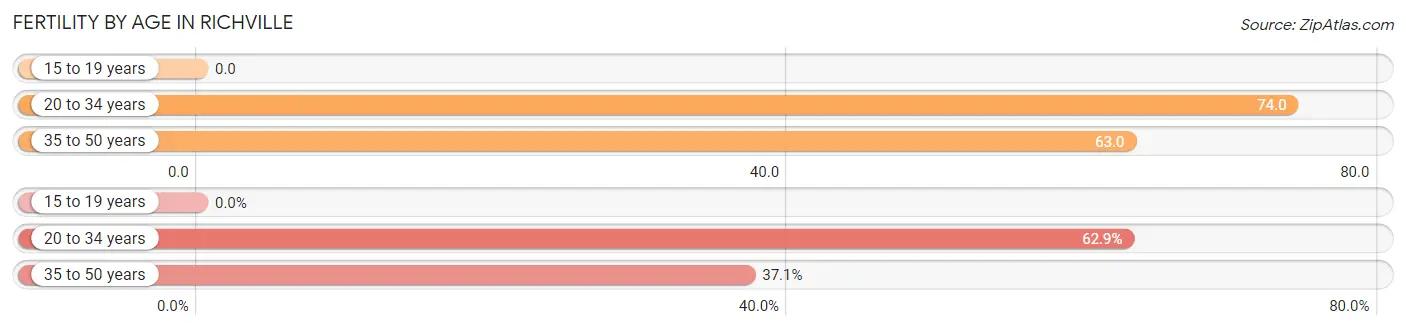
Fertility by Age in Richville
Average fertility rate in Richville is 60.0 births per 1,000 women. Women in the age bracket of 20 to 34 years have the highest fertility rate with 74.0 births per 1,000 women. Women in the age bracket of 20 to 34 years acount for 62.9% of all women with births.
| Age Bracket | Women with Births | Births / 1,000 Women |
| 15 to 19 years | 0 (0.0%) | 0.0 |
| 20 to 34 years | 22 (62.9%) | 74.0 |
| 35 to 50 years | 13 (37.1%) | 63.0 |
| Total | 35 (100.0%) | 60.0 |
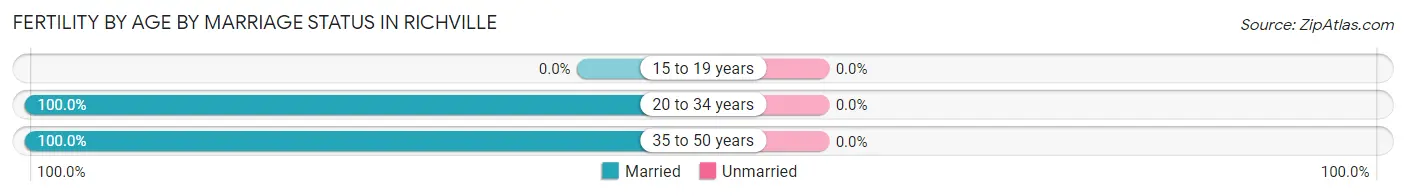
Fertility by Age by Marriage Status in Richville
| Age Bracket | Married | Unmarried |
| 15 to 19 years | 0 (0.0%) | 0 (0.0%) |
| 20 to 34 years | 22 (100.0%) | 0 (0.0%) |
| 35 to 50 years | 13 (100.0%) | 0 (0.0%) |
| Total | 35 (100.0%) | 0 (0.0%) |
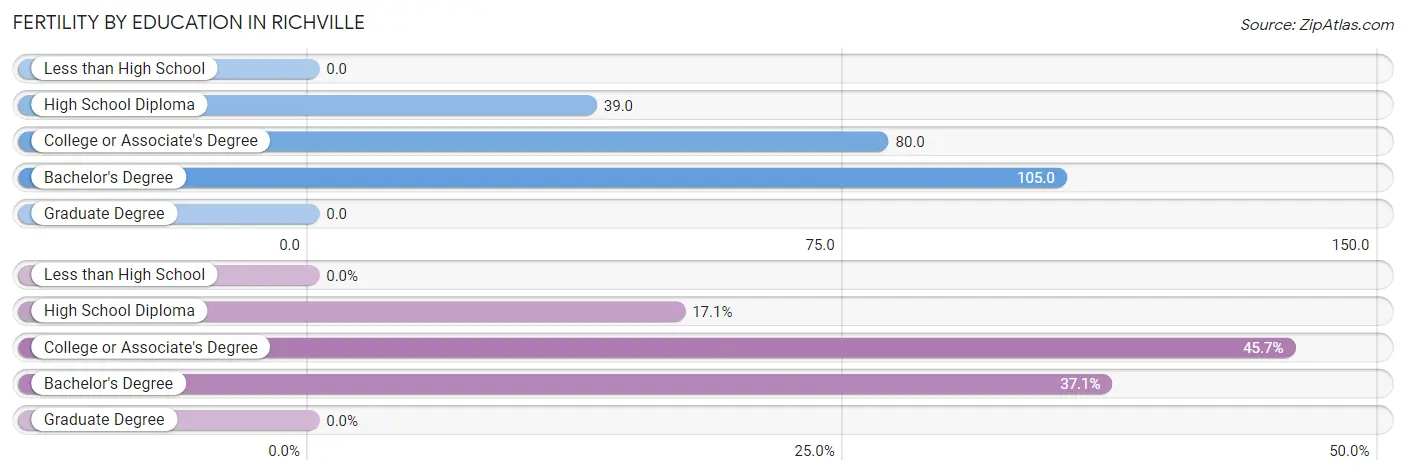
Fertility by Education in Richville
| Educational Attainment | Women with Births | Births / 1,000 Women |
| Less than High School | 0 (0.0%) | 0.0 |
| High School Diploma | 6 (17.1%) | 39.0 |
| College or Associate's Degree | 16 (45.7%) | 80.0 |
| Bachelor's Degree | 13 (37.1%) | 105.0 |
| Graduate Degree | 0 (0.0%) | 0.0 |
| Total | 35 (100.0%) | 60.0 |
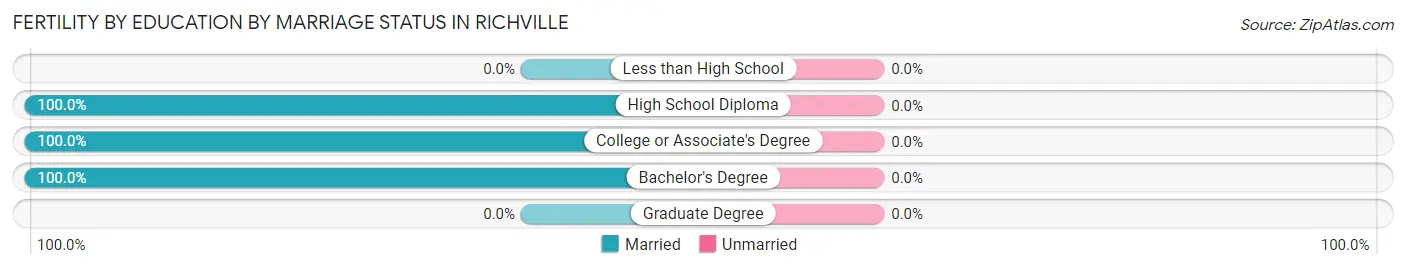
Fertility by Education by Marriage Status in Richville
| Educational Attainment | Married | Unmarried |
| Less than High School | 0 (0.0%) | 0 (0.0%) |
| High School Diploma | 6 (100.0%) | 0 (0.0%) |
| College or Associate's Degree | 16 (100.0%) | 0 (0.0%) |
| Bachelor's Degree | 13 (100.0%) | 0 (0.0%) |
| Graduate Degree | 0 (0.0%) | 0 (0.0%) |
| Total | 35 (100.0%) | 0 (0.0%) |
Income in Richville
Income Overview in Richville
Per Capita Income in Richville is $38,272, while median incomes of families and households are $96,974 and $75,074 respectively.
| Characteristic | Number | Measure |
| Per Capita Income | 3,023 | $38,272 |
| Median Family Income | 894 | $96,974 |
| Mean Family Income | 894 | $103,336 |
| Median Household Income | 1,356 | $75,074 |
| Mean Household Income | 1,356 | $84,737 |
| Income Deficit | 894 | $0 |
| Wage / Income Gap (%) | 3,023 | 48.84% |
| Wage / Income Gap ($) | 3,023 | 51.16¢ per $1 |
| Gini / Inequality Index | 3,023 | 0.36 |
Earnings by Sex in Richville
Average Earnings in Richville are $44,100, $55,788 for men and $28,542 for women, a difference of 48.8%.
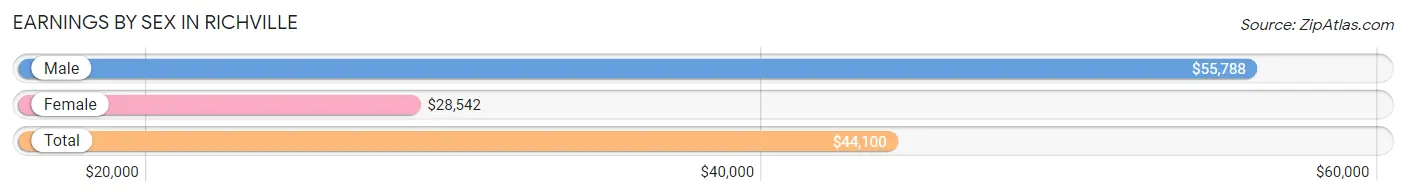
| Sex | Number | Average Earnings |
| Male | 971 (55.7%) | $55,788 |
| Female | 771 (44.3%) | $28,542 |
| Total | 1,742 (100.0%) | $44,100 |
Earnings by Sex by Income Bracket in Richville
The most common earnings brackets in Richville are $75,000 to $99,999 for men (163 | 16.8%) and $20,000 to $22,499 for women (118 | 15.3%).
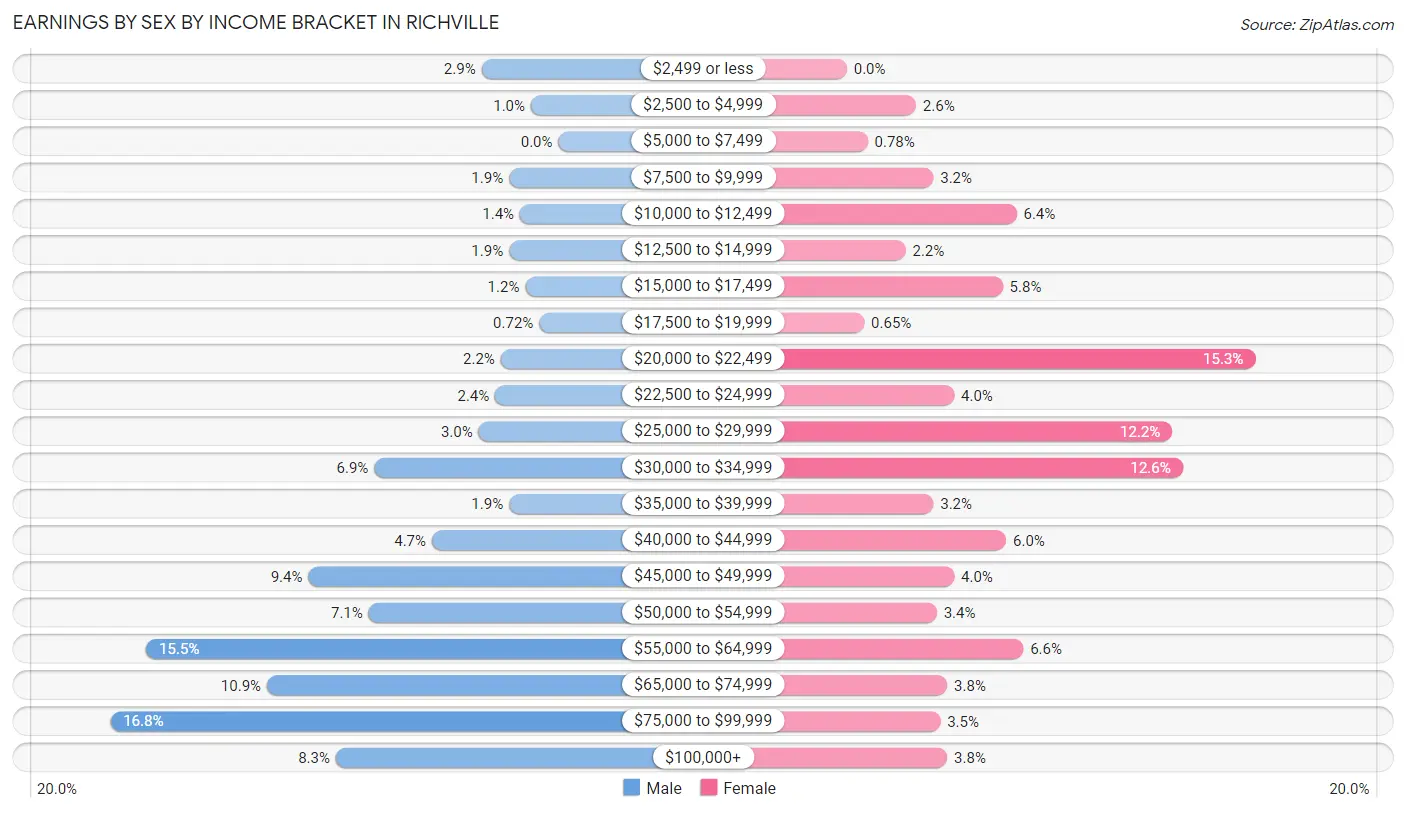
| Income | Male | Female |
| $2,499 or less | 28 (2.9%) | 0 (0.0%) |
| $2,500 to $4,999 | 10 (1.0%) | 20 (2.6%) |
| $5,000 to $7,499 | 0 (0.0%) | 6 (0.8%) |
| $7,500 to $9,999 | 18 (1.8%) | 25 (3.2%) |
| $10,000 to $12,499 | 14 (1.4%) | 49 (6.4%) |
| $12,500 to $14,999 | 18 (1.8%) | 17 (2.2%) |
| $15,000 to $17,499 | 12 (1.2%) | 45 (5.8%) |
| $17,500 to $19,999 | 7 (0.7%) | 5 (0.6%) |
| $20,000 to $22,499 | 21 (2.2%) | 118 (15.3%) |
| $22,500 to $24,999 | 23 (2.4%) | 31 (4.0%) |
| $25,000 to $29,999 | 29 (3.0%) | 94 (12.2%) |
| $30,000 to $34,999 | 67 (6.9%) | 97 (12.6%) |
| $35,000 to $39,999 | 18 (1.8%) | 25 (3.2%) |
| $40,000 to $44,999 | 46 (4.7%) | 46 (6.0%) |
| $45,000 to $49,999 | 91 (9.4%) | 31 (4.0%) |
| $50,000 to $54,999 | 69 (7.1%) | 26 (3.4%) |
| $55,000 to $64,999 | 150 (15.4%) | 51 (6.6%) |
| $65,000 to $74,999 | 106 (10.9%) | 29 (3.8%) |
| $75,000 to $99,999 | 163 (16.8%) | 27 (3.5%) |
| $100,000+ | 81 (8.3%) | 29 (3.8%) |
| Total | 971 (100.0%) | 771 (100.0%) |
Earnings by Sex by Educational Attainment in Richville
Average earnings in Richville are $58,475 for men and $34,508 for women, a difference of 41.0%. Men with an educational attainment of bachelor's degree enjoy the highest average annual earnings of $81,094, while those with college or associate's degree education earn the least with $57,000. Women with an educational attainment of graduate degree earn the most with the average annual earnings of $68,661, while those with less than high school education have the smallest earnings of $26,719.
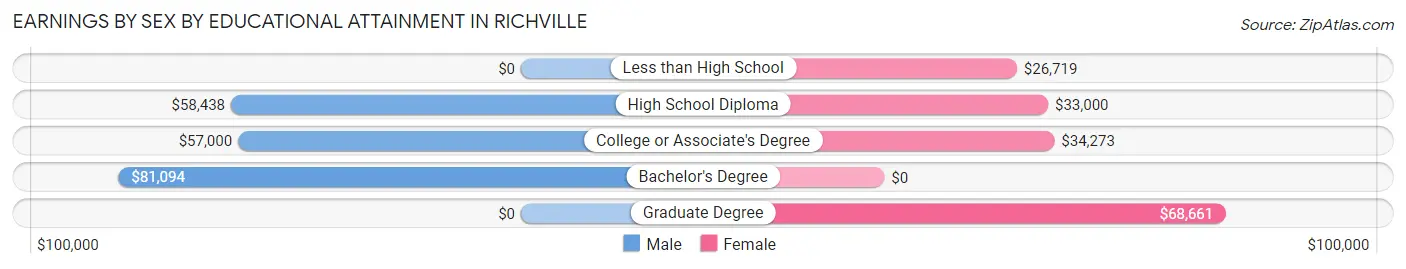
| Educational Attainment | Male Income | Female Income |
| Less than High School | - | - |
| High School Diploma | $58,438 | $33,000 |
| College or Associate's Degree | $57,000 | $34,273 |
| Bachelor's Degree | $81,094 | $0 |
| Graduate Degree | - | - |
| Total | $58,475 | $34,508 |
Family Income in Richville
Family Income Brackets in Richville
According to the Richville family income data, there are 301 families falling into the $100,000 to $149,999 income range, which is the most common income bracket and makes up 33.7% of all families.
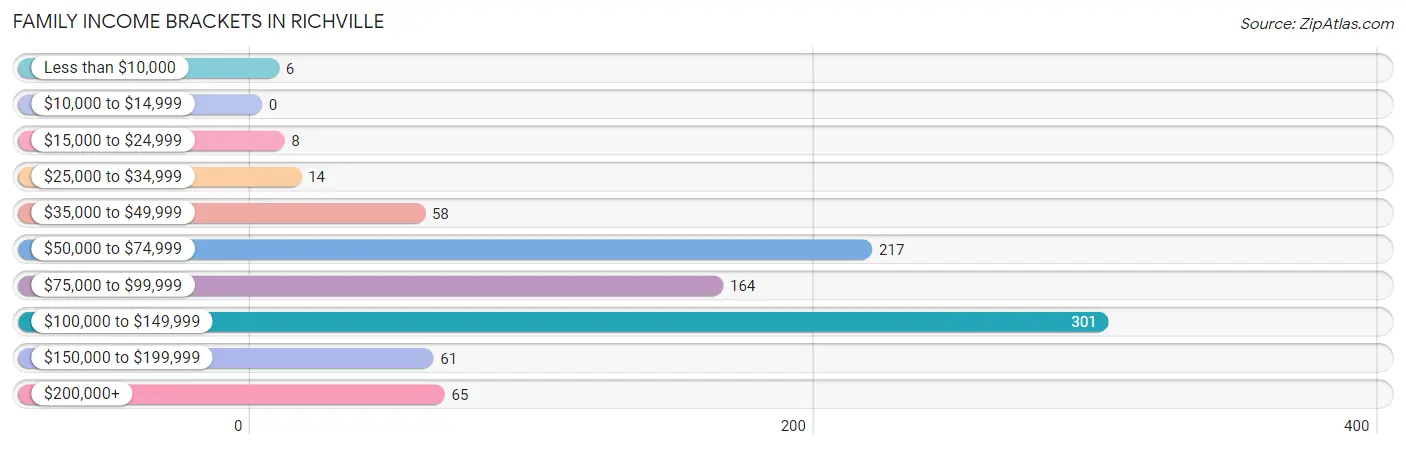
| Income Bracket | # Families | % Families |
| Less than $10,000 | 6 | 0.7% |
| $10,000 to $14,999 | 0 | 0.0% |
| $15,000 to $24,999 | 8 | 0.9% |
| $25,000 to $34,999 | 14 | 1.6% |
| $35,000 to $49,999 | 58 | 6.5% |
| $50,000 to $74,999 | 217 | 24.3% |
| $75,000 to $99,999 | 164 | 18.3% |
| $100,000 to $149,999 | 301 | 33.7% |
| $150,000 to $199,999 | 61 | 6.8% |
| $200,000+ | 65 | 7.3% |
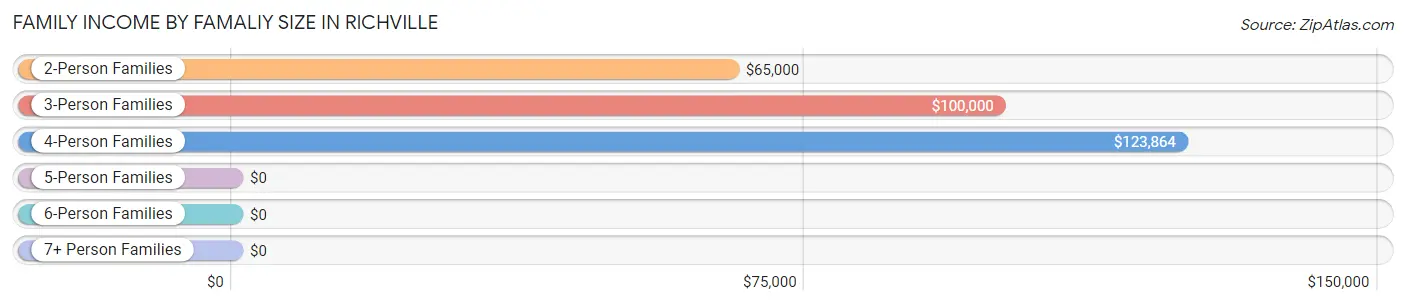
Family Income by Famaliy Size in Richville
4-person families (220 | 24.6%) account for the highest median family income in Richville with $123,864 per family, while 3-person families (168 | 18.8%) have the highest median income of $33,333 per family member.
| Income Bracket | # Families | Median Income |
| 2-Person Families | 476 (53.2%) | $65,000 |
| 3-Person Families | 168 (18.8%) | $100,000 |
| 4-Person Families | 220 (24.6%) | $123,864 |
| 5-Person Families | 30 (3.4%) | $0 |
| 6-Person Families | 0 (0.0%) | $0 |
| 7+ Person Families | 0 (0.0%) | $0 |
| Total | 894 (100.0%) | $96,974 |
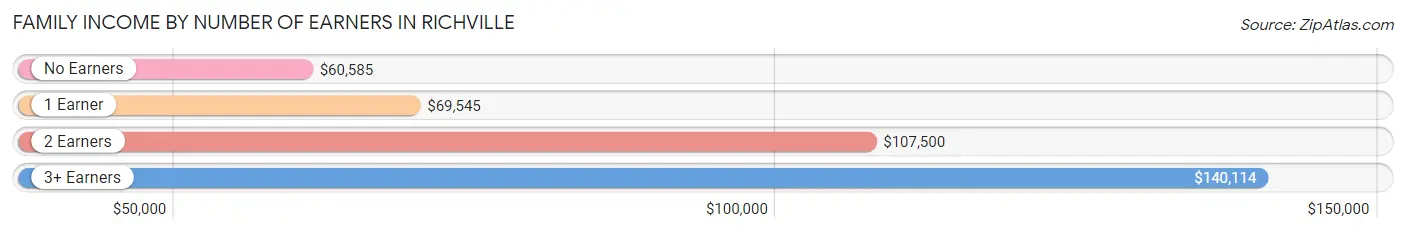
Family Income by Number of Earners in Richville
The median family income in Richville is $96,974, with families comprising 3+ earners (165) having the highest median family income of $140,114, while families with no earners (189) have the lowest median family income of $60,585, accounting for 18.5% and 21.1% of families, respectively.
| Number of Earners | # Families | Median Income |
| No Earners | 189 (21.1%) | $60,585 |
| 1 Earner | 260 (29.1%) | $69,545 |
| 2 Earners | 280 (31.3%) | $107,500 |
| 3+ Earners | 165 (18.5%) | $140,114 |
| Total | 894 (100.0%) | $96,974 |
Household Income in Richville
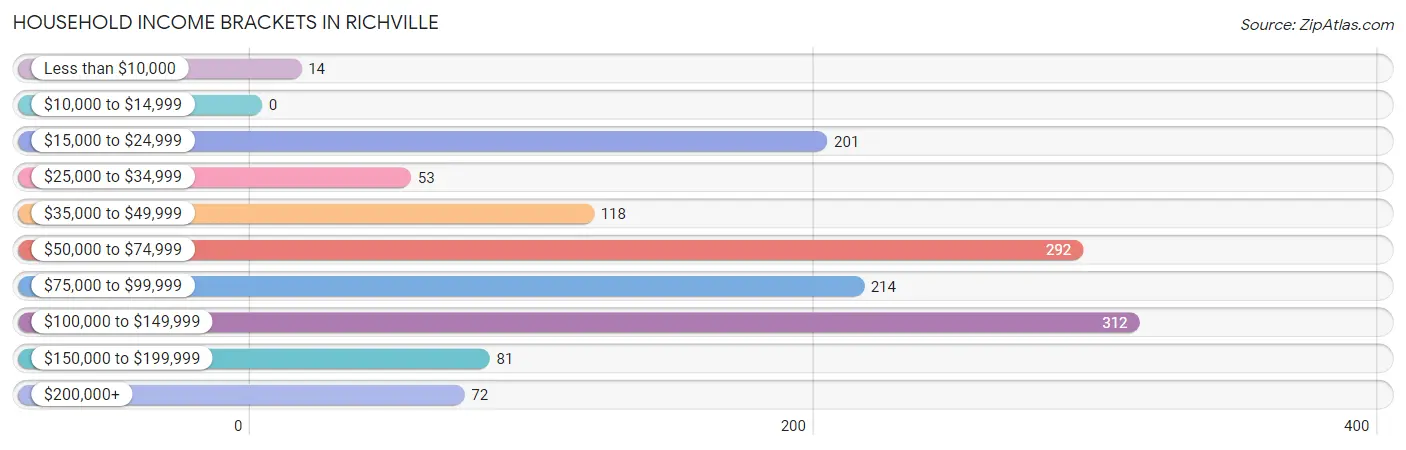
Household Income Brackets in Richville
With 312 households falling in the category, the $100,000 to $149,999 income range is the most frequent in Richville, accounting for 23.0% of all households.
| Income Bracket | # Households | % Households |
| Less than $10,000 | 14 | 1.0% |
| $10,000 to $14,999 | 0 | 0.0% |
| $15,000 to $24,999 | 201 | 14.8% |
| $25,000 to $34,999 | 53 | 3.9% |
| $35,000 to $49,999 | 118 | 8.7% |
| $50,000 to $74,999 | 292 | 21.5% |
| $75,000 to $99,999 | 214 | 15.8% |
| $100,000 to $149,999 | 312 | 23.0% |
| $150,000 to $199,999 | 81 | 6.0% |
| $200,000+ | 72 | 5.3% |
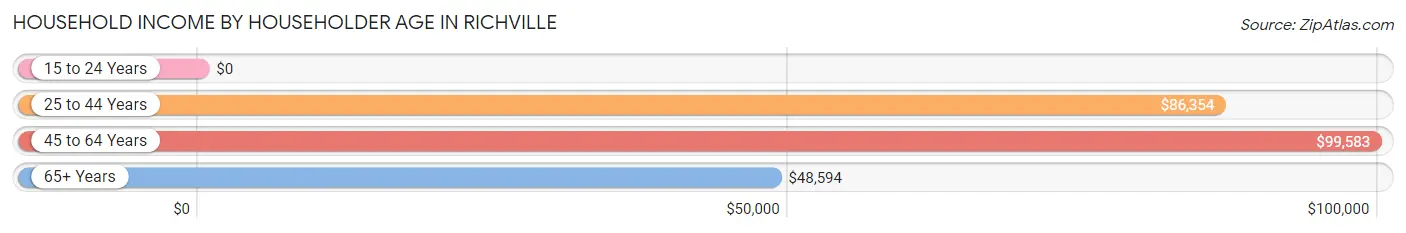
Household Income by Householder Age in Richville
The median household income in Richville is $75,074, with the highest median household income of $99,583 found in the 45 to 64 years age bracket for the primary householder. A total of 466 households (34.4%) fall into this category. Meanwhile, the 15 to 24 years age bracket for the primary householder has the lowest median household income of $0, with 44 households (3.2%) in this group.
| Income Bracket | # Households | Median Income |
| 15 to 24 Years | 44 (3.2%) | $0 |
| 25 to 44 Years | 282 (20.8%) | $86,354 |
| 45 to 64 Years | 466 (34.4%) | $99,583 |
| 65+ Years | 564 (41.6%) | $48,594 |
| Total | 1,356 (100.0%) | $75,074 |
Poverty in Richville
Income Below Poverty by Sex and Age in Richville
With 0.8% poverty level for males and 2.4% for females among the residents of Richville, 12 to 14 year old males and 6 to 11 year old females are the most vulnerable to poverty, with 6 males (9.4%) and 16 females (22.5%) in their respective age groups living below the poverty level.
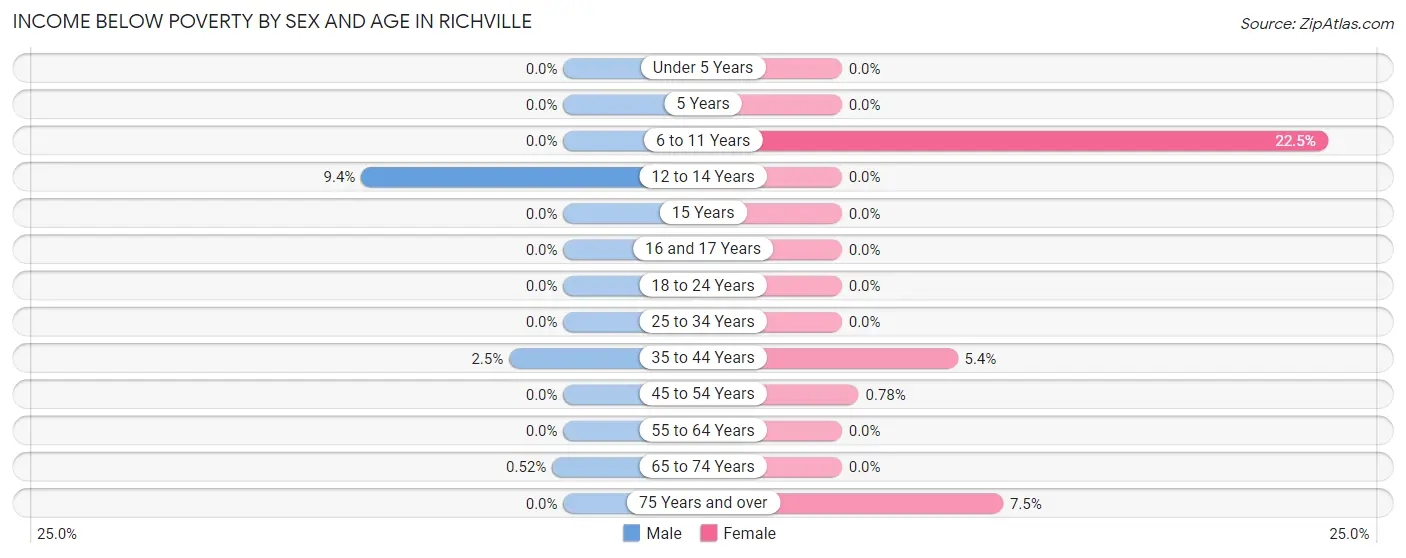
| Age Bracket | Male | Female |
| Under 5 Years | 0 (0.0%) | 0 (0.0%) |
| 5 Years | 0 (0.0%) | 0 (0.0%) |
| 6 to 11 Years | 0 (0.0%) | 16 (22.5%) |
| 12 to 14 Years | 6 (9.4%) | 0 (0.0%) |
| 15 Years | 0 (0.0%) | 0 (0.0%) |
| 16 and 17 Years | 0 (0.0%) | 0 (0.0%) |
| 18 to 24 Years | 0 (0.0%) | 0 (0.0%) |
| 25 to 34 Years | 0 (0.0%) | 0 (0.0%) |
| 35 to 44 Years | 6 (2.5%) | 8 (5.4%) |
| 45 to 54 Years | 0 (0.0%) | 1 (0.8%) |
| 55 to 64 Years | 0 (0.0%) | 0 (0.0%) |
| 65 to 74 Years | 1 (0.5%) | 0 (0.0%) |
| 75 Years and over | 0 (0.0%) | 8 (7.5%) |
| Total | 13 (0.8%) | 33 (2.4%) |
Income Above Poverty by Sex and Age in Richville
According to the poverty statistics in Richville, males aged under 5 years and females aged under 5 years are the age groups that are most secure financially, with 100.0% of males and 100.0% of females in these age groups living above the poverty line.
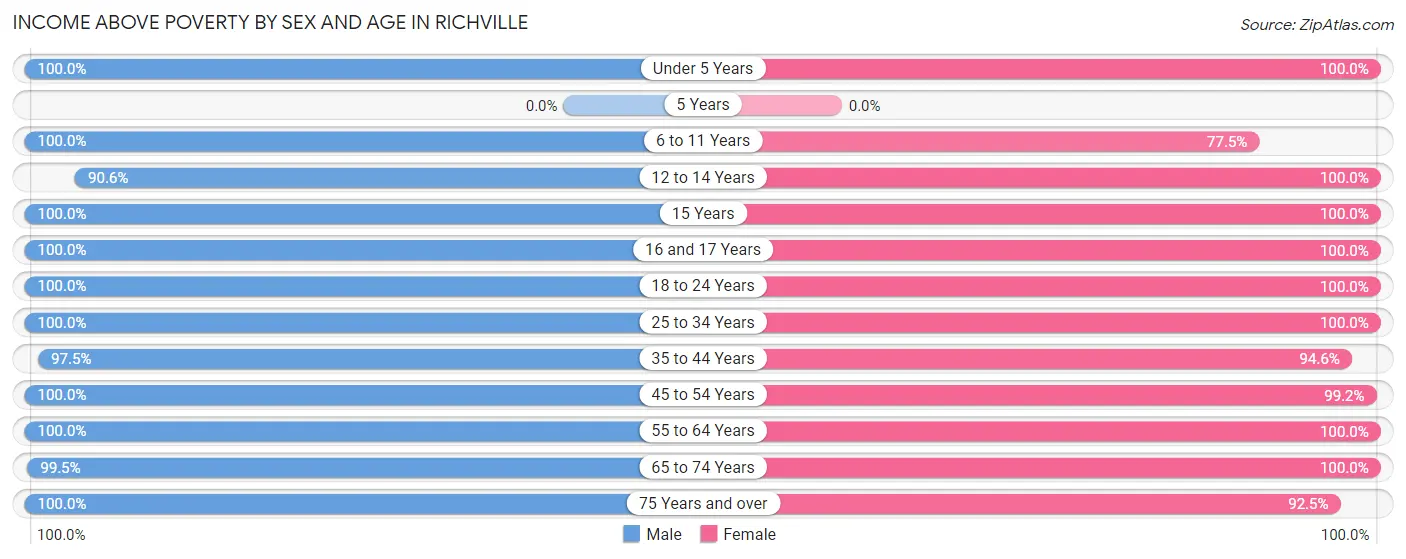
| Age Bracket | Male | Female |
| Under 5 Years | 42 (100.0%) | 44 (100.0%) |
| 5 Years | 0 (0.0%) | 0 (0.0%) |
| 6 to 11 Years | 53 (100.0%) | 55 (77.5%) |
| 12 to 14 Years | 58 (90.6%) | 42 (100.0%) |
| 15 Years | 27 (100.0%) | 13 (100.0%) |
| 16 and 17 Years | 27 (100.0%) | 21 (100.0%) |
| 18 to 24 Years | 109 (100.0%) | 253 (100.0%) |
| 25 to 34 Years | 182 (100.0%) | 91 (100.0%) |
| 35 to 44 Years | 232 (97.5%) | 141 (94.6%) |
| 45 to 54 Years | 149 (100.0%) | 127 (99.2%) |
| 55 to 64 Years | 321 (100.0%) | 182 (100.0%) |
| 65 to 74 Years | 191 (99.5%) | 257 (100.0%) |
| 75 Years and over | 261 (100.0%) | 99 (92.5%) |
| Total | 1,652 (99.2%) | 1,325 (97.6%) |
Income Below Poverty Among Married-Couple Families in Richville
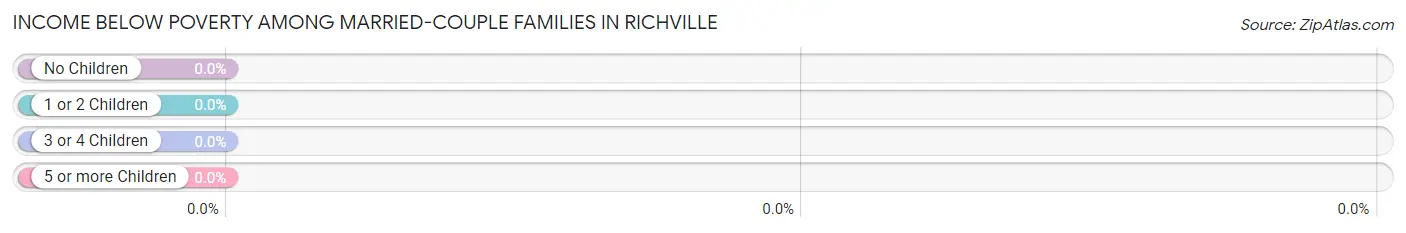
| Children | Above Poverty | Below Poverty |
| No Children | 562 (100.0%) | 0 (0.0%) |
| 1 or 2 Children | 196 (100.0%) | 0 (0.0%) |
| 3 or 4 Children | 0 (0.0%) | 0 (0.0%) |
| 5 or more Children | 0 (0.0%) | 0 (0.0%) |
| Total | 758 (100.0%) | 0 (0.0%) |
Income Below Poverty Among Single-Parent Households in Richville
According to the poverty data in Richville, 6.9% or 6 single-father households and 16.3% or 8 single-mother households are living below the poverty line. Among single-father households, those with 1 or 2 children have the highest poverty rate, with 6 households (30.0%) experiencing poverty. Likewise, among single-mother households, those with 1 or 2 children have the highest poverty rate, with 8 households (30.8%) falling below the poverty line.
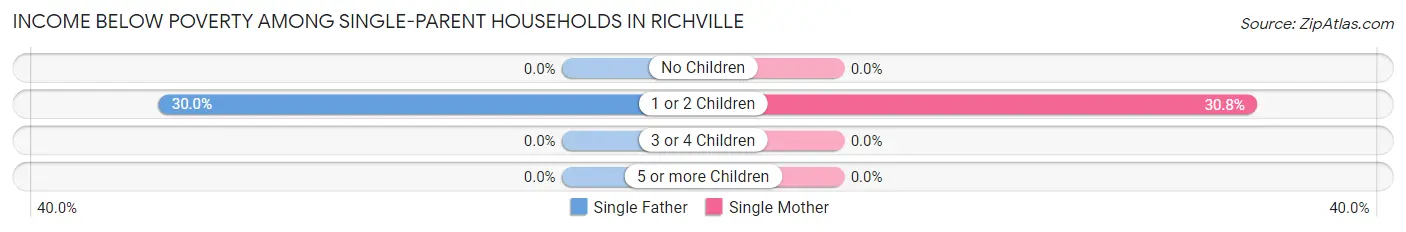
| Children | Single Father | Single Mother |
| No Children | 0 (0.0%) | 0 (0.0%) |
| 1 or 2 Children | 6 (30.0%) | 8 (30.8%) |
| 3 or 4 Children | 0 (0.0%) | 0 (0.0%) |
| 5 or more Children | 0 (0.0%) | 0 (0.0%) |
| Total | 6 (6.9%) | 8 (16.3%) |
Income Below Poverty Among Married-Couple vs Single-Parent Households in Richville
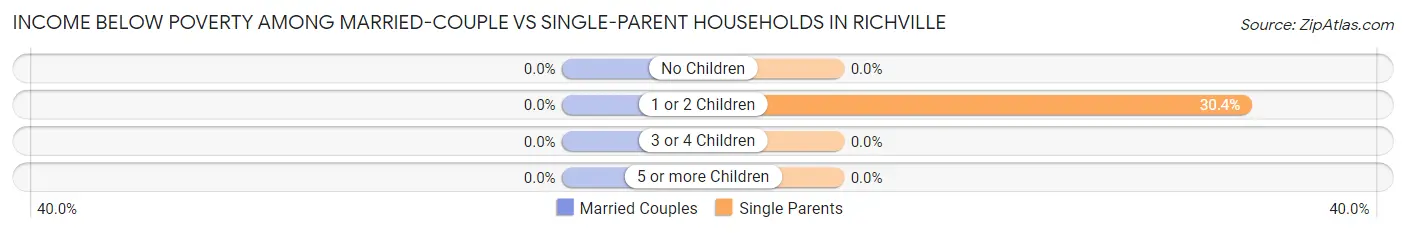
| Children | Married-Couple Families | Single-Parent Households |
| No Children | 0 (0.0%) | 0 (0.0%) |
| 1 or 2 Children | 0 (0.0%) | 14 (30.4%) |
| 3 or 4 Children | 0 (0.0%) | 0 (0.0%) |
| 5 or more Children | 0 (0.0%) | 0 (0.0%) |
| Total | 0 (0.0%) | 14 (10.3%) |
Employment Characteristics in Richville
Employment by Class of Employer in Richville
Among the 1,612 employed individuals in Richville, private company employees (1,209 | 75.0%), not-for-profit organizations (159 | 9.9%), and local government employees (131 | 8.1%) make up the most common classes of employment.
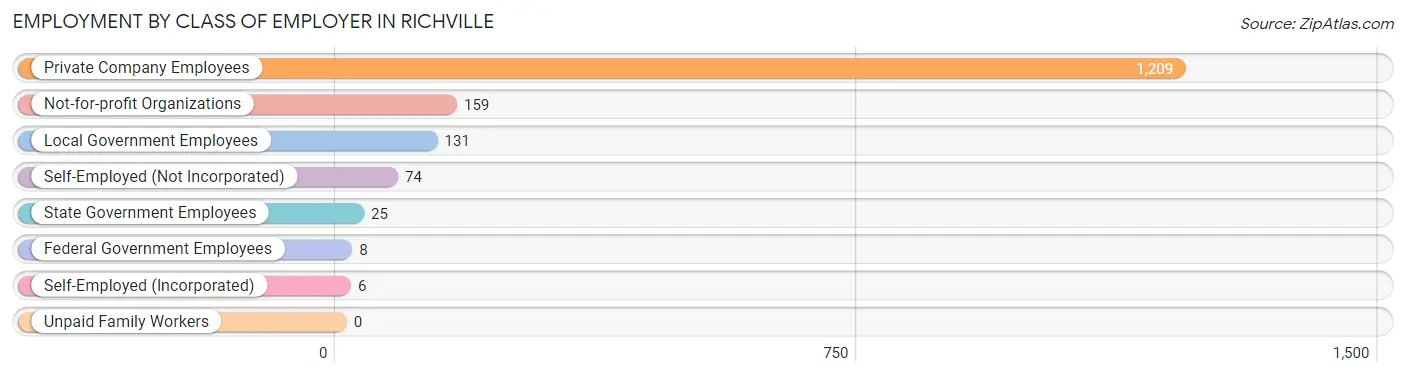
| Employer Class | # Employees | % Employees |
| Private Company Employees | 1,209 | 75.0% |
| Self-Employed (Incorporated) | 6 | 0.4% |
| Self-Employed (Not Incorporated) | 74 | 4.6% |
| Not-for-profit Organizations | 159 | 9.9% |
| Local Government Employees | 131 | 8.1% |
| State Government Employees | 25 | 1.5% |
| Federal Government Employees | 8 | 0.5% |
| Unpaid Family Workers | 0 | 0.0% |
| Total | 1,612 | 100.0% |
Employment Status by Age in Richville
According to the labor force statistics for Richville, out of the total population over 16 years of age (2,667), 62.4% or 1,664 individuals are in the labor force, with 2.7% or 45 of them unemployed. The age group with the highest labor force participation rate is 30 to 34 years, with 96.2% or 152 individuals in the labor force. Within the labor force, the 16 to 19 years age range has the highest percentage of unemployed individuals, with 8.1% or 9 of them being unemployed.
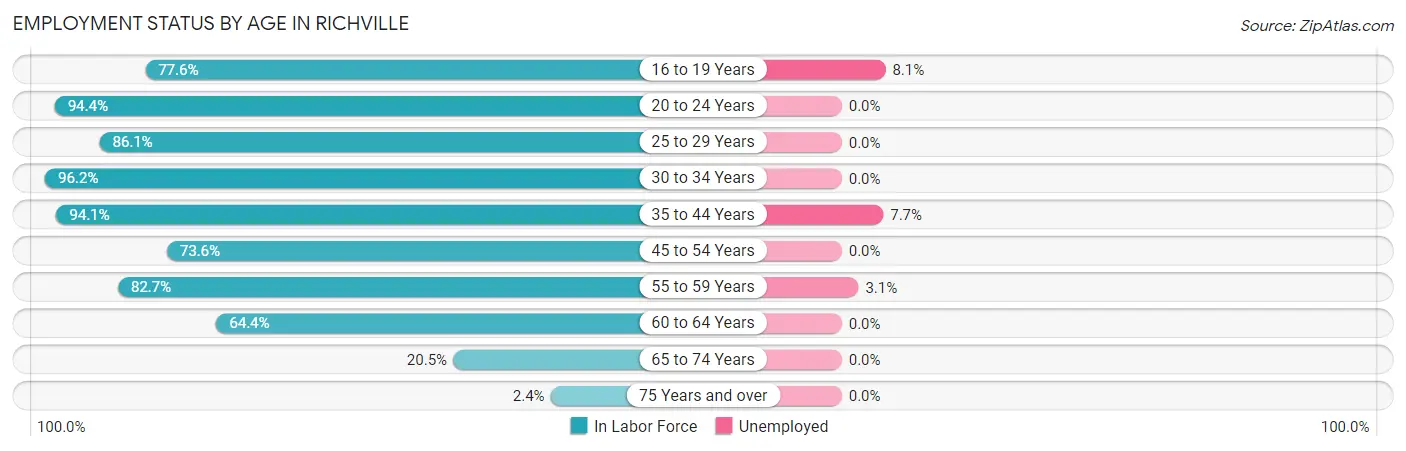
| Age Bracket | In Labor Force | Unemployed |
| 16 to 19 Years | 111 (77.6%) | 9 (8.1%) |
| 20 to 24 Years | 252 (94.4%) | 0 (0.0%) |
| 25 to 29 Years | 99 (86.1%) | 0 (0.0%) |
| 30 to 34 Years | 152 (96.2%) | 0 (0.0%) |
| 35 to 44 Years | 364 (94.1%) | 28 (7.7%) |
| 45 to 54 Years | 204 (73.6%) | 0 (0.0%) |
| 55 to 59 Years | 258 (82.7%) | 8 (3.1%) |
| 60 to 64 Years | 123 (64.4%) | 0 (0.0%) |
| 65 to 74 Years | 92 (20.5%) | 0 (0.0%) |
| 75 Years and over | 9 (2.4%) | 0 (0.0%) |
| Total | 1,664 (62.4%) | 45 (2.7%) |
Employment Status by Educational Attainment in Richville
According to labor force statistics for Richville, 83.3% of individuals (1,200) out of the total population between 25 and 64 years of age (1,440) are in the labor force, with 3.0% or 36 of them being unemployed. The group with the highest labor force participation rate are those with the educational attainment of bachelor's degree or higher, with 100.0% or 192 individuals in the labor force. Within the labor force, individuals with high school diploma education have the highest percentage of unemployment, with 8.2% or 36 of them being unemployed.
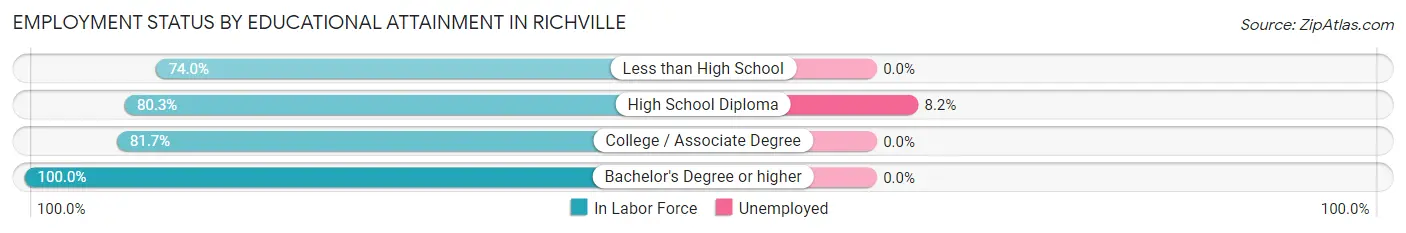
| Educational Attainment | In Labor Force | Unemployed |
| Less than High School | 37 (74.0%) | 0 (0.0%) |
| High School Diploma | 439 (80.3%) | 45 (8.2%) |
| College / Associate Degree | 532 (81.7%) | 0 (0.0%) |
| Bachelor's Degree or higher | 192 (100.0%) | 0 (0.0%) |
| Total | 1,200 (83.3%) | 43 (3.0%) |
Employment Occupations by Sex in Richville
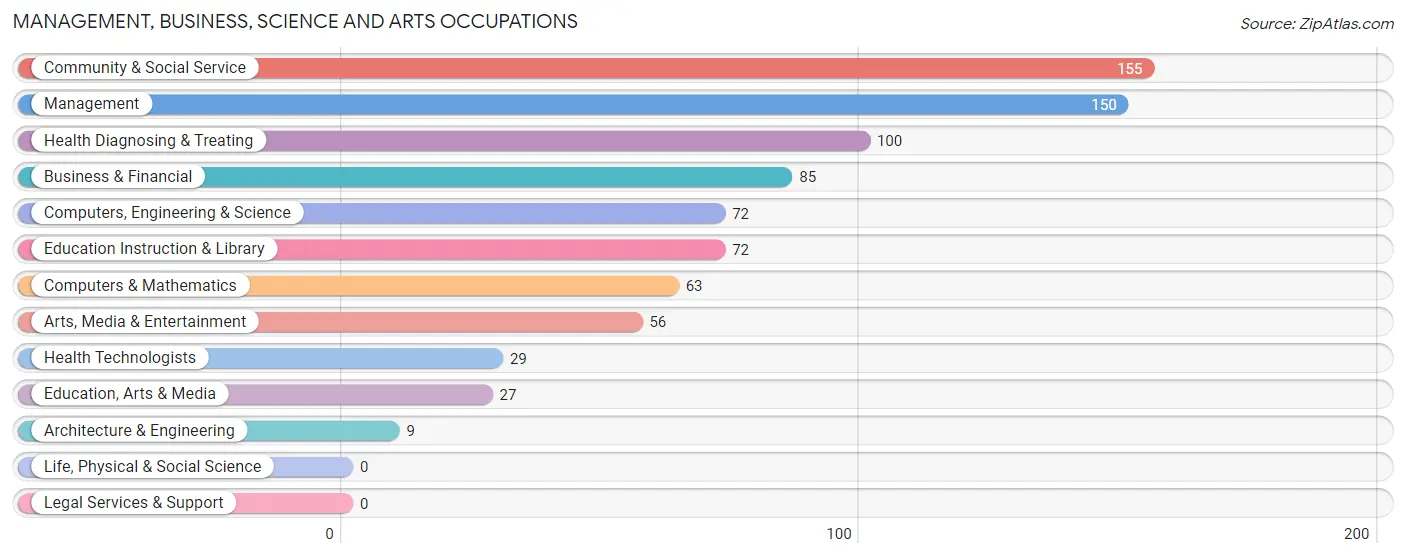
Management, Business, Science and Arts Occupations
The most common Management, Business, Science and Arts occupations in Richville are Community & Social Service (155 | 9.6%), Management (150 | 9.3%), Health Diagnosing & Treating (100 | 6.2%), Business & Financial (85 | 5.2%), and Computers, Engineering & Science (72 | 4.4%).
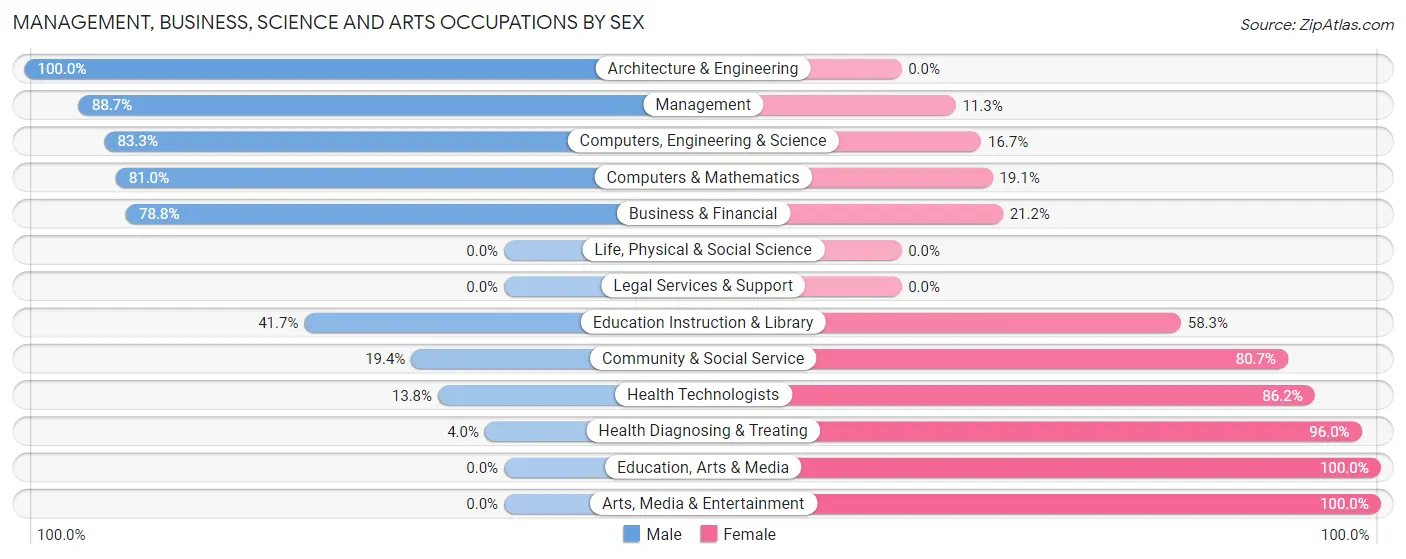
Management, Business, Science and Arts Occupations by Sex
Within the Management, Business, Science and Arts occupations in Richville, the most male-oriented occupations are Architecture & Engineering (100.0%), Management (88.7%), and Computers, Engineering & Science (83.3%), while the most female-oriented occupations are Education, Arts & Media (100.0%), Arts, Media & Entertainment (100.0%), and Health Diagnosing & Treating (96.0%).
| Occupation | Male | Female |
| Management | 133 (88.7%) | 17 (11.3%) |
| Business & Financial | 67 (78.8%) | 18 (21.2%) |
| Computers, Engineering & Science | 60 (83.3%) | 12 (16.7%) |
| Computers & Mathematics | 51 (80.9%) | 12 (19.1%) |
| Architecture & Engineering | 9 (100.0%) | 0 (0.0%) |
| Life, Physical & Social Science | 0 (0.0%) | 0 (0.0%) |
| Community & Social Service | 30 (19.4%) | 125 (80.6%) |
| Education, Arts & Media | 0 (0.0%) | 27 (100.0%) |
| Legal Services & Support | 0 (0.0%) | 0 (0.0%) |
| Education Instruction & Library | 30 (41.7%) | 42 (58.3%) |
| Arts, Media & Entertainment | 0 (0.0%) | 56 (100.0%) |
| Health Diagnosing & Treating | 4 (4.0%) | 96 (96.0%) |
| Health Technologists | 4 (13.8%) | 25 (86.2%) |
| Total (Category) | 294 (52.3%) | 268 (47.7%) |
| Total (Overall) | 860 (53.1%) | 759 (46.9%) |
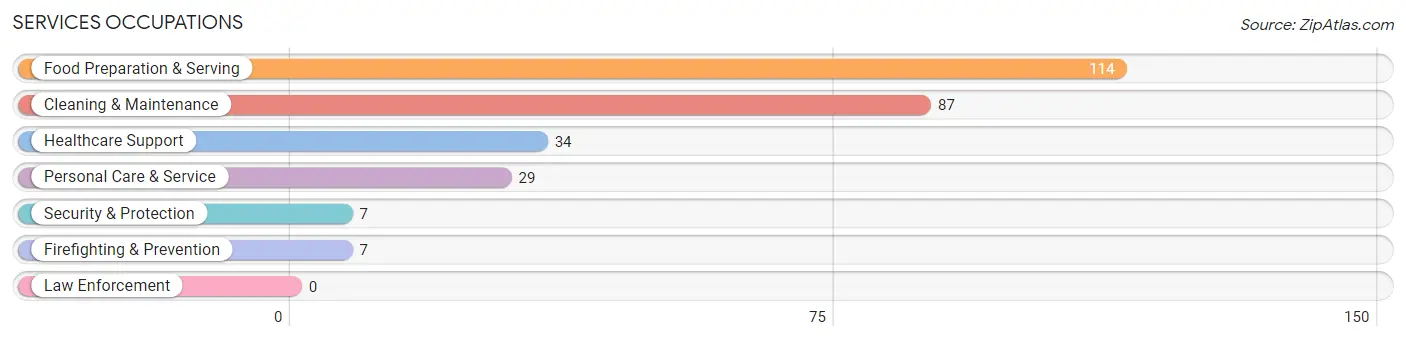
Services Occupations
The most common Services occupations in Richville are Food Preparation & Serving (114 | 7.0%), Cleaning & Maintenance (87 | 5.4%), Healthcare Support (34 | 2.1%), Personal Care & Service (29 | 1.8%), and Security & Protection (7 | 0.4%).
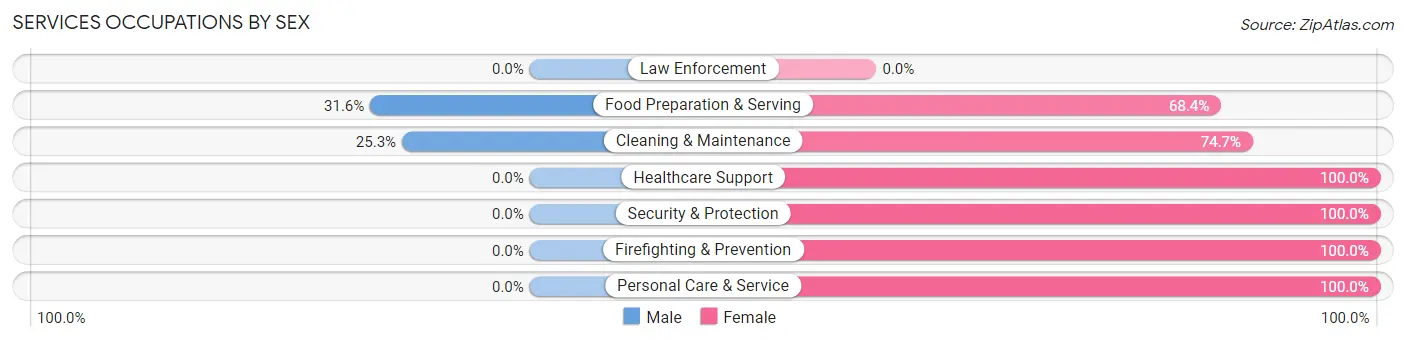
Services Occupations by Sex
Within the Services occupations in Richville, the most male-oriented occupations are Food Preparation & Serving (31.6%), and Cleaning & Maintenance (25.3%), while the most female-oriented occupations are Healthcare Support (100.0%), Security & Protection (100.0%), and Firefighting & Prevention (100.0%).
| Occupation | Male | Female |
| Healthcare Support | 0 (0.0%) | 34 (100.0%) |
| Security & Protection | 0 (0.0%) | 7 (100.0%) |
| Firefighting & Prevention | 0 (0.0%) | 7 (100.0%) |
| Law Enforcement | 0 (0.0%) | 0 (0.0%) |
| Food Preparation & Serving | 36 (31.6%) | 78 (68.4%) |
| Cleaning & Maintenance | 22 (25.3%) | 65 (74.7%) |
| Personal Care & Service | 0 (0.0%) | 29 (100.0%) |
| Total (Category) | 58 (21.4%) | 213 (78.6%) |
| Total (Overall) | 860 (53.1%) | 759 (46.9%) |
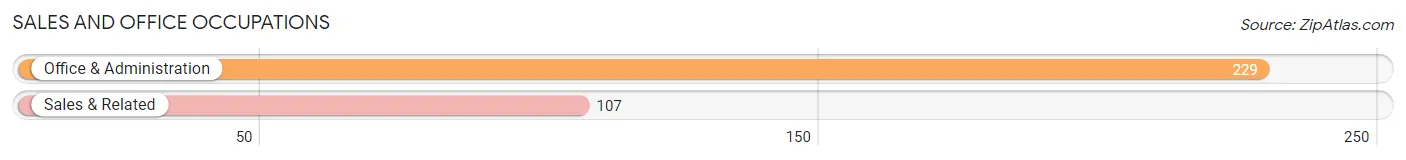
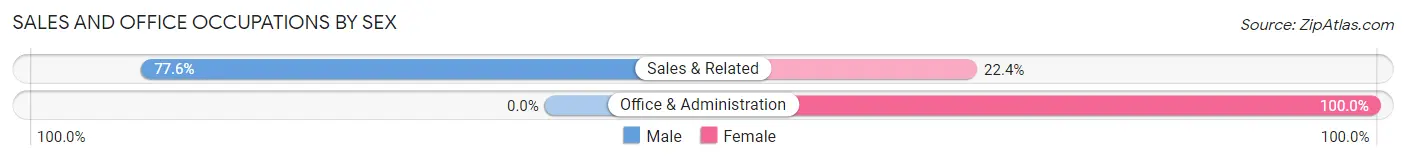
Sales and Office Occupations
The most common Sales and Office occupations in Richville are Office & Administration (229 | 14.1%), and Sales & Related (107 | 6.6%).
Sales and Office Occupations by Sex
| Occupation | Male | Female |
| Sales & Related | 83 (77.6%) | 24 (22.4%) |
| Office & Administration | 0 (0.0%) | 229 (100.0%) |
| Total (Category) | 83 (24.7%) | 253 (75.3%) |
| Total (Overall) | 860 (53.1%) | 759 (46.9%) |
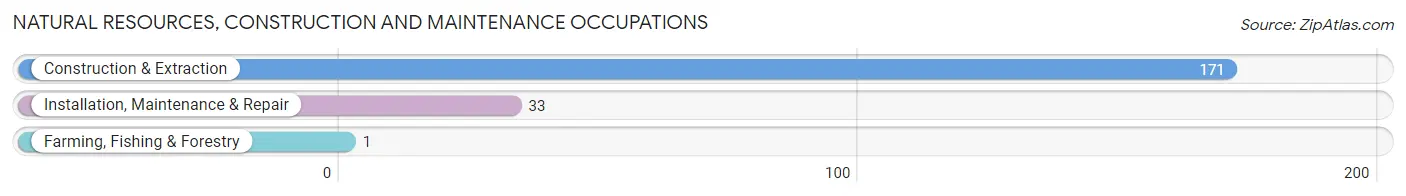
Natural Resources, Construction and Maintenance Occupations
The most common Natural Resources, Construction and Maintenance occupations in Richville are Construction & Extraction (171 | 10.6%), Installation, Maintenance & Repair (33 | 2.0%), and Farming, Fishing & Forestry (1 | 0.1%).
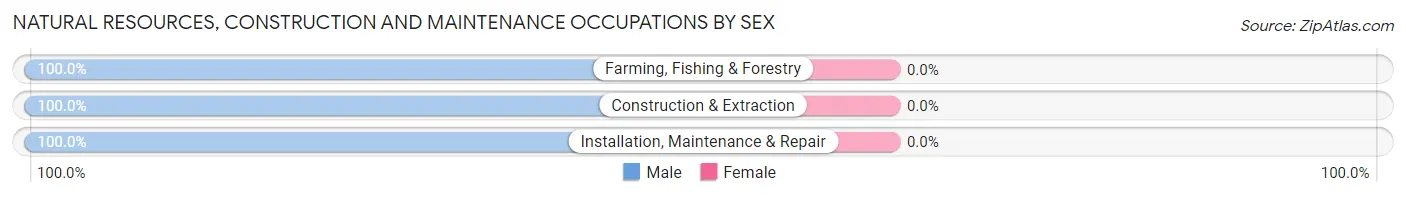
Natural Resources, Construction and Maintenance Occupations by Sex
| Occupation | Male | Female |
| Farming, Fishing & Forestry | 1 (100.0%) | 0 (0.0%) |
| Construction & Extraction | 171 (100.0%) | 0 (0.0%) |
| Installation, Maintenance & Repair | 33 (100.0%) | 0 (0.0%) |
| Total (Category) | 205 (100.0%) | 0 (0.0%) |
| Total (Overall) | 860 (53.1%) | 759 (46.9%) |
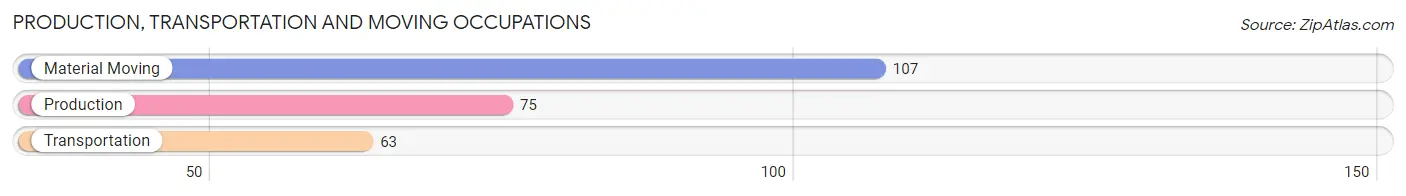
Production, Transportation and Moving Occupations
The most common Production, Transportation and Moving occupations in Richville are Material Moving (107 | 6.6%), Production (75 | 4.6%), and Transportation (63 | 3.9%).
Production, Transportation and Moving Occupations by Sex
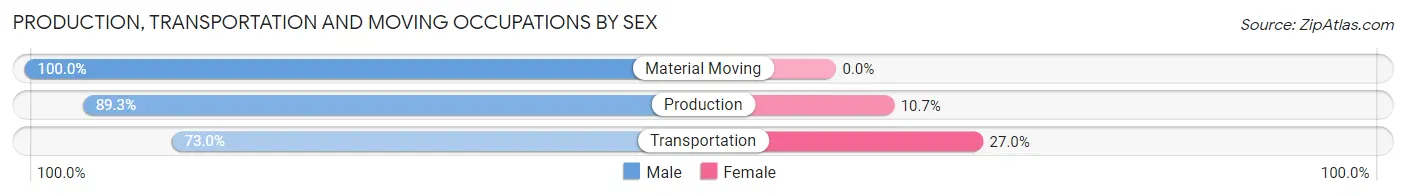
| Occupation | Male | Female |
| Production | 67 (89.3%) | 8 (10.7%) |
| Transportation | 46 (73.0%) | 17 (27.0%) |
| Material Moving | 107 (100.0%) | 0 (0.0%) |
| Total (Category) | 220 (89.8%) | 25 (10.2%) |
| Total (Overall) | 860 (53.1%) | 759 (46.9%) |
Employment Industries by Sex in Richville
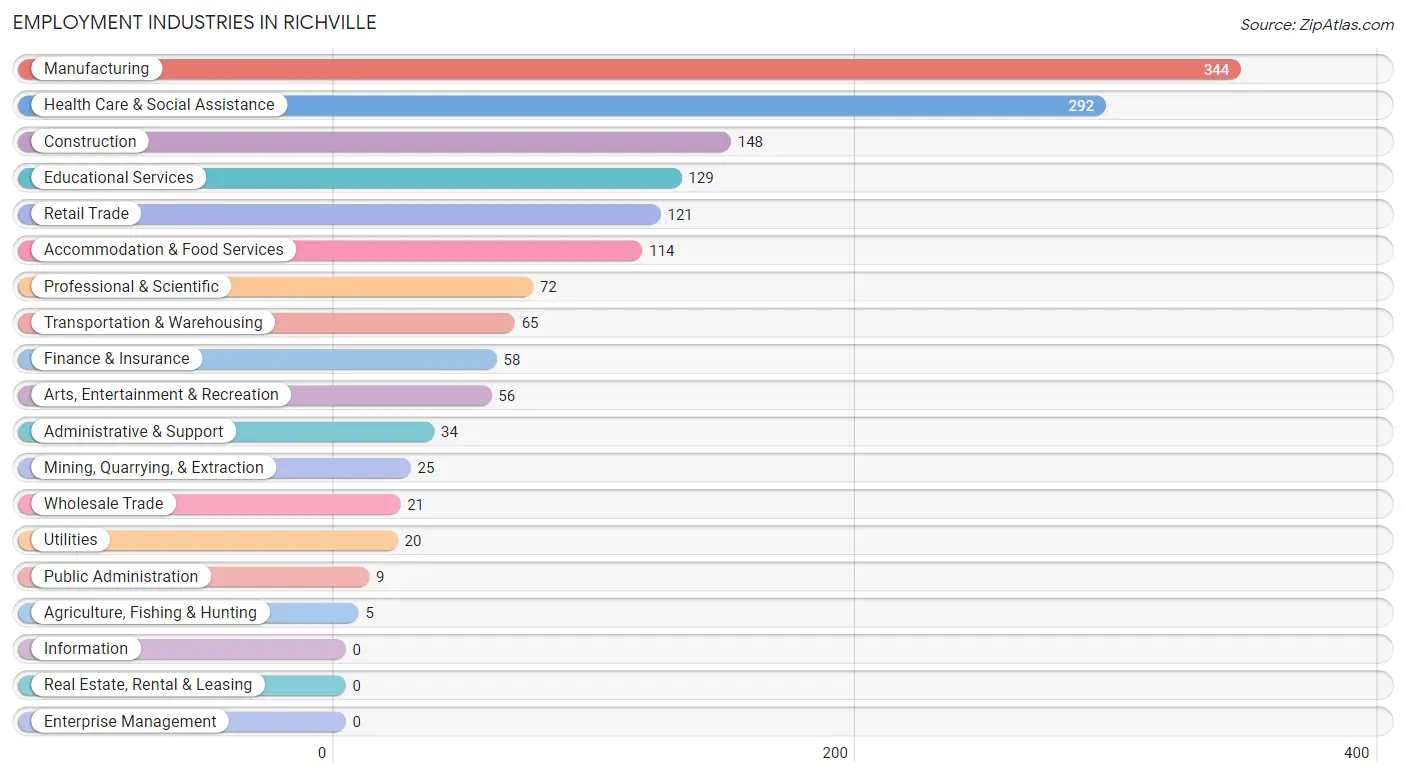
Employment Industries in Richville
The major employment industries in Richville include Manufacturing (344 | 21.2%), Health Care & Social Assistance (292 | 18.0%), Construction (148 | 9.1%), Educational Services (129 | 8.0%), and Retail Trade (121 | 7.5%).
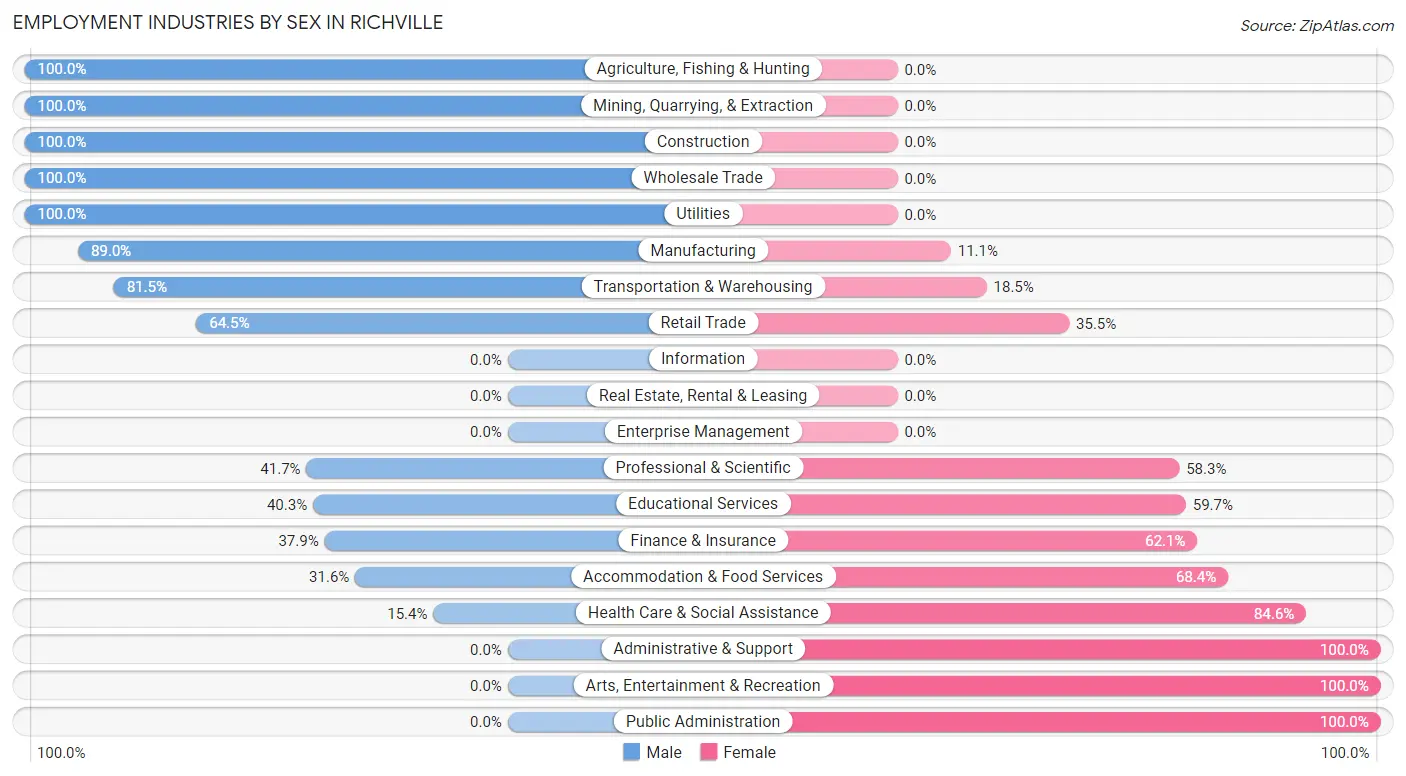
Employment Industries by Sex in Richville
The Richville industries that see more men than women are Agriculture, Fishing & Hunting (100.0%), Mining, Quarrying, & Extraction (100.0%), and Construction (100.0%), whereas the industries that tend to have a higher number of women are Administrative & Support (100.0%), Arts, Entertainment & Recreation (100.0%), and Public Administration (100.0%).
| Industry | Male | Female |
| Agriculture, Fishing & Hunting | 5 (100.0%) | 0 (0.0%) |
| Mining, Quarrying, & Extraction | 25 (100.0%) | 0 (0.0%) |
| Construction | 148 (100.0%) | 0 (0.0%) |
| Manufacturing | 306 (88.9%) | 38 (11.1%) |
| Wholesale Trade | 21 (100.0%) | 0 (0.0%) |
| Retail Trade | 78 (64.5%) | 43 (35.5%) |
| Transportation & Warehousing | 53 (81.5%) | 12 (18.5%) |
| Utilities | 20 (100.0%) | 0 (0.0%) |
| Information | 0 (0.0%) | 0 (0.0%) |
| Finance & Insurance | 22 (37.9%) | 36 (62.1%) |
| Real Estate, Rental & Leasing | 0 (0.0%) | 0 (0.0%) |
| Professional & Scientific | 30 (41.7%) | 42 (58.3%) |
| Enterprise Management | 0 (0.0%) | 0 (0.0%) |
| Administrative & Support | 0 (0.0%) | 34 (100.0%) |
| Educational Services | 52 (40.3%) | 77 (59.7%) |
| Health Care & Social Assistance | 45 (15.4%) | 247 (84.6%) |
| Arts, Entertainment & Recreation | 0 (0.0%) | 56 (100.0%) |
| Accommodation & Food Services | 36 (31.6%) | 78 (68.4%) |
| Public Administration | 0 (0.0%) | 9 (100.0%) |
| Total | 860 (53.1%) | 759 (46.9%) |
Education in Richville
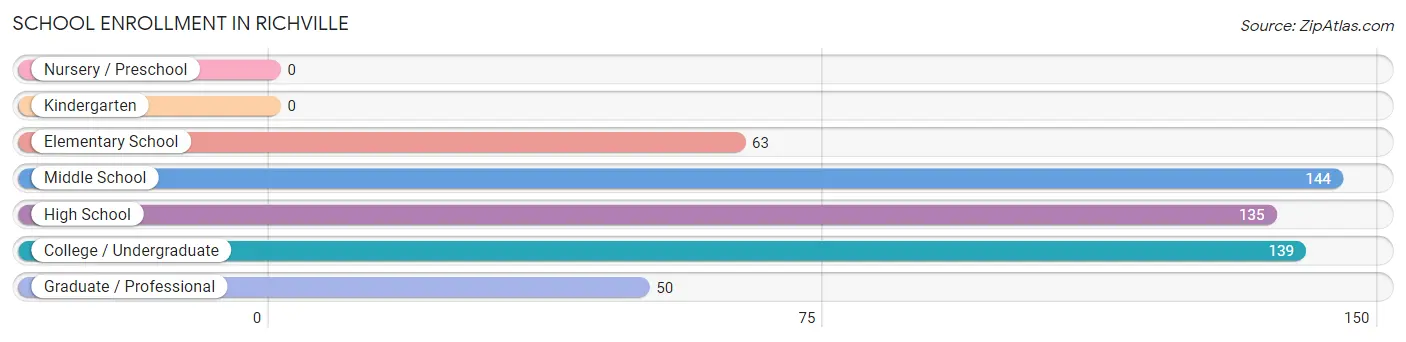
School Enrollment in Richville
The most common levels of schooling among the 531 students in Richville are middle school (144 | 27.1%), college / undergraduate (139 | 26.2%), and high school (135 | 25.4%).
| School Level | # Students | % Students |
| Nursery / Preschool | 0 | 0.0% |
| Kindergarten | 0 | 0.0% |
| Elementary School | 63 | 11.9% |
| Middle School | 144 | 27.1% |
| High School | 135 | 25.4% |
| College / Undergraduate | 139 | 26.2% |
| Graduate / Professional | 50 | 9.4% |
| Total | 531 | 100.0% |
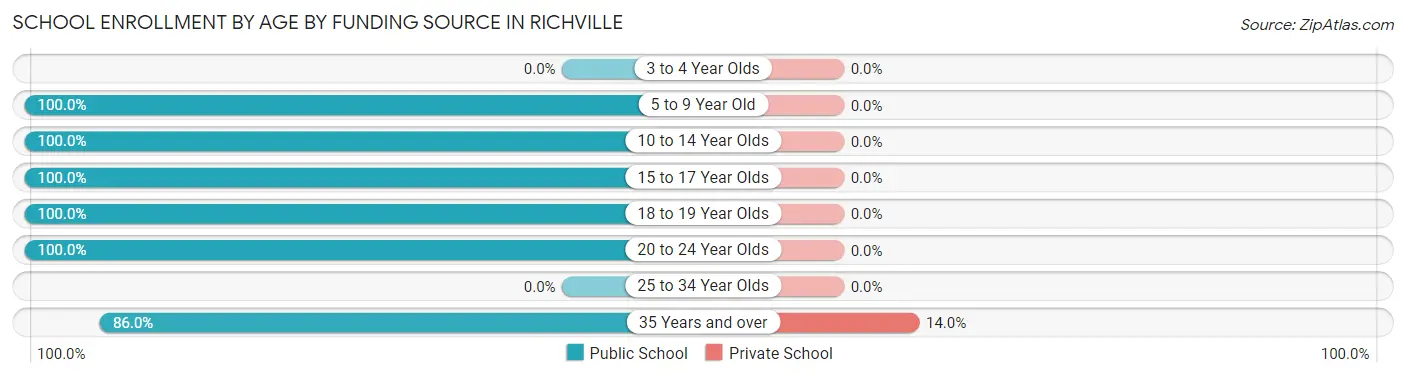
School Enrollment by Age by Funding Source in Richville
Out of a total of 531 students who are enrolled in schools in Richville, 8 (1.5%) attend a private institution, while the remaining 523 (98.5%) are enrolled in public schools. The age group of 35 years and over has the highest likelihood of being enrolled in private schools, with 8 (14.0% in the age bracket) enrolled. Conversely, the age group of 5 to 9 year old has the lowest likelihood of being enrolled in a private school, with 63 (100.0% in the age bracket) attending a public institution.
| Age Bracket | Public School | Private School |
| 3 to 4 Year Olds | 0 (0.0%) | 0 (0.0%) |
| 5 to 9 Year Old | 63 (100.0%) | 0 (0.0%) |
| 10 to 14 Year Olds | 155 (100.0%) | 0 (0.0%) |
| 15 to 17 Year Olds | 88 (100.0%) | 0 (0.0%) |
| 18 to 19 Year Olds | 53 (100.0%) | 0 (0.0%) |
| 20 to 24 Year Olds | 115 (100.0%) | 0 (0.0%) |
| 25 to 34 Year Olds | 0 (0.0%) | 0 (0.0%) |
| 35 Years and over | 49 (86.0%) | 8 (14.0%) |
| Total | 523 (98.5%) | 8 (1.5%) |
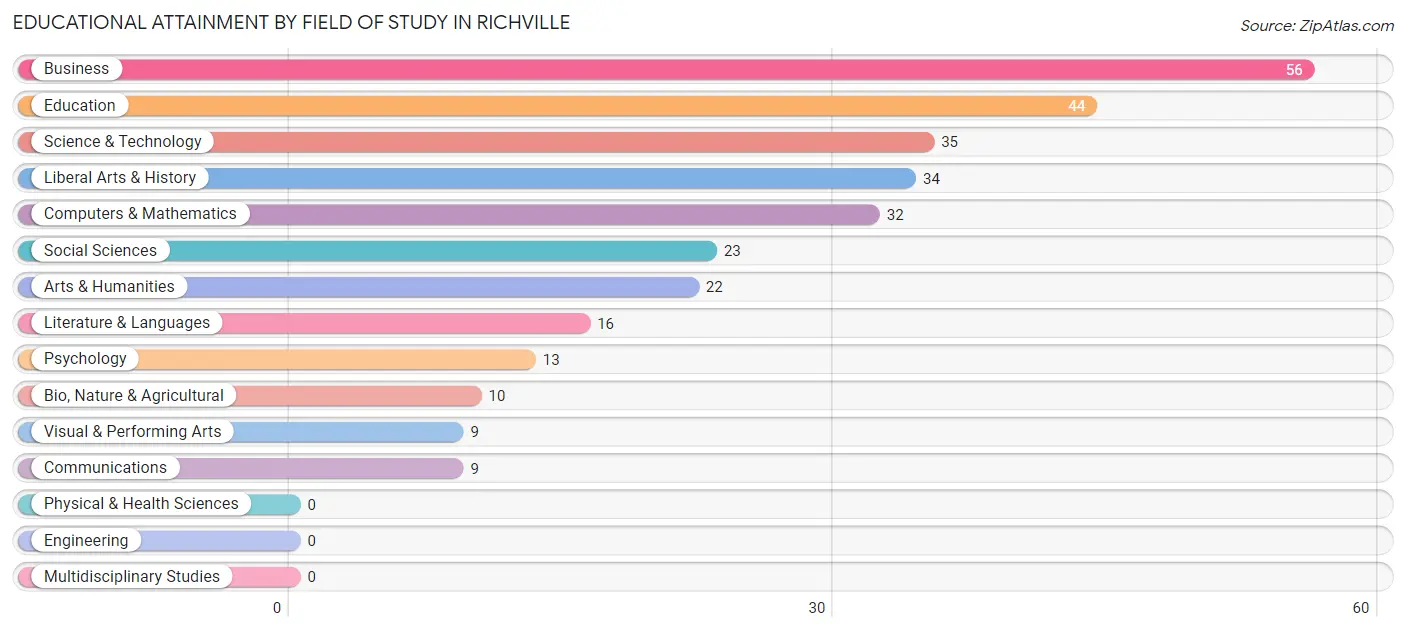
Educational Attainment by Field of Study in Richville
Business (56 | 18.5%), education (44 | 14.5%), science & technology (35 | 11.6%), liberal arts & history (34 | 11.2%), and computers & mathematics (32 | 10.6%) are the most common fields of study among 303 individuals in Richville who have obtained a bachelor's degree or higher.
| Field of Study | # Graduates | % Graduates |
| Computers & Mathematics | 32 | 10.6% |
| Bio, Nature & Agricultural | 10 | 3.3% |
| Physical & Health Sciences | 0 | 0.0% |
| Psychology | 13 | 4.3% |
| Social Sciences | 23 | 7.6% |
| Engineering | 0 | 0.0% |
| Multidisciplinary Studies | 0 | 0.0% |
| Science & Technology | 35 | 11.6% |
| Business | 56 | 18.5% |
| Education | 44 | 14.5% |
| Literature & Languages | 16 | 5.3% |
| Liberal Arts & History | 34 | 11.2% |
| Visual & Performing Arts | 9 | 3.0% |
| Communications | 9 | 3.0% |
| Arts & Humanities | 22 | 7.3% |
| Total | 303 | 100.0% |
Transportation & Commute in Richville
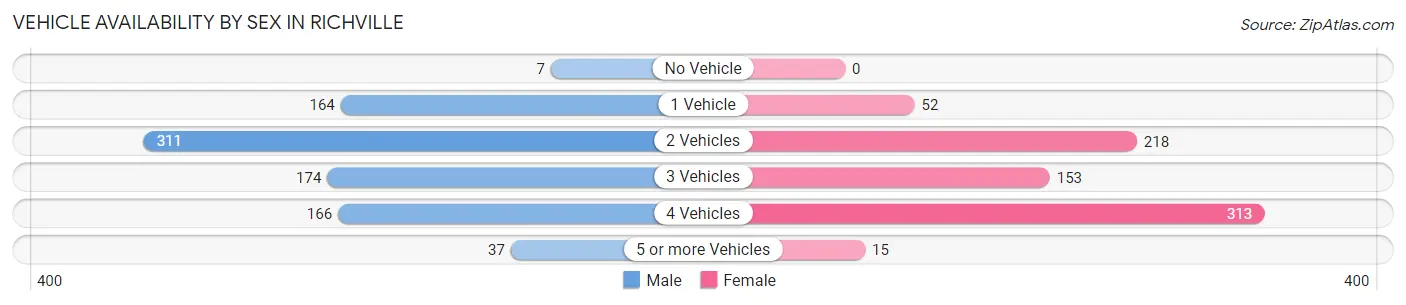
Vehicle Availability by Sex in Richville
The most prevalent vehicle ownership categories in Richville are males with 2 vehicles (311, accounting for 36.2%) and females with 2 vehicles (218, making up 41.4%).
| Vehicles Available | Male | Female |
| No Vehicle | 7 (0.8%) | 0 (0.0%) |
| 1 Vehicle | 164 (19.1%) | 52 (6.9%) |
| 2 Vehicles | 311 (36.2%) | 218 (29.0%) |
| 3 Vehicles | 174 (20.3%) | 153 (20.4%) |
| 4 Vehicles | 166 (19.3%) | 313 (41.7%) |
| 5 or more Vehicles | 37 (4.3%) | 15 (2.0%) |
| Total | 859 (100.0%) | 751 (100.0%) |
Commute Time in Richville
The most frequently occuring commute durations in Richville are 15 to 19 minutes (347 commuters, 24.5%), 10 to 14 minutes (256 commuters, 18.1%), and 5 to 9 minutes (210 commuters, 14.8%).
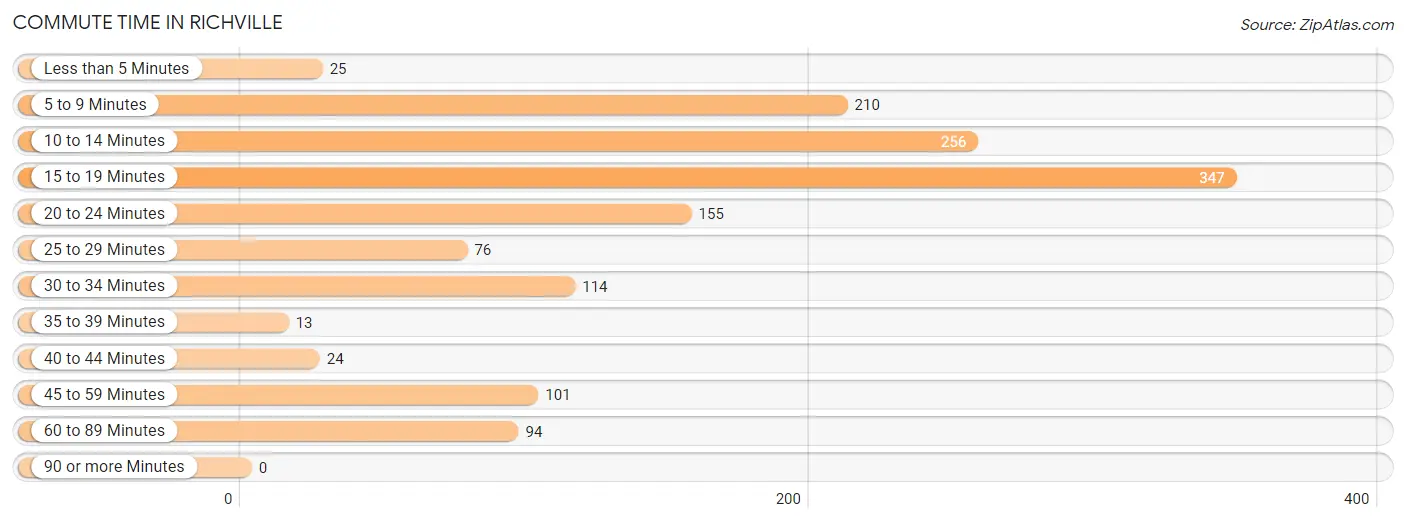
| Commute Time | # Commuters | % Commuters |
| Less than 5 Minutes | 25 | 1.8% |
| 5 to 9 Minutes | 210 | 14.8% |
| 10 to 14 Minutes | 256 | 18.1% |
| 15 to 19 Minutes | 347 | 24.5% |
| 20 to 24 Minutes | 155 | 11.0% |
| 25 to 29 Minutes | 76 | 5.4% |
| 30 to 34 Minutes | 114 | 8.1% |
| 35 to 39 Minutes | 13 | 0.9% |
| 40 to 44 Minutes | 24 | 1.7% |
| 45 to 59 Minutes | 101 | 7.1% |
| 60 to 89 Minutes | 94 | 6.6% |
| 90 or more Minutes | 0 | 0.0% |
Commute Time by Sex in Richville
The most common commute times in Richville are 15 to 19 minutes (171 commuters, 21.3%) for males and 15 to 19 minutes (176 commuters, 28.7%) for females.
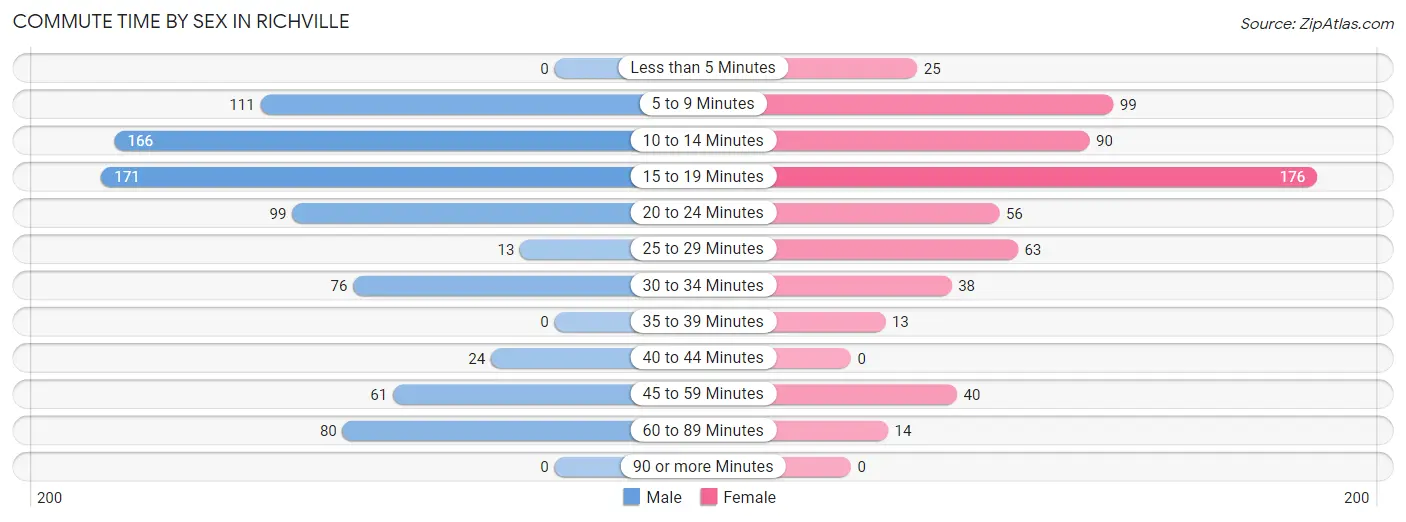
| Commute Time | Male | Female |
| Less than 5 Minutes | 0 (0.0%) | 25 (4.1%) |
| 5 to 9 Minutes | 111 (13.9%) | 99 (16.1%) |
| 10 to 14 Minutes | 166 (20.7%) | 90 (14.7%) |
| 15 to 19 Minutes | 171 (21.3%) | 176 (28.7%) |
| 20 to 24 Minutes | 99 (12.4%) | 56 (9.1%) |
| 25 to 29 Minutes | 13 (1.6%) | 63 (10.3%) |
| 30 to 34 Minutes | 76 (9.5%) | 38 (6.2%) |
| 35 to 39 Minutes | 0 (0.0%) | 13 (2.1%) |
| 40 to 44 Minutes | 24 (3.0%) | 0 (0.0%) |
| 45 to 59 Minutes | 61 (7.6%) | 40 (6.5%) |
| 60 to 89 Minutes | 80 (10.0%) | 14 (2.3%) |
| 90 or more Minutes | 0 (0.0%) | 0 (0.0%) |
Time of Departure to Work by Sex in Richville
The most frequent times of departure to work in Richville are 8:00 AM to 8:29 AM (135, 16.9%) for males and 7:30 AM to 7:59 AM (102, 16.6%) for females.
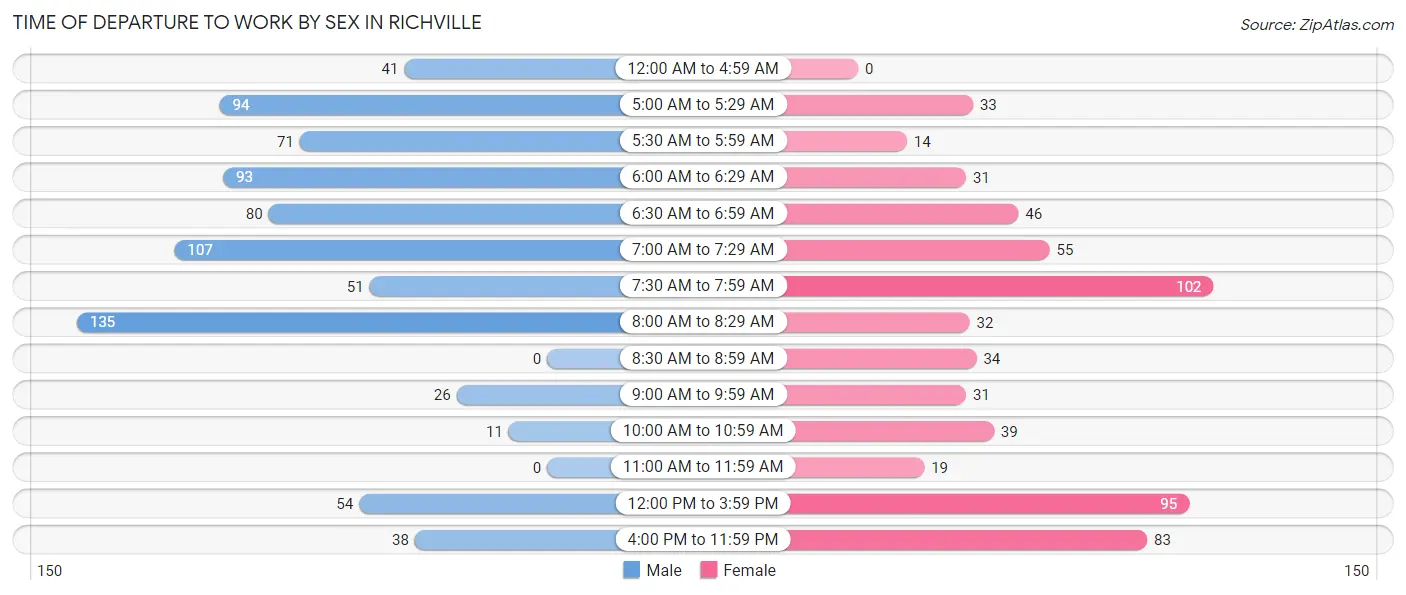
| Time of Departure | Male | Female |
| 12:00 AM to 4:59 AM | 41 (5.1%) | 0 (0.0%) |
| 5:00 AM to 5:29 AM | 94 (11.7%) | 33 (5.4%) |
| 5:30 AM to 5:59 AM | 71 (8.9%) | 14 (2.3%) |
| 6:00 AM to 6:29 AM | 93 (11.6%) | 31 (5.1%) |
| 6:30 AM to 6:59 AM | 80 (10.0%) | 46 (7.5%) |
| 7:00 AM to 7:29 AM | 107 (13.4%) | 55 (9.0%) |
| 7:30 AM to 7:59 AM | 51 (6.4%) | 102 (16.6%) |
| 8:00 AM to 8:29 AM | 135 (16.9%) | 32 (5.2%) |
| 8:30 AM to 8:59 AM | 0 (0.0%) | 34 (5.5%) |
| 9:00 AM to 9:59 AM | 26 (3.3%) | 31 (5.1%) |
| 10:00 AM to 10:59 AM | 11 (1.4%) | 39 (6.4%) |
| 11:00 AM to 11:59 AM | 0 (0.0%) | 19 (3.1%) |
| 12:00 PM to 3:59 PM | 54 (6.7%) | 95 (15.5%) |
| 4:00 PM to 11:59 PM | 38 (4.7%) | 83 (13.5%) |
| Total | 801 (100.0%) | 614 (100.0%) |
Housing Occupancy in Richville
Occupancy by Ownership in Richville
Of the total 1,356 dwellings in Richville, owner-occupied units account for 1,167 (86.1%), while renter-occupied units make up 189 (13.9%).
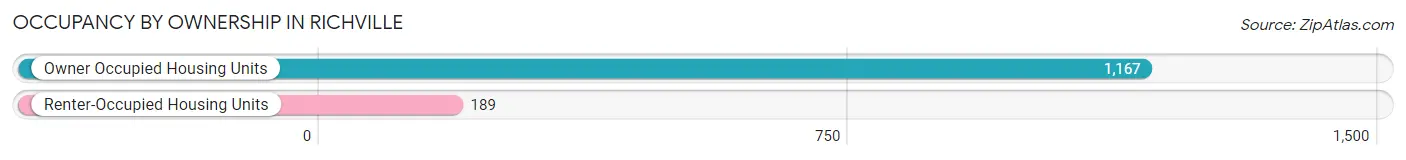
| Occupancy | # Housing Units | % Housing Units |
| Owner Occupied Housing Units | 1,167 | 86.1% |
| Renter-Occupied Housing Units | 189 | 13.9% |
| Total Occupied Housing Units | 1,356 | 100.0% |
Occupancy by Household Size in Richville
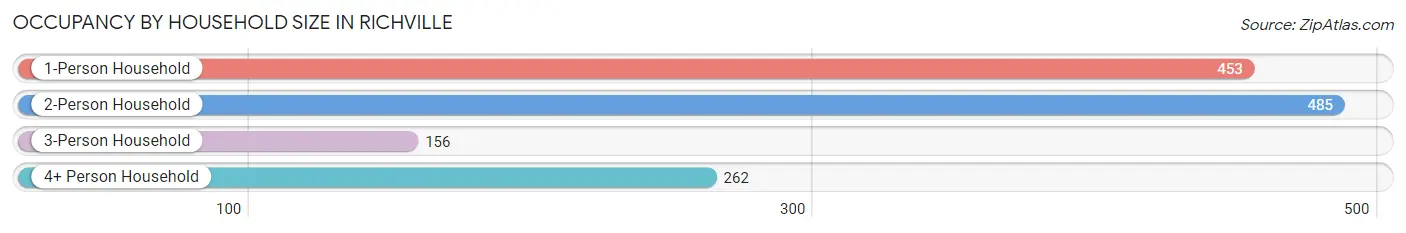
| Household Size | # Housing Units | % Housing Units |
| 1-Person Household | 453 | 33.4% |
| 2-Person Household | 485 | 35.8% |
| 3-Person Household | 156 | 11.5% |
| 4+ Person Household | 262 | 19.3% |
| Total Housing Units | 1,356 | 100.0% |
Occupancy by Ownership by Household Size in Richville
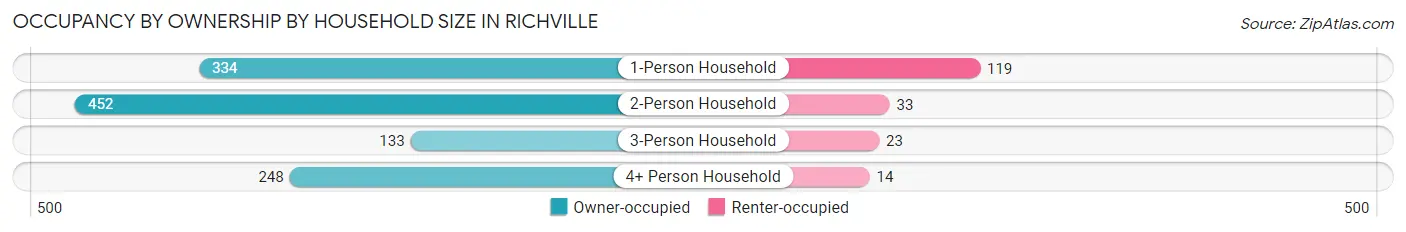
| Household Size | Owner-occupied | Renter-occupied |
| 1-Person Household | 334 (73.7%) | 119 (26.3%) |
| 2-Person Household | 452 (93.2%) | 33 (6.8%) |
| 3-Person Household | 133 (85.3%) | 23 (14.7%) |
| 4+ Person Household | 248 (94.7%) | 14 (5.3%) |
| Total Housing Units | 1,167 (86.1%) | 189 (13.9%) |
Occupancy by Educational Attainment in Richville
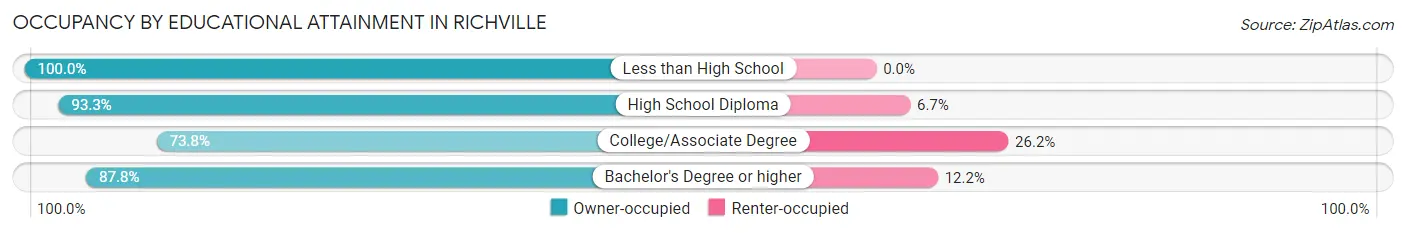
| Household Size | Owner-occupied | Renter-occupied |
| Less than High School | 103 (100.0%) | 0 (0.0%) |
| High School Diploma | 556 (93.3%) | 40 (6.7%) |
| College/Associate Degree | 364 (73.8%) | 129 (26.2%) |
| Bachelor's Degree or higher | 144 (87.8%) | 20 (12.2%) |
Occupancy by Age of Householder in Richville
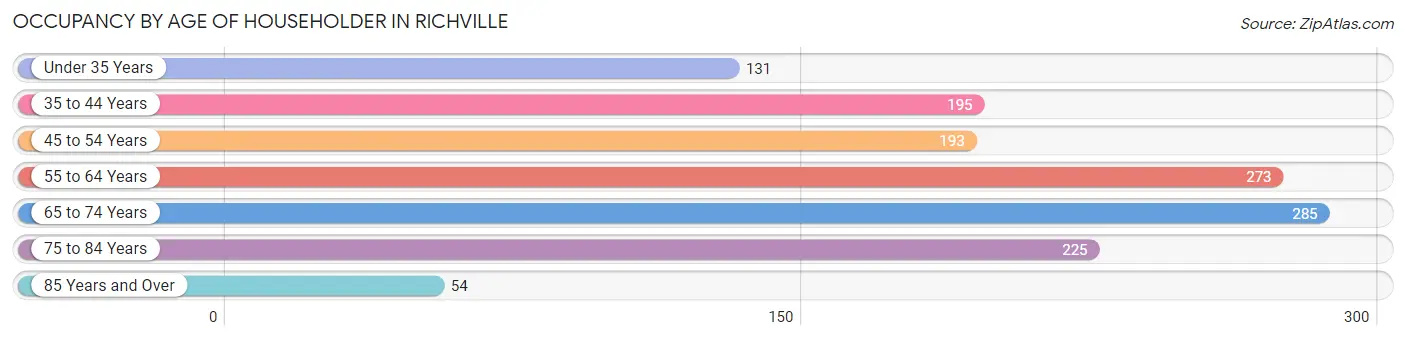
| Age Bracket | # Households | % Households |
| Under 35 Years | 131 | 9.7% |
| 35 to 44 Years | 195 | 14.4% |
| 45 to 54 Years | 193 | 14.2% |
| 55 to 64 Years | 273 | 20.1% |
| 65 to 74 Years | 285 | 21.0% |
| 75 to 84 Years | 225 | 16.6% |
| 85 Years and Over | 54 | 4.0% |
| Total | 1,356 | 100.0% |
Housing Finances in Richville
Median Income by Occupancy in Richville
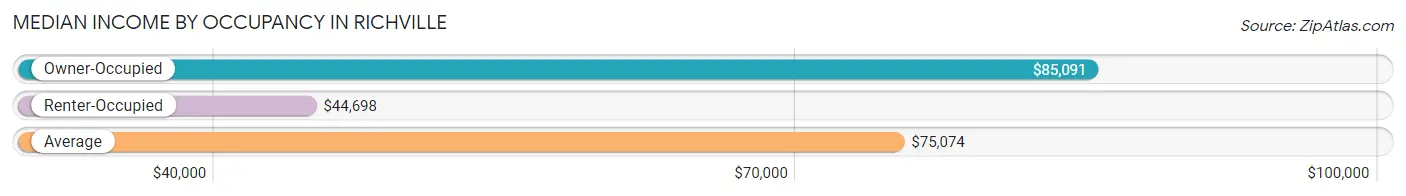
| Occupancy Type | # Households | Median Income |
| Owner-Occupied | 1,167 (86.1%) | $85,091 |
| Renter-Occupied | 189 (13.9%) | $44,698 |
| Average | 1,356 (100.0%) | $75,074 |
Occupancy by Householder Income Bracket in Richville
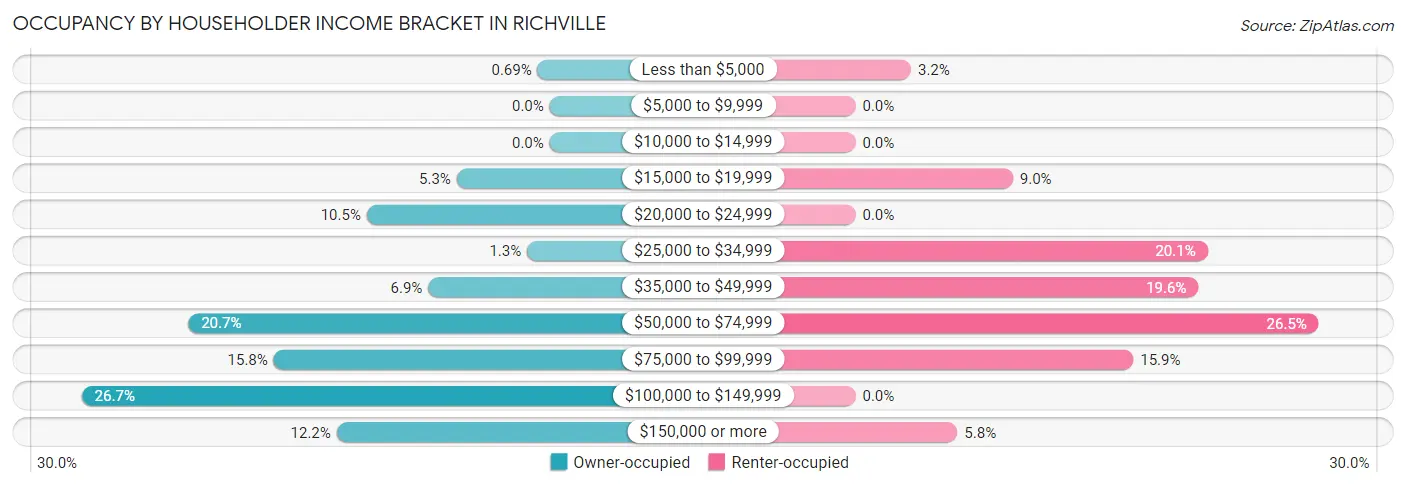
| Income Bracket | Owner-occupied | Renter-occupied |
| Less than $5,000 | 8 (0.7%) | 6 (3.2%) |
| $5,000 to $9,999 | 0 (0.0%) | 0 (0.0%) |
| $10,000 to $14,999 | 0 (0.0%) | 0 (0.0%) |
| $15,000 to $19,999 | 62 (5.3%) | 17 (9.0%) |
| $20,000 to $24,999 | 122 (10.4%) | 0 (0.0%) |
| $25,000 to $34,999 | 15 (1.3%) | 38 (20.1%) |
| $35,000 to $49,999 | 81 (6.9%) | 37 (19.6%) |
| $50,000 to $74,999 | 241 (20.6%) | 50 (26.5%) |
| $75,000 to $99,999 | 184 (15.8%) | 30 (15.9%) |
| $100,000 to $149,999 | 312 (26.7%) | 0 (0.0%) |
| $150,000 or more | 142 (12.2%) | 11 (5.8%) |
| Total | 1,167 (100.0%) | 189 (100.0%) |
Monthly Housing Cost Tiers in Richville
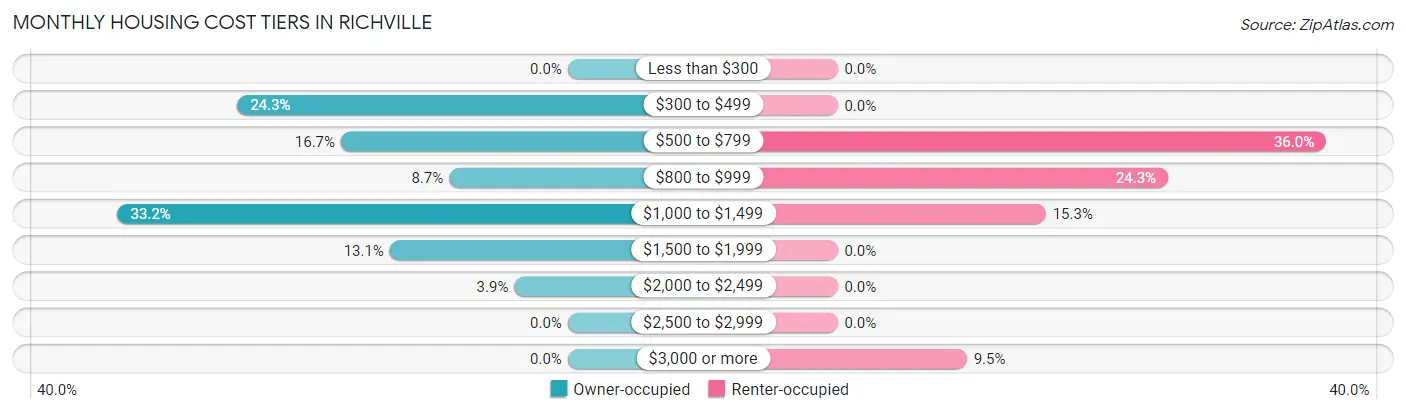
| Monthly Cost | Owner-occupied | Renter-occupied |
| Less than $300 | 0 (0.0%) | 0 (0.0%) |
| $300 to $499 | 284 (24.3%) | 0 (0.0%) |
| $500 to $799 | 195 (16.7%) | 68 (36.0%) |
| $800 to $999 | 102 (8.7%) | 46 (24.3%) |
| $1,000 to $1,499 | 387 (33.2%) | 29 (15.3%) |
| $1,500 to $1,999 | 153 (13.1%) | 0 (0.0%) |
| $2,000 to $2,499 | 46 (3.9%) | 0 (0.0%) |
| $2,500 to $2,999 | 0 (0.0%) | 0 (0.0%) |
| $3,000 or more | 0 (0.0%) | 18 (9.5%) |
| Total | 1,167 (100.0%) | 189 (100.0%) |
Physical Housing Characteristics in Richville
Housing Structures in Richville
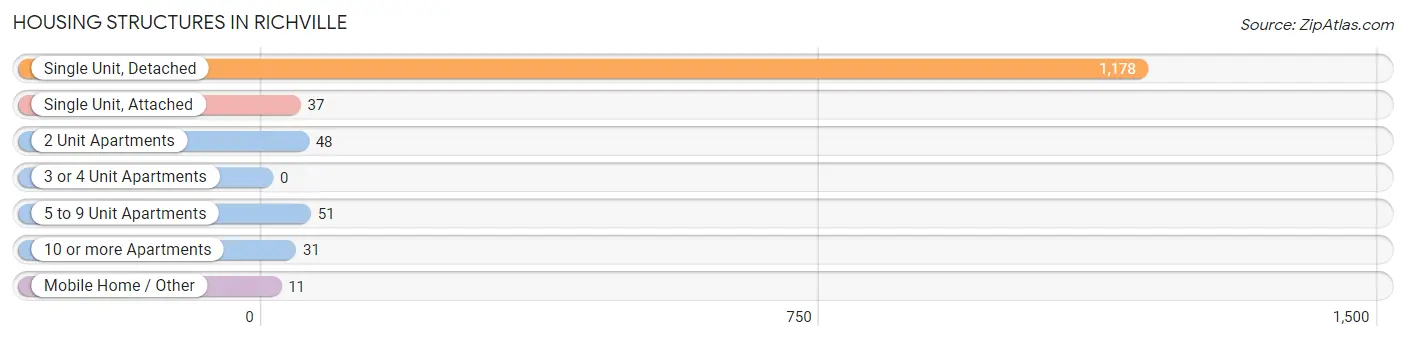
| Structure Type | # Housing Units | % Housing Units |
| Single Unit, Detached | 1,178 | 86.9% |
| Single Unit, Attached | 37 | 2.7% |
| 2 Unit Apartments | 48 | 3.5% |
| 3 or 4 Unit Apartments | 0 | 0.0% |
| 5 to 9 Unit Apartments | 51 | 3.8% |
| 10 or more Apartments | 31 | 2.3% |
| Mobile Home / Other | 11 | 0.8% |
| Total | 1,356 | 100.0% |
Housing Structures by Occupancy in Richville
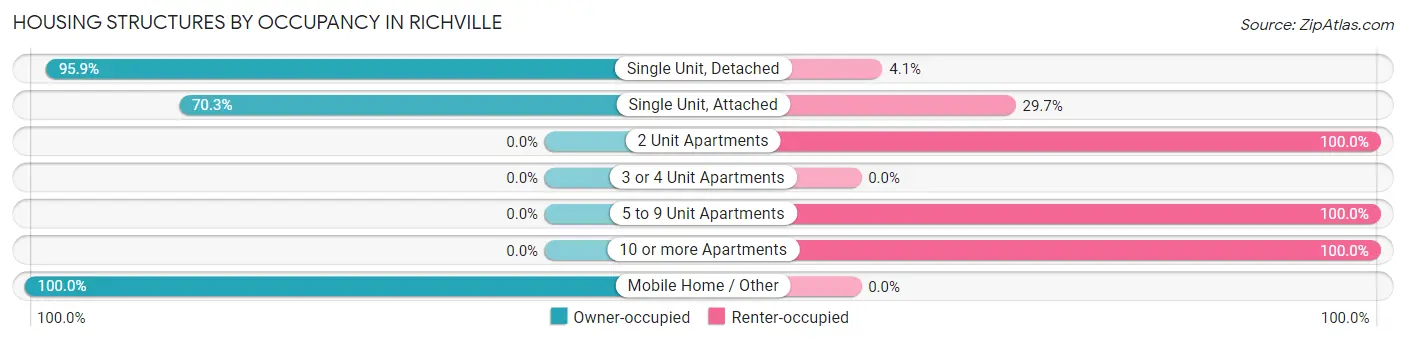
| Structure Type | Owner-occupied | Renter-occupied |
| Single Unit, Detached | 1,130 (95.9%) | 48 (4.1%) |
| Single Unit, Attached | 26 (70.3%) | 11 (29.7%) |
| 2 Unit Apartments | 0 (0.0%) | 48 (100.0%) |
| 3 or 4 Unit Apartments | 0 (0.0%) | 0 (0.0%) |
| 5 to 9 Unit Apartments | 0 (0.0%) | 51 (100.0%) |
| 10 or more Apartments | 0 (0.0%) | 31 (100.0%) |
| Mobile Home / Other | 11 (100.0%) | 0 (0.0%) |
| Total | 1,167 (86.1%) | 189 (13.9%) |
Housing Structures by Number of Rooms in Richville
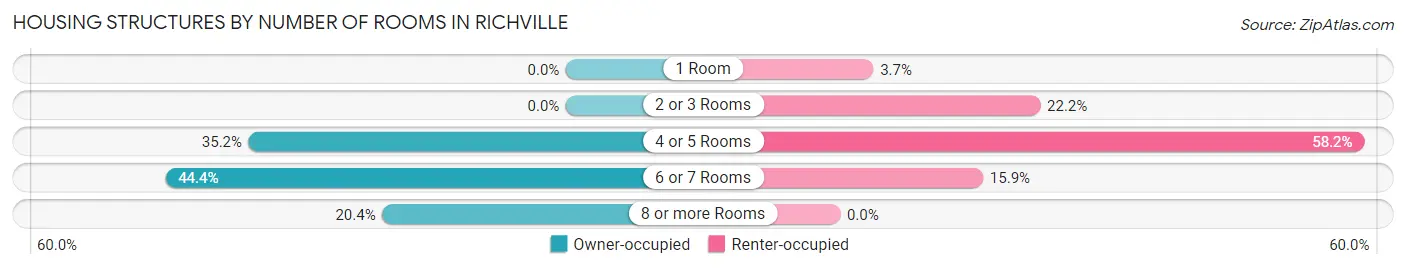
| Number of Rooms | Owner-occupied | Renter-occupied |
| 1 Room | 0 (0.0%) | 7 (3.7%) |
| 2 or 3 Rooms | 0 (0.0%) | 42 (22.2%) |
| 4 or 5 Rooms | 411 (35.2%) | 110 (58.2%) |
| 6 or 7 Rooms | 518 (44.4%) | 30 (15.9%) |
| 8 or more Rooms | 238 (20.4%) | 0 (0.0%) |
| Total | 1,167 (100.0%) | 189 (100.0%) |
Housing Structure by Heating Type in Richville
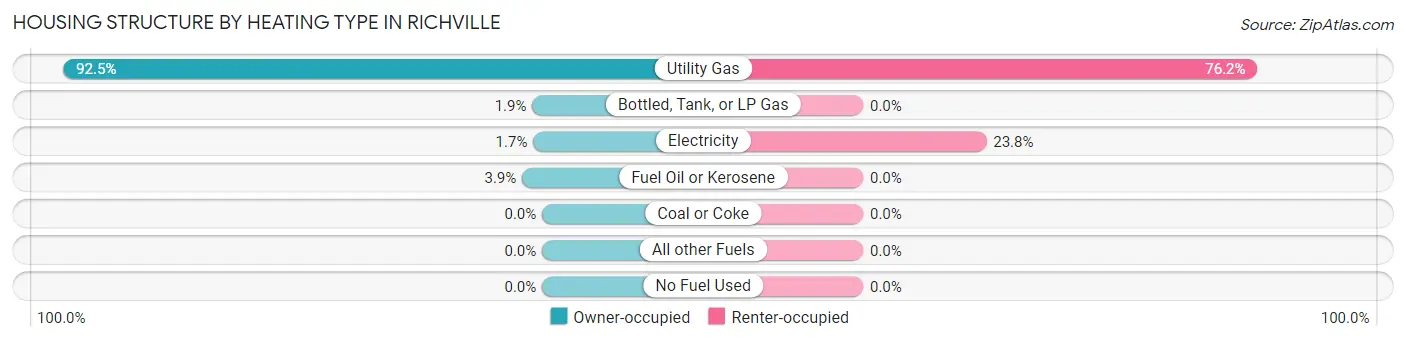
| Heating Type | Owner-occupied | Renter-occupied |
| Utility Gas | 1,080 (92.5%) | 144 (76.2%) |
| Bottled, Tank, or LP Gas | 22 (1.9%) | 0 (0.0%) |
| Electricity | 20 (1.7%) | 45 (23.8%) |
| Fuel Oil or Kerosene | 45 (3.9%) | 0 (0.0%) |
| Coal or Coke | 0 (0.0%) | 0 (0.0%) |
| All other Fuels | 0 (0.0%) | 0 (0.0%) |
| No Fuel Used | 0 (0.0%) | 0 (0.0%) |
| Total | 1,167 (100.0%) | 189 (100.0%) |
Household Vehicle Usage in Richville
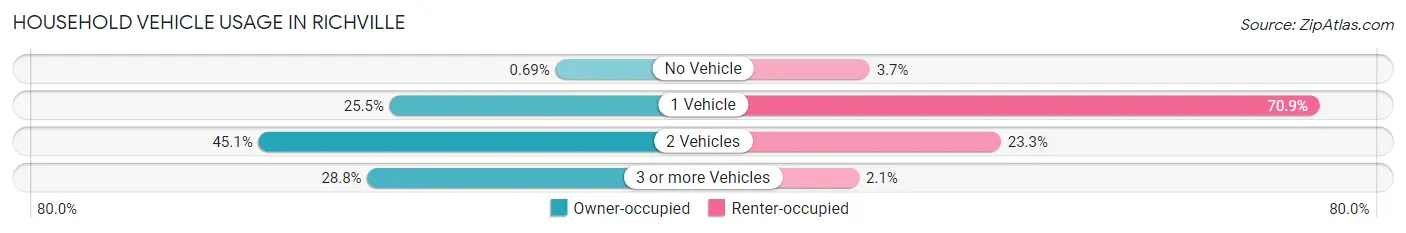
| Vehicles per Household | Owner-occupied | Renter-occupied |
| No Vehicle | 8 (0.7%) | 7 (3.7%) |
| 1 Vehicle | 297 (25.5%) | 134 (70.9%) |
| 2 Vehicles | 526 (45.1%) | 44 (23.3%) |
| 3 or more Vehicles | 336 (28.8%) | 4 (2.1%) |
| Total | 1,167 (100.0%) | 189 (100.0%) |
Real Estate & Mortgages in Richville
Real Estate and Mortgage Overview in Richville
| Characteristic | Without Mortgage | With Mortgage |
| Housing Units | 428 | 739 |
| Median Property Value | $144,900 | $158,100 |
| Median Household Income | $57,015 | $119 |
| Monthly Housing Costs | $466 | $0 |
| Real Estate Taxes | $2,250 | $0 |
Property Value by Mortgage Status in Richville
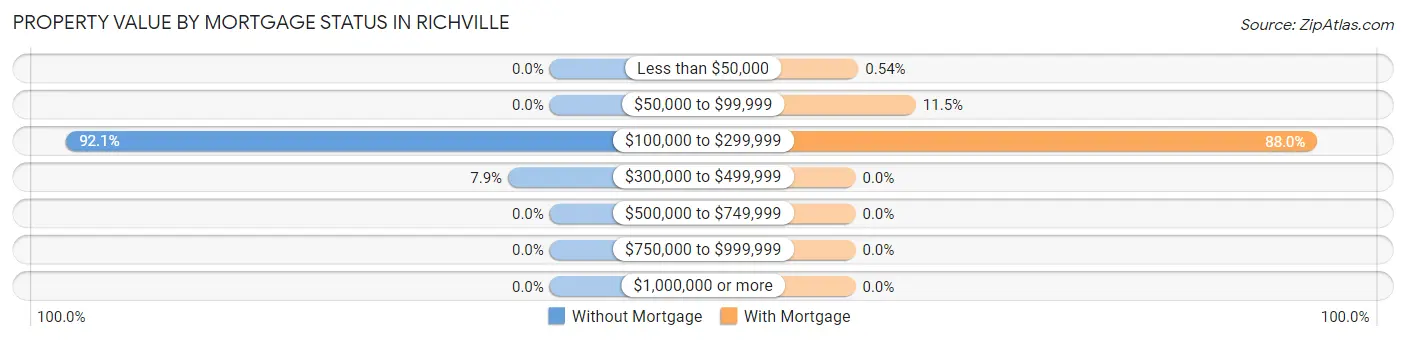
| Property Value | Without Mortgage | With Mortgage |
| Less than $50,000 | 0 (0.0%) | 4 (0.5%) |
| $50,000 to $99,999 | 0 (0.0%) | 85 (11.5%) |
| $100,000 to $299,999 | 394 (92.1%) | 650 (88.0%) |
| $300,000 to $499,999 | 34 (7.9%) | 0 (0.0%) |
| $500,000 to $749,999 | 0 (0.0%) | 0 (0.0%) |
| $750,000 to $999,999 | 0 (0.0%) | 0 (0.0%) |
| $1,000,000 or more | 0 (0.0%) | 0 (0.0%) |
| Total | 428 (100.0%) | 739 (100.0%) |
Household Income by Mortgage Status in Richville
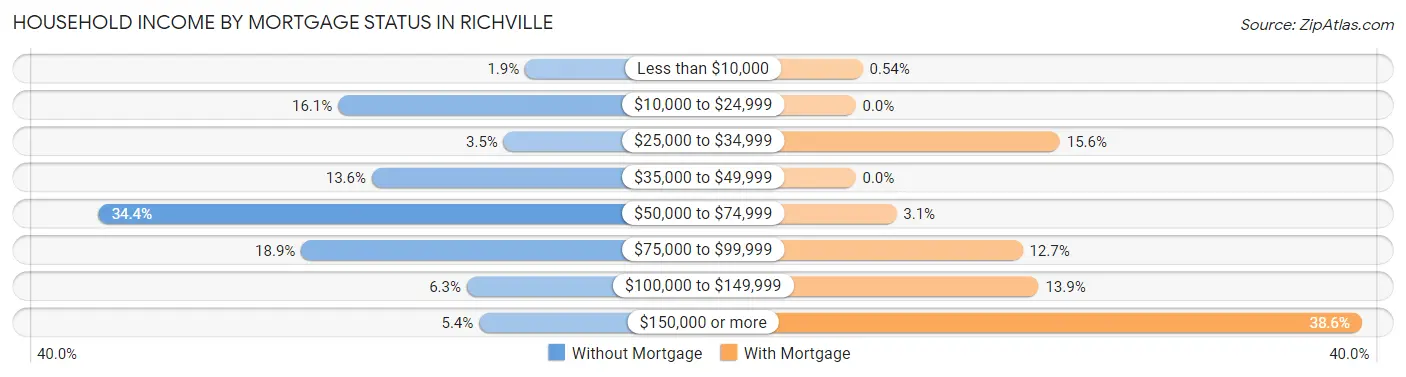
| Household Income | Without Mortgage | With Mortgage |
| Less than $10,000 | 8 (1.9%) | 4 (0.5%) |
| $10,000 to $24,999 | 69 (16.1%) | 0 (0.0%) |
| $25,000 to $34,999 | 15 (3.5%) | 115 (15.6%) |
| $35,000 to $49,999 | 58 (13.6%) | 0 (0.0%) |
| $50,000 to $74,999 | 147 (34.4%) | 23 (3.1%) |
| $75,000 to $99,999 | 81 (18.9%) | 94 (12.7%) |
| $100,000 to $149,999 | 27 (6.3%) | 103 (13.9%) |
| $150,000 or more | 23 (5.4%) | 285 (38.6%) |
| Total | 428 (100.0%) | 739 (100.0%) |
Property Value to Household Income Ratio in Richville
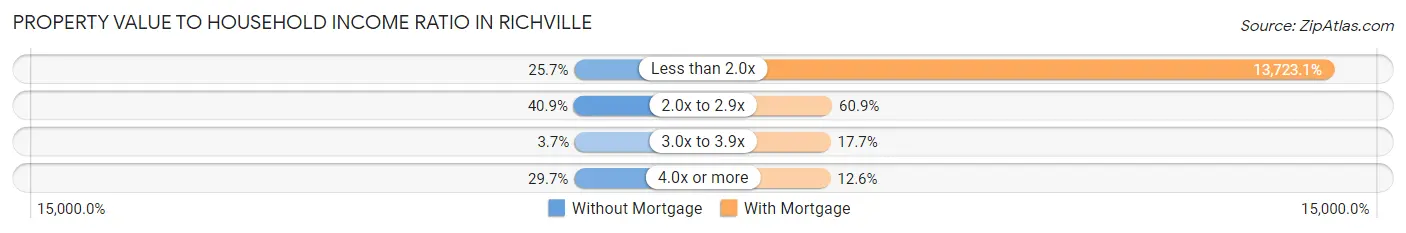
| Value-to-Income Ratio | Without Mortgage | With Mortgage |
| Less than 2.0x | 110 (25.7%) | 101,414 (13,723.1%) |
| 2.0x to 2.9x | 175 (40.9%) | 450 (60.9%) |
| 3.0x to 3.9x | 16 (3.7%) | 131 (17.7%) |
| 4.0x or more | 127 (29.7%) | 93 (12.6%) |
| Total | 428 (100.0%) | 739 (100.0%) |
Real Estate Taxes by Mortgage Status in Richville
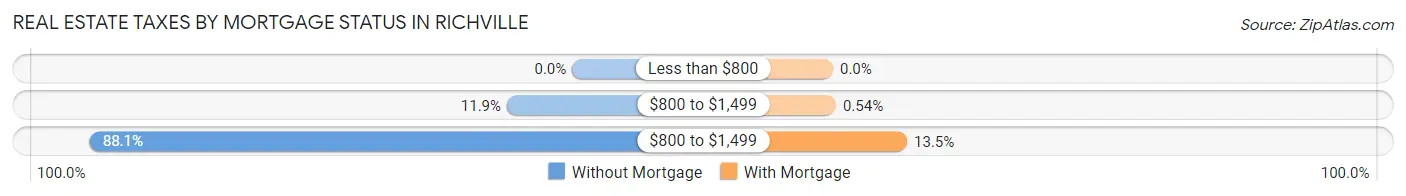
| Property Taxes | Without Mortgage | With Mortgage |
| Less than $800 | 0 (0.0%) | 0 (0.0%) |
| $800 to $1,499 | 51 (11.9%) | 4 (0.5%) |
| $800 to $1,499 | 377 (88.1%) | 100 (13.5%) |
| Total | 428 (100.0%) | 739 (100.0%) |
Health & Disability in Richville
Health Insurance Coverage by Age in Richville
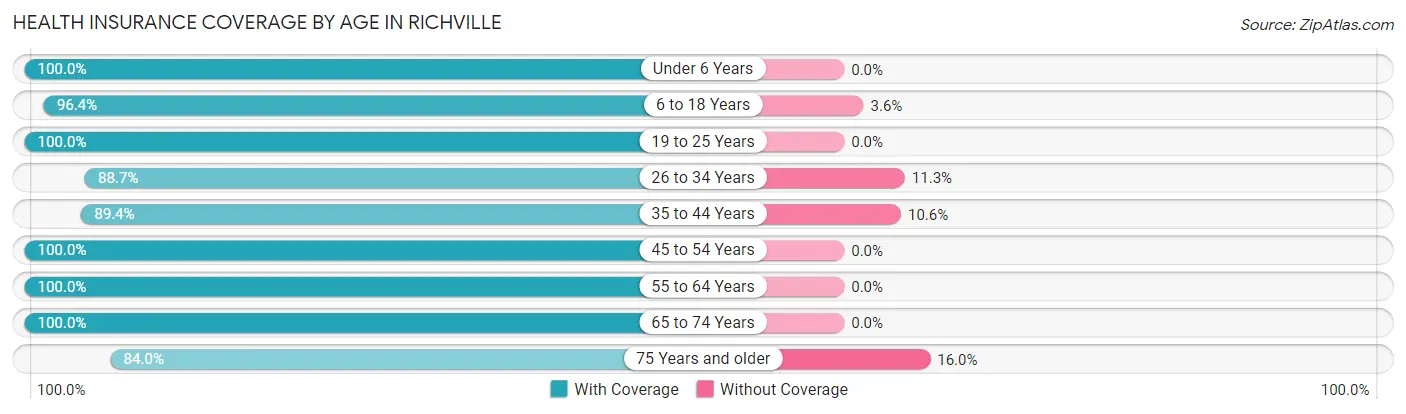
| Age Bracket | With Coverage | Without Coverage |
| Under 6 Years | 86 (100.0%) | 0 (0.0%) |
| 6 to 18 Years | 375 (96.4%) | 14 (3.6%) |
| 19 to 25 Years | 325 (100.0%) | 0 (0.0%) |
| 26 to 34 Years | 212 (88.7%) | 27 (11.3%) |
| 35 to 44 Years | 346 (89.4%) | 41 (10.6%) |
| 45 to 54 Years | 277 (100.0%) | 0 (0.0%) |
| 55 to 64 Years | 503 (100.0%) | 0 (0.0%) |
| 65 to 74 Years | 449 (100.0%) | 0 (0.0%) |
| 75 Years and older | 309 (84.0%) | 59 (16.0%) |
| Total | 2,882 (95.3%) | 141 (4.7%) |
Health Insurance Coverage by Citizenship Status in Richville
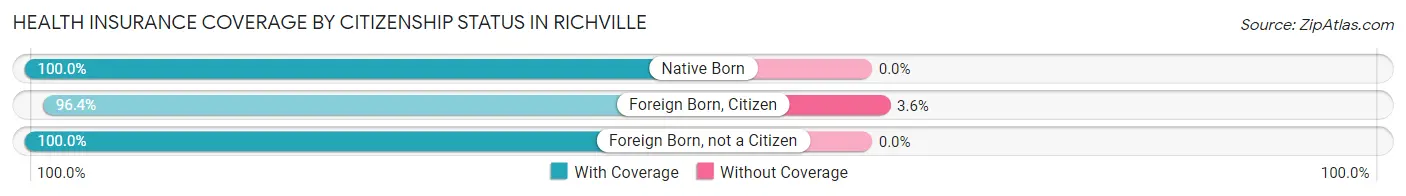
| Citizenship Status | With Coverage | Without Coverage |
| Native Born | 86 (100.0%) | 0 (0.0%) |
| Foreign Born, Citizen | 375 (96.4%) | 14 (3.6%) |
| Foreign Born, not a Citizen | 325 (100.0%) | 0 (0.0%) |
Health Insurance Coverage by Household Income in Richville
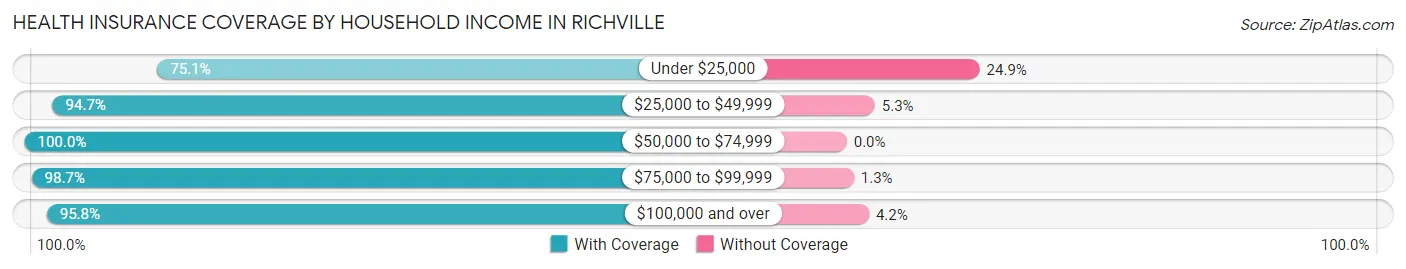
| Household Income | With Coverage | Without Coverage |
| Under $25,000 | 178 (75.1%) | 59 (24.9%) |
| $25,000 to $49,999 | 252 (94.7%) | 14 (5.3%) |
| $50,000 to $74,999 | 515 (100.0%) | 0 (0.0%) |
| $75,000 to $99,999 | 524 (98.7%) | 7 (1.3%) |
| $100,000 and over | 1,407 (95.8%) | 61 (4.2%) |
Public vs Private Health Insurance Coverage by Age in Richville
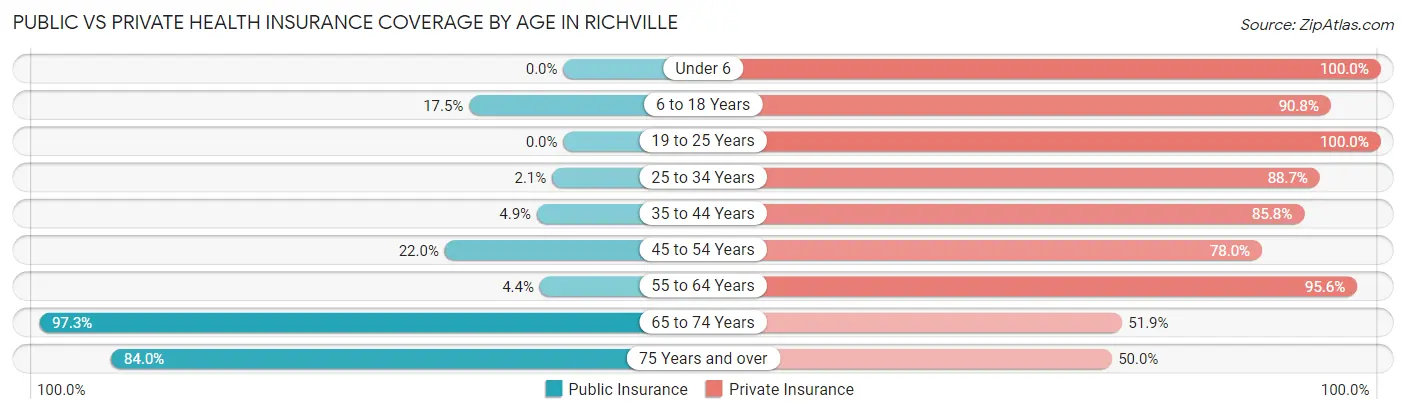
| Age Bracket | Public Insurance | Private Insurance |
| Under 6 | 0 (0.0%) | 86 (100.0%) |
| 6 to 18 Years | 68 (17.5%) | 353 (90.7%) |
| 19 to 25 Years | 0 (0.0%) | 325 (100.0%) |
| 25 to 34 Years | 5 (2.1%) | 212 (88.7%) |
| 35 to 44 Years | 19 (4.9%) | 332 (85.8%) |
| 45 to 54 Years | 61 (22.0%) | 216 (78.0%) |
| 55 to 64 Years | 22 (4.4%) | 481 (95.6%) |
| 65 to 74 Years | 437 (97.3%) | 233 (51.9%) |
| 75 Years and over | 309 (84.0%) | 184 (50.0%) |
| Total | 921 (30.5%) | 2,422 (80.1%) |
Disability Status by Sex by Age in Richville
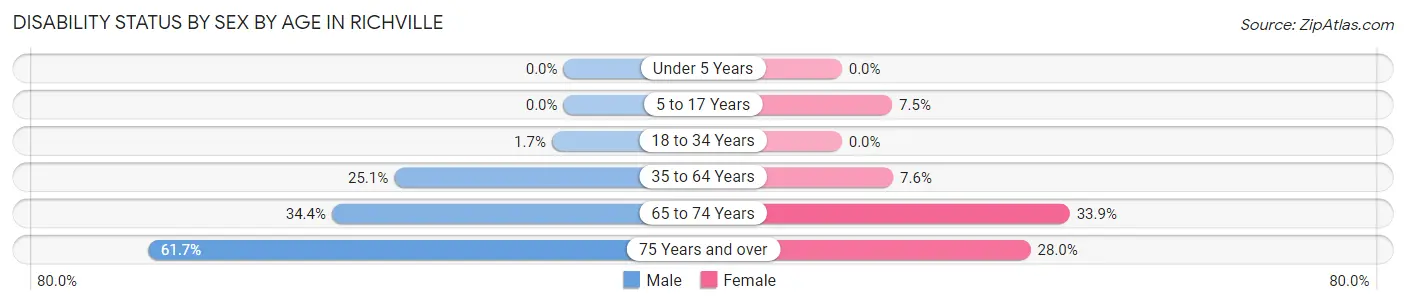
| Age Bracket | Male | Female |
| Under 5 Years | 0 (0.0%) | 0 (0.0%) |
| 5 to 17 Years | 0 (0.0%) | 11 (7.5%) |
| 18 to 34 Years | 5 (1.7%) | 0 (0.0%) |
| 35 to 64 Years | 178 (25.1%) | 35 (7.6%) |
| 65 to 74 Years | 66 (34.4%) | 87 (33.9%) |
| 75 Years and over | 161 (61.7%) | 30 (28.0%) |
Disability Class by Sex by Age in Richville
Disability Class: Hearing Difficulty
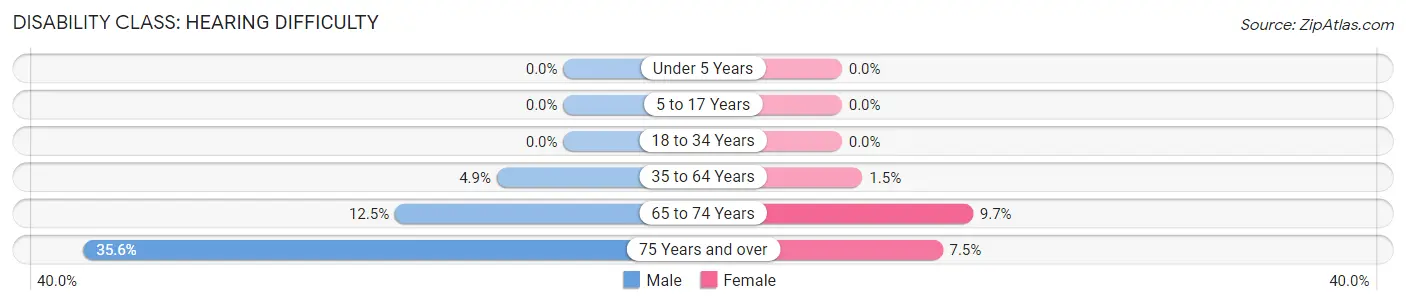
| Age Bracket | Male | Female |
| Under 5 Years | 0 (0.0%) | 0 (0.0%) |
| 5 to 17 Years | 0 (0.0%) | 0 (0.0%) |
| 18 to 34 Years | 0 (0.0%) | 0 (0.0%) |
| 35 to 64 Years | 35 (4.9%) | 7 (1.5%) |
| 65 to 74 Years | 24 (12.5%) | 25 (9.7%) |
| 75 Years and over | 93 (35.6%) | 8 (7.5%) |
Disability Class: Vision Difficulty
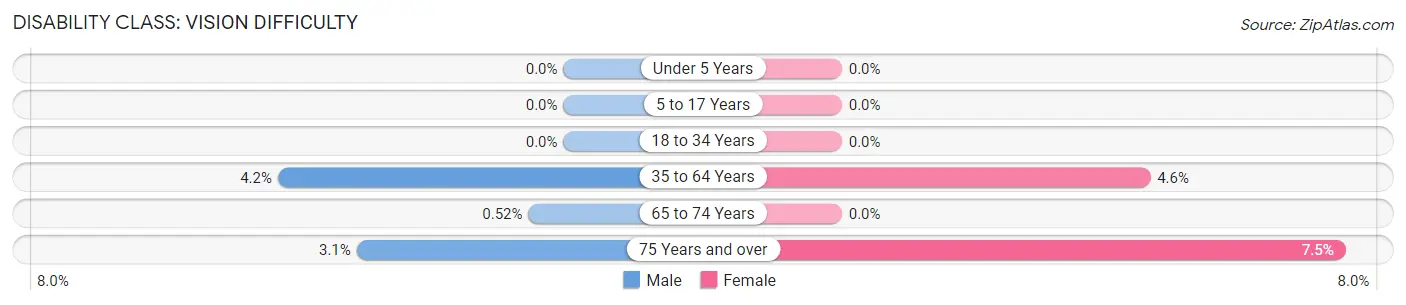
| Age Bracket | Male | Female |
| Under 5 Years | 0 (0.0%) | 0 (0.0%) |
| 5 to 17 Years | 0 (0.0%) | 0 (0.0%) |
| 18 to 34 Years | 0 (0.0%) | 0 (0.0%) |
| 35 to 64 Years | 30 (4.2%) | 21 (4.6%) |
| 65 to 74 Years | 1 (0.5%) | 0 (0.0%) |
| 75 Years and over | 8 (3.1%) | 8 (7.5%) |
Disability Class: Cognitive Difficulty
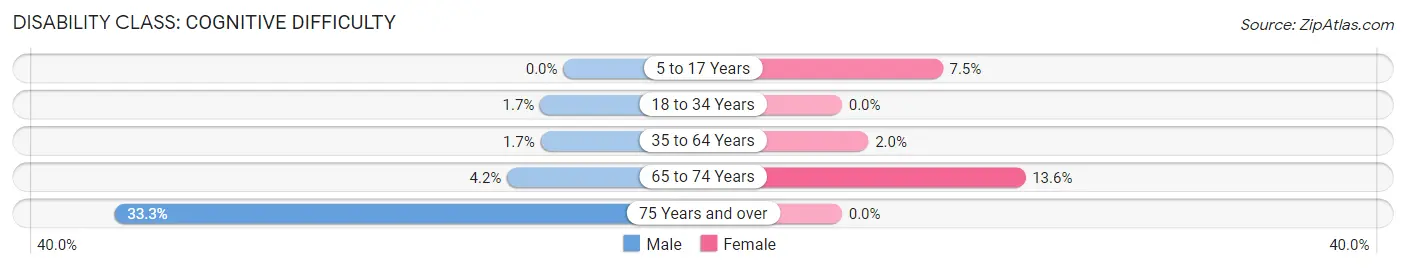
| Age Bracket | Male | Female |
| 5 to 17 Years | 0 (0.0%) | 11 (7.5%) |
| 18 to 34 Years | 5 (1.7%) | 0 (0.0%) |
| 35 to 64 Years | 12 (1.7%) | 9 (2.0%) |
| 65 to 74 Years | 8 (4.2%) | 35 (13.6%) |
| 75 Years and over | 87 (33.3%) | 0 (0.0%) |
Disability Class: Ambulatory Difficulty
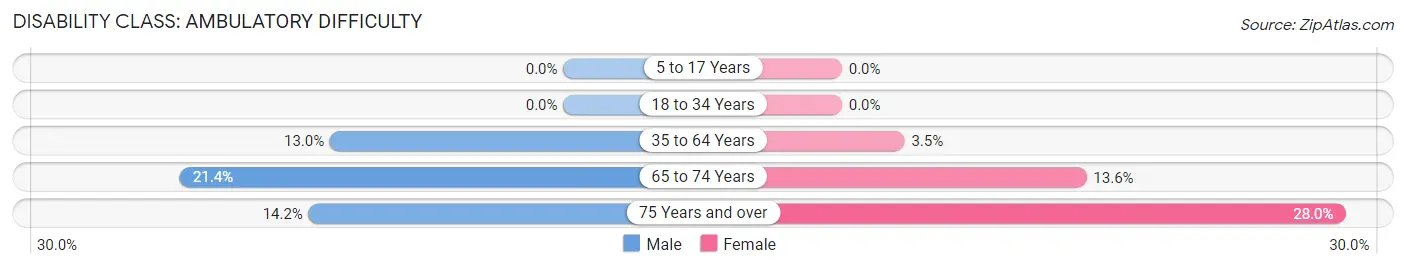
| Age Bracket | Male | Female |
| 5 to 17 Years | 0 (0.0%) | 0 (0.0%) |
| 18 to 34 Years | 0 (0.0%) | 0 (0.0%) |
| 35 to 64 Years | 92 (13.0%) | 16 (3.5%) |
| 65 to 74 Years | 41 (21.3%) | 35 (13.6%) |
| 75 Years and over | 37 (14.2%) | 30 (28.0%) |
Disability Class: Self-Care Difficulty
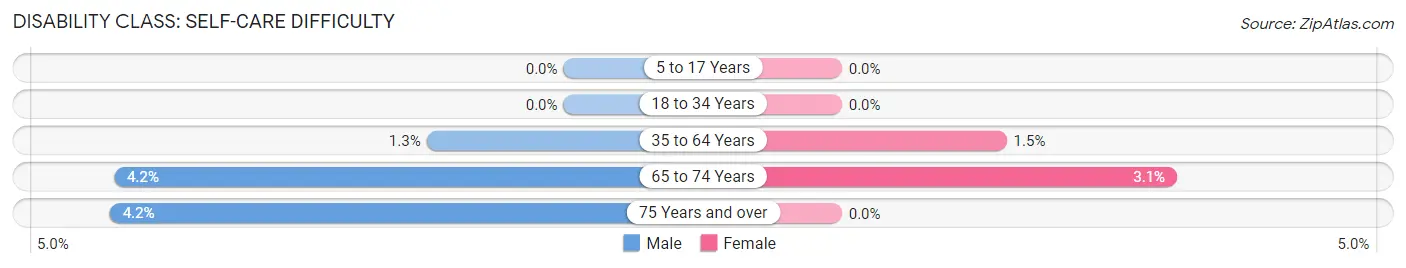
| Age Bracket | Male | Female |
| 5 to 17 Years | 0 (0.0%) | 0 (0.0%) |
| 18 to 34 Years | 0 (0.0%) | 0 (0.0%) |
| 35 to 64 Years | 9 (1.3%) | 7 (1.5%) |
| 65 to 74 Years | 8 (4.2%) | 8 (3.1%) |
| 75 Years and over | 11 (4.2%) | 0 (0.0%) |
Technology Access in Richville
Computing Device Access in Richville
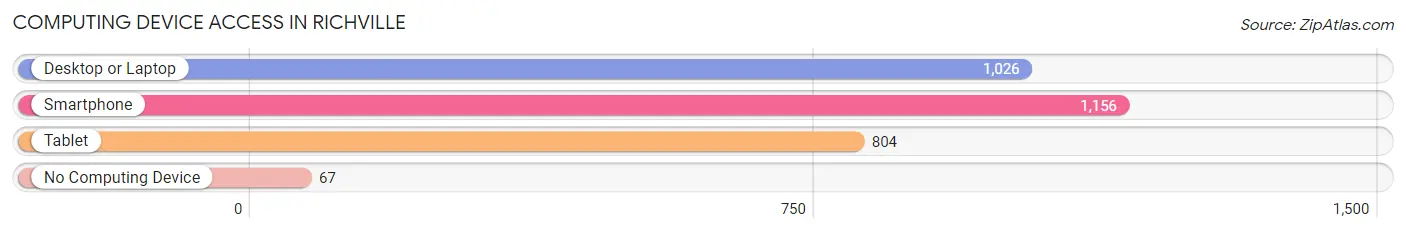
| Device Type | # Households | % Households |
| Desktop or Laptop | 1,026 | 75.7% |
| Smartphone | 1,156 | 85.3% |
| Tablet | 804 | 59.3% |
| No Computing Device | 67 | 4.9% |
| Total | 1,356 | 100.0% |
Internet Access in Richville
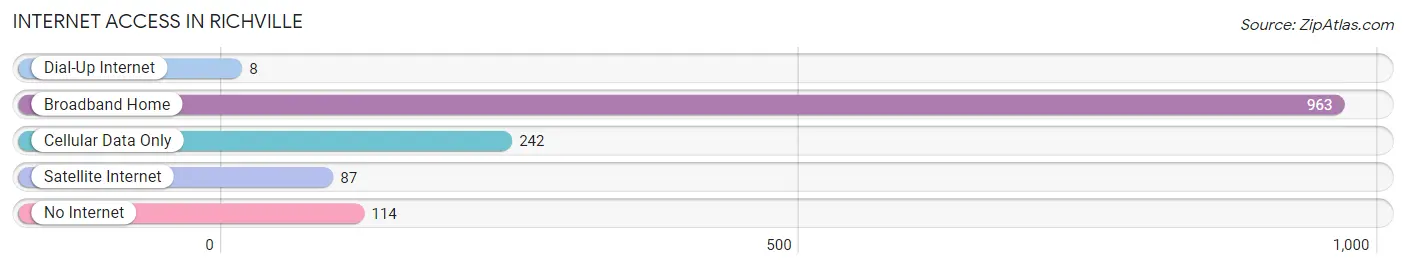
| Internet Type | # Households | % Households |
| Dial-Up Internet | 8 | 0.6% |
| Broadband Home | 963 | 71.0% |
| Cellular Data Only | 242 | 17.8% |
| Satellite Internet | 87 | 6.4% |
| No Internet | 114 | 8.4% |
| Total | 1,356 | 100.0% |
Richville Summary
Richville is a small village located in Tuscarawas County, Ohio. It is situated on the banks of the Tuscarawas River, approximately 10 miles south of the city of Dover. The village has a population of approximately 500 people and is part of the Dover-New Philadelphia-Uhrichsville Metropolitan Statistical Area.
History
Richville was founded in 1817 by a group of settlers from Pennsylvania. The village was named after one of the settlers, John Rich, who was a prominent landowner in the area. The village was originally a farming community, but it soon developed into a small industrial center. The first industry in Richville was a sawmill, which was built in 1820. This was followed by a gristmill, a tannery, and a woolen mill.
In the late 19th century, Richville became a popular tourist destination. The village was known for its scenic beauty and its proximity to the Tuscarawas River. The village also had a number of hotels and inns, which attracted visitors from all over the region.
Geography
Richville is located in the Appalachian Plateau region of Ohio. The village is situated on the banks of the Tuscarawas River, approximately 10 miles south of the city of Dover. The village is surrounded by rolling hills and wooded areas. The climate in Richville is generally mild, with temperatures ranging from the low 30s in the winter to the mid-80s in the summer.
Economy
The economy of Richville is largely based on agriculture and tourism. The village is home to several small farms, which produce a variety of crops, including corn, soybeans, and wheat. The village also has a number of small businesses, including restaurants, shops, and a hardware store.
Tourism is an important part of the local economy. The village is home to several historic sites, including the Richville Historic District, which is listed on the National Register of Historic Places. The village also has a number of parks and recreational areas, which attract visitors from all over the region.
Demographics
As of the 2010 census, the population of Richville was 498. The racial makeup of the village was 97.2% White, 0.6% African American, 0.2% Native American, 0.2% Asian, 0.2% from other races, and 1.8% from two or more races. Hispanic or Latino of any race were 0.8% of the population.
The median household income in Richville was $41,250, and the median family income was $45,000. The per capita income for the village was $18,945. About 8.3% of families and 10.2% of the population were below the poverty line, including 14.3% of those under age 18 and 6.3% of those age 65 or over.
Common Questions
What is the Total Population of Richville?
Total Population of Richville is 3,023.
What is the Total Male Population of Richville?
Total Male Population of Richville is 1,665.
What is the Total Female Population of Richville?
Total Female Population of Richville is 1,358.
What is the Ratio of Males per 100 Females in Richville?
There are 122.61 Males per 100 Females in Richville.
What is the Ratio of Females per 100 Males in Richville?
There are 81.56 Females per 100 Males in Richville.
What is the Median Population Age in Richville?
Median Population Age in Richville is 50.0 Years.
What is the Average Family Size in Richville
Average Family Size in Richville is 2.8 People.
What is the Average Household Size in Richville
Average Household Size in Richville is 2.2 People.
What is Per Capita Income in Richville?
Per Capita income in Richville is $38,272.
What is the Median Family Income in Richville?
Median Family Income in Richville is $96,974.
What is the Median Household income in Richville?
Median Household Income in Richville is $75,074.
What is Income or Wage Gap in Richville?
Income or Wage Gap in Richville is 48.8%.
Women in Richville earn 51.2 cents for every dollar earned by a man.
What is Inequality or Gini Index in Richville?
Inequality or Gini Index in Richville is 0.36.
How Large is the Labor Force in Richville?
There are 1,664 People in the Labor Forcein in Richville.
What is the Percentage of People in the Labor Force in Richville?
62.4% of People are in the Labor Force in Richville.
What is the Unemployment Rate in Richville?
Unemployment Rate in Richville is 2.7%.