Cities with the Most Immigrants from Syria in Ohio
RELATED REPORTS & OPTIONS
Syria
Ohio
Compare Cities
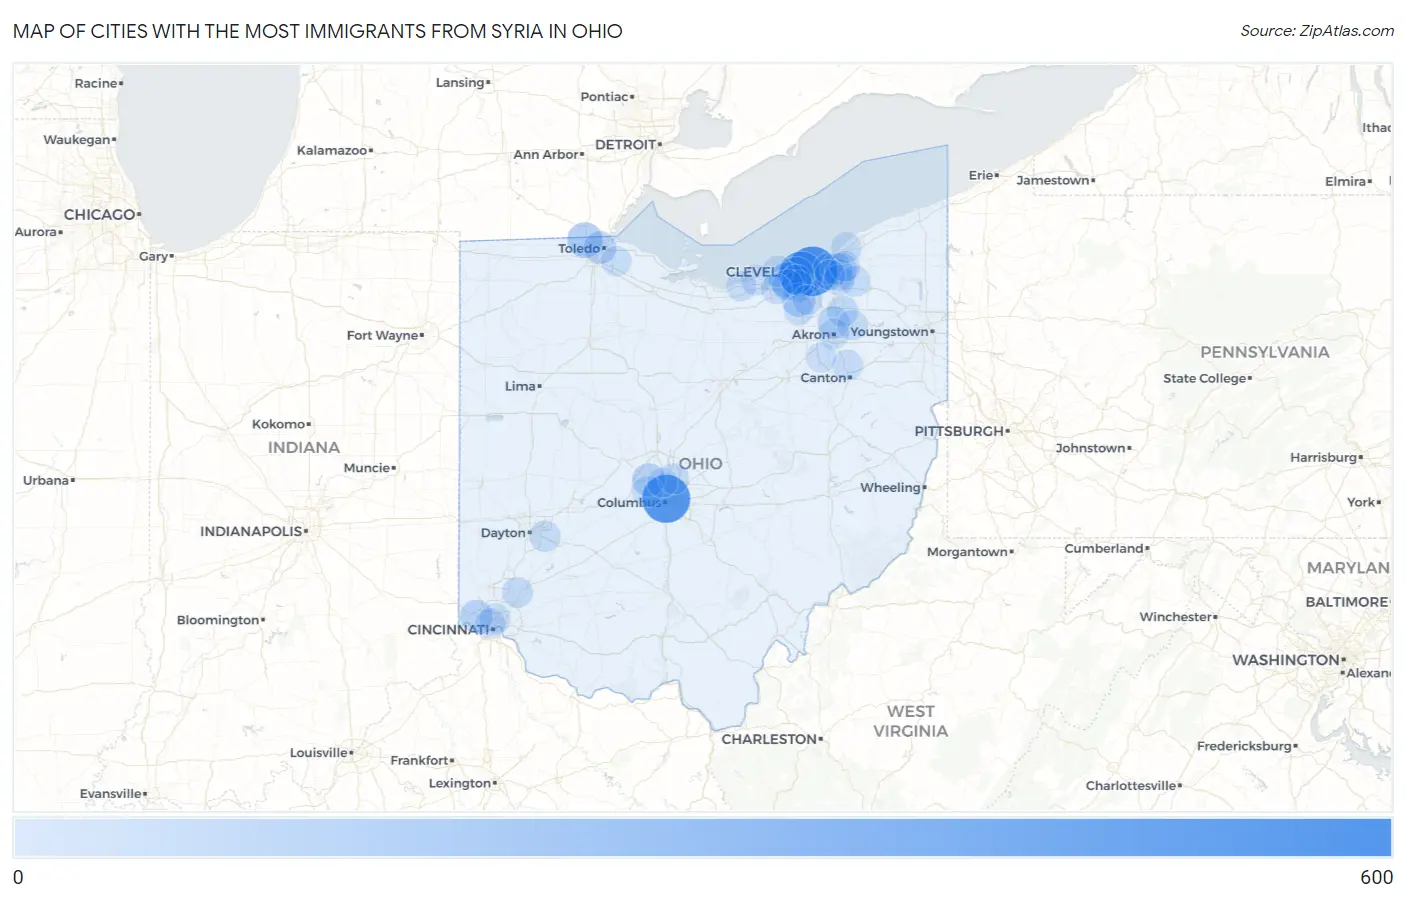
Map of Cities with the Most Immigrants from Syria in Ohio
0
600
Cities with the Most Immigrants from Syria in Ohio
| City | Syria | vs State | vs National | |
| 1. | Cleveland | 592 | 3,842(15.41%)#1 | 108,470(0.55%)#18 |
| 2. | Columbus | 544 | 3,842(14.16%)#2 | 108,470(0.50%)#21 |
| 3. | Lakewood | 436 | 3,842(11.35%)#3 | 108,470(0.40%)#33 |
| 4. | Rocky River | 182 | 3,842(4.74%)#4 | 108,470(0.17%)#113 |
| 5. | Westlake | 161 | 3,842(4.19%)#5 | 108,470(0.15%)#133 |
| 6. | Sylvania | 153 | 3,842(3.98%)#6 | 108,470(0.14%)#146 |
| 7. | Strongsville | 100 | 3,842(2.60%)#7 | 108,470(0.09%)#213 |
| 8. | Dublin | 91 | 3,842(2.37%)#8 | 108,470(0.08%)#230 |
| 9. | Dent | 79 | 3,842(2.06%)#9 | 108,470(0.07%)#265 |
| 10. | Toledo | 75 | 3,842(1.95%)#10 | 108,470(0.07%)#279 |
| 11. | Cuyahoga Falls | 64 | 3,842(1.67%)#11 | 108,470(0.06%)#321 |
| 12. | Mayfield Heights | 55 | 3,842(1.43%)#12 | 108,470(0.05%)#357 |
| 13. | Brook Park | 50 | 3,842(1.30%)#13 | 108,470(0.05%)#372 |
| 14. | Hudson | 43 | 3,842(1.12%)#14 | 108,470(0.04%)#412 |
| 15. | Cleveland Heights | 35 | 3,842(0.91%)#15 | 108,470(0.03%)#481 |
| 16. | Hilliard | 34 | 3,842(0.88%)#16 | 108,470(0.03%)#489 |
| 17. | Lyndhurst | 34 | 3,842(0.88%)#17 | 108,470(0.03%)#492 |
| 18. | Beavercreek | 32 | 3,842(0.83%)#18 | 108,470(0.03%)#506 |
| 19. | Avon Lake | 32 | 3,842(0.83%)#19 | 108,470(0.03%)#508 |
| 20. | North Olmsted | 30 | 3,842(0.78%)#20 | 108,470(0.03%)#522 |
| 21. | Pepper Pike | 29 | 3,842(0.75%)#21 | 108,470(0.03%)#535 |
| 22. | Westerville | 25 | 3,842(0.65%)#22 | 108,470(0.02%)#583 |
| 23. | Mason | 25 | 3,842(0.65%)#23 | 108,470(0.02%)#584 |
| 24. | St Bernard | 24 | 3,842(0.62%)#24 | 108,470(0.02%)#606 |
| 25. | Cincinnati | 23 | 3,842(0.60%)#25 | 108,470(0.02%)#608 |
| 26. | Akron | 22 | 3,842(0.57%)#26 | 108,470(0.02%)#625 |
| 27. | Orange | 22 | 3,842(0.57%)#27 | 108,470(0.02%)#643 |
| 28. | Lorain | 20 | 3,842(0.52%)#28 | 108,470(0.02%)#665 |
| 29. | South Russell | 20 | 3,842(0.52%)#29 | 108,470(0.02%)#678 |
| 30. | Gates Mills | 19 | 3,842(0.49%)#30 | 108,470(0.02%)#692 |
| 31. | Willoughby | 17 | 3,842(0.44%)#31 | 108,470(0.02%)#733 |
| 32. | Kent | 16 | 3,842(0.42%)#32 | 108,470(0.01%)#754 |
| 33. | North Canton | 15 | 3,842(0.39%)#33 | 108,470(0.01%)#783 |
| 34. | Brunswick | 14 | 3,842(0.36%)#34 | 108,470(0.01%)#798 |
| 35. | North Ridgeville | 12 | 3,842(0.31%)#35 | 108,470(0.01%)#846 |
| 36. | Shaker Heights | 12 | 3,842(0.31%)#36 | 108,470(0.01%)#847 |
| 37. | Fairview Park | 12 | 3,842(0.31%)#37 | 108,470(0.01%)#852 |
| 38. | Clinton | 7 | 3,842(0.18%)#38 | 108,470(0.01%)#994 |
| 39. | North Royalton | 6 | 3,842(0.16%)#39 | 108,470(0.01%)#1,005 |
| 40. | Worthington | 6 | 3,842(0.16%)#40 | 108,470(0.01%)#1,012 |
| 41. | Vermilion | 6 | 3,842(0.16%)#41 | 108,470(0.01%)#1,013 |
| 42. | Millbury | 5 | 3,842(0.13%)#42 | 108,470(0.00%)#1,045 |
Common Questions
What are the Top 10 Cities with the Most Immigrants from Syria in Ohio?
Top 10 Cities with the Most Immigrants from Syria in Ohio are:
#1
592
#2
544
#3
436
#4
182
#5
161
#6
153
#7
100
#8
91
#9
79
#10
75
What city has the Most Immigrants from Syria in Ohio?
Cleveland has the Most Immigrants from Syria in Ohio with 592.
What is the Total Immigrants from Syria in the State of Ohio?
Total Immigrants from Syria in Ohio is 3,842.
What is the Total Immigrants from Syria in the United States?
Total Immigrants from Syria in the United States is 108,470.