Cities with the Most Immigrants from Argentina in Ohio
RELATED REPORTS & OPTIONS
Argentina
Ohio
Compare Cities
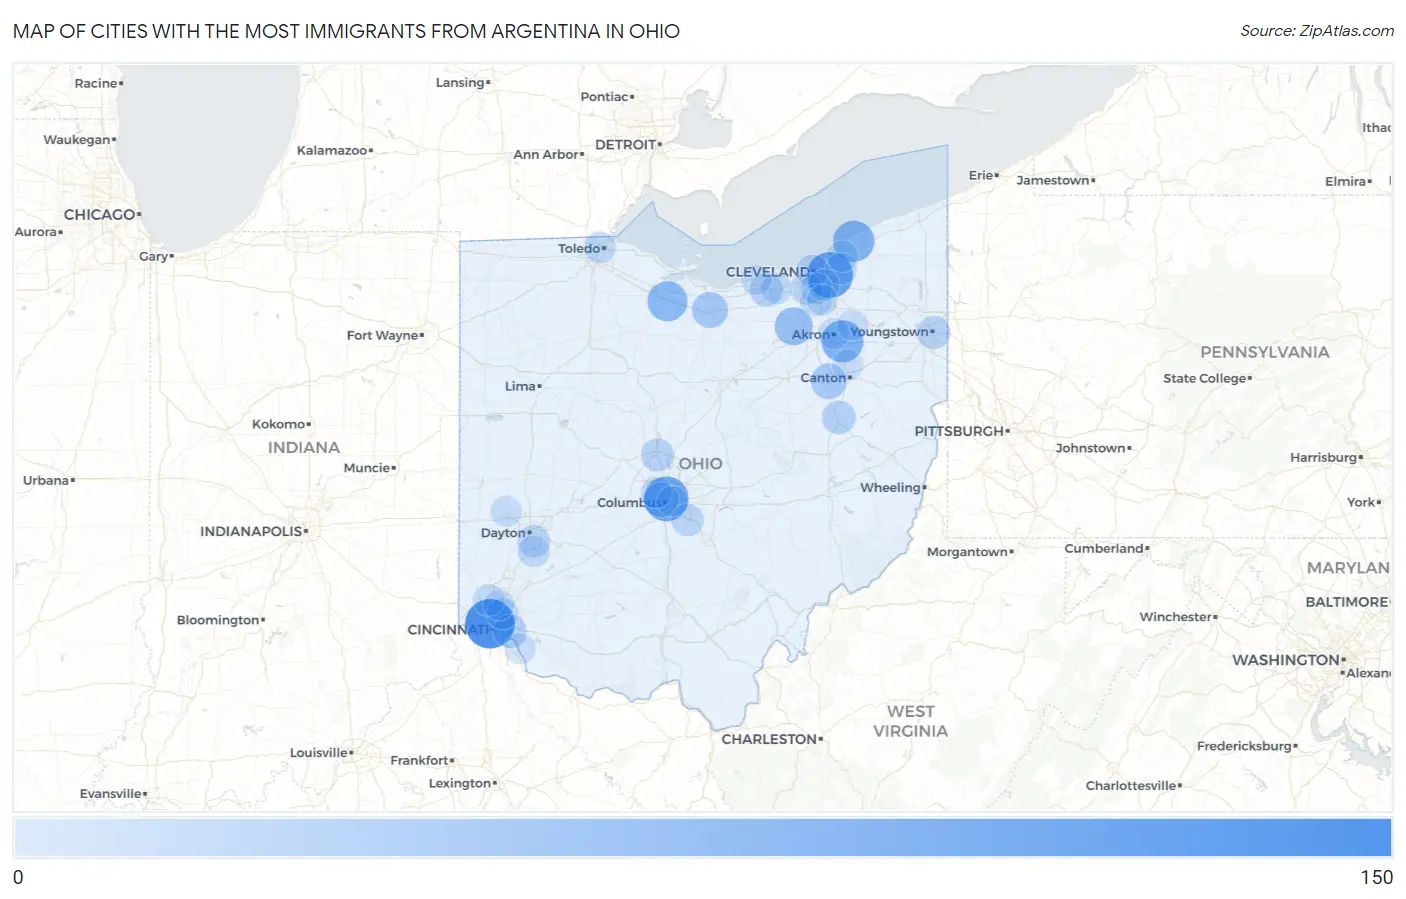
Map of Cities with the Most Immigrants from Argentina in Ohio
0
150
Cities with the Most Immigrants from Argentina in Ohio
| City | Argentina | vs State | vs National | |
| 1. | Cincinnati | 146 | 1,447(10.09%)#1 | 200,110(0.07%)#220 |
| 2. | Shaker Heights | 118 | 1,447(8.15%)#2 | 200,110(0.06%)#286 |
| 3. | Columbus | 109 | 1,447(7.53%)#3 | 200,110(0.05%)#307 |
| 4. | Sawyerwood | 88 | 1,447(6.08%)#4 | 200,110(0.04%)#400 |
| 5. | Mentor | 83 | 1,447(5.74%)#5 | 200,110(0.04%)#417 |
| 6. | Clyde | 74 | 1,447(5.11%)#6 | 200,110(0.04%)#470 |
| 7. | Medina | 58 | 1,447(4.01%)#7 | 200,110(0.03%)#585 |
| 8. | Norwalk | 43 | 1,447(2.97%)#8 | 200,110(0.02%)#744 |
| 9. | Massillon | 40 | 1,447(2.76%)#9 | 200,110(0.02%)#785 |
| 10. | Grandview Heights | 34 | 1,447(2.35%)#10 | 200,110(0.02%)#895 |
| 11. | Dover | 25 | 1,447(1.73%)#11 | 200,110(0.01%)#1,084 |
| 12. | Elyria | 24 | 1,447(1.66%)#12 | 200,110(0.01%)#1,109 |
| 13. | Sherwood | 24 | 1,447(1.66%)#13 | 200,110(0.01%)#1,134 |
| 14. | Youngstown | 23 | 1,447(1.59%)#14 | 200,110(0.01%)#1,140 |
| 15. | Delaware | 22 | 1,447(1.52%)#15 | 200,110(0.01%)#1,173 |
| 16. | Cleveland | 20 | 1,447(1.38%)#16 | 200,110(0.01%)#1,235 |
| 17. | Kettering | 18 | 1,447(1.24%)#17 | 200,110(0.01%)#1,301 |
| 18. | Canal Winchester | 18 | 1,447(1.24%)#18 | 200,110(0.01%)#1,323 |
| 19. | Parma Heights | 12 | 1,447(0.83%)#19 | 200,110(0.01%)#1,572 |
| 20. | Toledo | 11 | 1,447(0.76%)#20 | 200,110(0.01%)#1,608 |
| 21. | Centerville | 11 | 1,447(0.76%)#21 | 200,110(0.01%)#1,628 |
| 22. | Broadview Heights | 11 | 1,447(0.76%)#22 | 200,110(0.01%)#1,632 |
| 23. | Amberley | 11 | 1,447(0.76%)#23 | 200,110(0.01%)#1,660 |
| 24. | Upper Arlington | 10 | 1,447(0.69%)#24 | 200,110(0.00%)#1,679 |
| 25. | Mayfield Heights | 10 | 1,447(0.69%)#25 | 200,110(0.00%)#1,695 |
| 26. | Seven Hills | 10 | 1,447(0.69%)#26 | 200,110(0.00%)#1,706 |
| 27. | Pleasant Run Farm | 10 | 1,447(0.69%)#27 | 200,110(0.00%)#1,722 |
| 28. | Garfield Heights | 9 | 1,447(0.62%)#28 | 200,110(0.00%)#1,744 |
| 29. | Akron | 8 | 1,447(0.55%)#29 | 200,110(0.00%)#1,785 |
| 30. | Willoughby Hills | 8 | 1,447(0.55%)#30 | 200,110(0.00%)#1,817 |
| 31. | North Ridgeville | 7 | 1,447(0.48%)#31 | 200,110(0.00%)#1,859 |
| 32. | Phillipsburg | 7 | 1,447(0.48%)#32 | 200,110(0.00%)#1,908 |
| 33. | Brecksville | 6 | 1,447(0.41%)#33 | 200,110(0.00%)#1,933 |
| 34. | Bexley | 6 | 1,447(0.41%)#34 | 200,110(0.00%)#1,934 |
| 35. | New Richmond | 6 | 1,447(0.41%)#35 | 200,110(0.00%)#1,950 |
| 36. | Kent | 5 | 1,447(0.35%)#36 | 200,110(0.00%)#1,979 |
| 37. | Glendale | 5 | 1,447(0.35%)#37 | 200,110(0.00%)#2,003 |
| 38. | North Canton | 4 | 1,447(0.28%)#38 | 200,110(0.00%)#2,025 |
| 39. | Lorain | 2 | 1,447(0.14%)#39 | 200,110(0.00%)#2,108 |
Common Questions
What are the Top 10 Cities with the Most Immigrants from Argentina in Ohio?
Top 10 Cities with the Most Immigrants from Argentina in Ohio are:
#1
146
#2
118
#3
109
#4
88
#5
83
#6
74
#7
58
#8
43
#9
40
#10
34
What city has the Most Immigrants from Argentina in Ohio?
Cincinnati has the Most Immigrants from Argentina in Ohio with 146.
What is the Total Immigrants from Argentina in the State of Ohio?
Total Immigrants from Argentina in Ohio is 1,447.
What is the Total Immigrants from Argentina in the United States?
Total Immigrants from Argentina in the United States is 200,110.