Cities with the Highest Percentage of Population Employed in Public Administration in Ohio
RELATED REPORTS & OPTIONS
Public Administration
Ohio
Compare Cities
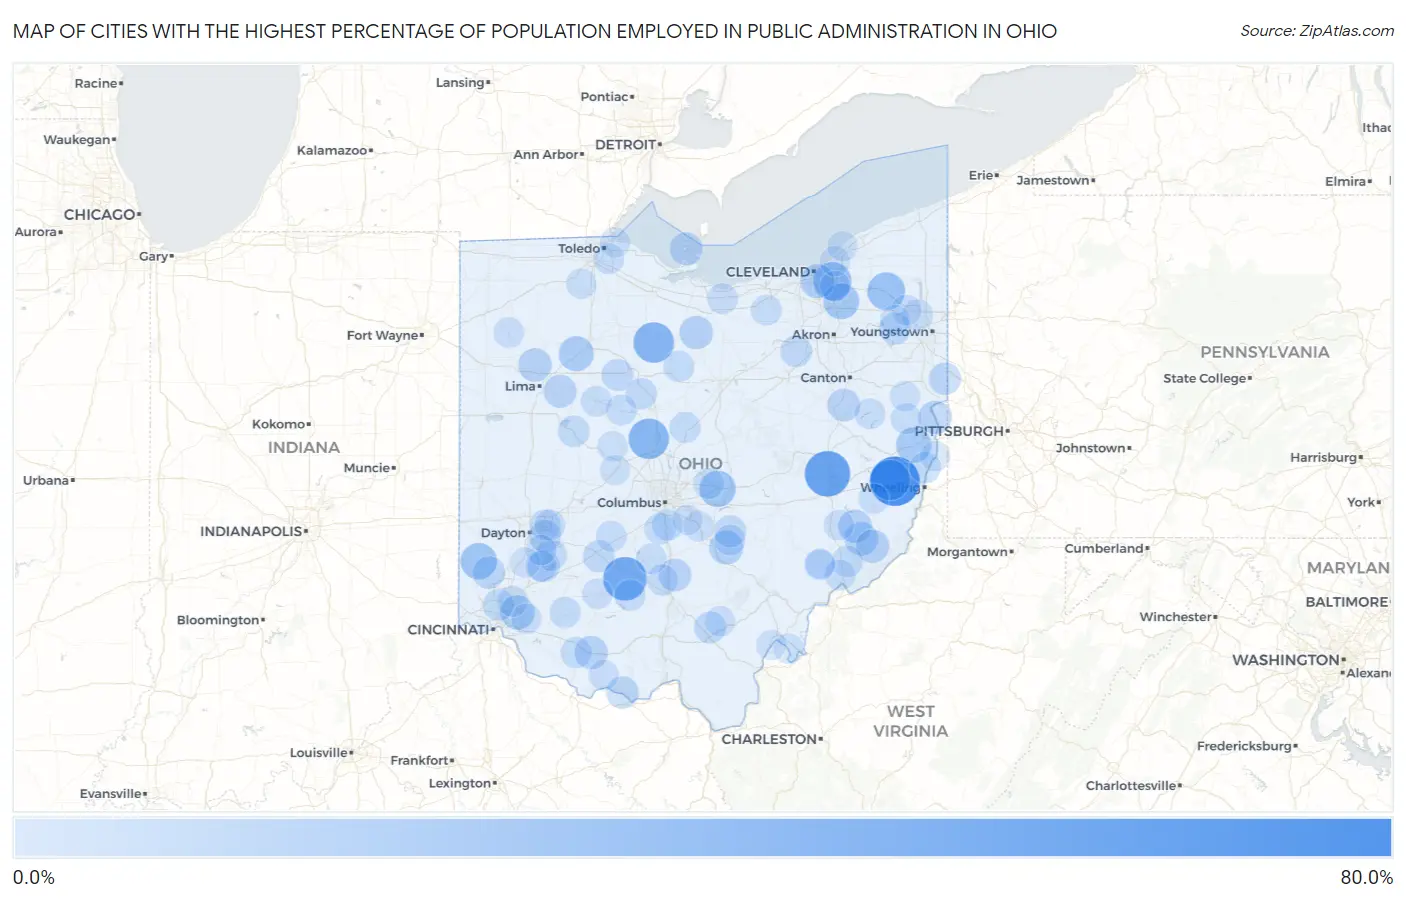
Map of Cities with the Highest Percentage of Population Employed in Public Administration in Ohio
0.0%
80.0%
Cities with the Highest Percentage of Population Employed in Public Administration in Ohio
| City | % Employed | vs State | vs National | |
| 1. | Bannock | 66.0% | 3.9%(+62.1)#1 | 4.7%(+61.3)#65 |
| 2. | Kimbolton | 53.5% | 3.9%(+49.6)#2 | 4.7%(+48.8)#111 |
| 3. | Good Hope | 48.2% | 3.9%(+44.3)#3 | 4.7%(+43.6)#160 |
| 4. | Melmore | 38.7% | 3.9%(+34.8)#4 | 4.7%(+34.0)#281 |
| 5. | Radnor | 38.5% | 3.9%(+34.6)#5 | 4.7%(+33.8)#287 |
| 6. | Lafferty | 38.5% | 3.9%(+34.6)#6 | 4.7%(+33.8)#288 |
| 7. | North Randall | 31.2% | 3.9%(+27.3)#7 | 4.7%(+26.6)#437 |
| 8. | Parkman | 30.0% | 3.9%(+26.1)#8 | 4.7%(+25.3)#489 |
| 9. | Somerville | 26.4% | 3.9%(+22.5)#9 | 4.7%(+21.8)#642 |
| 10. | Granville South | 26.2% | 3.9%(+22.3)#10 | 4.7%(+21.5)#654 |
| 11. | Twinsburg Heights | 24.8% | 3.9%(+20.9)#11 | 4.7%(+20.1)#757 |
| 12. | Bloomingdale | 23.3% | 3.9%(+19.3)#12 | 4.7%(+18.6)#879 |
| 13. | Rawson | 22.3% | 3.9%(+18.4)#13 | 4.7%(+17.6)#957 |
| 14. | Miamiville | 20.6% | 3.9%(+16.7)#14 | 4.7%(+15.9)#1,117 |
| 15. | Cuyahoga Heights | 19.9% | 3.9%(+16.0)#15 | 4.7%(+15.2)#1,211 |
| 16. | Bass Lake | 19.4% | 3.9%(+15.5)#16 | 4.7%(+14.7)#1,276 |
| 17. | Hide A Way Hills | 19.4% | 3.9%(+15.5)#17 | 4.7%(+14.7)#1,279 |
| 18. | Petersburg | 18.1% | 3.9%(+14.2)#18 | 4.7%(+13.4)#1,468 |
| 19. | Holiday Lakes | 17.9% | 3.9%(+14.0)#19 | 4.7%(+13.2)#1,493 |
| 20. | Stafford | 17.9% | 3.9%(+13.9)#20 | 4.7%(+13.2)#1,510 |
| 21. | Summerfield | 17.7% | 3.9%(+13.8)#21 | 4.7%(+13.1)#1,523 |
| 22. | Stratton | 17.6% | 3.9%(+13.7)#22 | 4.7%(+12.9)#1,551 |
| 23. | Vaughnsville | 17.5% | 3.9%(+13.6)#23 | 4.7%(+12.9)#1,567 |
| 24. | Graysville | 17.4% | 3.9%(+13.5)#24 | 4.7%(+12.7)#1,588 |
| 25. | Winchester | 17.1% | 3.9%(+13.2)#25 | 4.7%(+12.4)#1,646 |
| 26. | Harrod | 16.4% | 3.9%(+12.4)#26 | 4.7%(+11.7)#1,788 |
| 27. | Put In Bay | 16.3% | 3.9%(+12.4)#27 | 4.7%(+11.6)#1,802 |
| 28. | Zoar | 15.8% | 3.9%(+11.9)#28 | 4.7%(+11.2)#1,896 |
| 29. | Kingston | 15.7% | 3.9%(+11.8)#29 | 4.7%(+11.0)#1,927 |
| 30. | Seven Mile | 15.0% | 3.9%(+11.1)#30 | 4.7%(+10.3)#2,114 |
| 31. | Negley | 14.4% | 3.9%(+10.4)#31 | 4.7%(+9.67)#2,330 |
| 32. | Newport Cdp Shelby County | 14.3% | 3.9%(+10.4)#32 | 4.7%(+9.60)#2,368 |
| 33. | Rome Stout | 14.3% | 3.9%(+10.4)#33 | 4.7%(+9.60)#2,381 |
| 34. | Jacksontown | 14.1% | 3.9%(+10.2)#34 | 4.7%(+9.45)#2,430 |
| 35. | Corwin | 13.8% | 3.9%(+9.86)#35 | 4.7%(+9.08)#2,554 |
| 36. | Beavercreek | 13.7% | 3.9%(+9.81)#36 | 4.7%(+9.03)#2,568 |
| 37. | Coalton | 13.7% | 3.9%(+9.77)#37 | 4.7%(+8.99)#2,586 |
| 38. | Rushville | 13.6% | 3.9%(+9.73)#38 | 4.7%(+8.95)#2,601 |
| 39. | Milledgeville | 13.5% | 3.9%(+9.55)#39 | 4.7%(+8.78)#2,679 |
| 40. | Craig Beach | 13.4% | 3.9%(+9.44)#40 | 4.7%(+8.67)#2,725 |
| 41. | Kirby | 13.3% | 3.9%(+9.42)#41 | 4.7%(+8.65)#2,740 |
| 42. | Sterling | 13.0% | 3.9%(+9.09)#42 | 4.7%(+8.31)#2,853 |
| 43. | Huntsville | 12.5% | 3.9%(+8.59)#43 | 4.7%(+7.81)#3,013 |
| 44. | Morral | 12.2% | 3.9%(+8.29)#44 | 4.7%(+7.51)#3,165 |
| 45. | Connorville | 12.2% | 3.9%(+8.29)#45 | 4.7%(+7.51)#3,172 |
| 46. | Glendale | 12.1% | 3.9%(+8.23)#46 | 4.7%(+7.45)#3,201 |
| 47. | Spring Valley | 12.0% | 3.9%(+8.04)#47 | 4.7%(+7.27)#3,288 |
| 48. | Commercial Point | 11.7% | 3.9%(+7.79)#48 | 4.7%(+7.02)#3,415 |
| 49. | Lower Salem | 11.5% | 3.9%(+7.63)#49 | 4.7%(+6.85)#3,507 |
| 50. | Sulphur Springs | 11.5% | 3.9%(+7.59)#50 | 4.7%(+6.81)#3,538 |
| 51. | Lake Waynoka | 11.5% | 3.9%(+7.57)#51 | 4.7%(+6.79)#3,544 |
| 52. | St Martin | 11.3% | 3.9%(+7.34)#52 | 4.7%(+6.56)#3,665 |
| 53. | Andersonville | 11.2% | 3.9%(+7.27)#53 | 4.7%(+6.49)#3,689 |
| 54. | Fulton | 11.1% | 3.9%(+7.20)#54 | 4.7%(+6.43)#3,733 |
| 55. | Lockbourne | 11.1% | 3.9%(+7.20)#55 | 4.7%(+6.43)#3,738 |
| 56. | South Salem | 10.9% | 3.9%(+6.96)#56 | 4.7%(+6.18)#3,875 |
| 57. | Bolindale | 10.8% | 3.9%(+6.89)#57 | 4.7%(+6.12)#3,933 |
| 58. | Highpoint | 10.7% | 3.9%(+6.80)#58 | 4.7%(+6.02)#3,995 |
| 59. | Wright Patterson Afb | 10.6% | 3.9%(+6.74)#59 | 4.7%(+5.96)#4,031 |
| 60. | La Rue | 10.6% | 3.9%(+6.72)#60 | 4.7%(+5.95)#4,045 |
| 61. | Midway | 10.6% | 3.9%(+6.71)#61 | 4.7%(+5.93)#4,054 |
| 62. | Bergholz | 10.6% | 3.9%(+6.64)#62 | 4.7%(+5.87)#4,091 |
| 63. | Alexandria | 10.5% | 3.9%(+6.60)#63 | 4.7%(+5.82)#4,138 |
| 64. | Kenton | 10.4% | 3.9%(+6.51)#64 | 4.7%(+5.73)#4,195 |
| 65. | Lagrange | 10.3% | 3.9%(+6.44)#65 | 4.7%(+5.66)#4,233 |
| 66. | Bremen | 10.3% | 3.9%(+6.41)#66 | 4.7%(+5.64)#4,255 |
| 67. | Berlin Heights | 10.3% | 3.9%(+6.40)#67 | 4.7%(+5.63)#4,262 |
| 68. | Devola | 10.3% | 3.9%(+6.40)#68 | 4.7%(+5.62)#4,265 |
| 69. | Waynesville | 10.2% | 3.9%(+6.28)#69 | 4.7%(+5.50)#4,349 |
| 70. | Williamsport | 10.0% | 3.9%(+6.11)#70 | 4.7%(+5.34)#4,455 |
| 71. | Fairborn | 10.0% | 3.9%(+6.09)#71 | 4.7%(+5.32)#4,464 |
| 72. | Dellroy | 9.9% | 3.9%(+6.00)#72 | 4.7%(+5.22)#4,550 |
| 73. | Walbridge | 9.9% | 3.9%(+5.96)#73 | 4.7%(+5.19)#4,579 |
| 74. | Oakwood | 9.8% | 3.9%(+5.89)#74 | 4.7%(+5.12)#4,635 |
| 75. | Bedford Heights | 9.8% | 3.9%(+5.89)#75 | 4.7%(+5.11)#4,638 |
| 76. | Bellbrook | 9.8% | 3.9%(+5.84)#76 | 4.7%(+5.07)#4,683 |
| 77. | Waterford | 9.7% | 3.9%(+5.83)#77 | 4.7%(+5.05)#4,695 |
| 78. | Leavittsburg | 9.6% | 3.9%(+5.68)#78 | 4.7%(+4.90)#4,798 |
| 79. | Highland | 9.6% | 3.9%(+5.68)#79 | 4.7%(+4.90)#4,801 |
| 80. | Carroll | 9.6% | 3.9%(+5.65)#80 | 4.7%(+4.87)#4,817 |
| 81. | Hamden | 9.5% | 3.9%(+5.58)#81 | 4.7%(+4.81)#4,882 |
| 82. | Nankin | 9.4% | 3.9%(+5.45)#82 | 4.7%(+4.67)#4,995 |
| 83. | Sarahsville | 9.3% | 3.9%(+5.39)#83 | 4.7%(+4.62)#5,036 |
| 84. | Beverly | 9.3% | 3.9%(+5.37)#84 | 4.7%(+4.59)#5,054 |
| 85. | Barnesville | 9.1% | 3.9%(+5.19)#85 | 4.7%(+4.42)#5,190 |
| 86. | West Union | 9.1% | 3.9%(+5.19)#86 | 4.7%(+4.42)#5,192 |
| 87. | Tontogany | 9.0% | 3.9%(+5.10)#87 | 4.7%(+4.32)#5,292 |
| 88. | Day Heights | 9.0% | 3.9%(+5.07)#88 | 4.7%(+4.29)#5,321 |
| 89. | Summitville | 8.9% | 3.9%(+4.98)#89 | 4.7%(+4.20)#5,398 |
| 90. | Raymond | 8.9% | 3.9%(+4.98)#90 | 4.7%(+4.20)#5,402 |
| 91. | Canal Winchester | 8.9% | 3.9%(+4.96)#91 | 4.7%(+4.19)#5,417 |
| 92. | South Canal | 8.8% | 3.9%(+4.87)#92 | 4.7%(+4.09)#5,508 |
| 93. | Springboro | 8.8% | 3.9%(+4.85)#93 | 4.7%(+4.07)#5,533 |
| 94. | Milford Center | 8.7% | 3.9%(+4.81)#94 | 4.7%(+4.03)#5,577 |
| 95. | Brilliant | 8.6% | 3.9%(+4.72)#95 | 4.7%(+3.94)#5,665 |
| 96. | Harbor View | 8.6% | 3.9%(+4.71)#96 | 4.7%(+3.94)#5,678 |
| 97. | Richmond Heights | 8.6% | 3.9%(+4.71)#97 | 4.7%(+3.93)#5,684 |
| 98. | Racine | 8.6% | 3.9%(+4.67)#98 | 4.7%(+3.89)#5,715 |
| 99. | Middleport | 8.4% | 3.9%(+4.52)#99 | 4.7%(+3.75)#5,883 |
| 100. | Timberlake | 8.4% | 3.9%(+4.50)#100 | 4.7%(+3.73)#5,903 |
Common Questions
What are the Top 10 Cities with the Highest Percentage of Population Employed in Public Administration in Ohio?
Top 10 Cities with the Highest Percentage of Population Employed in Public Administration in Ohio are:
#1
66.0%
#2
53.5%
#3
48.2%
#4
38.7%
#5
38.5%
#6
38.5%
#7
31.2%
#8
30.0%
#9
26.4%
#10
26.2%
What city has the Highest Percentage of Population Employed in Public Administration in Ohio?
Bannock has the Highest Percentage of Population Employed in Public Administration in Ohio with 66.0%.
What is the Percentage of Population Employed in Public Administration in the State of Ohio?
Percentage of Population Employed in Public Administration in Ohio is 3.9%.
What is the Percentage of Population Employed in Public Administration in the United States?
Percentage of Population Employed in Public Administration in the United States is 4.7%.