Cities with the Highest Percentage of Population Employed in Arts, Media & Entertainment in Ohio
RELATED REPORTS & OPTIONS
Arts, Media & Entertainment
Ohio
Compare Cities
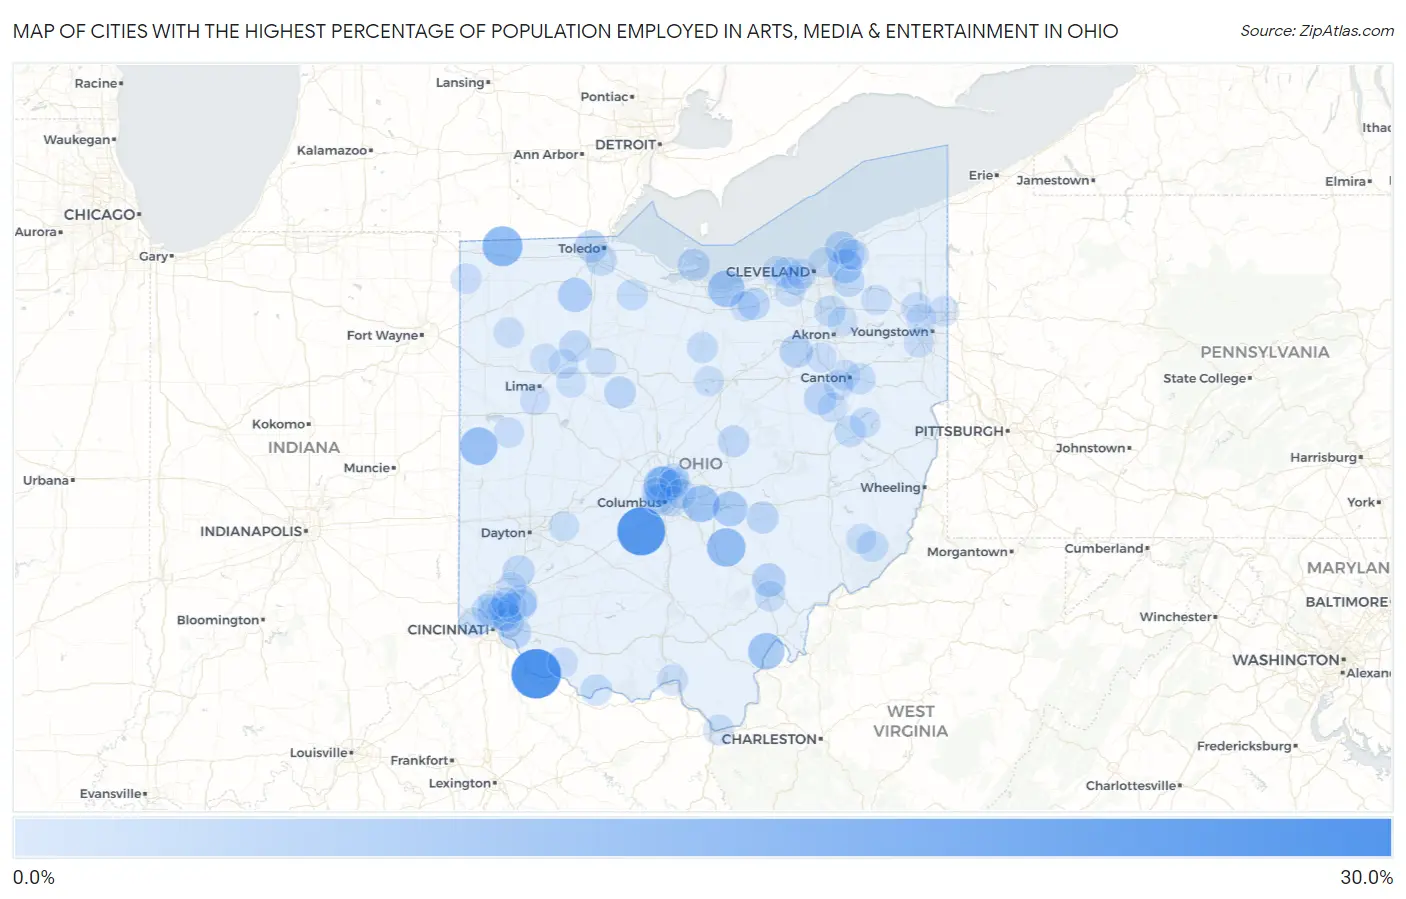
Map of Cities with the Highest Percentage of Population Employed in Arts, Media & Entertainment in Ohio
0.0%
30.0%
Cities with the Highest Percentage of Population Employed in Arts, Media & Entertainment in Ohio
| City | % Employed | vs State | vs National | |
| 1. | Chilo | 28.6% | 1.6%(+27.0)#1 | 2.1%(+26.5)#54 |
| 2. | Derby | 26.4% | 1.6%(+24.9)#2 | 2.1%(+24.4)#64 |
| 3. | New Haven Cdp Hamilton County | 21.3% | 1.6%(+19.7)#3 | 2.1%(+19.2)#97 |
| 4. | Ai | 17.8% | 1.6%(+16.2)#4 | 2.1%(+15.7)#128 |
| 5. | Alvordton | 15.8% | 1.6%(+14.2)#5 | 2.1%(+13.7)#164 |
| 6. | Hide A Way Hills | 13.8% | 1.6%(+12.3)#6 | 2.1%(+11.8)#217 |
| 7. | Riverlea | 12.9% | 1.6%(+11.4)#7 | 2.1%(+10.9)#248 |
| 8. | New Weston | 12.8% | 1.6%(+11.3)#8 | 2.1%(+10.8)#252 |
| 9. | Mitiwanga | 11.7% | 1.6%(+10.1)#9 | 2.1%(+9.61)#301 |
| 10. | Etna | 11.5% | 1.6%(+9.92)#10 | 2.1%(+9.41)#308 |
| 11. | Cheshire | 11.1% | 1.6%(+9.56)#11 | 2.1%(+9.05)#322 |
| 12. | Ridgewood | 9.6% | 1.6%(+8.07)#12 | 2.1%(+7.56)#415 |
| 13. | Thornport | 9.2% | 1.6%(+7.67)#13 | 2.1%(+7.16)#445 |
| 14. | Weston | 8.2% | 1.6%(+6.68)#14 | 2.1%(+6.17)#559 |
| 15. | Gates Mills | 8.2% | 1.6%(+6.65)#15 | 2.1%(+6.14)#561 |
| 16. | Guilford Lake | 7.7% | 1.6%(+6.16)#16 | 2.1%(+5.65)#646 |
| 17. | Millfield | 7.5% | 1.6%(+6.00)#17 | 2.1%(+5.49)#676 |
| 18. | Sterling | 6.8% | 1.6%(+5.23)#18 | 2.1%(+4.72)#840 |
| 19. | Lakeline | 6.4% | 1.6%(+4.81)#19 | 2.1%(+4.30)#949 |
| 20. | Amberley | 6.2% | 1.6%(+4.65)#20 | 2.1%(+4.14)#990 |
| 21. | Wilmot | 6.1% | 1.6%(+4.57)#21 | 2.1%(+4.06)#1,013 |
| 22. | Cherry Grove | 6.1% | 1.6%(+4.55)#22 | 2.1%(+4.04)#1,018 |
| 23. | Ottawa Hills | 6.0% | 1.6%(+4.49)#23 | 2.1%(+3.98)#1,037 |
| 24. | Lakeside | 6.0% | 1.6%(+4.46)#24 | 2.1%(+3.95)#1,045 |
| 25. | Loveland Park | 6.0% | 1.6%(+4.46)#25 | 2.1%(+3.95)#1,046 |
| 26. | Oberlin | 5.9% | 1.6%(+4.37)#26 | 2.1%(+3.86)#1,088 |
| 27. | Fultonham | 5.8% | 1.6%(+4.25)#27 | 2.1%(+3.74)#1,131 |
| 28. | Woodworth | 5.7% | 1.6%(+4.20)#28 | 2.1%(+3.69)#1,151 |
| 29. | Marseilles | 5.6% | 1.6%(+4.00)#29 | 2.1%(+3.49)#1,236 |
| 30. | Hunter | 5.5% | 1.6%(+3.94)#30 | 2.1%(+3.44)#1,265 |
| 31. | Gambier | 5.4% | 1.6%(+3.82)#31 | 2.1%(+3.31)#1,326 |
| 32. | Benton Ridge | 5.4% | 1.6%(+3.81)#32 | 2.1%(+3.30)#1,338 |
| 33. | North Lima | 5.3% | 1.6%(+3.71)#33 | 2.1%(+3.20)#1,382 |
| 34. | Grandview Heights | 5.2% | 1.6%(+3.64)#34 | 2.1%(+3.13)#1,420 |
| 35. | Chagrin Falls | 5.1% | 1.6%(+3.54)#35 | 2.1%(+3.03)#1,466 |
| 36. | Rossford | 5.0% | 1.6%(+3.46)#36 | 2.1%(+2.95)#1,505 |
| 37. | Waite Hill | 5.0% | 1.6%(+3.45)#37 | 2.1%(+2.94)#1,516 |
| 38. | Skyline Acres | 5.0% | 1.6%(+3.42)#38 | 2.1%(+2.91)#1,548 |
| 39. | Bay Village | 4.9% | 1.6%(+3.37)#39 | 2.1%(+2.86)#1,571 |
| 40. | Worthington | 4.9% | 1.6%(+3.34)#40 | 2.1%(+2.83)#1,585 |
| 41. | Midvale | 4.8% | 1.6%(+3.26)#41 | 2.1%(+2.75)#1,649 |
| 42. | South Mount Vernon | 4.8% | 1.6%(+3.23)#42 | 2.1%(+2.72)#1,662 |
| 43. | Manchester | 4.7% | 1.6%(+3.13)#43 | 2.1%(+2.62)#1,728 |
| 44. | Peninsula | 4.7% | 1.6%(+3.12)#44 | 2.1%(+2.61)#1,737 |
| 45. | Loveland | 4.5% | 1.6%(+2.98)#45 | 2.1%(+2.47)#1,835 |
| 46. | East Canton | 4.5% | 1.6%(+2.95)#46 | 2.1%(+2.44)#1,856 |
| 47. | Helena | 4.4% | 1.6%(+2.86)#47 | 2.1%(+2.35)#1,914 |
| 48. | Plymouth | 4.4% | 1.6%(+2.80)#48 | 2.1%(+2.29)#1,964 |
| 49. | Graysville | 4.3% | 1.6%(+2.80)#49 | 2.1%(+2.29)#1,972 |
| 50. | Burlington | 4.2% | 1.6%(+2.67)#50 | 2.1%(+2.16)#2,062 |
| 51. | New Boston | 4.2% | 1.6%(+2.66)#51 | 2.1%(+2.15)#2,067 |
| 52. | Sherrodsville | 4.0% | 1.6%(+2.48)#52 | 2.1%(+1.97)#2,241 |
| 53. | Westerville | 3.9% | 1.6%(+2.35)#53 | 2.1%(+1.84)#2,365 |
| 54. | Athens | 3.9% | 1.6%(+2.35)#54 | 2.1%(+1.84)#2,367 |
| 55. | Mariemont | 3.9% | 1.6%(+2.32)#55 | 2.1%(+1.81)#2,391 |
| 56. | Silverton | 3.8% | 1.6%(+2.29)#56 | 2.1%(+1.78)#2,423 |
| 57. | Bratenahl | 3.8% | 1.6%(+2.26)#57 | 2.1%(+1.75)#2,457 |
| 58. | Brookfield Center | 3.8% | 1.6%(+2.25)#58 | 2.1%(+1.74)#2,462 |
| 59. | Edgerton | 3.8% | 1.6%(+2.25)#59 | 2.1%(+1.74)#2,468 |
| 60. | Reedurban | 3.8% | 1.6%(+2.23)#60 | 2.1%(+1.72)#2,498 |
| 61. | Minerva Park | 3.8% | 1.6%(+2.22)#61 | 2.1%(+1.71)#2,513 |
| 62. | Avon Lake | 3.8% | 1.6%(+2.20)#62 | 2.1%(+1.69)#2,537 |
| 63. | Olmsted Falls | 3.7% | 1.6%(+2.20)#63 | 2.1%(+1.69)#2,543 |
| 64. | Fairview Park | 3.7% | 1.6%(+2.17)#64 | 2.1%(+1.66)#2,579 |
| 65. | Hiram | 3.7% | 1.6%(+2.16)#65 | 2.1%(+1.65)#2,590 |
| 66. | Marble Cliff | 3.7% | 1.6%(+2.16)#66 | 2.1%(+1.65)#2,591 |
| 67. | Cridersville | 3.7% | 1.6%(+2.15)#67 | 2.1%(+1.64)#2,597 |
| 68. | New Bremen | 3.7% | 1.6%(+2.15)#68 | 2.1%(+1.64)#2,613 |
| 69. | Four Bridges | 3.7% | 1.6%(+2.13)#69 | 2.1%(+1.62)#2,623 |
| 70. | Oakwood | 3.7% | 1.6%(+2.12)#70 | 2.1%(+1.61)#2,633 |
| 71. | Meyers Lake | 3.7% | 1.6%(+2.12)#71 | 2.1%(+1.61)#2,637 |
| 72. | Morgandale | 3.6% | 1.6%(+2.02)#72 | 2.1%(+1.51)#2,745 |
| 73. | Stafford | 3.6% | 1.6%(+2.02)#73 | 2.1%(+1.51)#2,754 |
| 74. | Lakewood | 3.6% | 1.6%(+2.02)#74 | 2.1%(+1.51)#2,756 |
| 75. | Bexley | 3.6% | 1.6%(+2.02)#75 | 2.1%(+1.51)#2,757 |
| 76. | Georgetown | 3.6% | 1.6%(+2.02)#76 | 2.1%(+1.51)#2,760 |
| 77. | Clinton | 3.6% | 1.6%(+2.01)#77 | 2.1%(+1.50)#2,765 |
| 78. | Niles | 3.6% | 1.6%(+2.01)#78 | 2.1%(+1.50)#2,768 |
| 79. | Kirtland | 3.5% | 1.6%(+1.97)#79 | 2.1%(+1.46)#2,822 |
| 80. | Kipton | 3.5% | 1.6%(+1.94)#80 | 2.1%(+1.43)#2,871 |
| 81. | Ontario | 3.5% | 1.6%(+1.93)#81 | 2.1%(+1.42)#2,887 |
| 82. | Richville | 3.5% | 1.6%(+1.91)#82 | 2.1%(+1.40)#2,906 |
| 83. | Evendale | 3.4% | 1.6%(+1.86)#83 | 2.1%(+1.35)#2,970 |
| 84. | Yellow Springs | 3.4% | 1.6%(+1.86)#84 | 2.1%(+1.35)#2,978 |
| 85. | Canfield | 3.4% | 1.6%(+1.84)#85 | 2.1%(+1.33)#3,010 |
| 86. | Finneytown | 3.3% | 1.6%(+1.79)#86 | 2.1%(+1.28)#3,064 |
| 87. | Middlebranch | 3.3% | 1.6%(+1.79)#87 | 2.1%(+1.28)#3,074 |
| 88. | Columbus Grove | 3.3% | 1.6%(+1.79)#88 | 2.1%(+1.28)#3,083 |
| 89. | Huber Ridge | 3.3% | 1.6%(+1.78)#89 | 2.1%(+1.27)#3,087 |
| 90. | Gahanna | 3.3% | 1.6%(+1.78)#90 | 2.1%(+1.27)#3,103 |
| 91. | Mack | 3.3% | 1.6%(+1.77)#91 | 2.1%(+1.26)#3,121 |
| 92. | Strasburg | 3.3% | 1.6%(+1.75)#92 | 2.1%(+1.24)#3,153 |
| 93. | Upper Arlington | 3.3% | 1.6%(+1.74)#93 | 2.1%(+1.23)#3,176 |
| 94. | Greenhills | 3.3% | 1.6%(+1.72)#94 | 2.1%(+1.22)#3,201 |
| 95. | Ada | 3.3% | 1.6%(+1.72)#95 | 2.1%(+1.21)#3,214 |
| 96. | Montgomery | 3.2% | 1.6%(+1.70)#96 | 2.1%(+1.19)#3,245 |
| 97. | Bluffton | 3.2% | 1.6%(+1.69)#97 | 2.1%(+1.18)#3,251 |
| 98. | Mount Blanchard | 3.2% | 1.6%(+1.66)#98 | 2.1%(+1.15)#3,315 |
| 99. | Stow | 3.2% | 1.6%(+1.66)#99 | 2.1%(+1.15)#3,327 |
| 100. | Sharonville | 3.2% | 1.6%(+1.62)#100 | 2.1%(+1.11)#3,396 |
Common Questions
What are the Top 10 Cities with the Highest Percentage of Population Employed in Arts, Media & Entertainment in Ohio?
Top 10 Cities with the Highest Percentage of Population Employed in Arts, Media & Entertainment in Ohio are:
#1
28.6%
#2
26.4%
#3
15.8%
#4
13.8%
#5
12.9%
#6
12.8%
#7
11.7%
#8
11.5%
#9
11.1%
#10
9.2%
What city has the Highest Percentage of Population Employed in Arts, Media & Entertainment in Ohio?
Chilo has the Highest Percentage of Population Employed in Arts, Media & Entertainment in Ohio with 28.6%.
What is the Percentage of Population Employed in Arts, Media & Entertainment in the State of Ohio?
Percentage of Population Employed in Arts, Media & Entertainment in Ohio is 1.6%.
What is the Percentage of Population Employed in Arts, Media & Entertainment in the United States?
Percentage of Population Employed in Arts, Media & Entertainment in the United States is 2.1%.