Cities with the Lowest Poverty Level Among Single Fathers in Ohio
RELATED REPORTS & OPTIONS
Lowest Poverty | Single Father
Ohio
Compare Cities
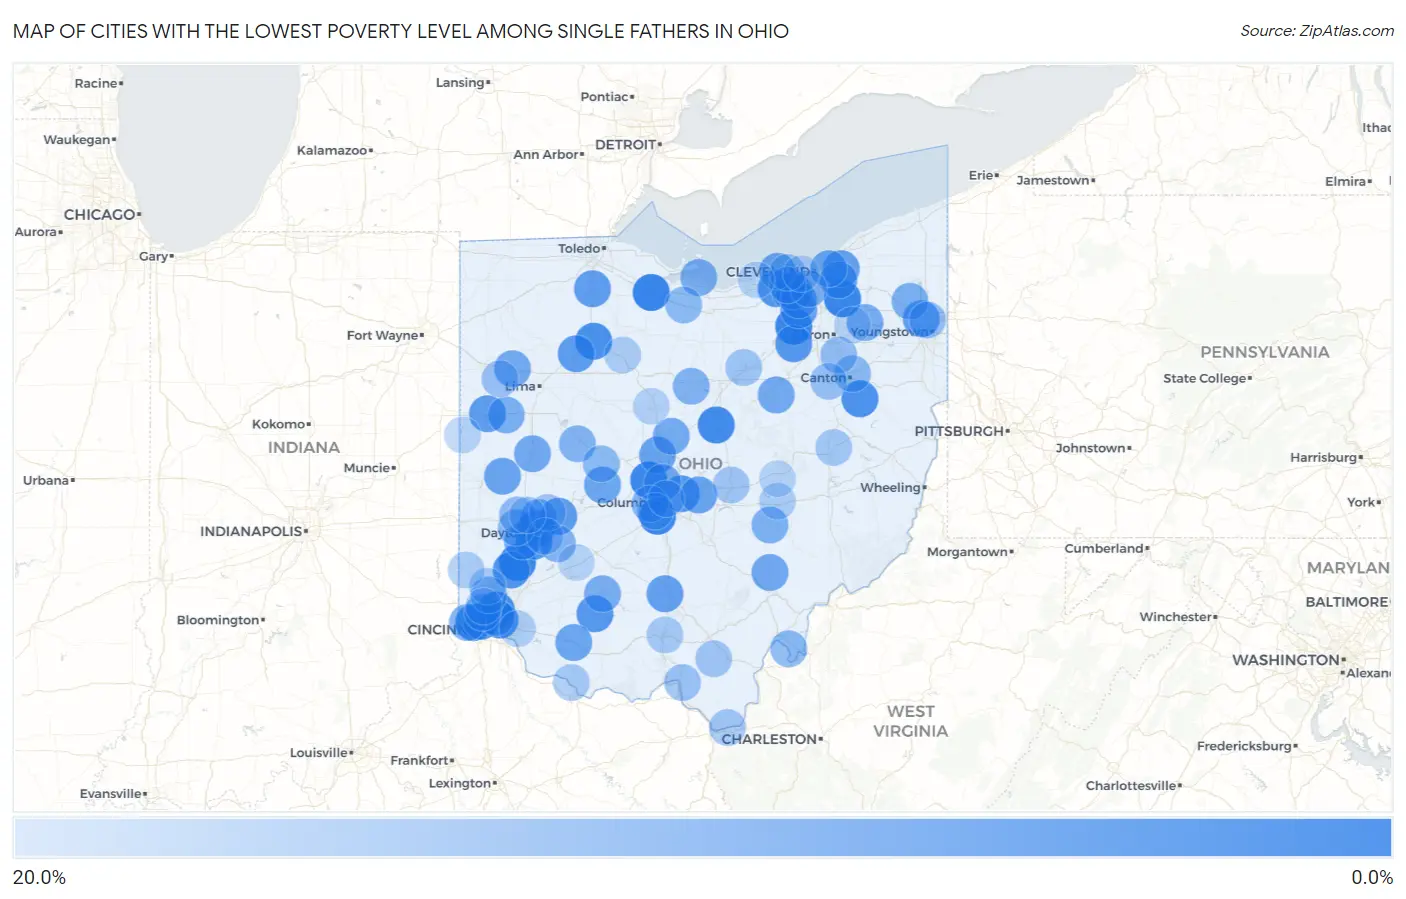
Map of Cities with the Lowest Poverty Level Among Single Fathers in Ohio
20.0%
0.0%
Cities with the Lowest Poverty Level Among Single Fathers in Ohio
| City | Single Father Poverty | vs State | vs National | |
| 1. | Fremont | 1.6% | 14.6%(-13.0)#1 | 13.7%(-12.1)#53 |
| 2. | Medina | 1.9% | 14.6%(-12.8)#2 | 13.7%(-11.9)#74 |
| 3. | Twinsburg | 1.9% | 14.6%(-12.7)#3 | 13.7%(-11.8)#79 |
| 4. | Franklin | 2.1% | 14.6%(-12.5)#4 | 13.7%(-11.6)#97 |
| 5. | Dublin | 2.3% | 14.6%(-12.3)#5 | 13.7%(-11.4)#114 |
| 6. | Grove City | 2.4% | 14.6%(-12.3)#6 | 13.7%(-11.3)#123 |
| 7. | Fredericktown | 2.9% | 14.6%(-11.7)#7 | 13.7%(-10.8)#180 |
| 8. | Wyoming | 3.0% | 14.6%(-11.6)#8 | 13.7%(-10.7)#188 |
| 9. | Mack | 3.3% | 14.6%(-11.3)#9 | 13.7%(-10.4)#231 |
| 10. | Norwood | 3.9% | 14.6%(-10.8)#10 | 13.7%(-9.84)#292 |
| 11. | Findlay | 4.0% | 14.6%(-10.7)#11 | 13.7%(-9.75)#298 |
| 12. | Magnolia | 4.1% | 14.6%(-10.6)#12 | 13.7%(-9.66)#310 |
| 13. | Riverside | 4.1% | 14.6%(-10.5)#13 | 13.7%(-9.61)#318 |
| 14. | Kettering | 4.8% | 14.6%(-9.82)#14 | 13.7%(-8.90)#416 |
| 15. | North Ridgeville | 4.8% | 14.6%(-9.81)#15 | 13.7%(-8.89)#417 |
| 16. | Middletown | 5.0% | 14.6%(-9.66)#16 | 13.7%(-8.74)#439 |
| 17. | Gahanna | 5.5% | 14.6%(-9.17)#17 | 13.7%(-8.24)#500 |
| 18. | Hillsboro | 5.6% | 14.6%(-9.08)#18 | 13.7%(-8.16)#512 |
| 19. | Seville | 5.6% | 14.6%(-9.08)#19 | 13.7%(-8.16)#514 |
| 20. | Cheviot | 6.1% | 14.6%(-8.55)#20 | 13.7%(-7.63)#584 |
| 21. | Enon | 6.1% | 14.6%(-8.51)#21 | 13.7%(-7.59)#588 |
| 22. | Celina | 6.2% | 14.6%(-8.39)#22 | 13.7%(-7.46)#608 |
| 23. | Rawson | 6.2% | 14.6%(-8.39)#23 | 13.7%(-7.46)#613 |
| 24. | Bowling Green | 6.4% | 14.6%(-8.24)#24 | 13.7%(-7.32)#631 |
| 25. | Niles | 6.8% | 14.6%(-7.88)#25 | 13.7%(-6.96)#681 |
| 26. | Olmsted Falls | 6.8% | 14.6%(-7.80)#26 | 13.7%(-6.88)#694 |
| 27. | Chillicothe | 7.0% | 14.6%(-7.62)#27 | 13.7%(-6.69)#722 |
| 28. | Mayfield Heights | 7.1% | 14.6%(-7.53)#28 | 13.7%(-6.61)#730 |
| 29. | Brunswick | 7.2% | 14.6%(-7.46)#29 | 13.7%(-6.53)#746 |
| 30. | Berea | 7.5% | 14.6%(-7.17)#30 | 13.7%(-6.24)#801 |
| 31. | Orange | 7.5% | 14.6%(-7.14)#31 | 13.7%(-6.21)#805 |
| 32. | Delaware | 7.6% | 14.6%(-7.04)#32 | 13.7%(-6.12)#815 |
| 33. | Pataskala | 7.6% | 14.6%(-7.04)#33 | 13.7%(-6.12)#816 |
| 34. | Bradford | 7.7% | 14.6%(-6.94)#34 | 13.7%(-6.02)#842 |
| 35. | Cleveland Heights | 7.9% | 14.6%(-6.74)#35 | 13.7%(-5.82)#890 |
| 36. | Moraine | 8.0% | 14.6%(-6.68)#36 | 13.7%(-5.76)#897 |
| 37. | Mechanicsburg | 8.0% | 14.6%(-6.64)#37 | 13.7%(-5.71)#904 |
| 38. | Sardinia | 8.0% | 14.6%(-6.64)#38 | 13.7%(-5.71)#905 |
| 39. | Avon Lake | 8.2% | 14.6%(-6.40)#39 | 13.7%(-5.48)#936 |
| 40. | Strongsville | 8.5% | 14.6%(-6.18)#40 | 13.7%(-5.26)#966 |
| 41. | Sidney | 8.5% | 14.6%(-6.10)#41 | 13.7%(-5.17)#983 |
| 42. | Trimble | 8.6% | 14.6%(-6.07)#42 | 13.7%(-5.14)#996 |
| 43. | Worthington | 8.8% | 14.6%(-5.85)#43 | 13.7%(-4.92)#1,034 |
| 44. | Shreve | 8.8% | 14.6%(-5.81)#44 | 13.7%(-4.89)#1,039 |
| 45. | Delphos | 8.9% | 14.6%(-5.75)#45 | 13.7%(-4.82)#1,046 |
| 46. | Ashley | 9.0% | 14.6%(-5.68)#46 | 13.7%(-4.76)#1,062 |
| 47. | Elmwood Place | 9.1% | 14.6%(-5.55)#47 | 13.7%(-4.62)#1,083 |
| 48. | Ravenna | 9.3% | 14.6%(-5.33)#48 | 13.7%(-4.41)#1,113 |
| 49. | Sandusky | 9.5% | 14.6%(-5.16)#49 | 13.7%(-4.23)#1,136 |
| 50. | Leesburg | 9.7% | 14.6%(-4.96)#50 | 13.7%(-4.03)#1,168 |
| 51. | St Marys | 9.8% | 14.6%(-4.79)#51 | 13.7%(-3.86)#1,195 |
| 52. | Champion Heights | 9.9% | 14.6%(-4.78)#52 | 13.7%(-3.85)#1,196 |
| 53. | Roseville | 10.0% | 14.6%(-4.64)#53 | 13.7%(-3.71)#1,216 |
| 54. | North Bend | 10.0% | 14.6%(-4.64)#54 | 13.7%(-3.71)#1,225 |
| 55. | Parma | 10.2% | 14.6%(-4.48)#55 | 13.7%(-3.55)#1,253 |
| 56. | White Oak | 10.3% | 14.6%(-4.36)#56 | 13.7%(-3.44)#1,272 |
| 57. | Huber Heights | 10.3% | 14.6%(-4.34)#57 | 13.7%(-3.41)#1,273 |
| 58. | Galion | 10.7% | 14.6%(-3.92)#58 | 13.7%(-3.00)#1,339 |
| 59. | Bellefontaine | 10.8% | 14.6%(-3.82)#59 | 13.7%(-2.89)#1,359 |
| 60. | Lincoln Village | 10.9% | 14.6%(-3.77)#60 | 13.7%(-2.84)#1,365 |
| 61. | Xenia | 11.0% | 14.6%(-3.67)#61 | 13.7%(-2.75)#1,379 |
| 62. | Fairfield | 11.1% | 14.6%(-3.53)#62 | 13.7%(-2.60)#1,400 |
| 63. | Racine | 11.5% | 14.6%(-3.10)#63 | 13.7%(-2.17)#1,472 |
| 64. | Trotwood | 11.6% | 14.6%(-3.01)#64 | 13.7%(-2.08)#1,483 |
| 65. | Canton | 11.6% | 14.6%(-3.00)#65 | 13.7%(-2.07)#1,485 |
| 66. | Bellevue | 11.8% | 14.6%(-2.79)#66 | 13.7%(-1.87)#1,512 |
| 67. | North Lewisburg | 12.0% | 14.6%(-2.64)#67 | 13.7%(-1.71)#1,537 |
| 68. | Clayton | 12.4% | 14.6%(-2.21)#68 | 13.7%(-1.29)#1,605 |
| 69. | Green | 12.6% | 14.6%(-2.00)#69 | 13.7%(-1.07)#1,655 |
| 70. | Girard | 13.2% | 14.6%(-1.45)#70 | 13.7%(-0.526)#1,726 |
| 71. | Massillon | 13.2% | 14.6%(-1.43)#71 | 13.7%(-0.505)#1,730 |
| 72. | North Olmsted | 13.3% | 14.6%(-1.30)#72 | 13.7%(-0.379)#1,747 |
| 73. | Wheelersburg | 13.3% | 14.6%(-1.30)#73 | 13.7%(-0.379)#1,751 |
| 74. | Venedocia | 13.3% | 14.6%(-1.30)#74 | 13.7%(-0.379)#1,766 |
| 75. | Bay Village | 13.7% | 14.6%(-0.938)#75 | 13.7%(-0.014)#1,817 |
| 76. | Ashland | 13.8% | 14.6%(-0.800)#76 | 13.7%(+0.124)#1,840 |
| 77. | Newark | 14.3% | 14.6%(-0.351)#77 | 13.7%(+0.573)#1,892 |
| 78. | Park Layne | 14.3% | 14.6%(-0.351)#78 | 13.7%(+0.573)#1,901 |
| 79. | Oak Hill | 14.3% | 14.6%(-0.351)#79 | 13.7%(+0.573)#1,911 |
| 80. | Chesapeake | 14.3% | 14.6%(-0.351)#80 | 13.7%(+0.573)#1,914 |
| 81. | Urbancrest | 14.3% | 14.6%(-0.351)#81 | 13.7%(+0.573)#1,915 |
| 82. | Beavercreek | 14.5% | 14.6%(-0.146)#82 | 13.7%(+0.778)#1,949 |
| 83. | Port Washington | 14.7% | 14.6%(+0.069)#83 | 13.7%(+0.993)#1,983 |
| 84. | Ripley | 14.9% | 14.6%(+0.228)#84 | 13.7%(+1.15)#1,994 |
| 85. | Piketon | 14.9% | 14.6%(+0.289)#85 | 13.7%(+1.21)#2,001 |
| 86. | Vandalia | 15.2% | 14.6%(+0.515)#86 | 13.7%(+1.44)#2,032 |
| 87. | Hamilton | 15.3% | 14.6%(+0.614)#87 | 13.7%(+1.54)#2,044 |
| 88. | Columbus | 15.5% | 14.6%(+0.848)#88 | 13.7%(+1.77)#2,080 |
| 89. | Carey | 15.6% | 14.6%(+0.988)#89 | 13.7%(+1.91)#2,098 |
| 90. | Oxford | 15.7% | 14.6%(+1.07)#90 | 13.7%(+1.99)#2,109 |
| 91. | Zanesville | 15.8% | 14.6%(+1.15)#91 | 13.7%(+2.08)#2,120 |
| 92. | Mount Carmel | 15.9% | 14.6%(+1.31)#92 | 13.7%(+2.23)#2,146 |
| 93. | Lakewood | 16.4% | 14.6%(+1.76)#93 | 13.7%(+2.68)#2,199 |
| 94. | Marion | 16.6% | 14.6%(+1.96)#94 | 13.7%(+2.89)#2,222 |
| 95. | Northgate | 16.7% | 14.6%(+2.03)#95 | 13.7%(+2.95)#2,240 |
| 96. | Fort Recovery | 16.7% | 14.6%(+2.03)#96 | 13.7%(+2.95)#2,250 |
| 97. | Dresden | 16.7% | 14.6%(+2.03)#97 | 13.7%(+2.95)#2,253 |
| 98. | Port William | 16.7% | 14.6%(+2.03)#98 | 13.7%(+2.95)#2,286 |
| 99. | Lorain | 16.8% | 14.6%(+2.20)#99 | 13.7%(+3.12)#2,306 |
| 100. | Kent | 17.0% | 14.6%(+2.38)#100 | 13.7%(+3.31)#2,324 |
Common Questions
What are the Top 10 Cities with the Lowest Poverty Level Among Single Fathers in Ohio?
Top 10 Cities with the Lowest Poverty Level Among Single Fathers in Ohio are:
#1
1.6%
#2
1.9%
#3
1.9%
#4
2.1%
#5
2.3%
#6
2.4%
#7
2.9%
#8
3.0%
#9
3.3%
#10
3.9%
What city has the Lowest Poverty Level Among Single Fathers in Ohio?
Fremont has the Lowest Poverty Level Among Single Fathers in Ohio with 1.6%.
What is the Poverty Level Among Single Fathers in the State of Ohio?
Poverty Level Among Single Fathers in Ohio is 14.6%.
What is the Poverty Level Among Single Fathers in the United States?
Poverty Level Among Single Fathers in the United States is 13.7%.